Headlines
|
|
Investors' fears shift from inflation to growth:
Investors' concerns are cycling from too-high inflation to too-low growth. Because of that, the correlation between stocks and Treasuries has become negative in recent sessions. Soft economic releases like consumer surveys have been more disappointing than hard releases that reflect actual conditions.
|
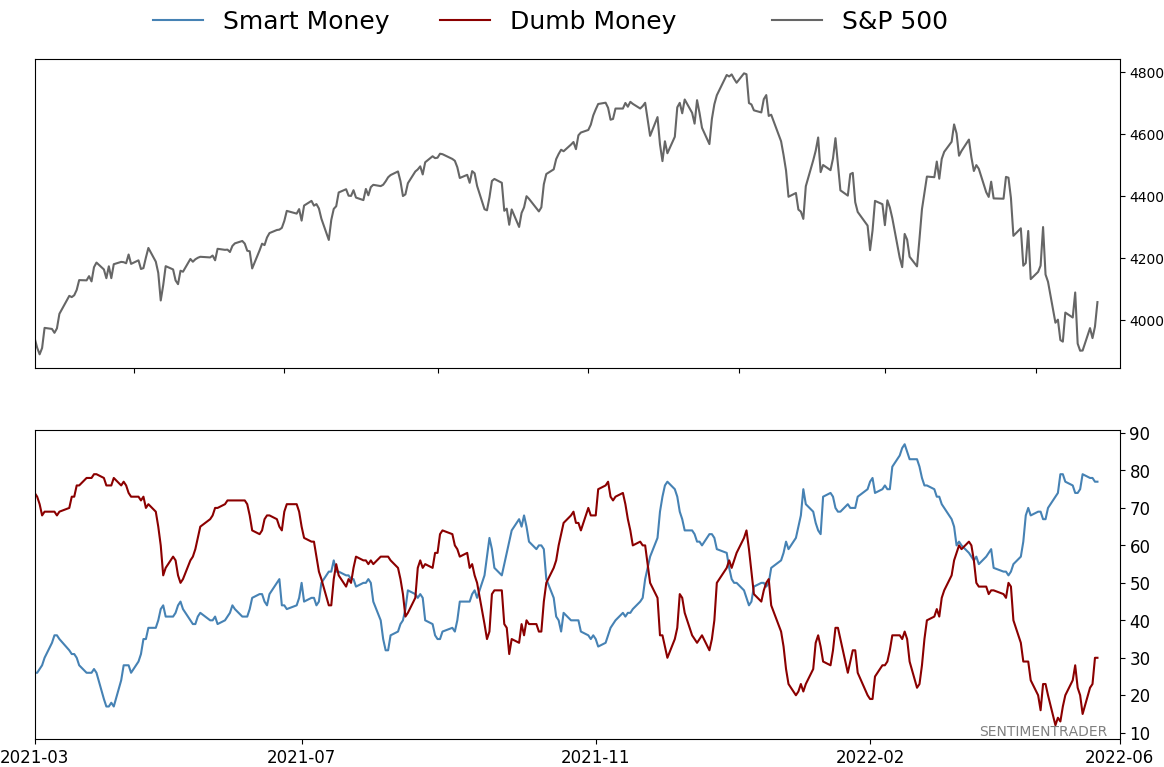
Smart / Dumb Money Confidence
|
Smart Money Confidence: 77%
Dumb Money Confidence: 30%
|
|
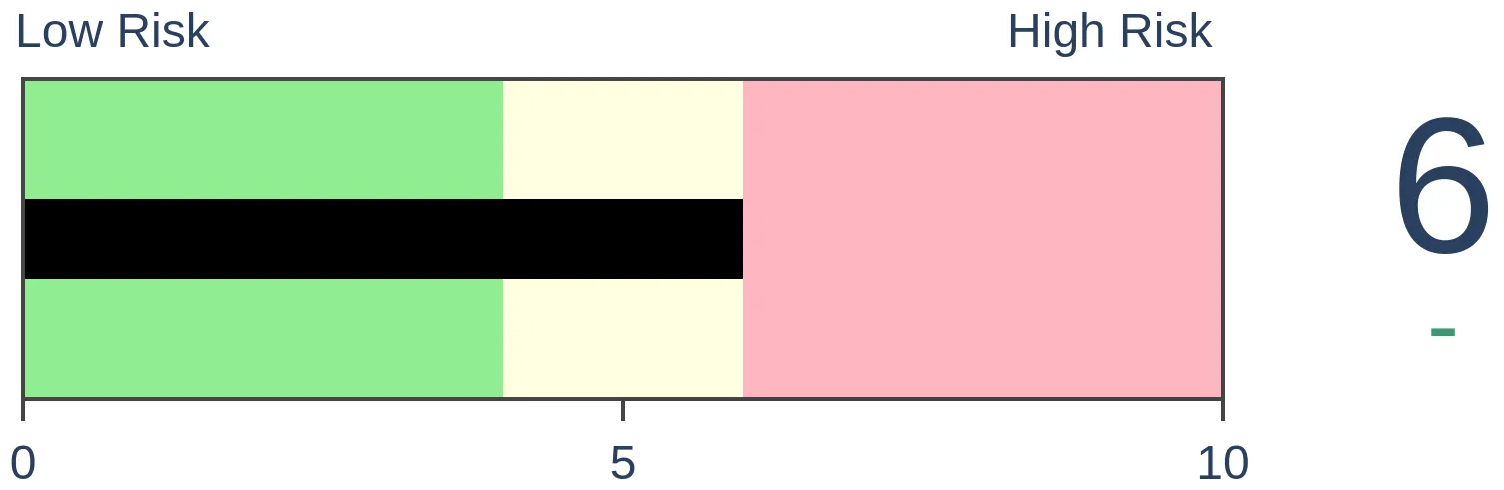
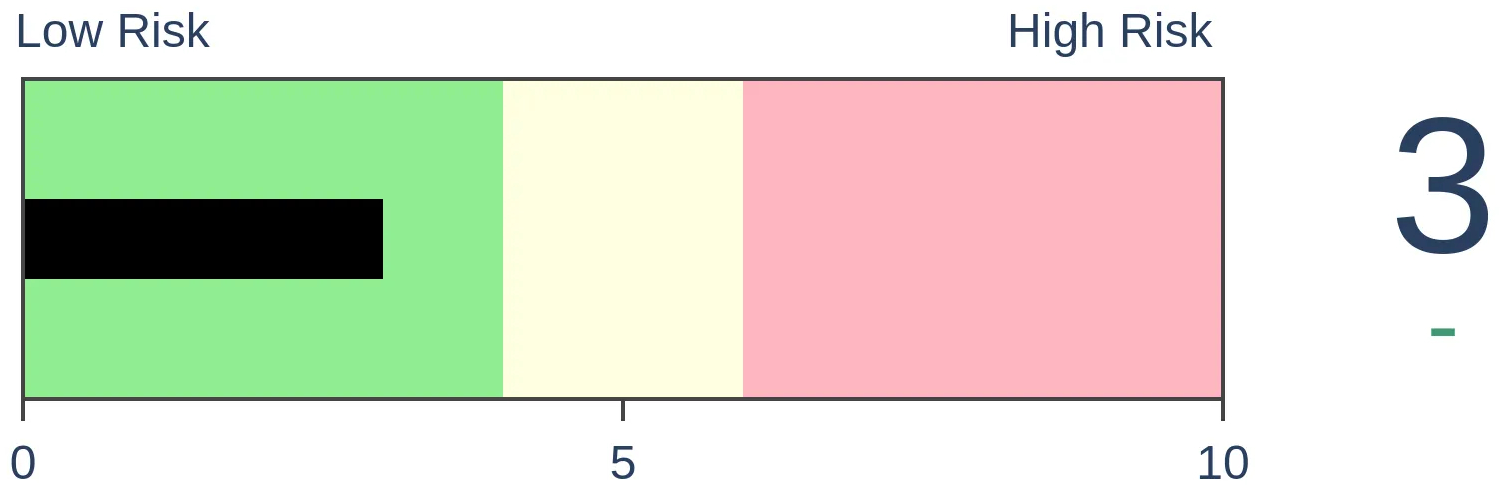
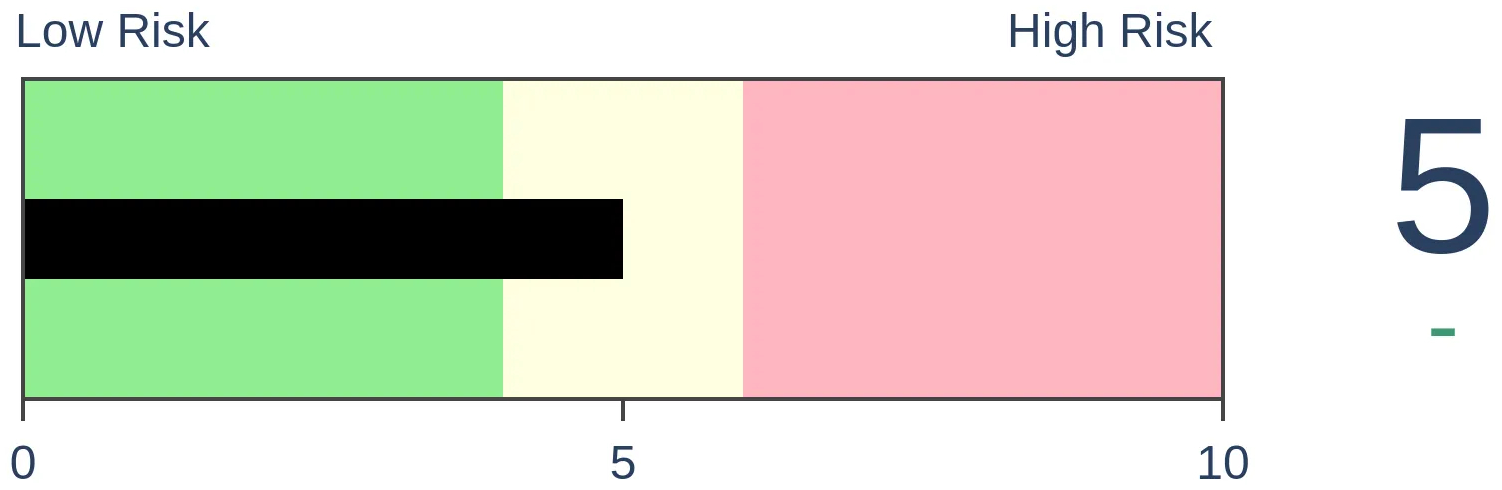
Risk Levels
Stocks Short-Term
|
Stocks Medium-Term
|
|
Bonds
|
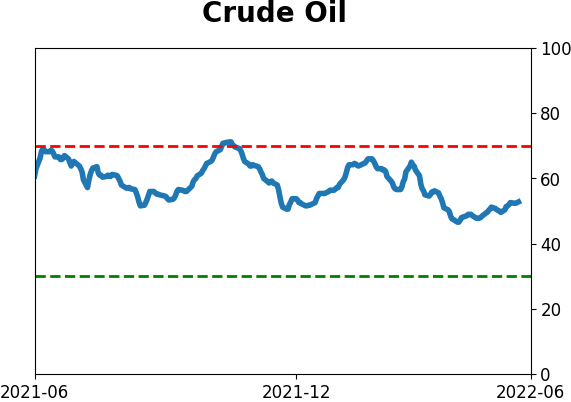
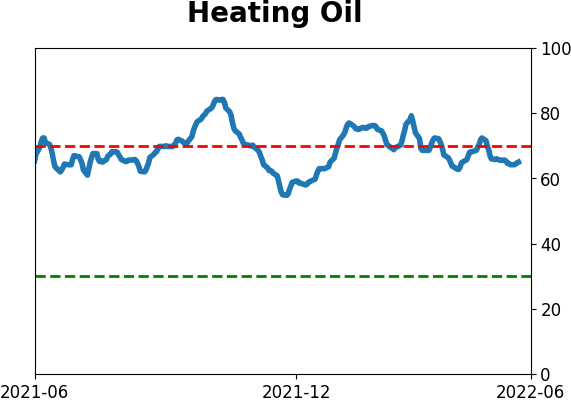
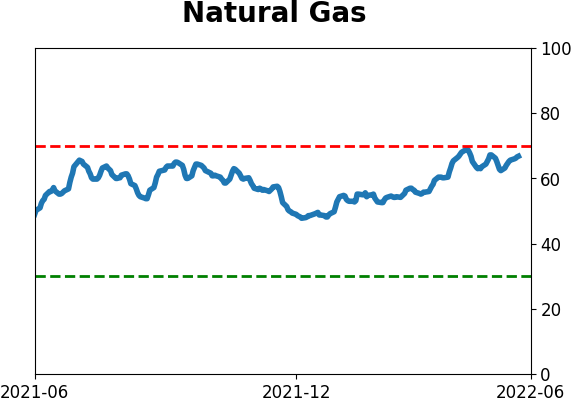
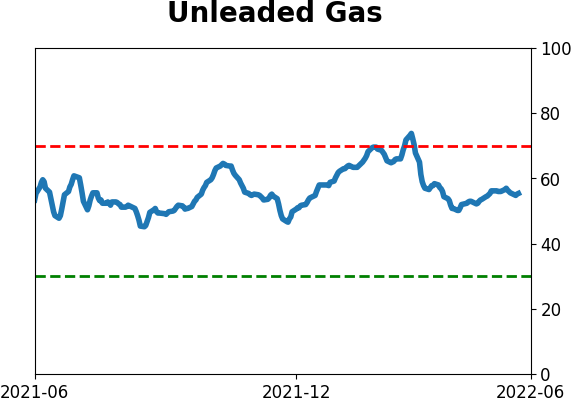
Crude Oil

|
|
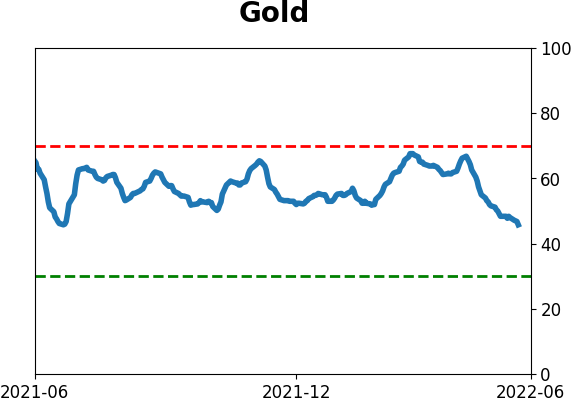
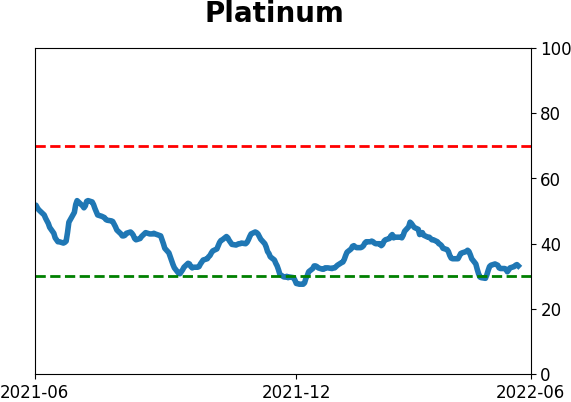
Gold

|
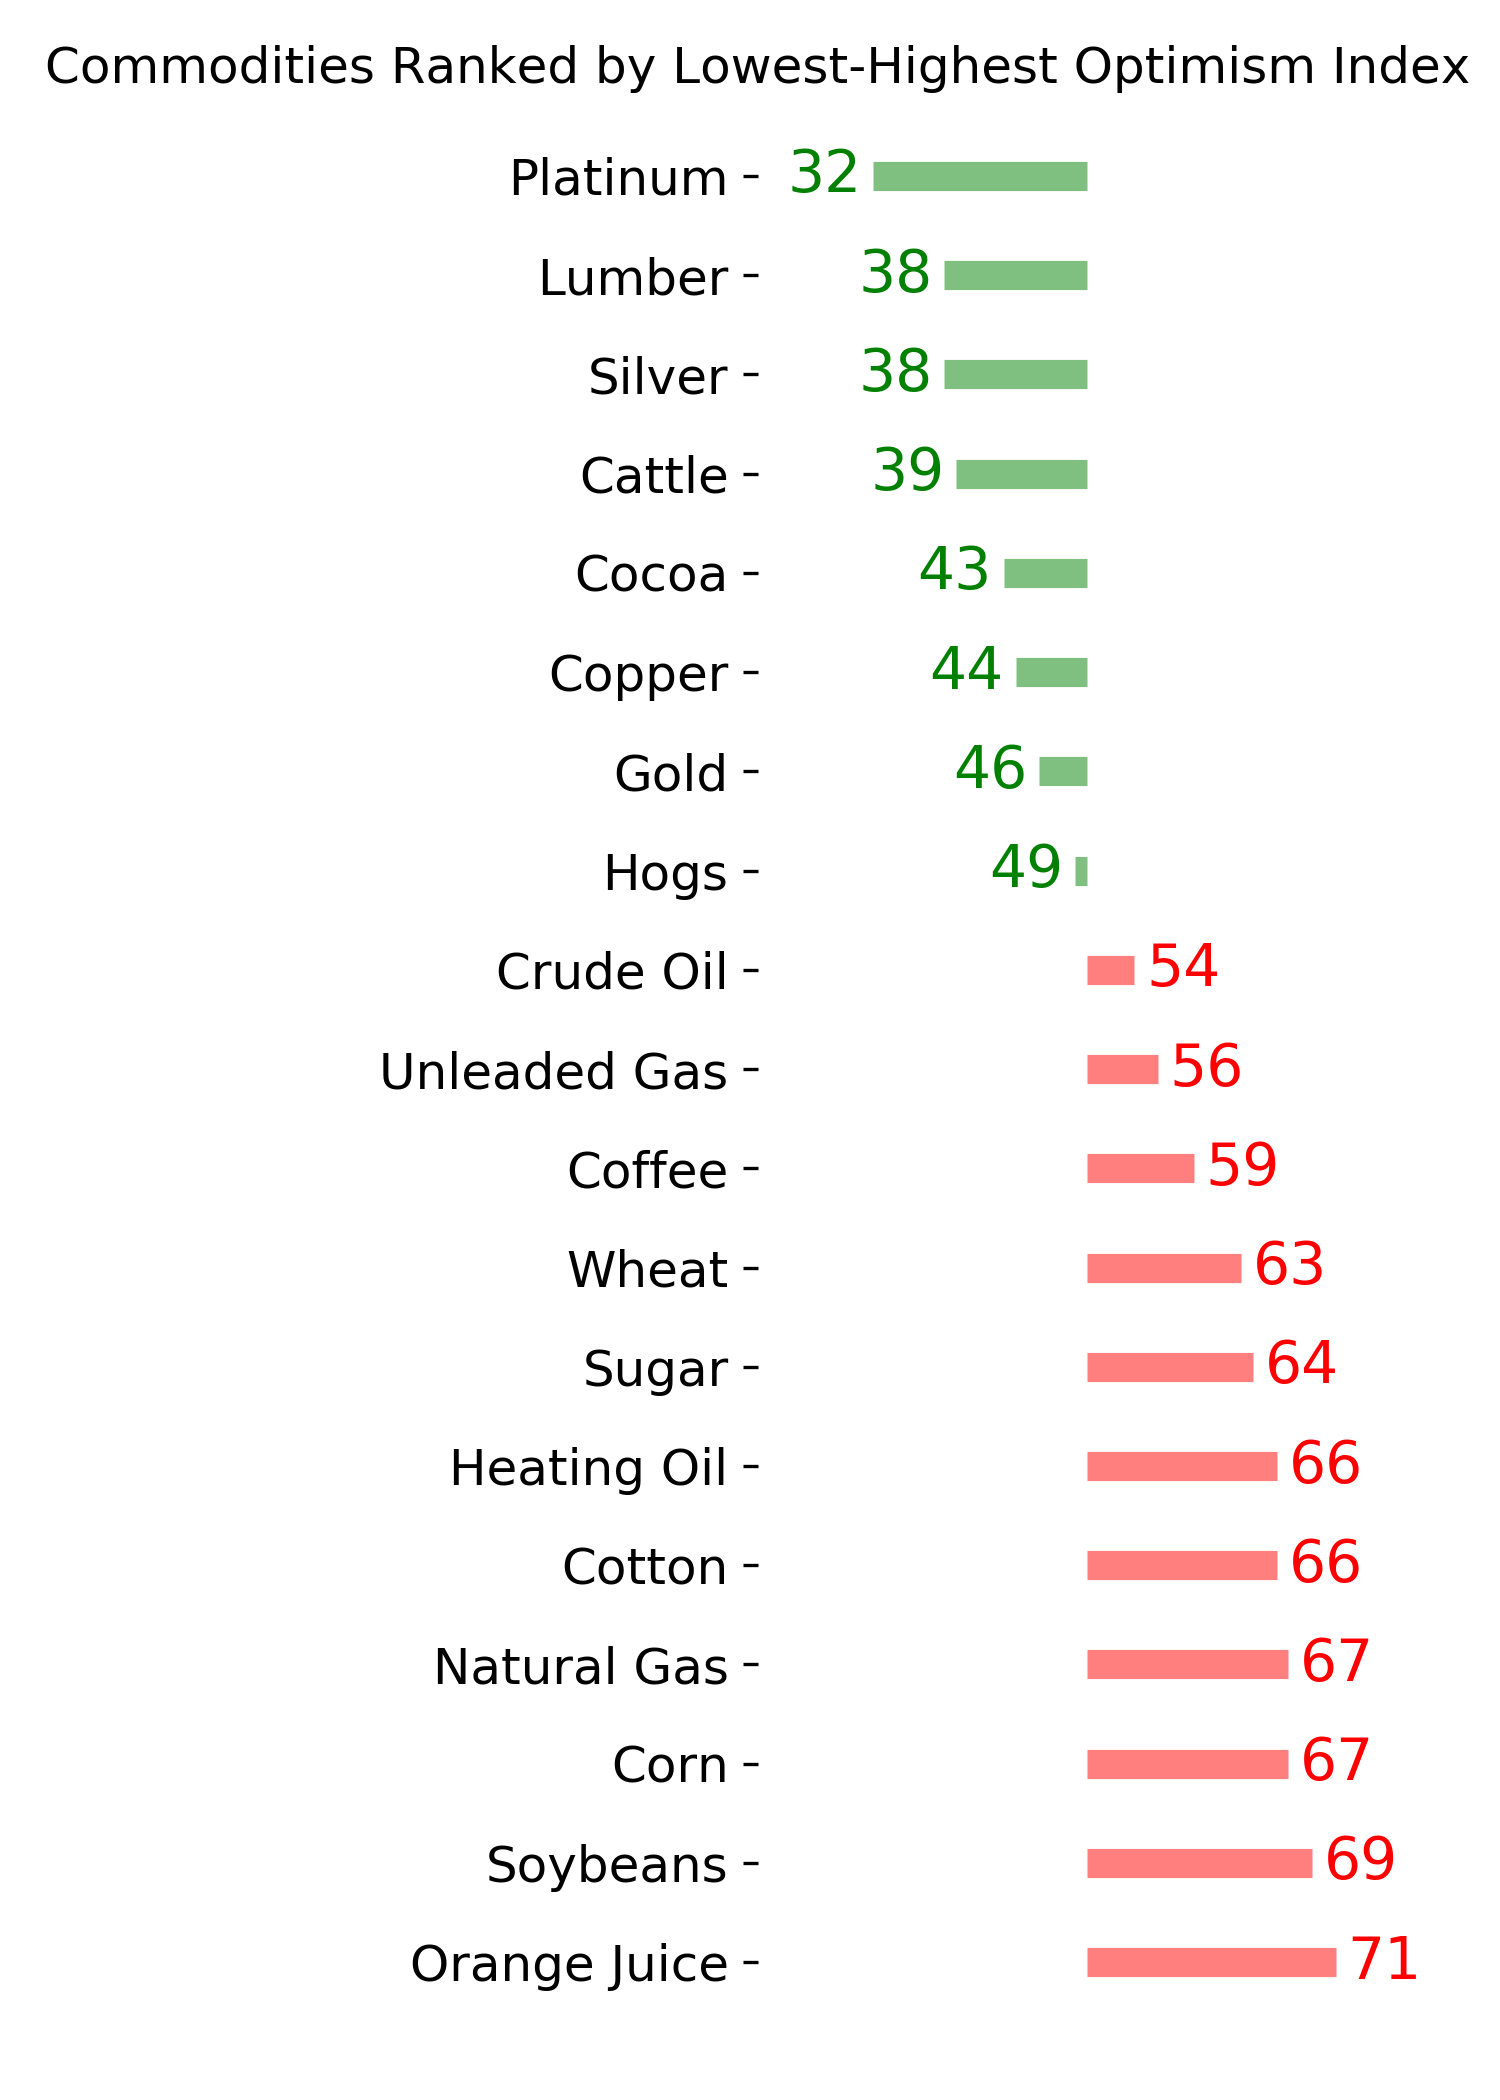
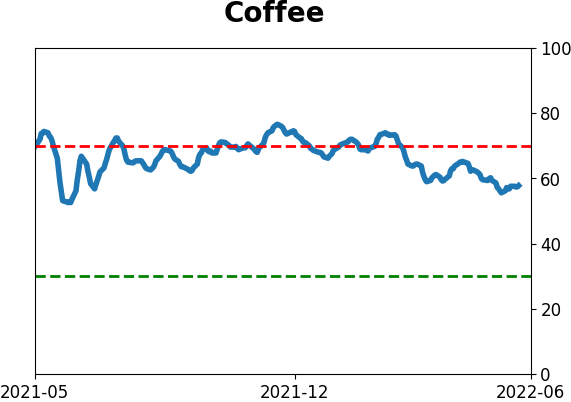
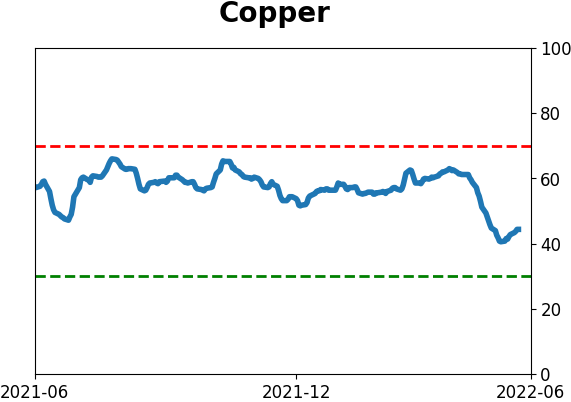
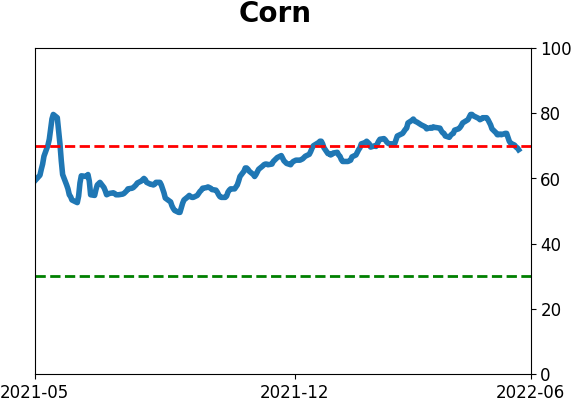
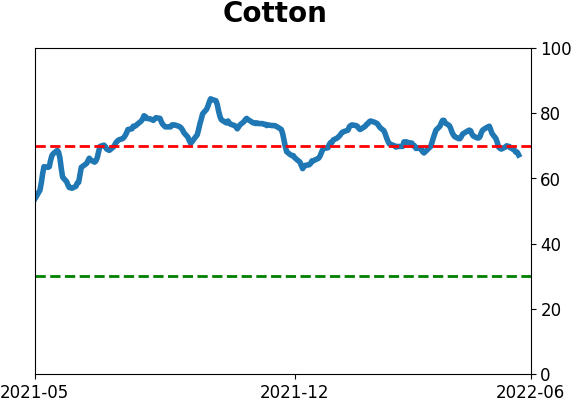
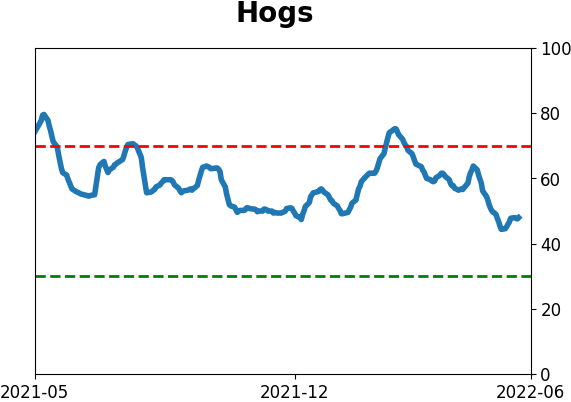
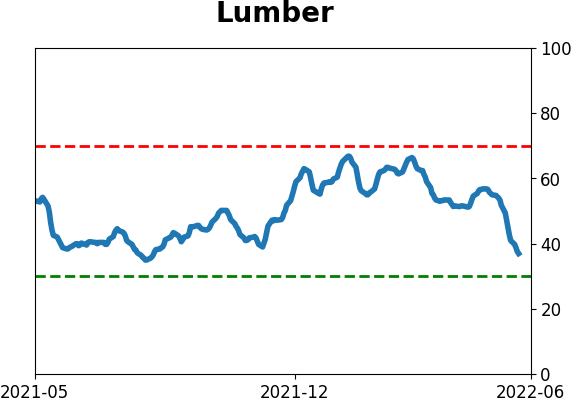
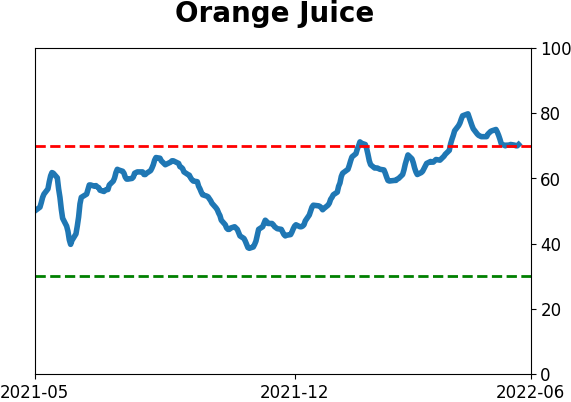
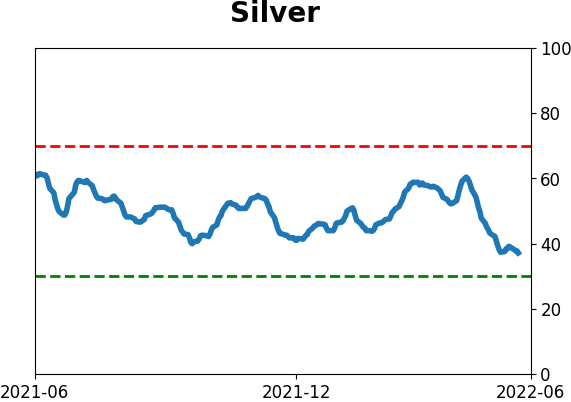
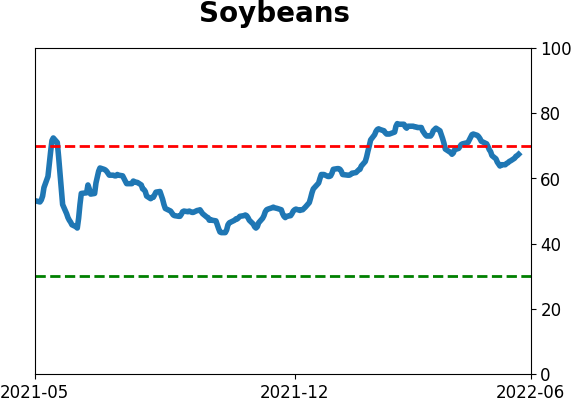
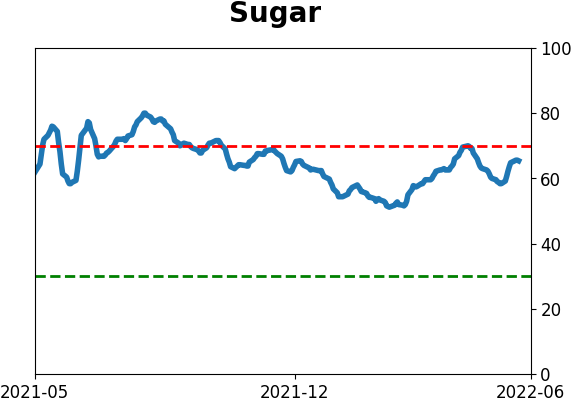
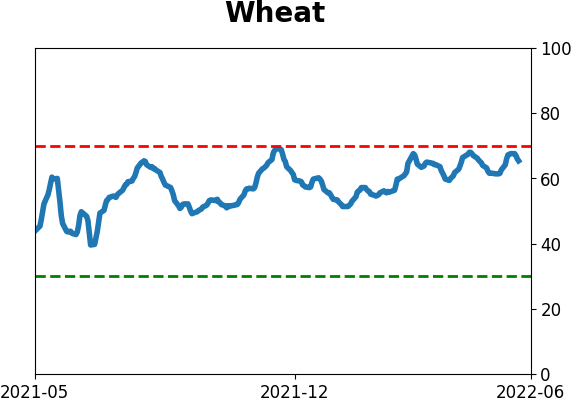
Agriculture
|
|
Research
By Jason Goepfert
BOTTOM LINE
Investors' concerns are cycling from too-high inflation to too-low growth. Because of that, the correlation between stocks and Treasuries has become negative in recent sessions. Soft economic releases like consumer surveys have been more disappointing than hard releases that reflect actual conditions.
FORECAST / TIMEFRAME
None
|
Key points:
- Inflation worries drove investor sentiment, and now that's moving toward growth worries
- The correlation between stocks and bonds has shifted quickly
- Consumer surveys are much more negative than economic data would justify (so far)
Worries morph from inflation to growth
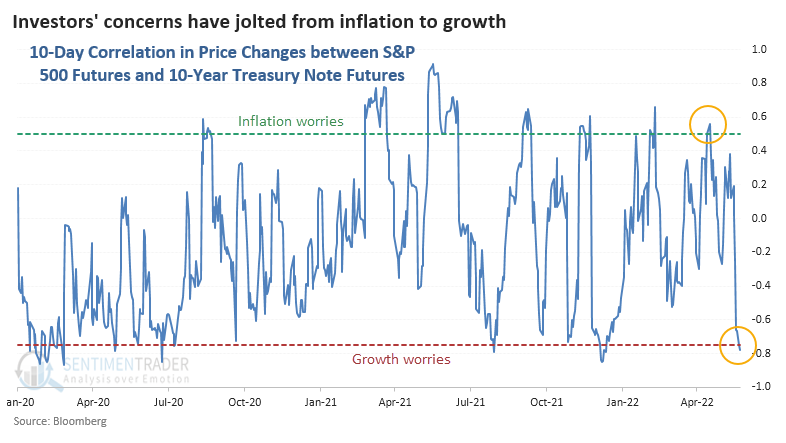
The guesses about what worries investors more are changing rapidly. A month ago, the narrative was that they were worried about inflation. Now, they're worried about growth. The stories have shifted quickly from a too-hot expansion that would drive increases in inflation and interest rates to a spike in recession talk.
We can see that clearly in the shift in the relationship between stocks and bonds. The daily price changes in the S&P 500 futures and 10-year Treasury note futures have cycled from positive to strongly negative. On down days in stocks, investors are moving into Treasuries for safety, and those should appreciate if growth slows and interest rates fall or rise more slowly.
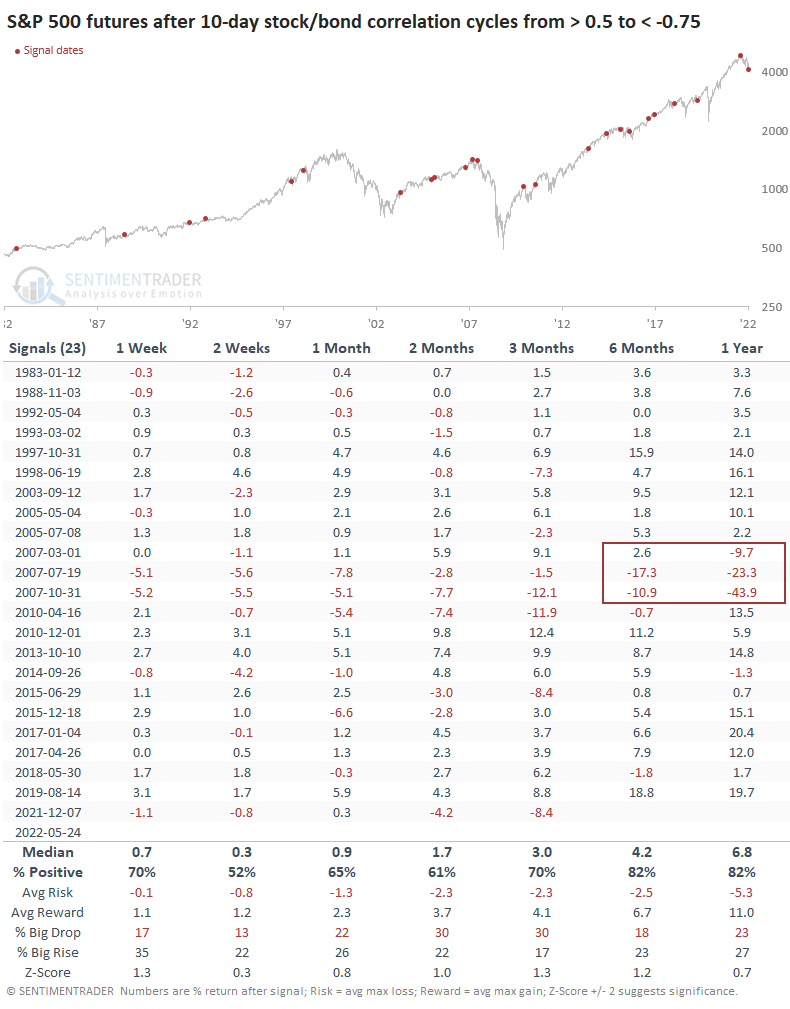
When investors shifted quickly from one scare to the other, it mostly preceded gains for the S&P 500. Most of these came when stocks were rising, not falling, but the only signals that preceded substantial negative returns over the next 6-12 months were the few that triggered in 2007.
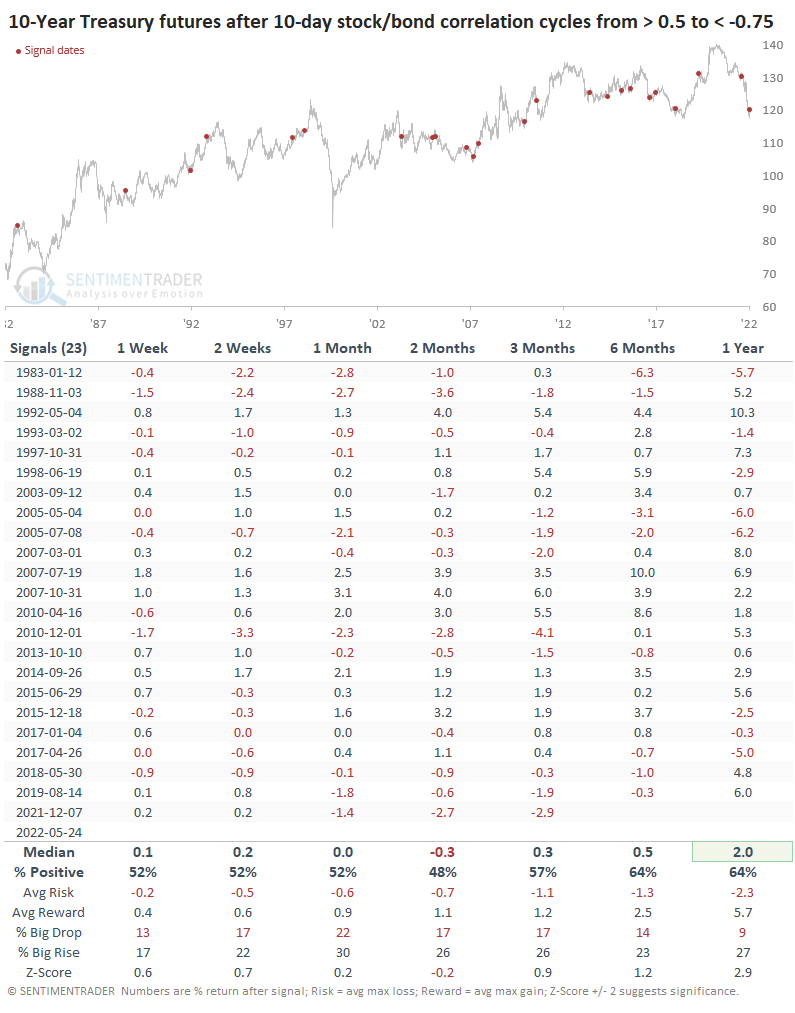
For Treasuries it was also a mixed sign.
We can see that the growth concerns among investors and consumers mostly is starting to play out in the economic data, as economic surprises have been to the downside of economists' expectations.
But consumers' expectations have fallen even further. The surprises in "soft" economic releases like consumer surveys have been more significant than in "hard" releases of actual economic performance.
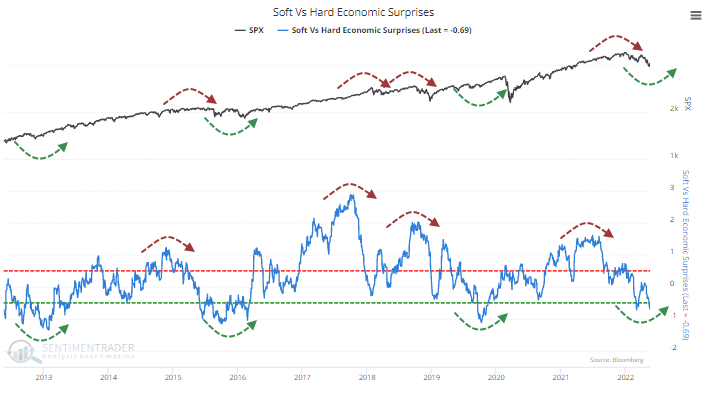
This is a tenuous conclusion, but over the past decade, when consumers were too optimistic relative to actual economic output, it preceded harsh conditions for stocks and vice-versa. A big caveat is that consumers were consistently more pessimistic during the 2002 and 2008 bear markets, so bulls want to see this data reverse to the upside.
What the research tells us...
Many investors overestimate the importance of economic data on stock performance. While there is something of a relationship, it's pretty weak - investors are much more forward-looking than economic data or (especially) surveys of economic potential. Currently, the deep pessimism toward stocks has only recently been rewarded by disappointing economic data. Still, surveys suggest the economy would have to fall much further, much faster, to justify their pessimism. Much of that has been focused on weak growth, so if we see upcoming economic data surprise to the upside and/or company earnings releases say the outlook is okay, it should be a positive jolt for stocks.
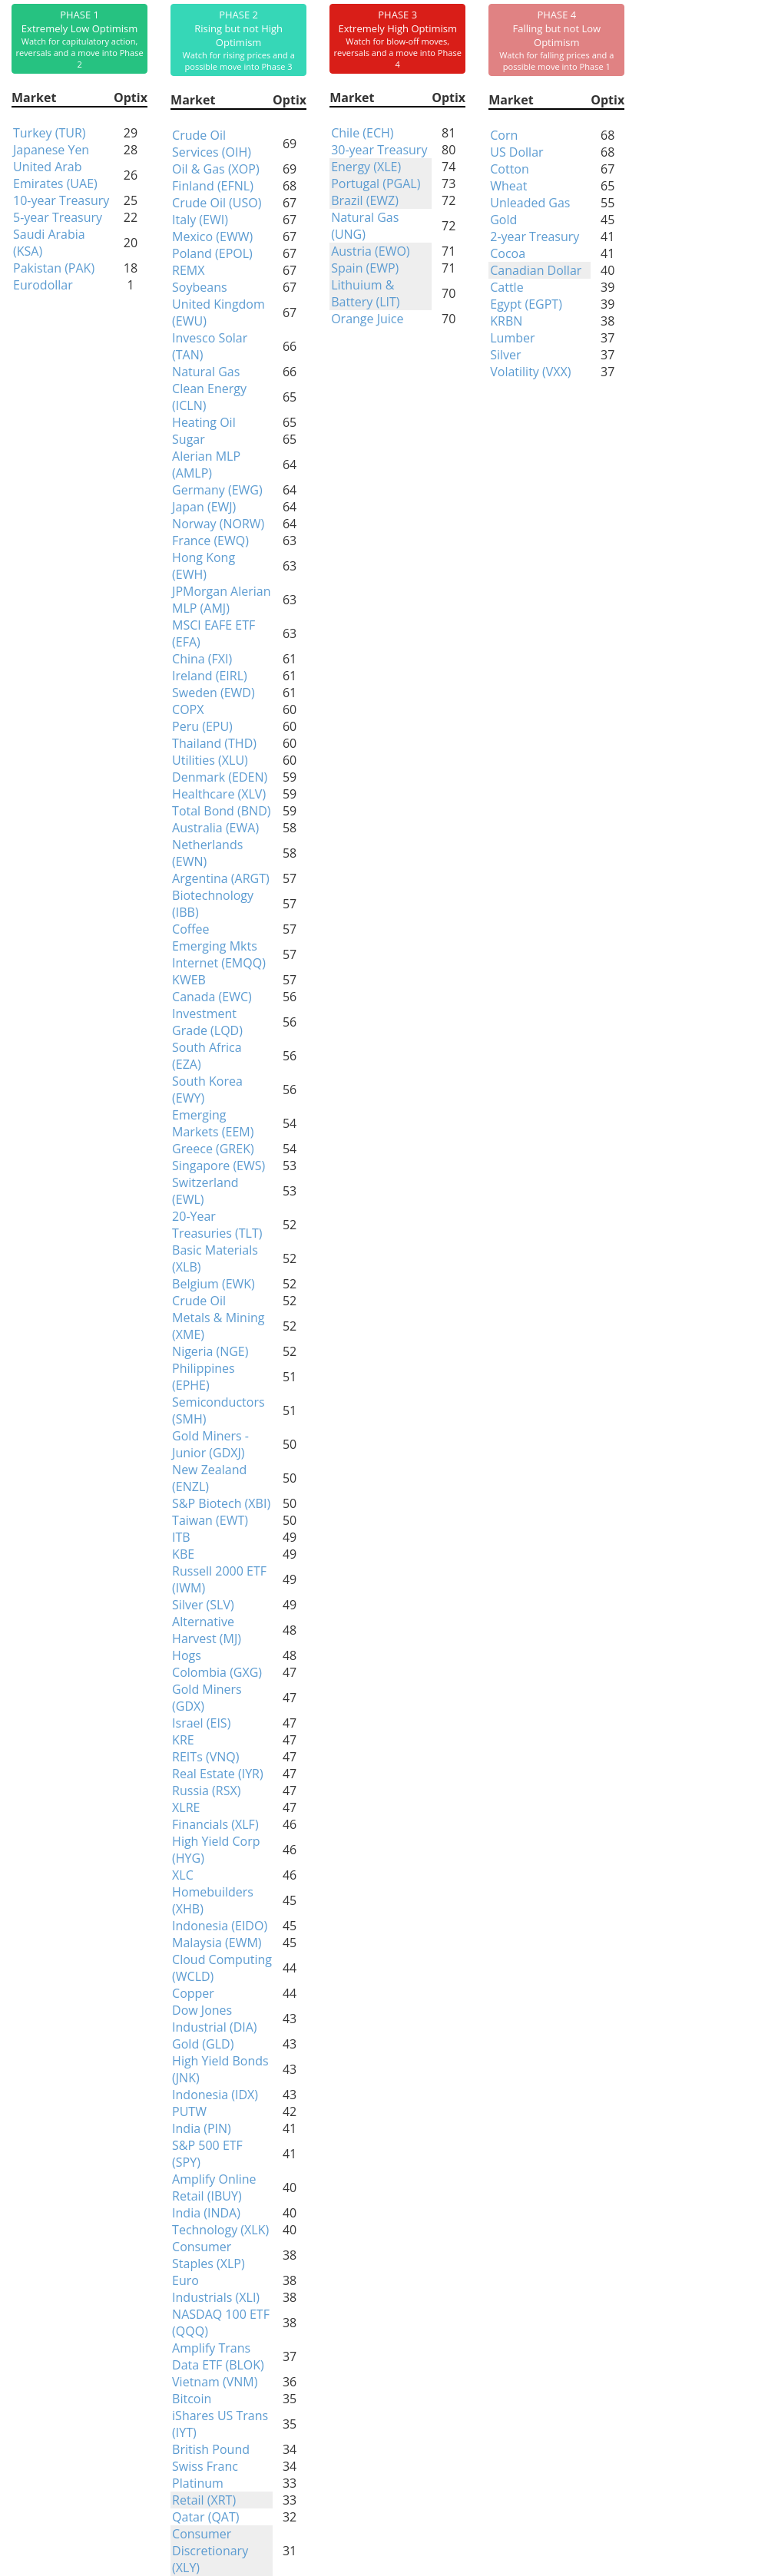
Indicators at Extremes
Phase Table
Ranks
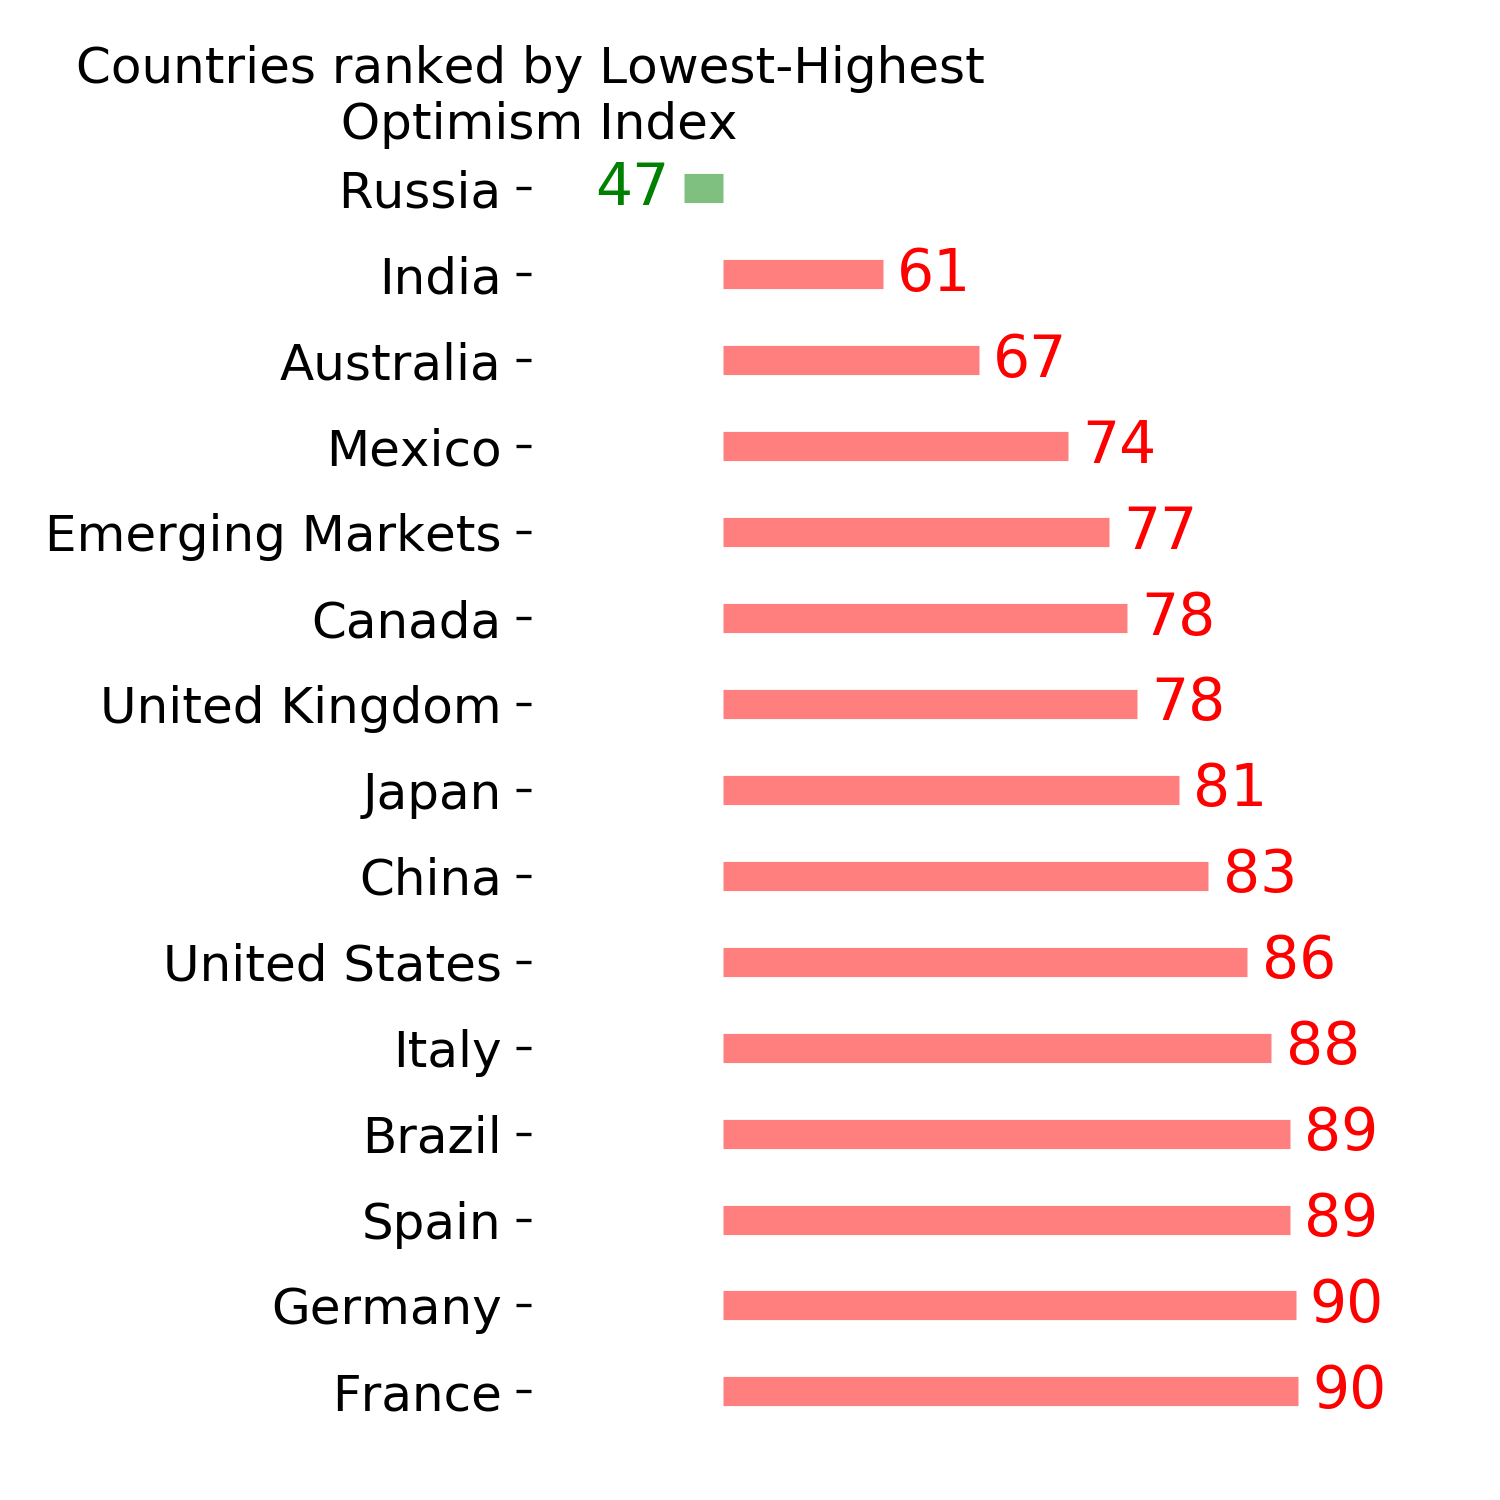
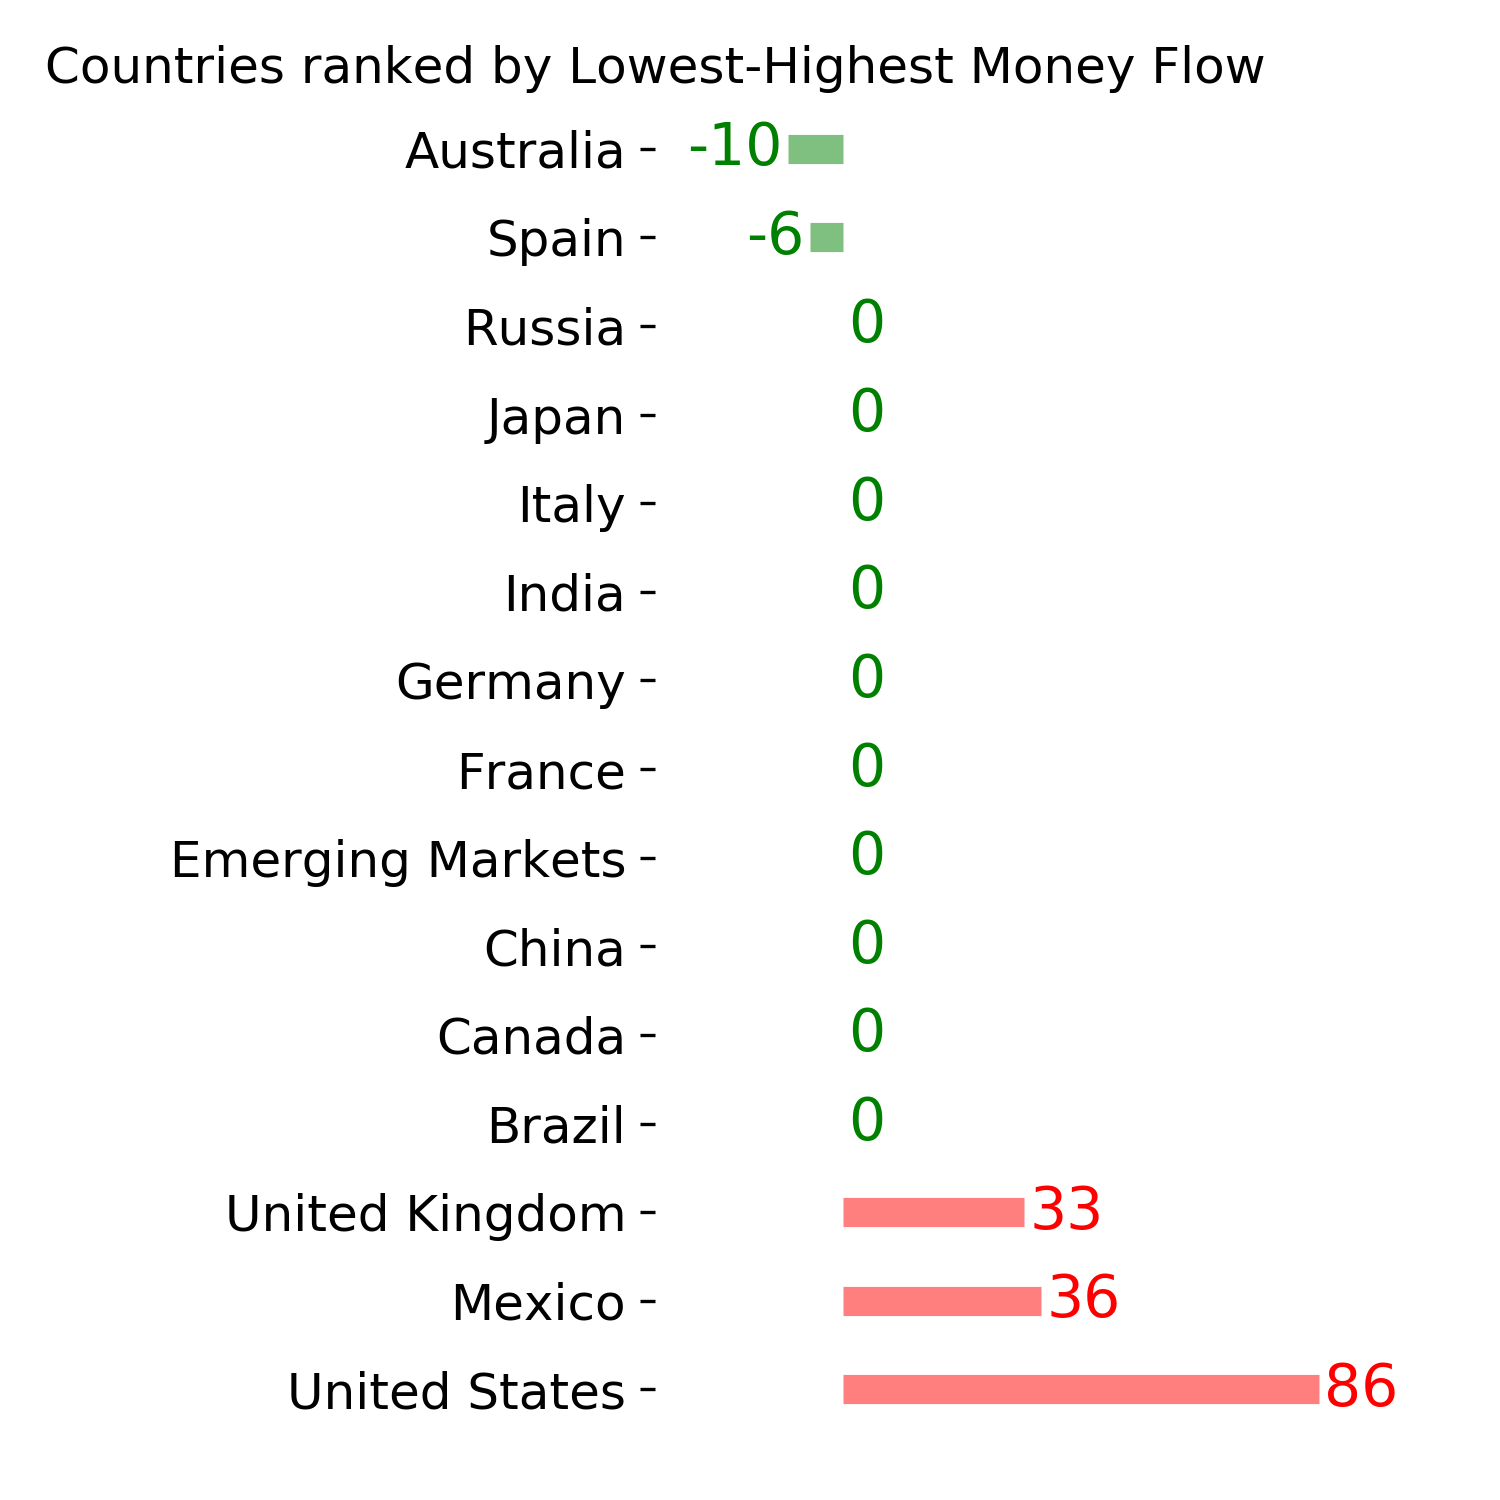
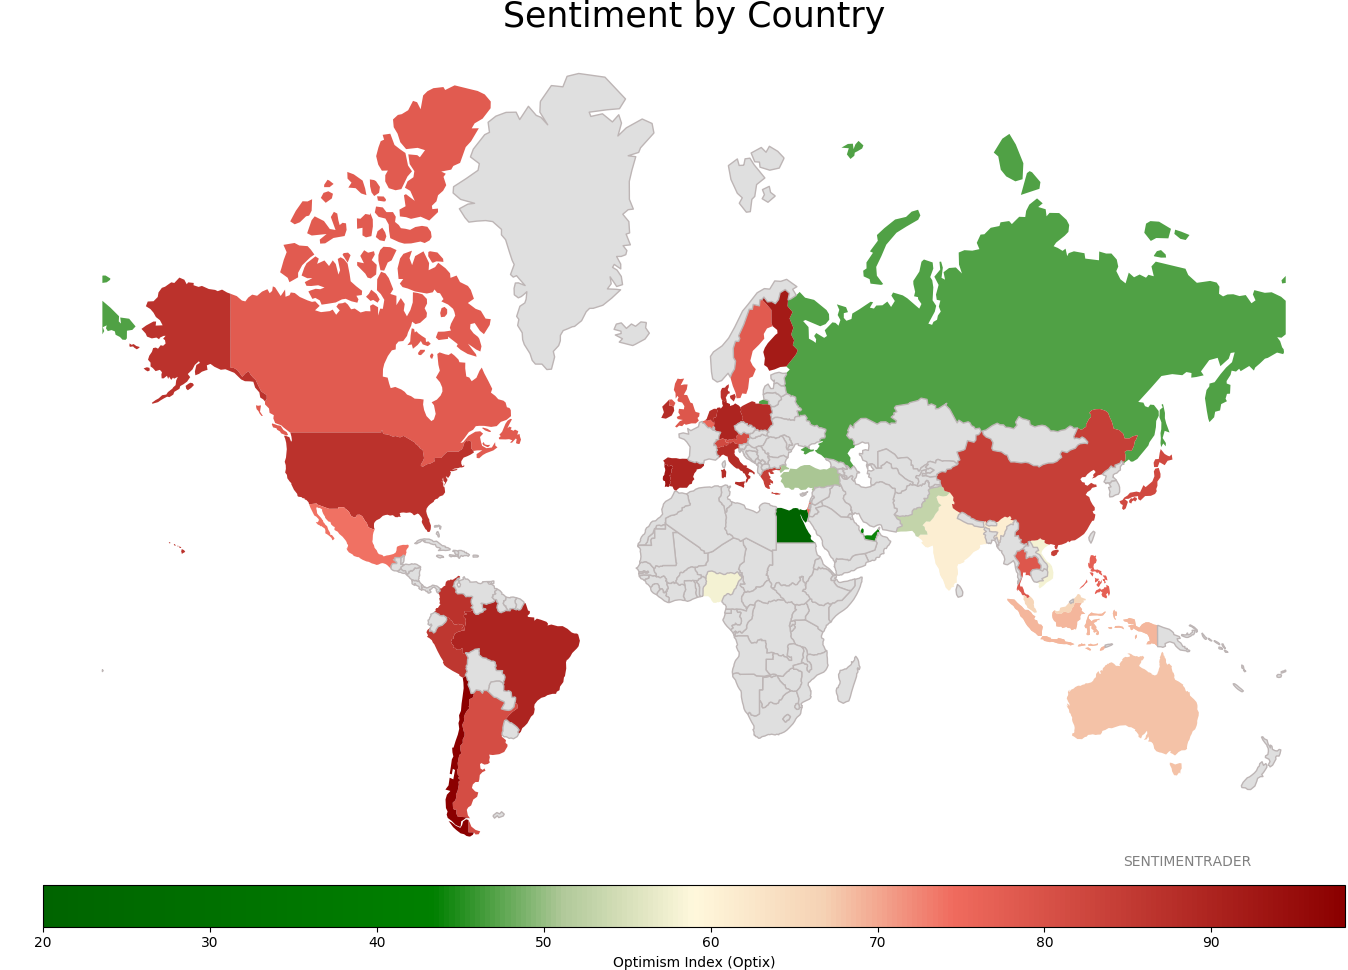
Sentiment Around The World
Optimism Index Thumbnails
|
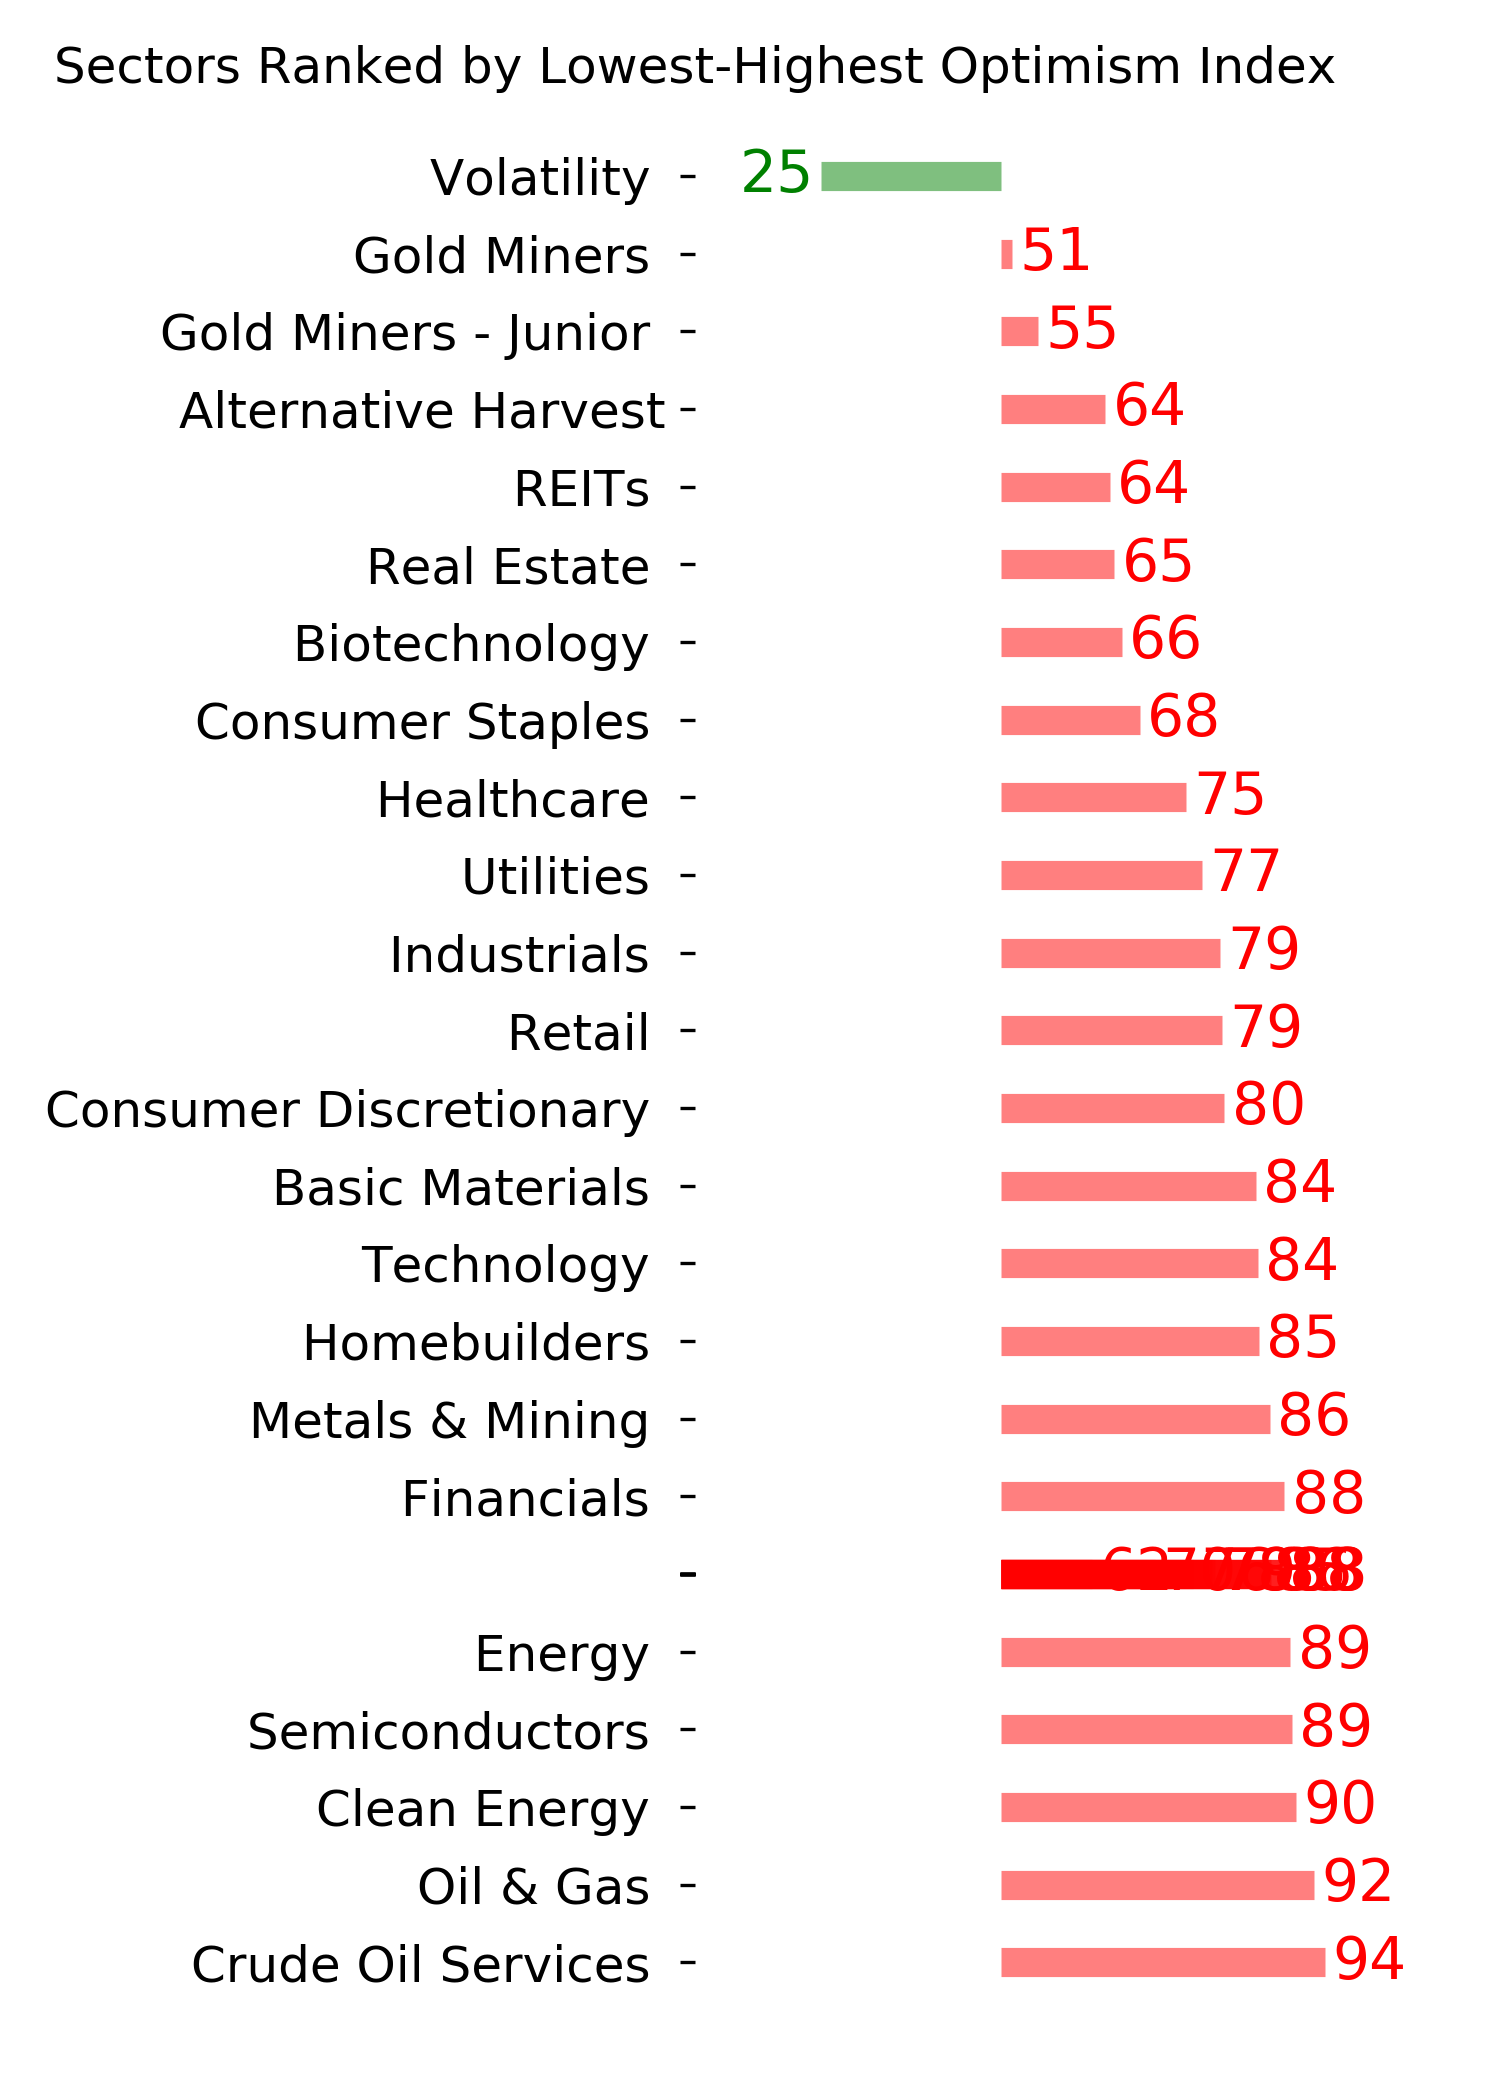
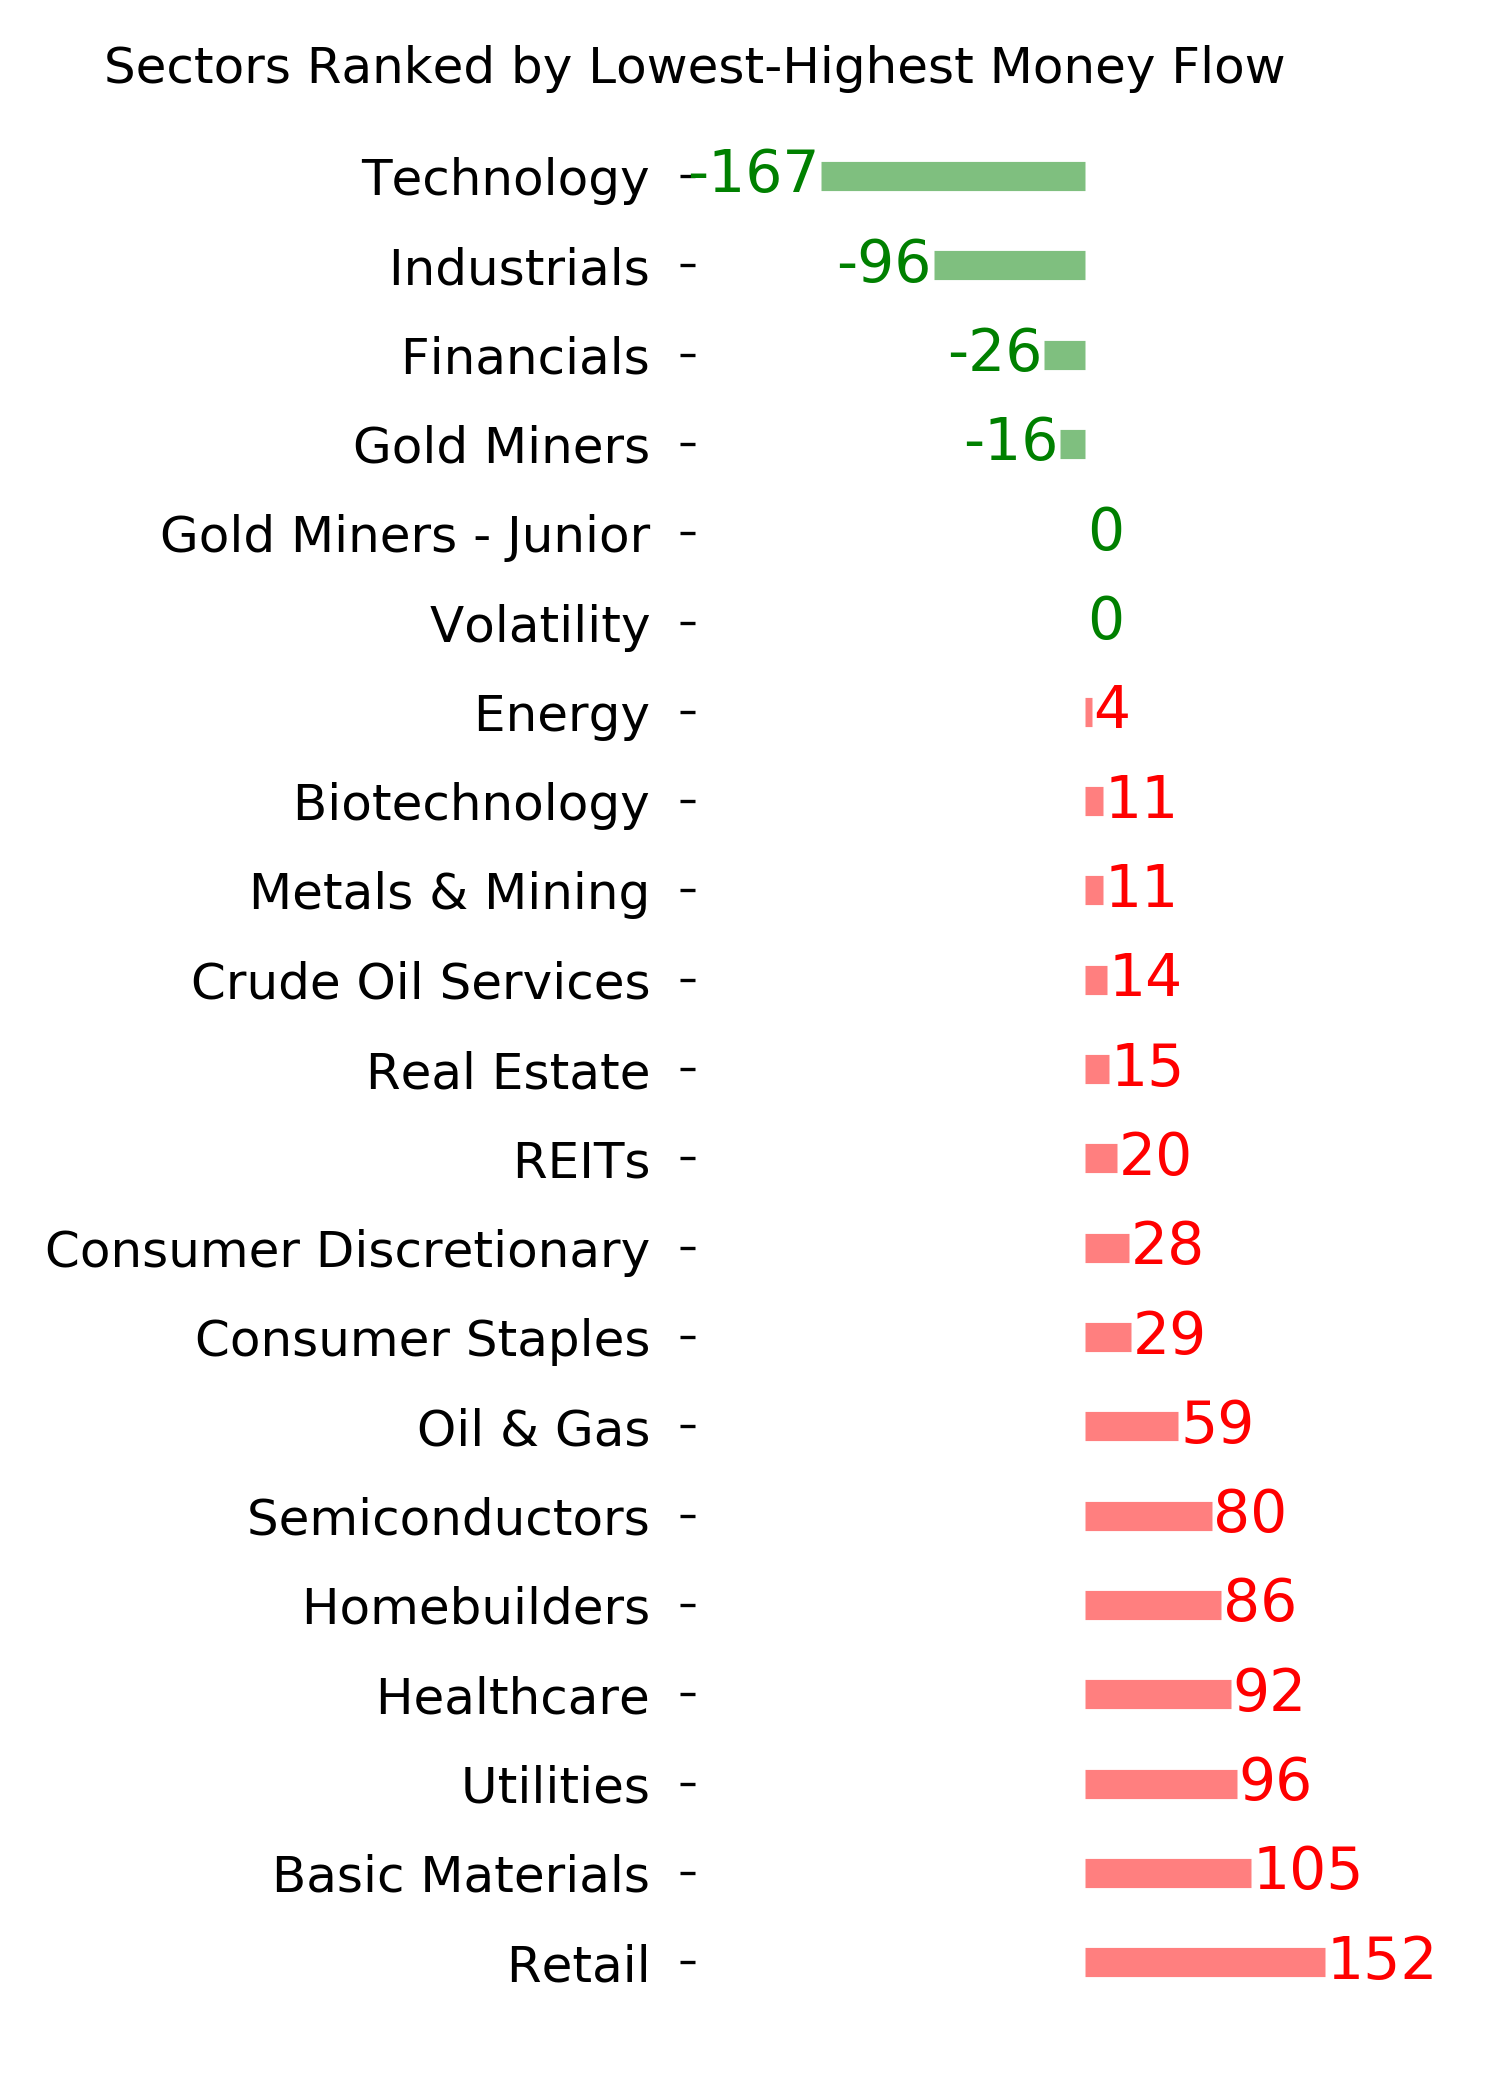
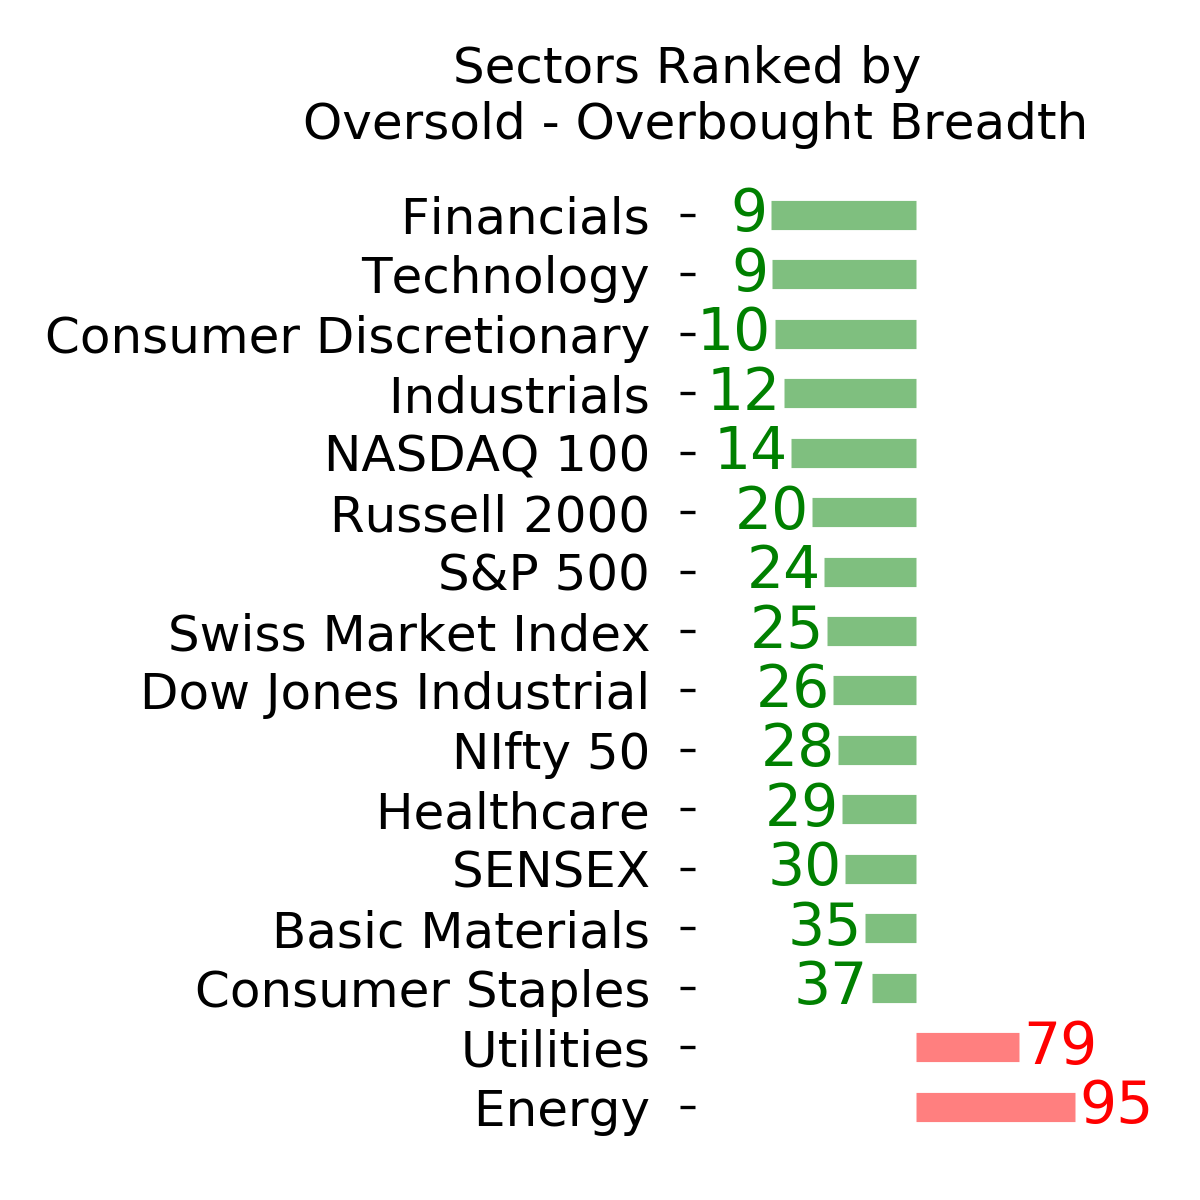
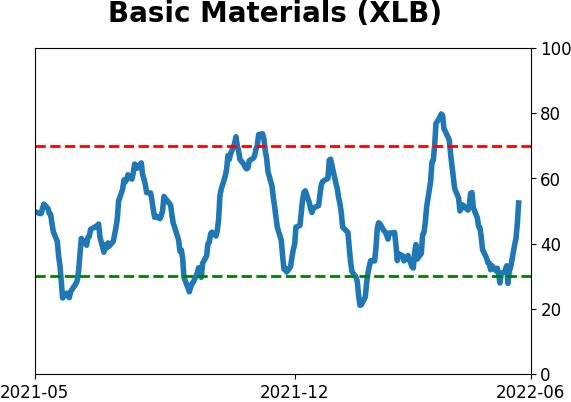
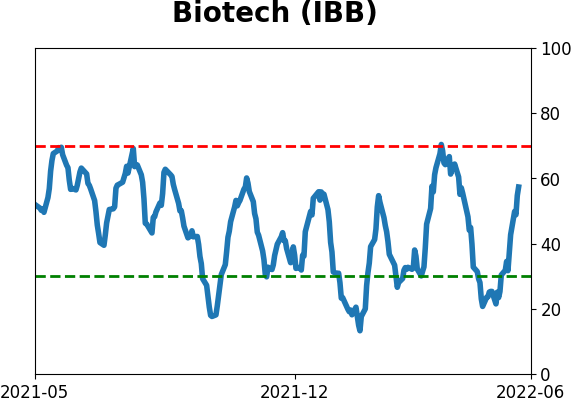
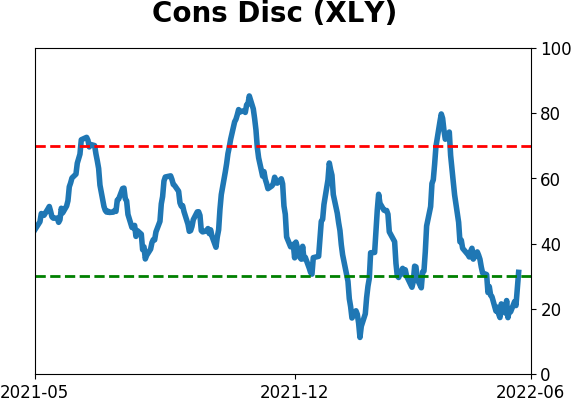
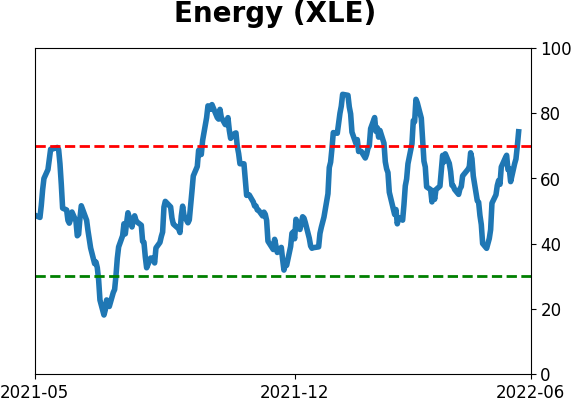
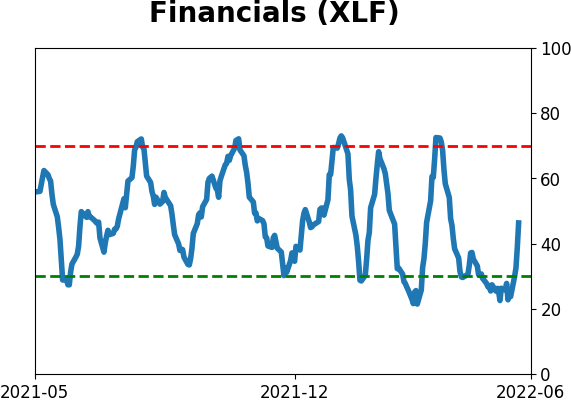
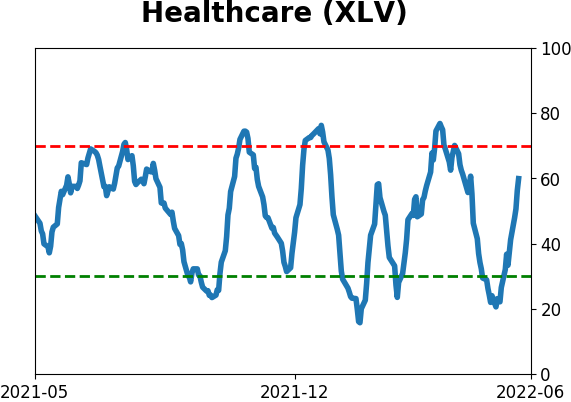
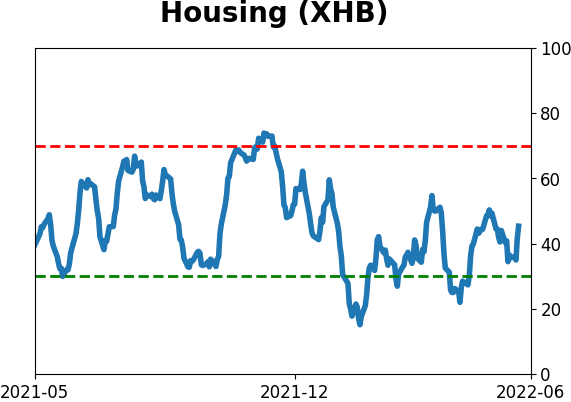
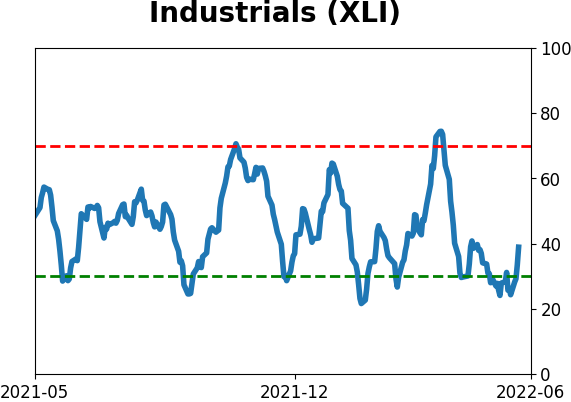
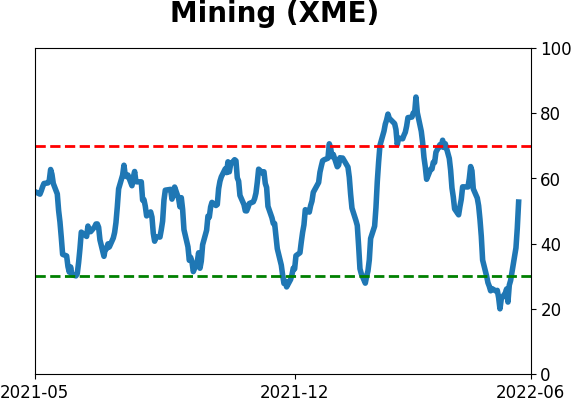
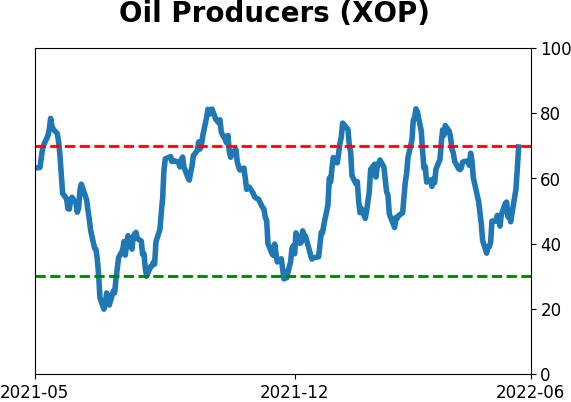
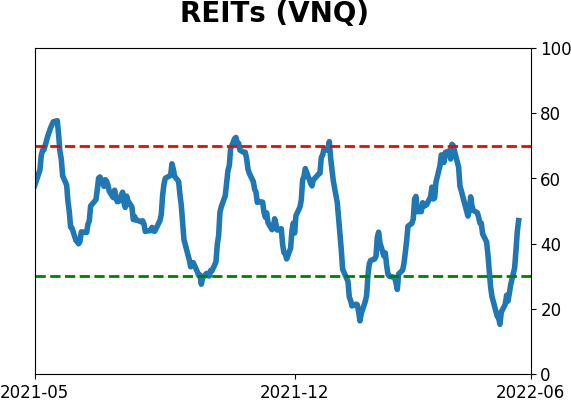
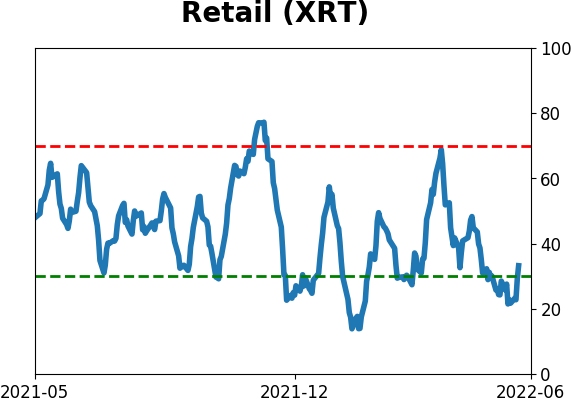
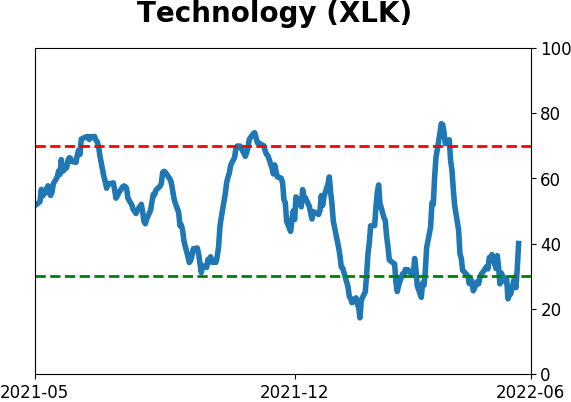
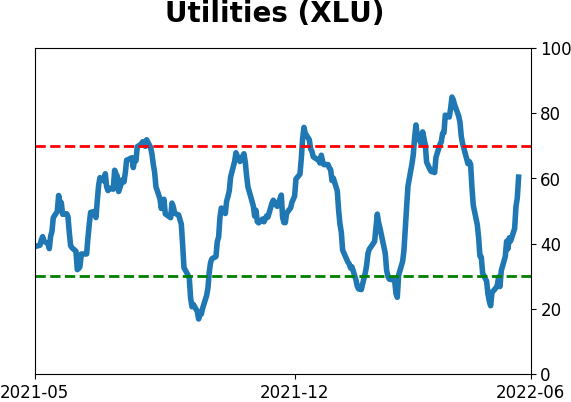
Sector ETF's - 10-Day Moving Average
|
|
|
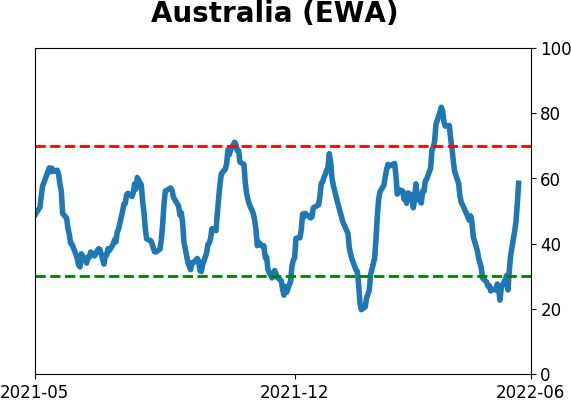
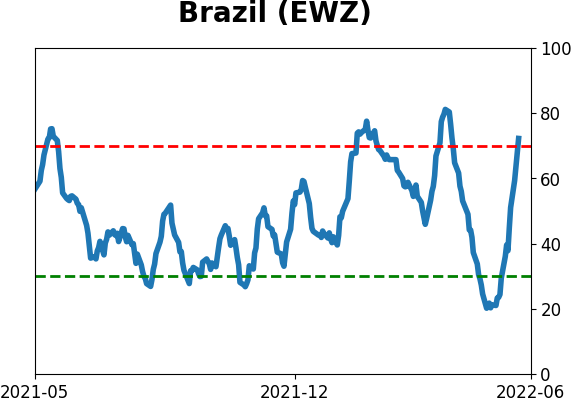
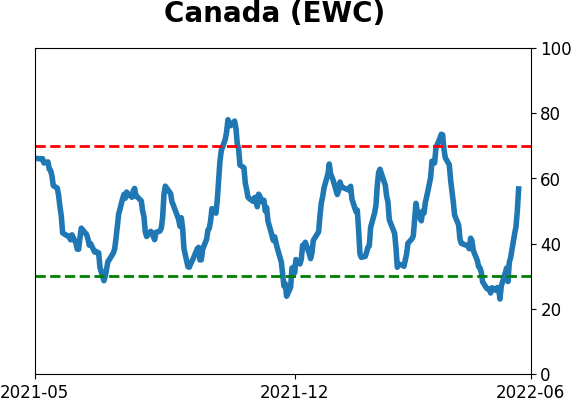
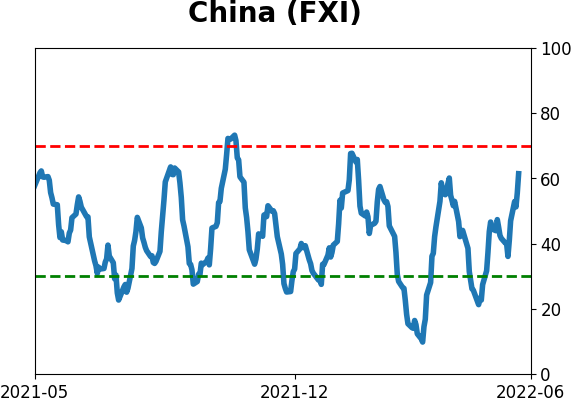
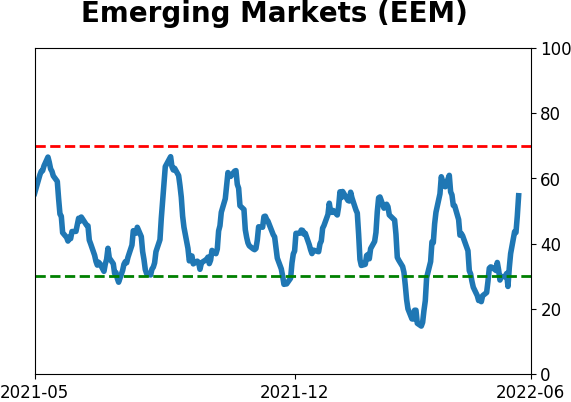
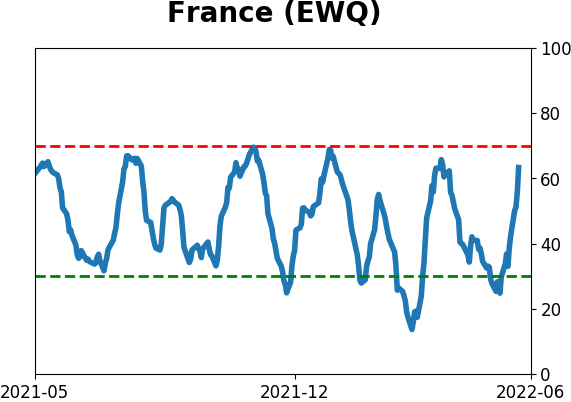
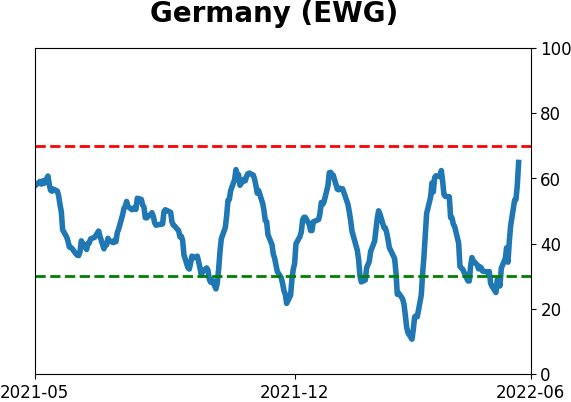
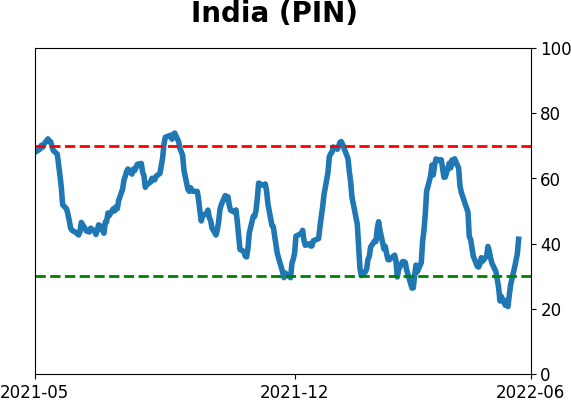
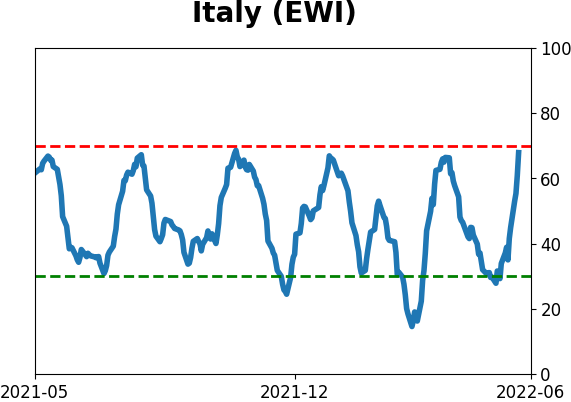
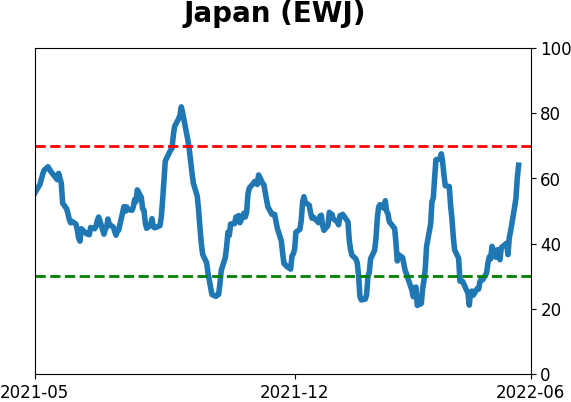
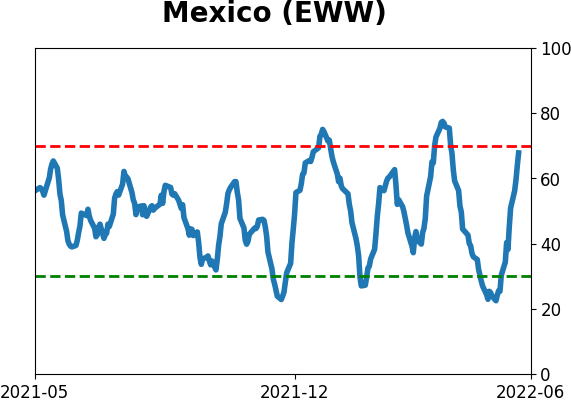
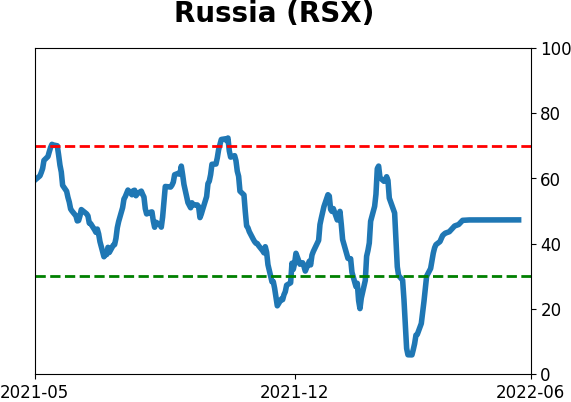
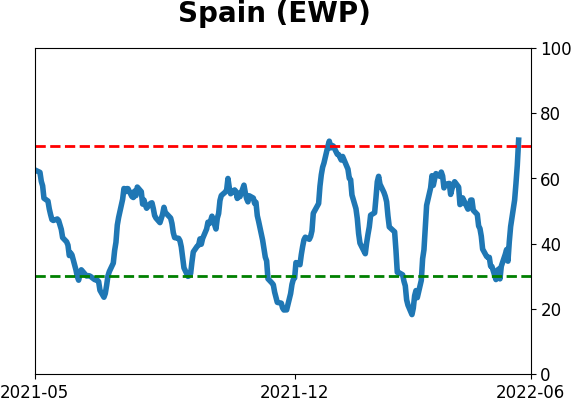
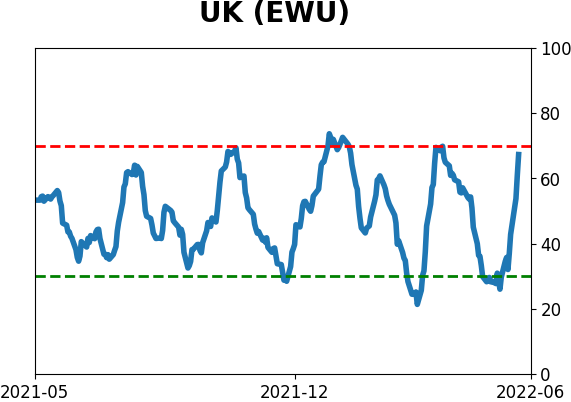
Country ETF's - 10-Day Moving Average
|
|
|
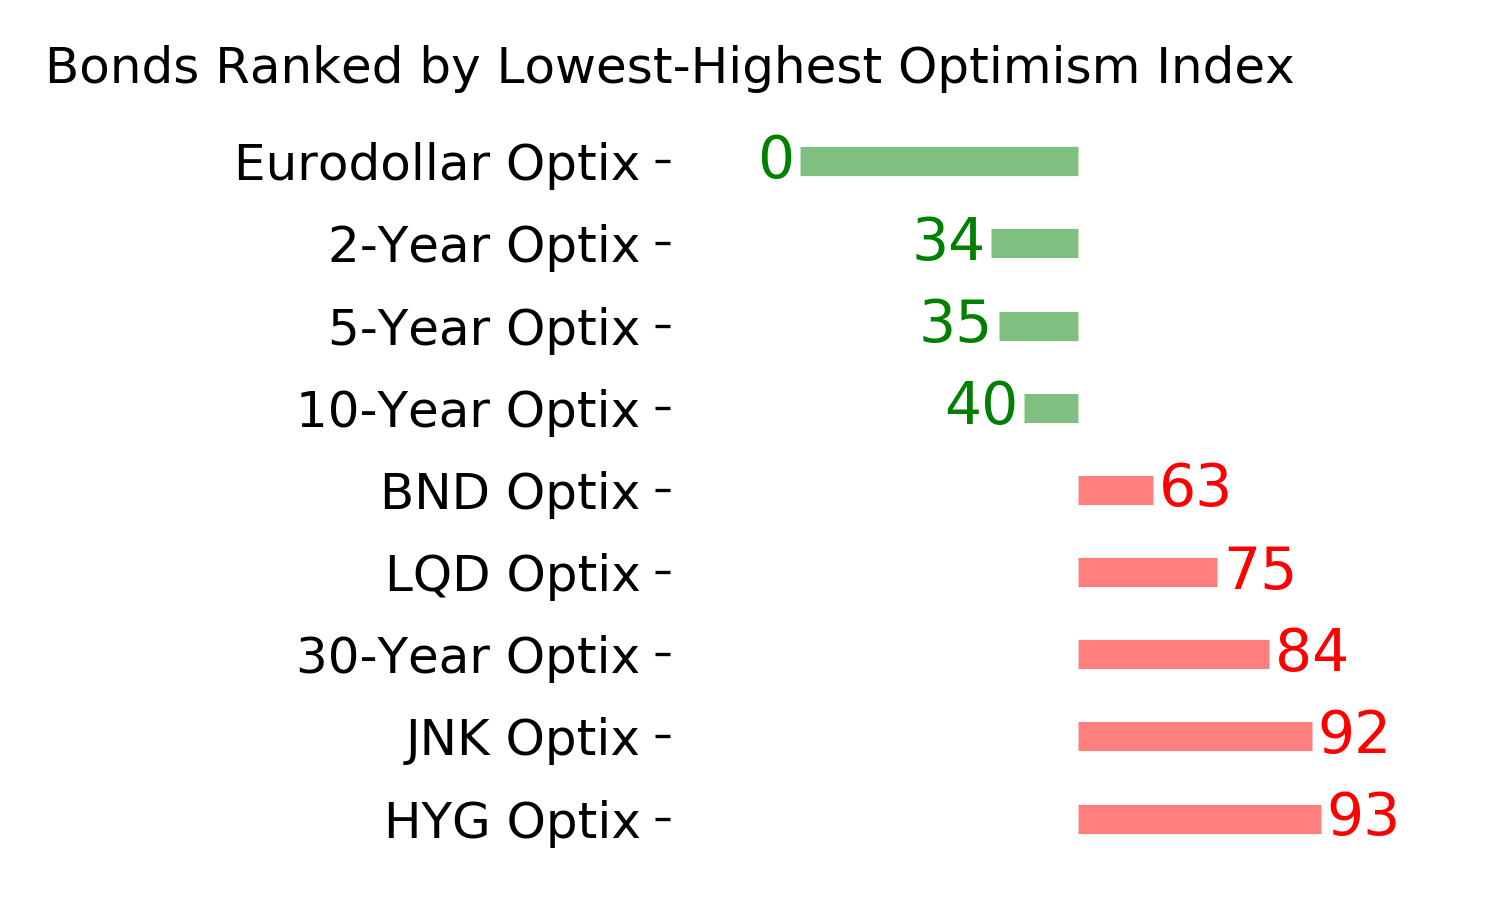
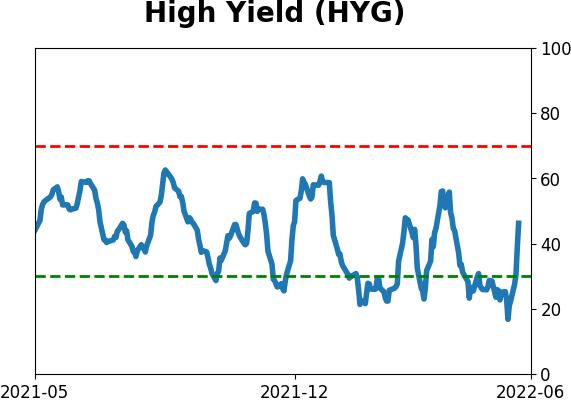
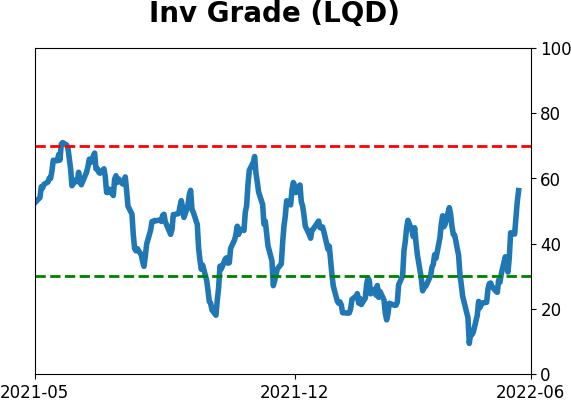
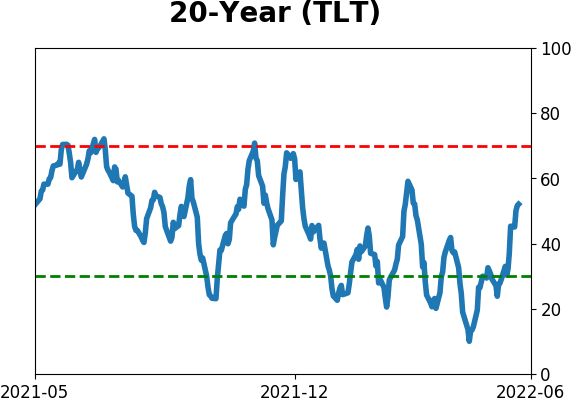
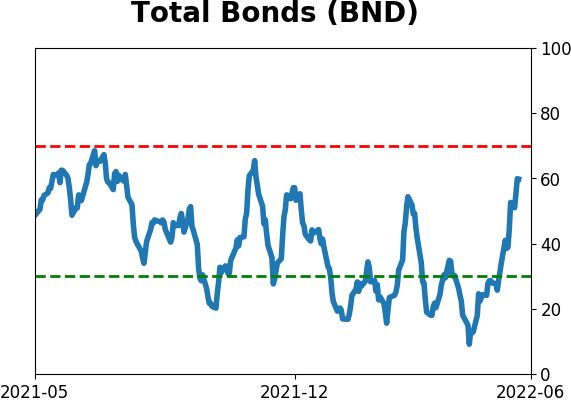
Bond ETF's - 10-Day Moving Average
|
|
|
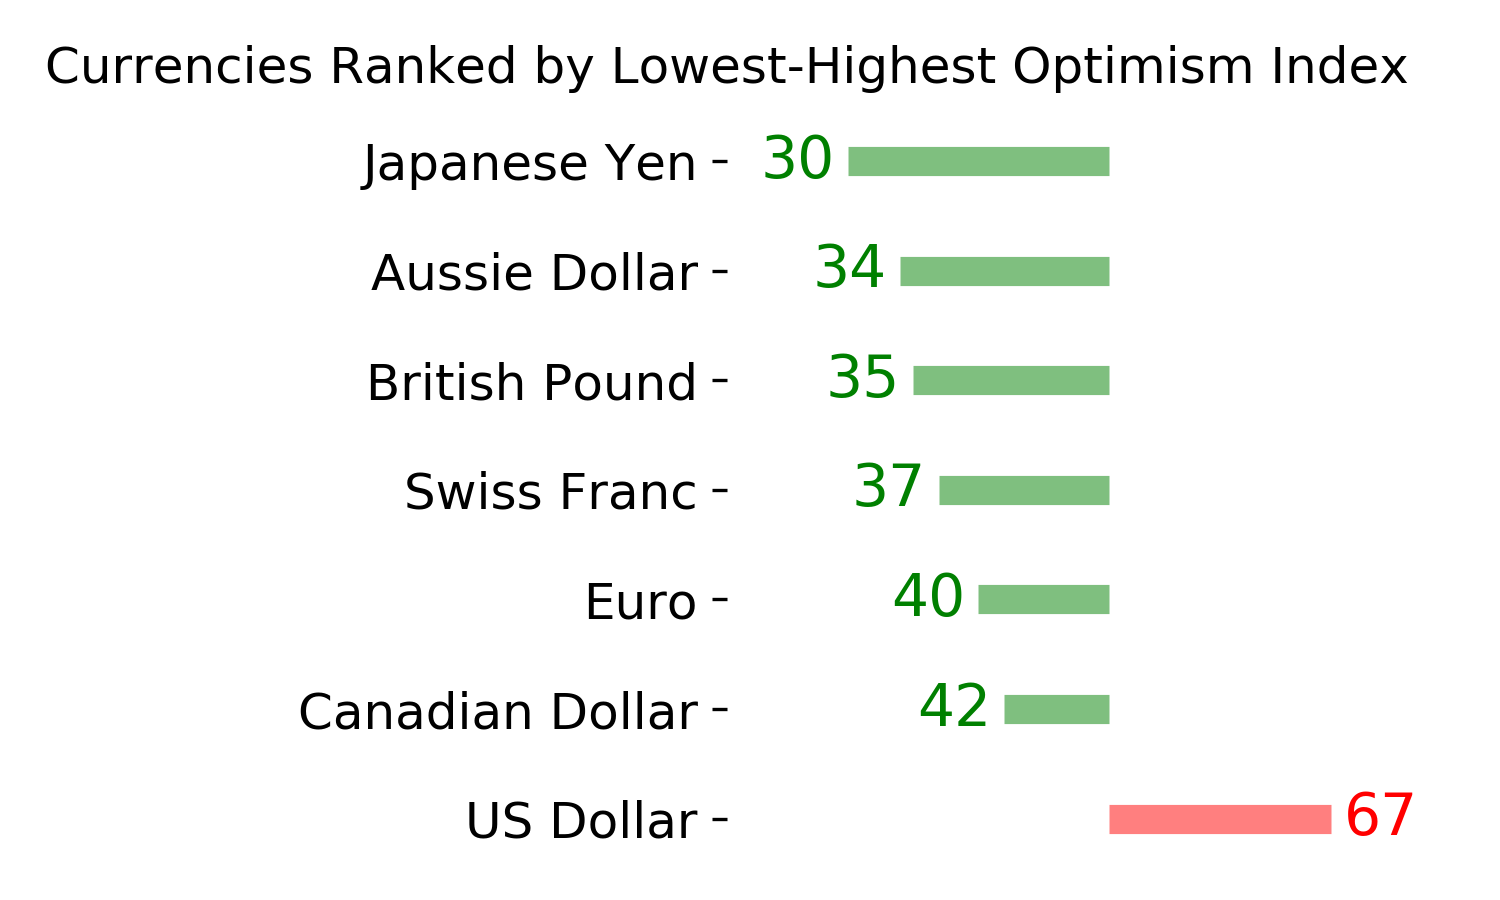
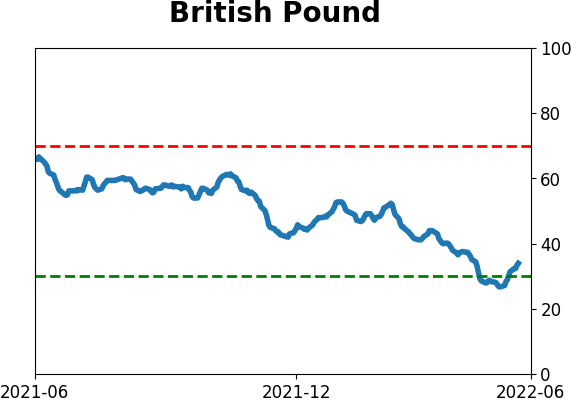
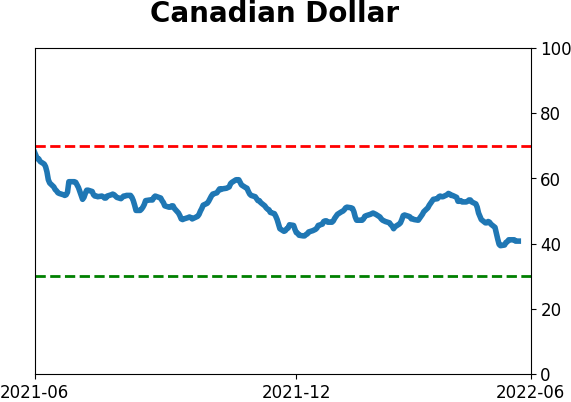
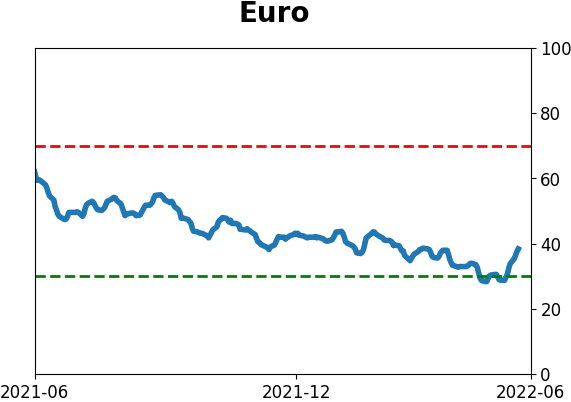
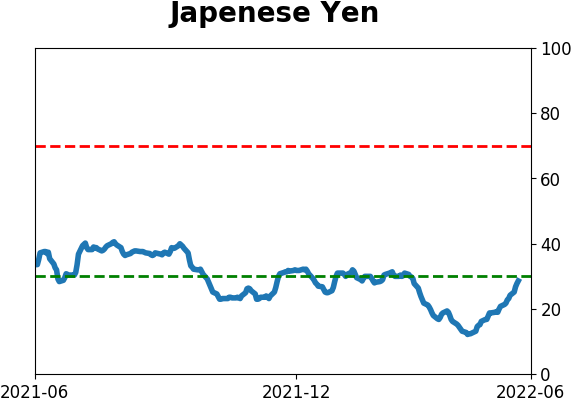
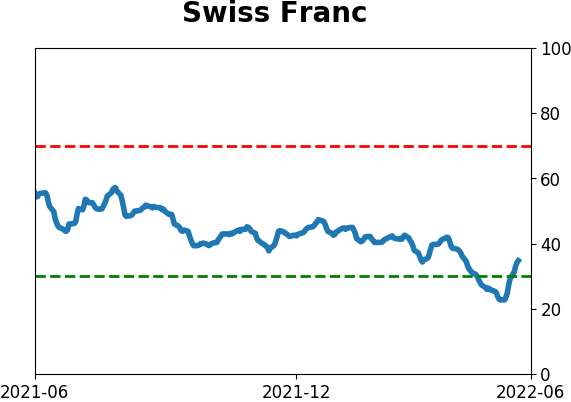
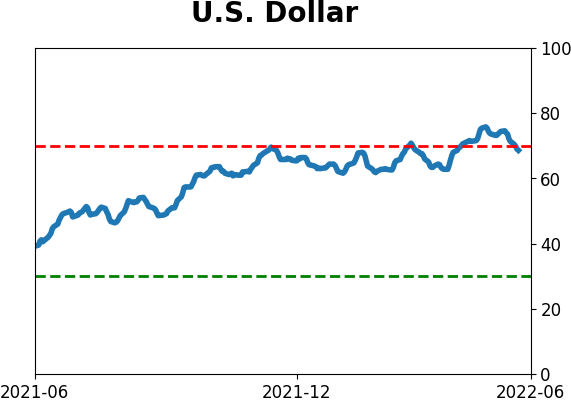
Currency ETF's - 5-Day Moving Average
|
|
|
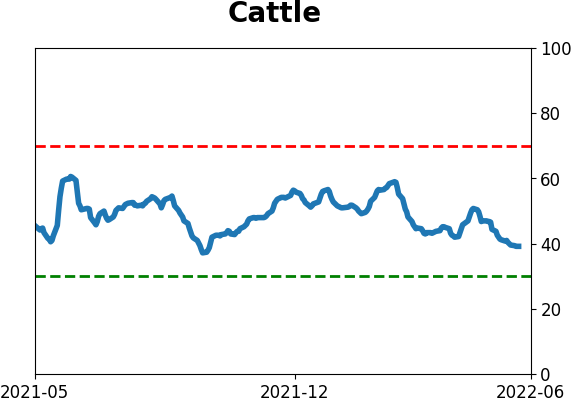
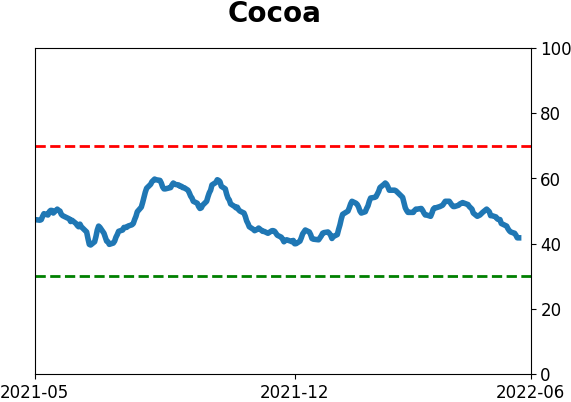
Commodity ETF's - 5-Day Moving Average
|
|