Headlines
|
|
The S&P's Inflation Adjusted Yield Just Plunged to a Record Low:
The inflation-adjusted yield from dividends and earnings that an investor is getting in the S&P 500 has plunged to a 50-year low. Using just earnings, the yield is negative. All five of the other times this happened preceded declines in stocks.
Bottom Line:
See the Outlook & Allocations page for more details on these summaries STOCKS: Hold
The speculative frenzy in February is wrung out. Internal dynamics have mostly held up, with some exceptions. Many of our studies still show a mixed to poor short-term view, with medium- and long-term ones turning more positive. BONDS: Hold
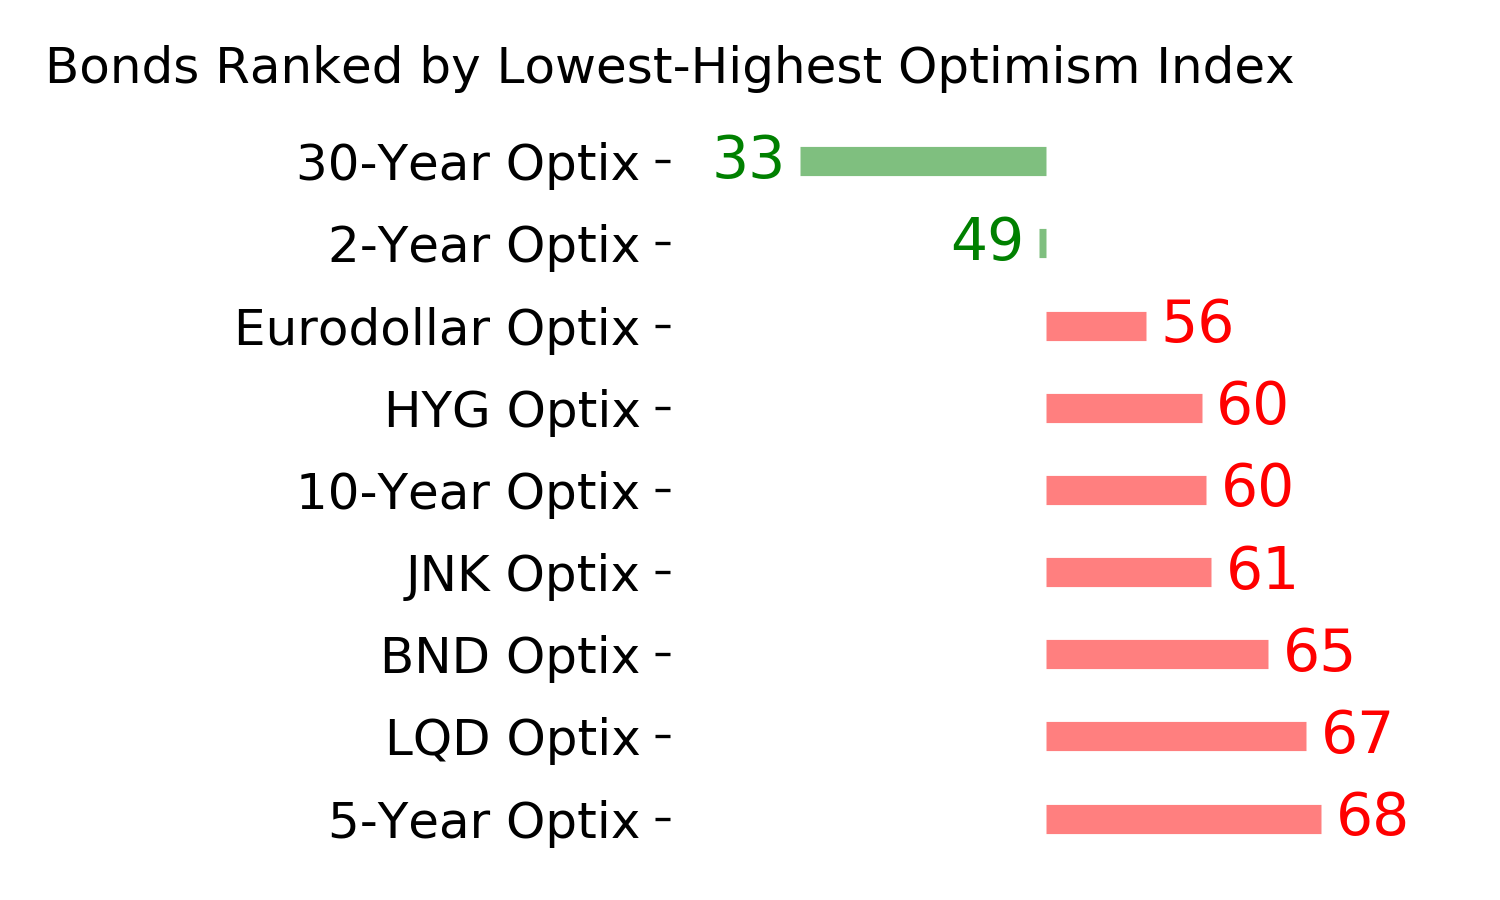
Various parts of the market got hit in March, with the lowest Bond Optimism Index we usually see during healthy environments. After a shaky couple of weeks, the broad bond market has modestly recovered. Not a big edge here either way. GOLD: Hold
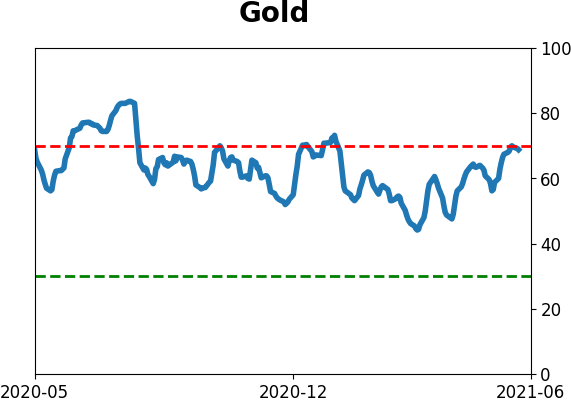
Gold and miners have done very well, recovering above long-term trend lines. The issue is that both have tended to perform poorly after similar situations - will have to wait and see how it plays out.
|
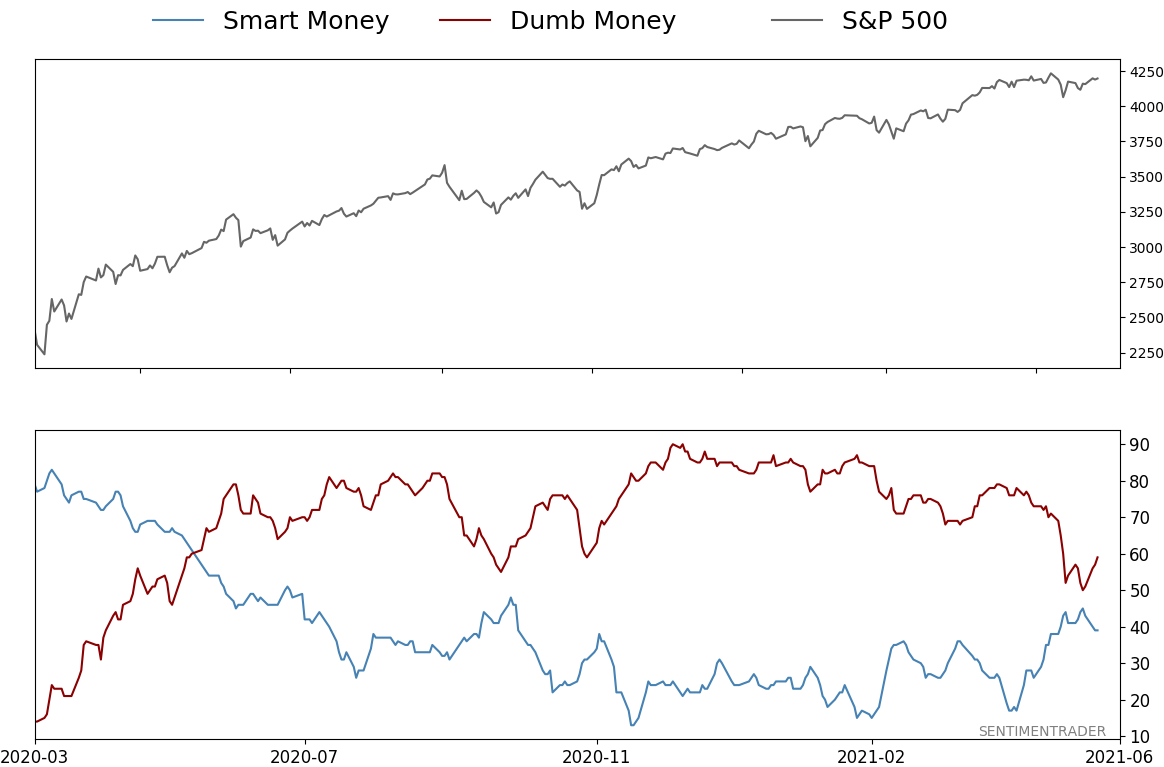
Smart / Dumb Money Confidence
|
Smart Money Confidence: 39%
Dumb Money Confidence: 59%
|
|
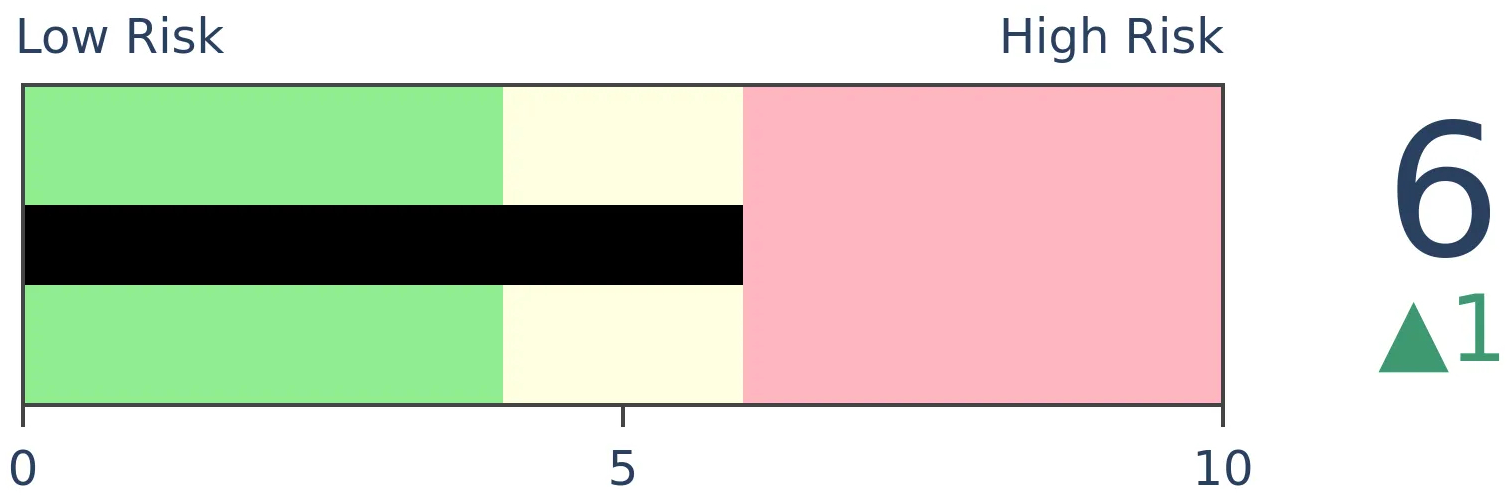
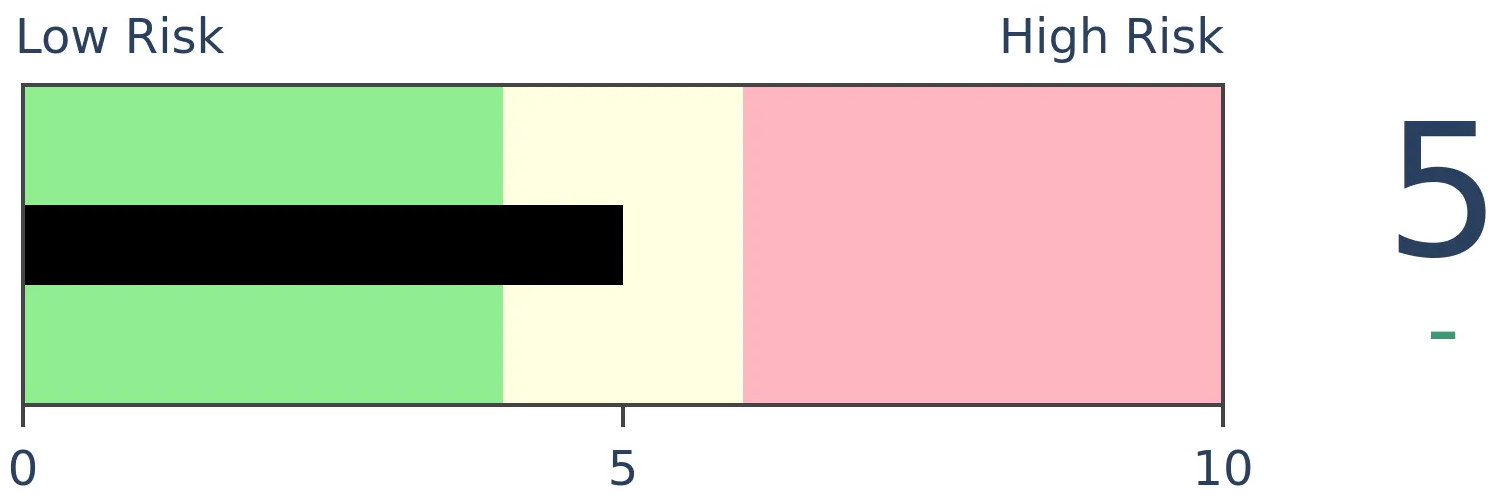
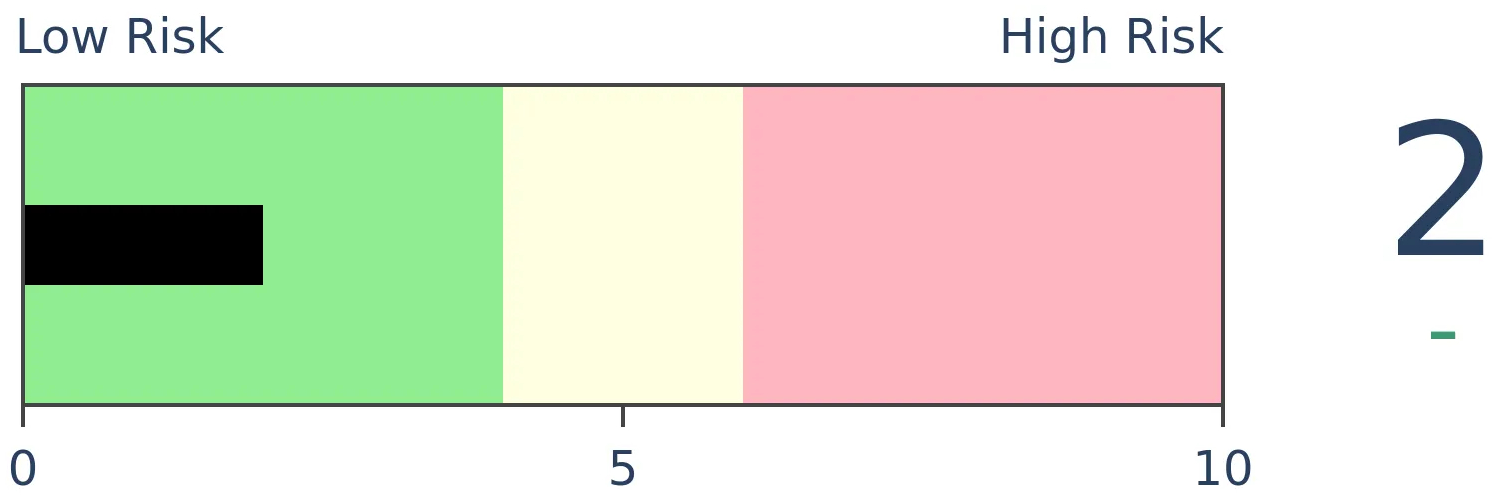
Risk Levels
Stocks Short-Term
|
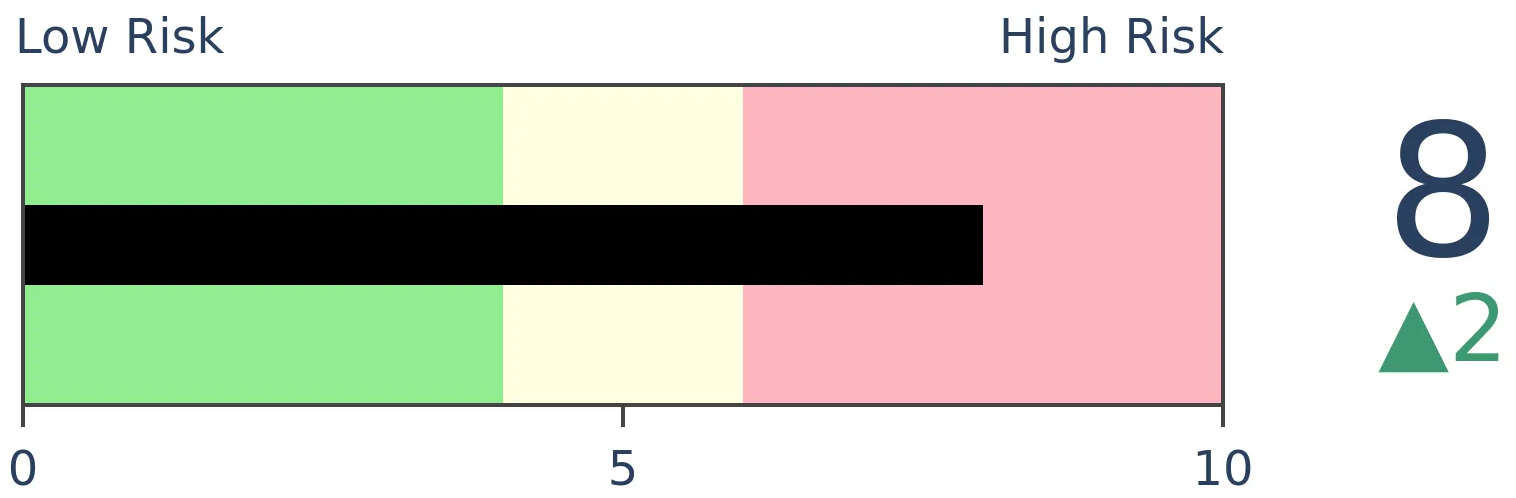
Stocks Medium-Term
|
|
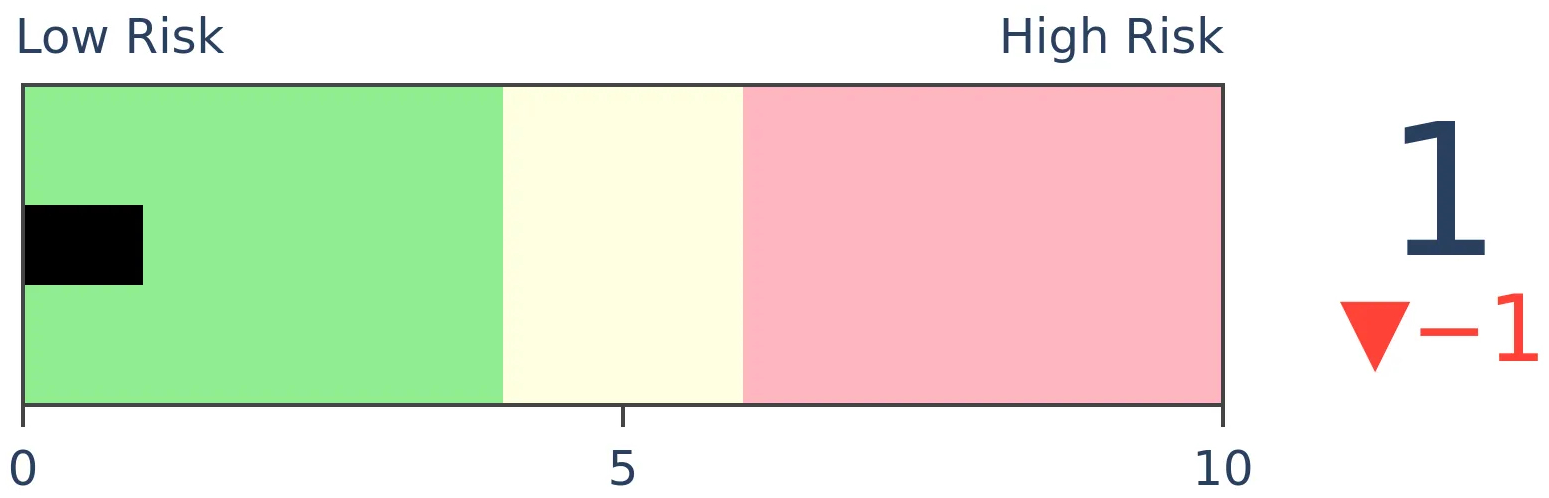
Bonds
|
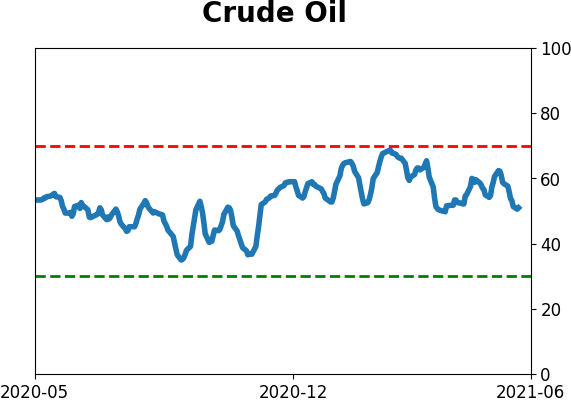
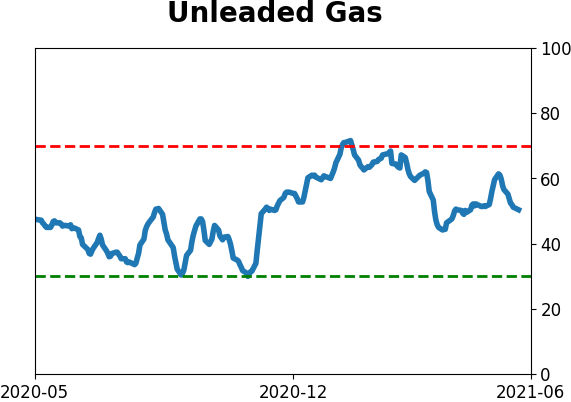
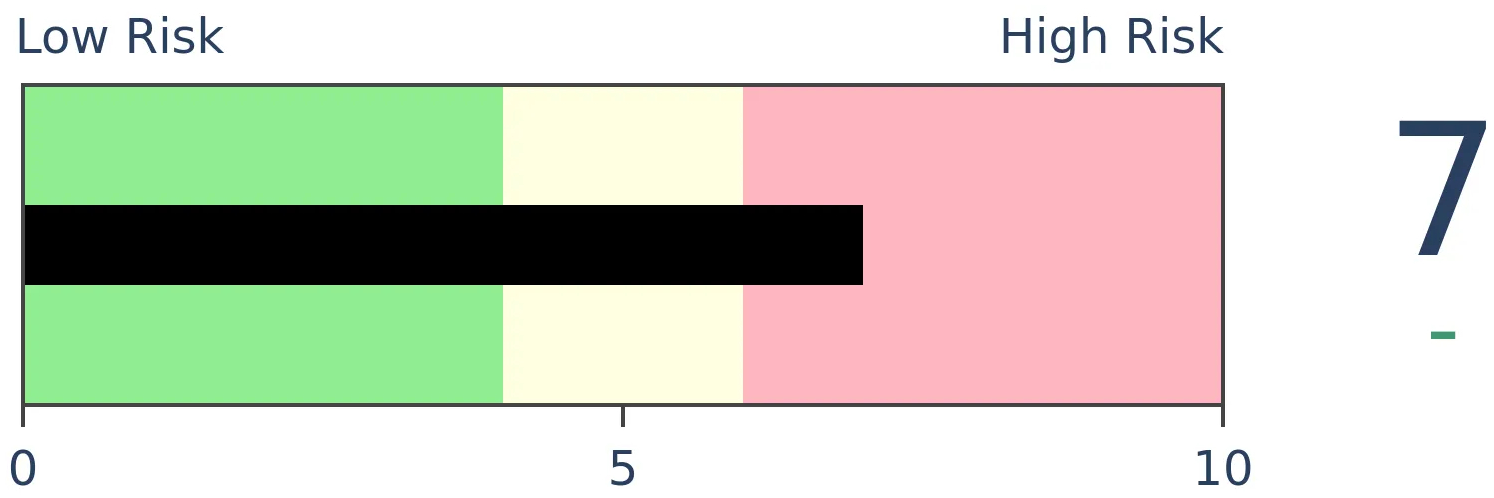
Crude Oil
|
|
Gold
|
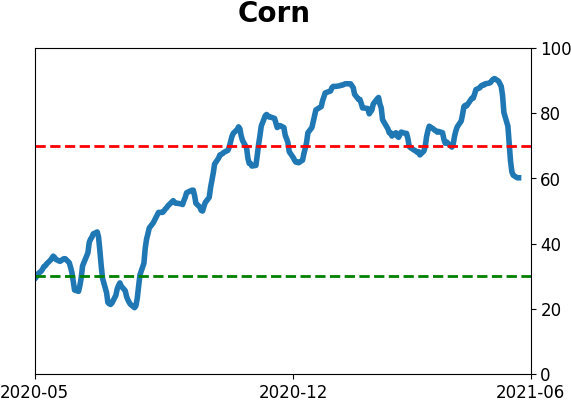
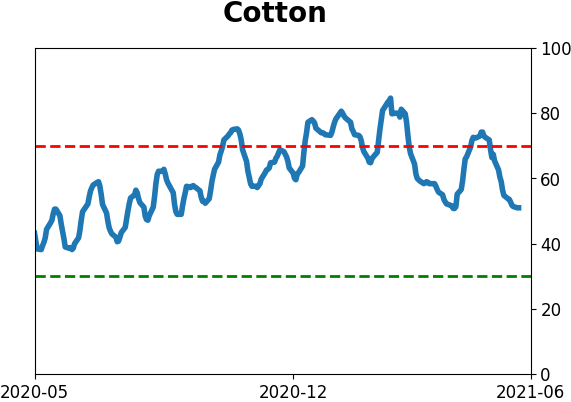
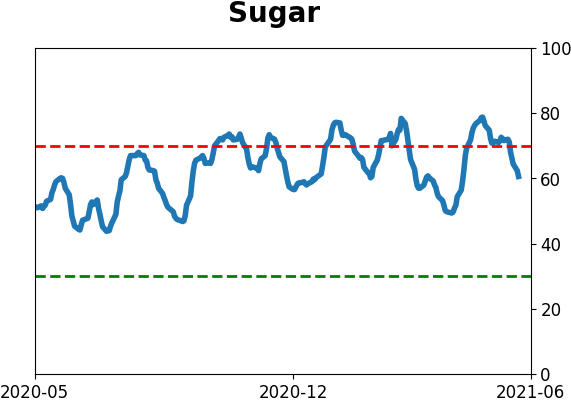
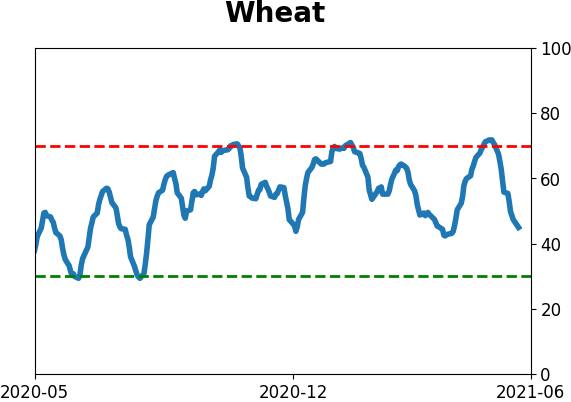
Agriculture
|
|
Research
BOTTOM LINE
The inflation-adjusted yield from dividends and earnings that an investor is getting in the S&P 500 has plunged to a 50-year low. Using just earnings, the yield is negative. All five of the other times this happened preceded declines in stocks.
FORECAST / TIMEFRAME
SPY -- Down, Long-Term
|
Whatever one thinks about the outlook for inflation, it's hard to debate the idea that it's already here. Using traditional ways of measurement, virtually all of them are high and rising.
Until recently, one of the main arguments for stocks was that even though they weren't yielding much, at least they were earning more than Treasuries, even after accounting for inflation.
Now that there has been a spike in inflation gauges, the earnings yield on the S&P 500 has turned negative. This is not a condition that investors have had to tackle much over the past 70 years.
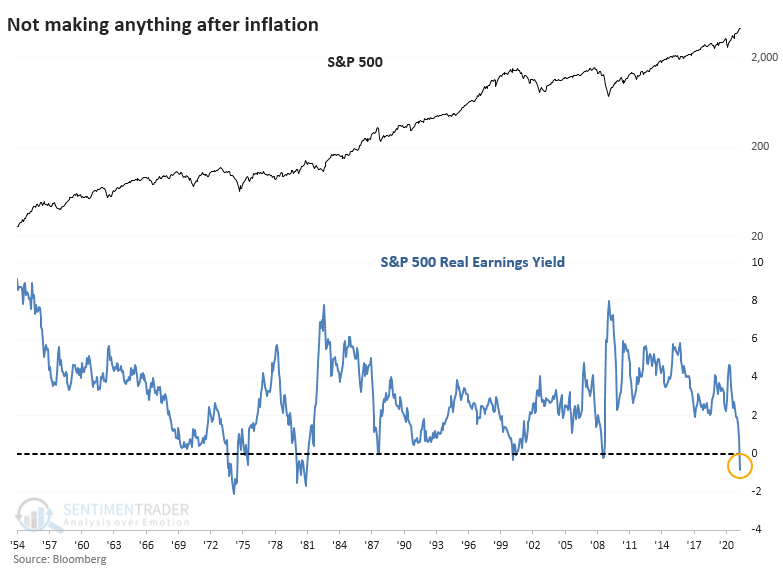
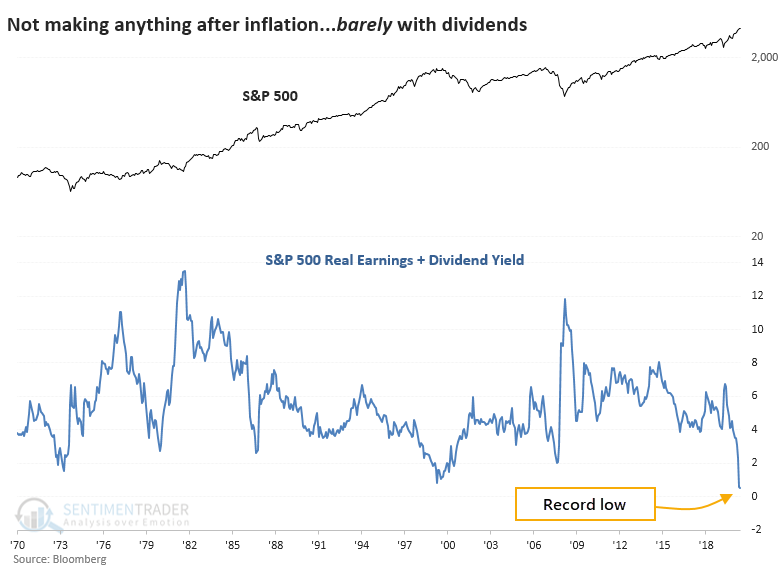
When an investor in the S&P adds up her dividend check and share of earnings, then subtracts the loss of purchasing power from inflation, she's barely coming out even. This is a record low, dating back to 1970, just eclipsing the prior low from March 2000.
NEGATIVE REAL YIELDS = TROUBLE
If we ignore dividends, then there have been five other times when the S&P 500's inflation-adjusted earnings yield turned negative. You may want to close one eye and use the other to look askance at the table because it's not pretty.
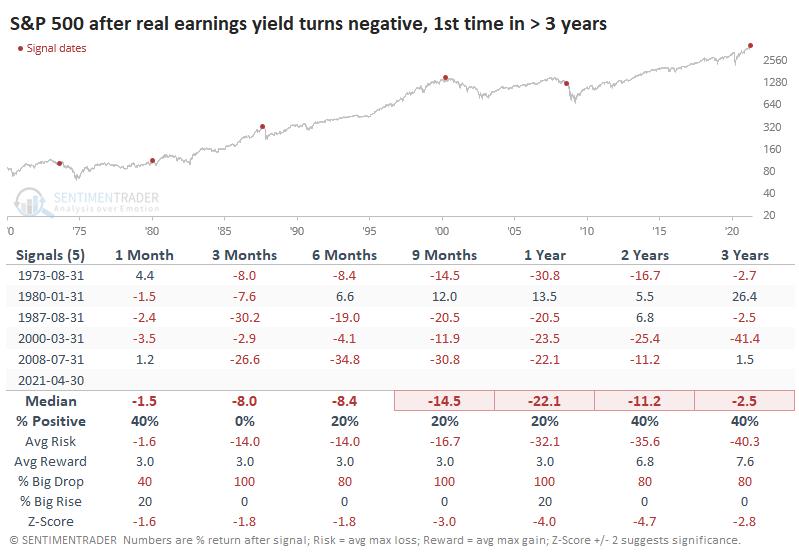
The Risk/Reward table shows just how limited the upside was.
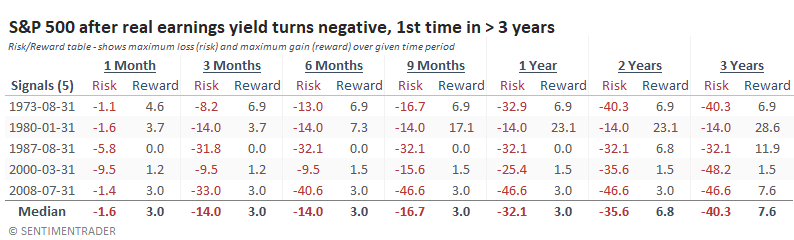
The S&P failed to rally more than 7% at its best point within the next two years after all but one signal, from January 1980. That time, the S&P suffered a quick correction then rallied strongly in the year ahead (and then failed again). All the others showed maximum drawdowns of -32% or more. Ouch.
TECH TROUBLES, VALUE PREFERENCE
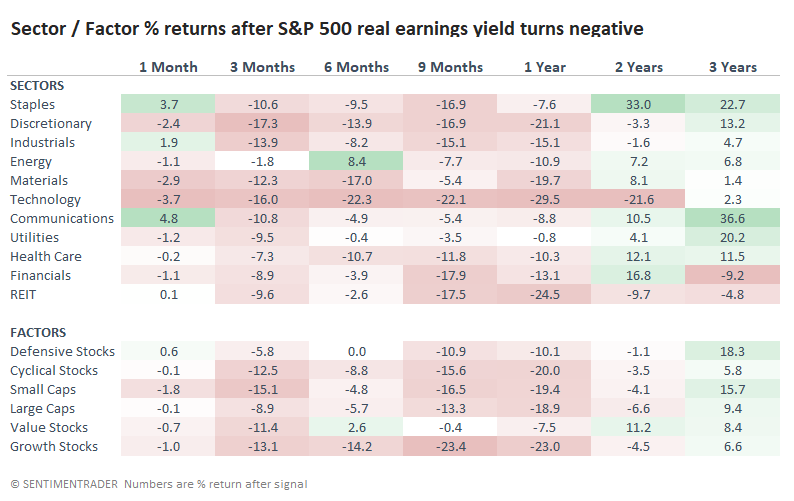
As Jay showed last week, inflation has had an especially pernicious effect on Technology stocks. And when we look at the average returns in sectors and factors following these same signals, the worst returns were, indeed, in Tech, Discretionary, and Growth stocks. There weren't exactly any winners, but the "best losers" included Value, Staples, Energy, and Utilities. Not a big surprise.
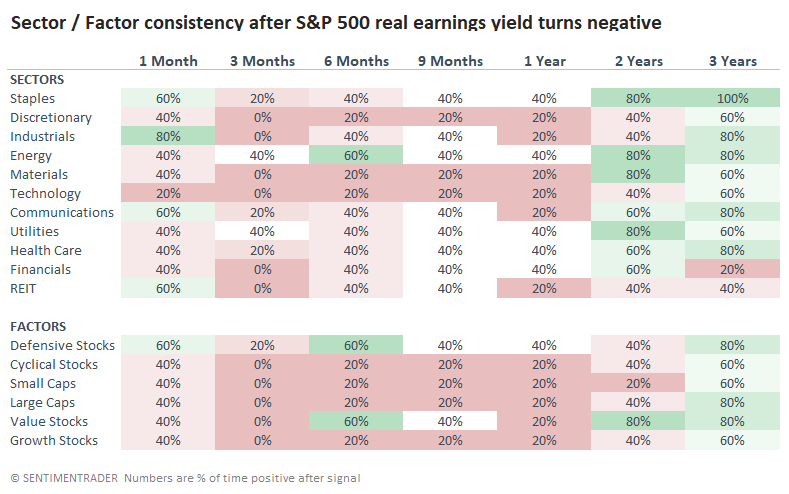
If we look at sector and factor consistency instead, it's a similar story. This is the percentage of time that each showed a positive return over the time frames. With a sample size of only five, it's not as informative as it would be with more precedents.
The biggest risk with putting weight on data like this is the this-time-is-different argument due to unprecedented stimulus, an unusually active central bank, and problems with measuring inflation, especially a base rate that's being so influenced by a once-in-a-century pandemic.
While acknowledging that history is never a perfect guide, we'd rather use it as a guide than pure guesses about why it's not valid. And this history is waving a major red flag for the long-term.
Active Studies
| Time Frame | Bullish | Bearish | | Short-Term | 0 | 0 | | Medium-Term | 1 | 11 | | Long-Term | 11 | 5 |
|
Indicators at Extremes
Portfolio
| Position | Description | Weight % | Added / Reduced | Date | | Stocks | RSP | 4.1 | Added 4.1% | 2021-05-19 | | Bonds | 23.9% BND, 6.9% SCHP | 30.8 | Reduced 7.1% | 2021-05-19 | | Commodities | GCC | 2.5 | Reduced 2.1%
| 2020-09-04 | | Precious Metals | GDX | 5.6 | Reduced 4.2% | 2021-05-19 | | Special Situations | 4.3% XLE, 2.2% PSCE | 7.2 | Reduced 5.6% | 2021-04-22 | | Cash | | 49.8 | | |
|
Updates (Changes made today are underlined)
Much of our momentum and trend work has remained positive for several months, with some scattered exceptions. Almost all sentiment-related work has shown a poor risk/reward ratio for stocks, especially as speculation drove to record highs in exuberance in February. Much of that has worn off, and most of our models are back toward neutral levels. There isn't much to be excited about here. The same goes for bonds and even gold. Gold has been performing well lately and is back above long-term trend lines. The issue is that it has a poor record of holding onto gains when attempting a long-term trend change like this, so we'll take a wait-and-see approach. RETURN YTD: 9.2% 2020: 8.1%, 2019: 12.6%, 2018: 0.6%, 2017: 3.8%, 2016: 17.1%, 2015: 9.2%, 2014: 14.5%, 2013: 2.2%, 2012: 10.8%, 2011: 16.5%, 2010: 15.3%, 2009: 23.9%, 2008: 16.2%, 2007: 7.8%
|
|
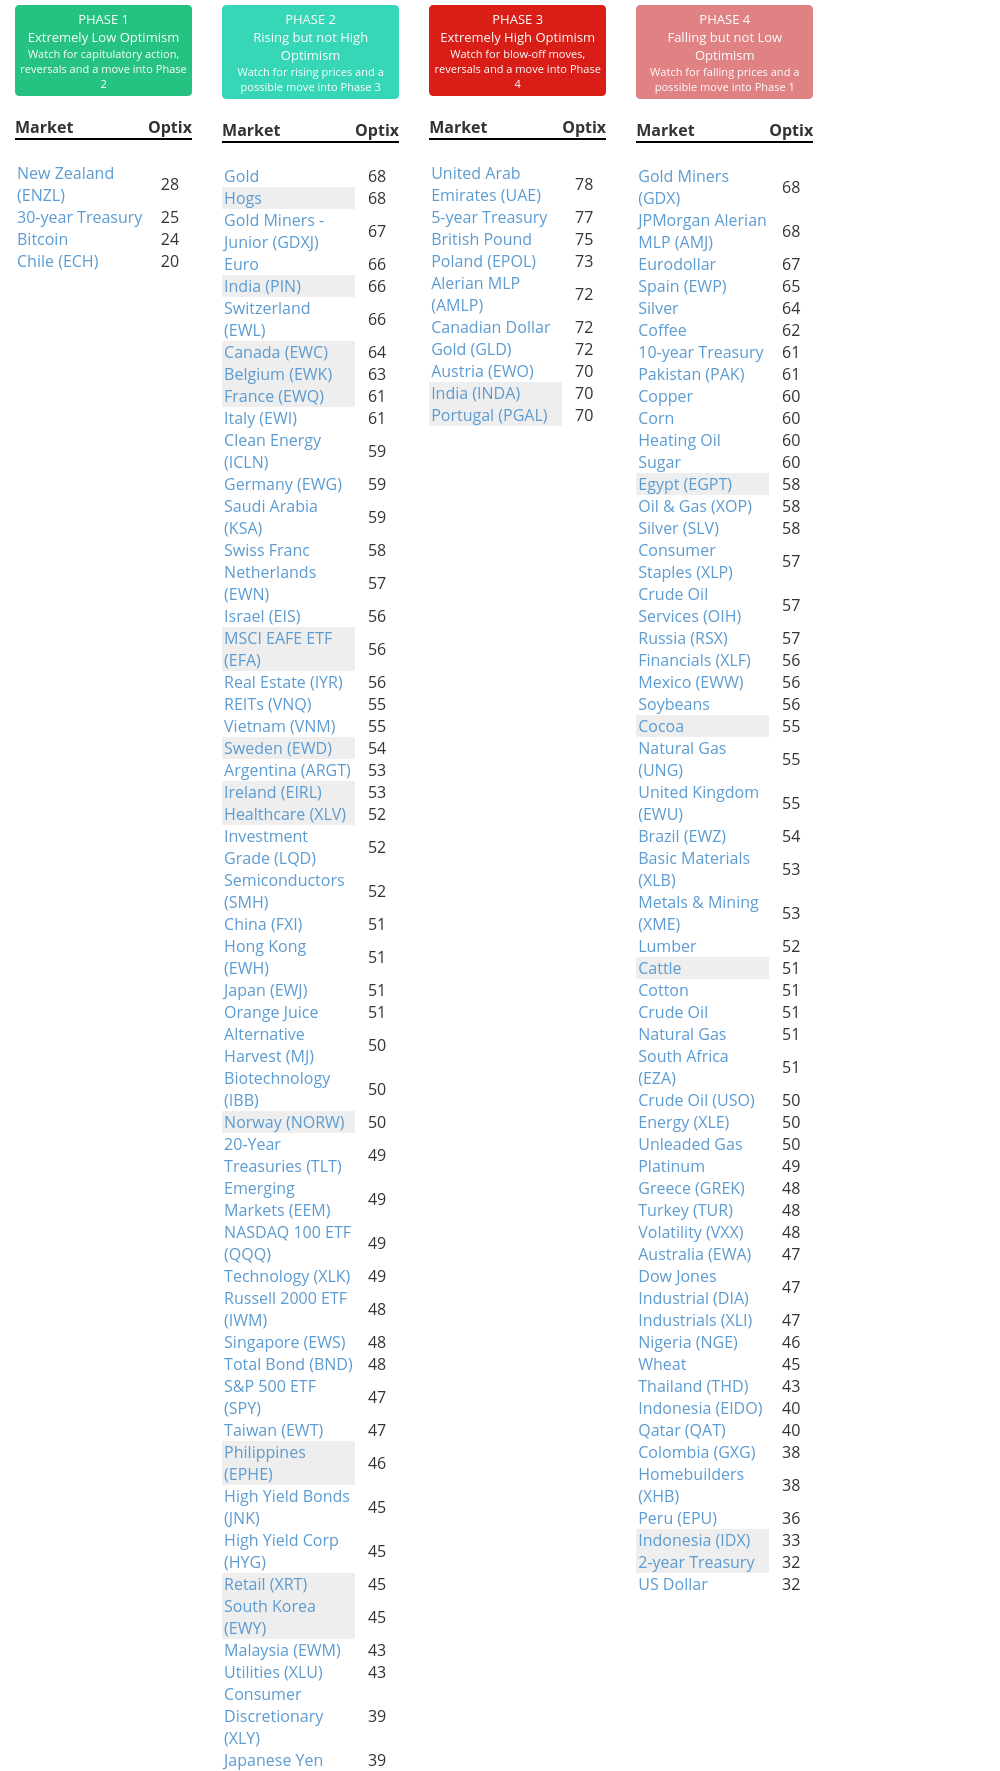
Phase Table
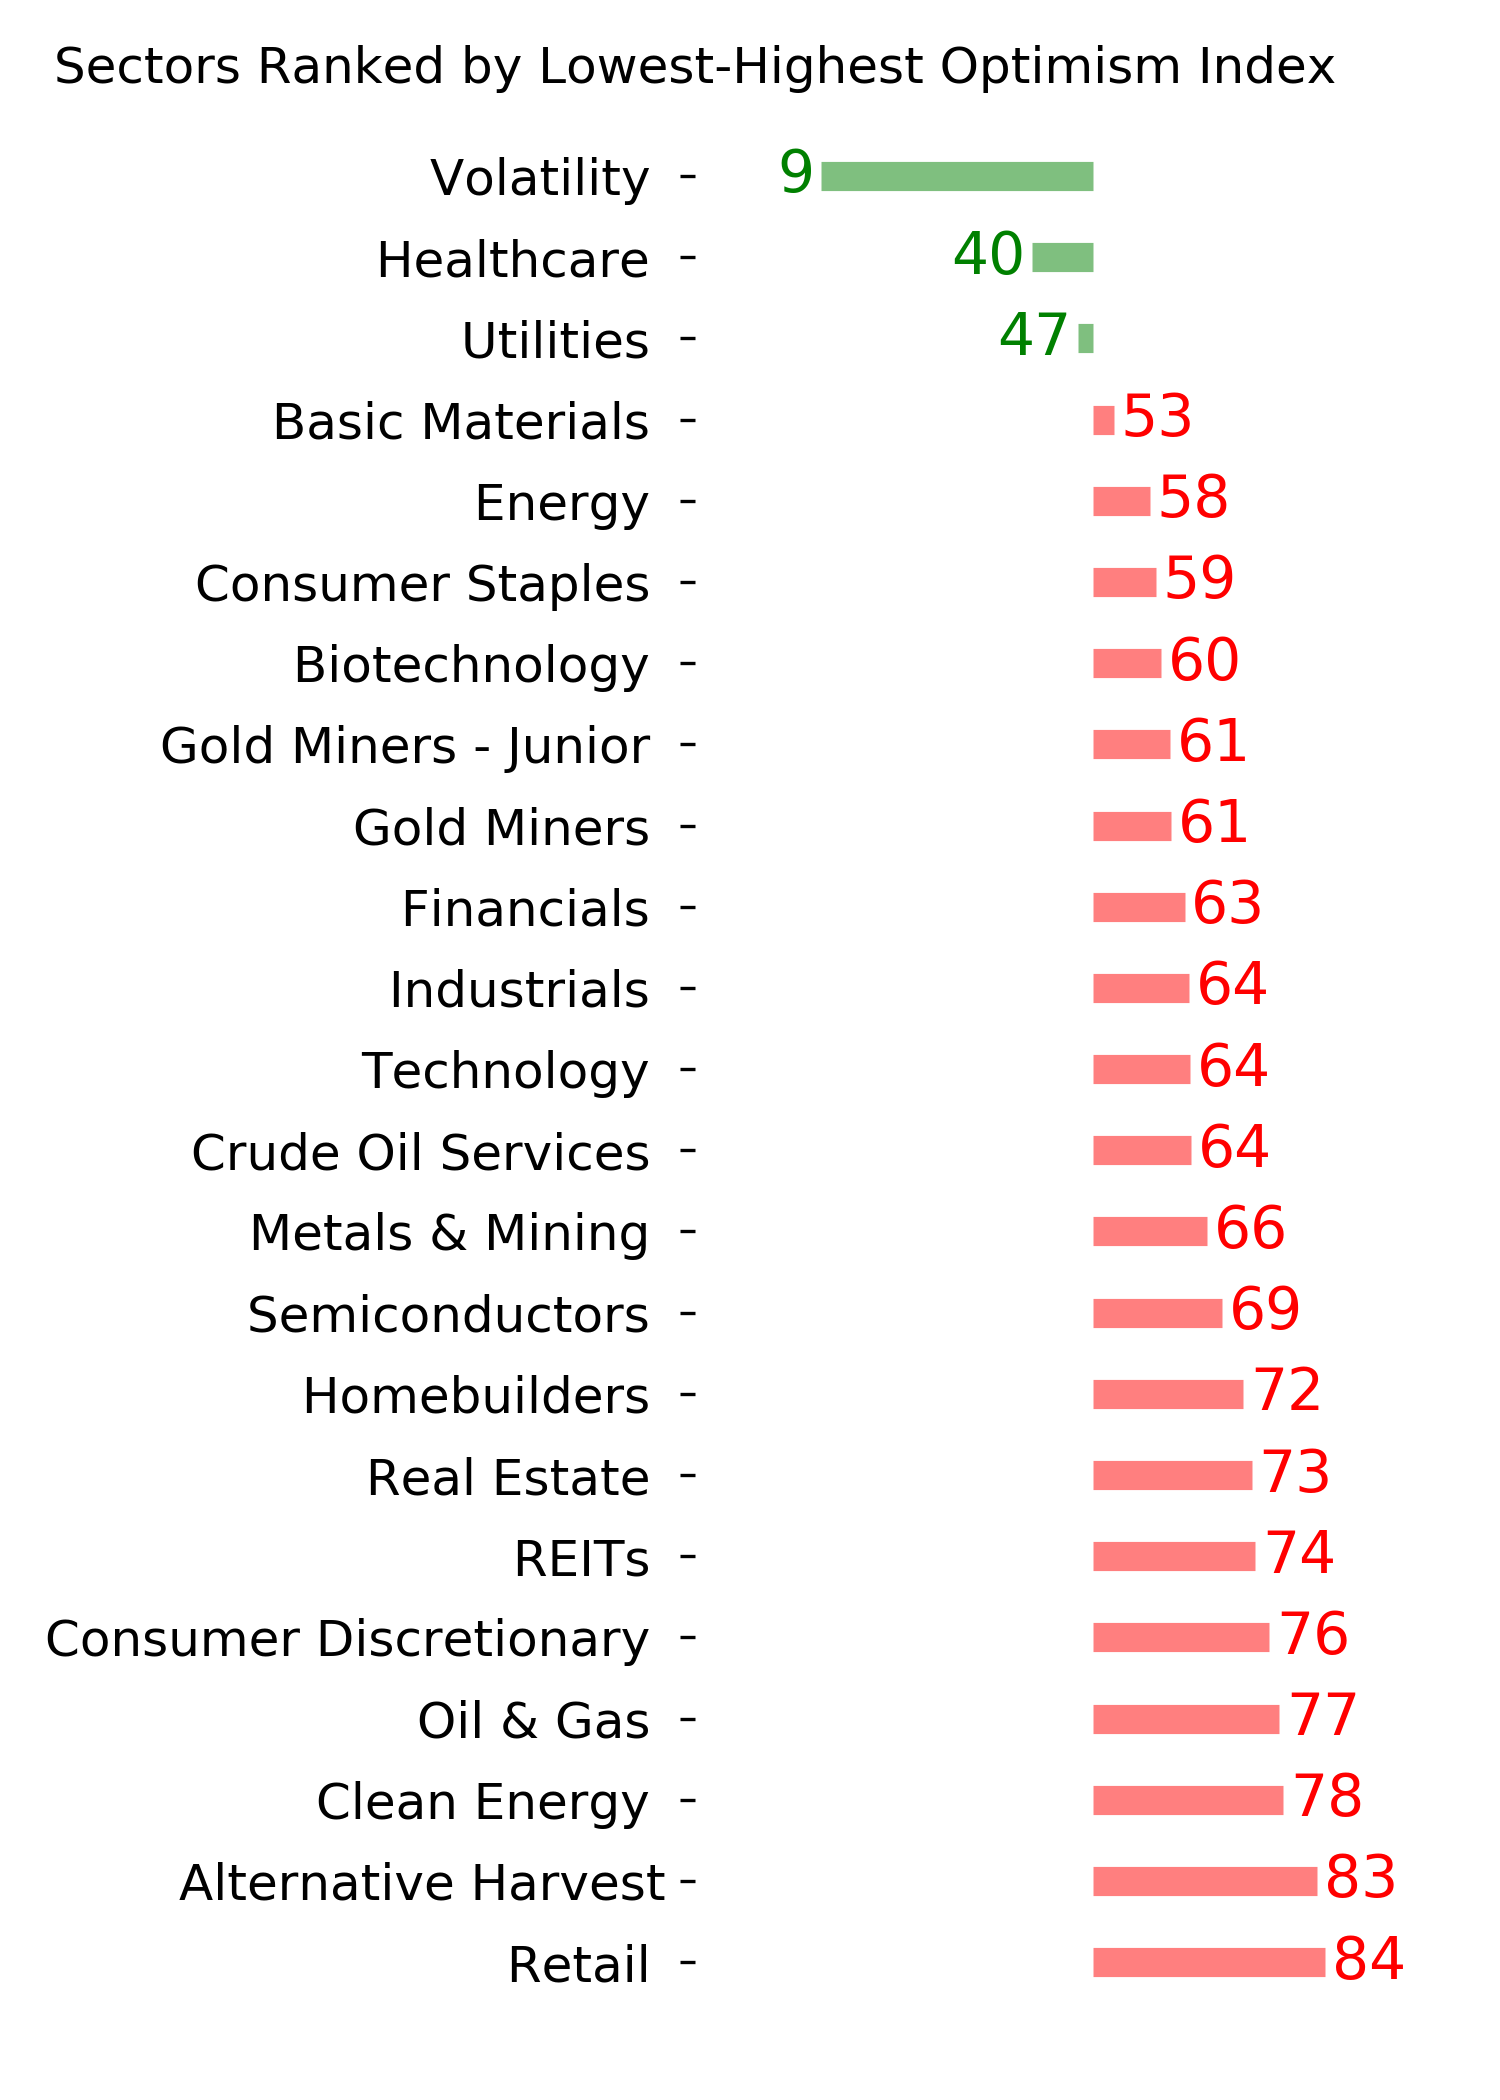
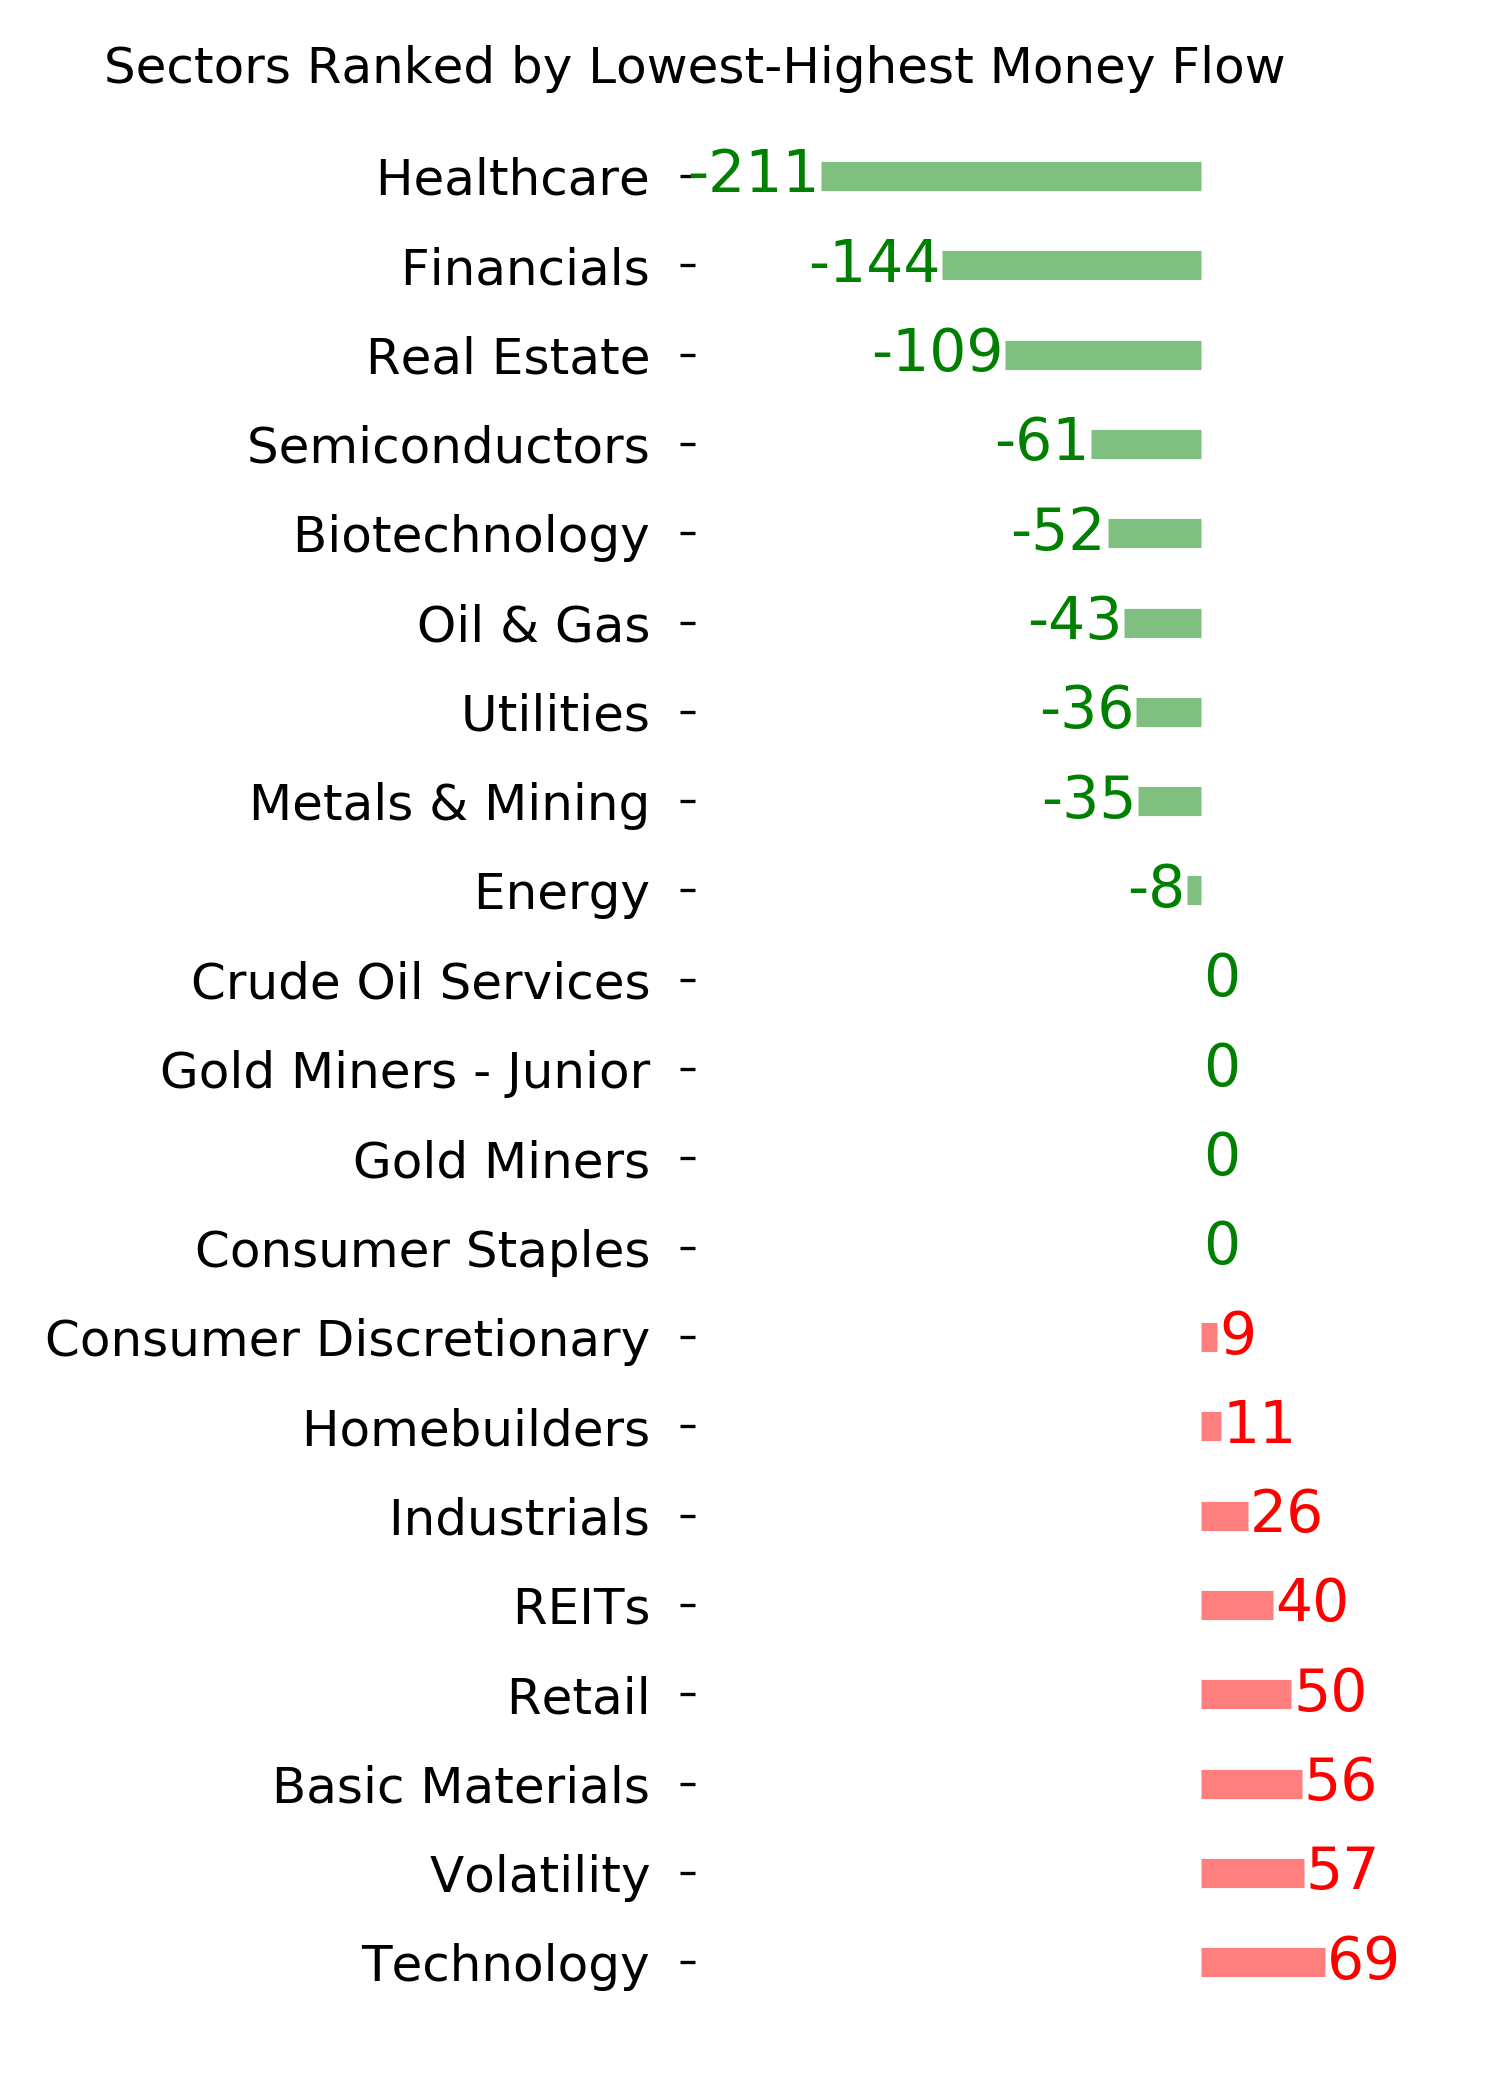
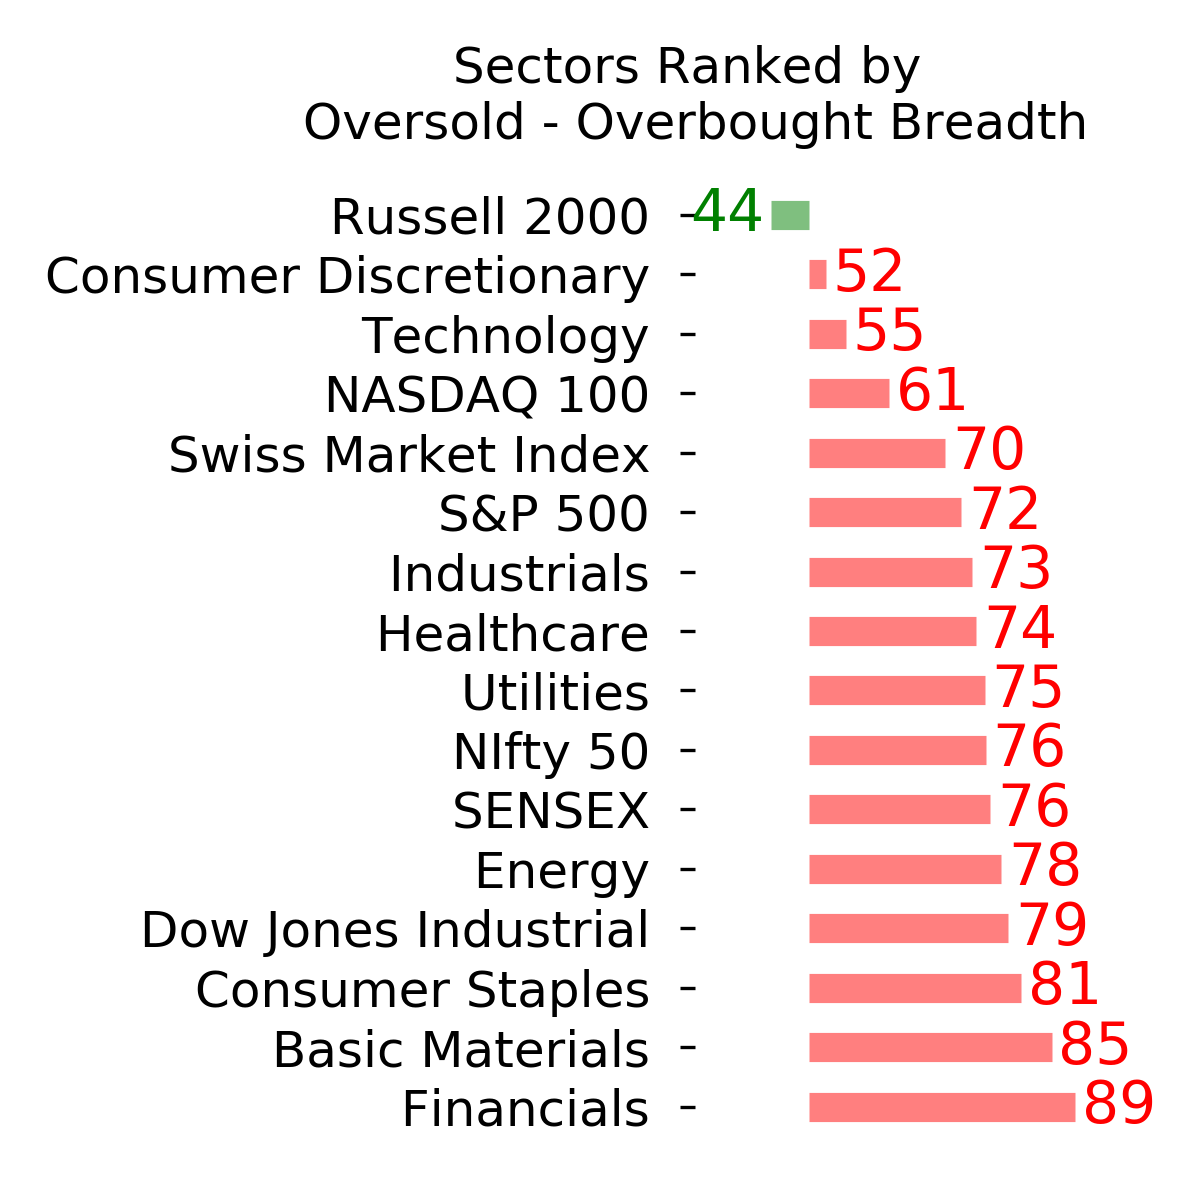
Ranks
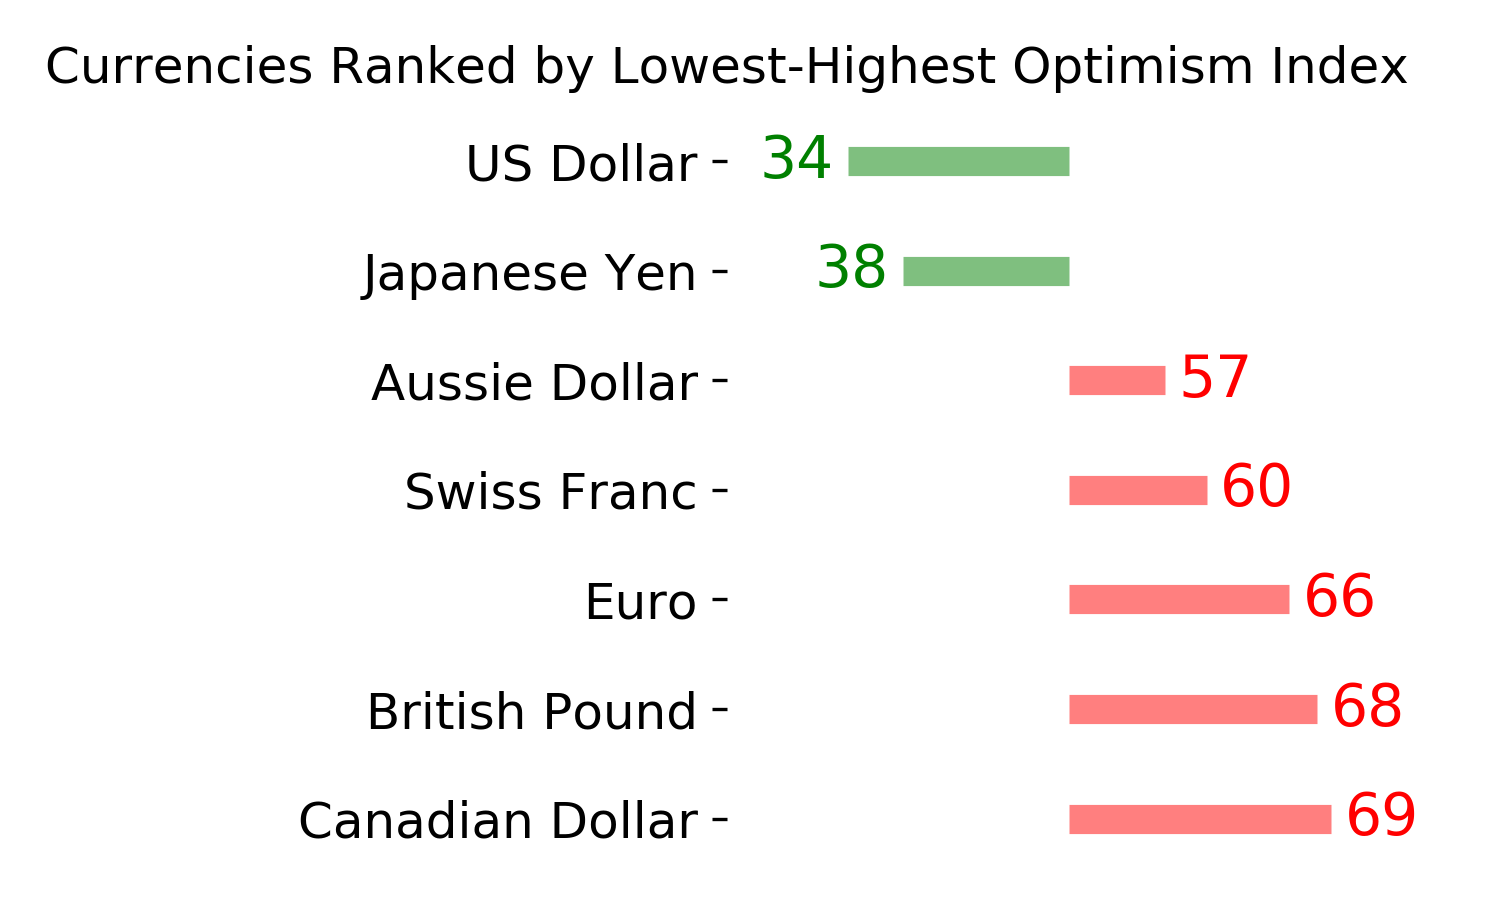
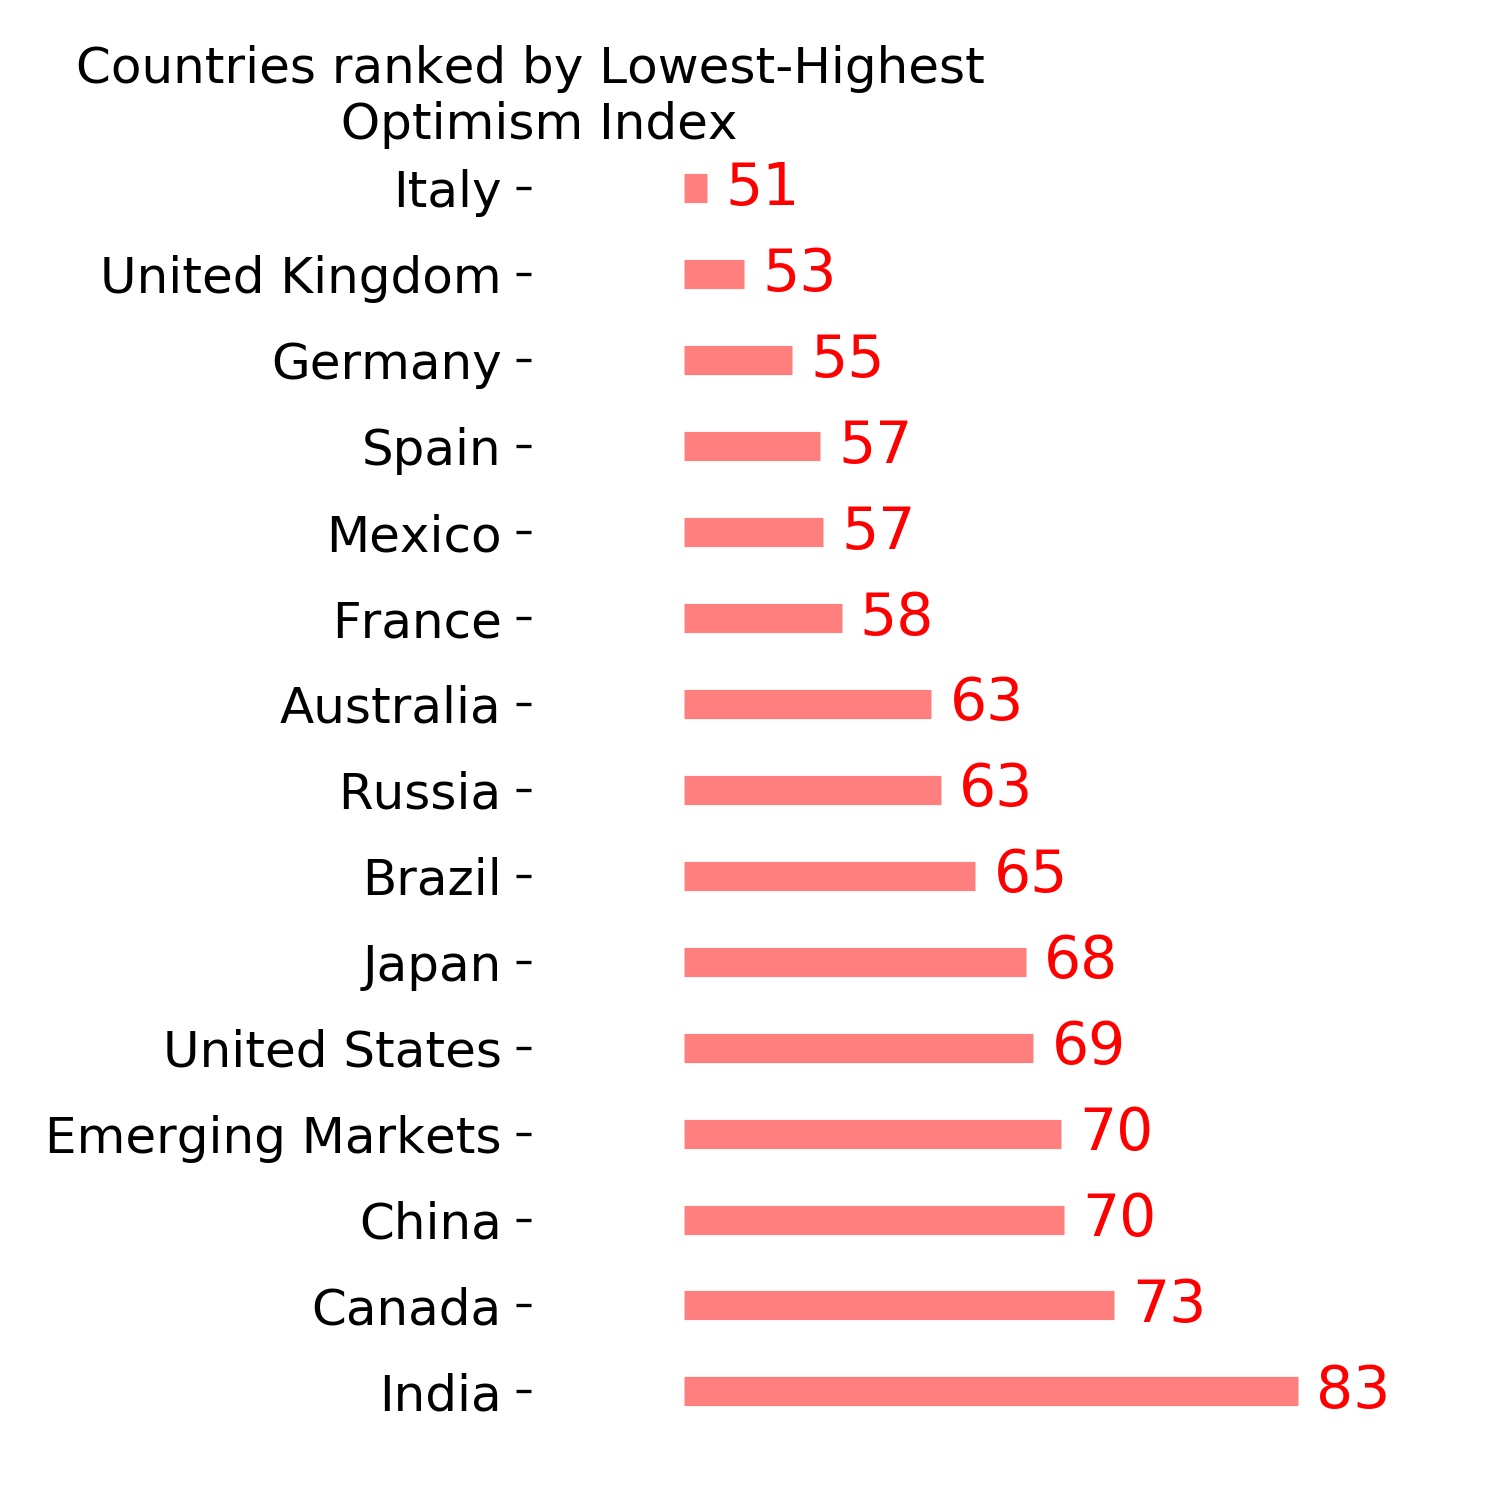
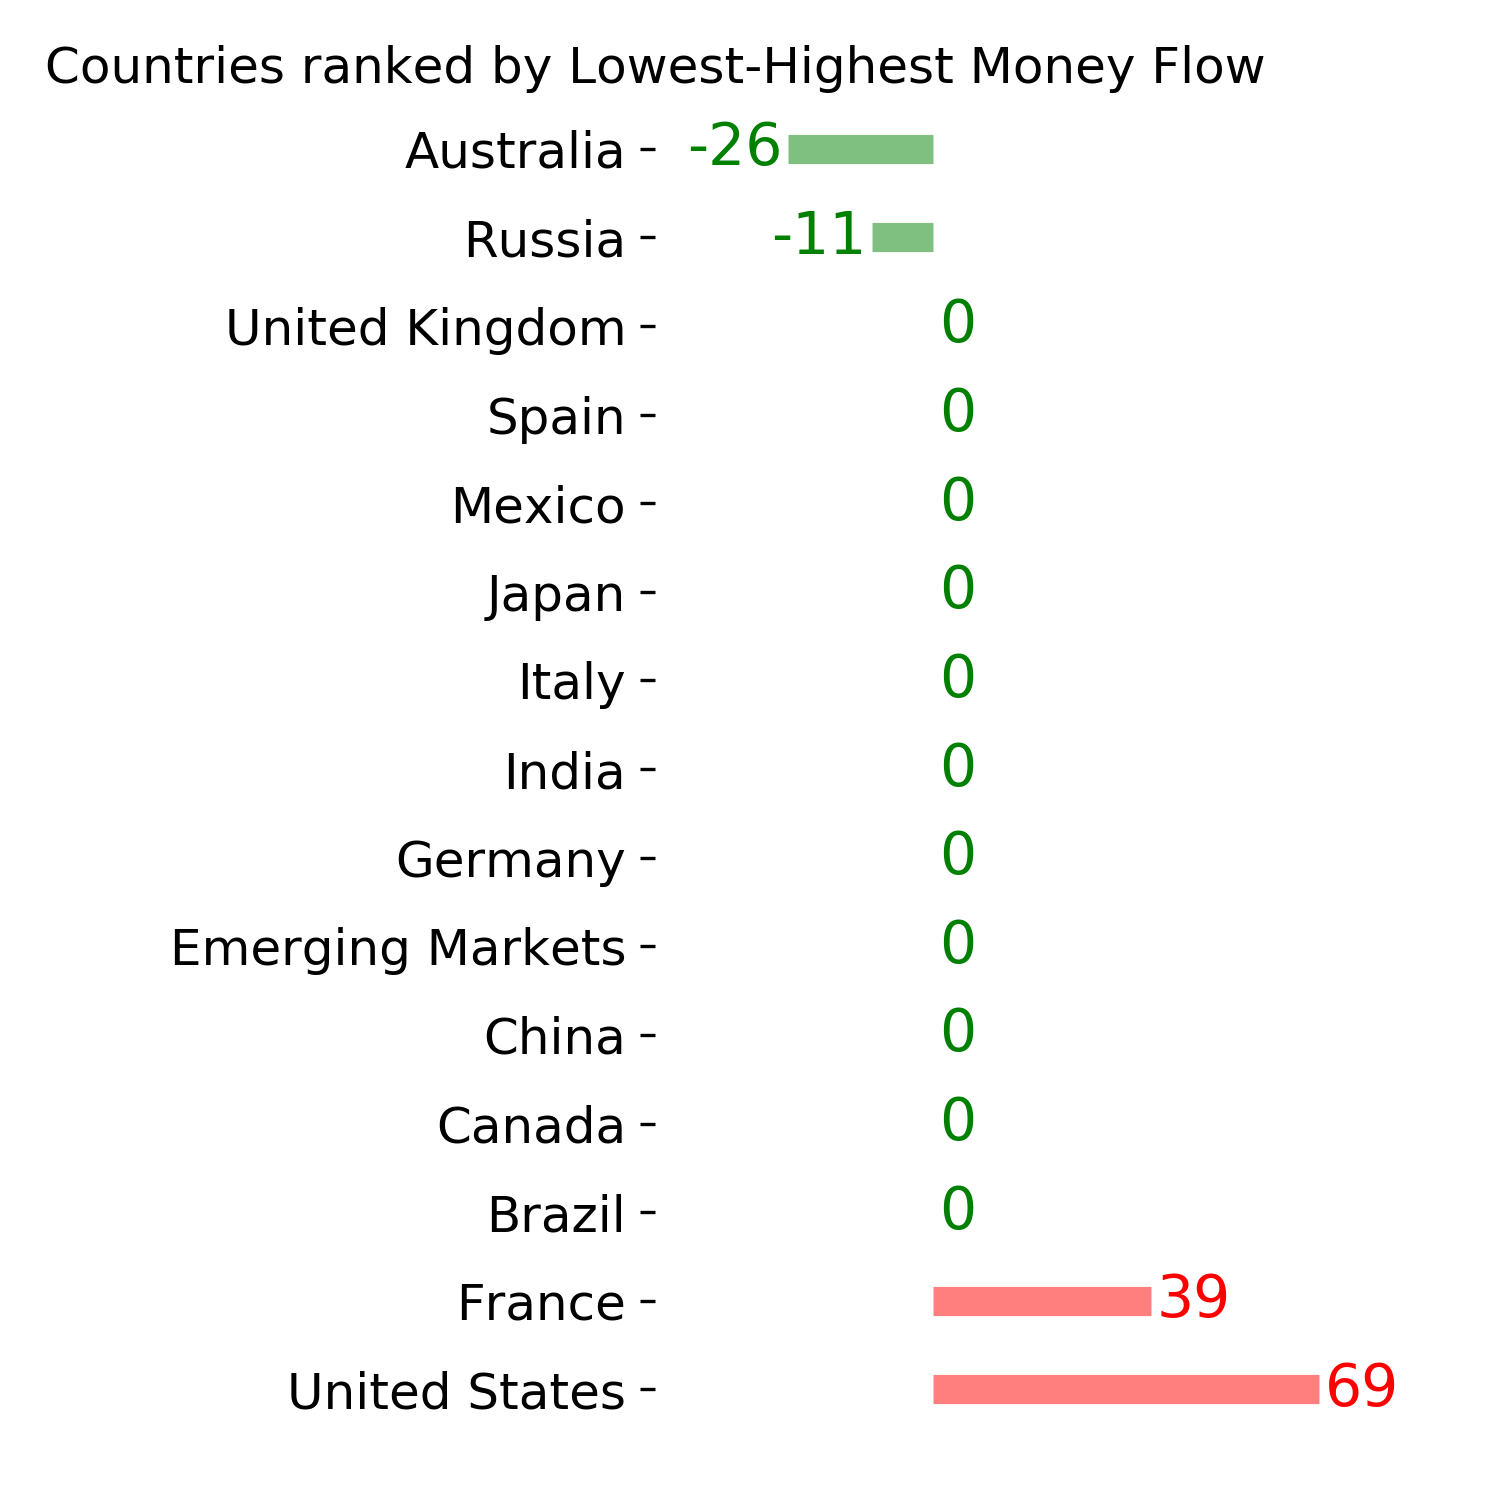
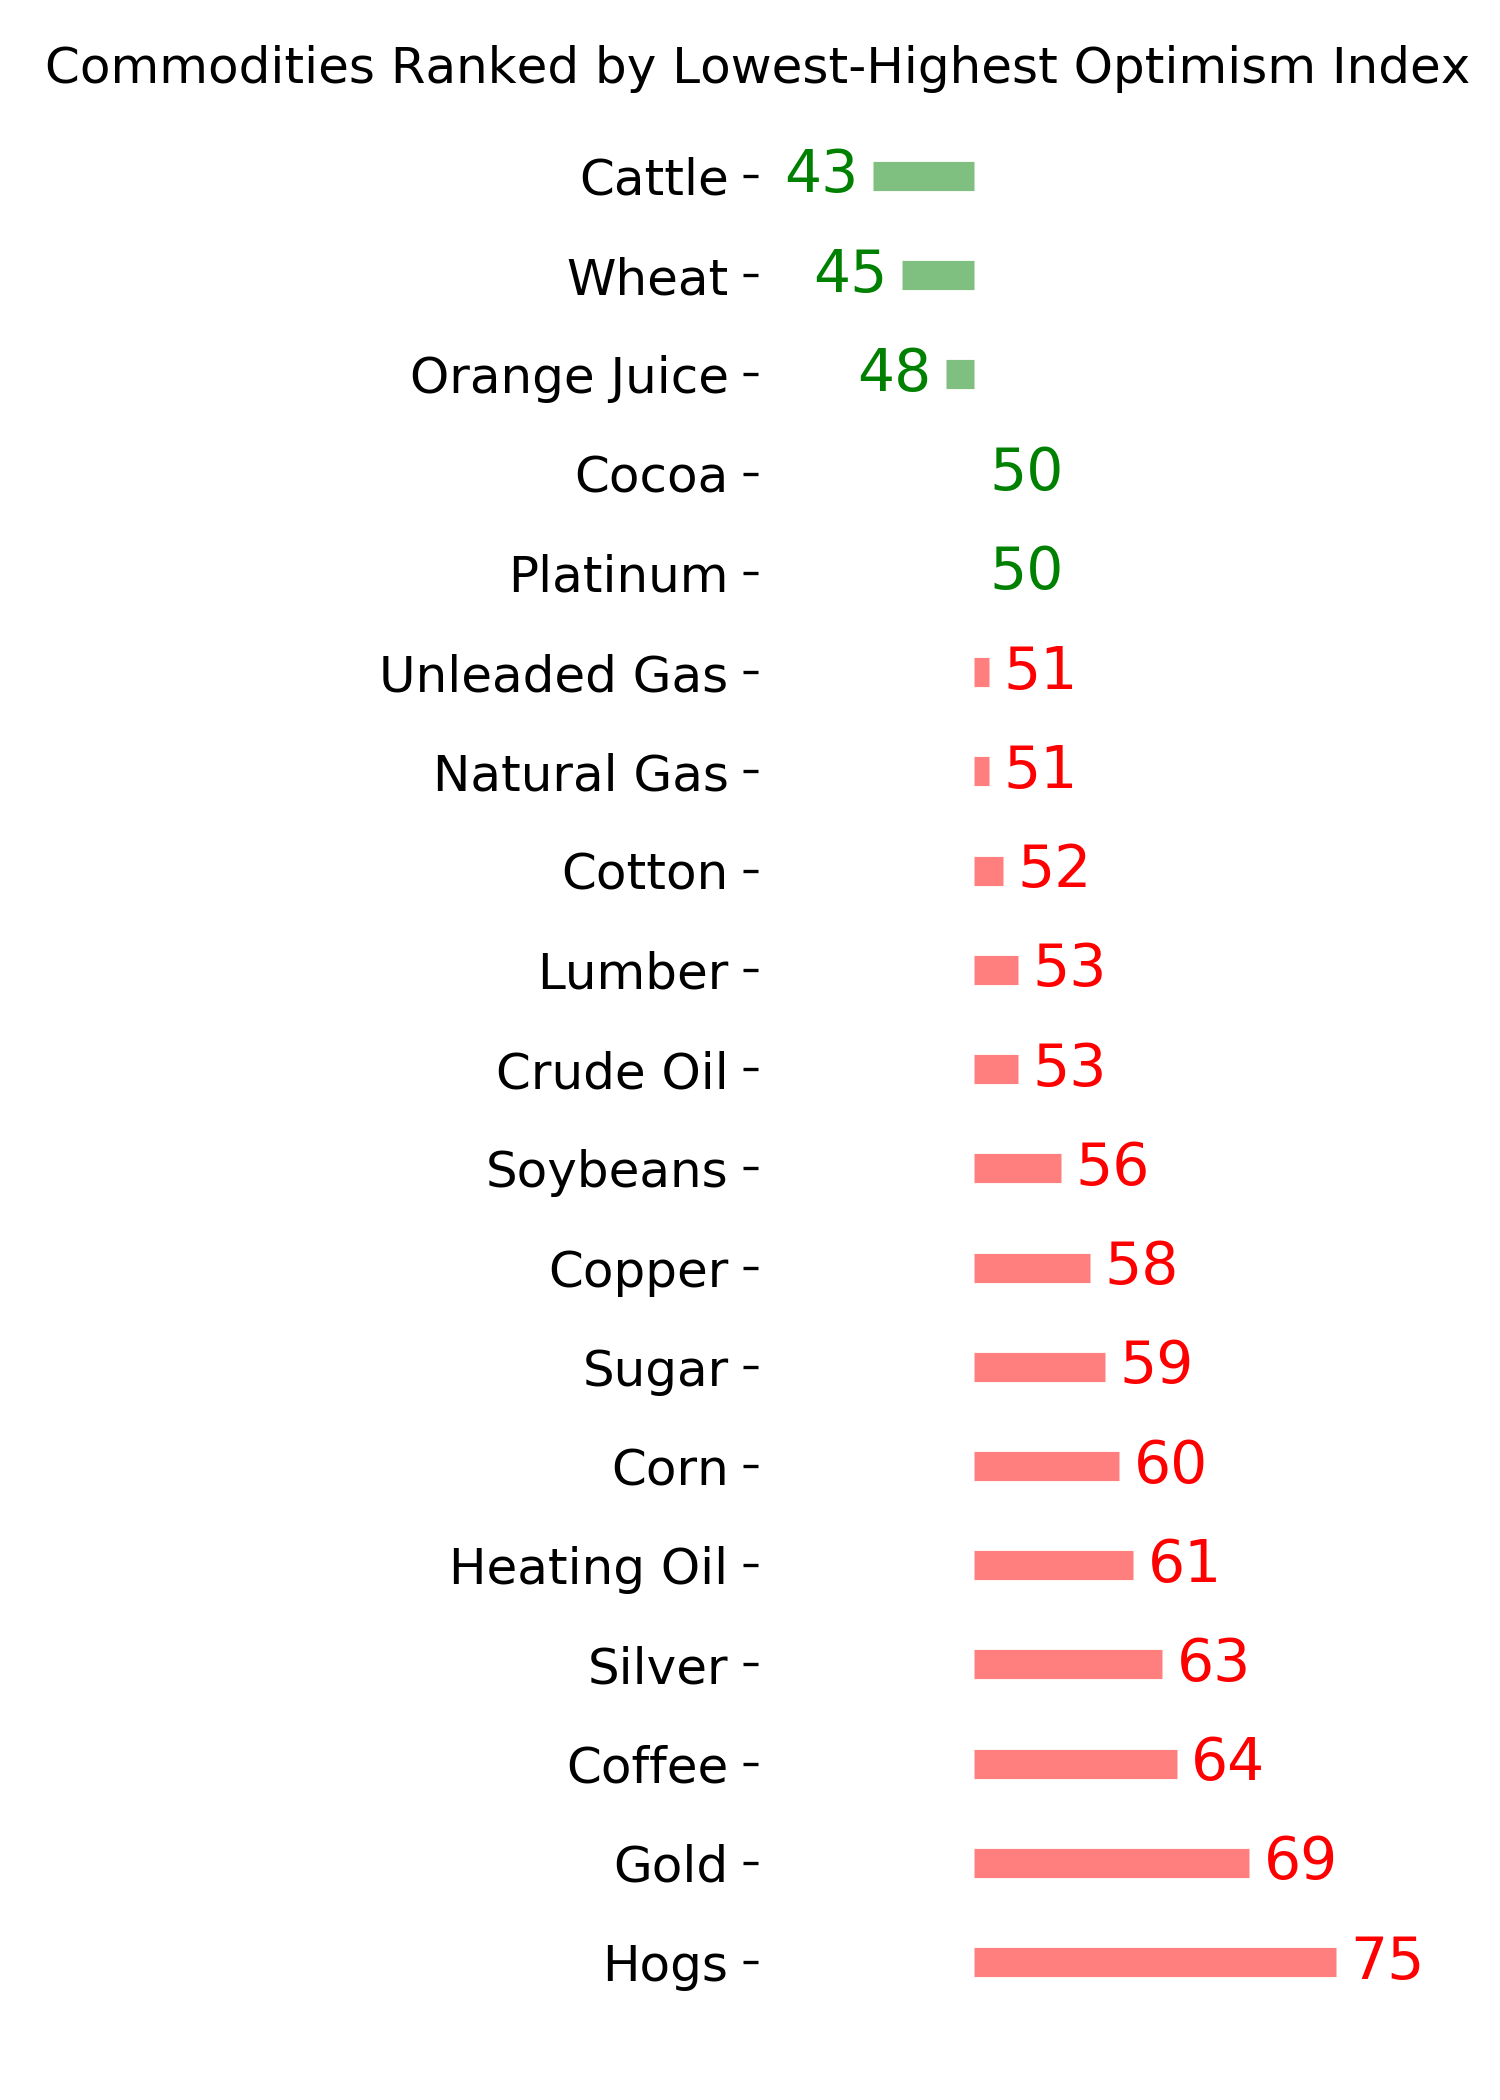
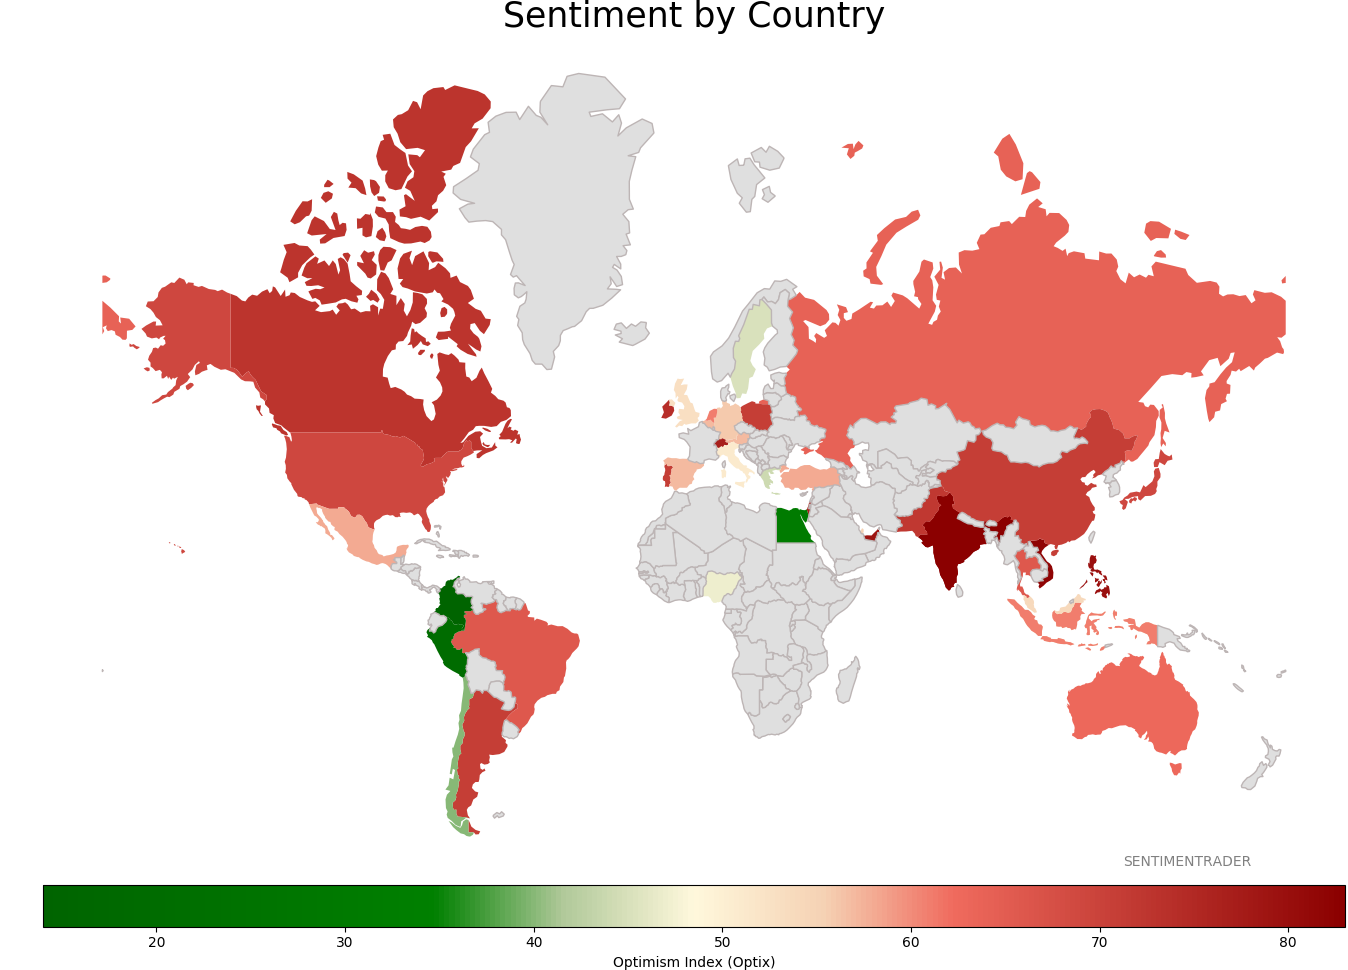
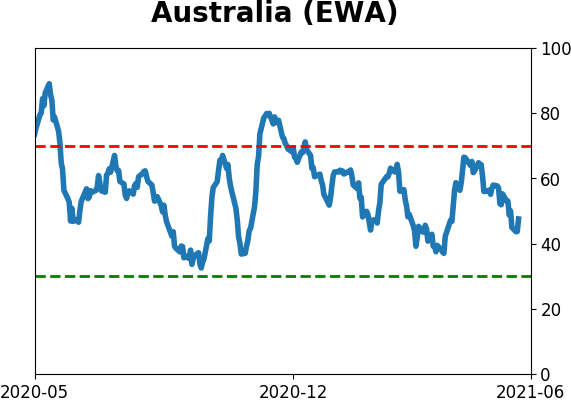
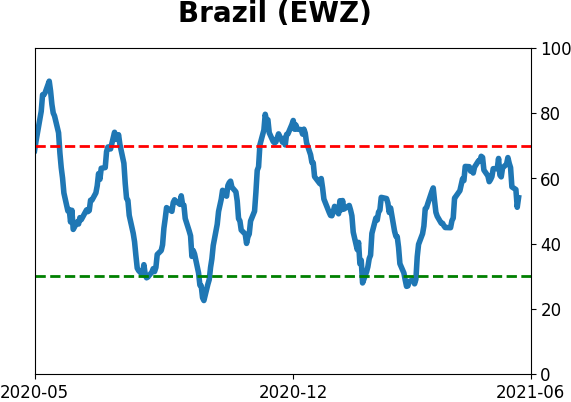
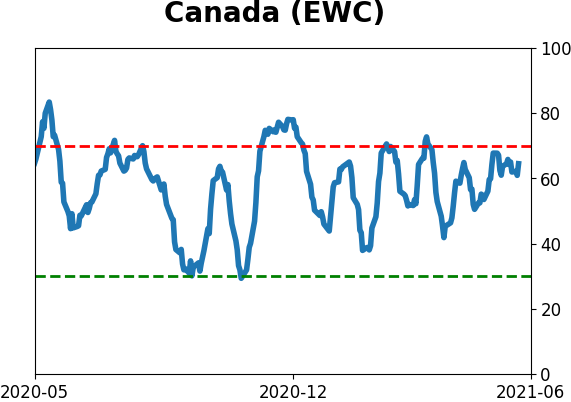
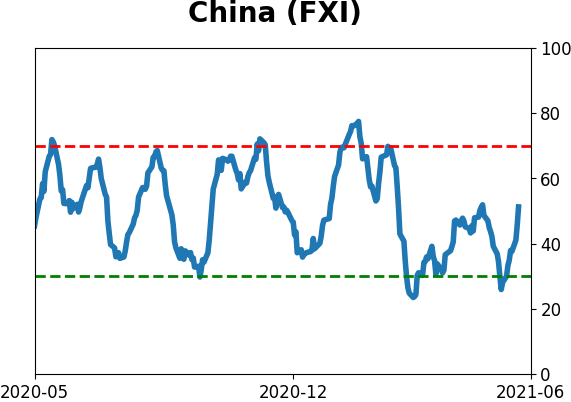
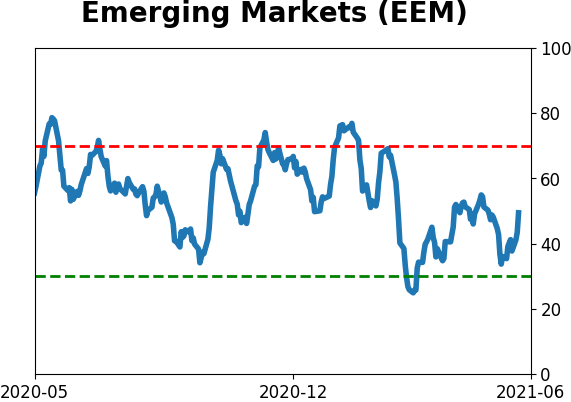
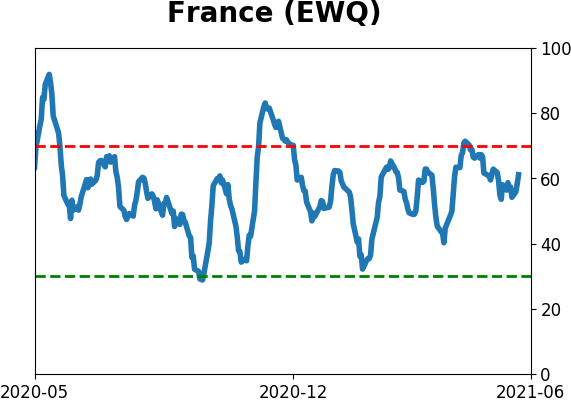
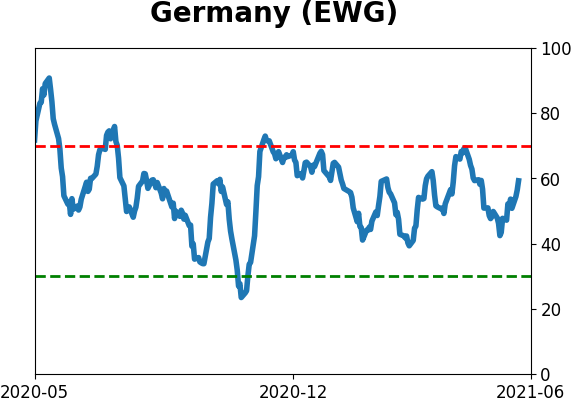
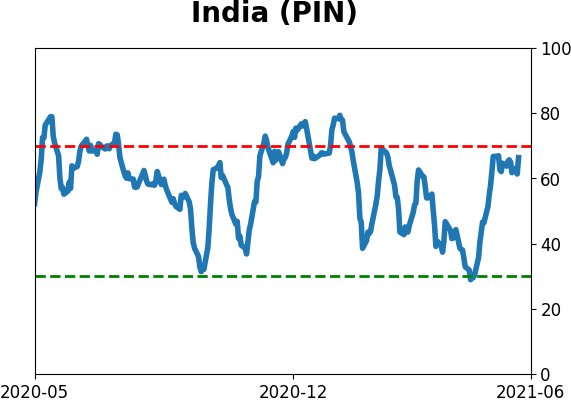
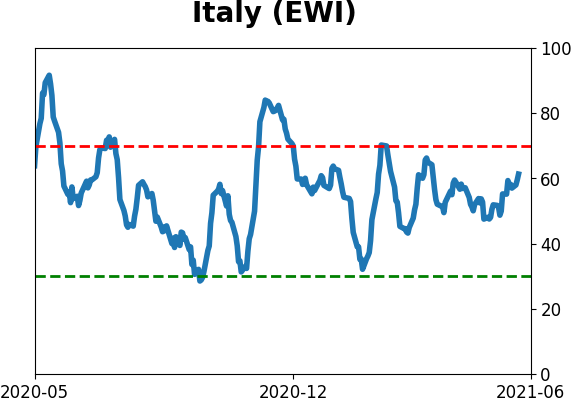
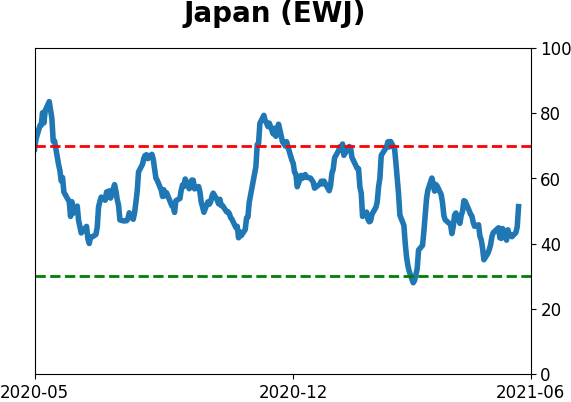
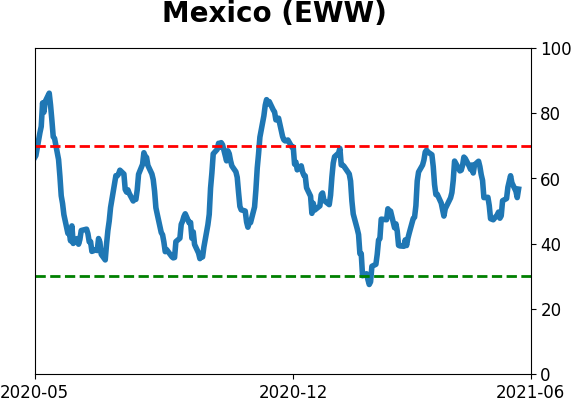
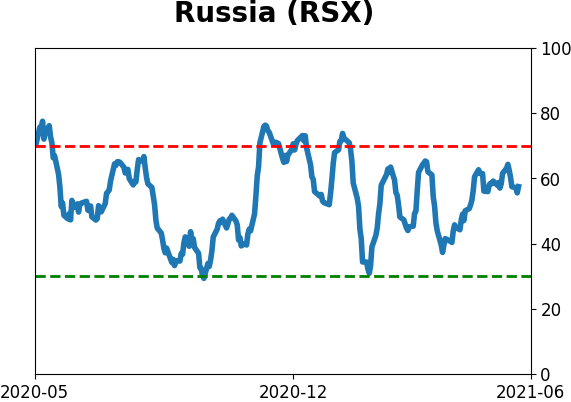
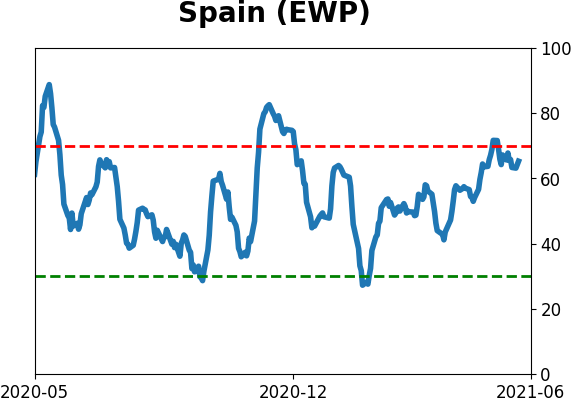
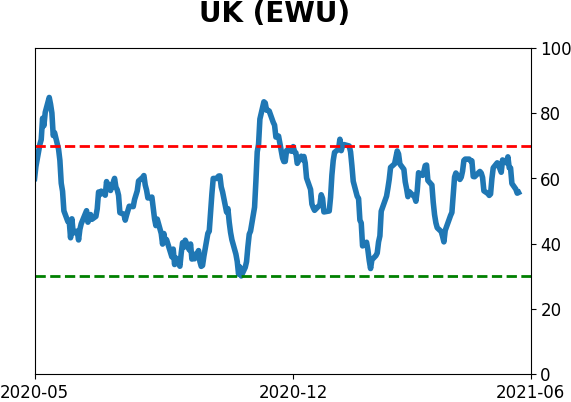
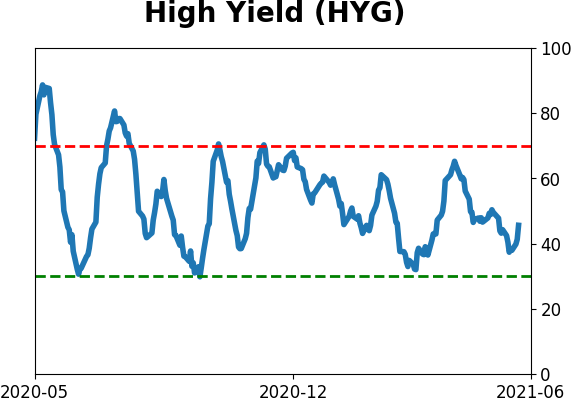
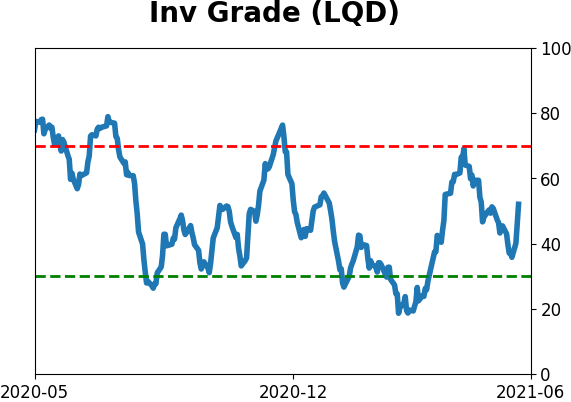
Sentiment Around The World
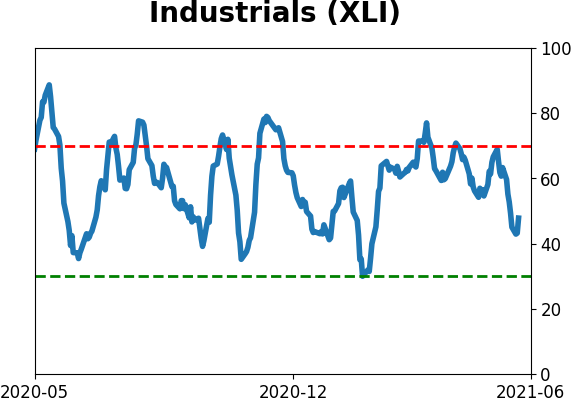
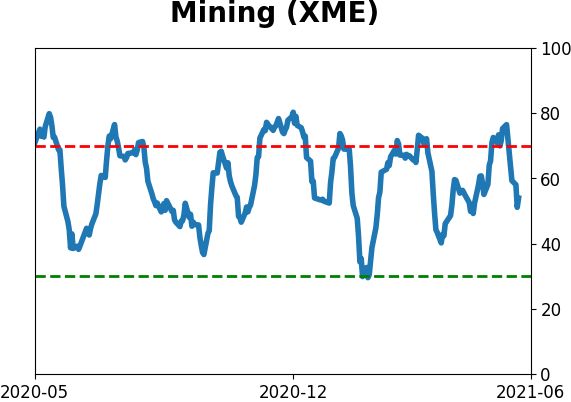
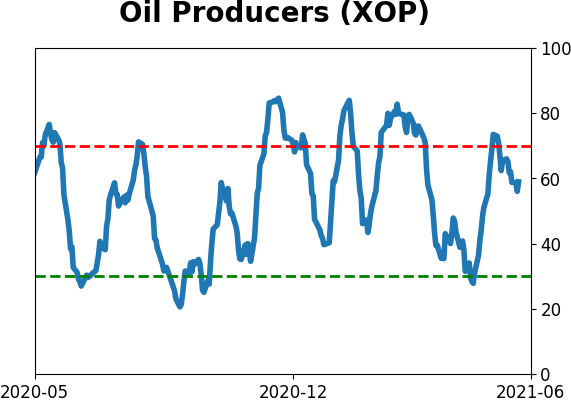
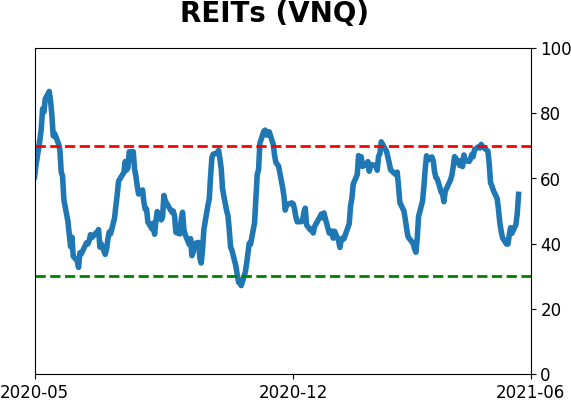
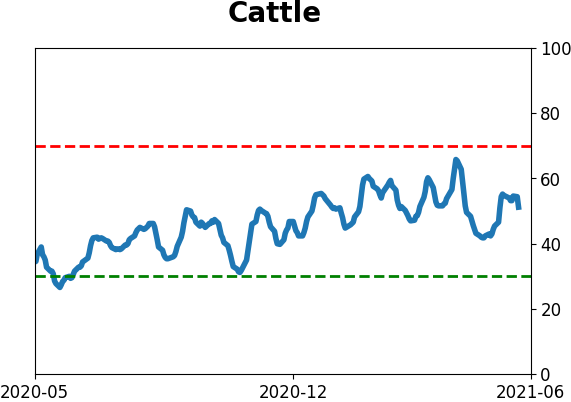
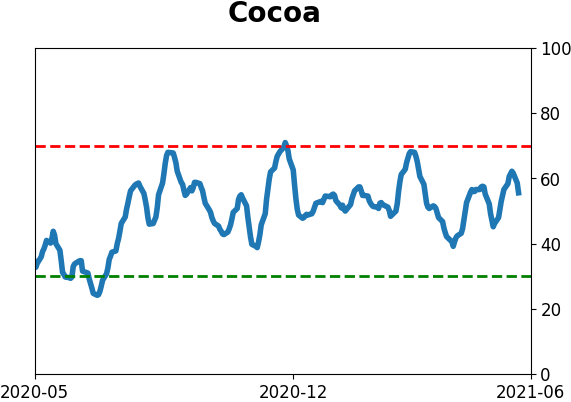
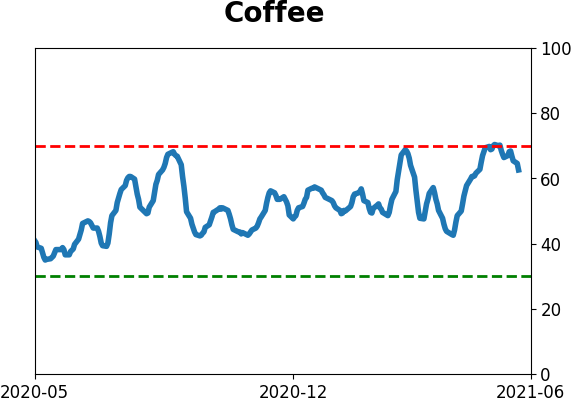
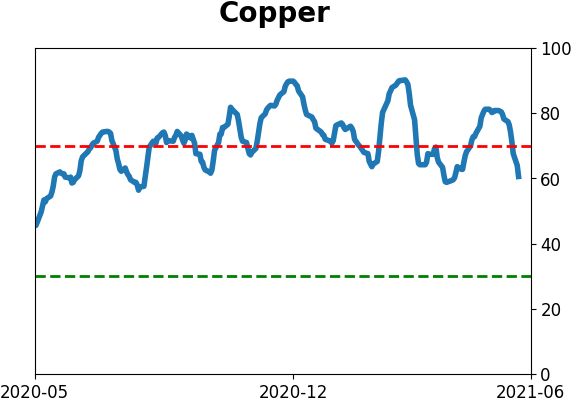
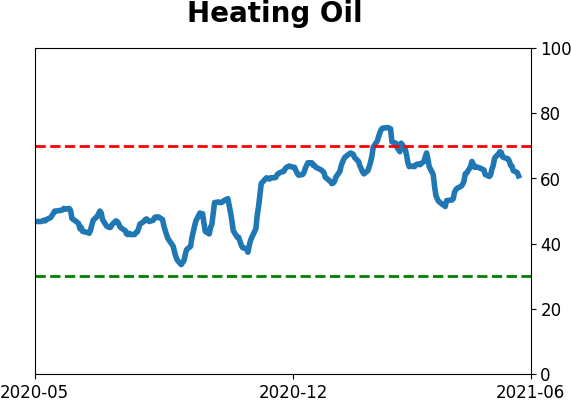
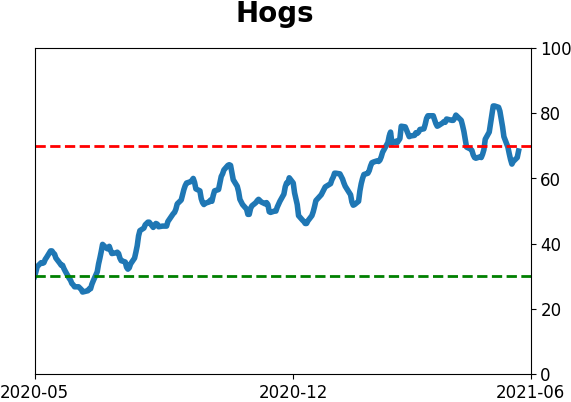
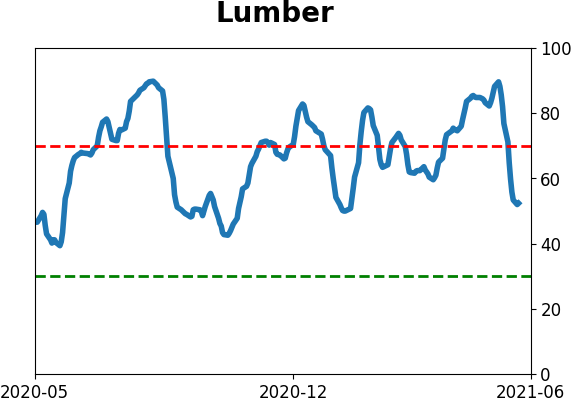
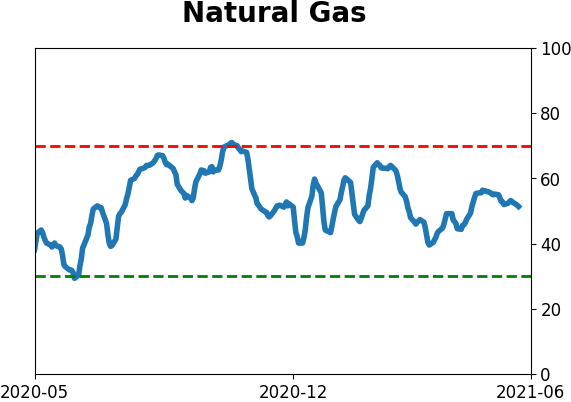
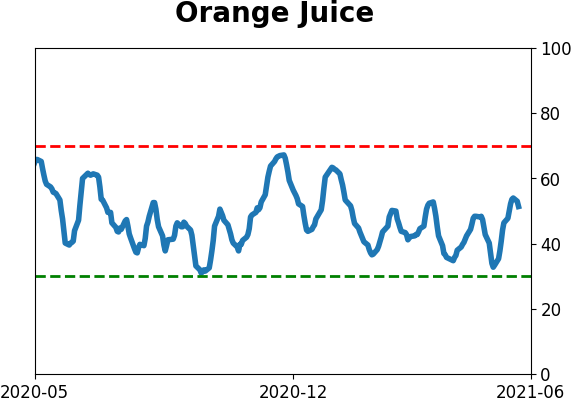
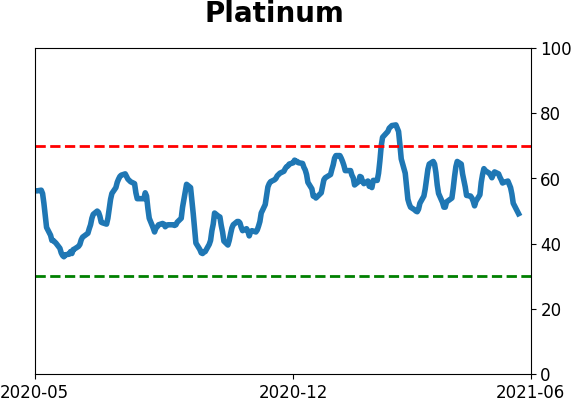
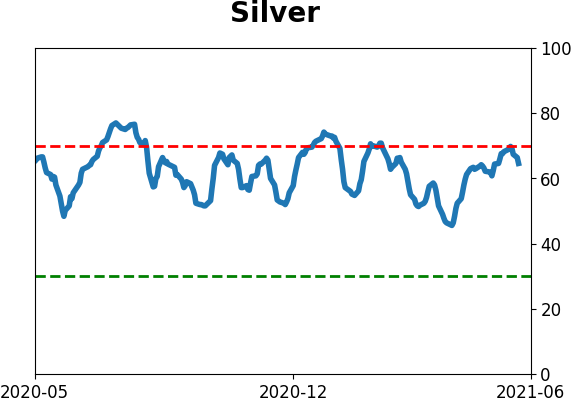
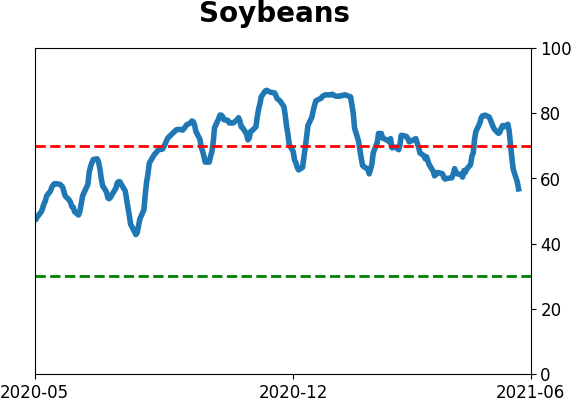
Optimism Index Thumbnails
|
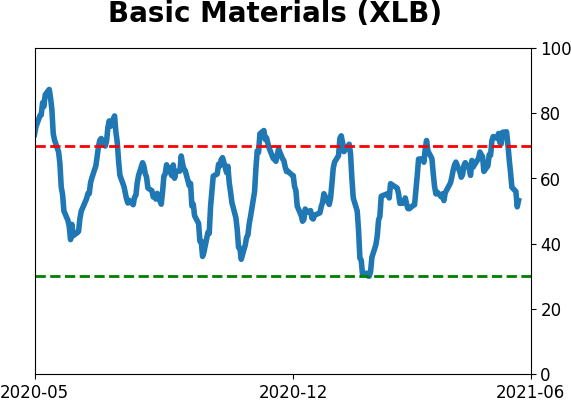
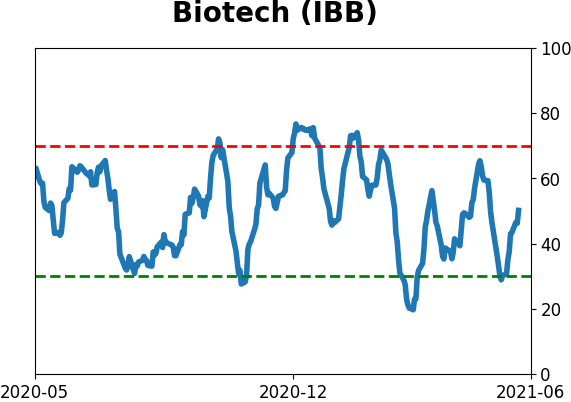
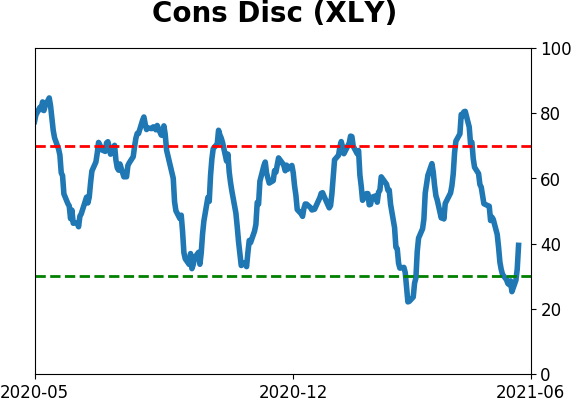
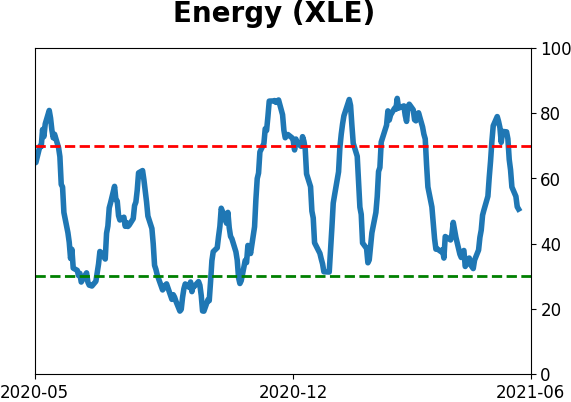
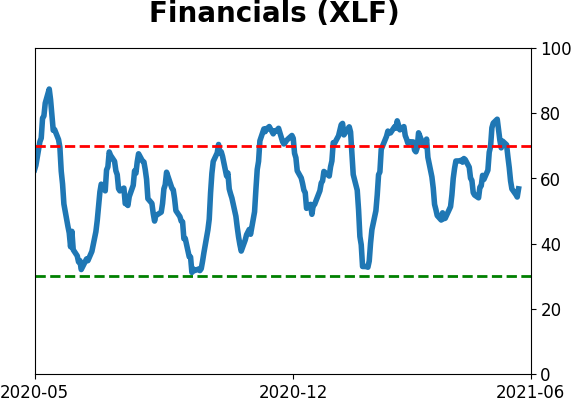
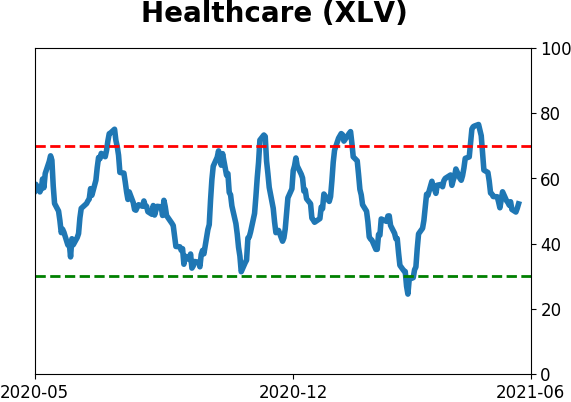
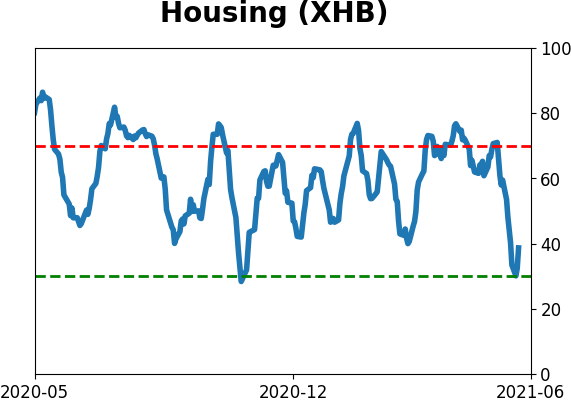
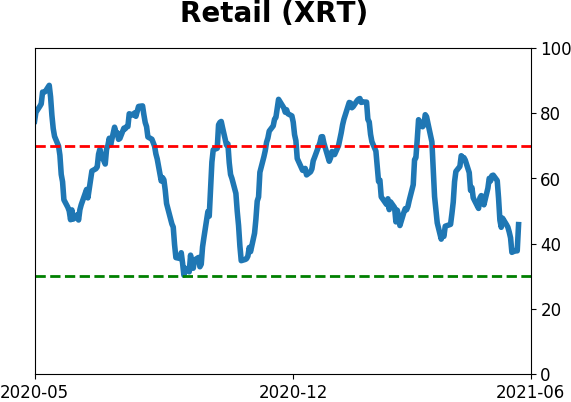
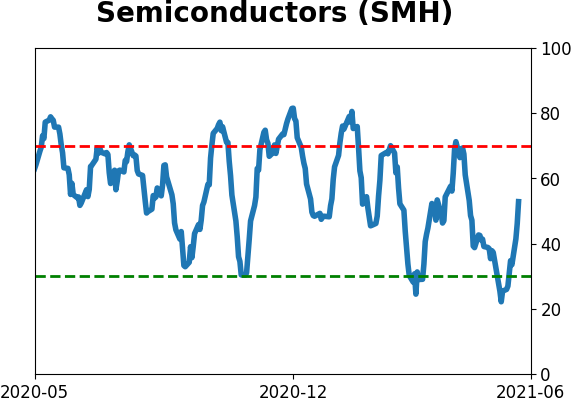
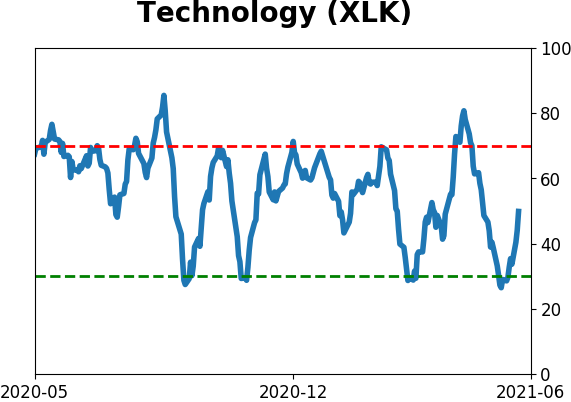
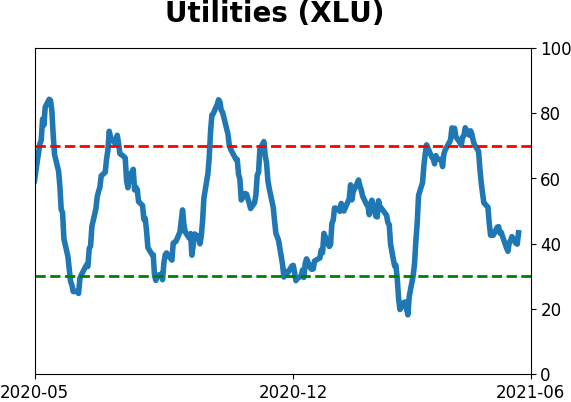
Sector ETF's - 10-Day Moving Average
|
|
|
Country ETF's - 10-Day Moving Average
|
|
|
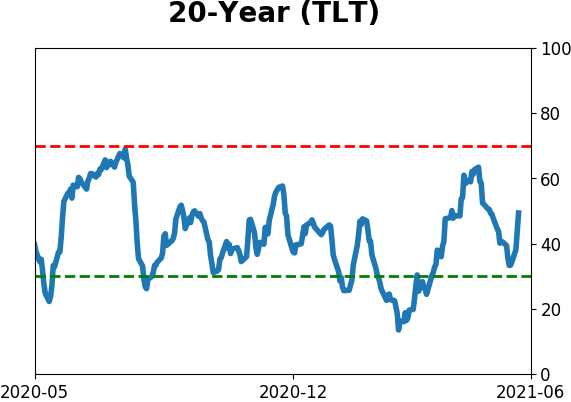
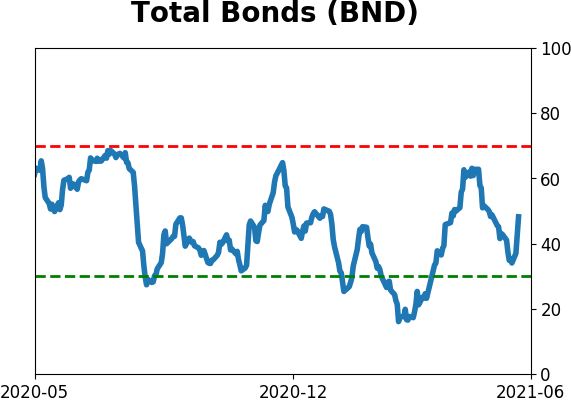
Bond ETF's - 10-Day Moving Average
|
|
|
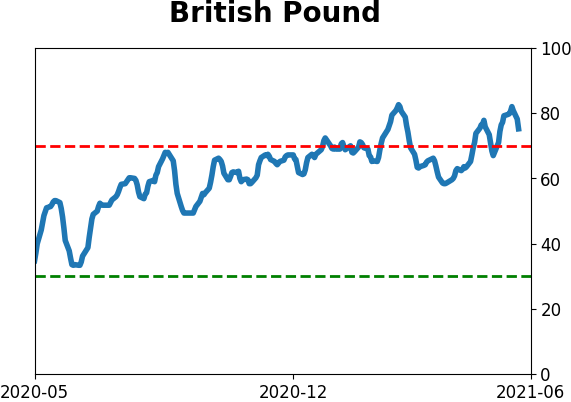
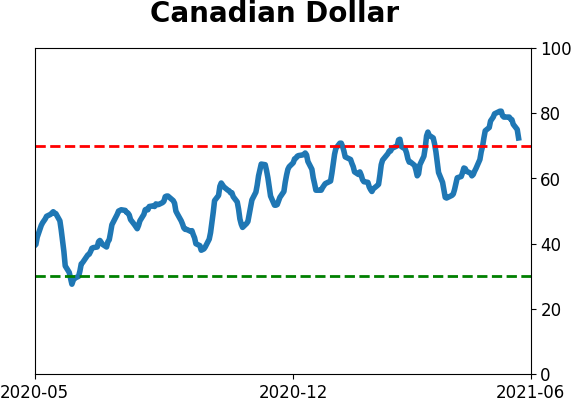
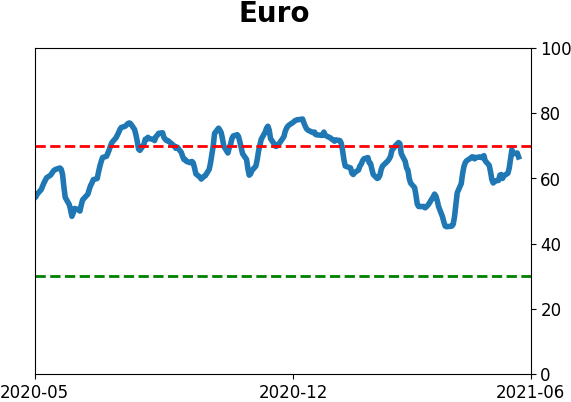
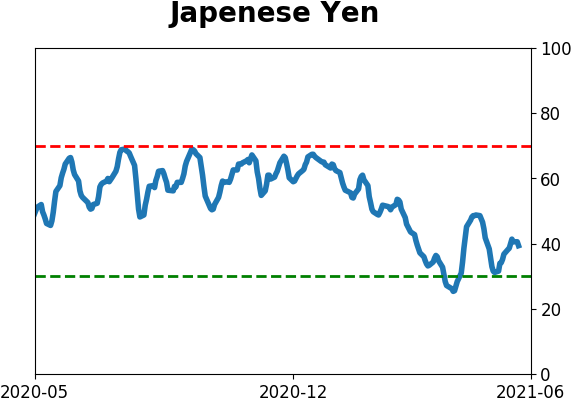
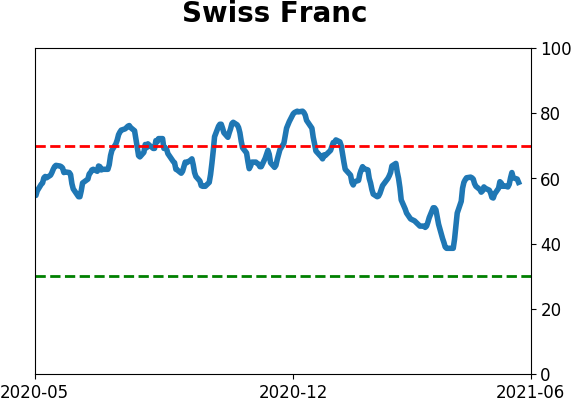
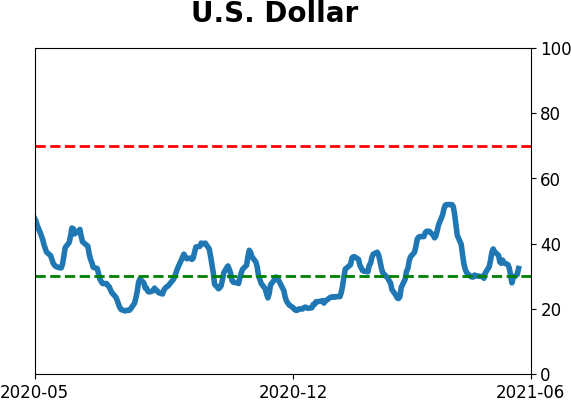
Currency ETF's - 5-Day Moving Average
|
|
|
Commodity ETF's - 5-Day Moving Average
|
|