Daily Report : TradingEdge Weekly for May 24 - Low anxiety even with Thursday's reversal, a good 100 day start, miner moves

| View/Print a PDF version of this Report |
Headlines
|
TradingEdge Weekly for May 24 - Low anxiety even with Thursday's reversal, a good 100 day start, miner moves: This week, we saw that there is little anxiety among traders as the VIX slips to an extremely low level, even with Thursday's severe reversal. It's hard to blame them with a fantastic first 100 trading days of the year for stocks. An investor could just focus on the 6 days surrounding market holidays and ignore everything else. Gold miners and copper have had quite a run. |
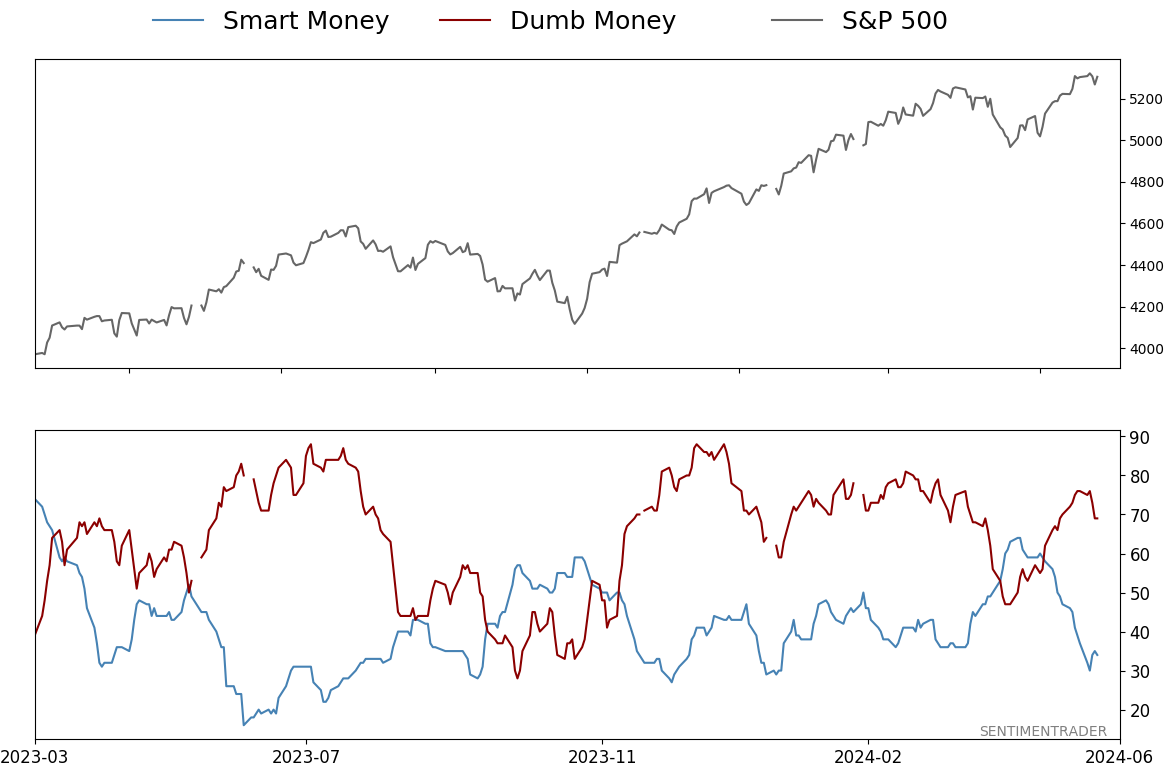
Smart / Dumb Money Confidence
|
|
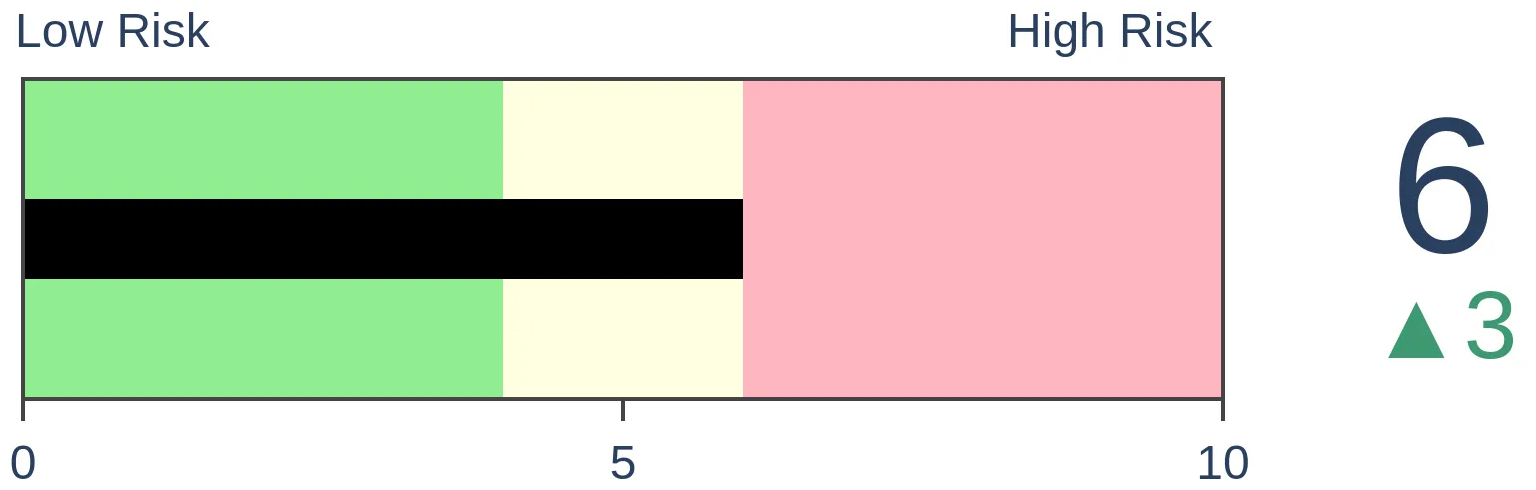
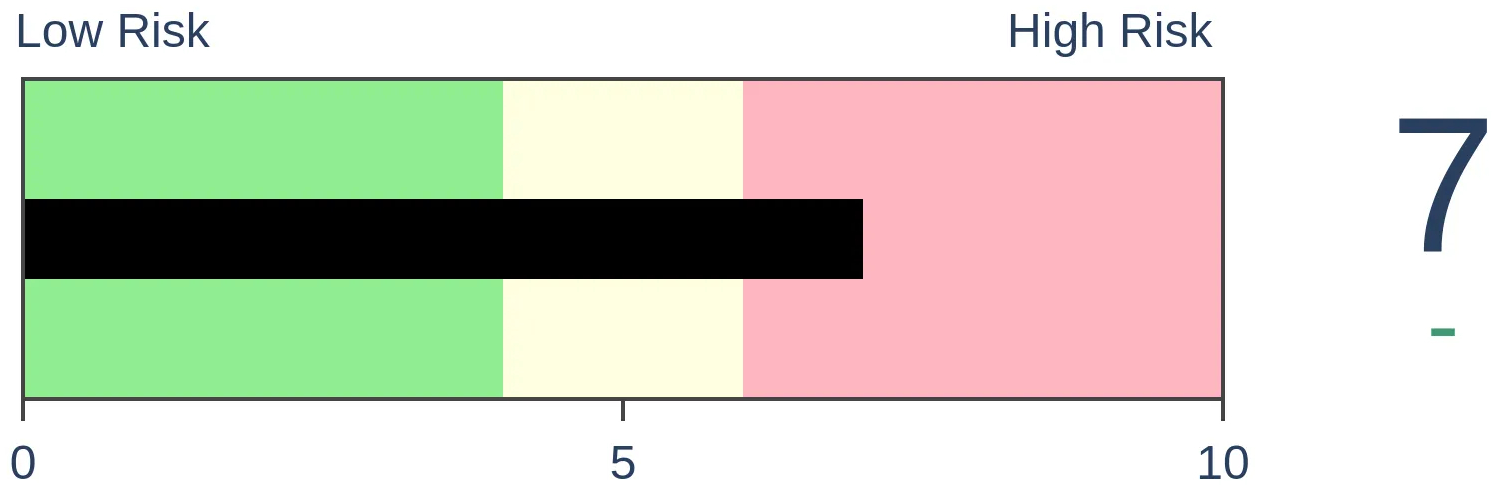
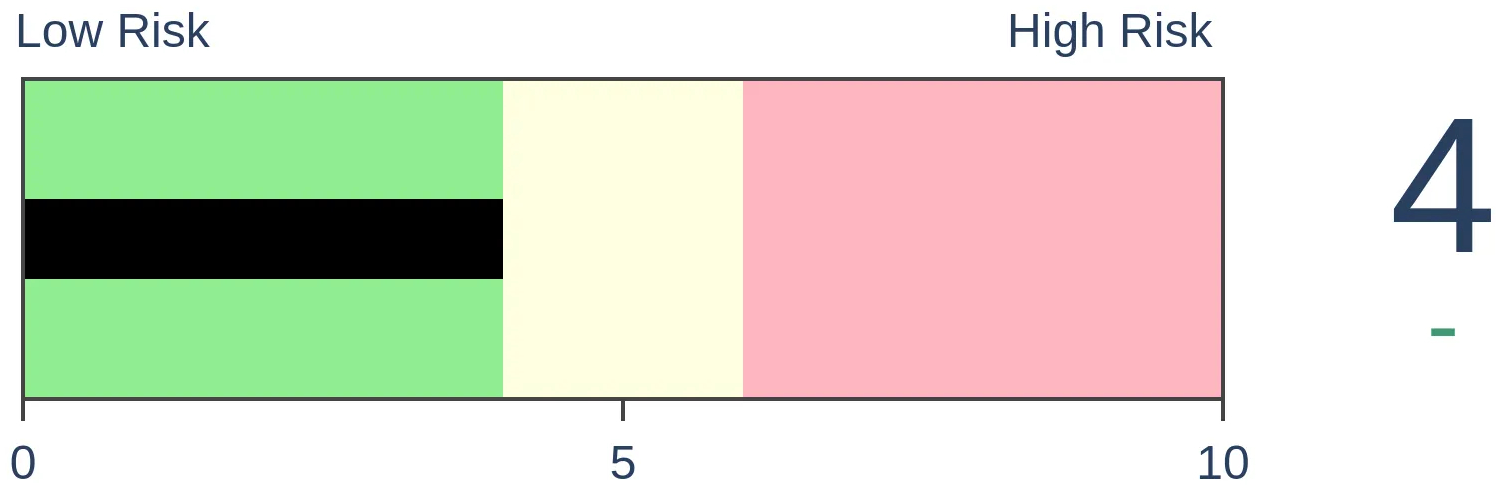
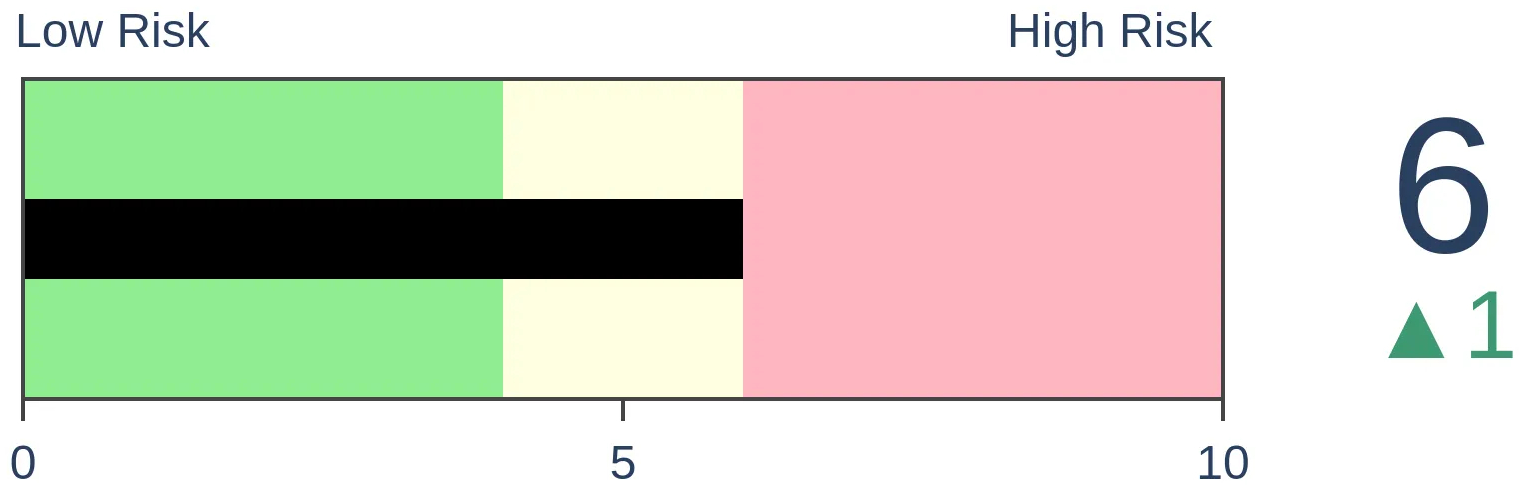
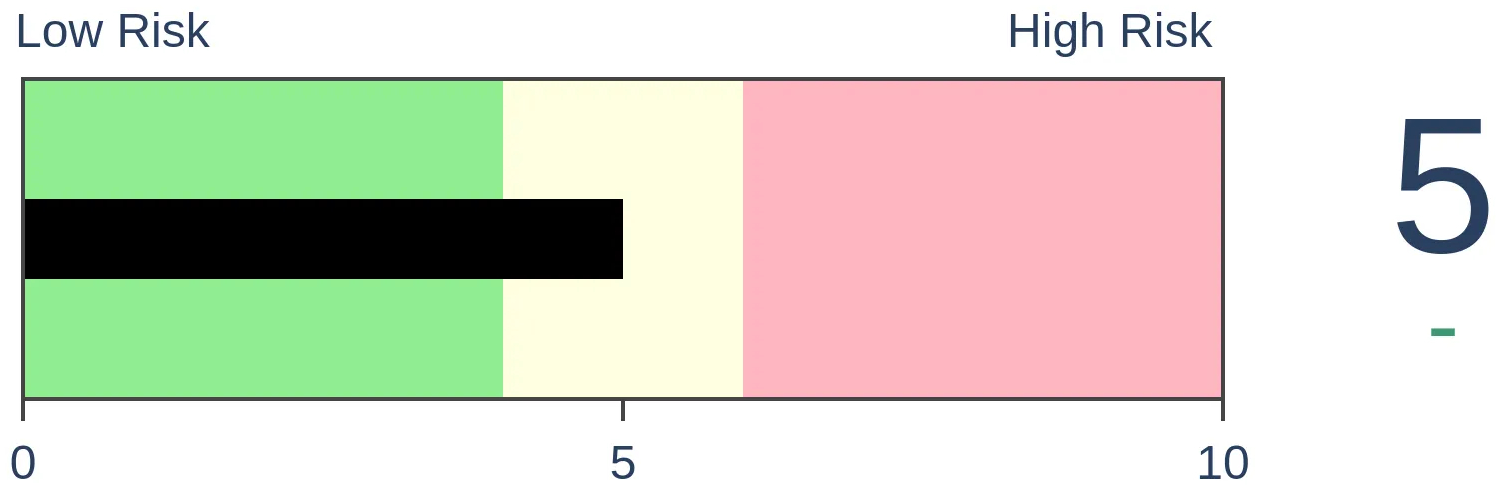
Risk Levels
|
|

|
Research
TradingEdge Weekly for May 24 - Low anxiety even with Thursday's reversal, a good 100 day start, miner movesBy Jason GoepfertBOTTOM LINEThis week, we saw that there is little anxiety among traders as the VIX slips to an extremely low level, even with Thursday's severe reversal. It's hard to blame them with a fantastic first 100 trading days of the year for stocks. An investor could just focus on the 6 days surrounding market holidays and ignore everything else. Gold miners and copper have had quite a run. FORECAST / TIMEFRAME |
Key points:
- No sign of anxiety among traders as the VIX slips
- That changed a little bit with the severe reversal on Thursday
- Overbought stocks are making a comeback
- It's been a great first 100 days for stocks
- Transportation stocks are lagging
- Small caps are entering a nice seasonal window
- The 6 trading days around market holidays have surpassed the return on all other days
- Gold mining stocks are surging again
- The jump in miners come with some warnings, as historically they have not succeeded much in holding momentum
- Copper's record run
No anxiety
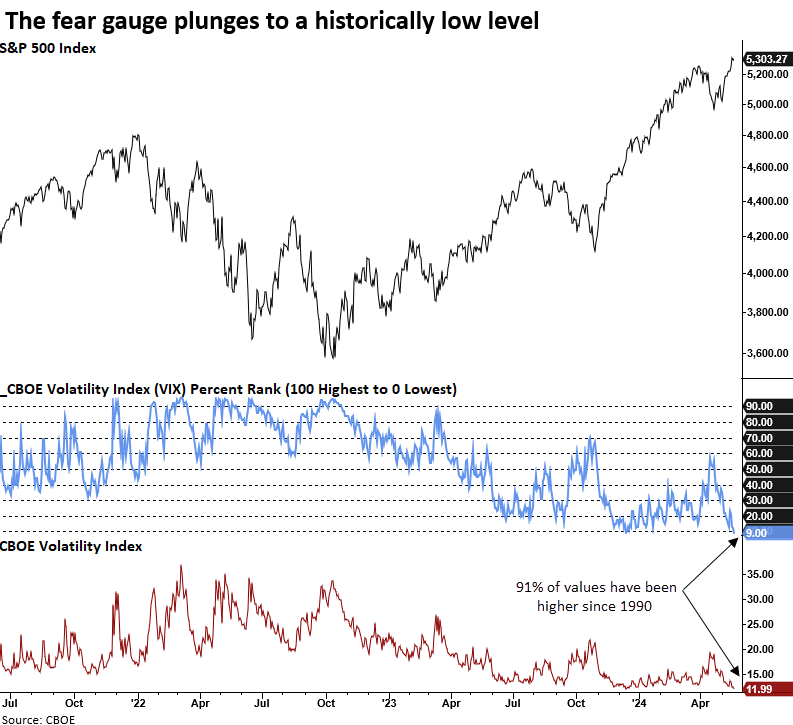
Last Friday, the Volatility Index (VIX) dipped below 12, signaling decreased anxiety among investors. Dean showed that similar conditions suggest the S&P 500 could consolidate the recent gains over the next few weeks.
A low VIX generally indicates a market environment where investors expect less volatility and feel more confident. The last instance when the VIX fell below 12 after rising to 19 or higher, resembling the recent occurrence, was in November 2019, which led to a 4.6% increase in the S&P 500 over the ensuing two months.
Whenever the Volatility Index (VIX) shifted from above 19 to below 12, the S&P 500 tended to consolidate its recent gains over the subsequent two weeks. A continuation of the uptrend followed this pause, with the index recording gains a year later in all but one case.
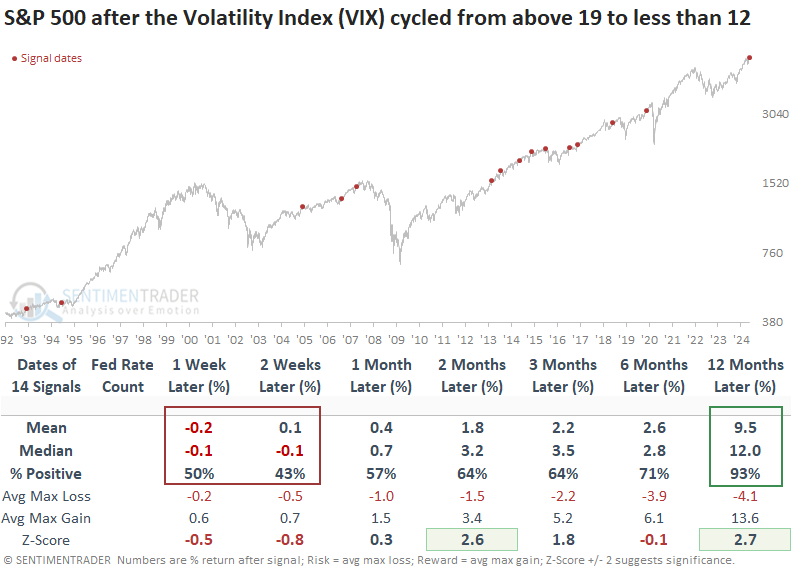
Over the ensuing three months, the maximum loss exceeded -5% only once, challenging the commonly held belief that a low VIX signals dangerous complacency.
With the VIX lower than 91% of all historical values since 1990, the likelihood of further downside is limited. This explains the consistently high percent positive readings across all time horizons in the following outlook table.
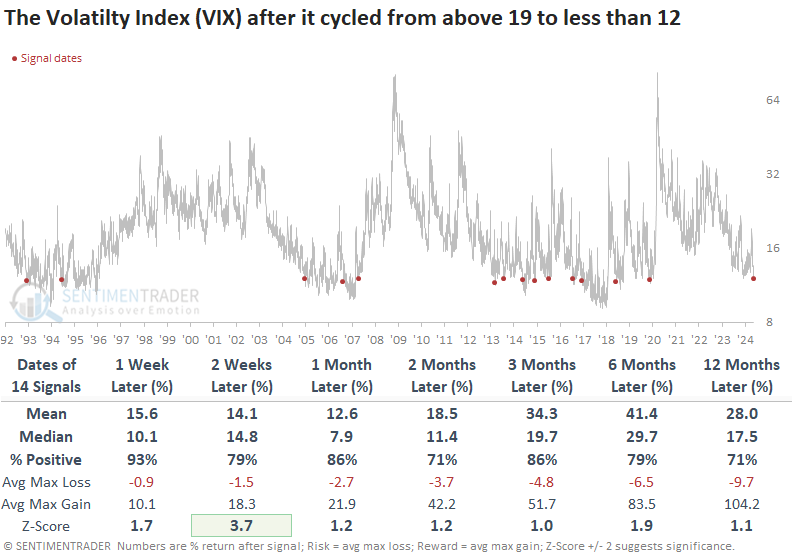
Following periods when the Volatility Index cycled from above 19 to below 12, it usually takes about 82 trading sessions to rebound above the reset level of 19.
That was quick
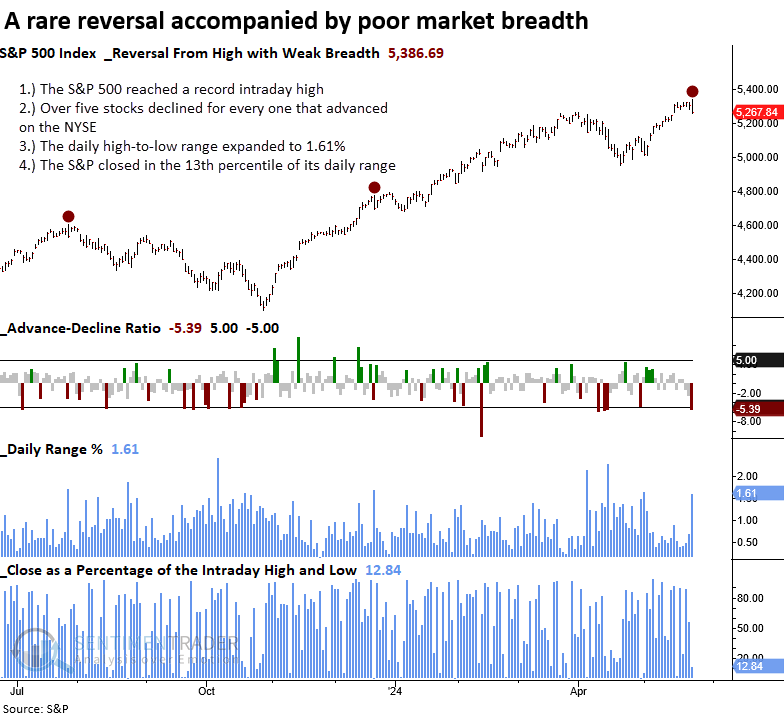
Dean also noted that on Thursday, after a record intraday high, the S&P 500 tumbled, with market breadth turning decidedly negative. Similar conditions suggest the world's most benchmarked index could be near-term rangebound.
The selling pressure broadened the S&P 500's trading range significantly, with the index closing near the lowest level of the day. Additionally, the reversal was marked by poor market breadth on the NYSE, where the advance-decline ratio showed a concerning imbalance, with five stocks declining for every one that advanced.
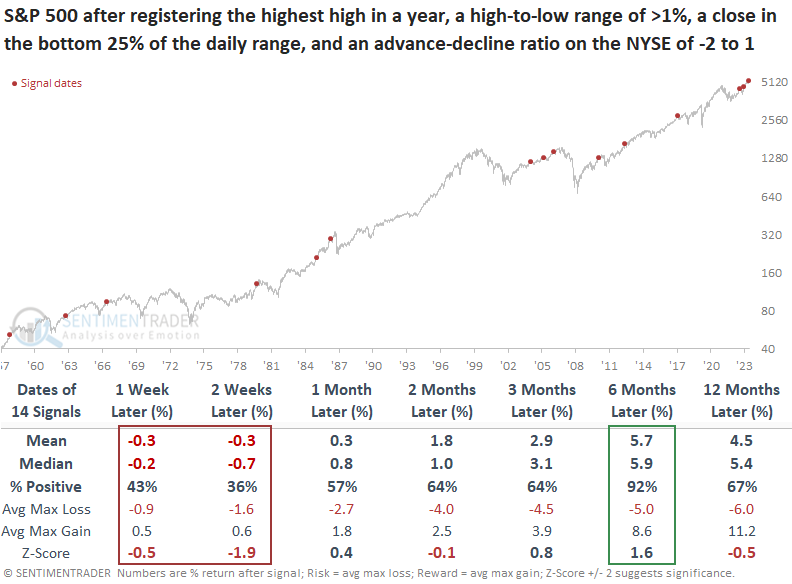
Following a downside reversal like the one seen on Thursday, the S&P 500 typically experiences a modest short-term correction. Over the ensuing three weeks, the world's most benchmarked index displayed a negative return at some point in 12 out of 14 instances.
While the short-term outlook could see some backing and filling, these one-day reversal patterns do not align with significant market peaks. The S&P 500 was higher in all but one instance in the subsequent six months. Over this same interval, none of the maximum losses exceeded -10 %, although July 2023 was close with a -9.3 % decline.
More overbought stocks, but that could be a good thing
The stock market has been on a run since a brief pullback in April, and Jay noted that several technical indicators suggest the rally could continue.
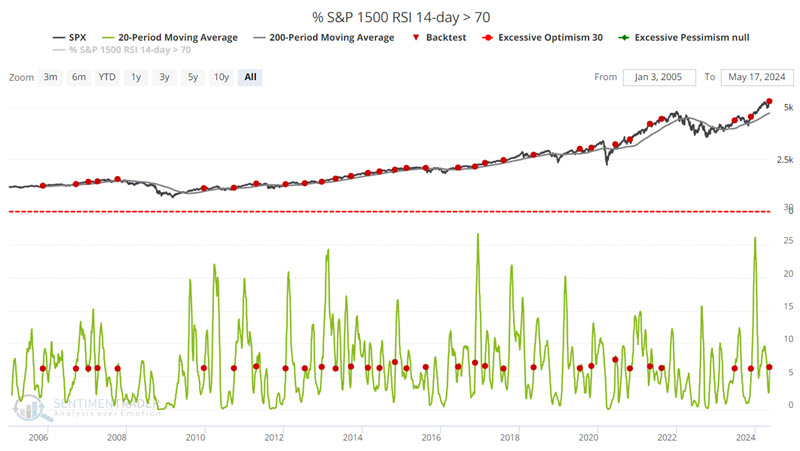
In a true bull market, an extended bullish run can follow even a brief oversold period. The chart below highlights with a red dot those dates when the 20-day moving average of the S&P 1500 % of stocks with a 14-day RSI above 70% crossed above 6.2 - while the S&P 500 was above its 200-day moving average - for the first time in three months.
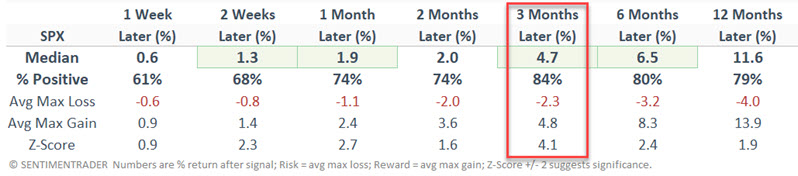
In other words, this indicator waits for the 20-day average of broad market breadth to drop to a very low level (i.e., below 6.2%) and then reverse higher to signal the resumption of a favorable trend. By design, it tends to be late, but the rallies they signal tend to persist, as highlighted in the performance figures below.
Jay also noted that the iShares U.S. Transportation ETF (ticker IYT) seeks to track the investment results of an index composed of U.S. equities in the transportation sector. Its medium-term Optimism Index turned higher from a low level, which tends to precede positive returns for the broader stock market.
NOTE: Jay conducted a webinar in association with the National Association of Active Investment Managers (NAAIM) about his 30-30-30-10 investment strategy. You can view a replay here.
A great start
The market reached the 100-day mark of the year. And what a year it's been for the most benchmarked equity index in the world, as the S&P 500 has set (at least) 24 record high closes during these 100 days.
This year qualifies as one of the best since 1928 in terms of persistent record highs. Only a handful of other years have matched or exceeded this performance, including only one over the past 25 years.
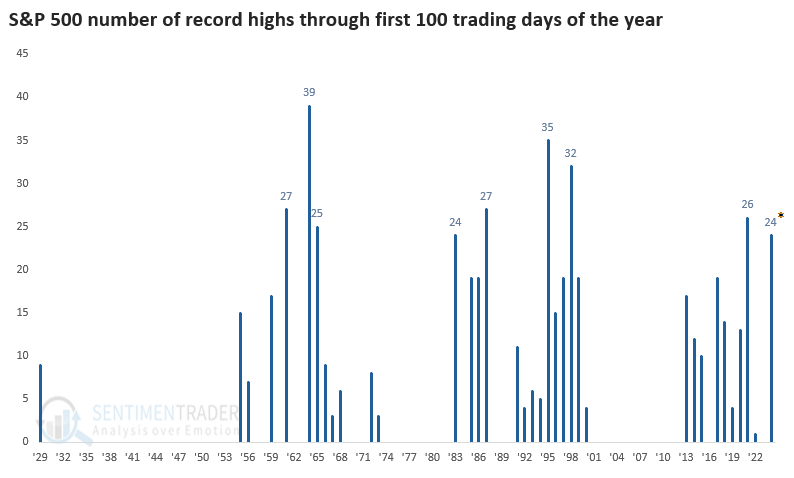
The table below shows years that enjoyed at least 15 record highs through the first 100 days. The S&P's returns were weak in the very short term but strong into year-end. Over the next six months, only 2 signals out of 17 suffered a loss.
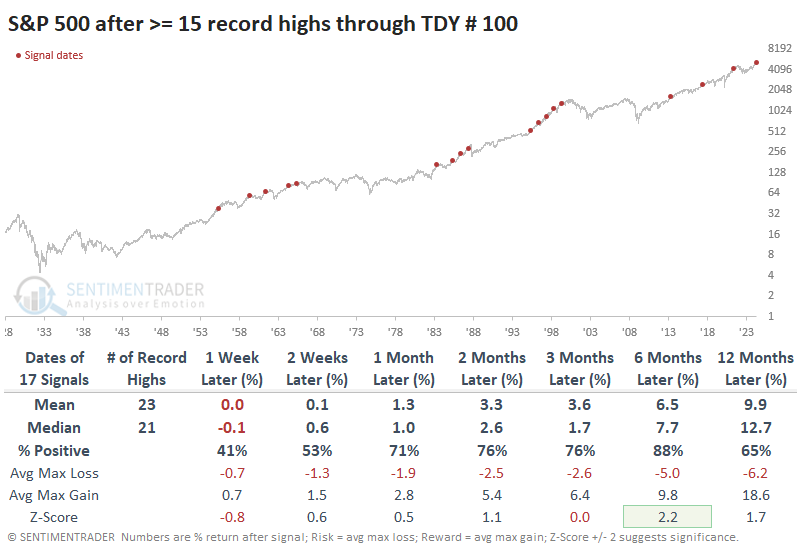
When we compare those returns to years when the S&P didn't manage any record highs during the first 100 sessions, after good 100-day starts, the S&P rallied into year-end 88% of the time compared to only 60% after bad starts, with significantly less risk.
The Dow Jones Industrial Average has also recorded an impressive number of record highs during its first 100 days of the year. Like the S&P 500, the Dow showed weak returns in the short term but consistently rallied into year-end. Of the three losses, only one was much larger than -5%.
Slow transportation
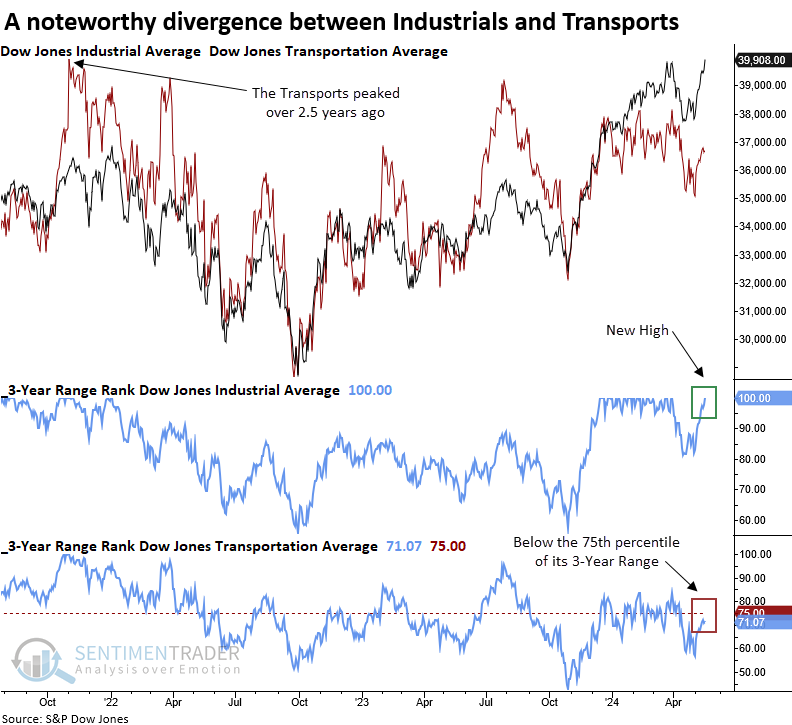
The Dow Jones Industrial Average closed at a new high, with the Transports severely lagging. Dean suggested that similar divergences weren't ominous, with the Industrials rising 75% of the time a year later.
According to Dow Theory, a rising trend in both the Dow Jones Industrial Average (the manufacturers of goods) and the Dow Jones Transportation Average (the companies that transport the goods) indicates a healthy economy, which is positive for stock performance. Although Dow Theory remains on a buy signal from July 2023, the transports have not registered a new high in two and half years.
Dean applied a 3-year range rank to both indexes to capture other periods similar to now. The industrial sector showed a rank of 100%, indicating a new high. In contrast, the transport sector displayed a rank of 71%, a stark difference between the two groups that should be rising in unison.
Following instances when the Dow Jones Industrial Average closed at a 3-year high with the Transportation Average's 3-year range rank in the 75th percentile or less, the Industrials rose 75% of the time over the subsequent year, with a median return of 17%, which exhibited significance relative to random returns.
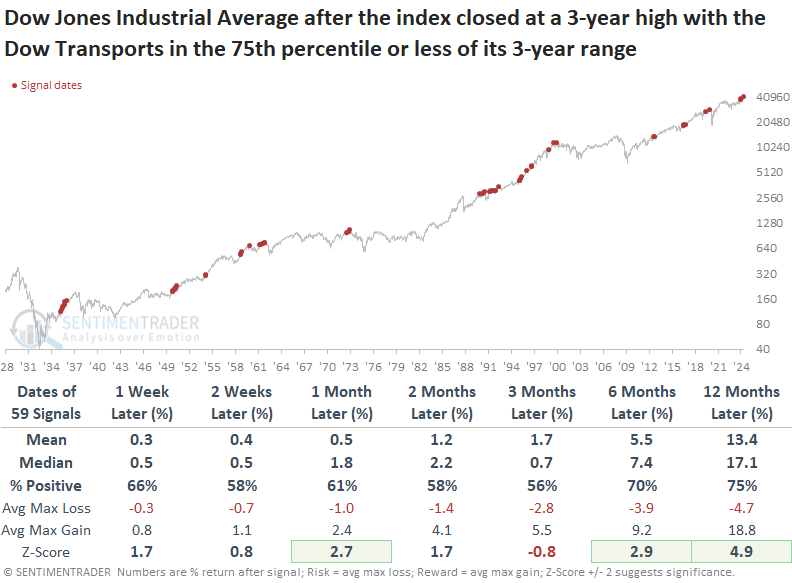
Transports had a slight edge over the next three to twelve months, pointing to a potential catch-up trade by the laggard.
Given that the Dow Jones Industrial Average no longer reflects industrial companies, let's substitute the S&P 500 Industrials for the Dow Jones Industrial Average. Interestingly, there were fewer signals, some of which were associated with significant drawdowns.
In cases where the S&P 500 reached a 3-year high with the Transports residing in the 75th percentile or less versus its 3-year range, the outlook for the world's most benchmarked index was solid.
A bullish seasonal boost
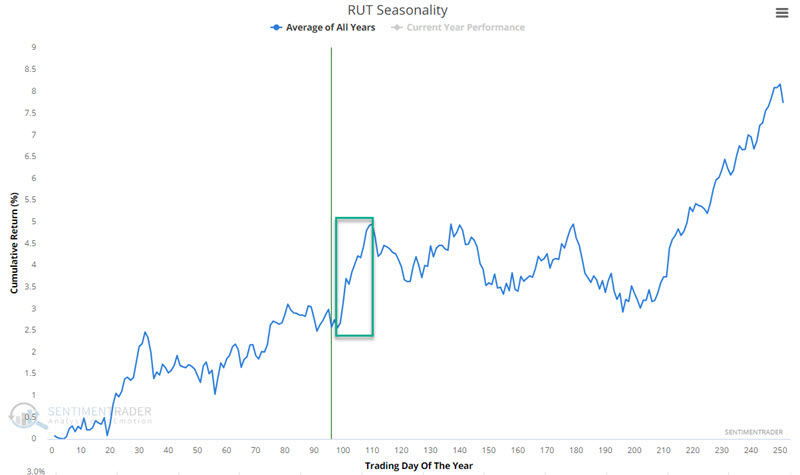
The stock market tends to perform well around market holidays, and Jay highlighted that the next several weeks also mark a generally favorable time of year for stocks.
The chart below displays the annual seasonal trend for small caps. Note the brief favorable window (typically includes the dates around the Memorial Day holiday) extending from the close on Trading Day of Year (TDY) #98 through TDY #110.
To examine the history, we will use the action of the FAMA French Index from 1973 to 1991 and then the S&P 600 small-cap index after that. The chart below displays the hypothetical growth of $1 invested in the S&P 600 Index only during these seasonal windows.
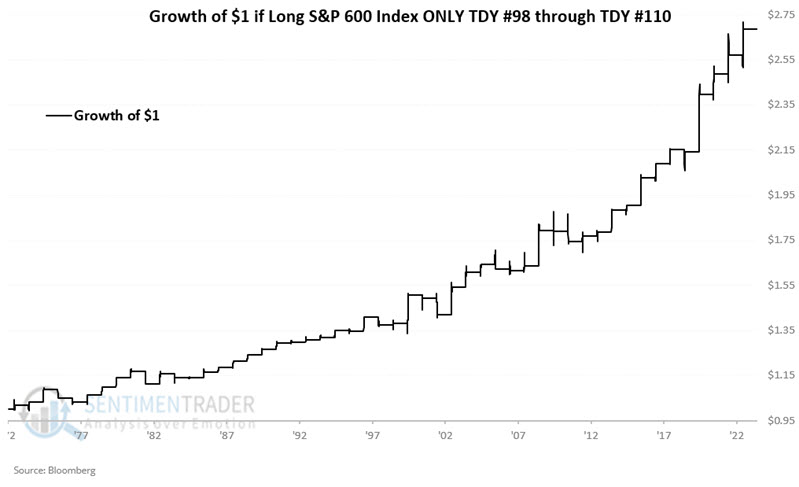
The S&P 500 large-cap index shows a similar but slightly different favorable window around Memorial Day. For large caps, that period extends from the close on Trading Day of Year (TDY) #99 through TDY #109, but still showed a 73% win rate during those windows.
Holiday cheer
Jay further noted that the stock market has shown a persistent long-term tendency to rally before and after market holidays. The six days surrounding holidays gained 13% more than all other days combined despite representing only roughly 1/5th of all trading days.
Much analysis has been done regarding stock market performance around market holidays. For this test, rather than wondering if, say, the day before July 4th has performed better than the day after Christmas, we will treat all holiday days the same.
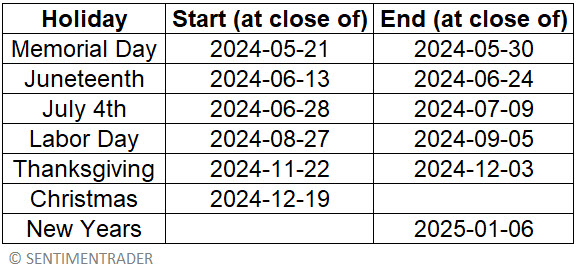
This test analyzes the performance of the S&P 500 Index solely on the three trading days before and after each market holiday. The holidays included are:
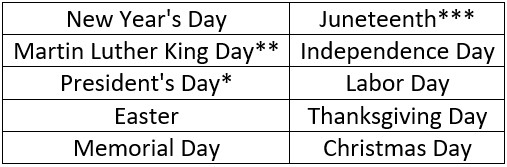
The strategy followed below is simple: Buy and hold the S&P 500 Index only during the three trading days before and the three trading days after every market holiday starting in December 1933. The chart below is quite enlightening. It displays the Growth of $ 1 for the S&P 500 Index held only during Holiday Days (black line) compared to the growth of $1 in the S&P 500 Index during all other trading days (blue line).
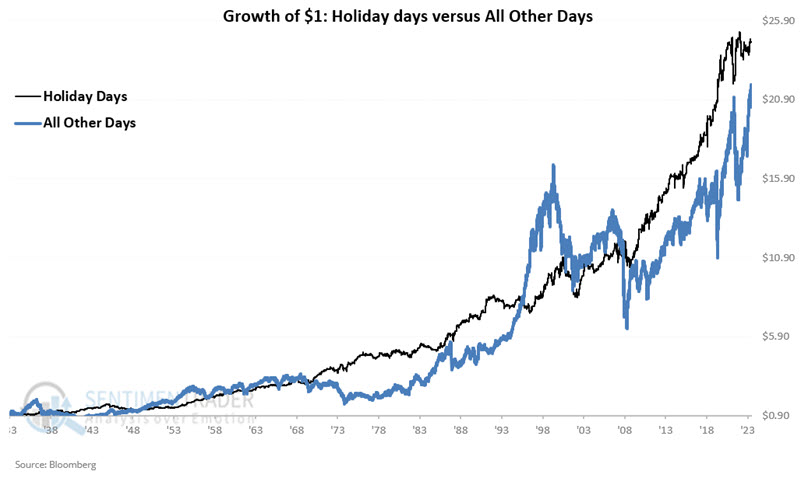
Despite representing only 19% of all trading days, Holiday Days gained +2,354% versus All Other Days (representing 81% of all trading days), which earned only +2,083%. The bottom line: Holiday Days have delivered more total return in just a fifth of the time.
The next period - around Memorial Day - begins at the close on May 21st and extends through the close on May 30th.
The table below displays the Holiday Dates for the remainder of 2024.
Miners have enjoyed a major rally
A little over a month ago, we examined the surge in gold mining stocks. If buyers continued to show interest, it would tell us quite a bit about their longer-term prospects.
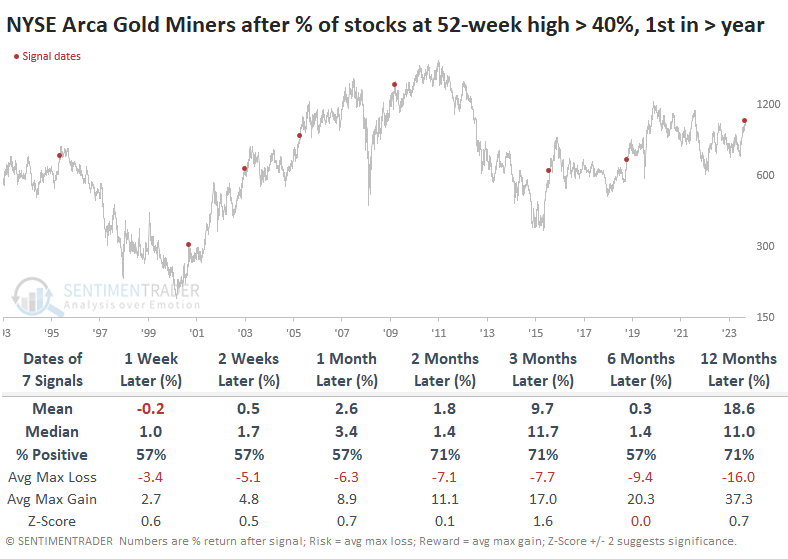
And interest they have shown. Miners dipped for a couple of weeks after that, but buyers saw that as an opportunity, which is rare for this sector. As a result, more than 40% of mining stocks hit a 52-week high last week. This was the first reading over 40% in over a year, and the last couple of instances marked the nascent stages of impressive rallies.
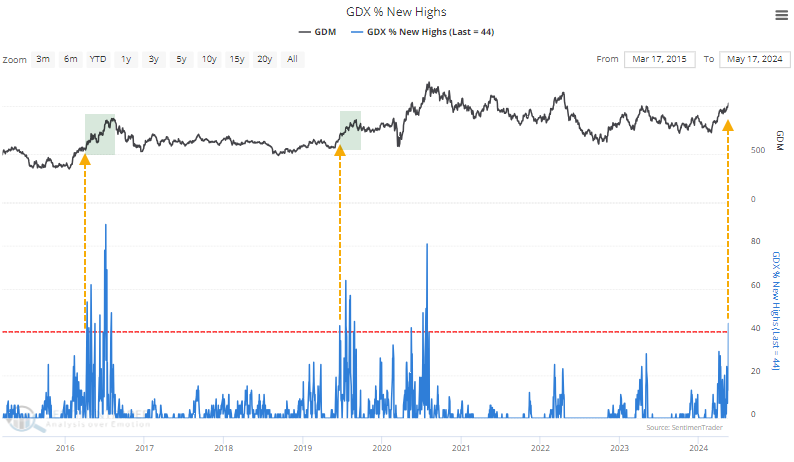
Over the past 30 years, the first time more than 40% of gold miners reached a 52-week high at the same time mostly preceded further gains in the NYSE Arca Gold Miners Index, though there were a couple of large failures with double-digit losses either two or three months later.
As a result of the rally and more stocks reaching new highs, it's logical to assume that fewer stocks are in corrections, which they are. After more than 90% of miners were in corrections and then 20% or fewer of them were, the NYSE Arca Gold Miners index showed a gain either two or three months later every time.
Not only are fewer of them in corrections, but even fewer are in bear markets. This figure has cycled from above 80% to fewer than 8% for only the 7th time in 30 years. As we saw above, the next three months were mostly positive, with only one failure.
Some miner warnings
Many are wondering if gold mining stocks will join the party that gold bugs have enjoyed. A series of recent sentiment and breadth indicators suggest caution regarding miners - and possibly a better outcome for commodities.
If gold bullion continues to rally, gold stocks will likely rally higher in conjunction. In the meantime, various sentiment and breadth indicators have flashed generally unfavorable signals for gold miners. Interestingly, these signals have been much more favorable for commodities as an asset class.
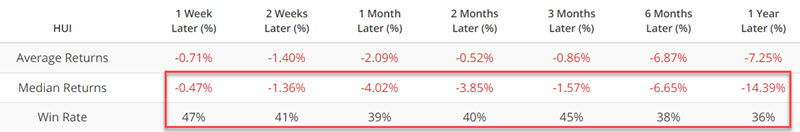
For the tests below, we will use the Gold Bugs Index (ticker HUI) to analyze gold stock miner performance and the Bloomberg Commodity Index (ticker BCOMSP) to analyze commodity performance.
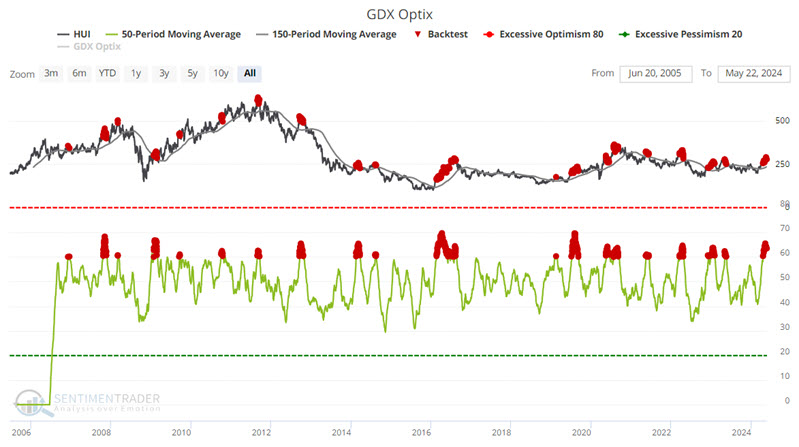
The chart below highlights with a red dot those dates when the 50-day moving average of GDX Optix is above 60% while ticker HUI was above its 150-day moving average. Note that this is different than the tests above, as it only looks at raw readings and not cycles from one extreme to the other.
The chart below highlights with a red dot those dates when the 50-day moving average of GDX Optix is above 60% while ticker BCOMSP was above its 150-day moving average.
The results above are only mildly compelling but much better than those for gold stocks.
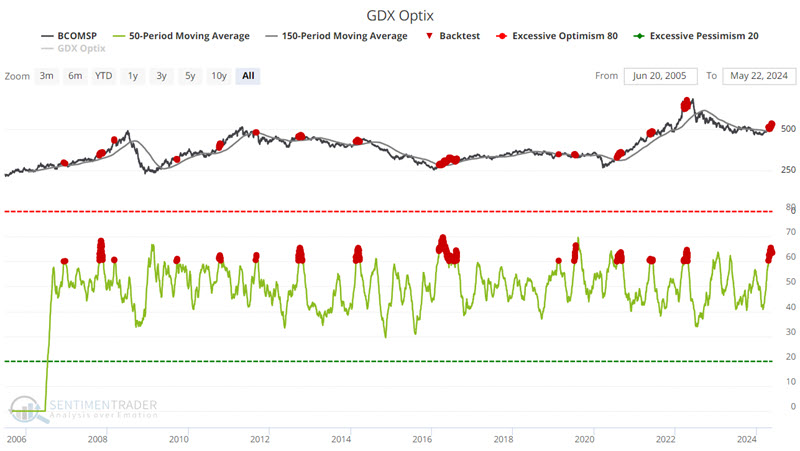
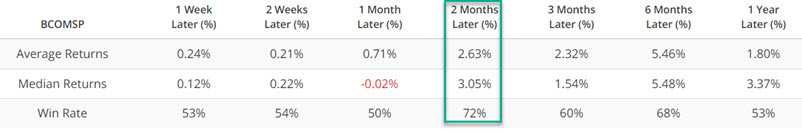
Jay also looked at the percentage of miners in bear markets, as well as how many are above their 200-day moving averages. Because miners have had difficulty holding upside momentum, forward returns were mostly negative. But they were mostly positive for commodities in general.
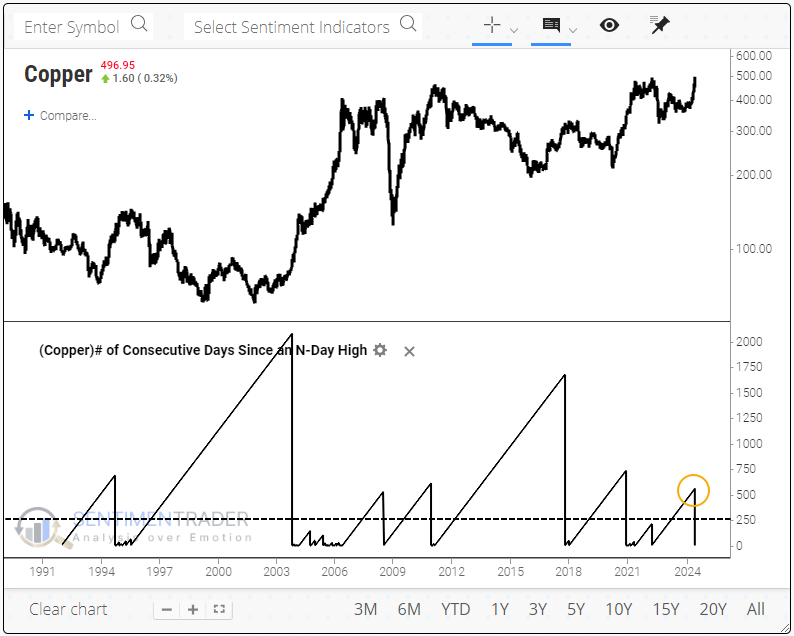
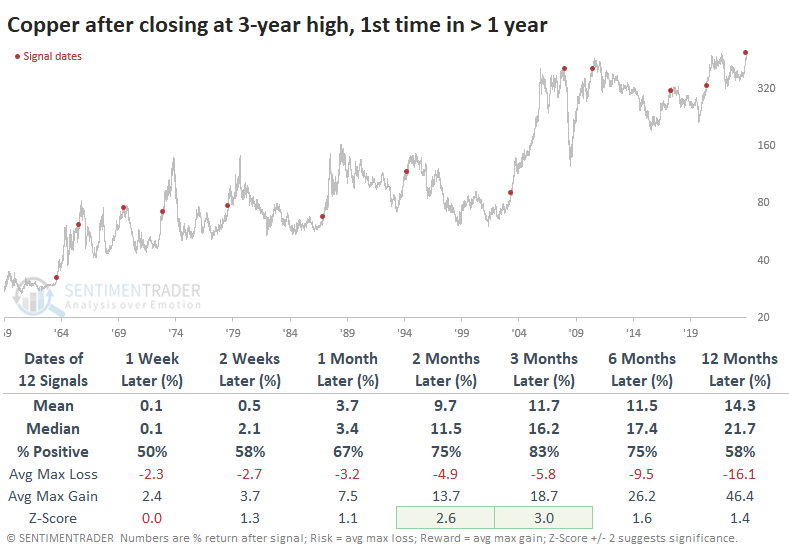
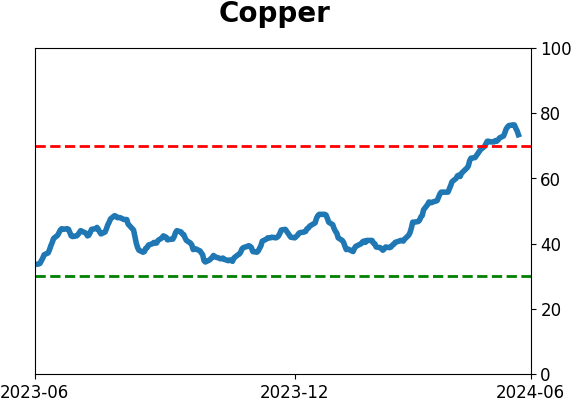
Copper's record run
In a market suddenly overflowing with extreme moves, copper stands out. The metal jumped in March, continued rising in April, and spurted higher once again to a new high.
This was copper's first multi-year high in more than two years. Historically, there have only been a dozen instances when it went at least a year between making new multi-year highs.
These breakouts were a decent sign for the metal itself over the medium term. During the next three months, copper added to its gains 10 times out of 12, but the exceptions were painful failures right at the peak, leading to massive declines during 1970 and 2008.
Overall, the risk versus reward over the next few months was healthy, with average drawups more than triple the average drawdowns.
Copper breakouts led to mostly good returns for stocks, especially over the next couple of months. Since the early 1980s, these copper breakouts did precede the '87 Black Monday crash, but not before the S&P 500 rallied double-digits first. And it also preceded the 2008 global financial crisis, but again, the S&P rallied a bit in the first couple of months following the copper breakout before rolling over.
Among other indexes and assets, the Dow, Nasdaq, and Russell all mostly outperformed the S&P up to two months later, especially the Nasdaq Composite over the next two months.
These were not good signals for the U.S. dollar, which suffered losses every time but once over the next six months. And 10-year Treasury notes showed consistent losses as well (meaning yields rose), which makes sense as a breakout in copper indicates strong economic activity and the likelihood of higher interest rates.
About TradingEdge Weekly...
The goal of TradingEdge Weekly is to summarize some of the research published to SentimenTrader over the past week. Sometimes there is a lot to digest, and this summary highlights the highest conviction or most compelling ideas we discussed. This is NOT the published research; rather, it pulls out some of the most relevant parts. It includes links to the published research for convenience, and if you don't subscribe to those products, it will present the options for access.
Indicators at Extremes
|
|
|
Phase Table
|
|
|
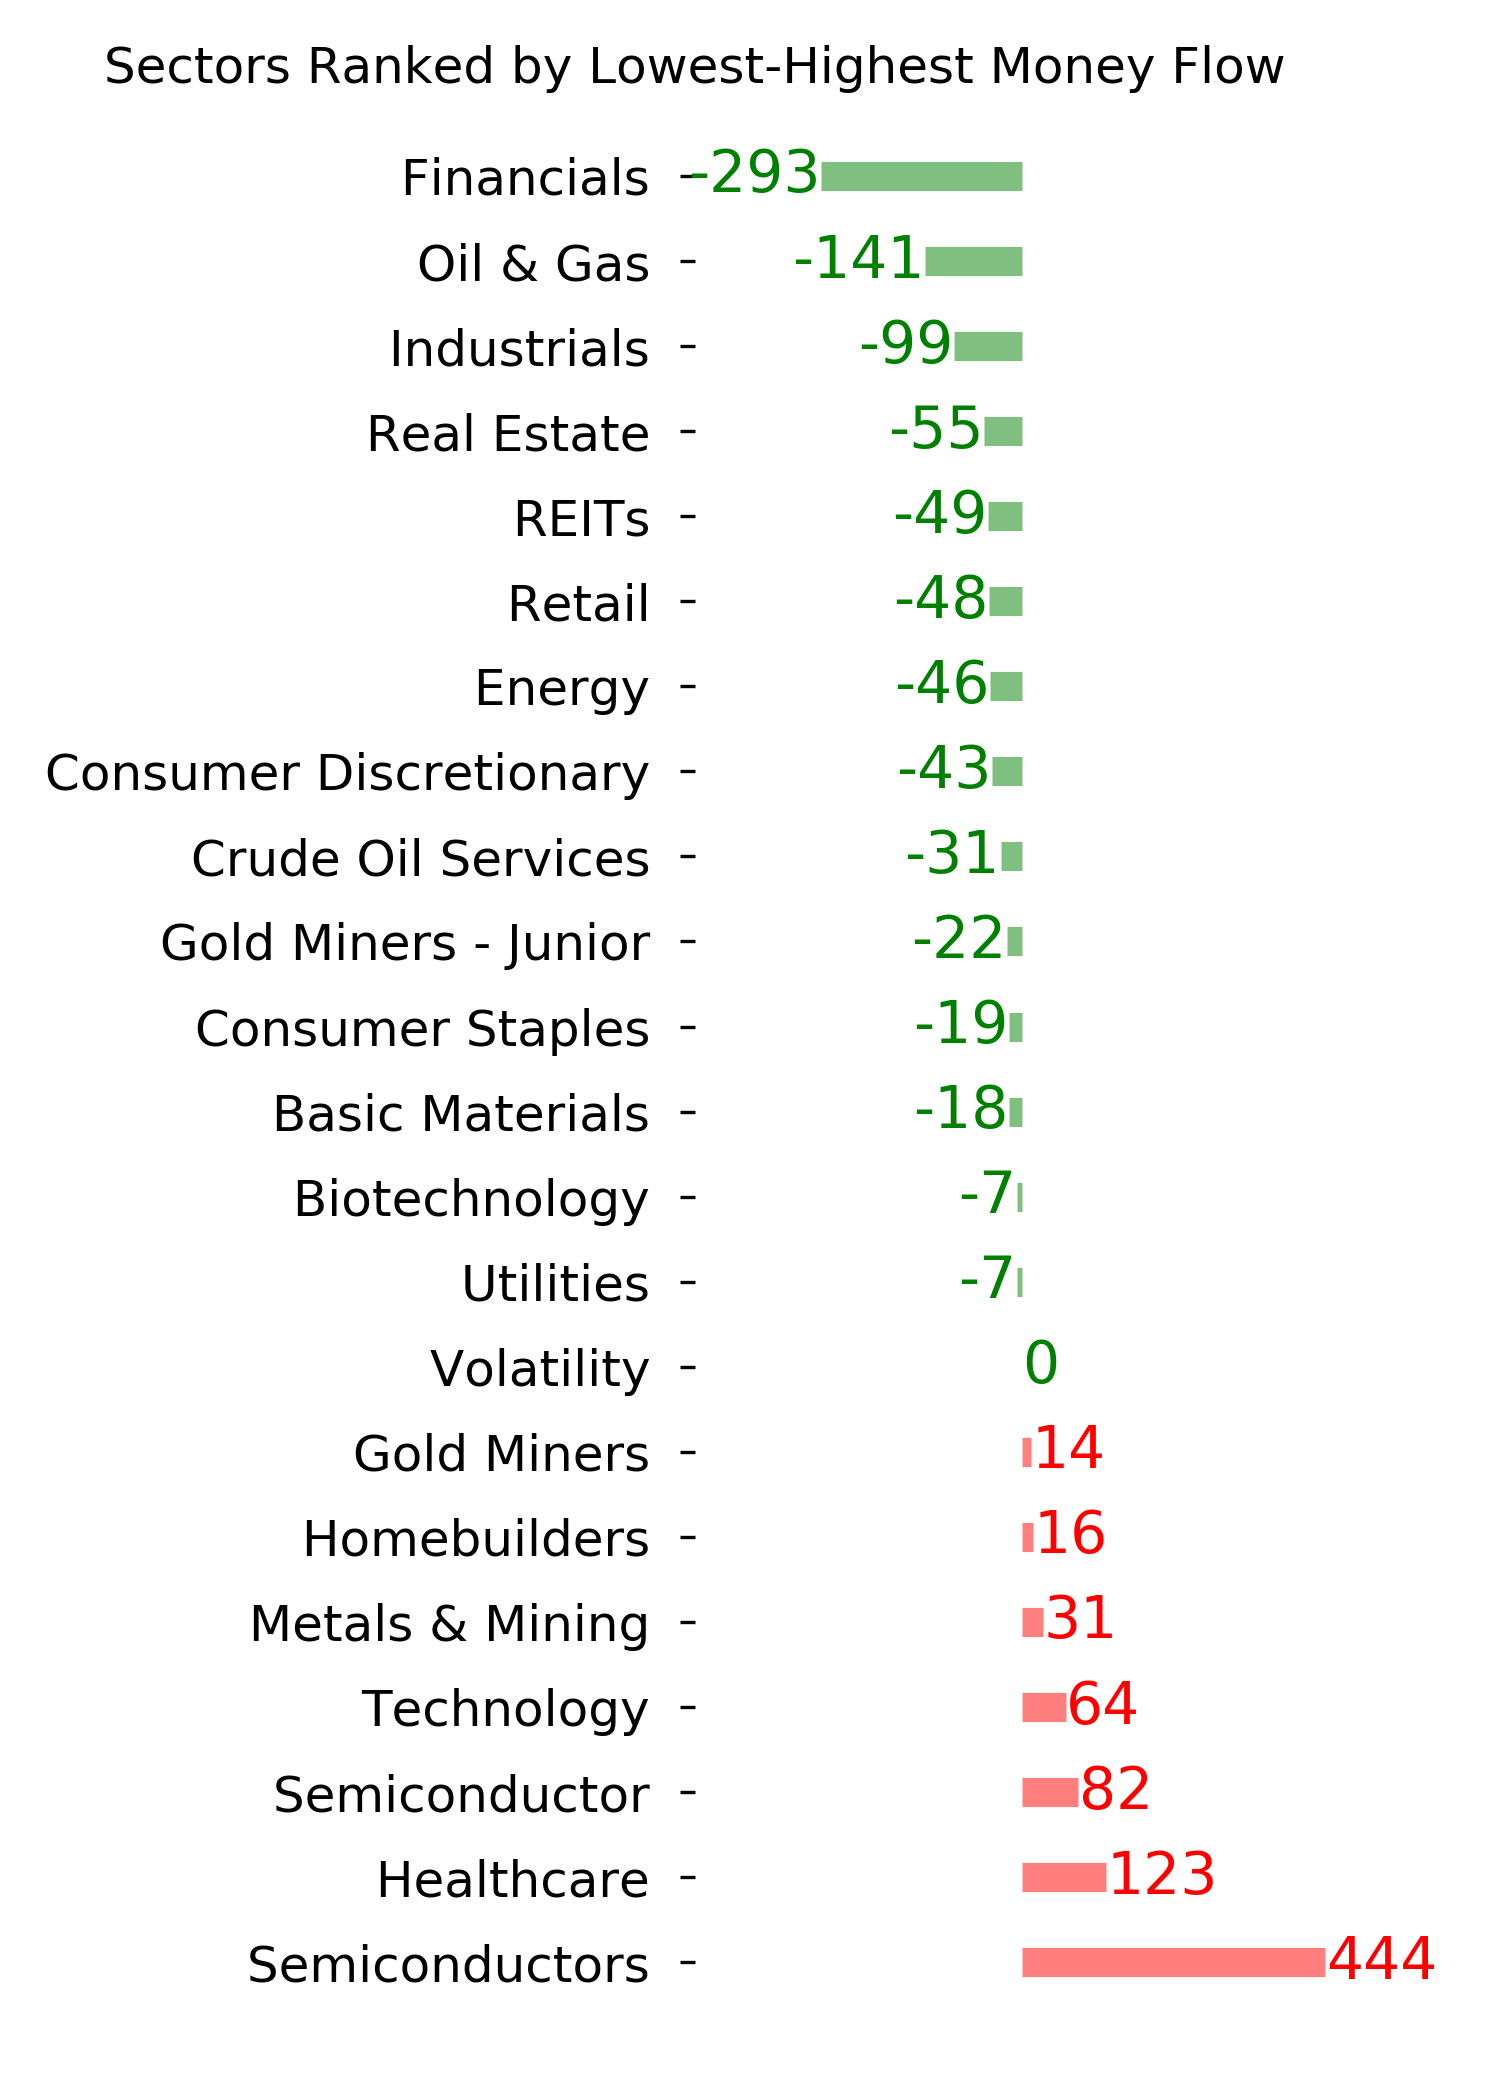
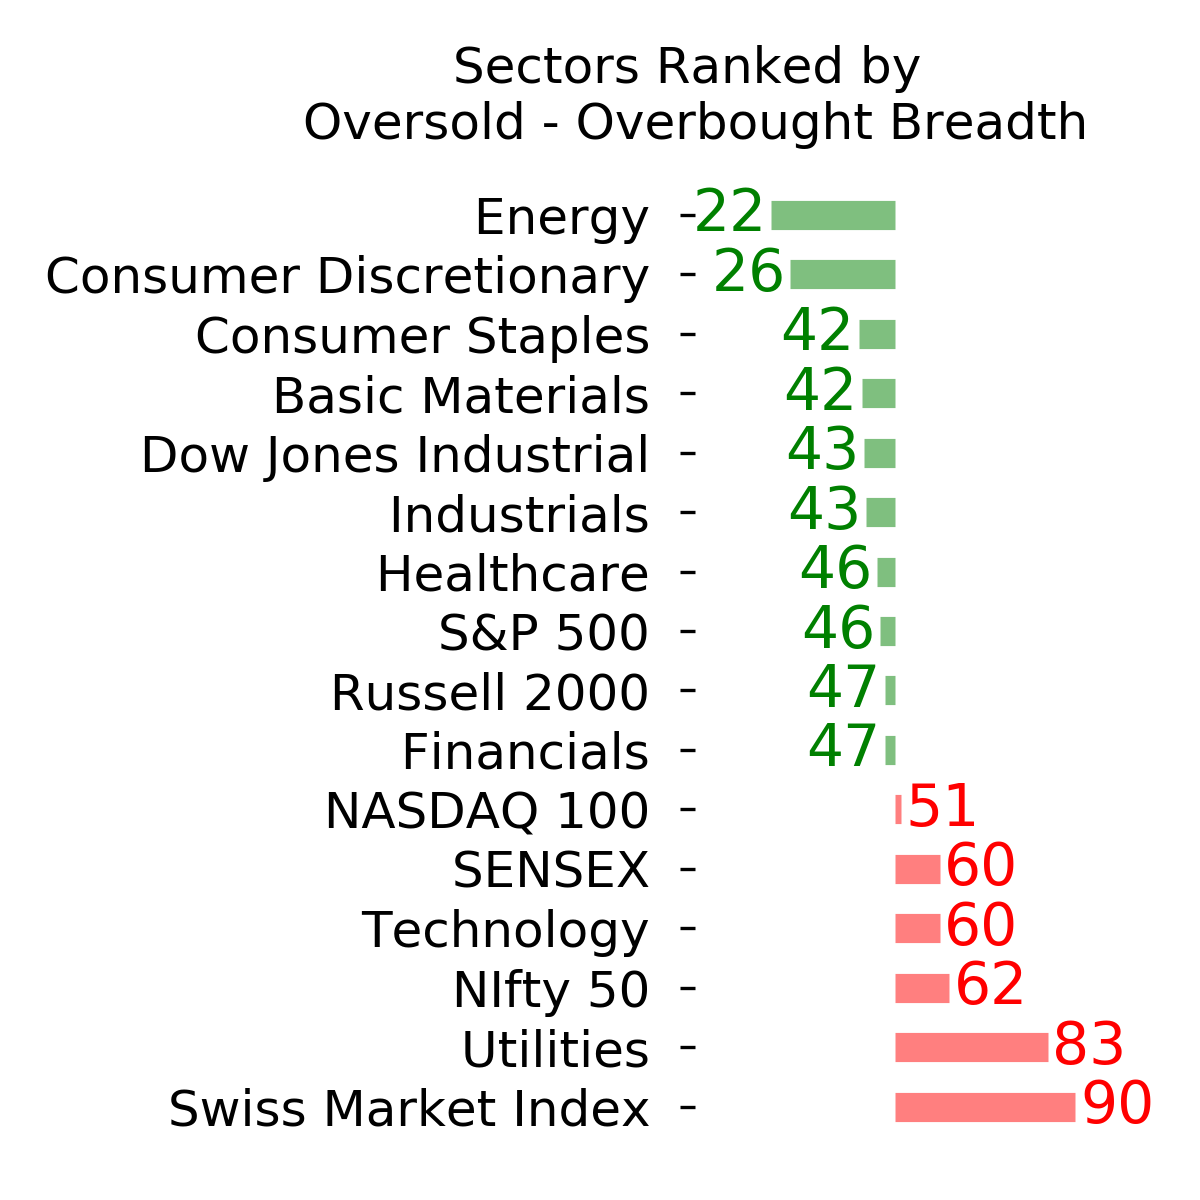
Ranks
|
|
|
|
|
|
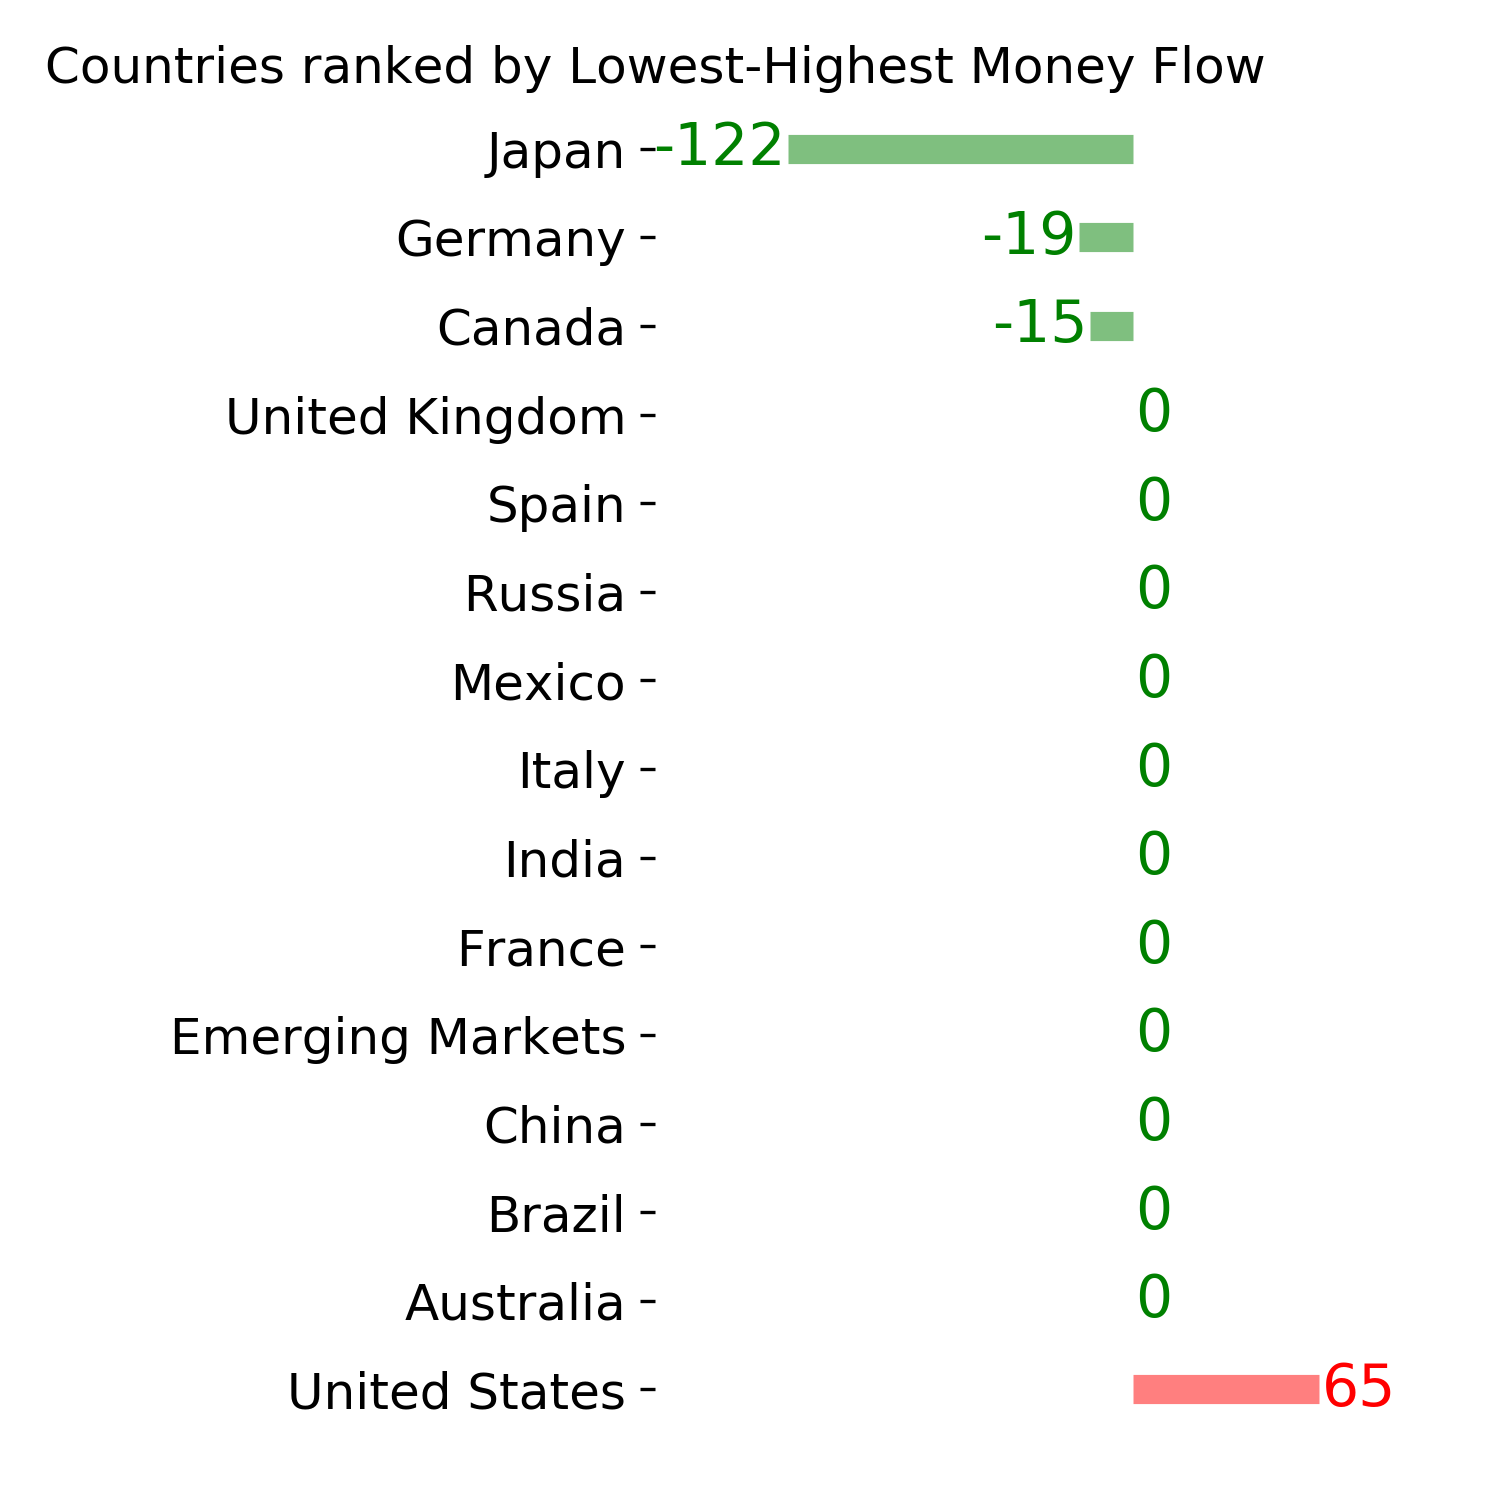
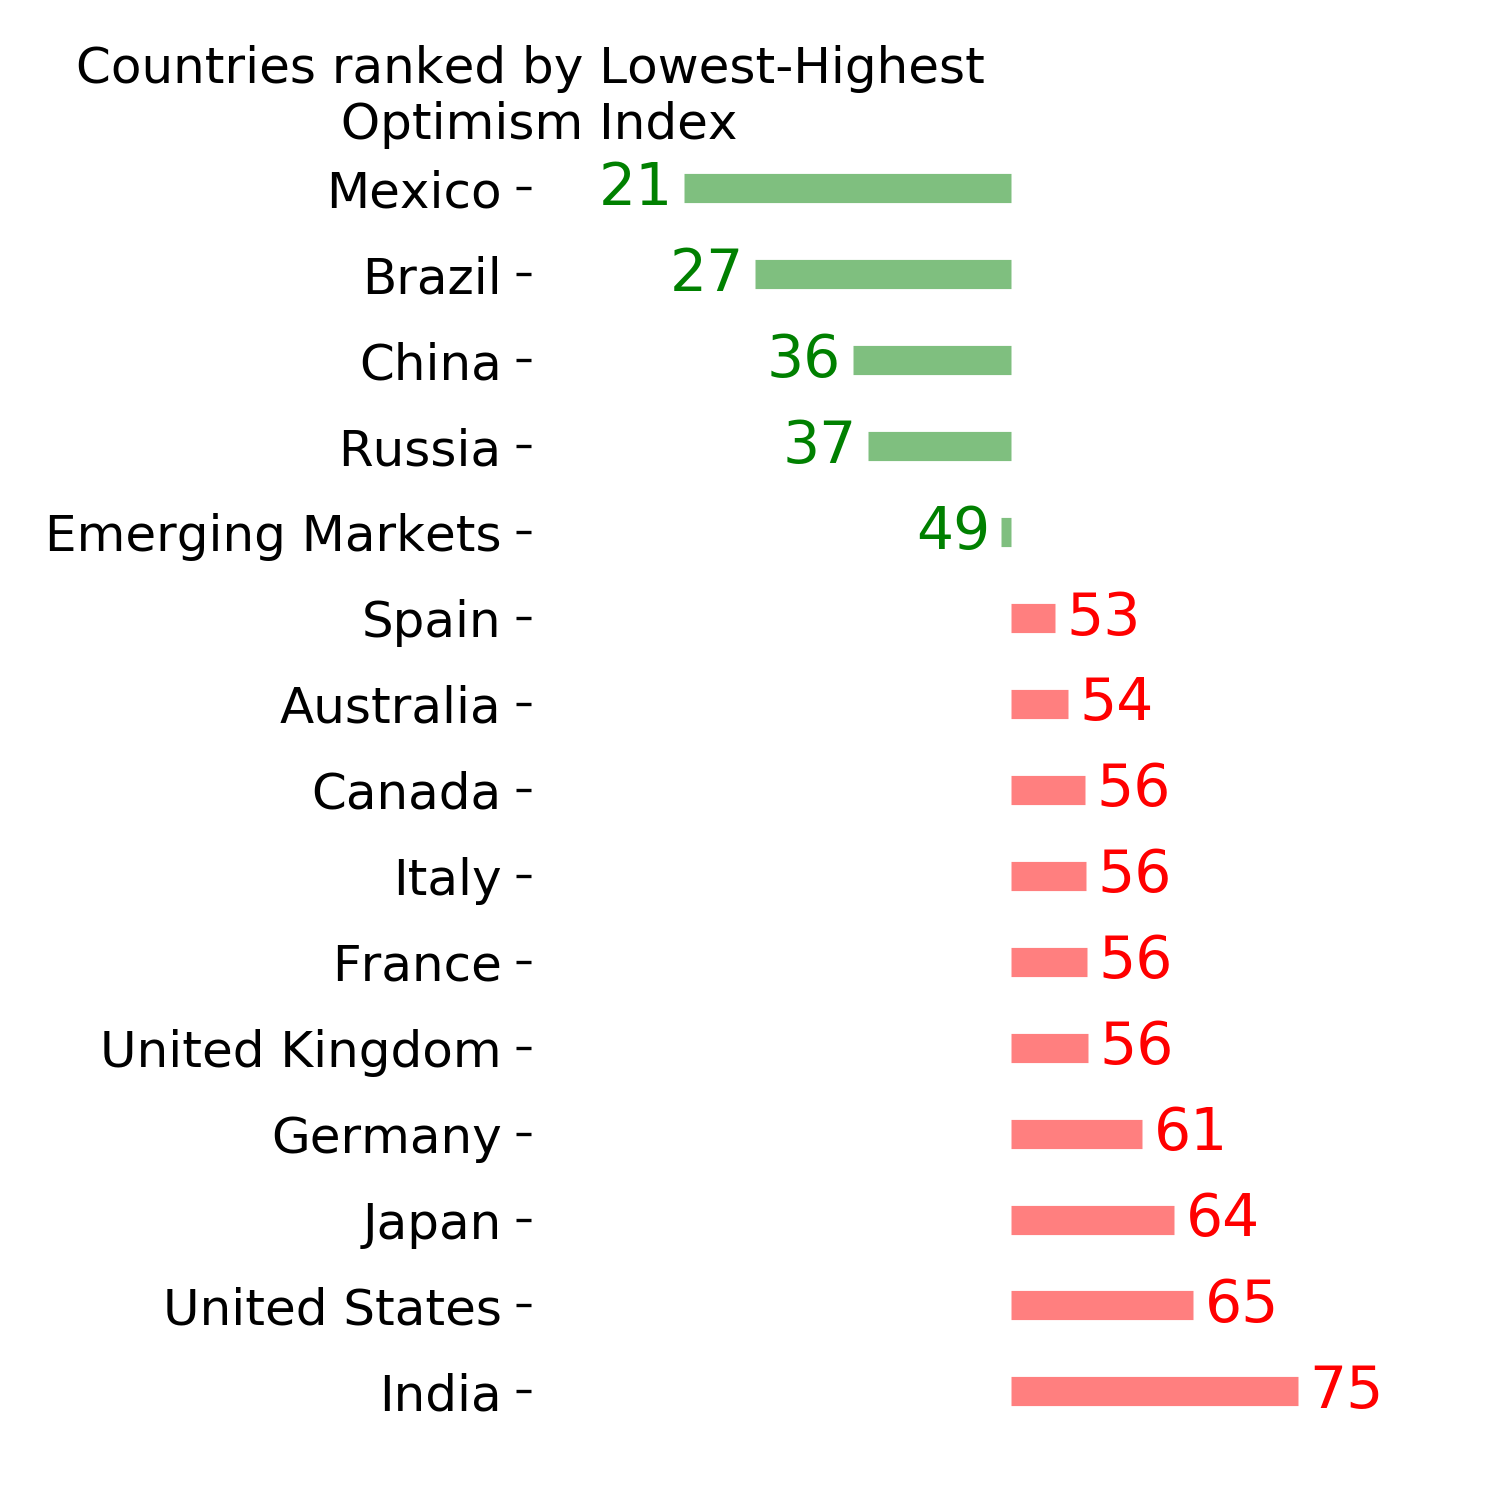
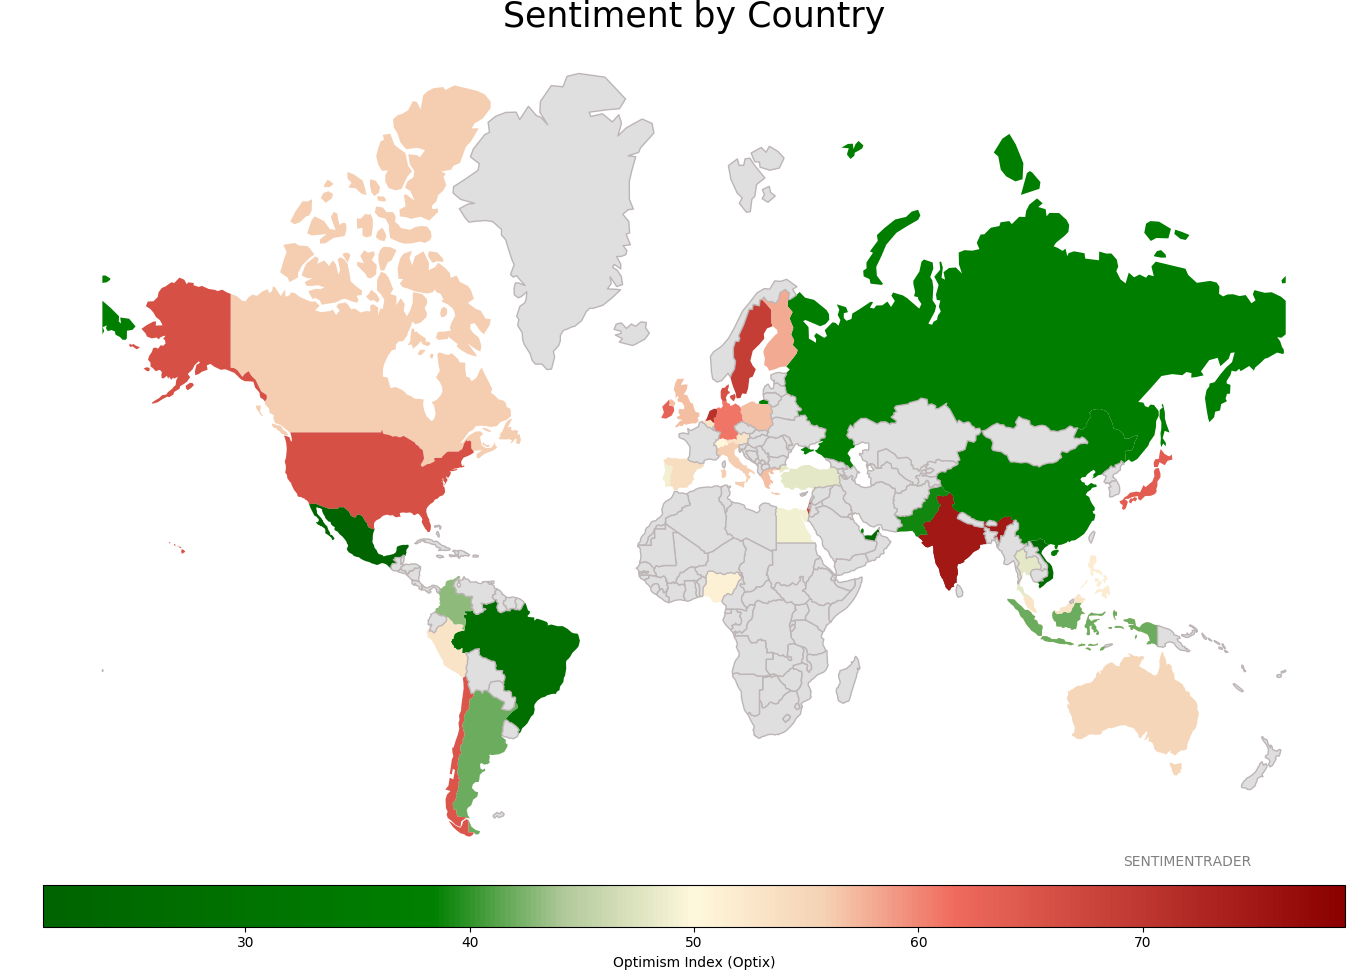
Sentiment Around The World
|
|
|
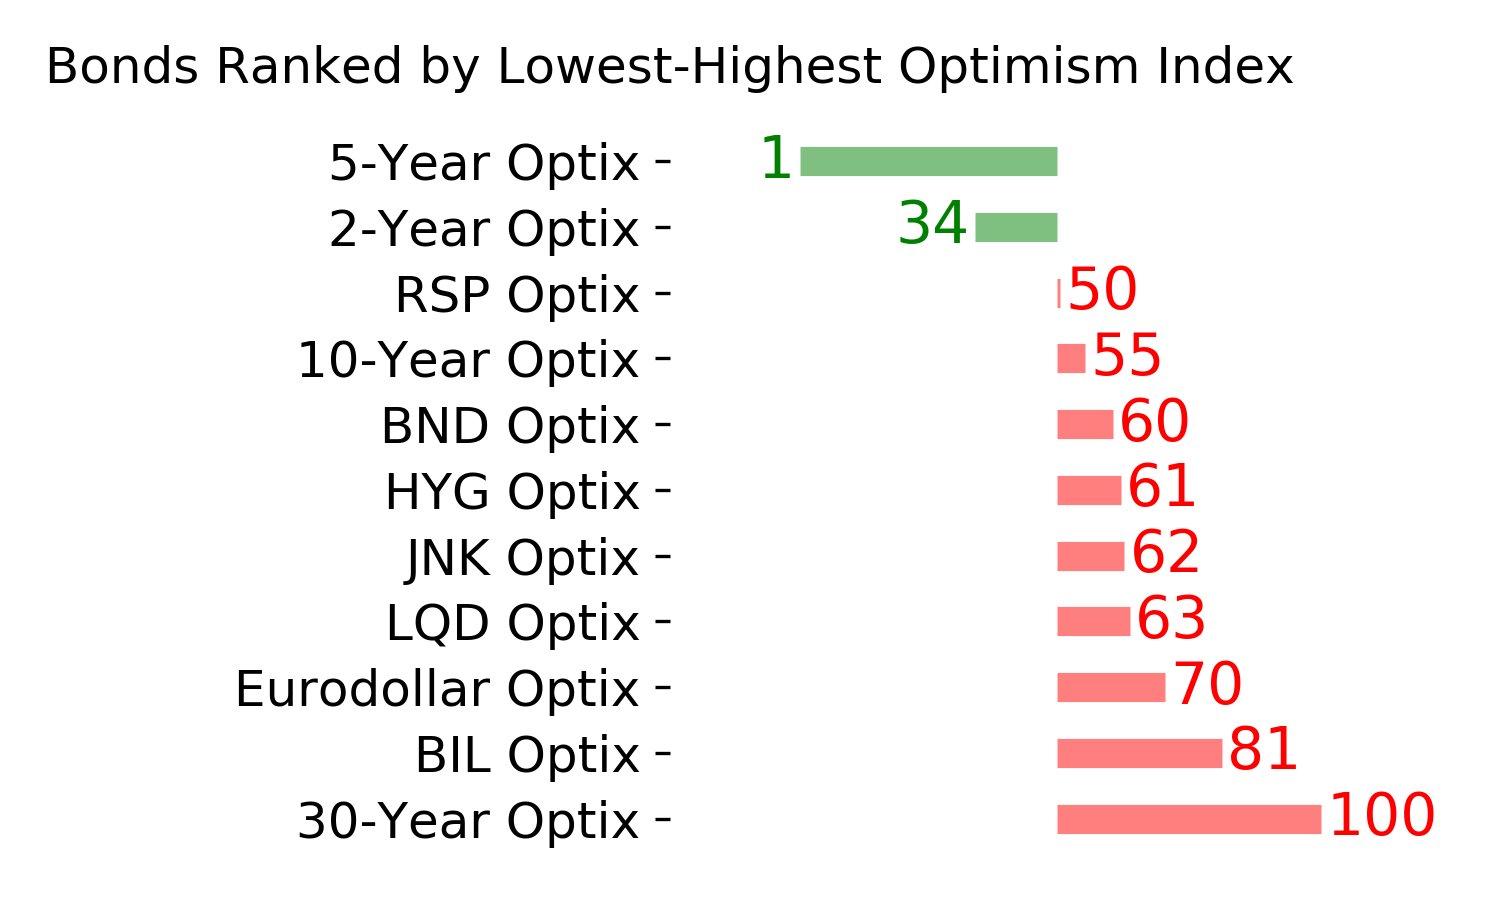
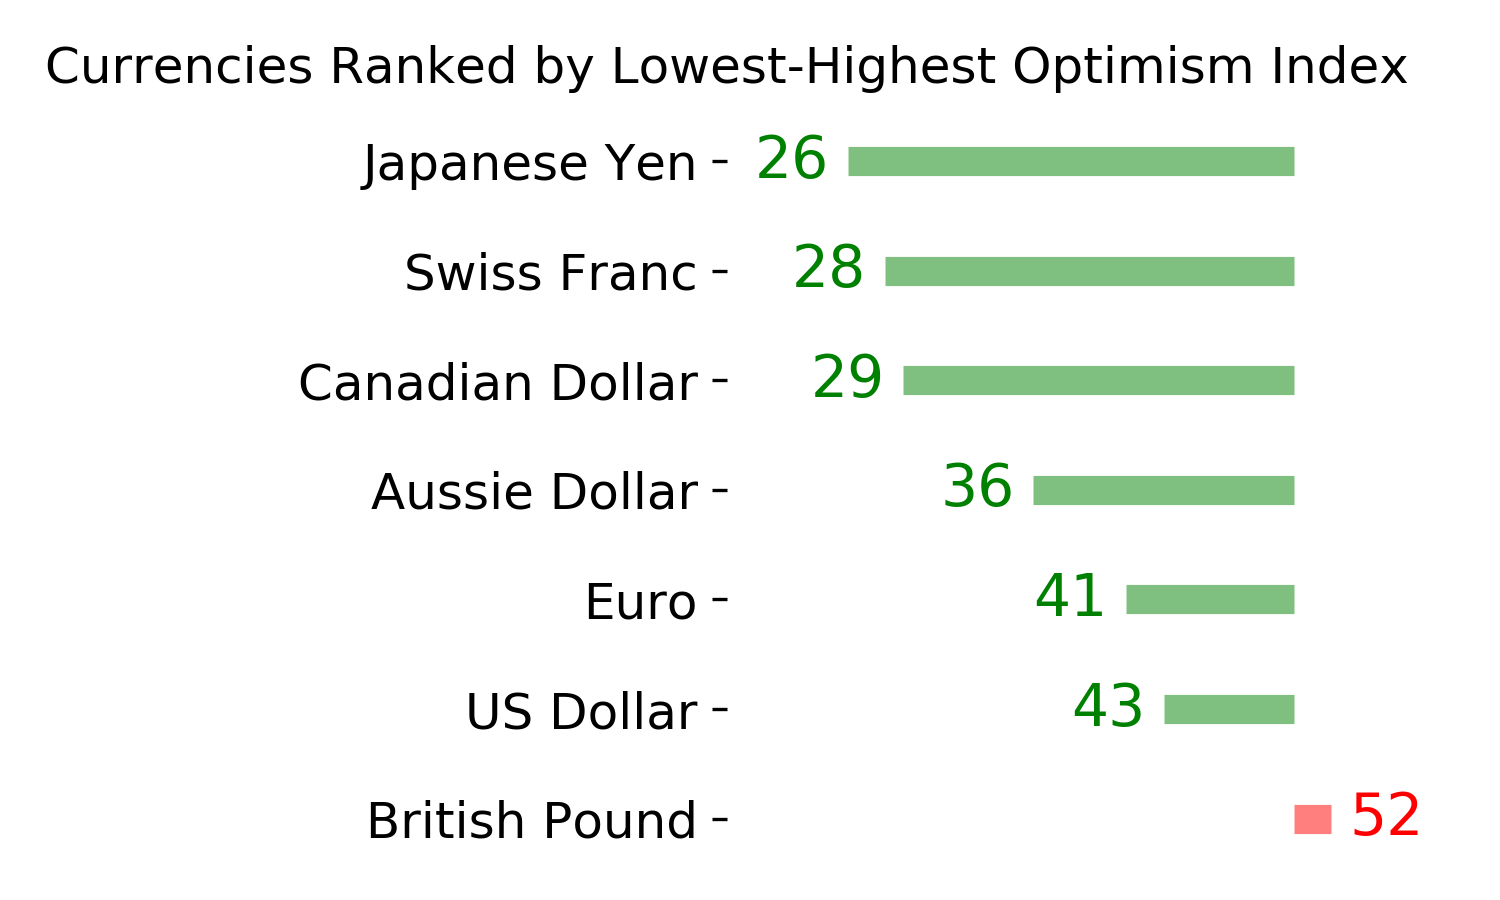
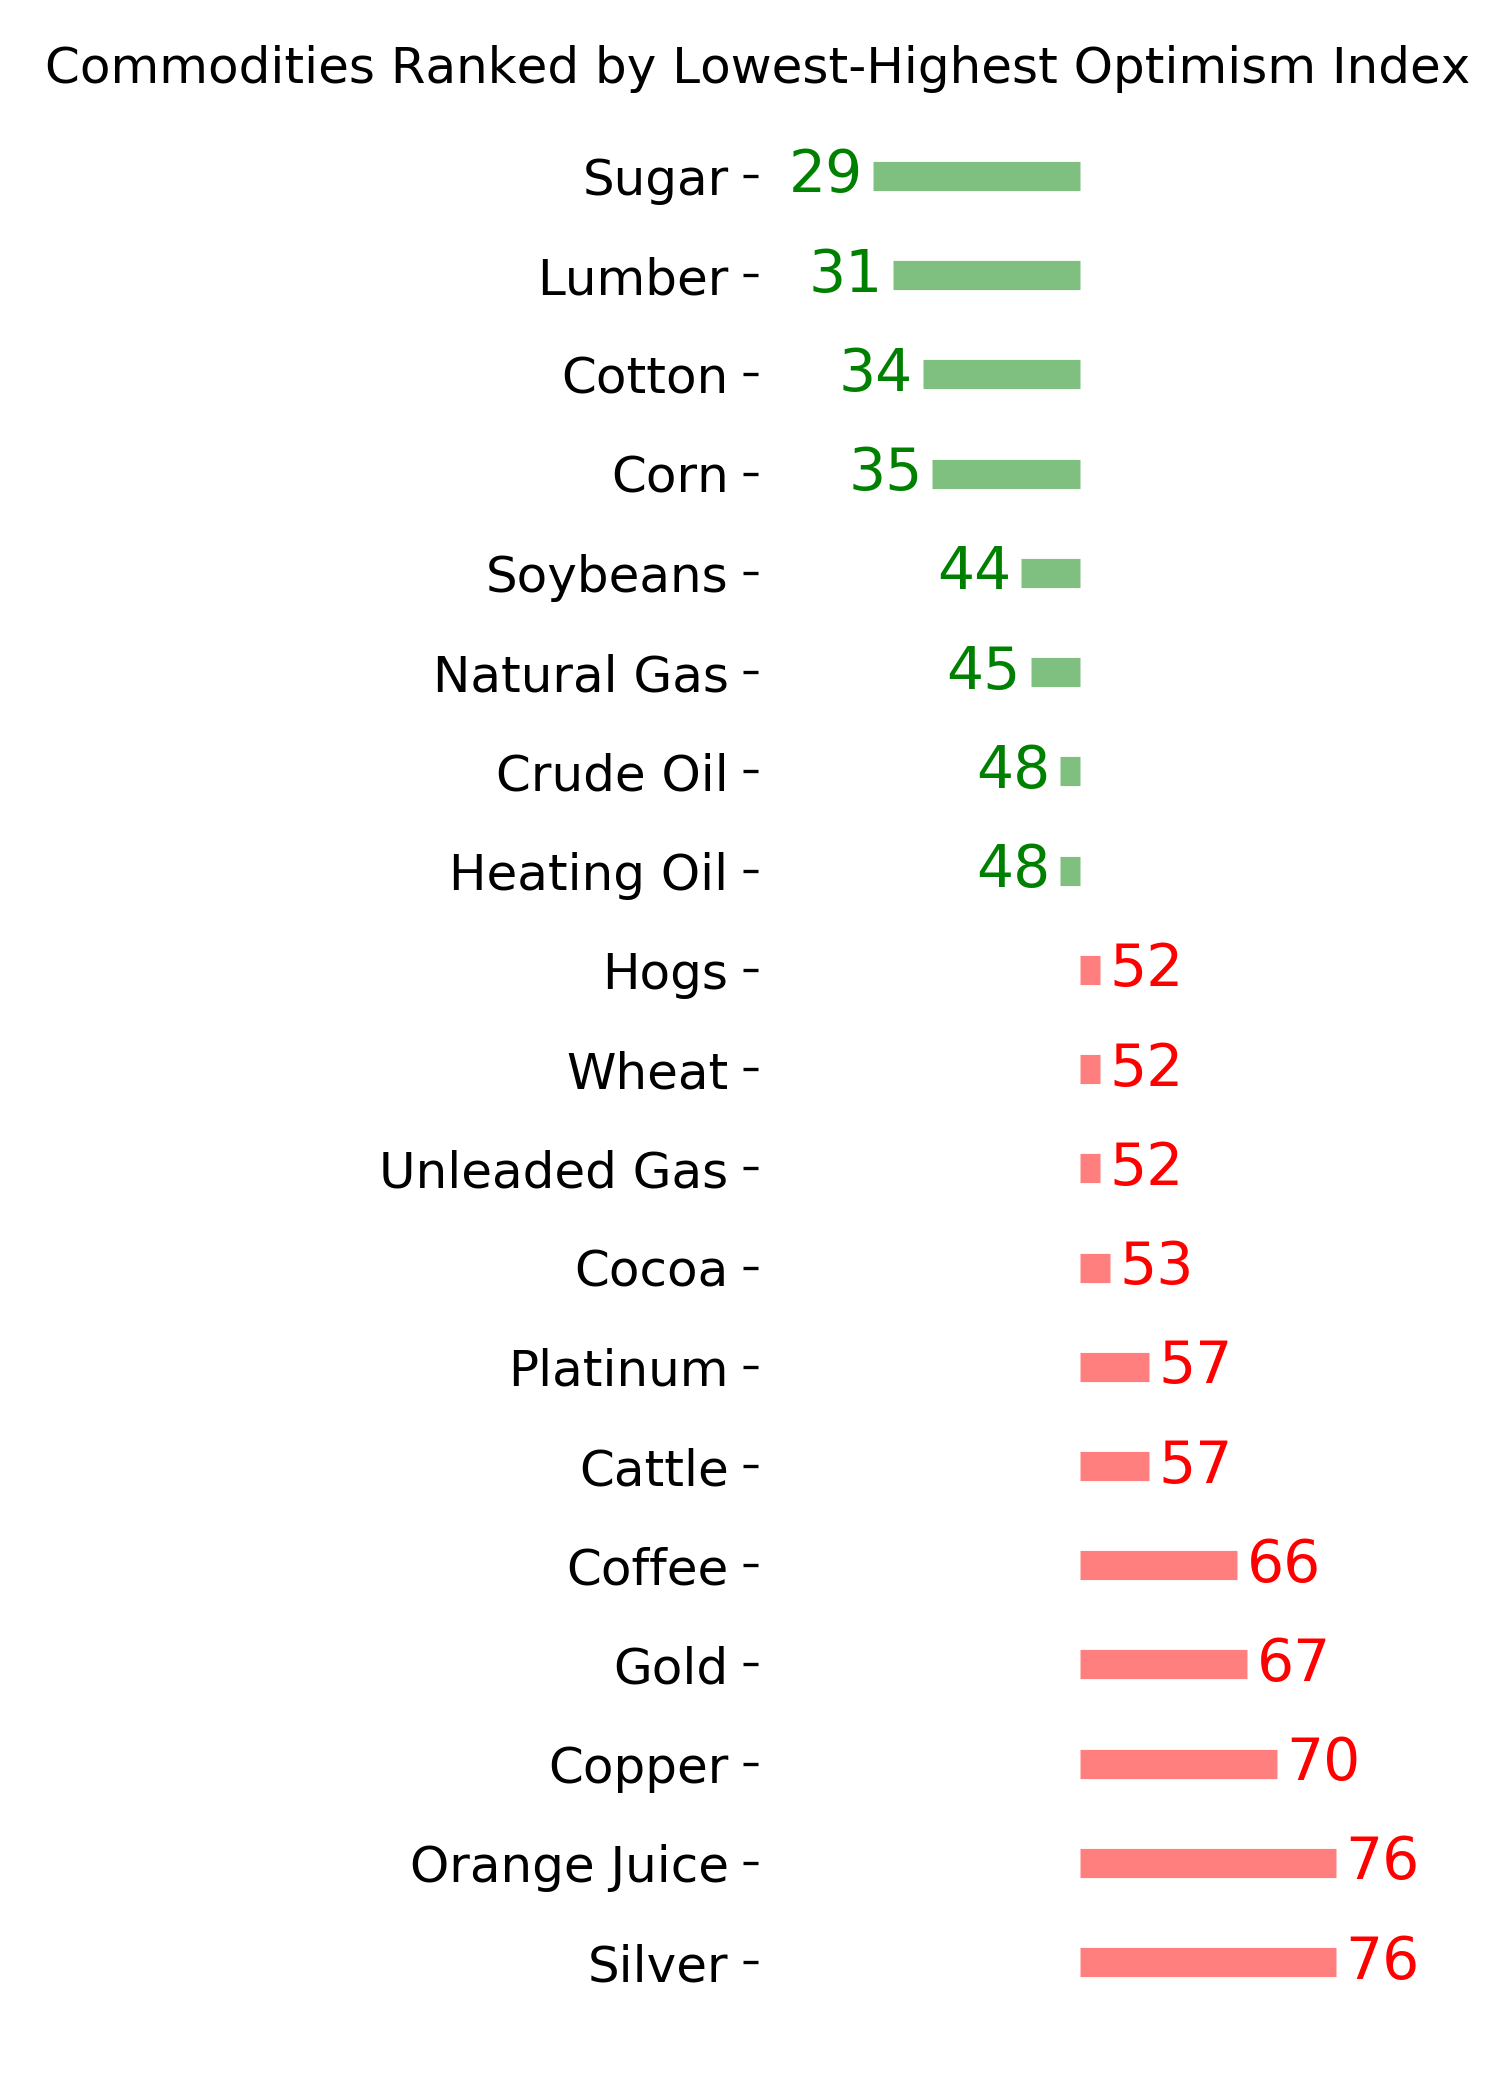
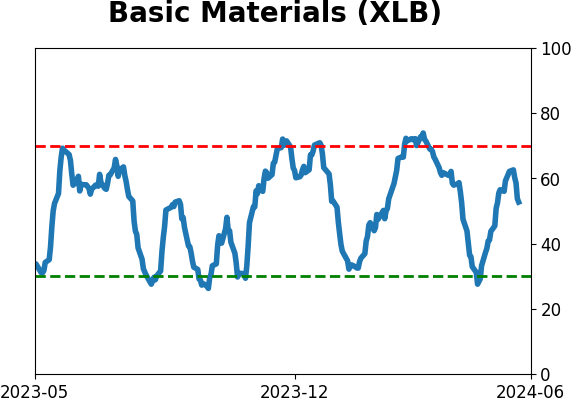
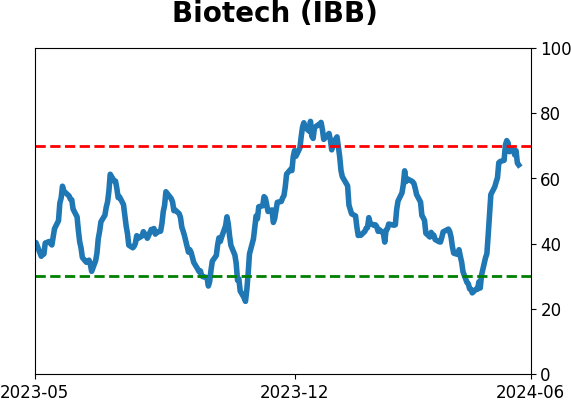
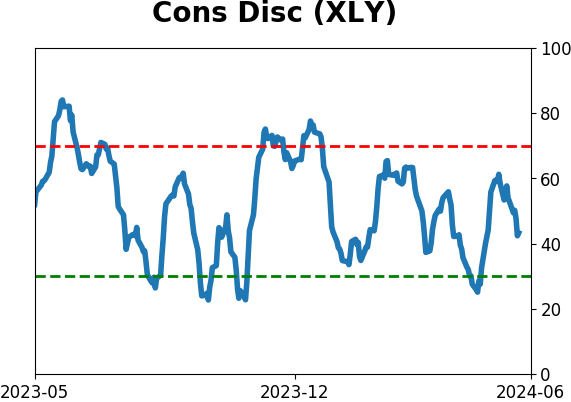
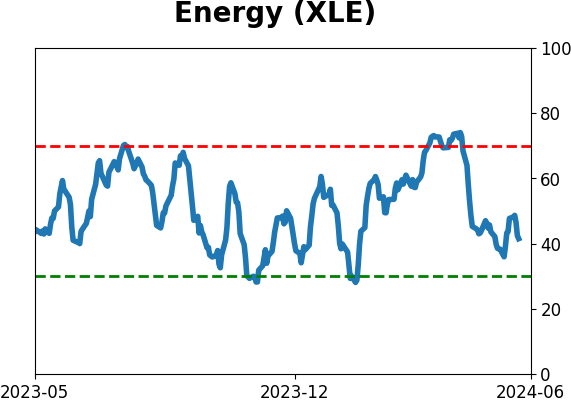
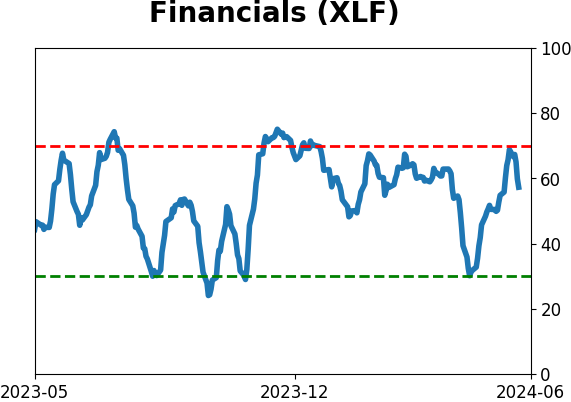
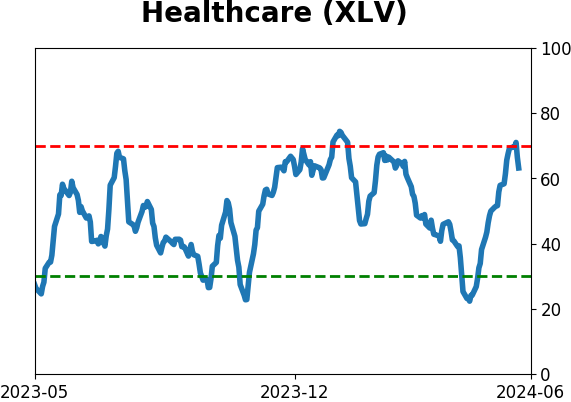
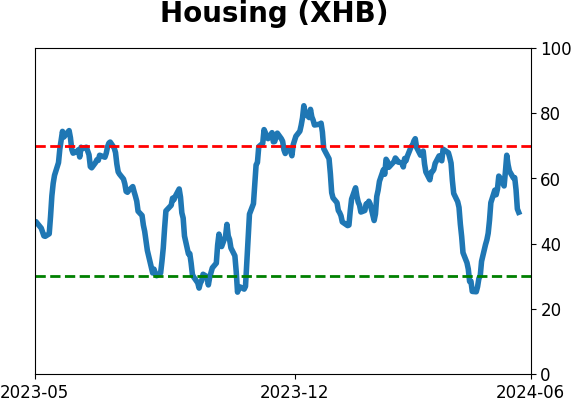
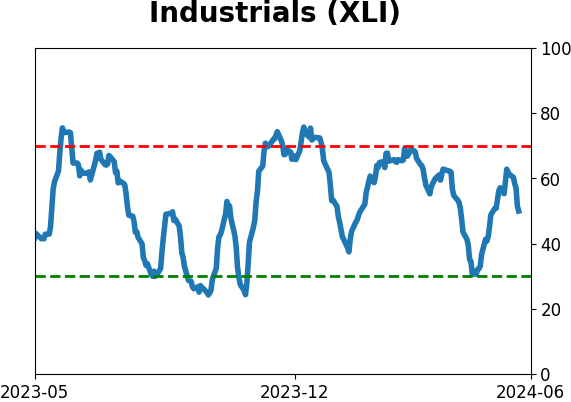
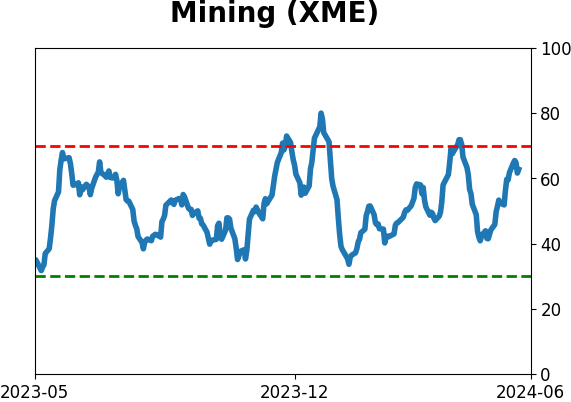
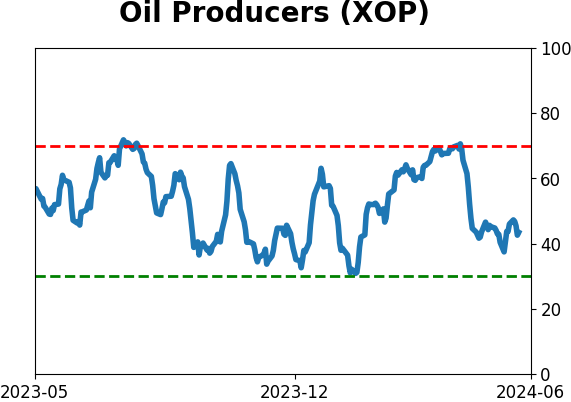
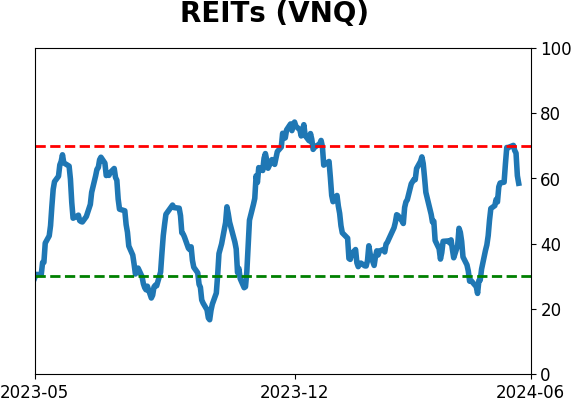
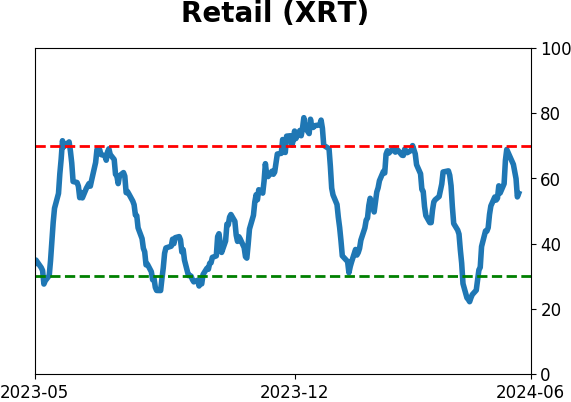
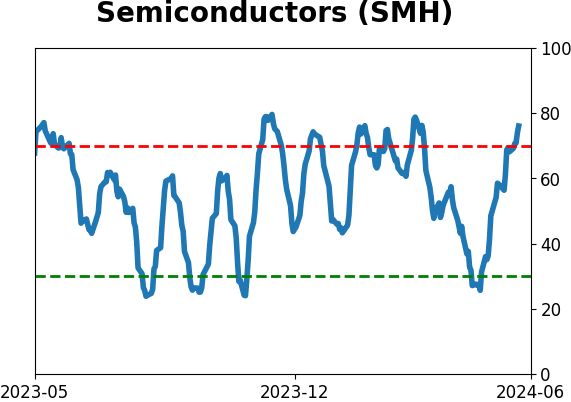
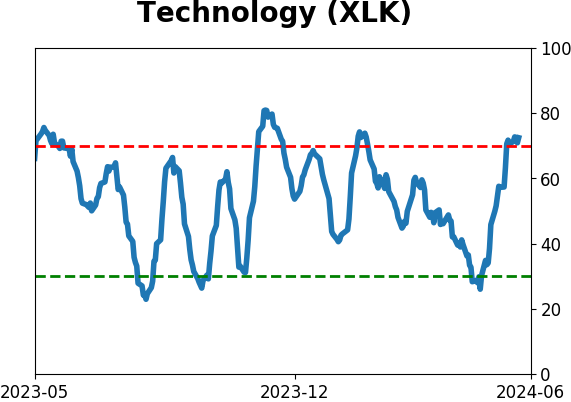
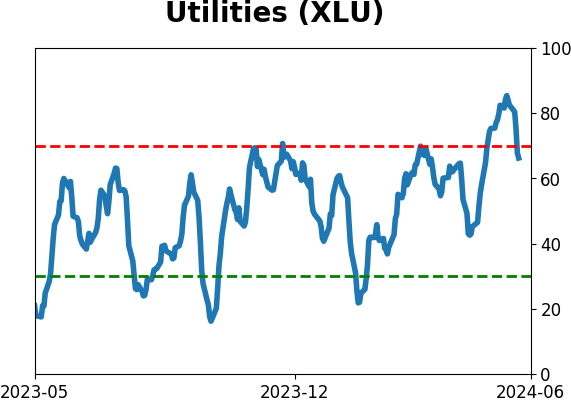
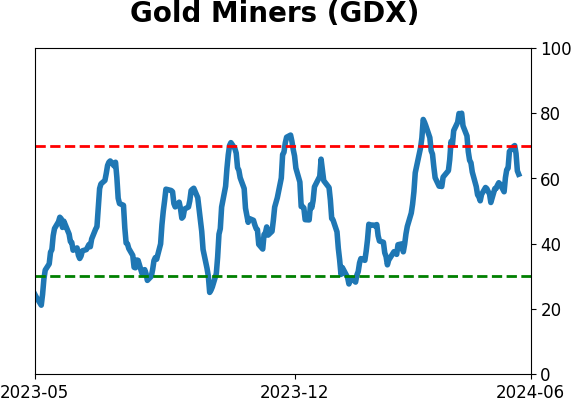
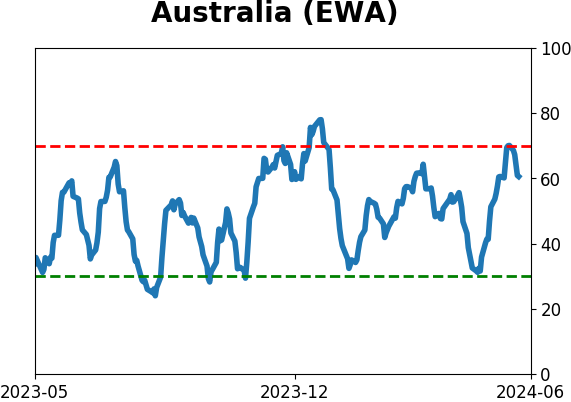
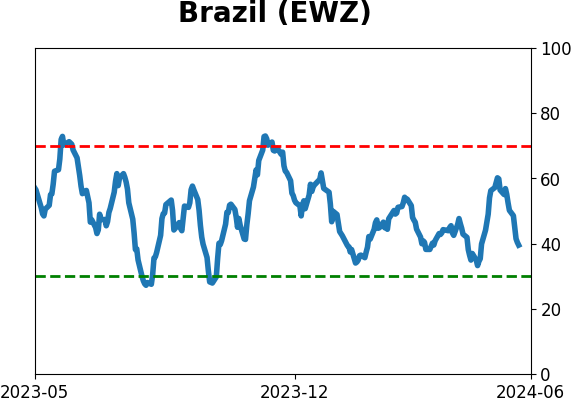
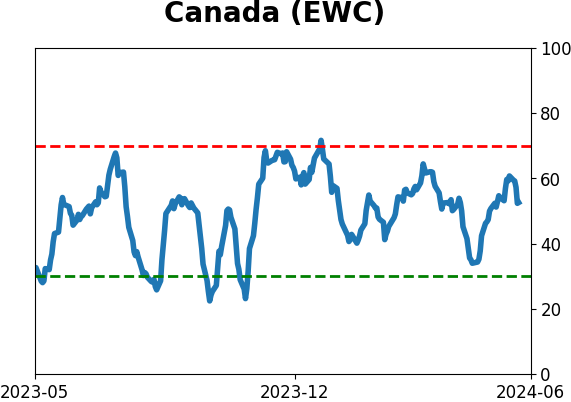
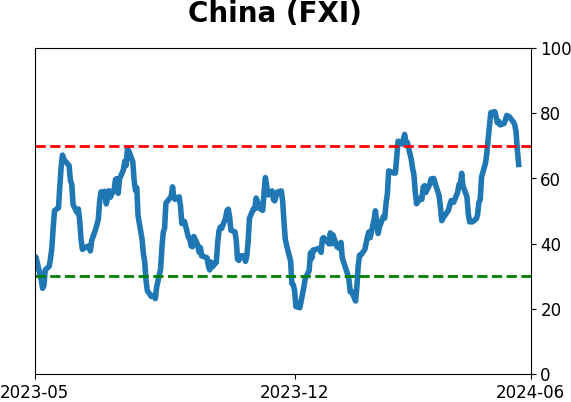
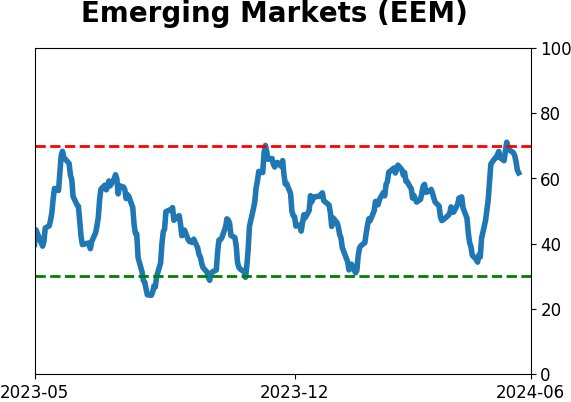
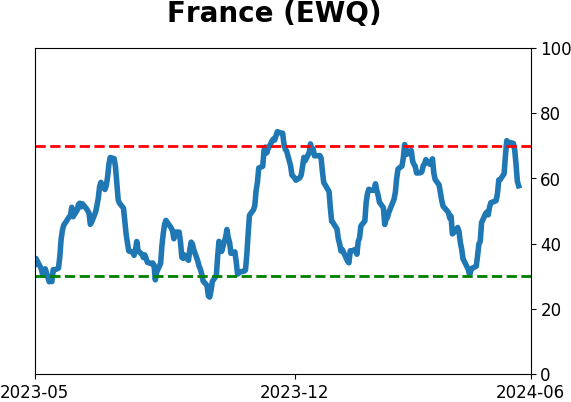
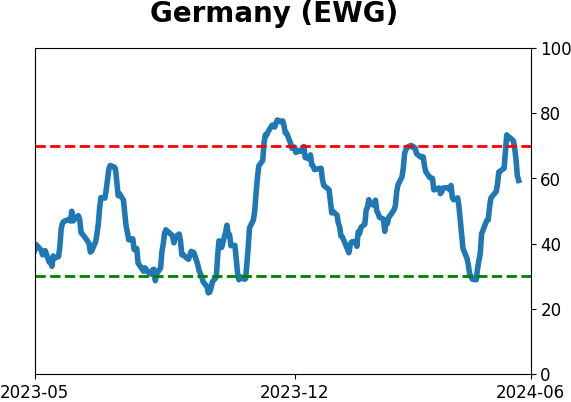
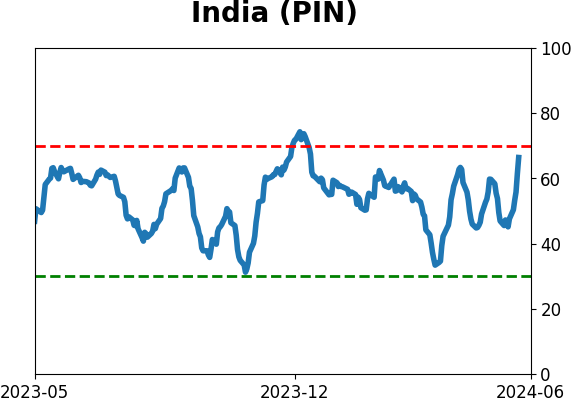
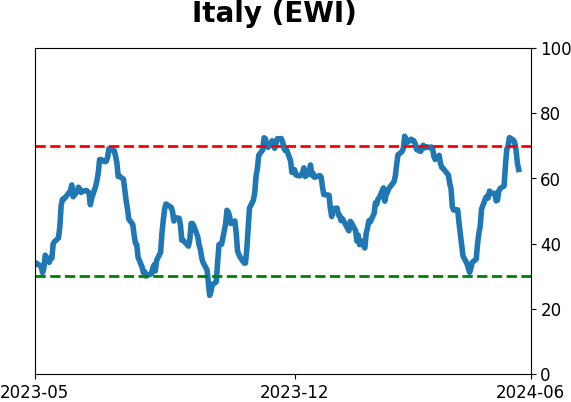
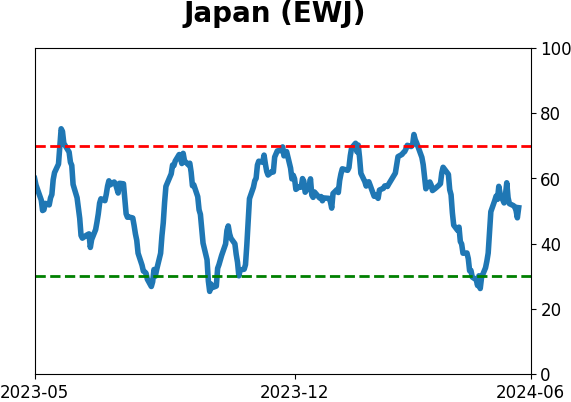
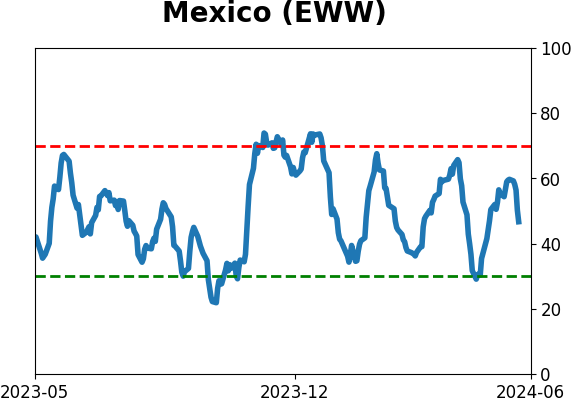
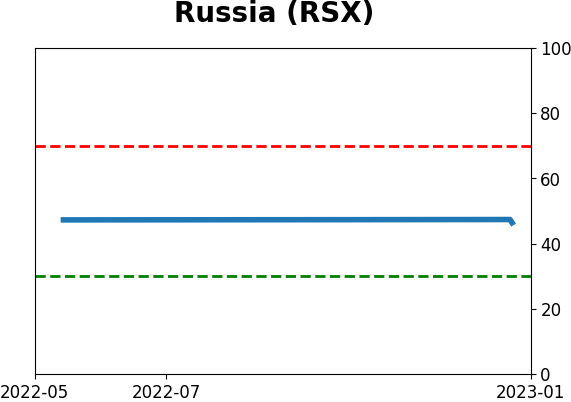
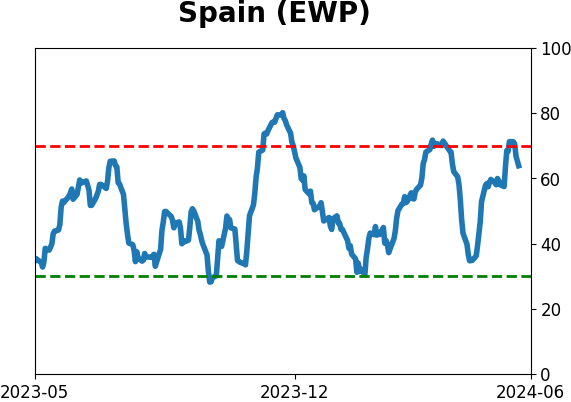
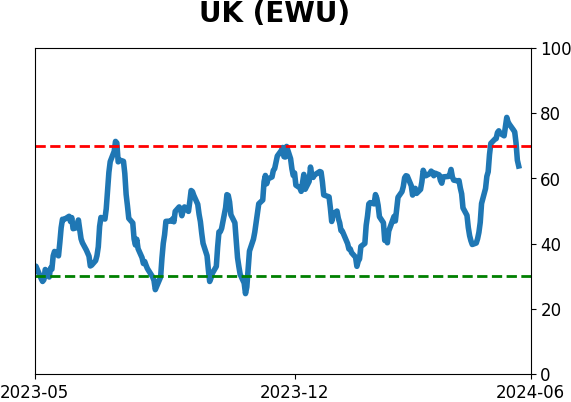
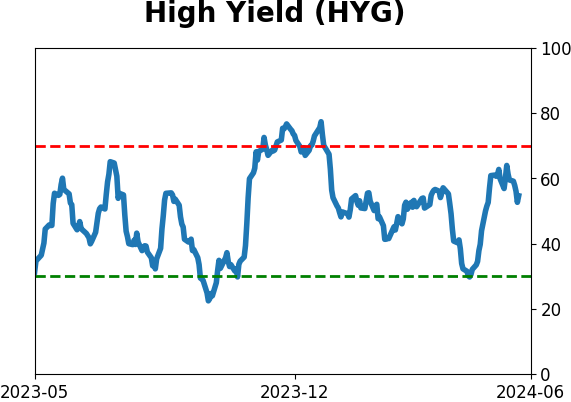
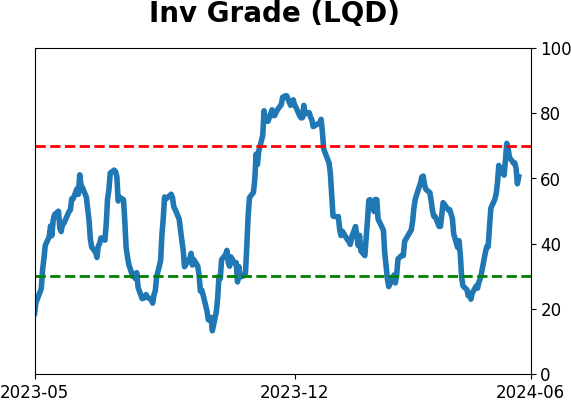
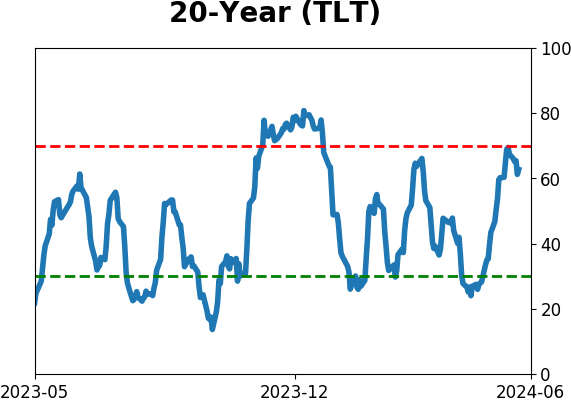
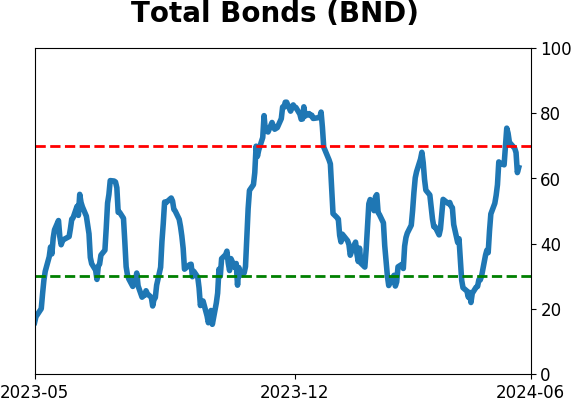
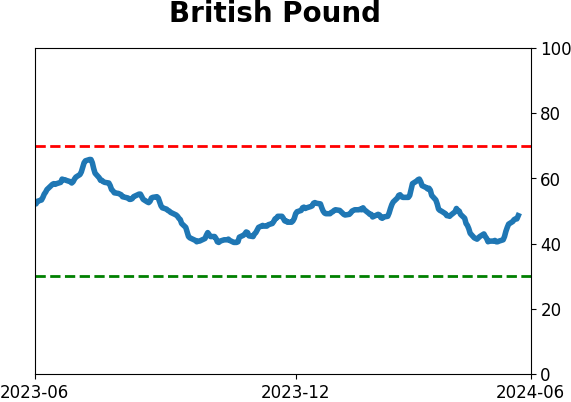
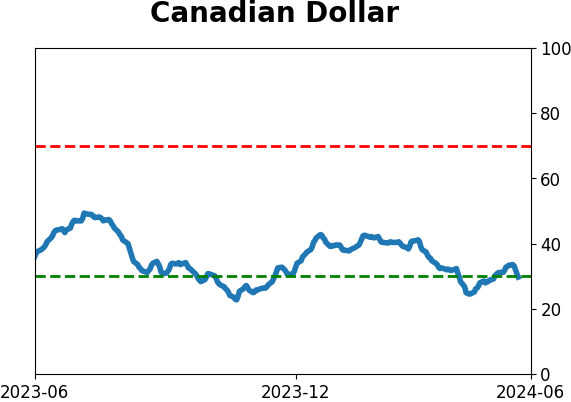
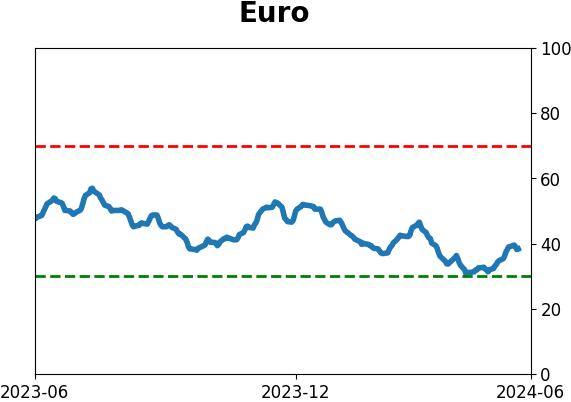
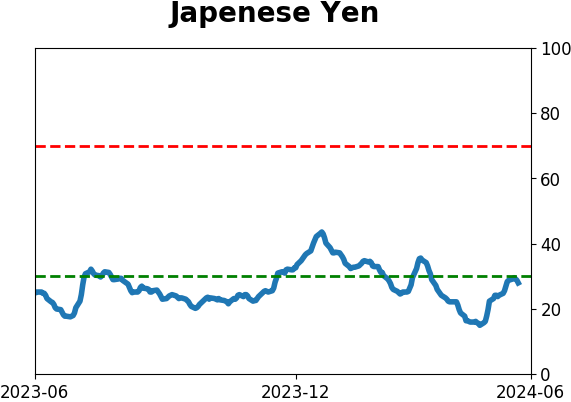
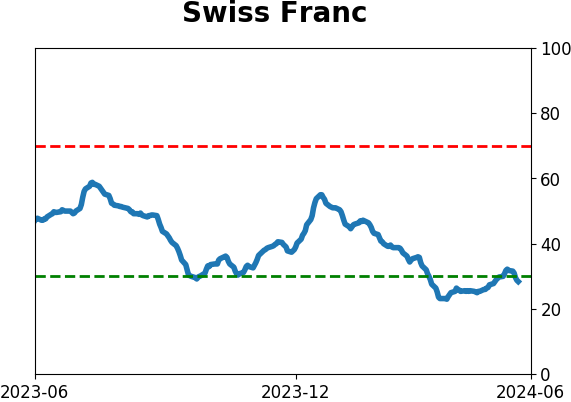
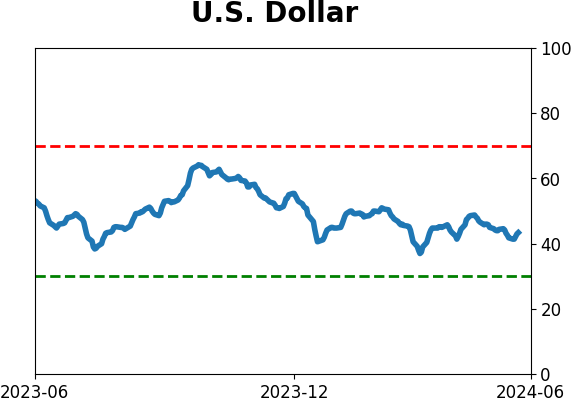
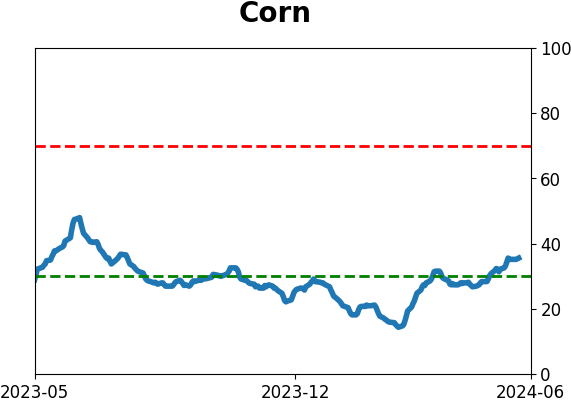
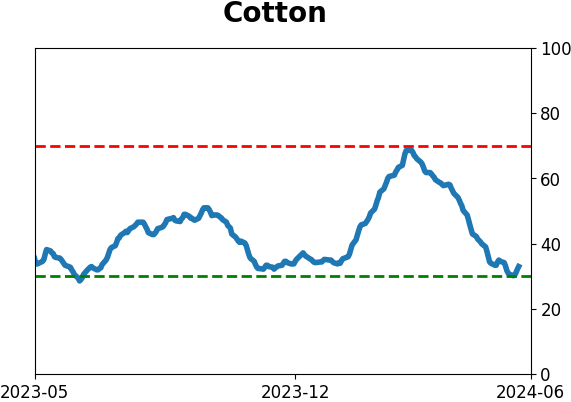
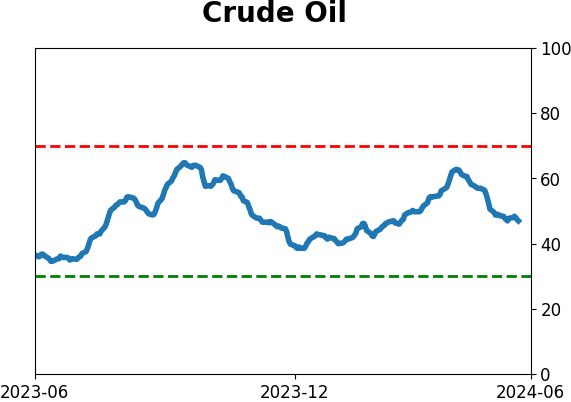
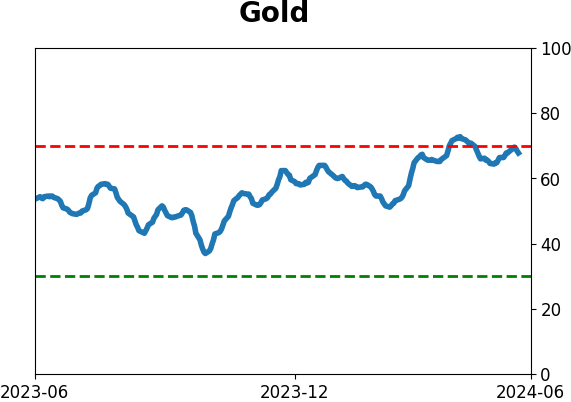
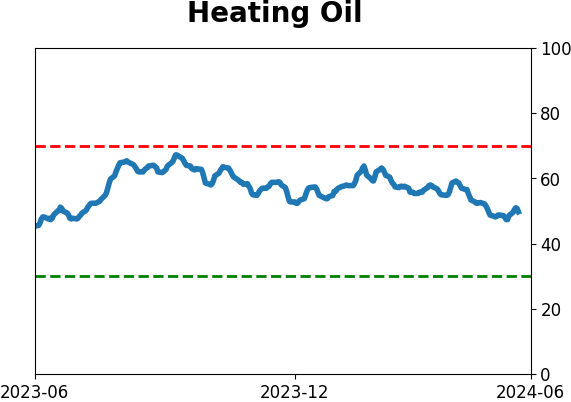
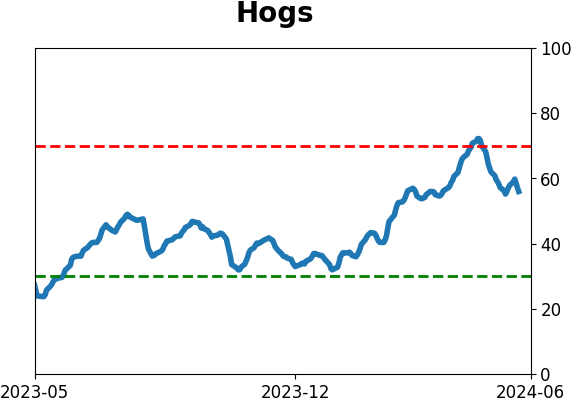
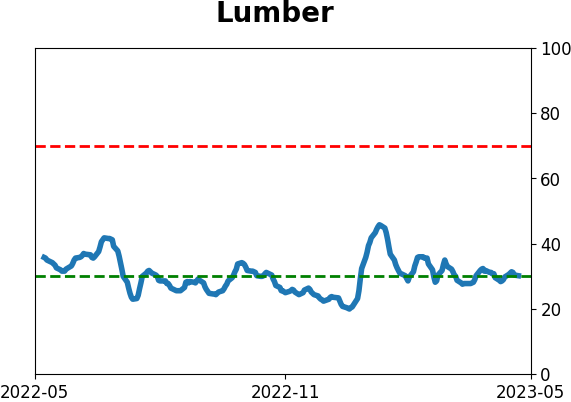
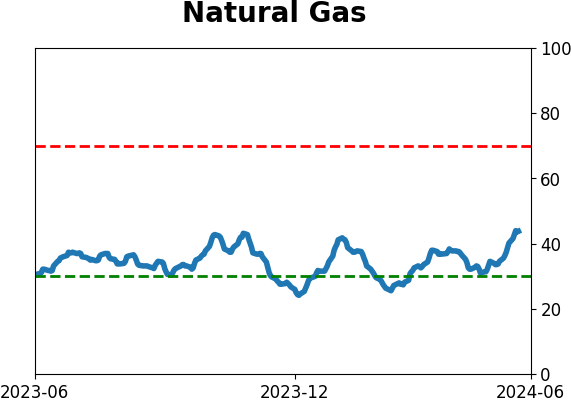
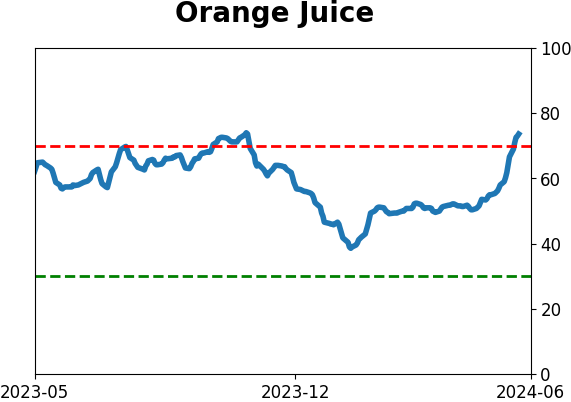
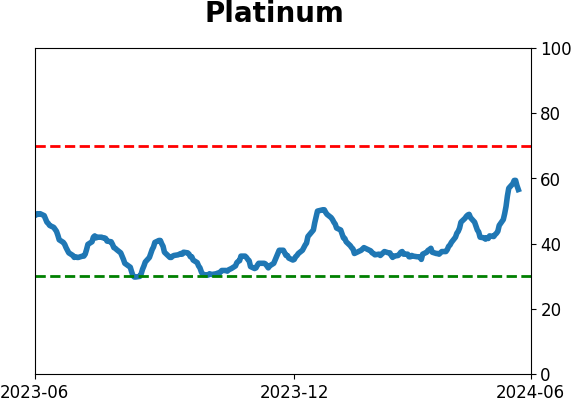
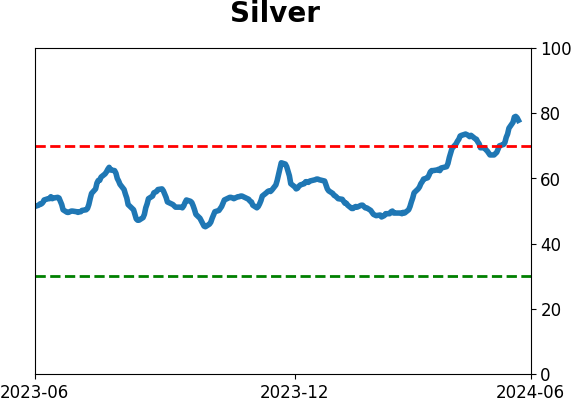
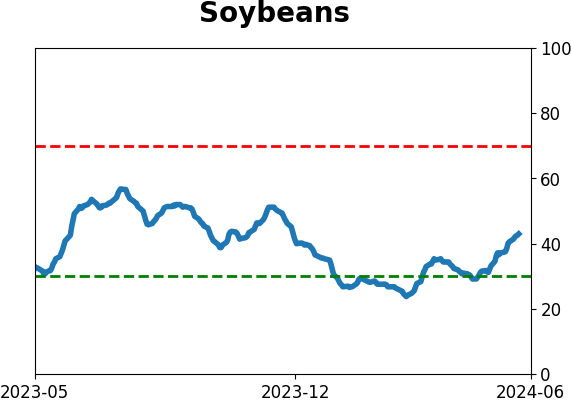
Optimism Index Thumbnails
|
|
|
|
|
|
|
|
|
|
|
|
|
|
|
|
|
|
|
|
|