Headlines
|
|
Yields pop and stocks drop:
Stocks in interest rate-sensitive sectors like Consumer Staples and Utilities plunged in the last few weeks as rates increased to multi-month highs. The decline pushed a breadth-based indicator that measures oversold conditions to an extreme for both groups, especially relative to the broad market. After similar divergences between defensive sectors and the S&P 500, Consumer Staples and Utilities tend to rally.
|
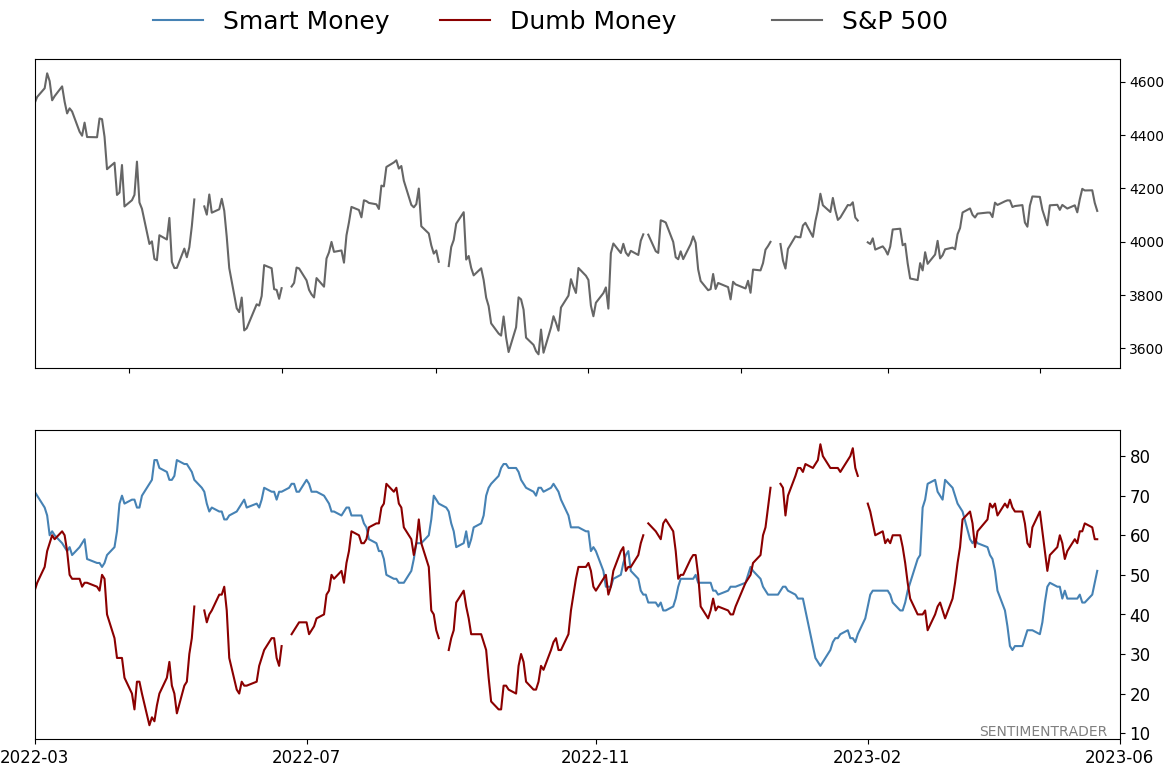
Smart / Dumb Money Confidence
|
Smart Money Confidence: 51%
Dumb Money Confidence: 59%
|
|
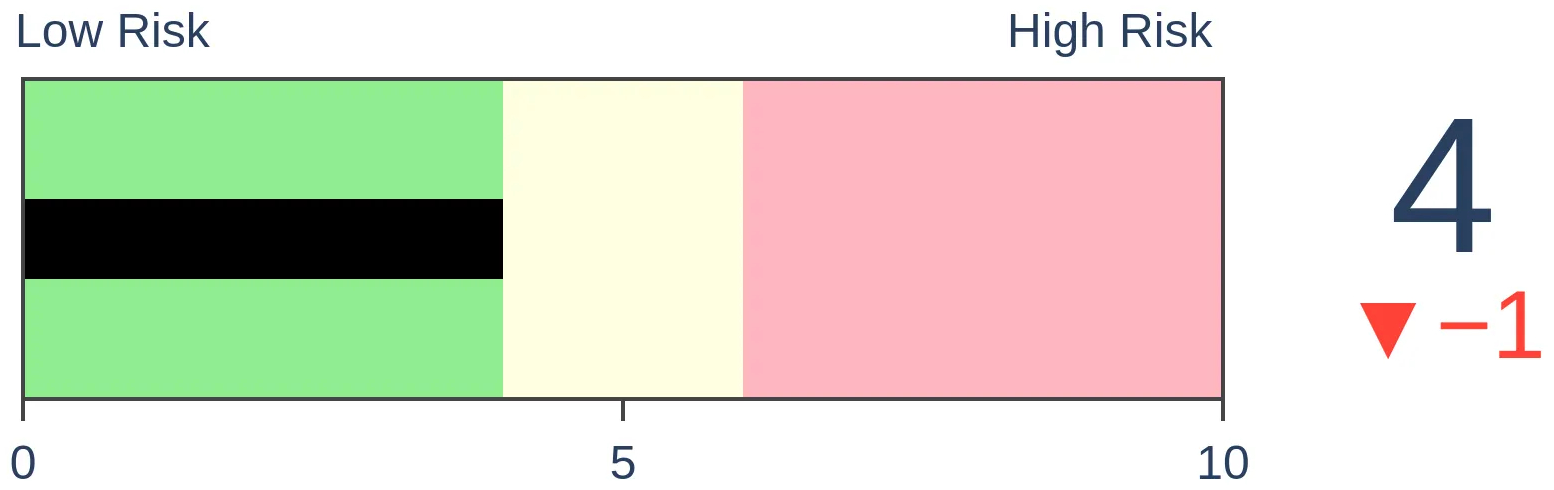
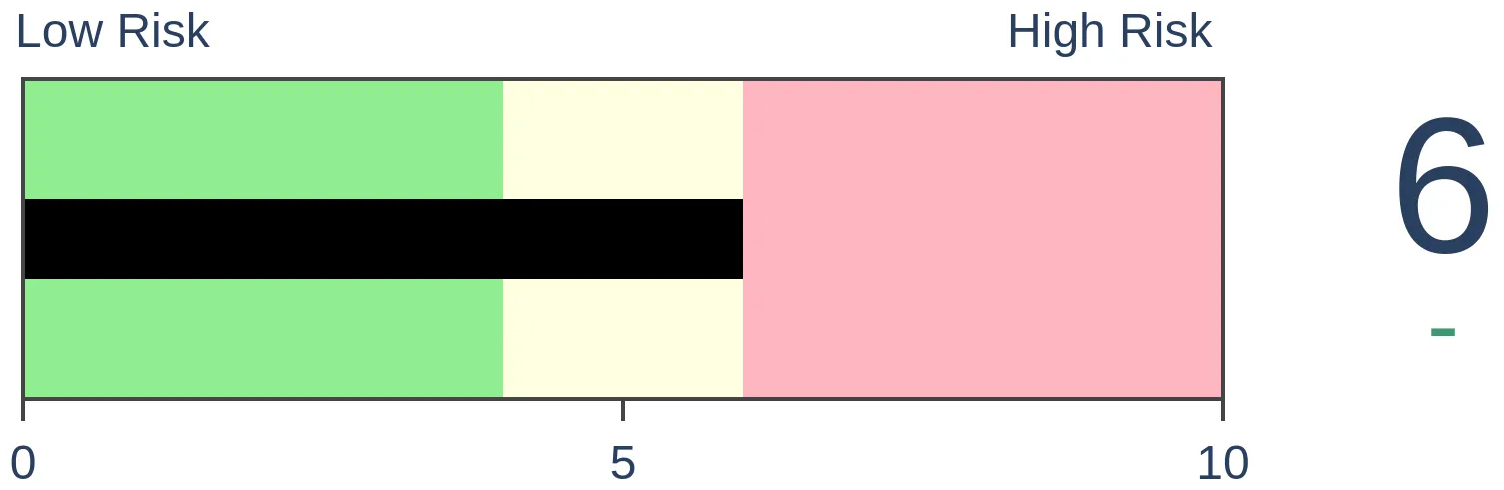
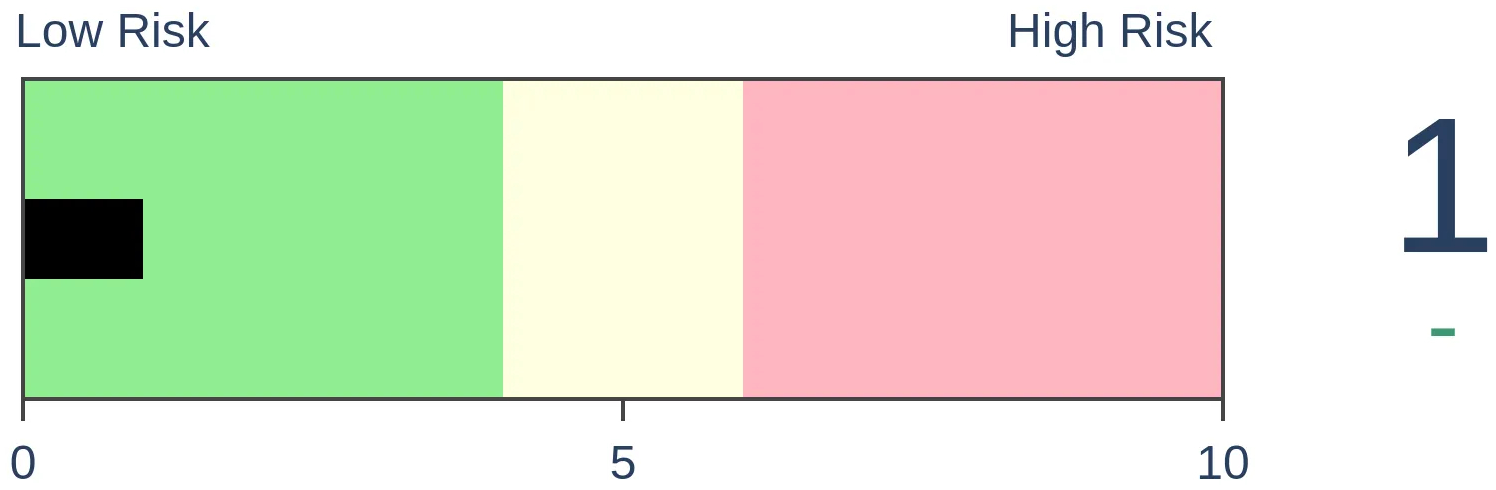
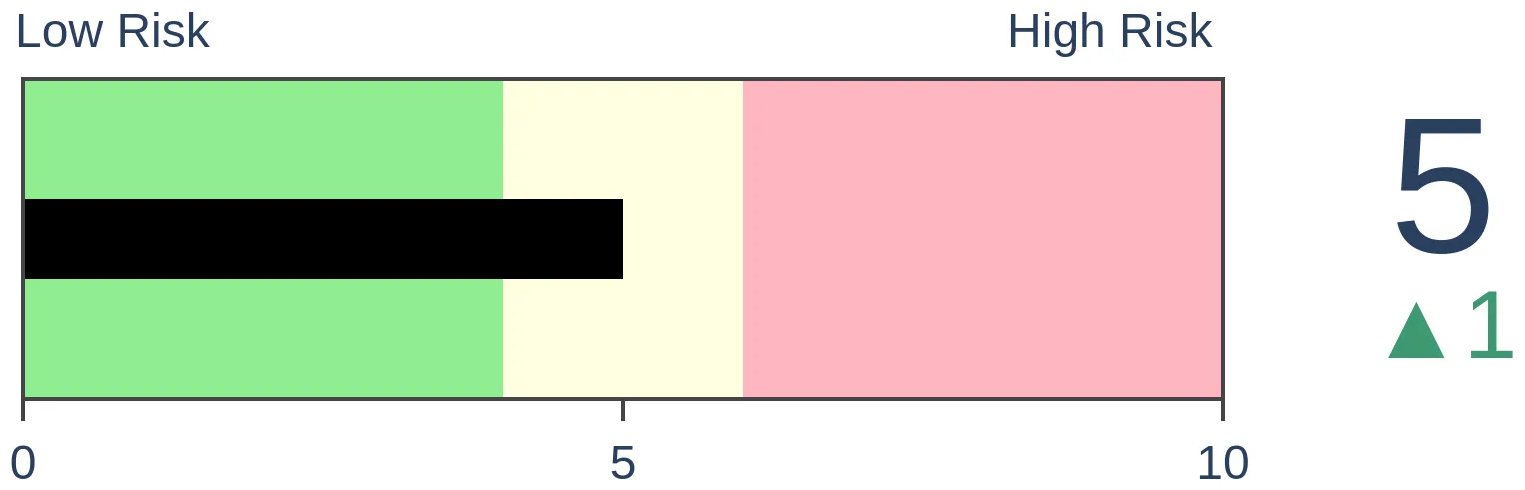
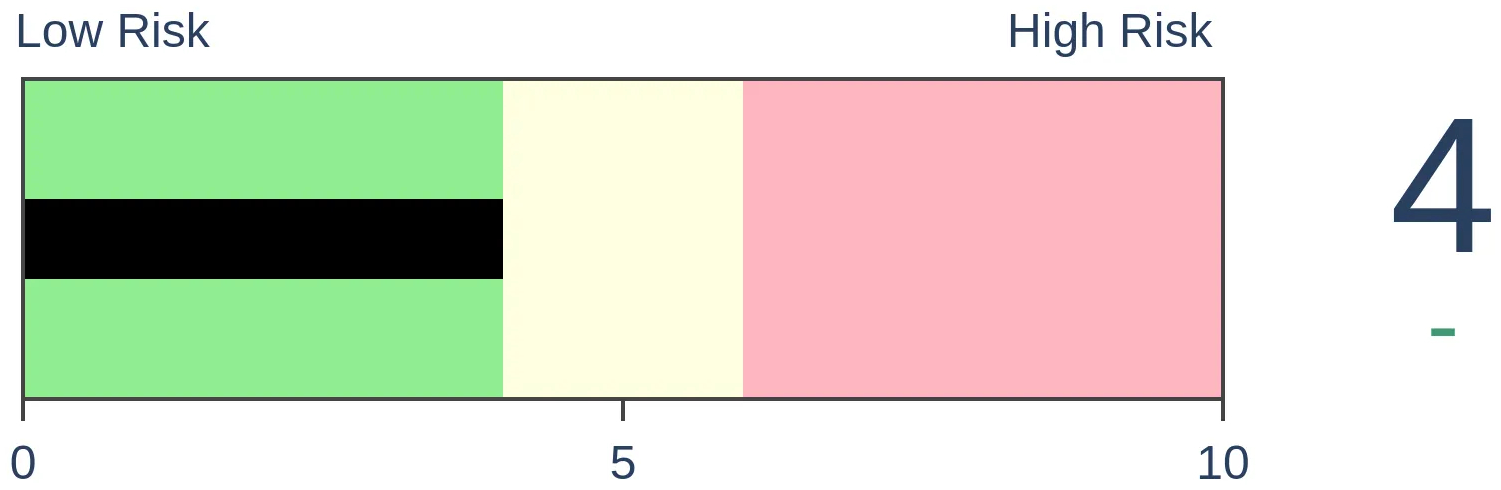
Risk Levels
Stocks Short-Term
|
Stocks Medium-Term
|
|
Bonds
|
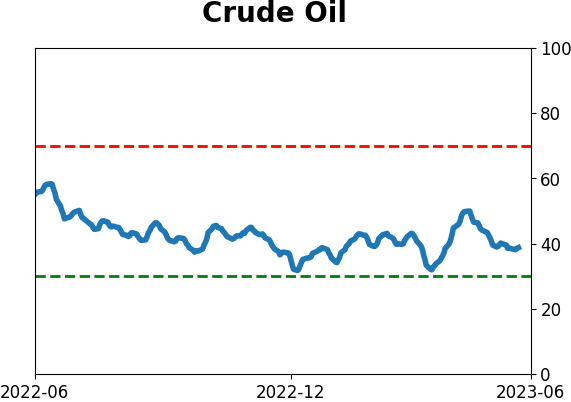
Crude Oil
|
|
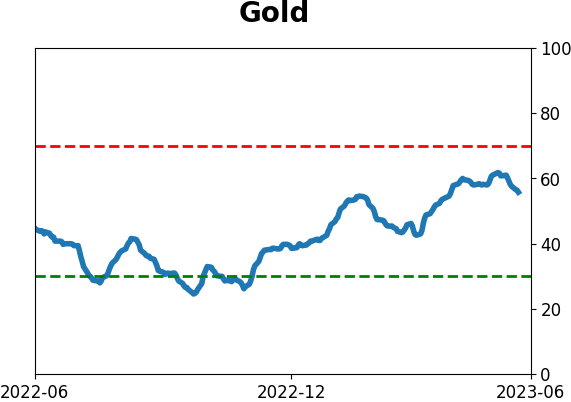
Gold
|
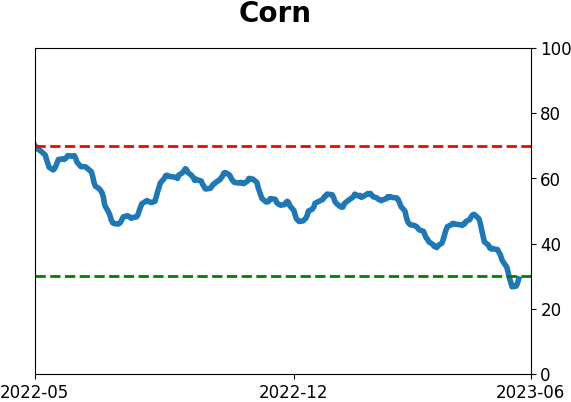
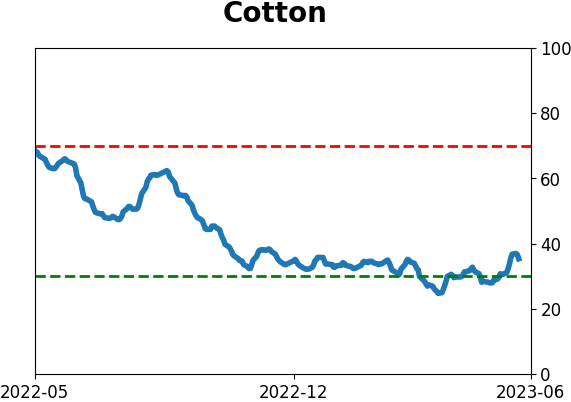
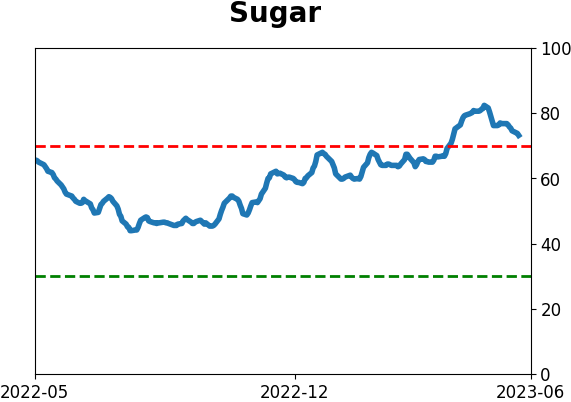
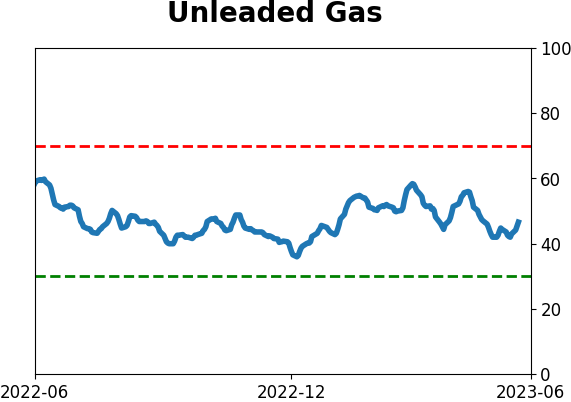
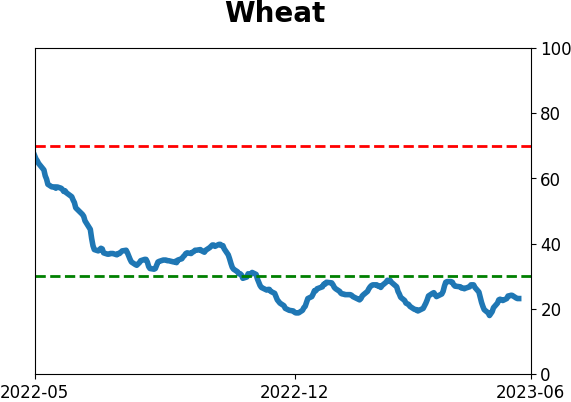
Agriculture
|
|
Research
By Dean Christians
BOTTOM LINE
Stocks in interest rate-sensitive sectors like Consumer Staples and Utilities plunged in the last few weeks as rates increased to multi-month highs. The decline pushed a breadth-based indicator that measures oversold conditions to an extreme for both groups, especially relative to the broad market. After similar divergences between defensive sectors and the S&P 500, Consumer Staples and Utilities tend to rally.
FORECAST / TIMEFRAME
None
|
Key points:
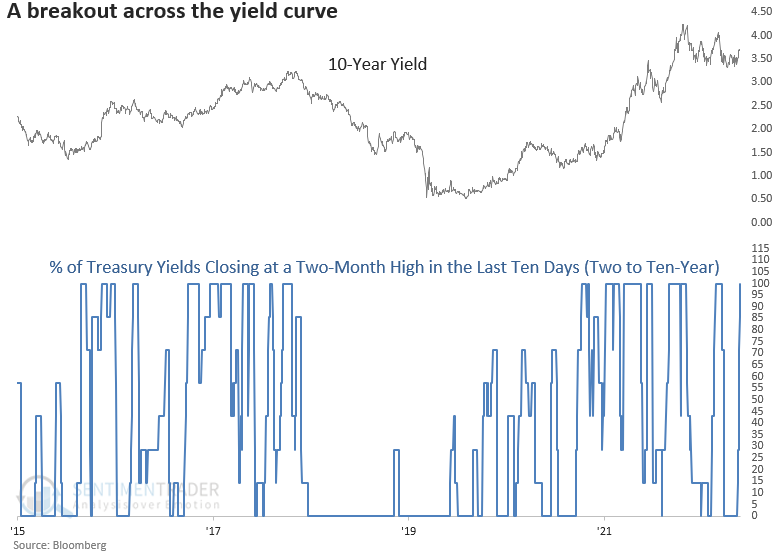
- Treasury yields ranging from two to ten years all closed at a two-month high in the last ten days
- The upside reversal in yields sent Consumer Staples and Utility stocks plunging to oversold levels
- After similar oversold conditions, returns were solid for the sectors and mixed for the broad market
Treasury yields are breaking out, sending interest rate-sensitive sectors plunging
Interest rate-sensitive sectors like Consumer Staples and Utilities have taken a beating of late as Treasury yields reversed higher over the last few weeks and closed at multi-month highs. The plunge in higher-yielding defensive stocks sent a breadth-based indicator that measures oversold conditions surging higher.
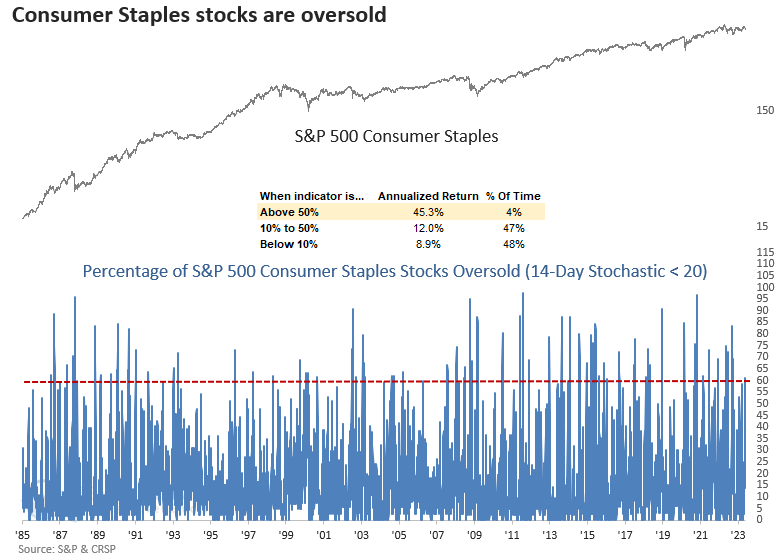
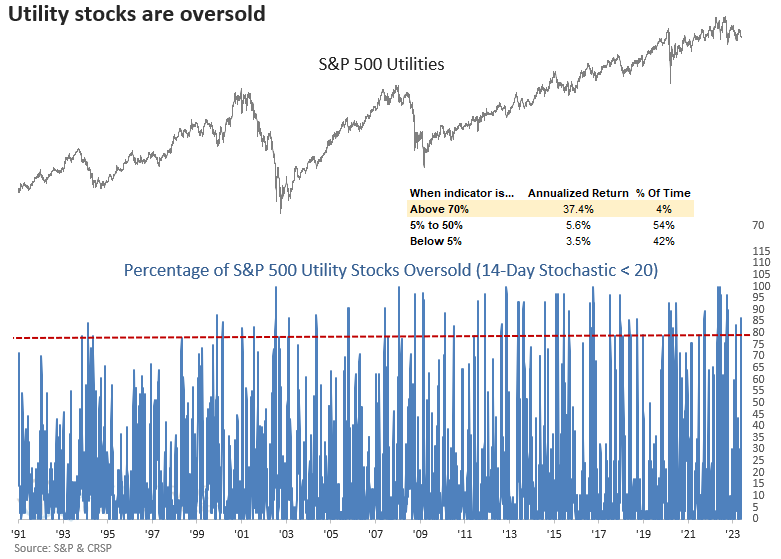
The percentage of oversold issues, a 14-day stochastic < 20, for Consumer Staples and Utility stocks increased above 60% and 80%, respectively. Interestingly, the same indicator for the S&P 500 showed only 23% of issues oversold. The significant difference between defensive stocks and the broad market is rare.
Let's assess the outlook for Consumer Staples, Utilities, and the S&P 500 when defensive sectors show a high level of oversold stocks relative to the broad market.
Consumer Staples stocks are oversold relative to the broad market
The percentage of oversold Consumer Staples stocks surged to a level associated with extremely bullish annualized returns for the sector.
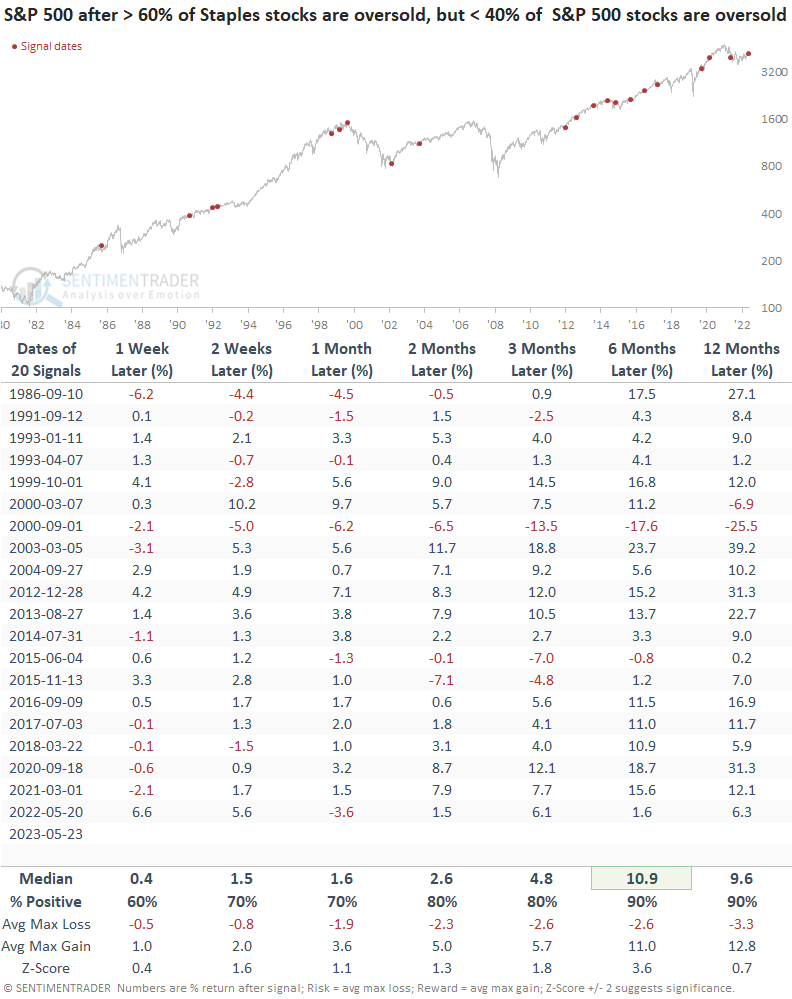
Similar Staples versus broad market divergences preceded excellent results
When greater than 60% of Consumer Staples stocks are oversold, but fewer than 40% of S&P 500 stocks are oversold, the divergence between a defensive sector and the broad market tends to mark a bullish inflection point for Staples. Three months later, the group was higher 85% of the time.
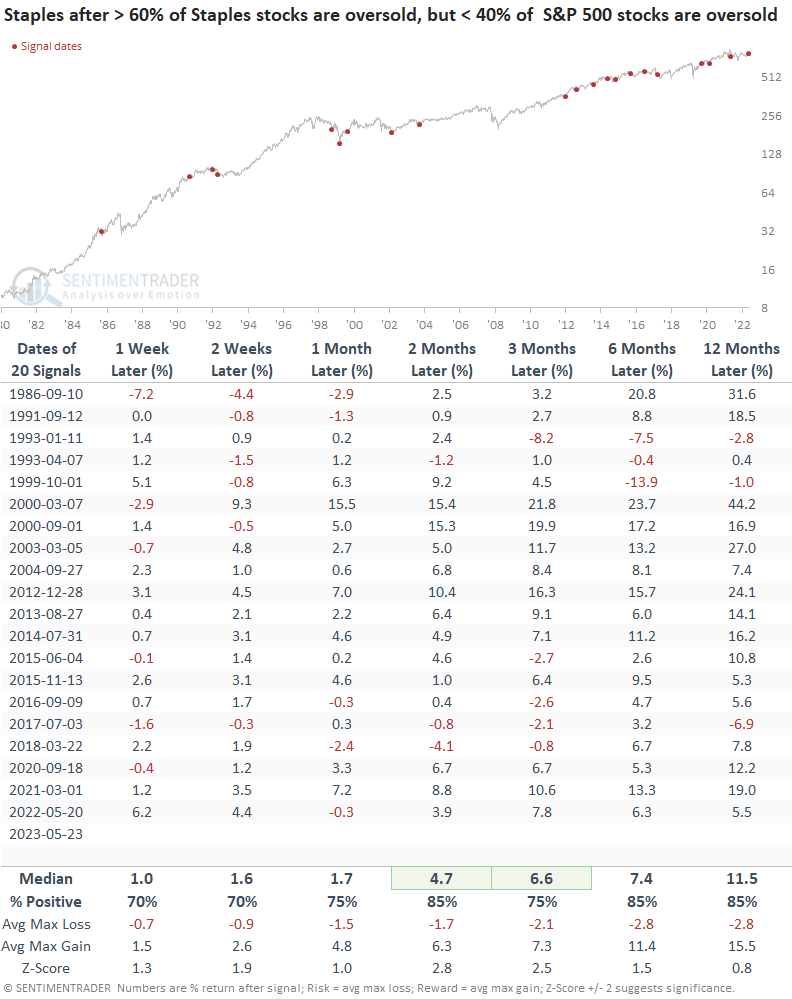
The difference in oversold conditions between the two groups was also bullish for the broad market. Six months later, the S&P 500 was higher 90% of the time.
Utility stocks are oversold relative to the broad market
Like Consumer Staples, the percentage of S&P 500 Utility sector stocks registering an oversold condition surged to a level associated with significant annualized returns.
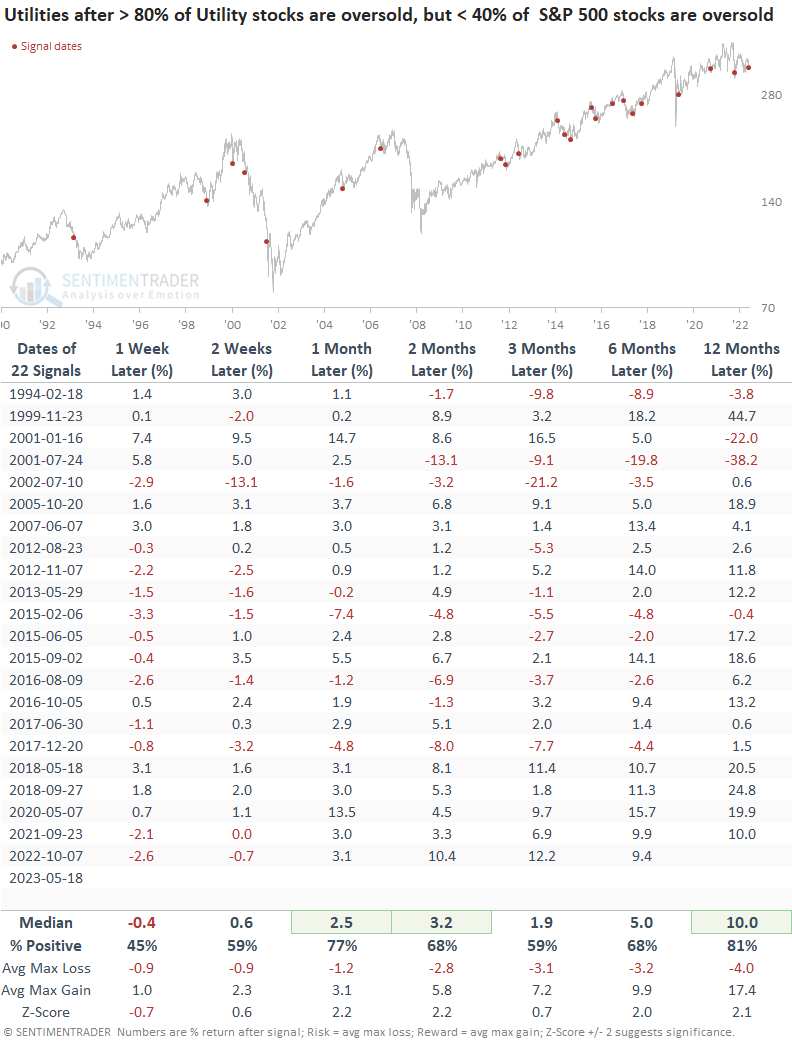
Similar Utility versus broad market divergences preceded solid results
When greater than 80% of Utility stocks are oversold, but fewer than 40% of S&P 500 stocks are oversold, the variation between the two groups tends to lead to some downside follow-through over the next week. A month later, the utility sector bounced back with a 77% win rate.
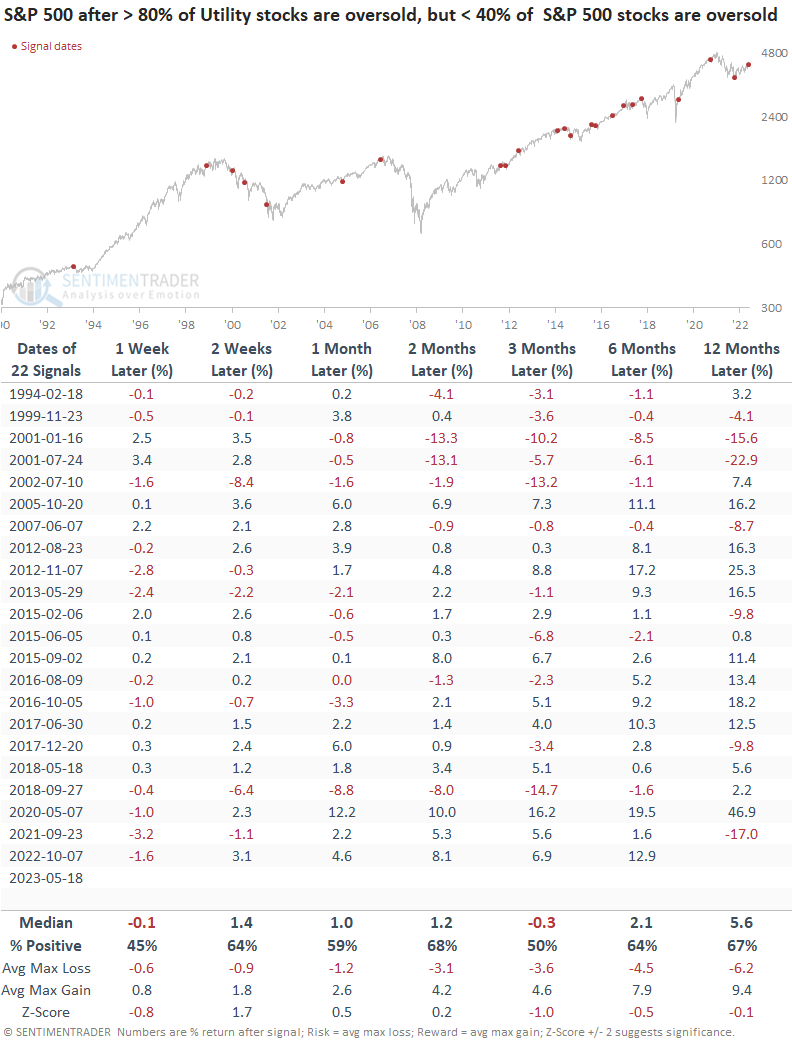
When I apply the signals to the S&P 500, the results look significantly worse than the Utility sector outlook, with flat returns over the next three months.
What the research tells us...
Treasury yields reversed to the upside and closed at multi-month highs, negatively impacting interest rate-sensitive sectors like Consumer Stapels and Utilities. The swoon in defensive sector stocks pushed a breadth-based indicator that measures oversold conditions to an extreme level, especially compared to the number of oversold stocks in the S&P 500. When defensive groups become oversold relative to the broad market, history suggests the worst is most likely over. Staples and Utilities tend to rebound over the next few months.
The broad market has started to take note of the backup in yields over the last few sessions. However, I suspect the rate increase is related to the debt ceiling drama in Washington. So, rates could ease should a deal get done, and stocks will pop.
Indicators at Extremes
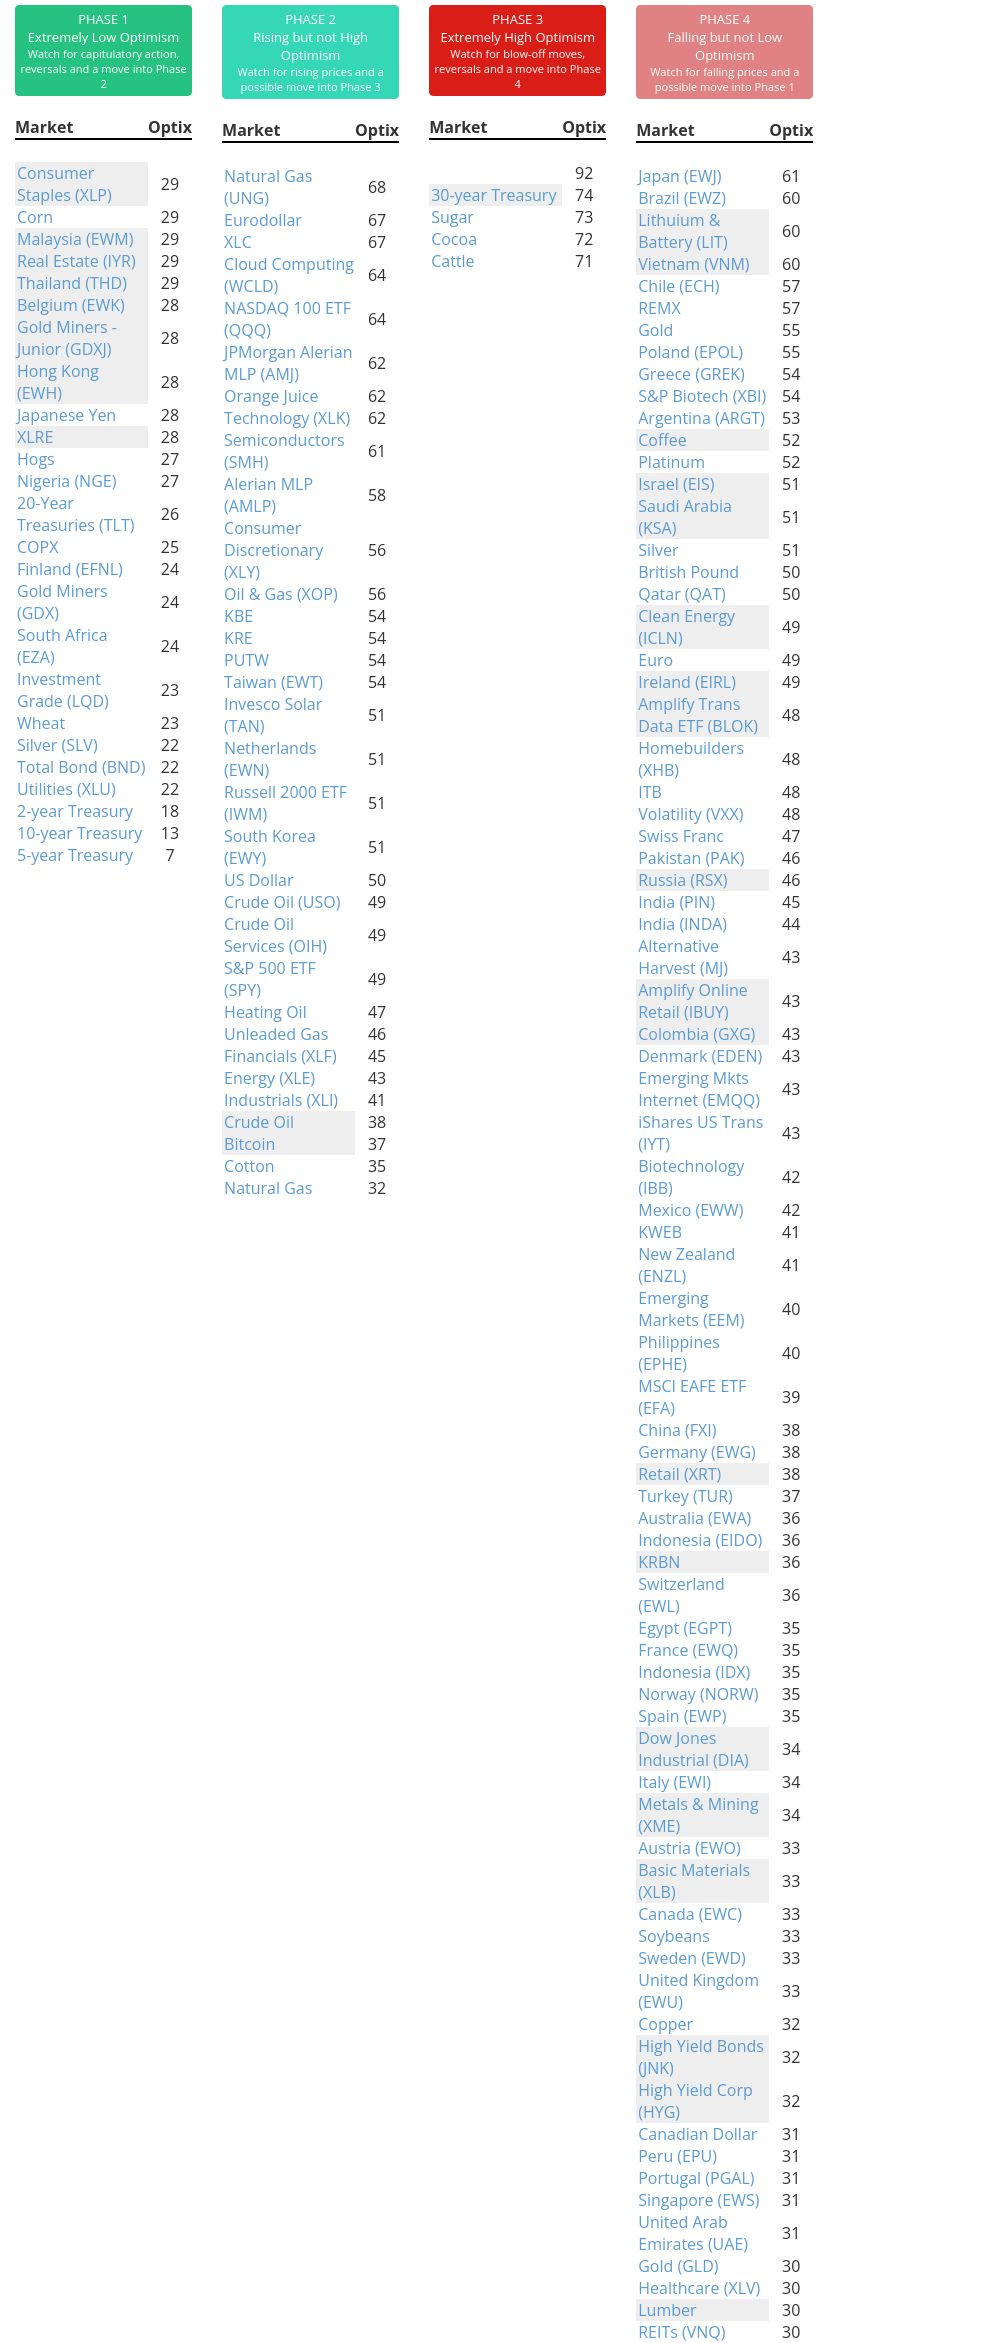
Phase Table
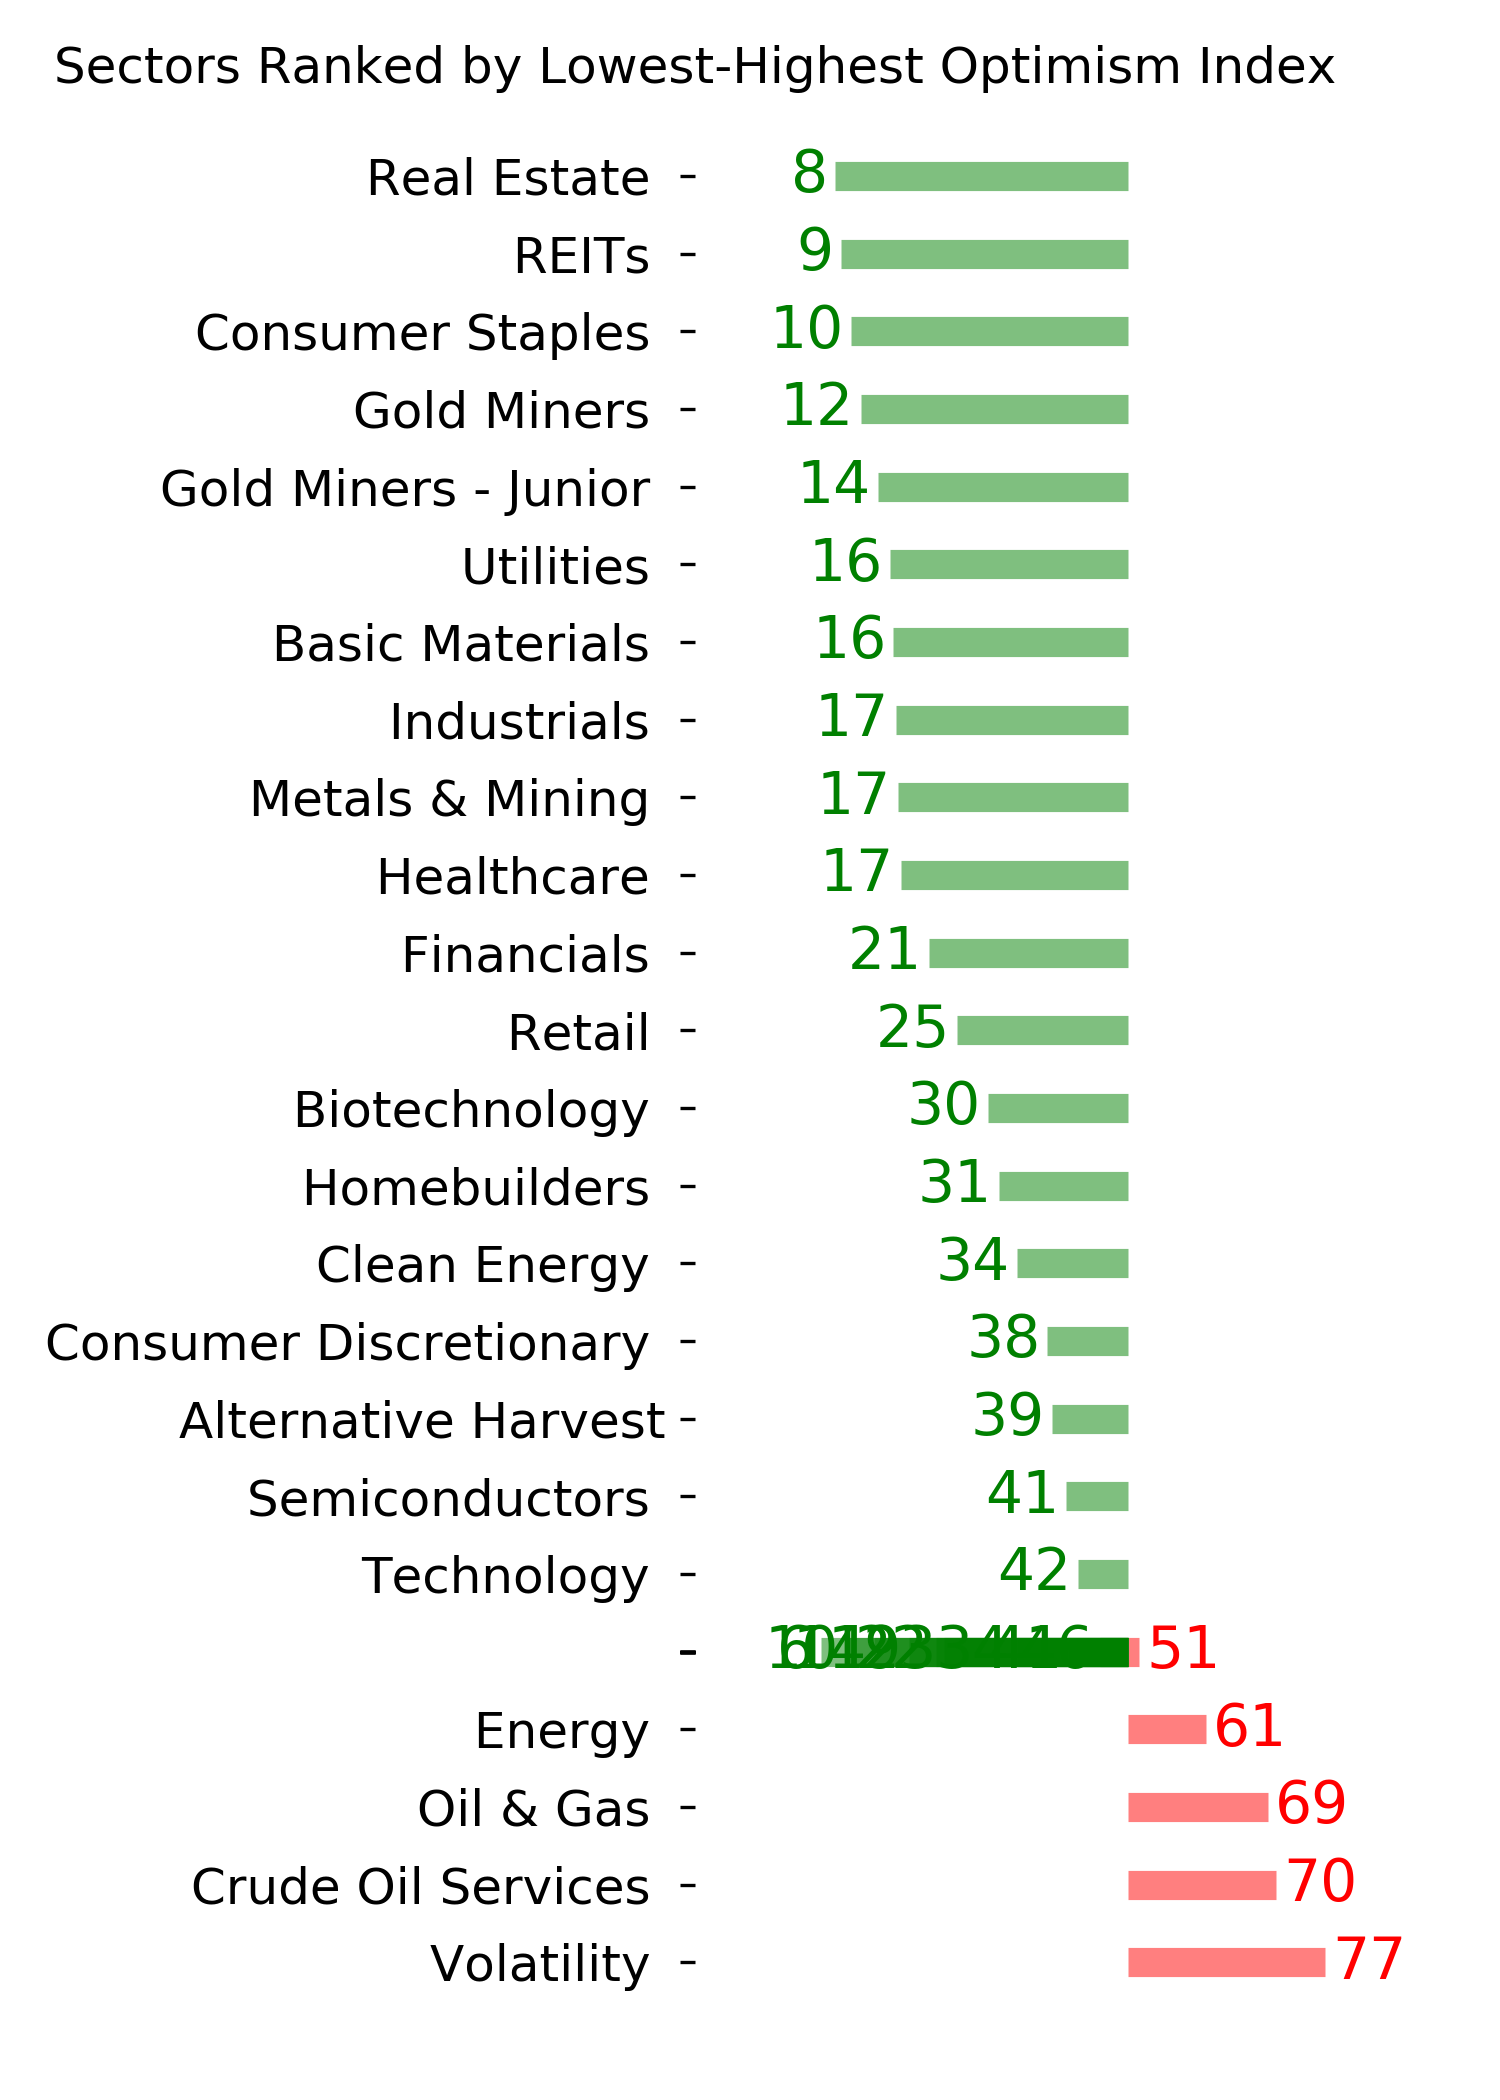
Ranks
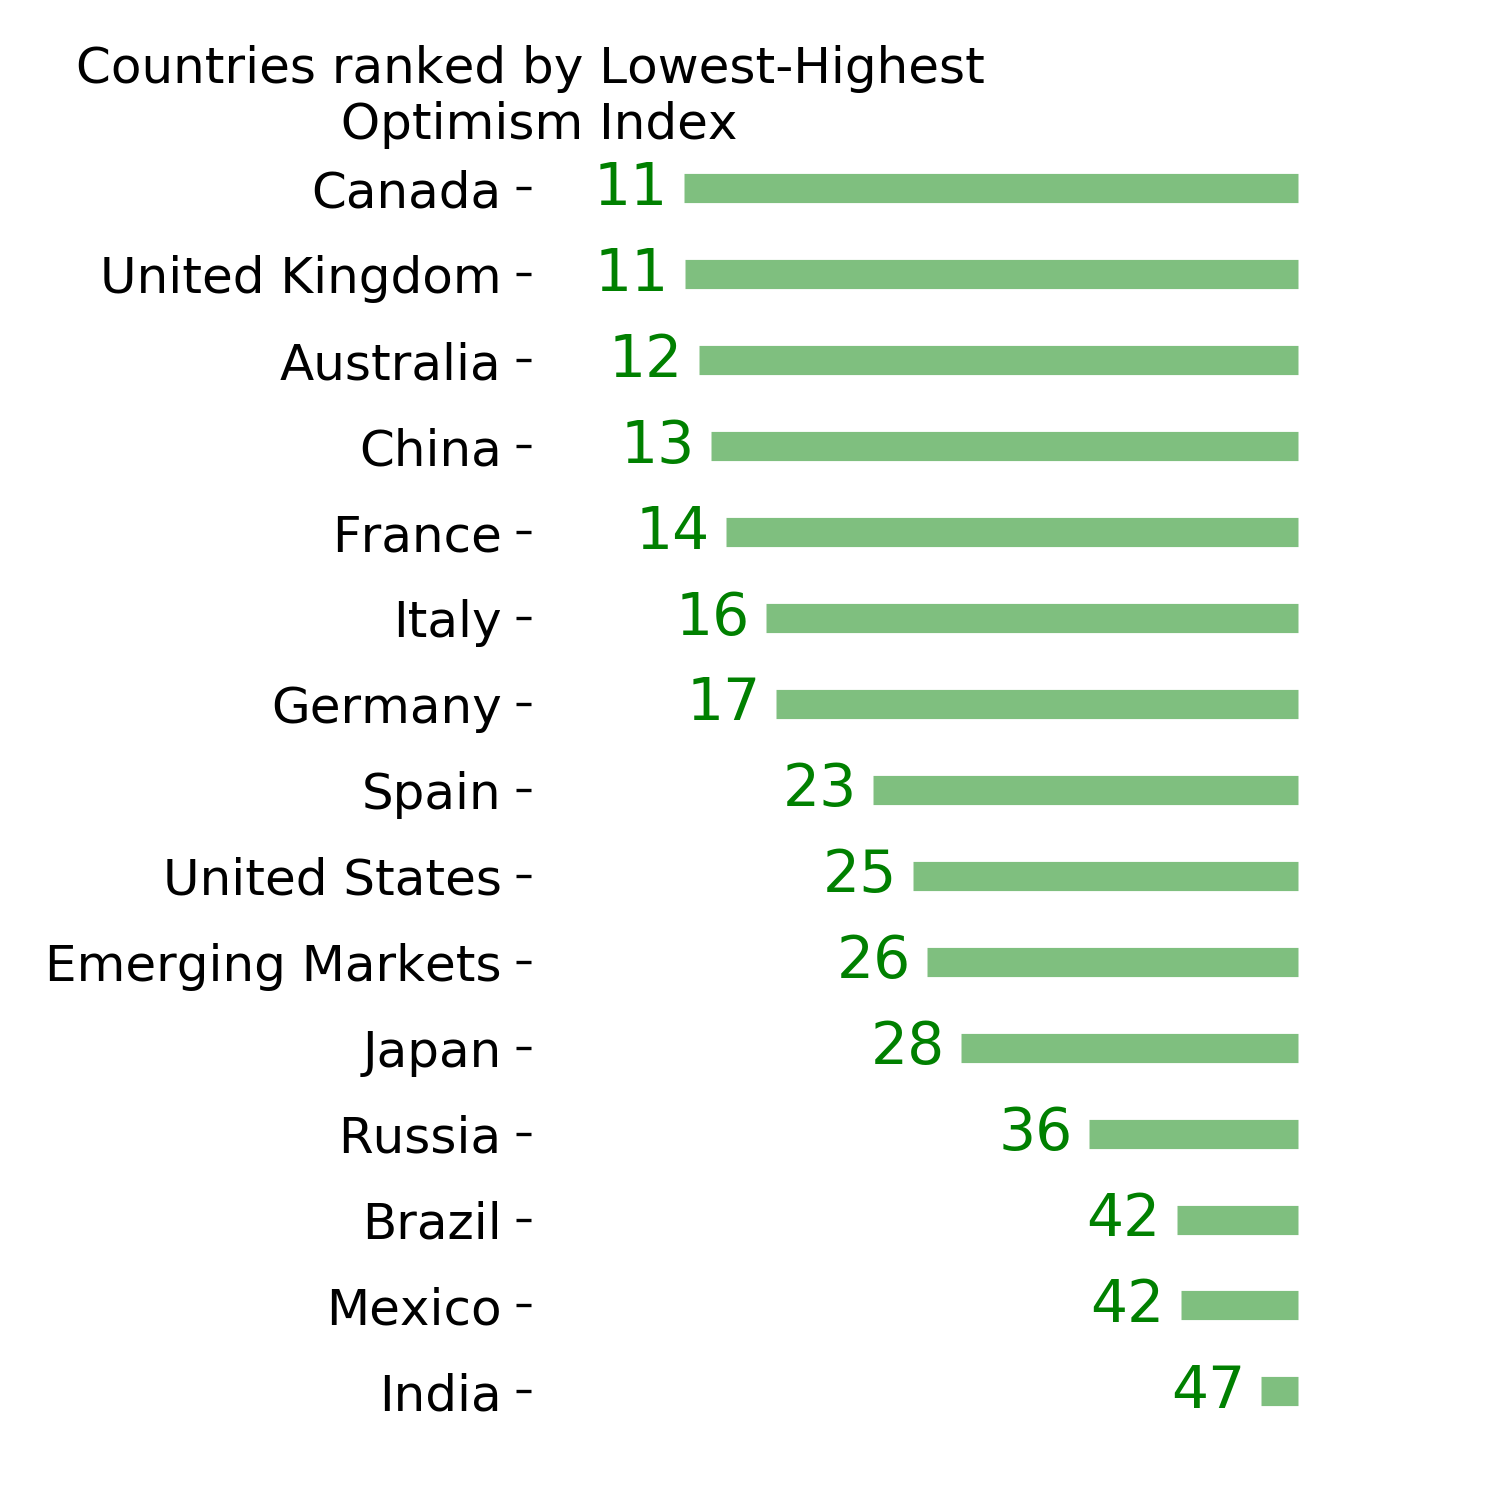
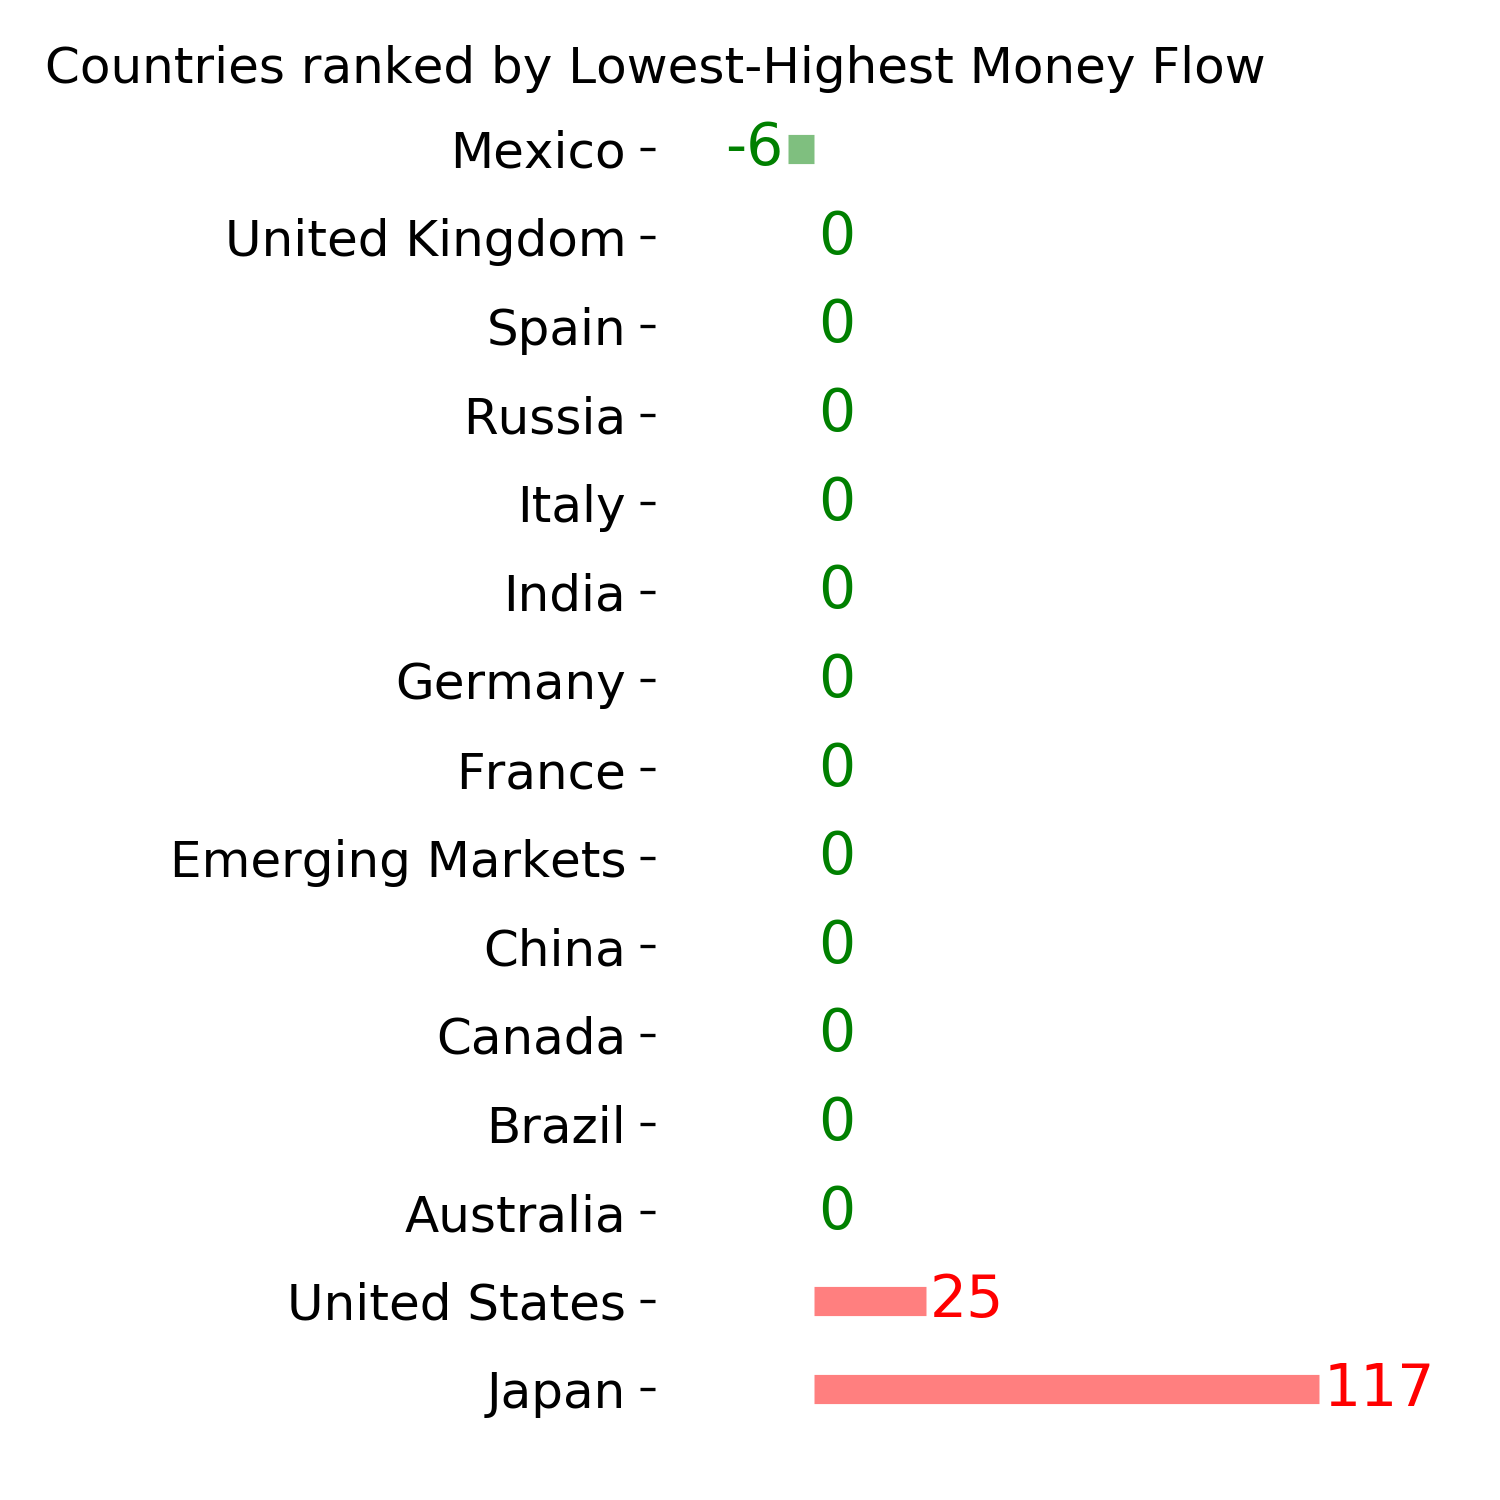
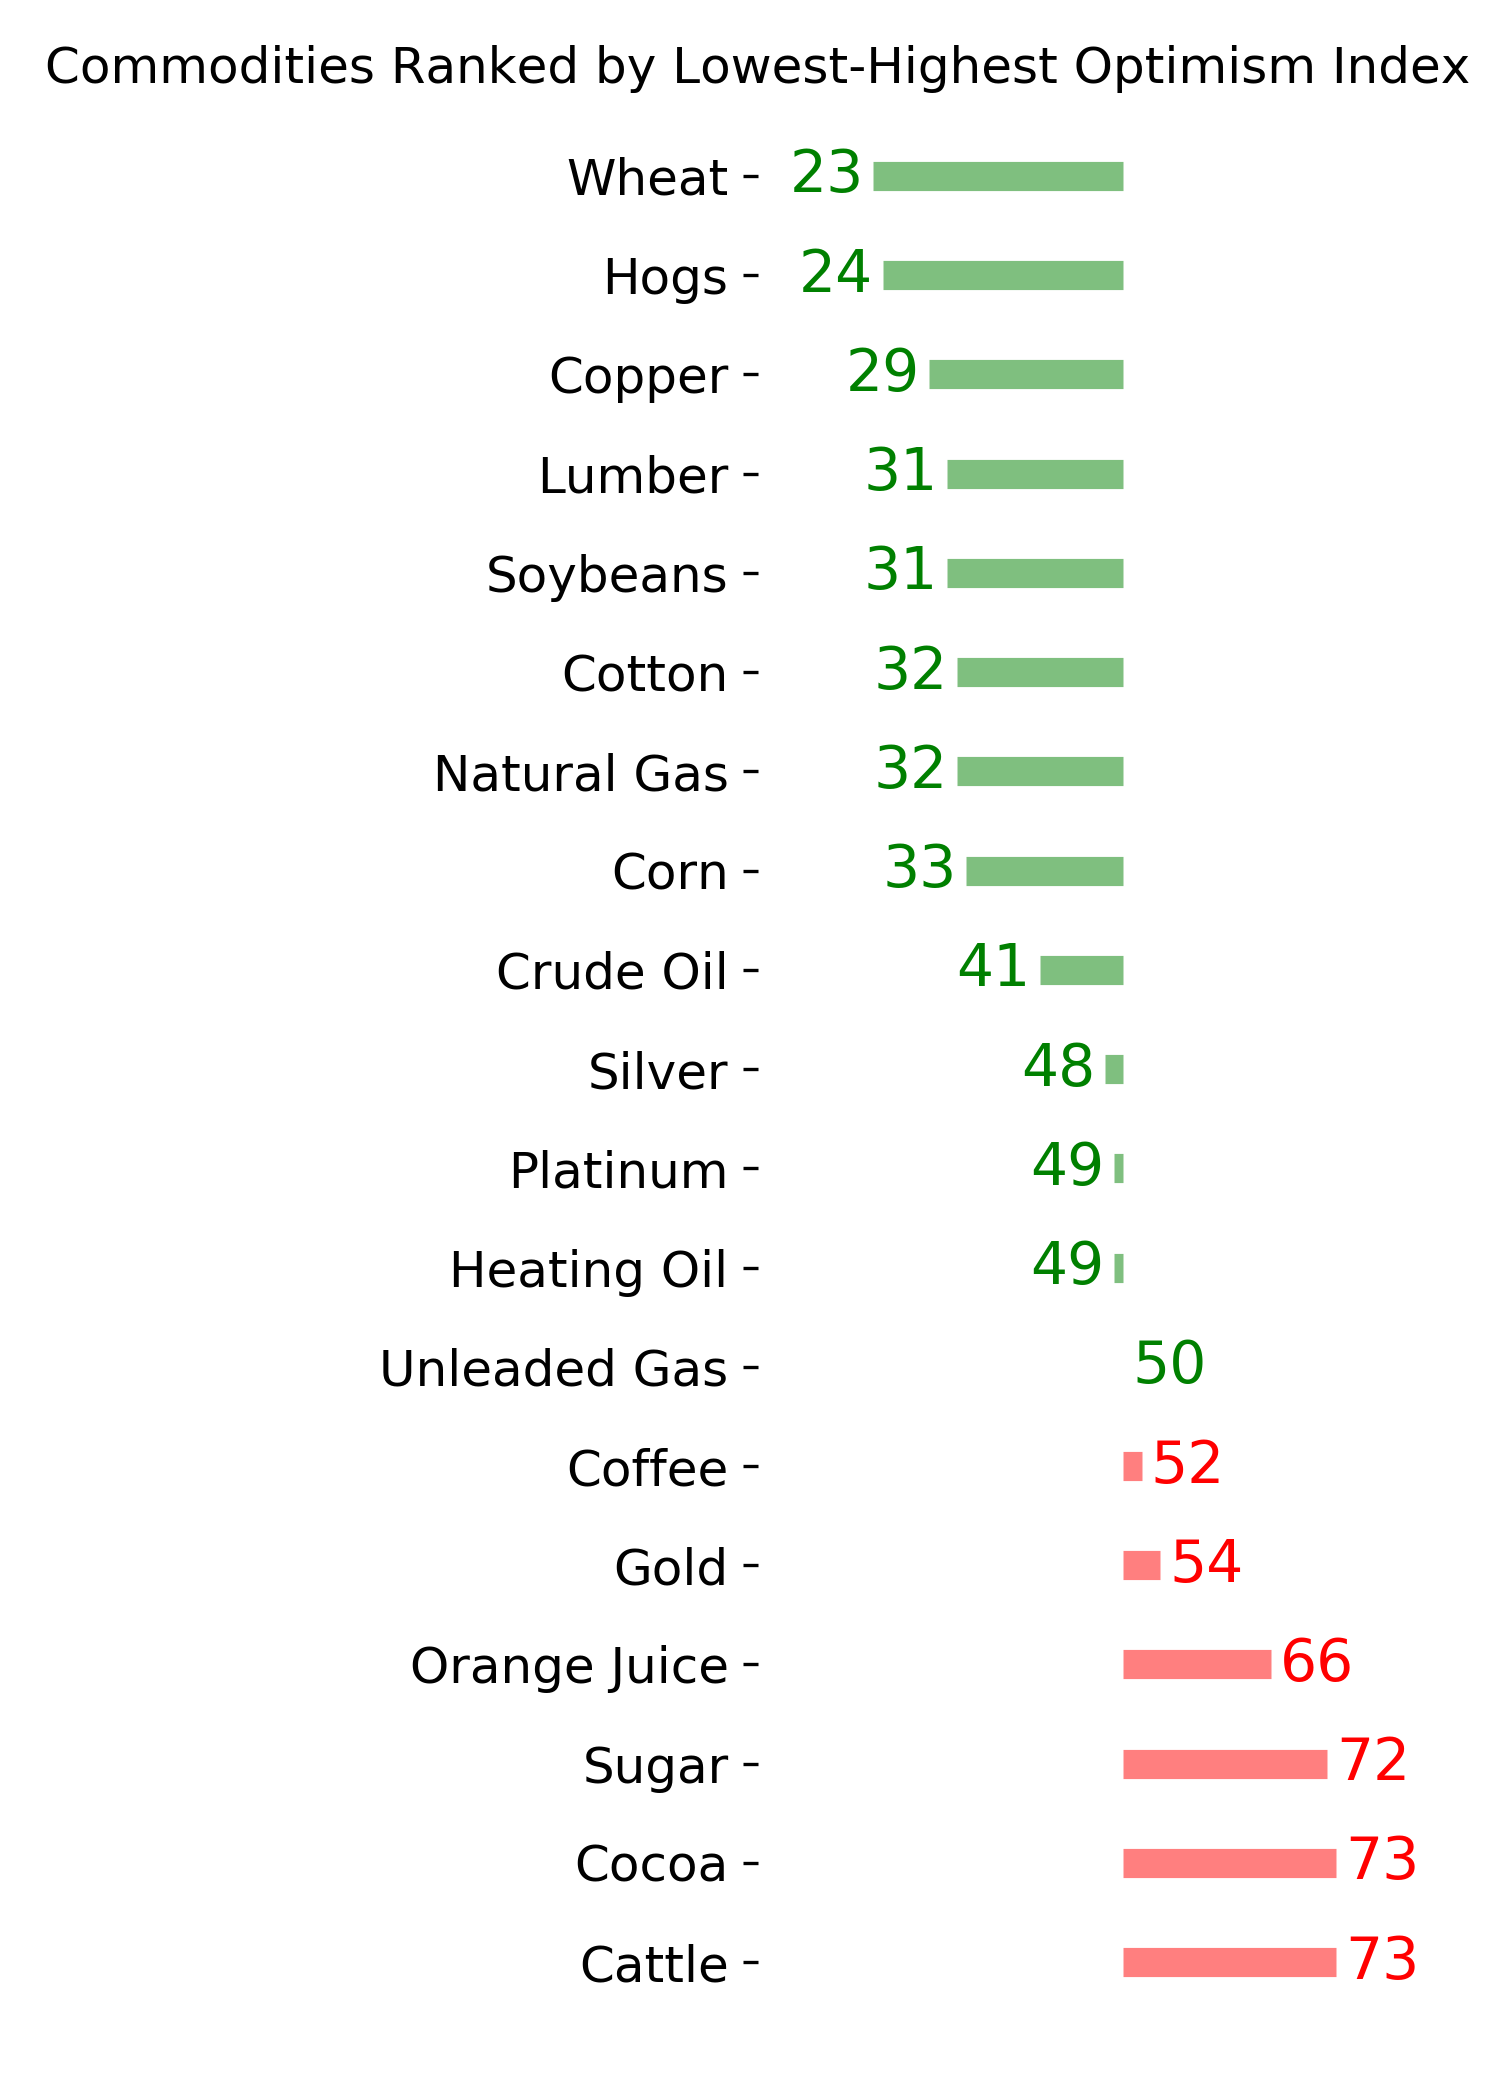
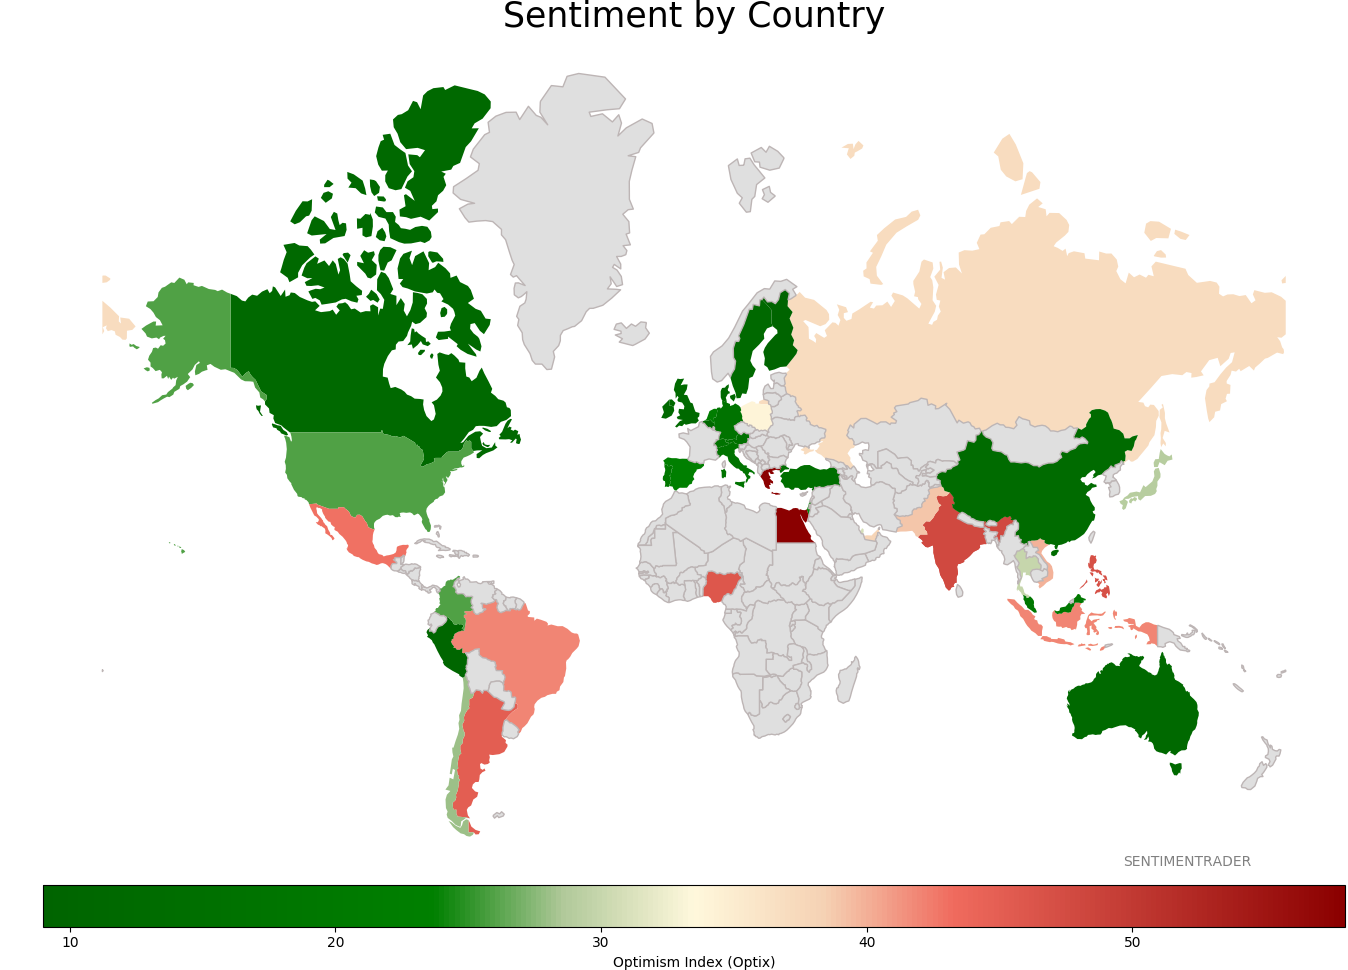
Sentiment Around The World
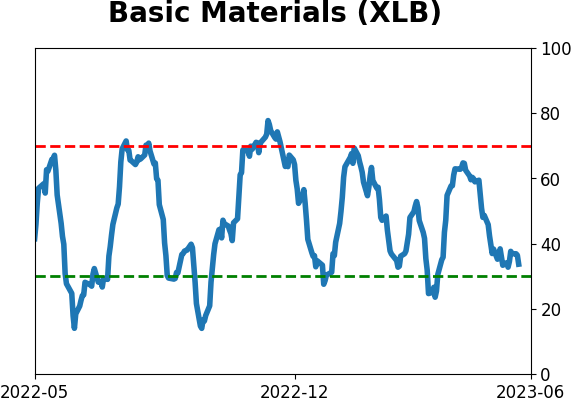
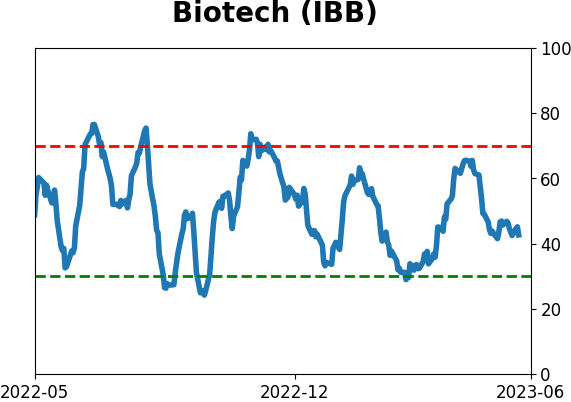
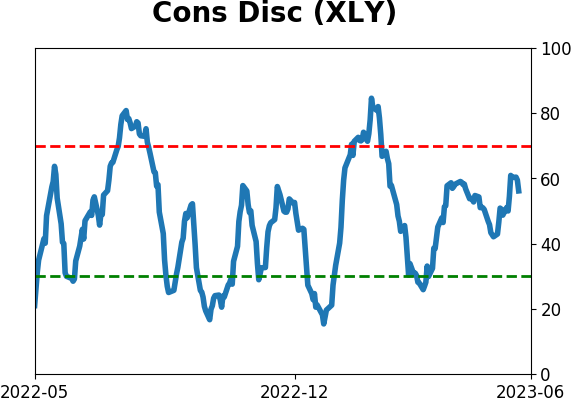
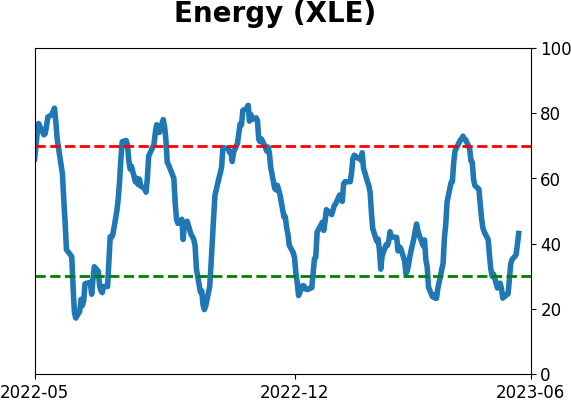
Optimism Index Thumbnails
|
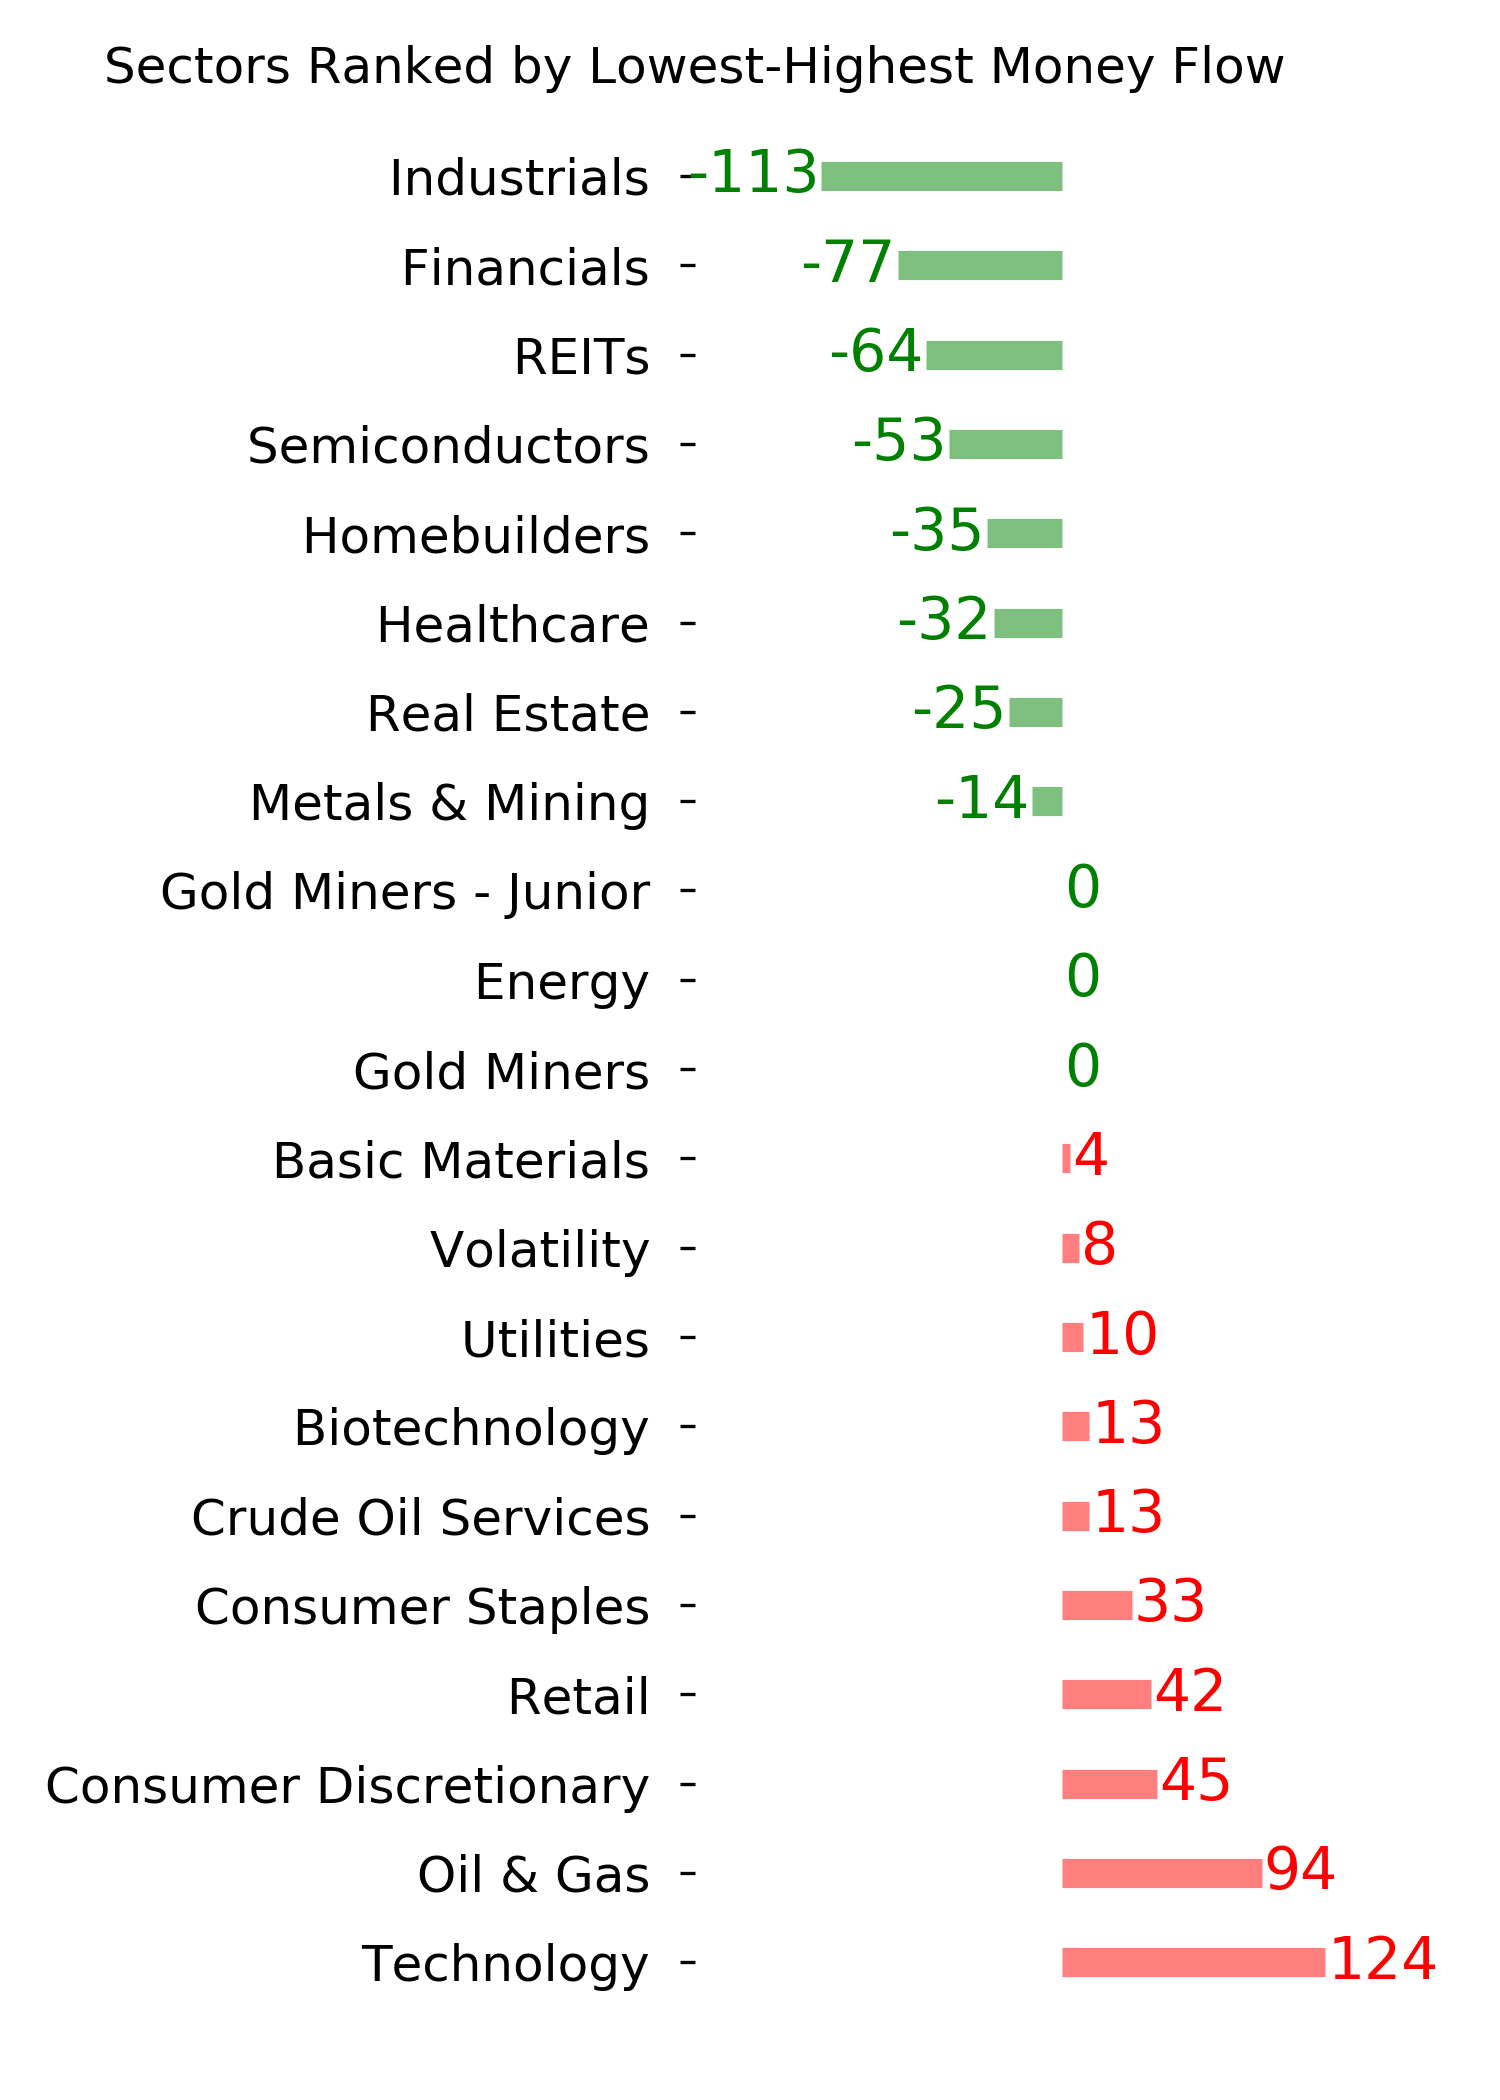
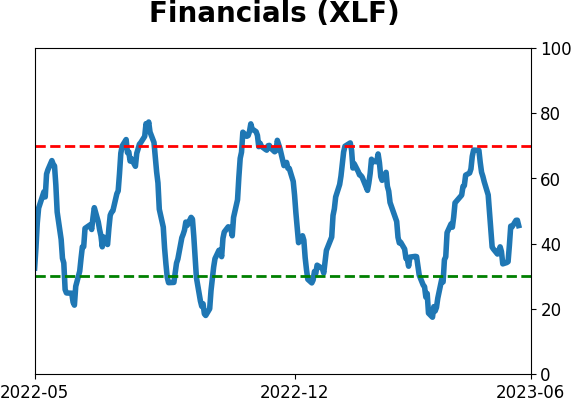
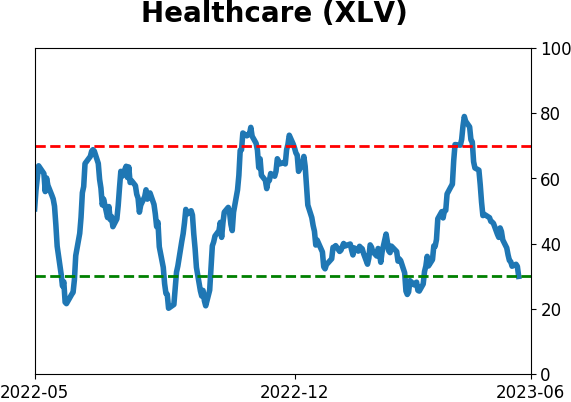
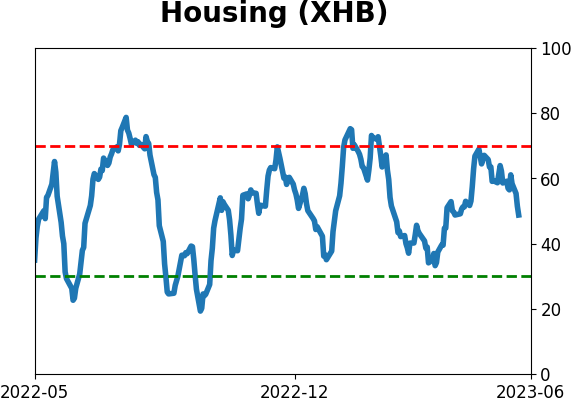
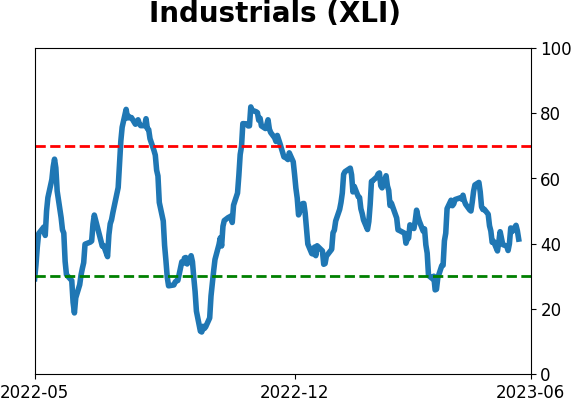
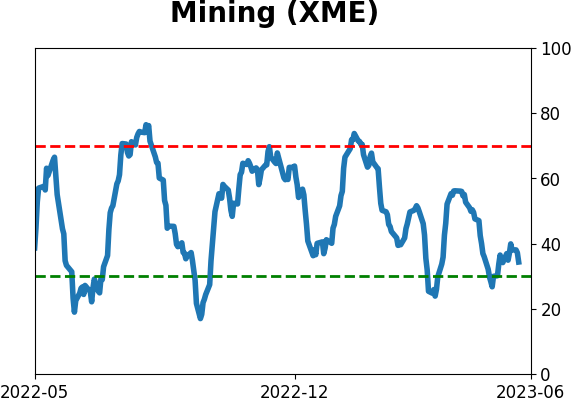
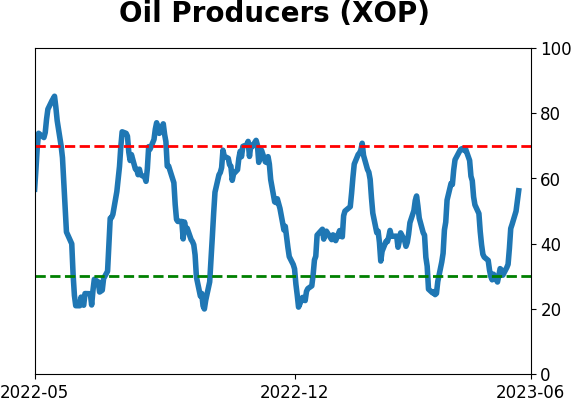
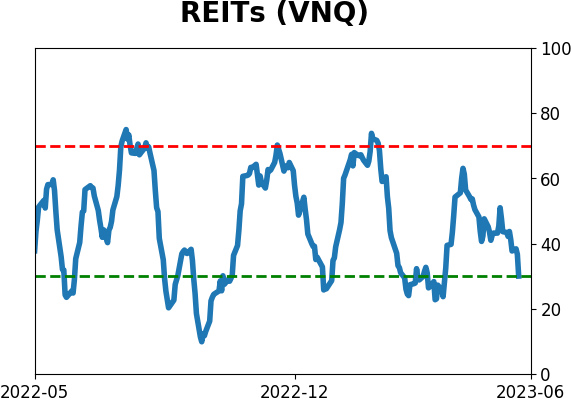
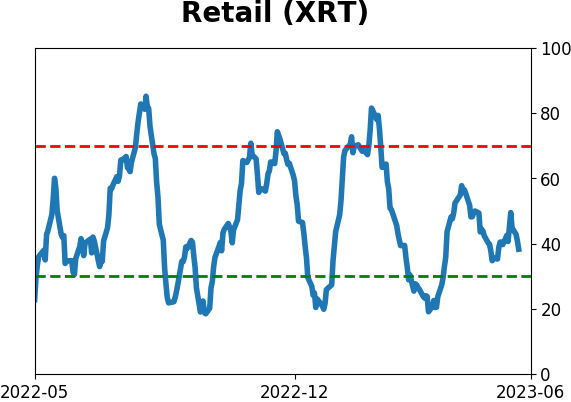
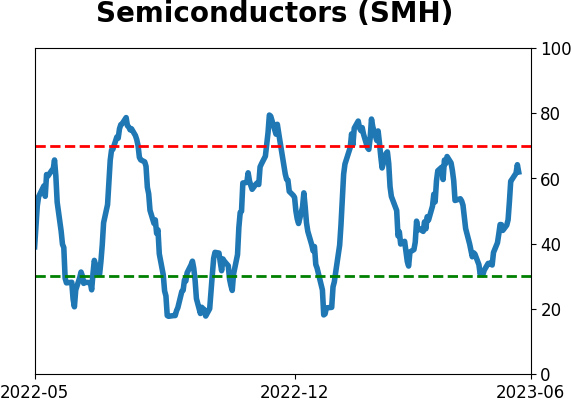
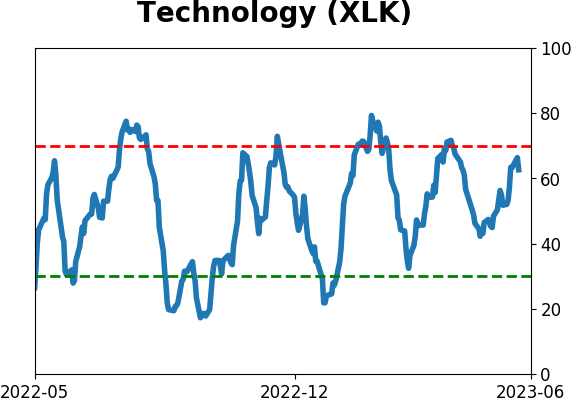
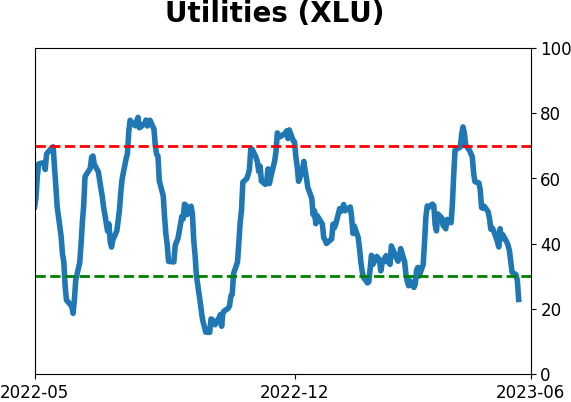
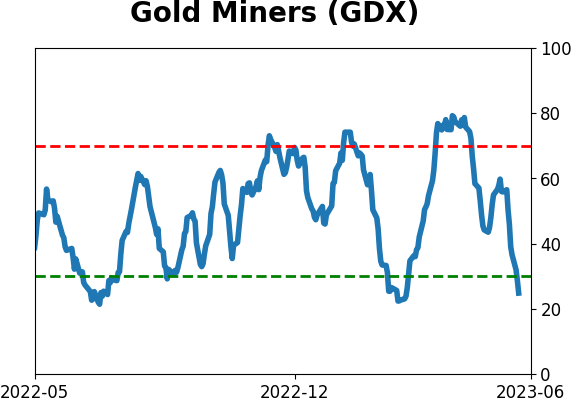
Sector ETF's - 10-Day Moving Average
|
|
|
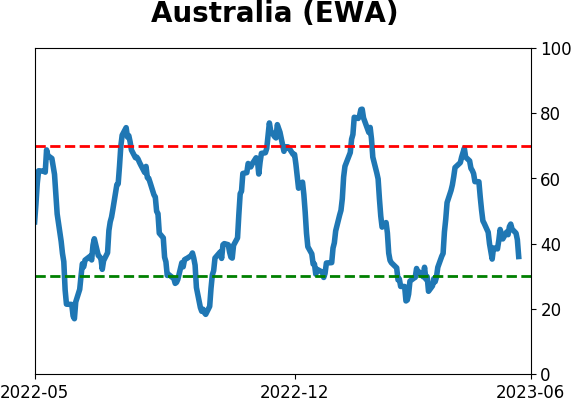
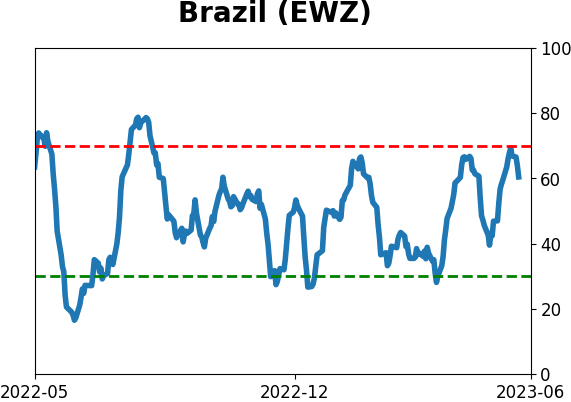
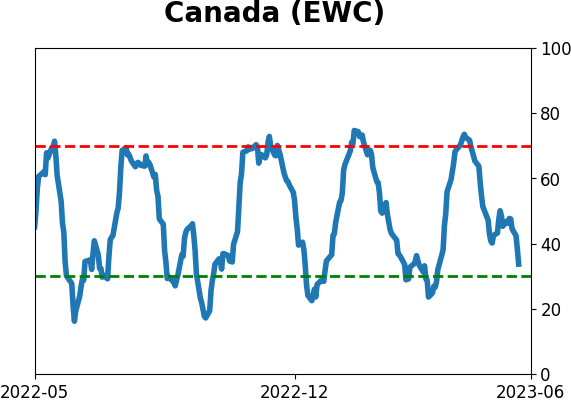
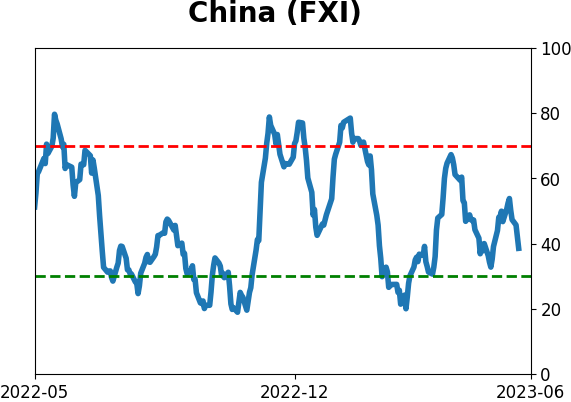
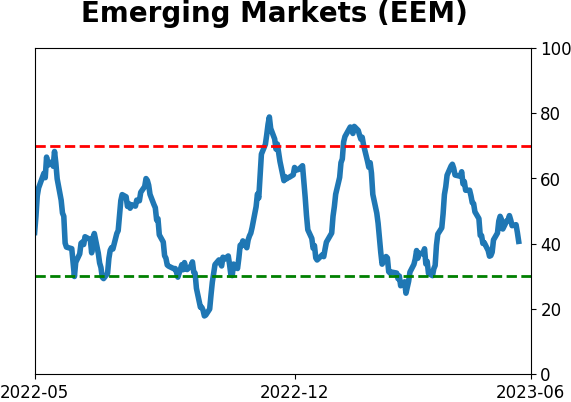
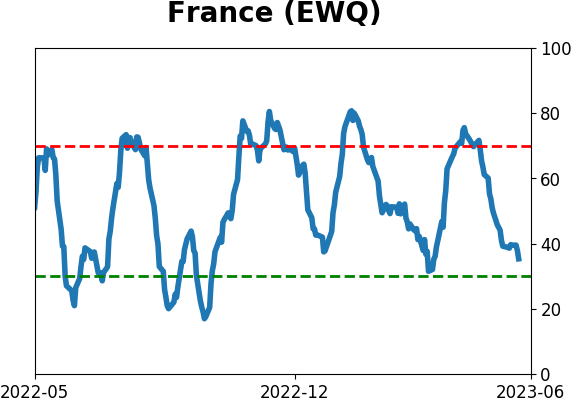
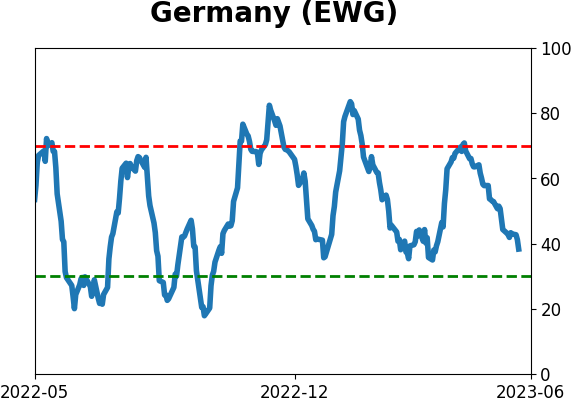
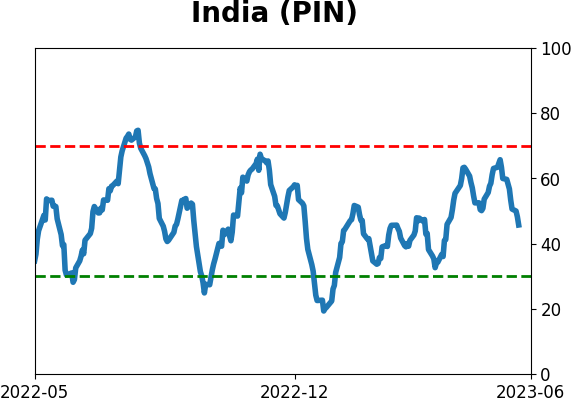
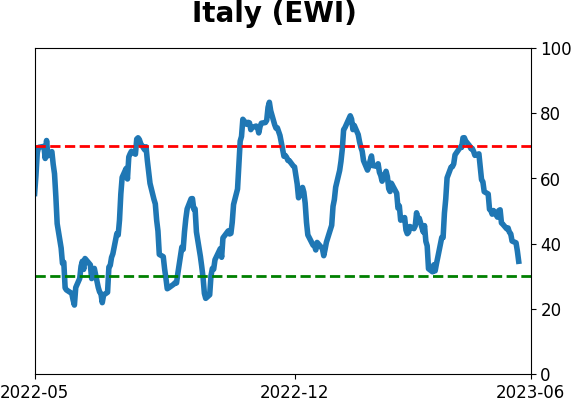
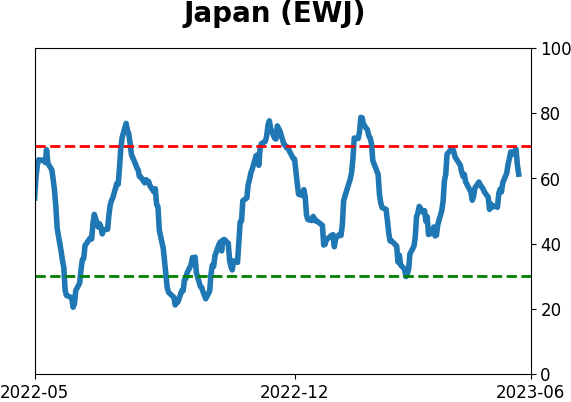
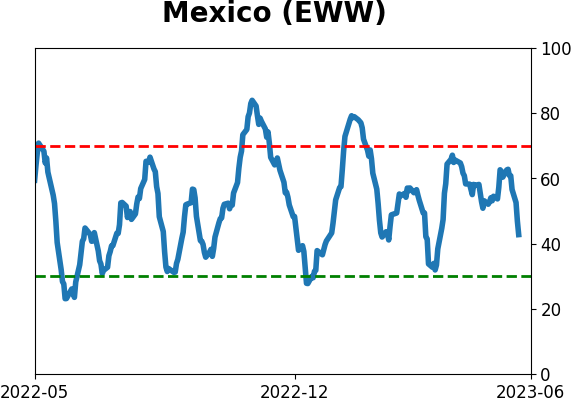
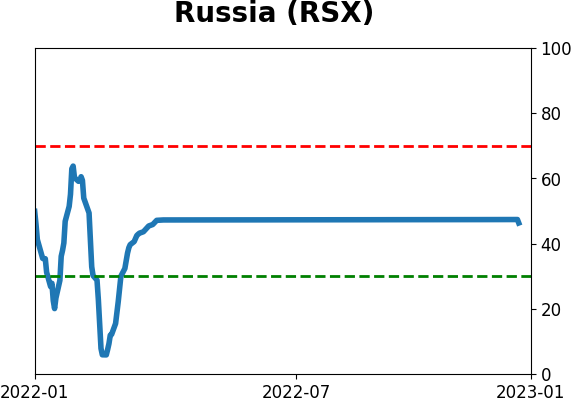
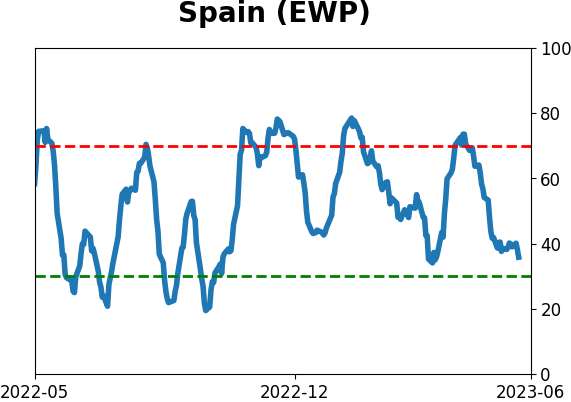
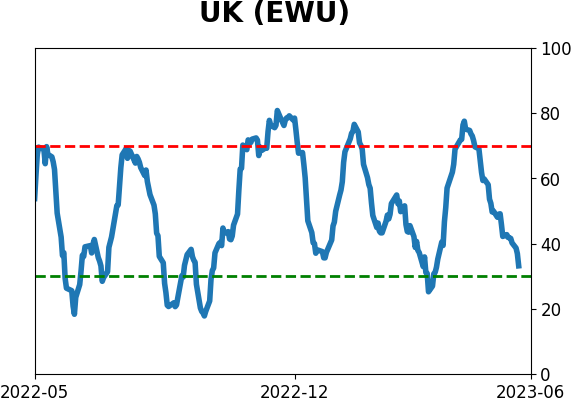
Country ETF's - 10-Day Moving Average
|
|
|
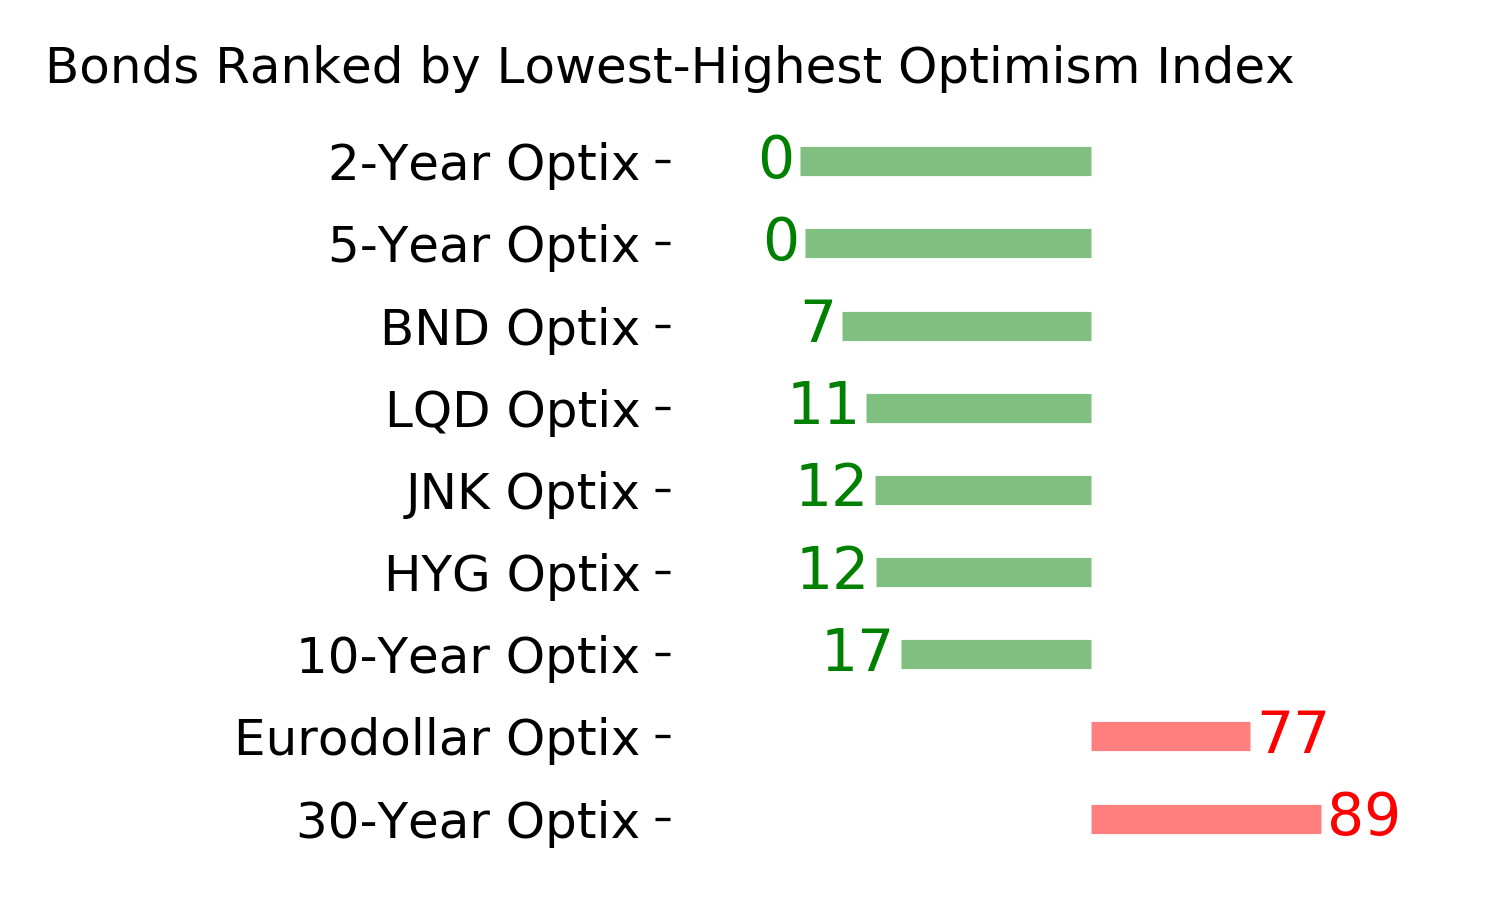
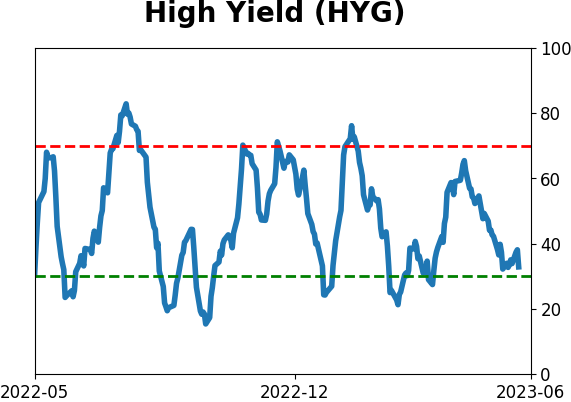
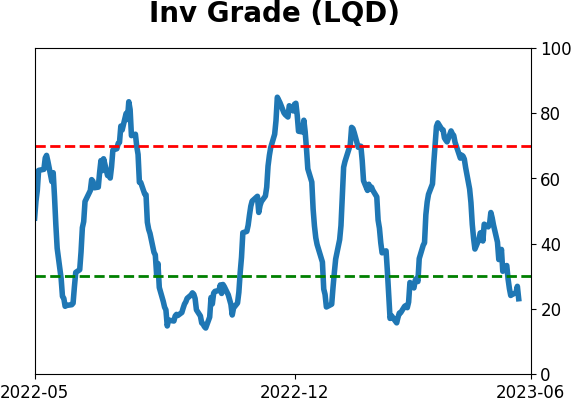
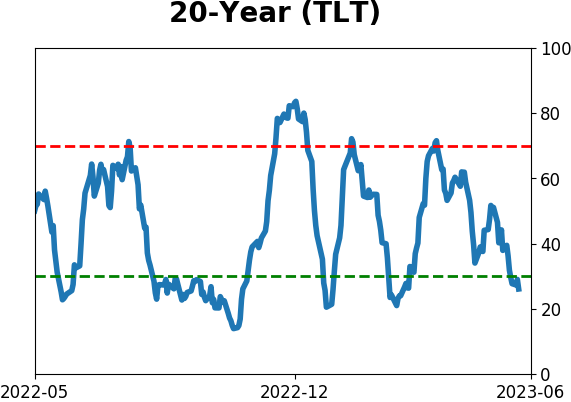
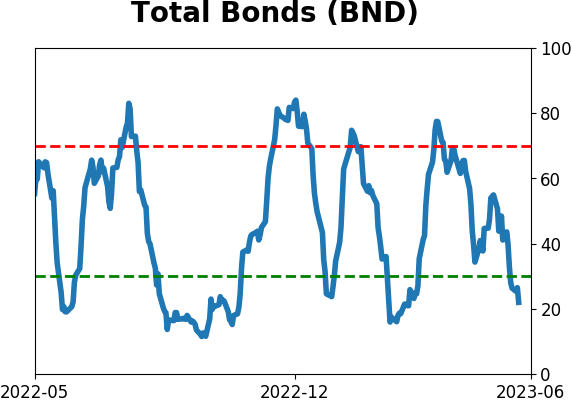
Bond ETF's - 10-Day Moving Average
|
|
|
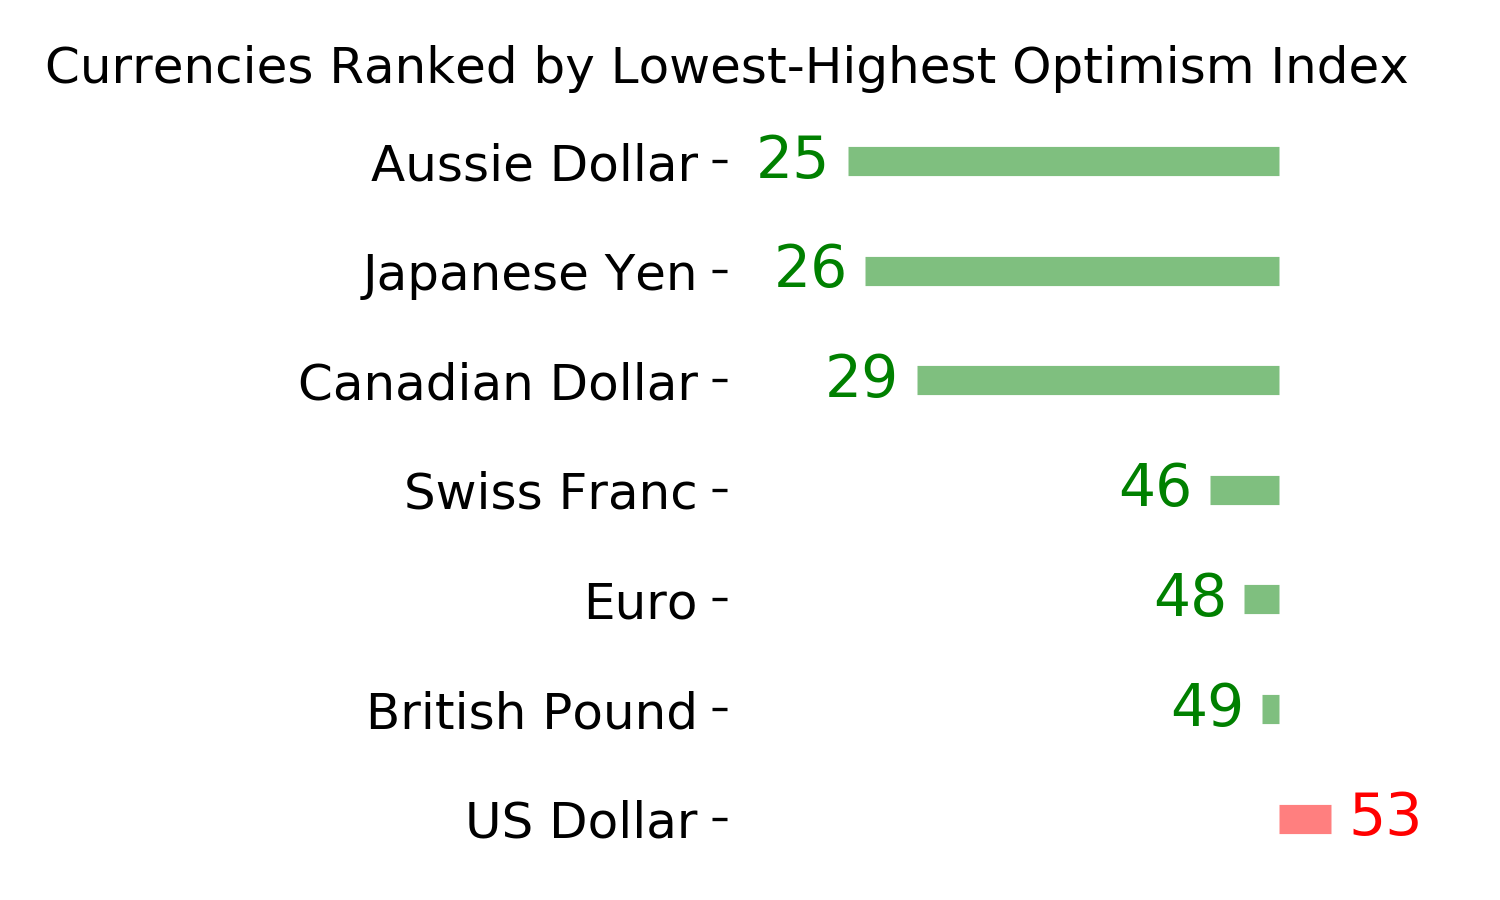
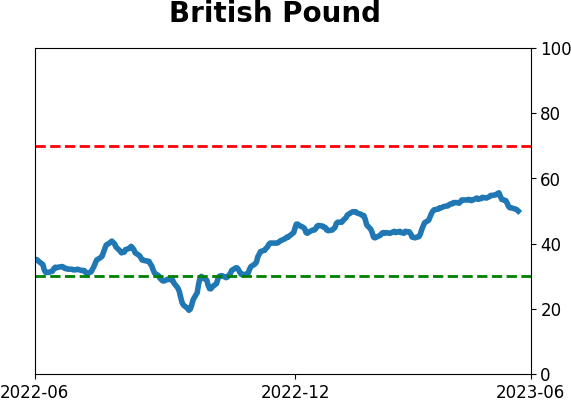
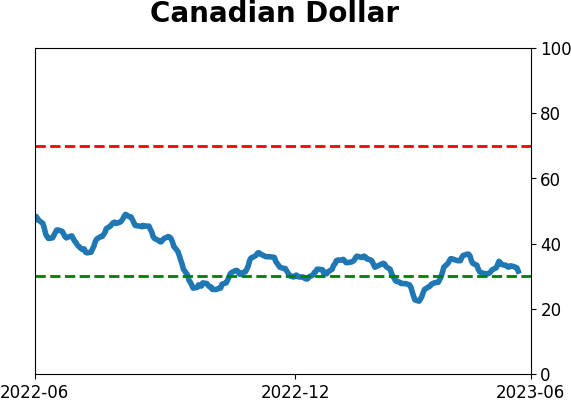
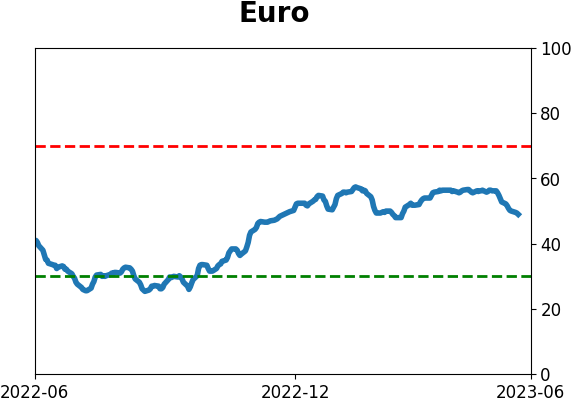
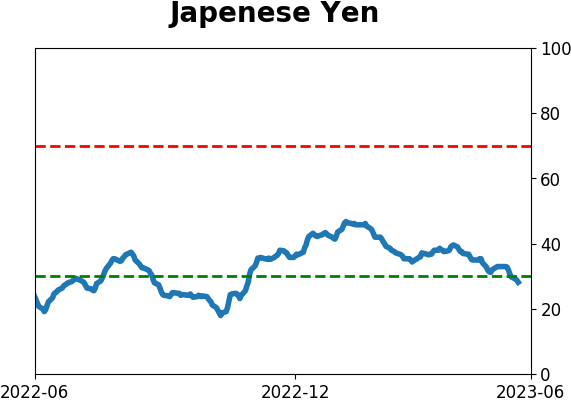
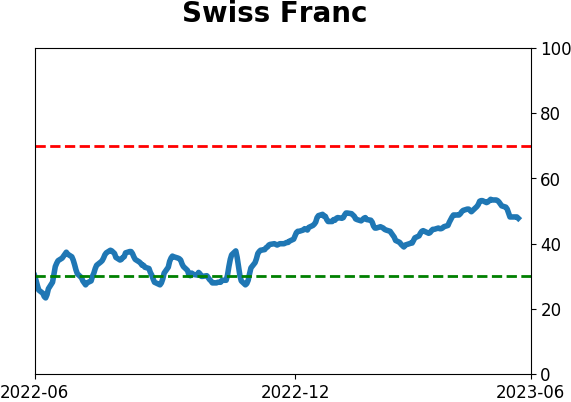
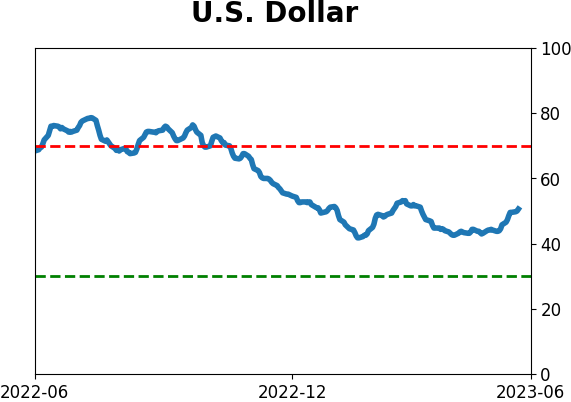
Currency ETF's - 5-Day Moving Average
|
|
|
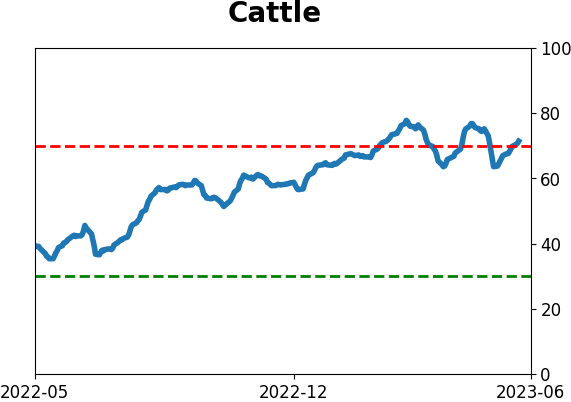
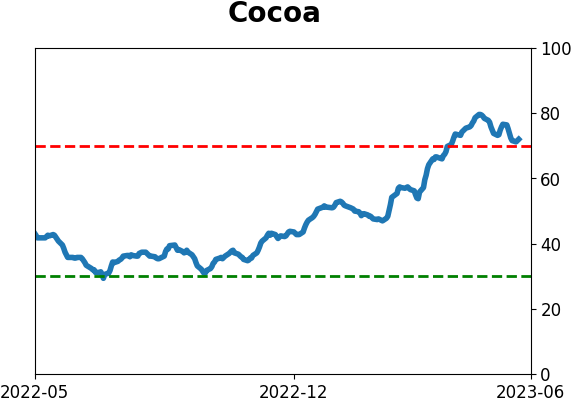
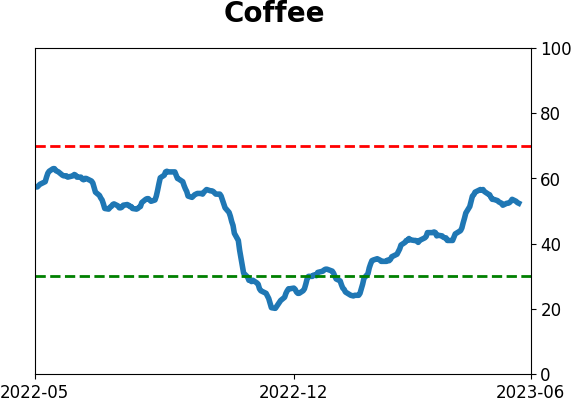
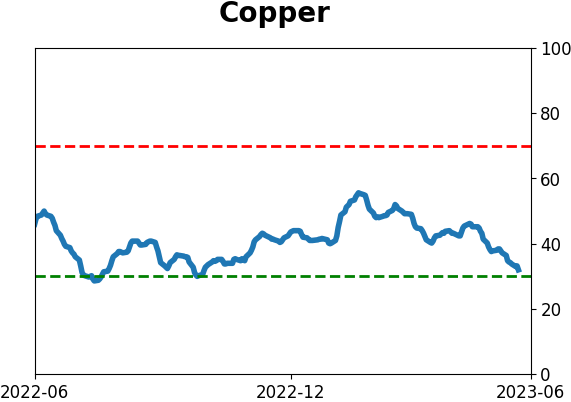
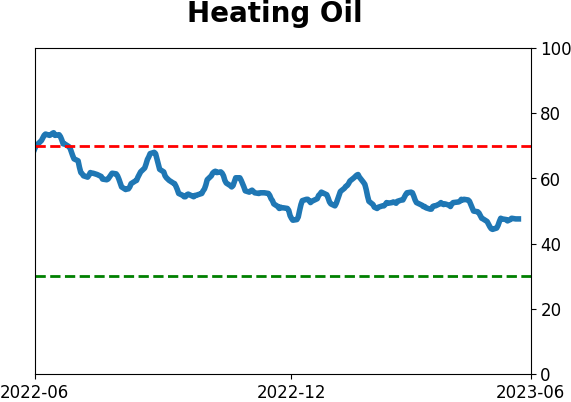
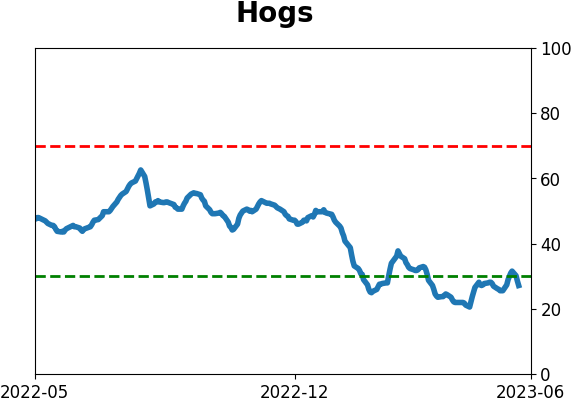
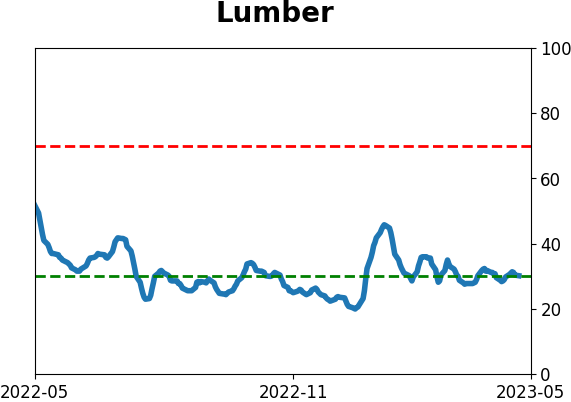
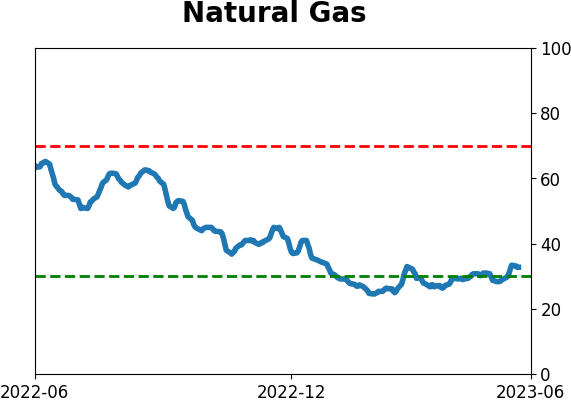
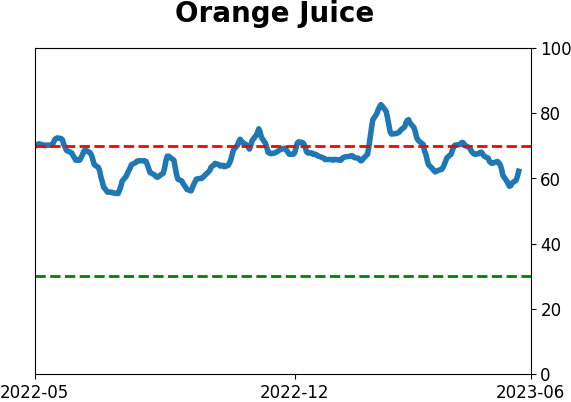
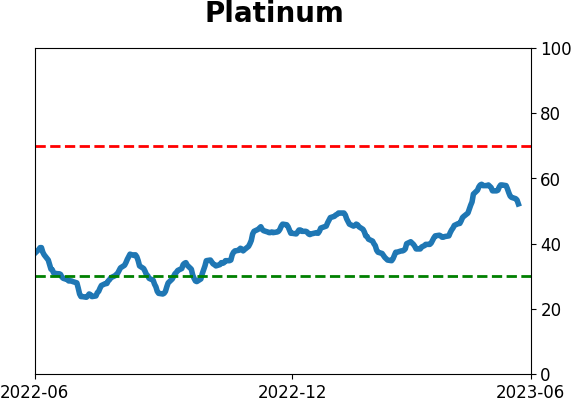
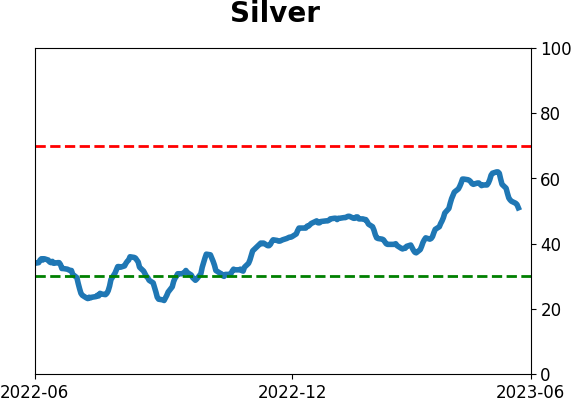
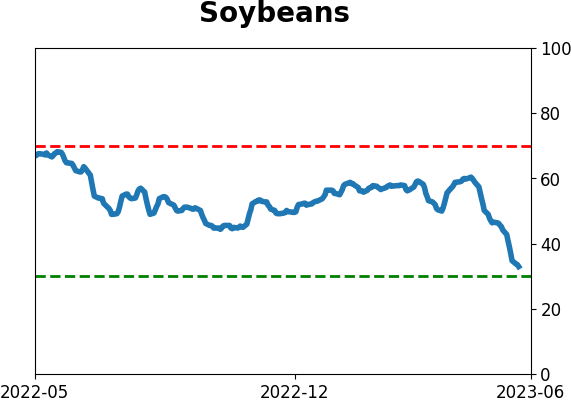
Commodity ETF's - 5-Day Moving Average
|
|