Headlines
|
|
The 30-30-30-10 Investment Strategy:
No investment strategy works all the time. Combining strategies that enjoy positive expectations but are not highly correlated can improve long-term results (not to mention mental health). While mechanical, objective strategies are best for taking the emotion out of investing, it can also be beneficial to trust your own instinctswith a limited portion of capital. Introducing the 30-30-30-10 Strategy.
|
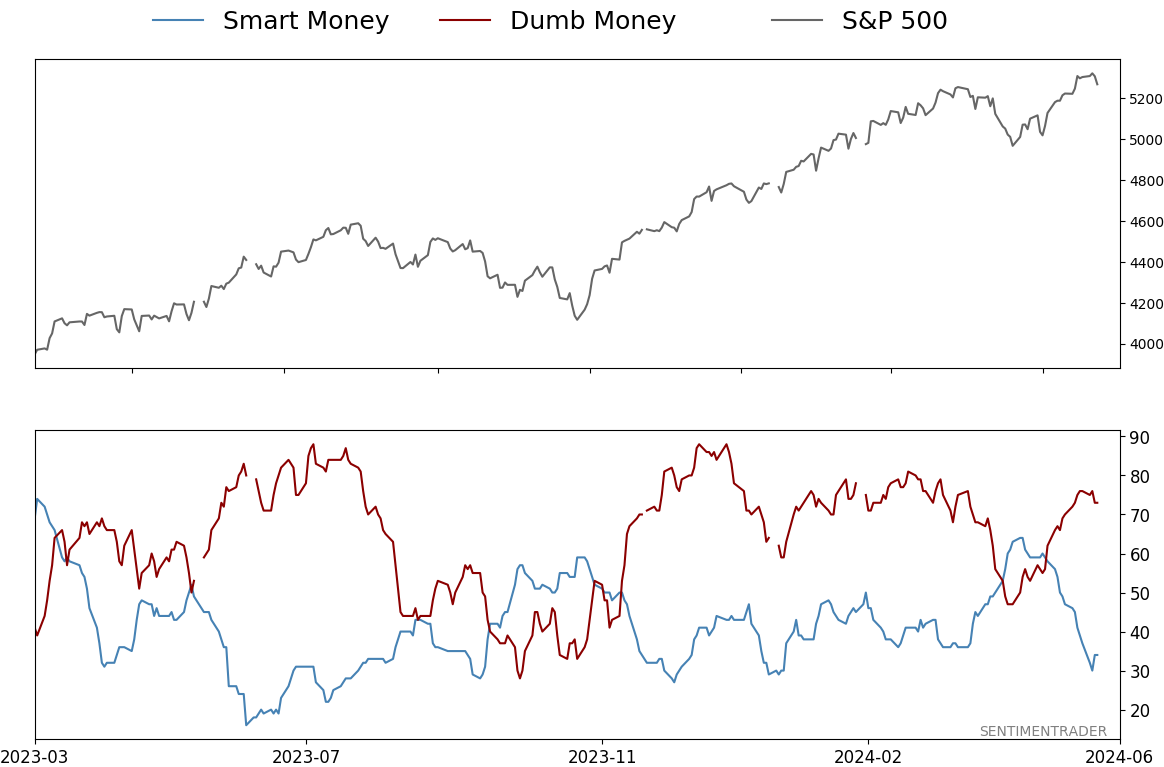
Smart / Dumb Money Confidence
|
Smart Money Confidence: 34%
Dumb Money Confidence: 73%
|
|
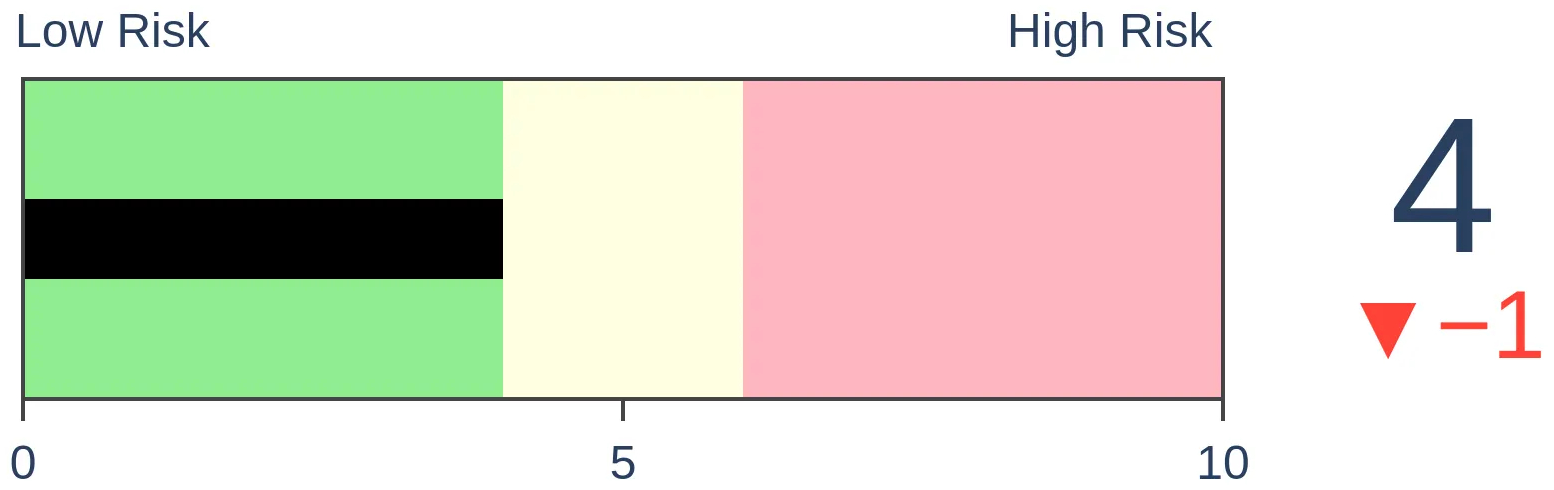
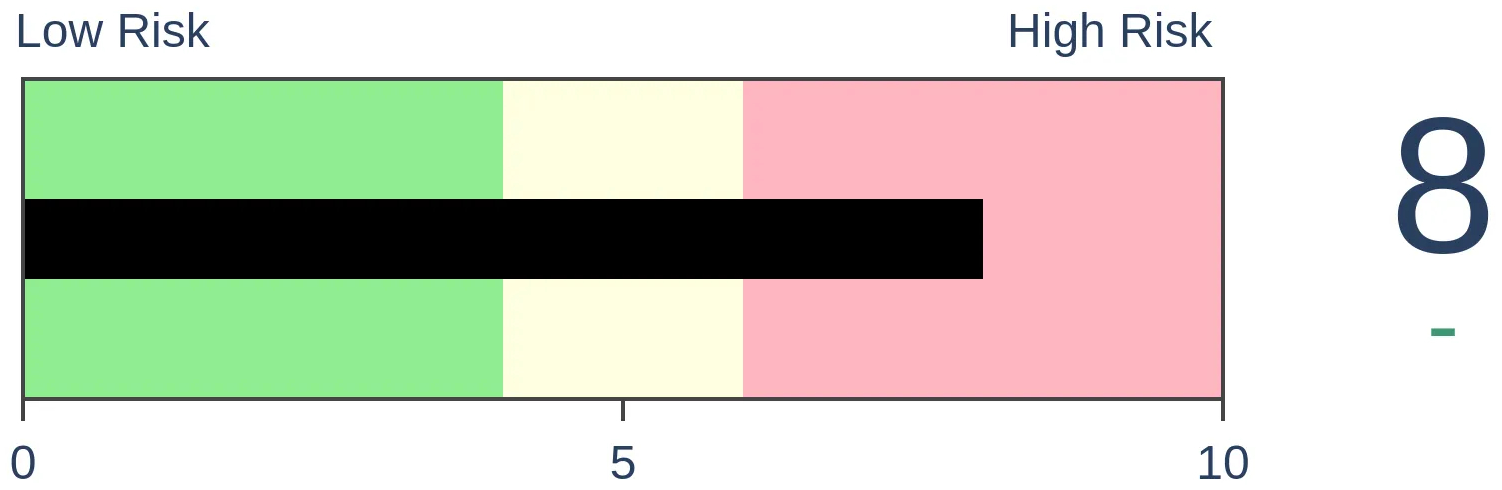
Risk Levels
Stocks Short-Term
|
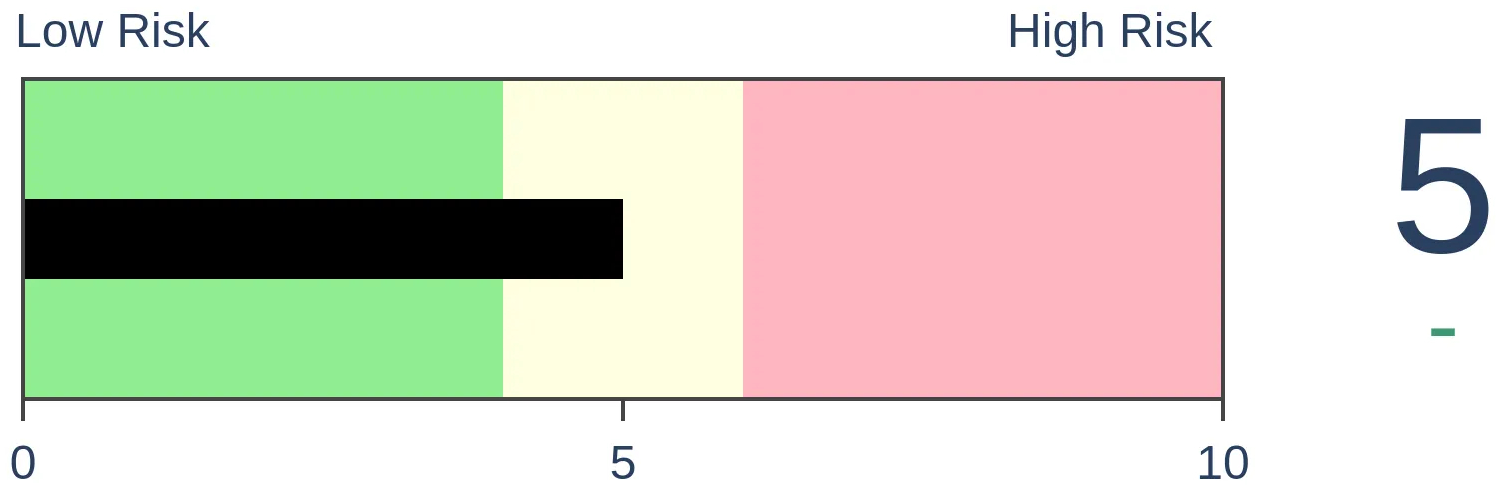
Stocks Medium-Term
|
|
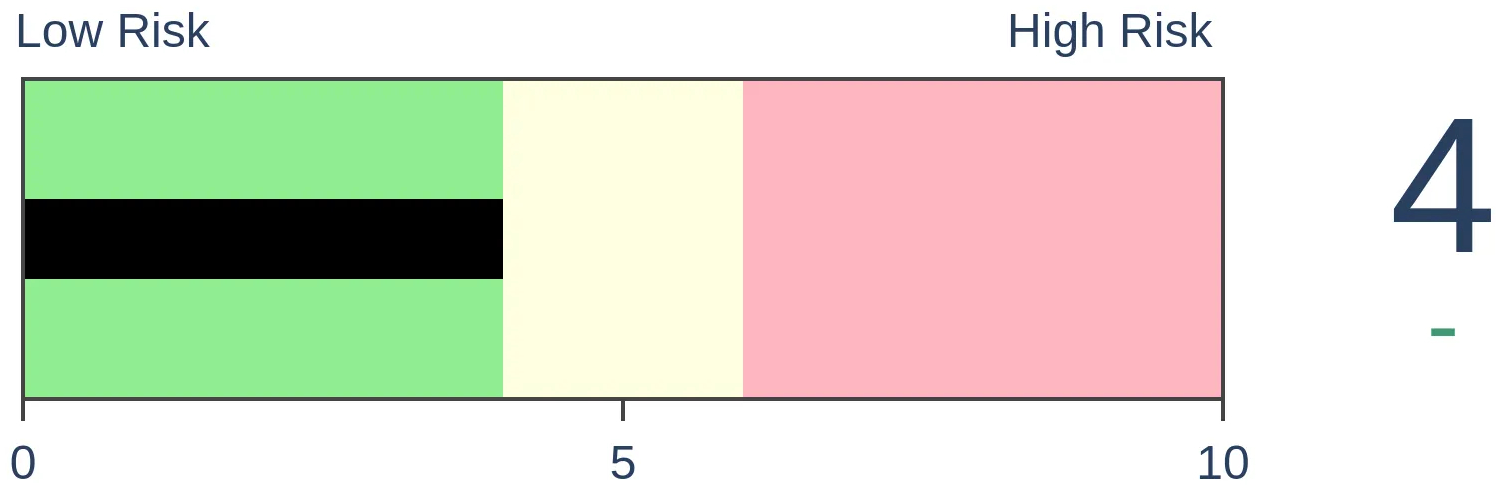
Bonds
|
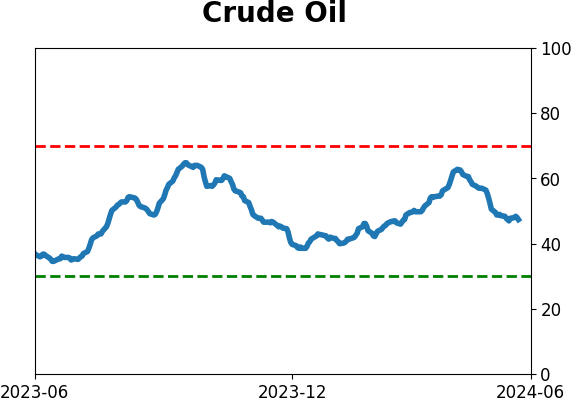
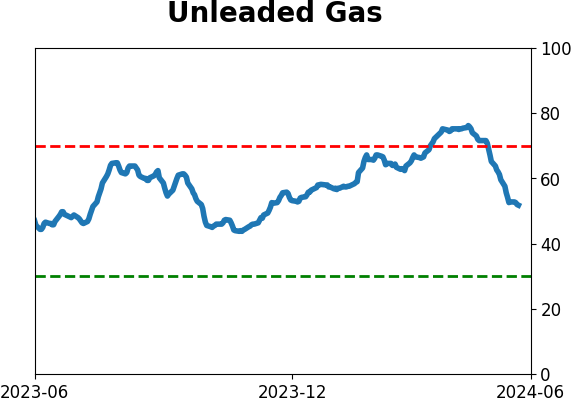
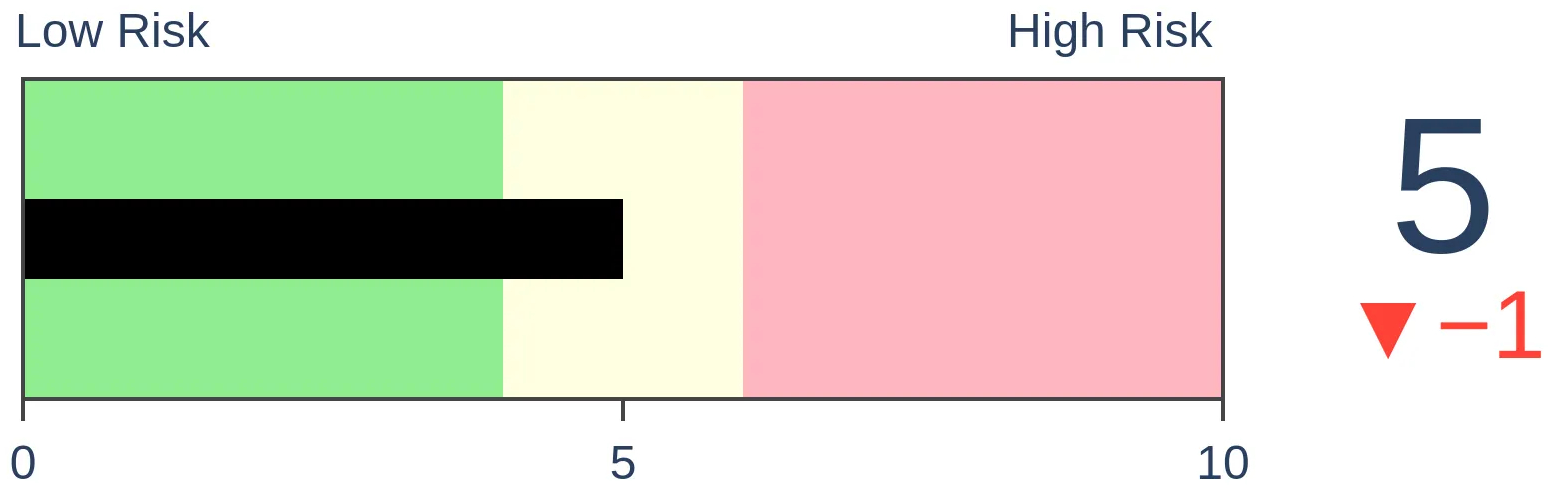
Crude Oil
|
|
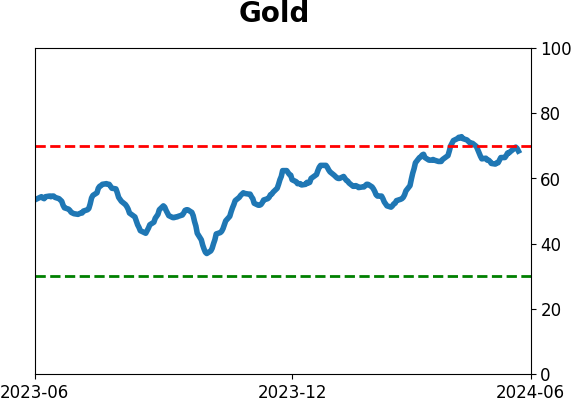
Gold
|
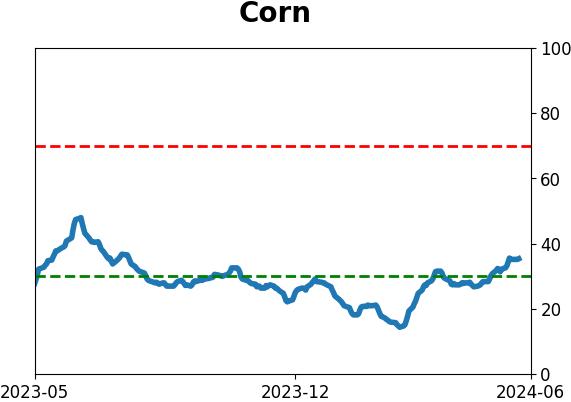
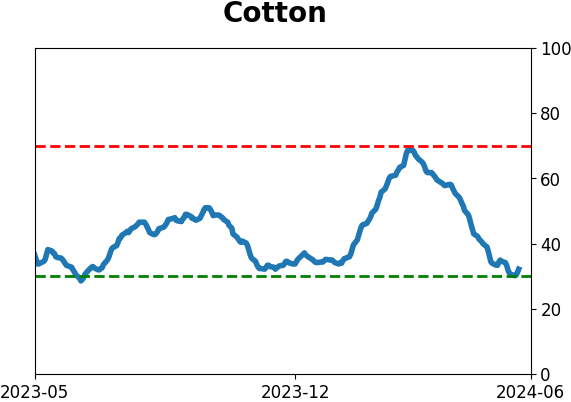
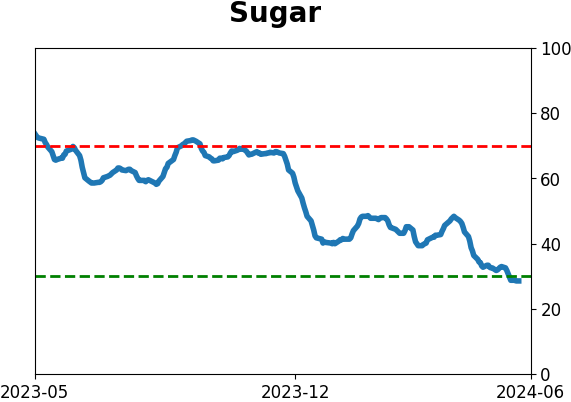
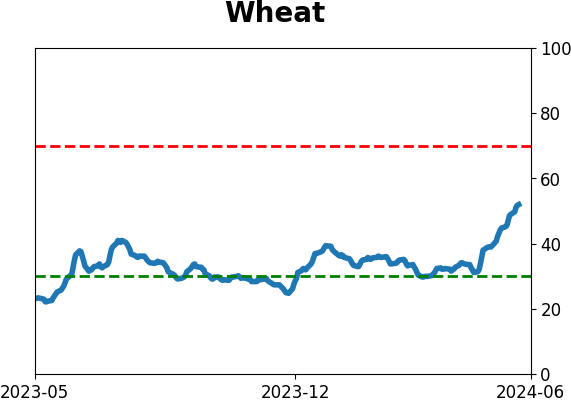
Agriculture

|
|
Research
By Jay Kaeppel
BOTTOM LINE
No investment strategy works all the time. Combining strategies that enjoy positive expectations but are not highly correlated can improve long-term results (not to mention mental health). While mechanical, objective strategies are best for taking the emotion out of investing, it can also be beneficial to trust your own instinctswith a limited portion of capital. Introducing the 30-30-30-10 Strategy.
FORECAST / TIMEFRAME
None
|
Key points:
- The link below allows you to view a webinar sponsored and hosted by NAAIM (National Association of Active Investment Managers)
- The topic is "How I Invest by Jay Kaeppel: The 30-30-10 Strategy
- The concept involves combining investment strategies into a comprehensive approach
The purpose of the video
The 30-30-30-10 Strategy is an investment allocation method I originally developed strictly for my own use. Over time, a number of individuals I have shared the concept with have stated that they found it helpful in organizing their own approach to investing. Included in this group is Ryan Redfern, President of NAAIM. He invited me to present the concept to NAAIM members via a webinar. The webinar occurred on 2024-05-15, and the link below will take you to the recording via NAAIM.
About the 30-30-30-10 Strategy
Without going into much detail (since the video does that), the 30-30-30-10 Strategy is a concept based on the notion that there is no "one best way" to invest. Over many years of research, I have found many investment approaches that can achieve success over time. However, no one strategy always makes money. The overarching idea behind the strategy is to combine investment approaches that have positive expectations but are not highly correlated. The goal is to achieve consistent profitability while also (hopefully) reducing the fluctuations in an account's equity curve (which will hopefully keep an investor from deviating from their approach).
Link to the 30-30-30-10 Strategy webinar
https://attendee.gotowebinar.com/recording/686325492914059523
Indicators at Extremes
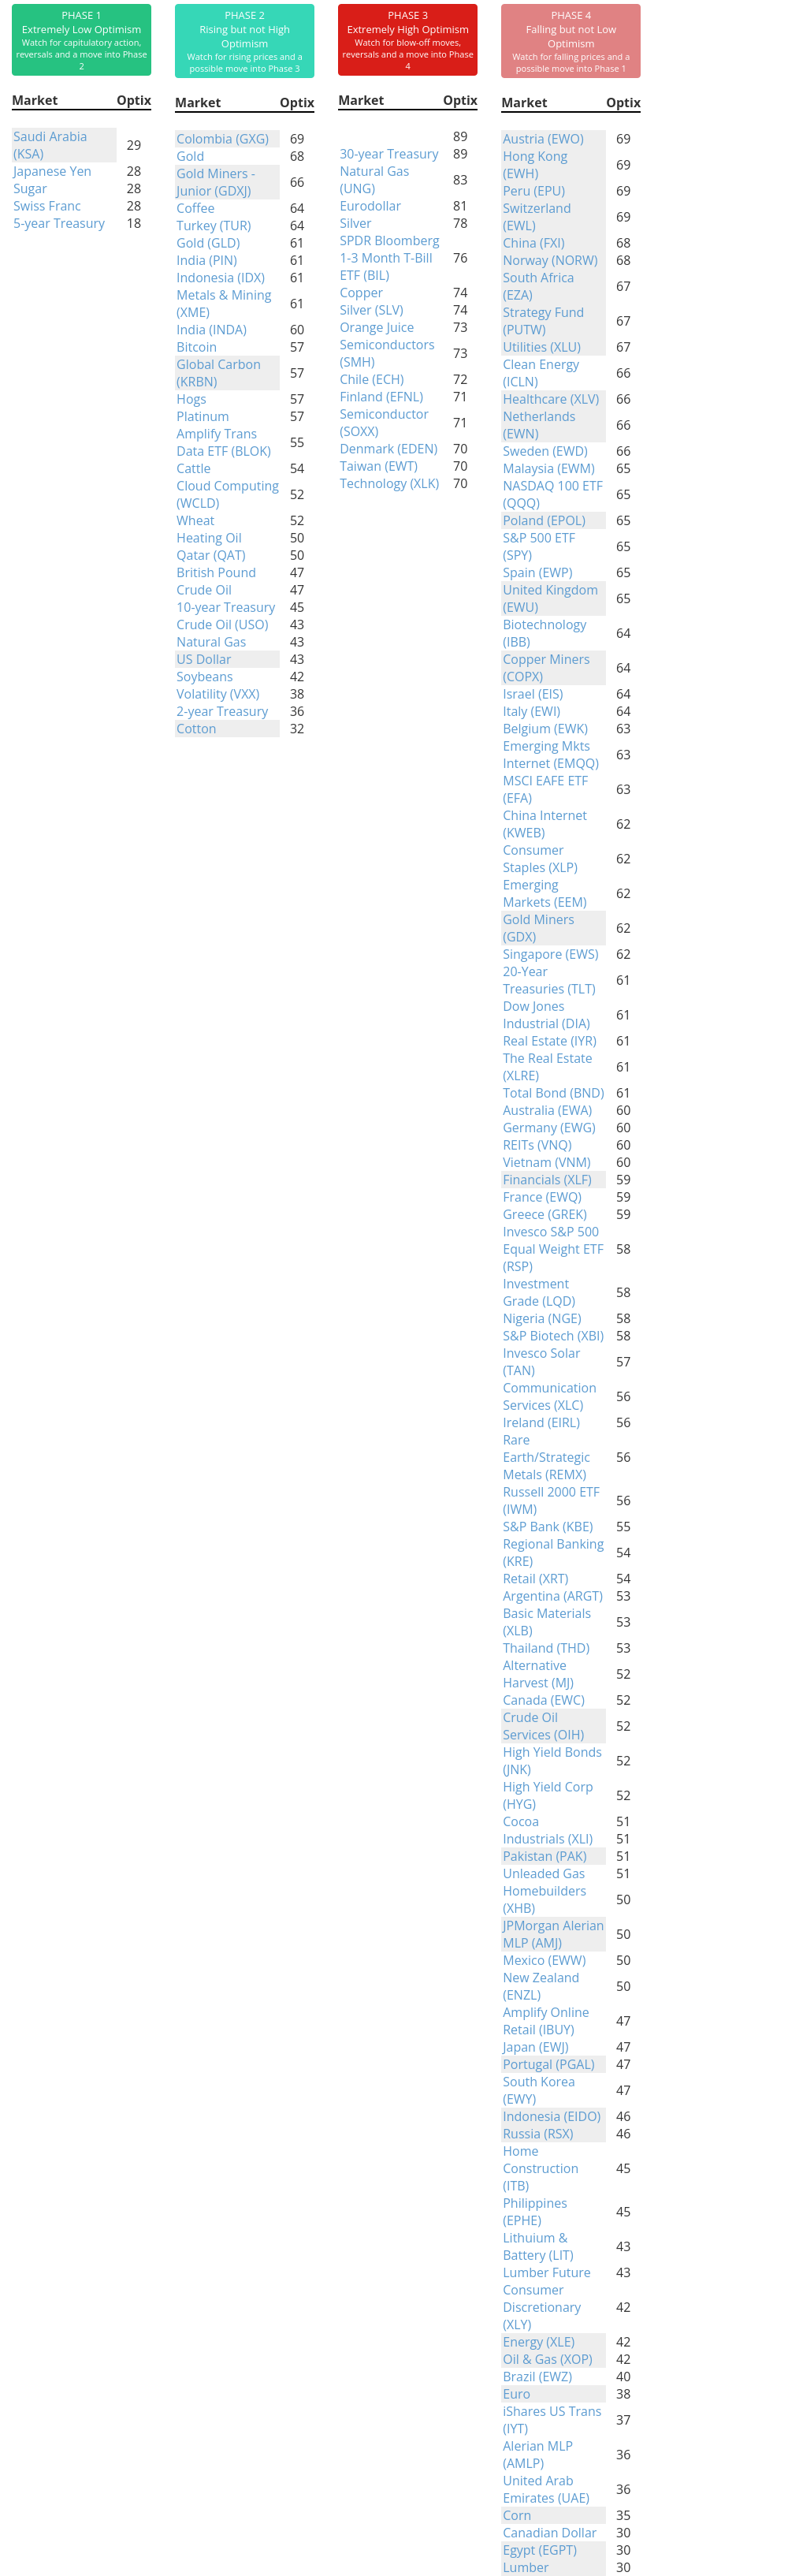
Phase Table
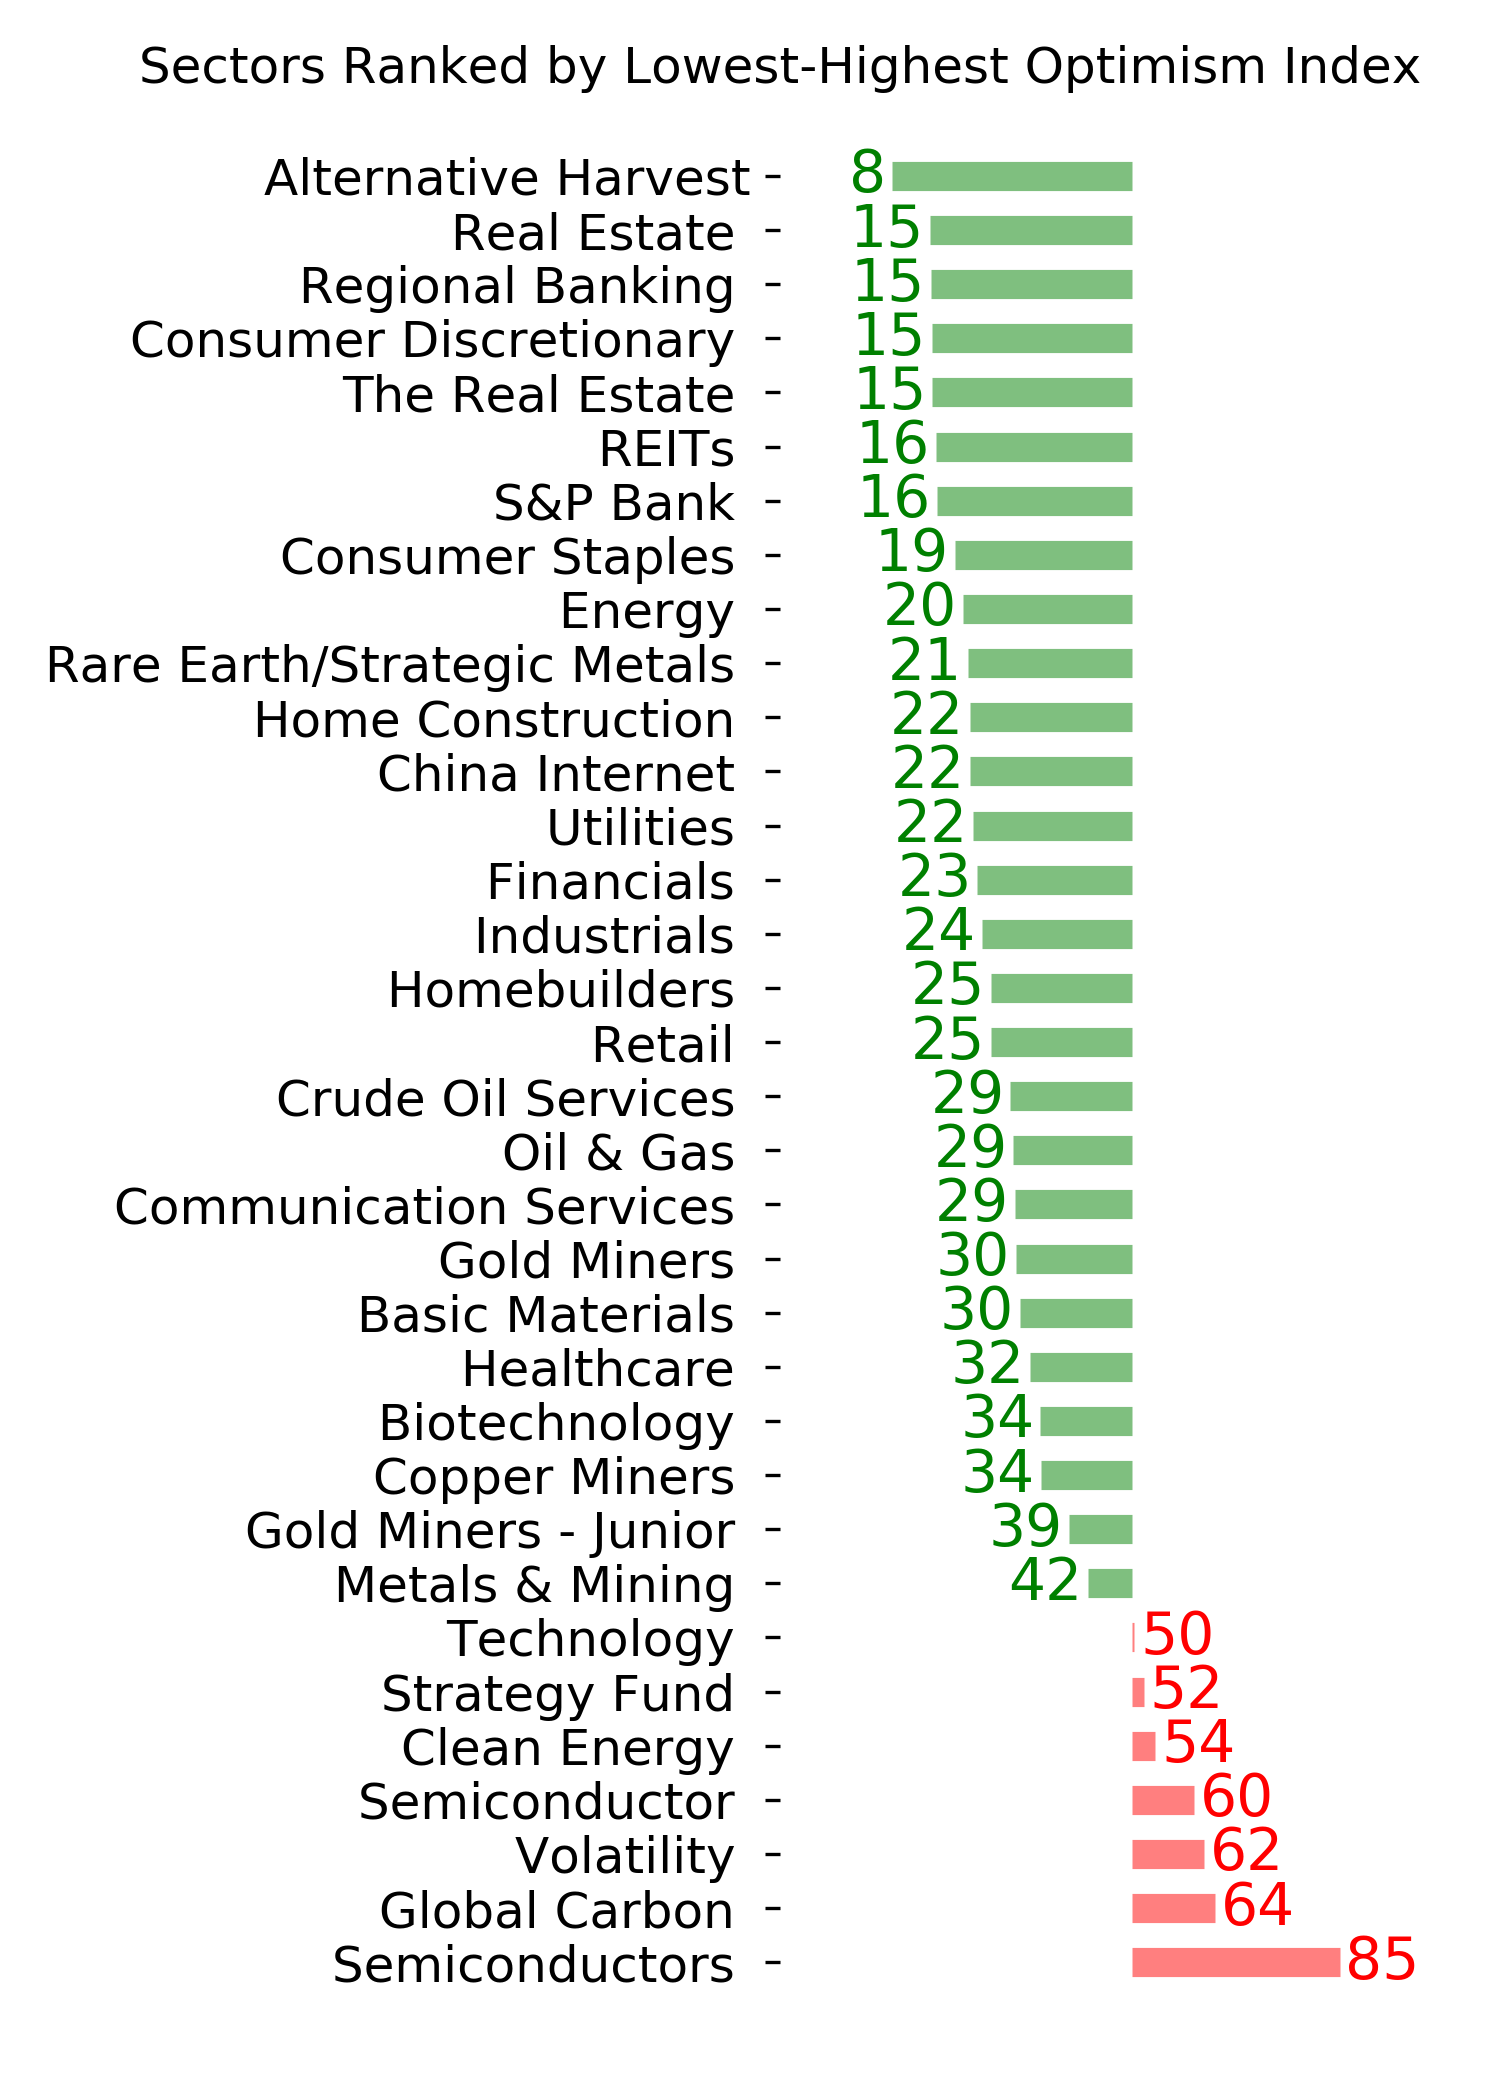
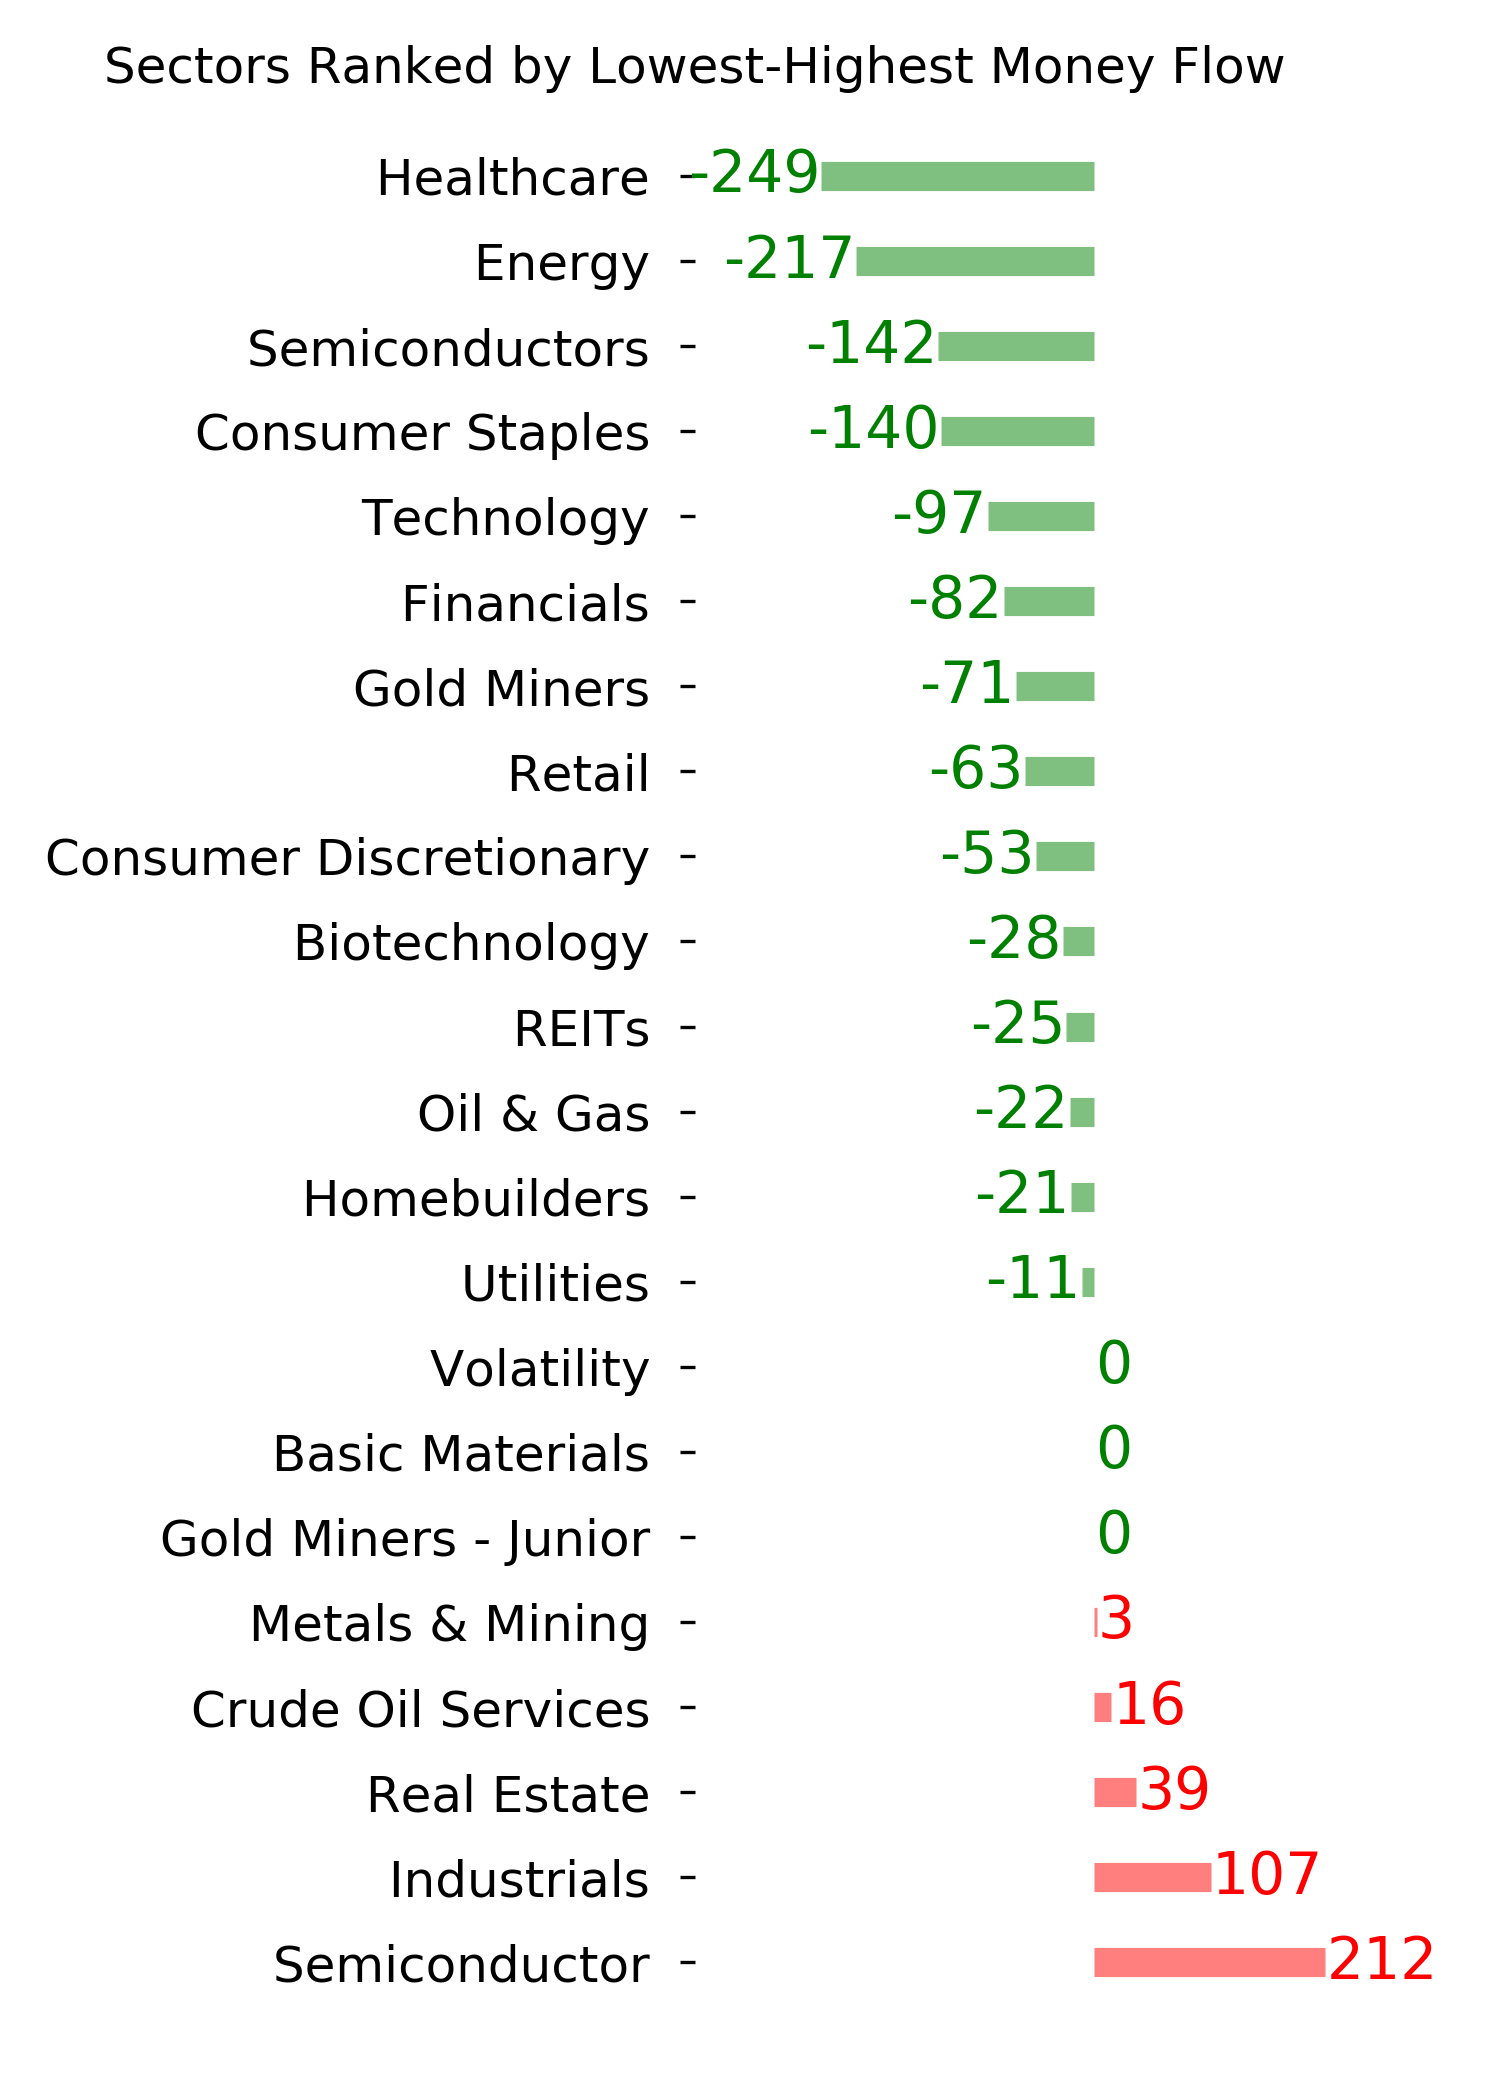
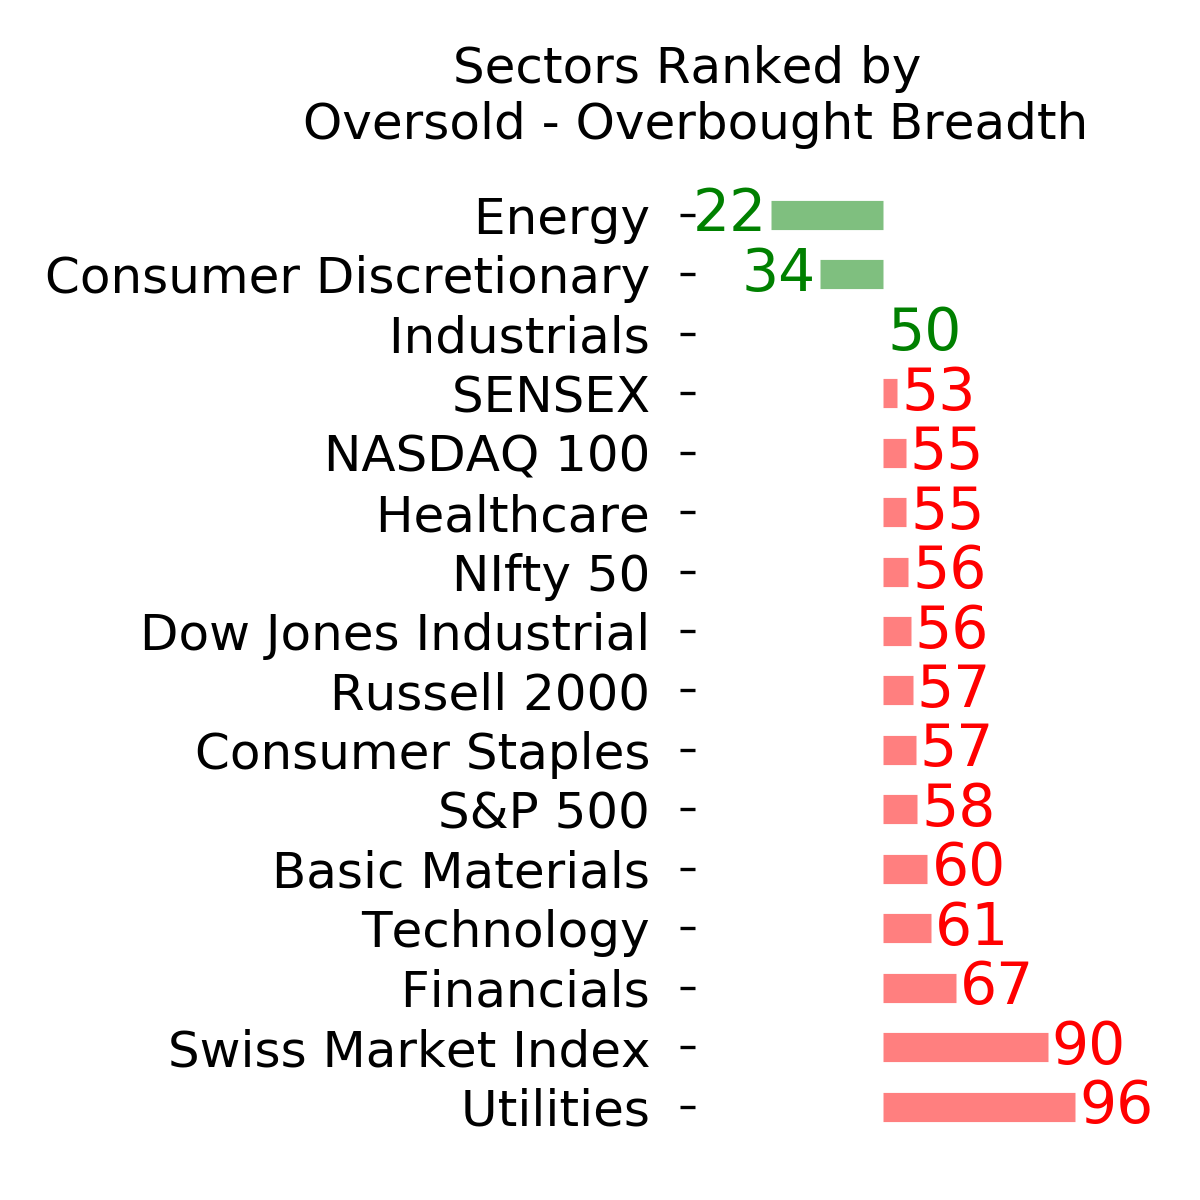
Ranks
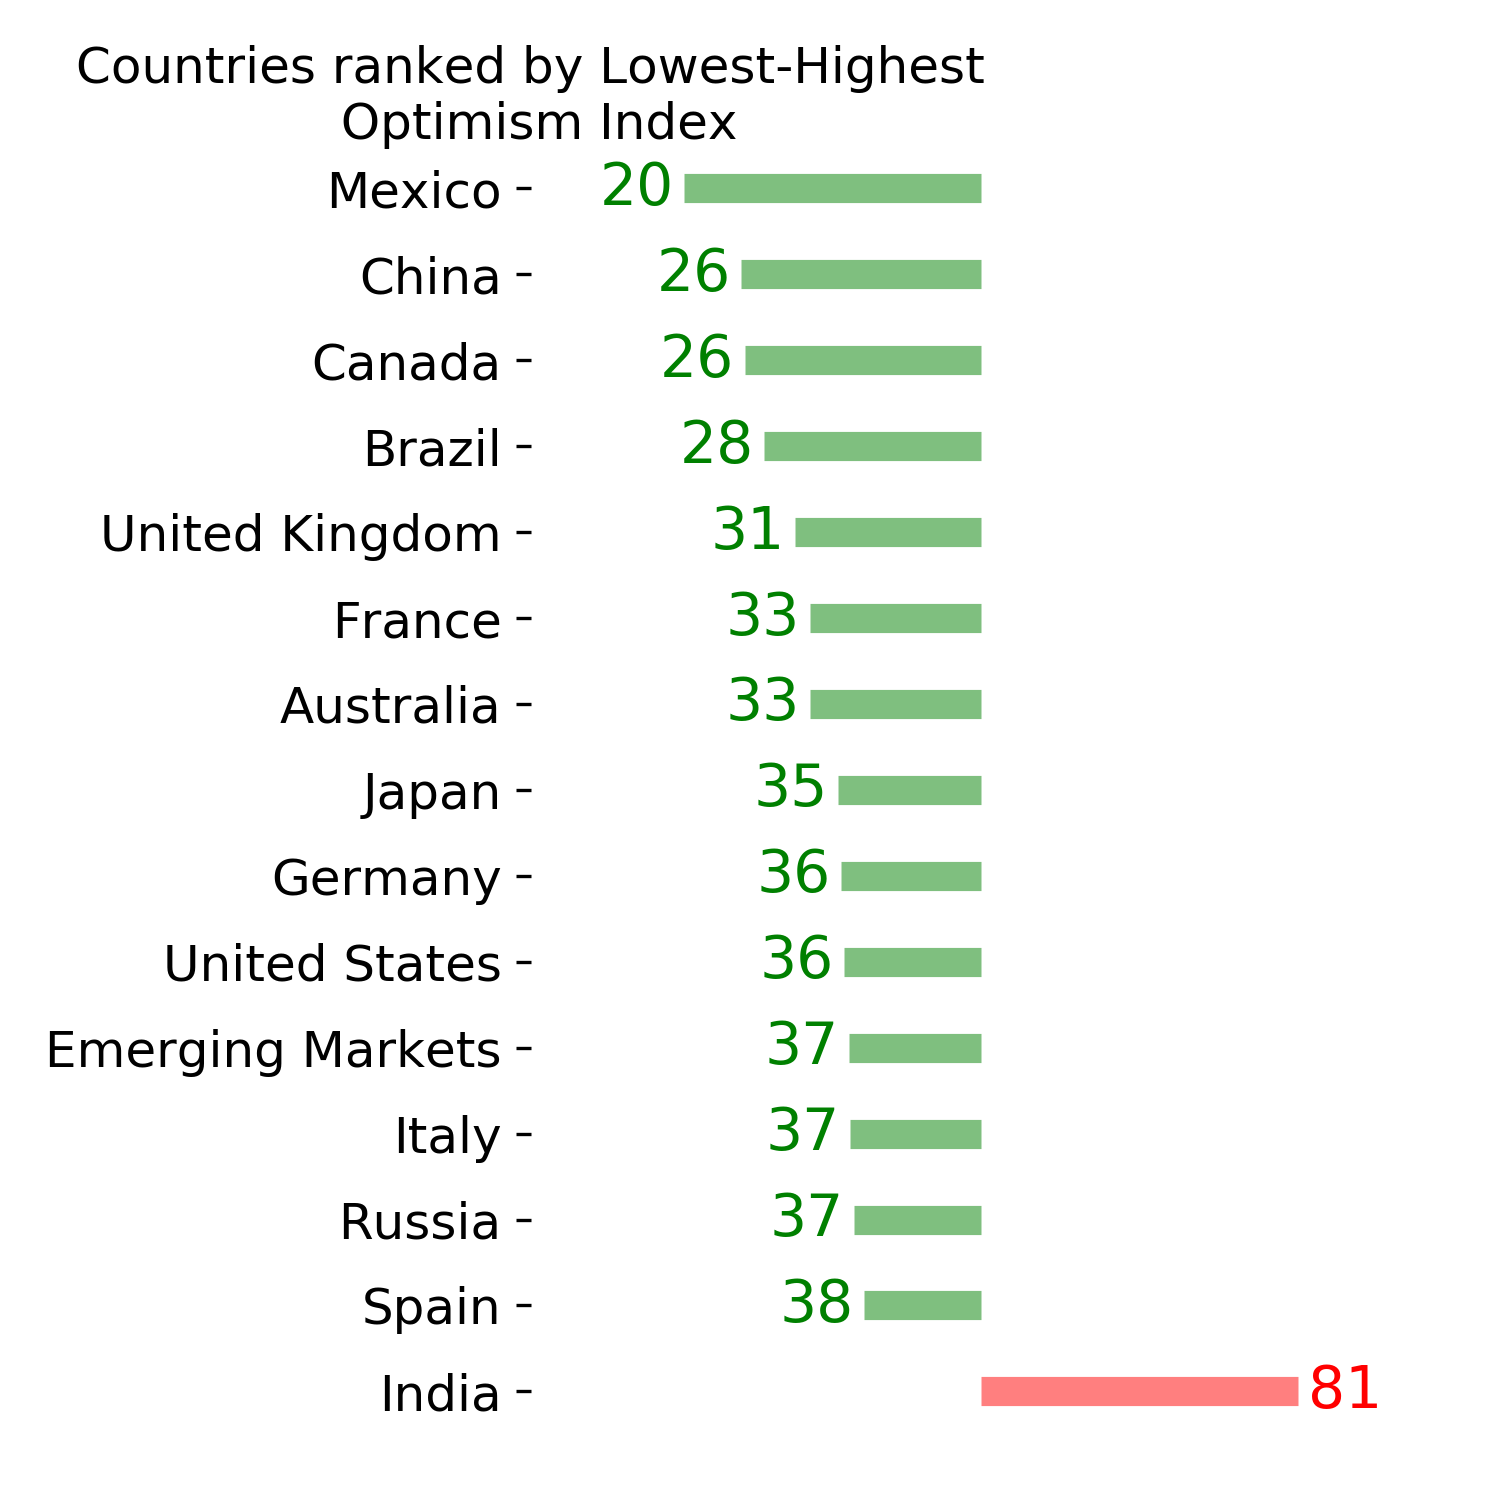
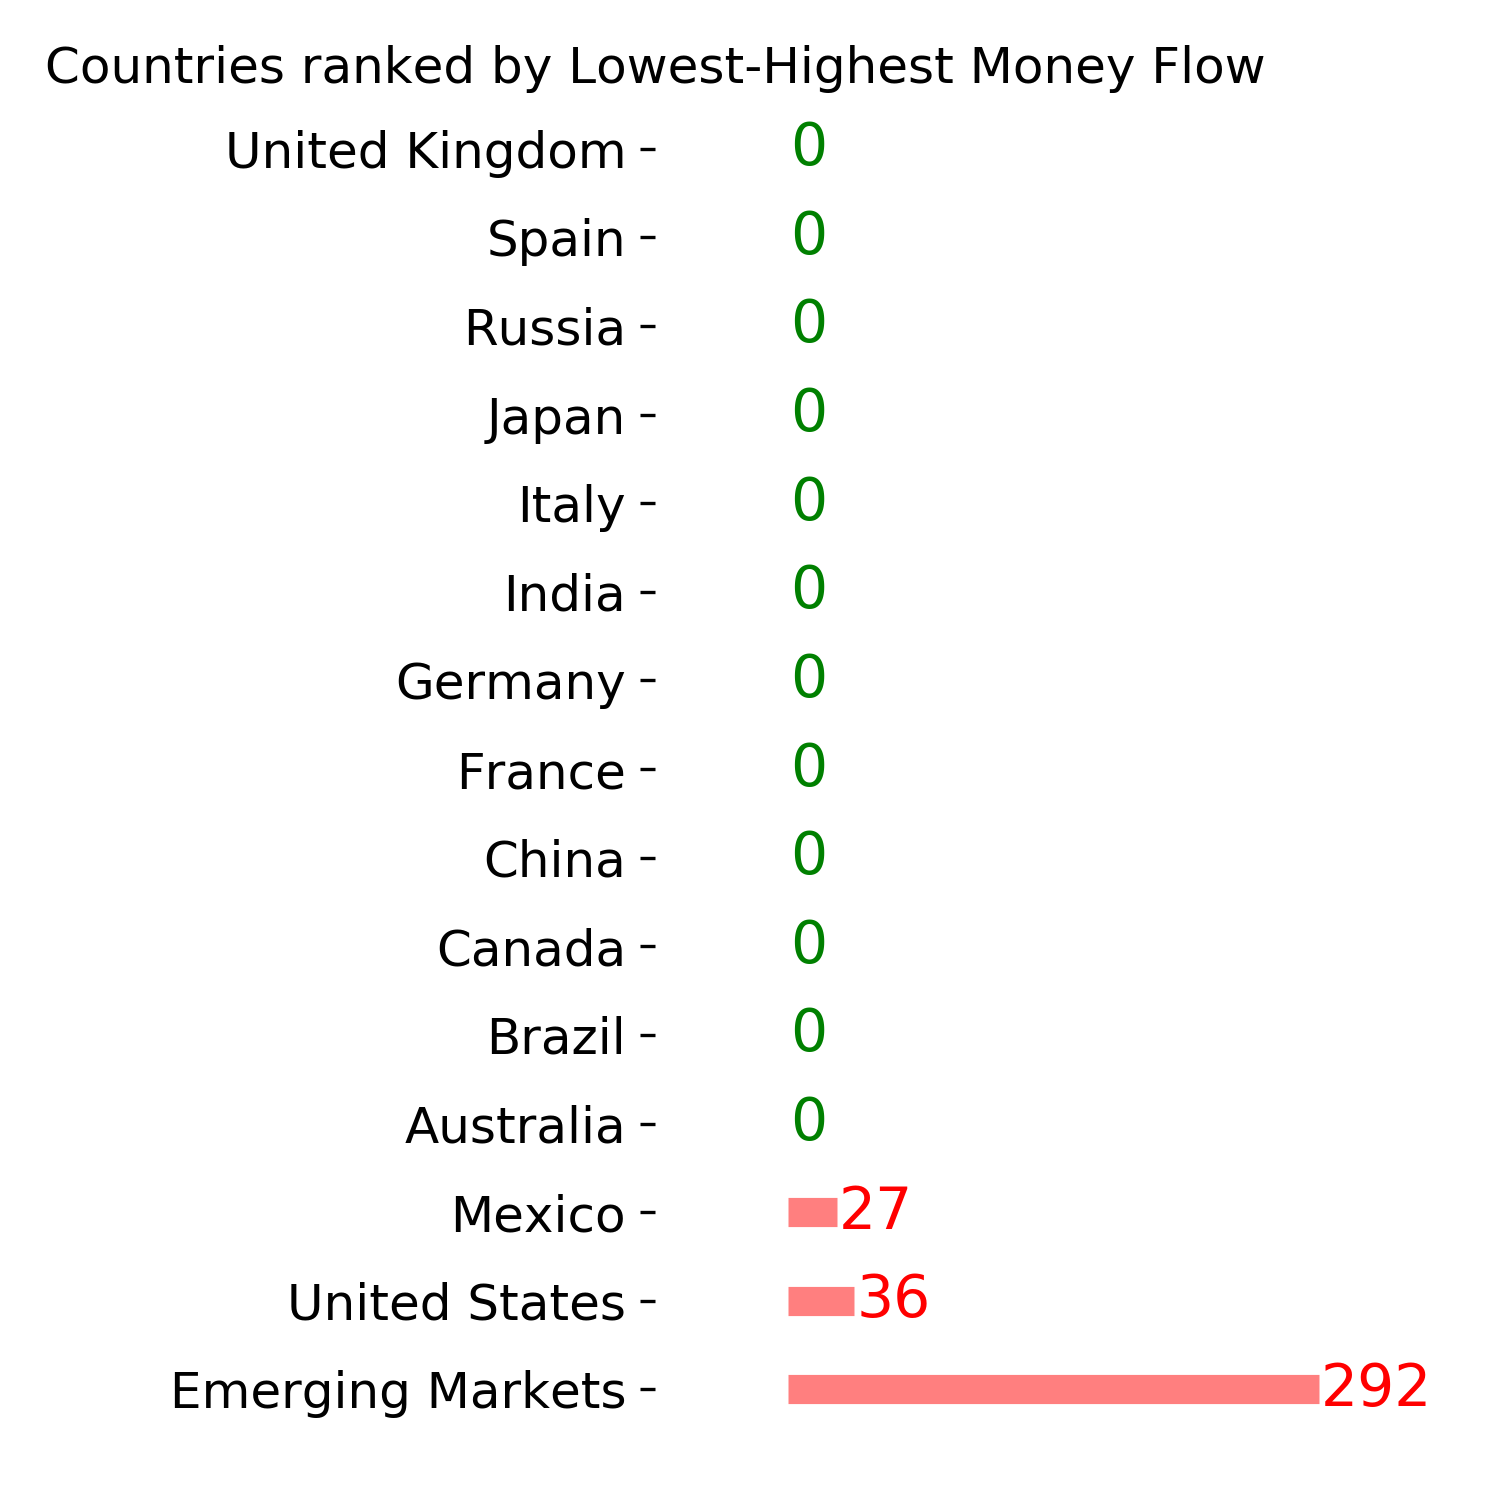
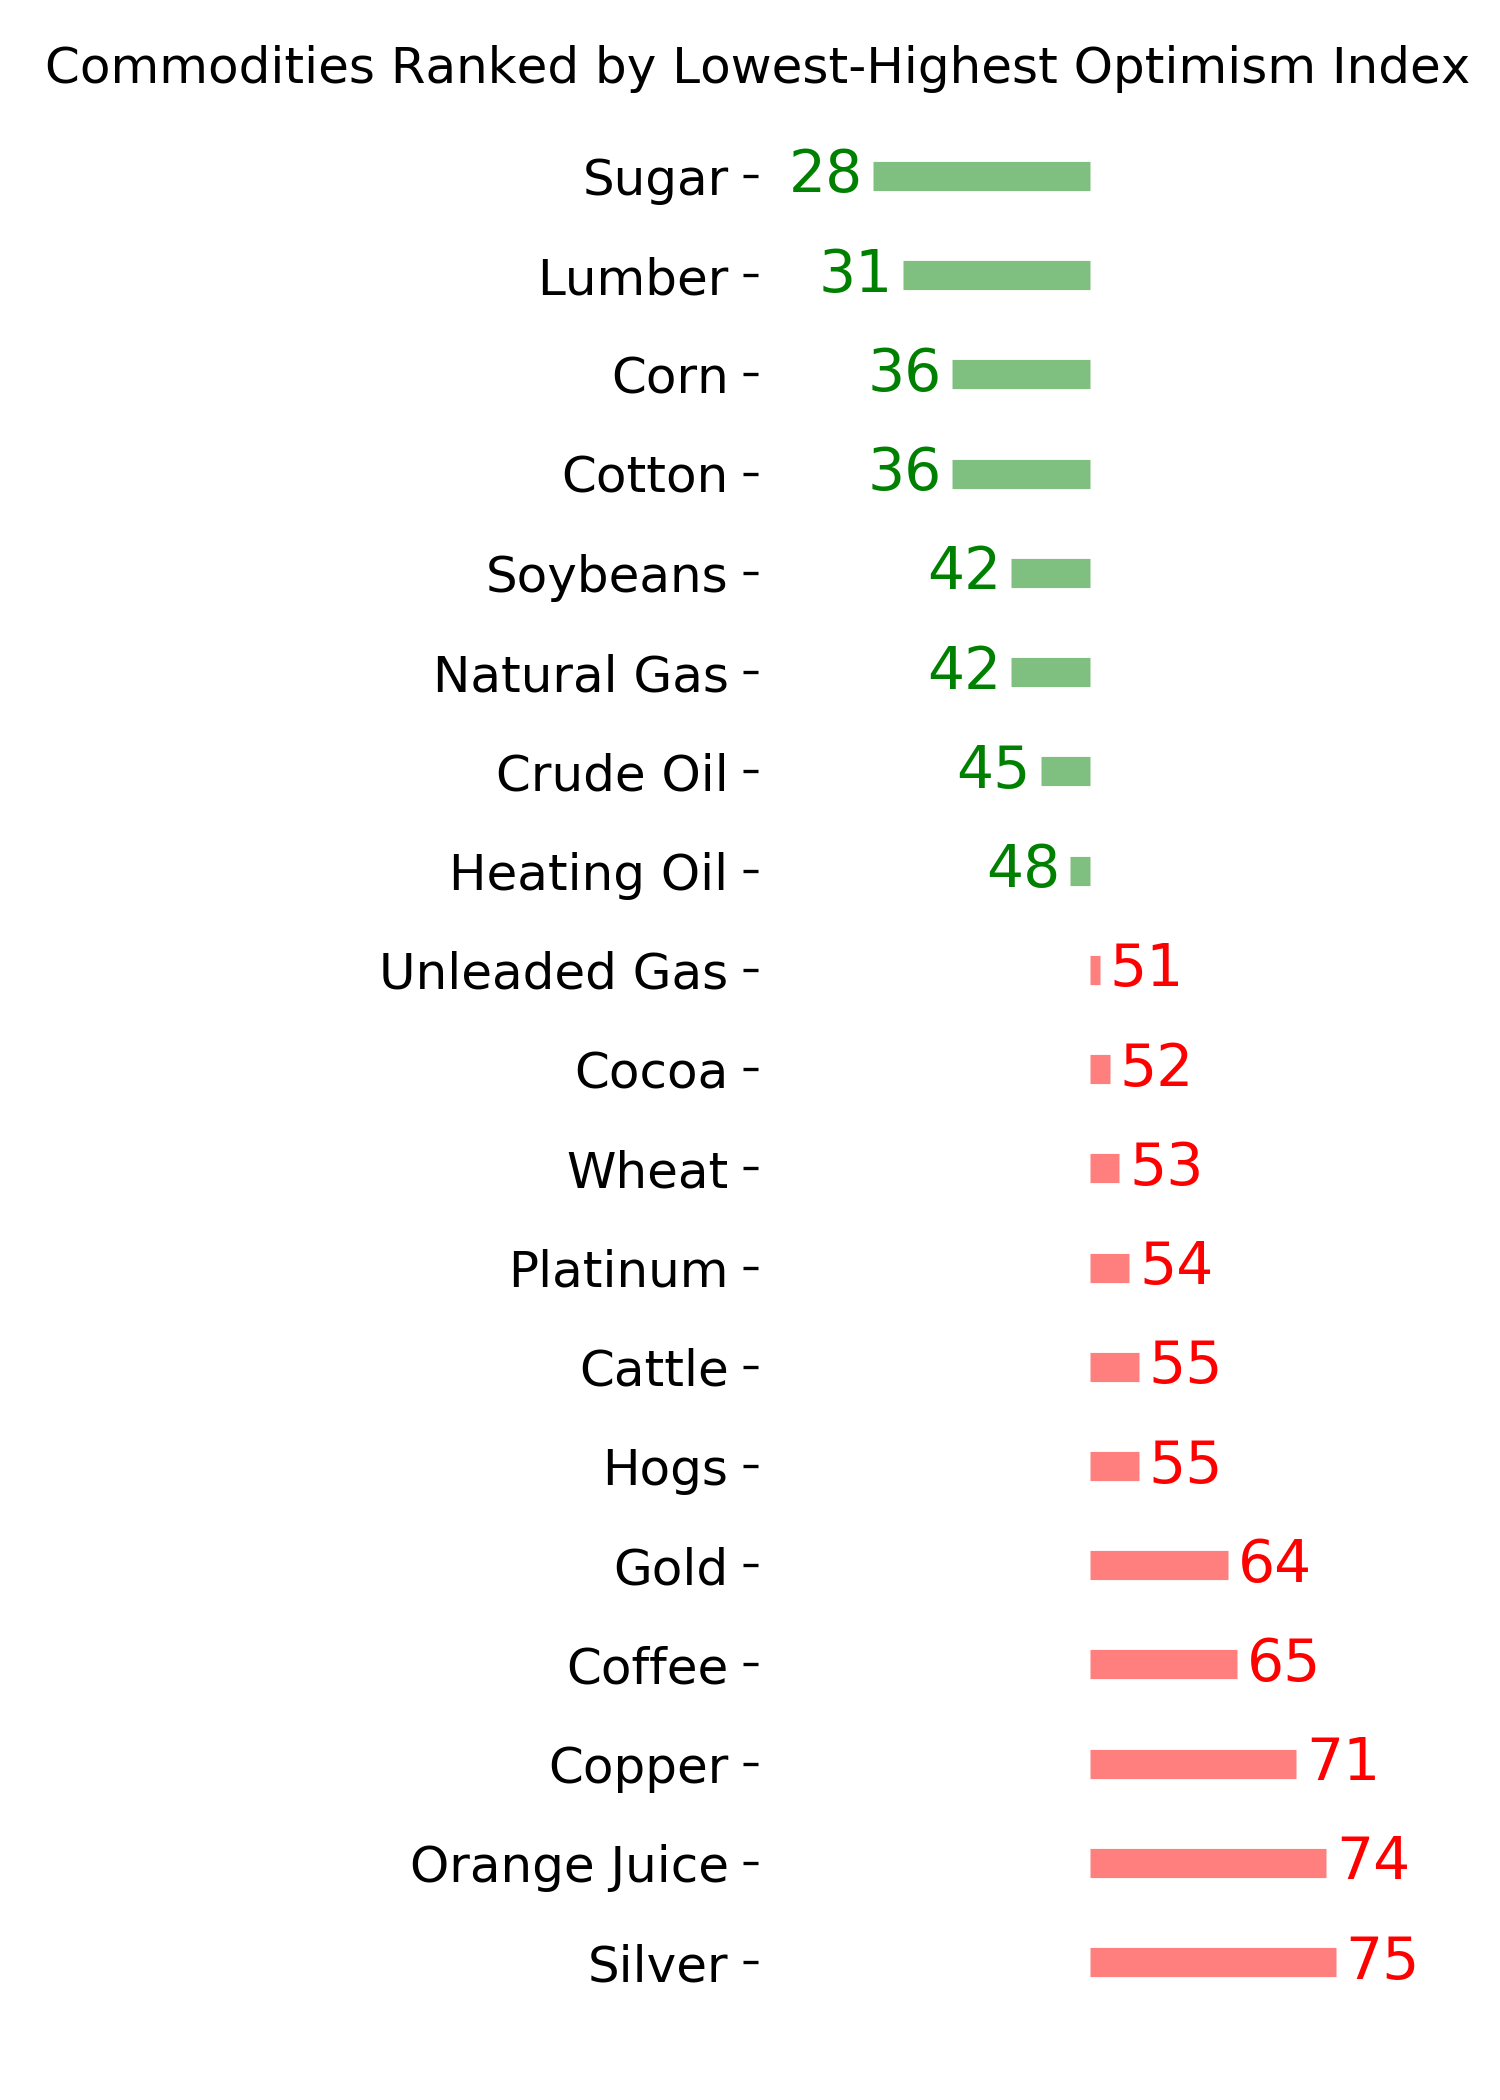
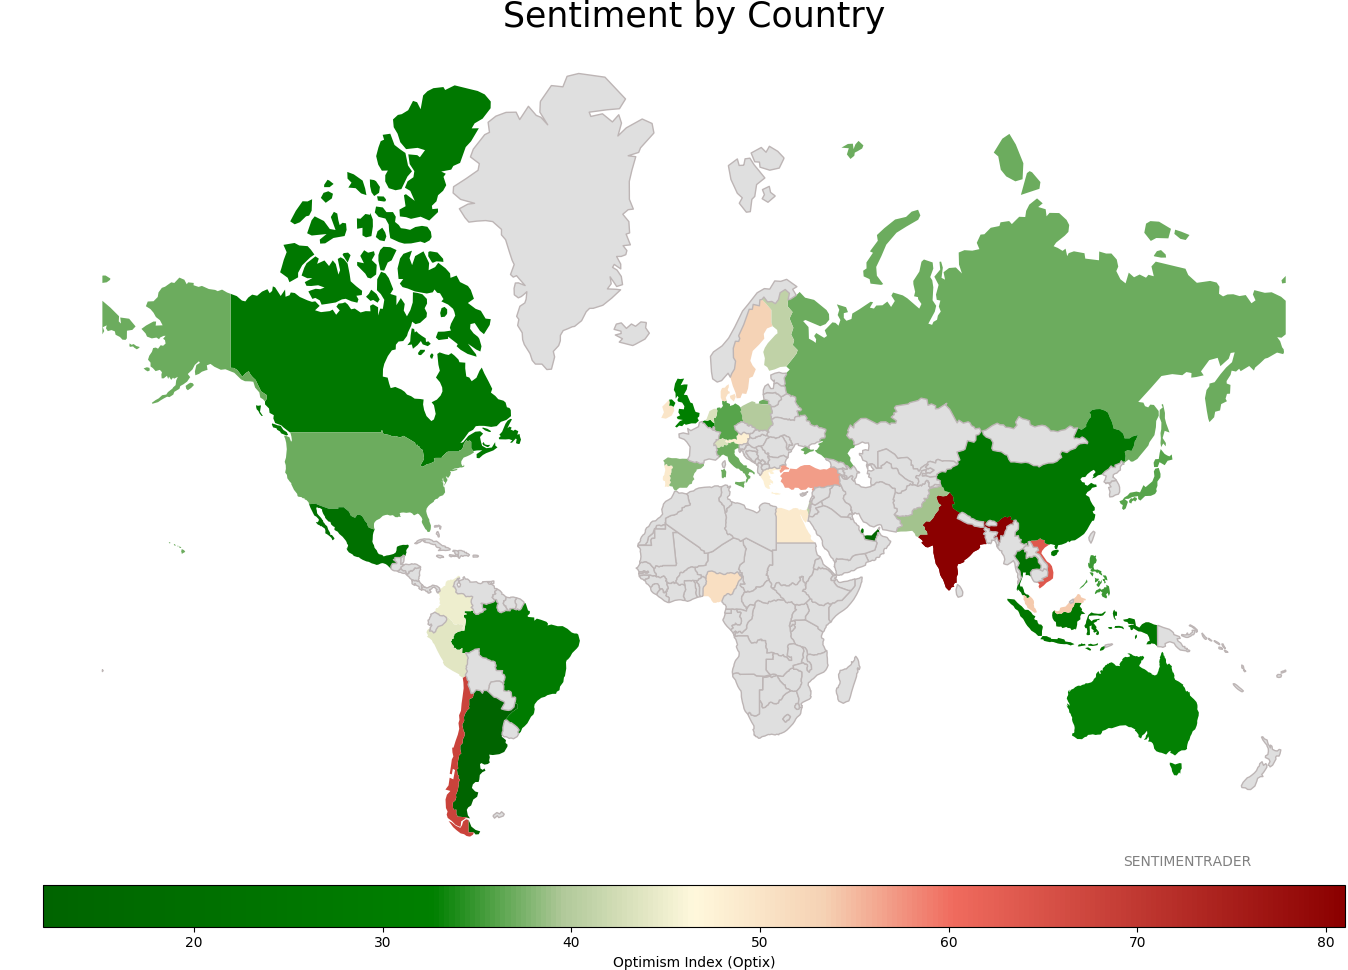
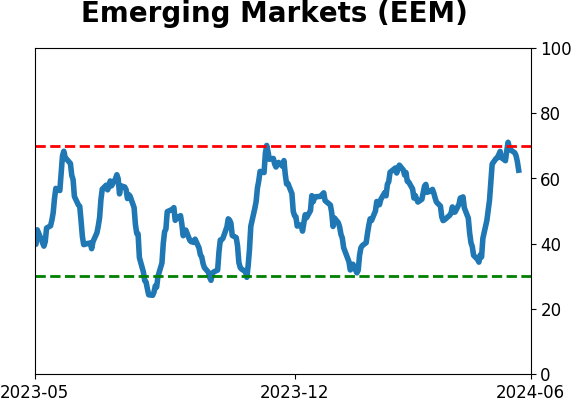
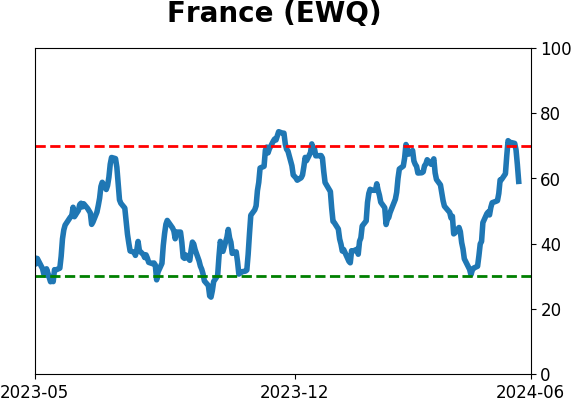
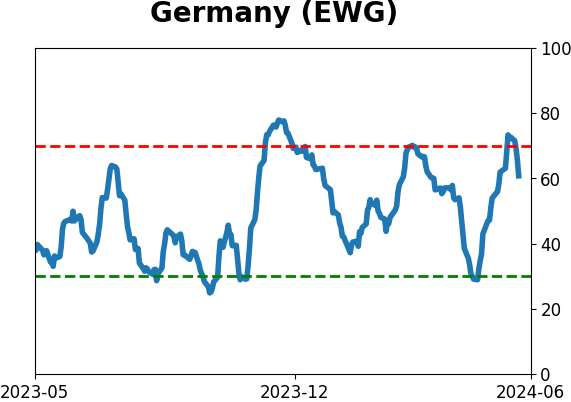
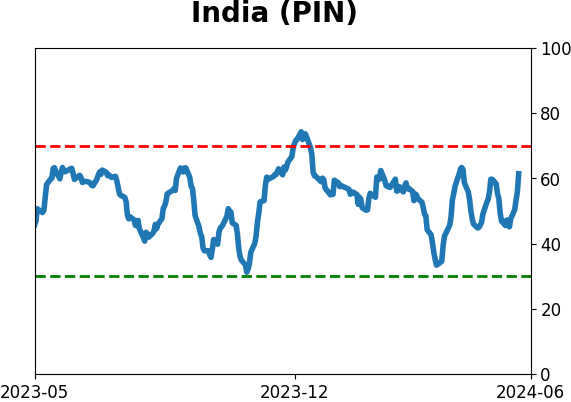
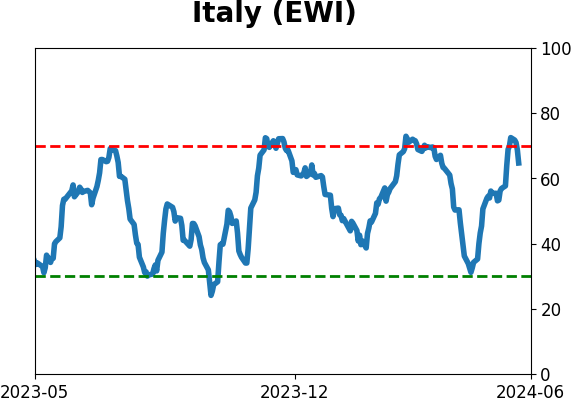
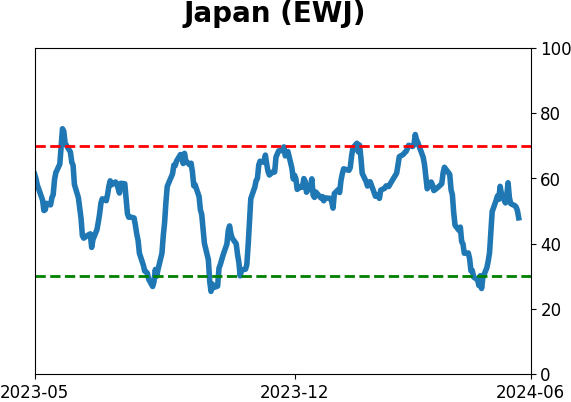
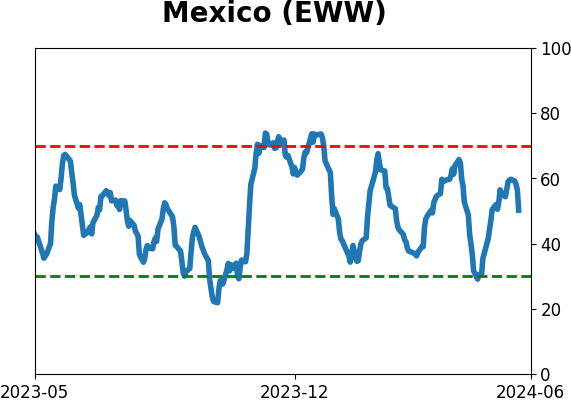
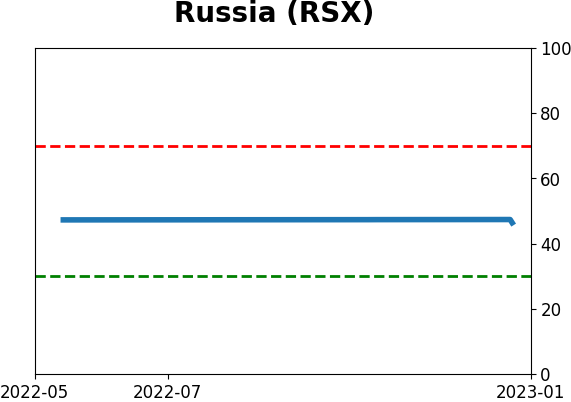
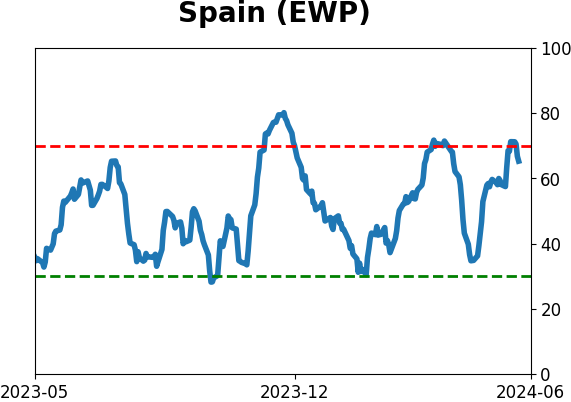
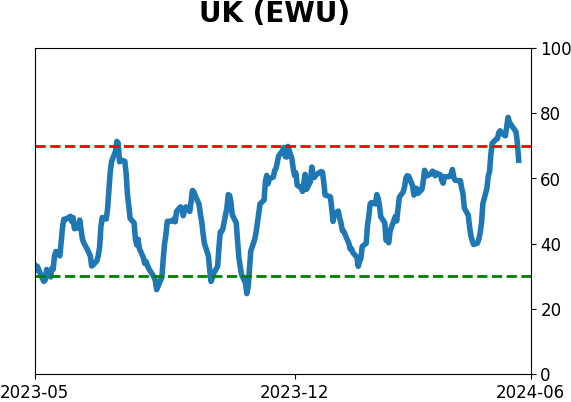
Sentiment Around The World
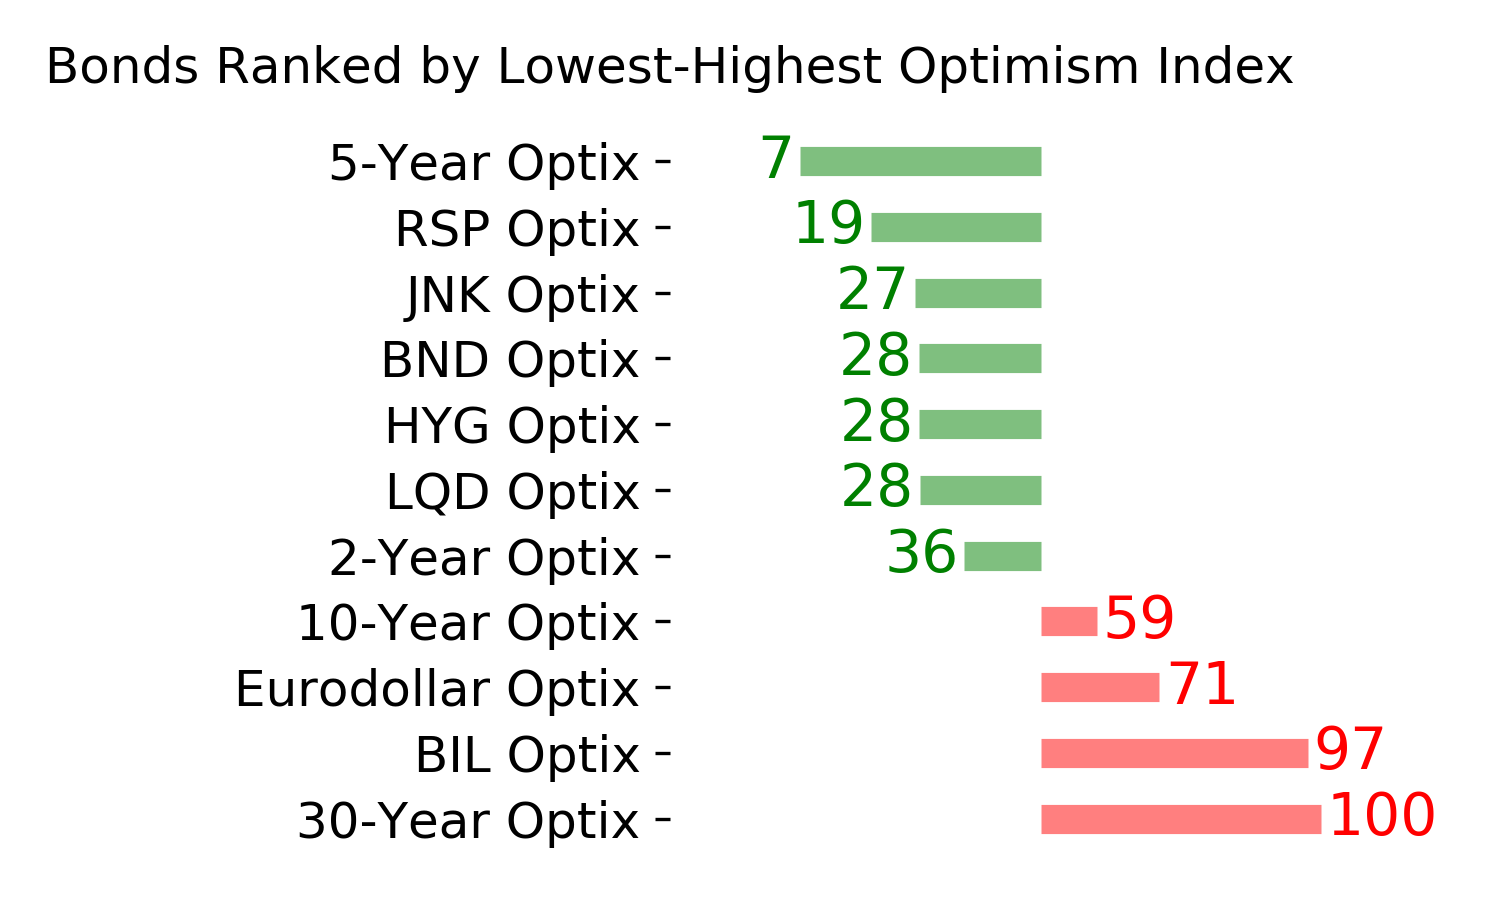
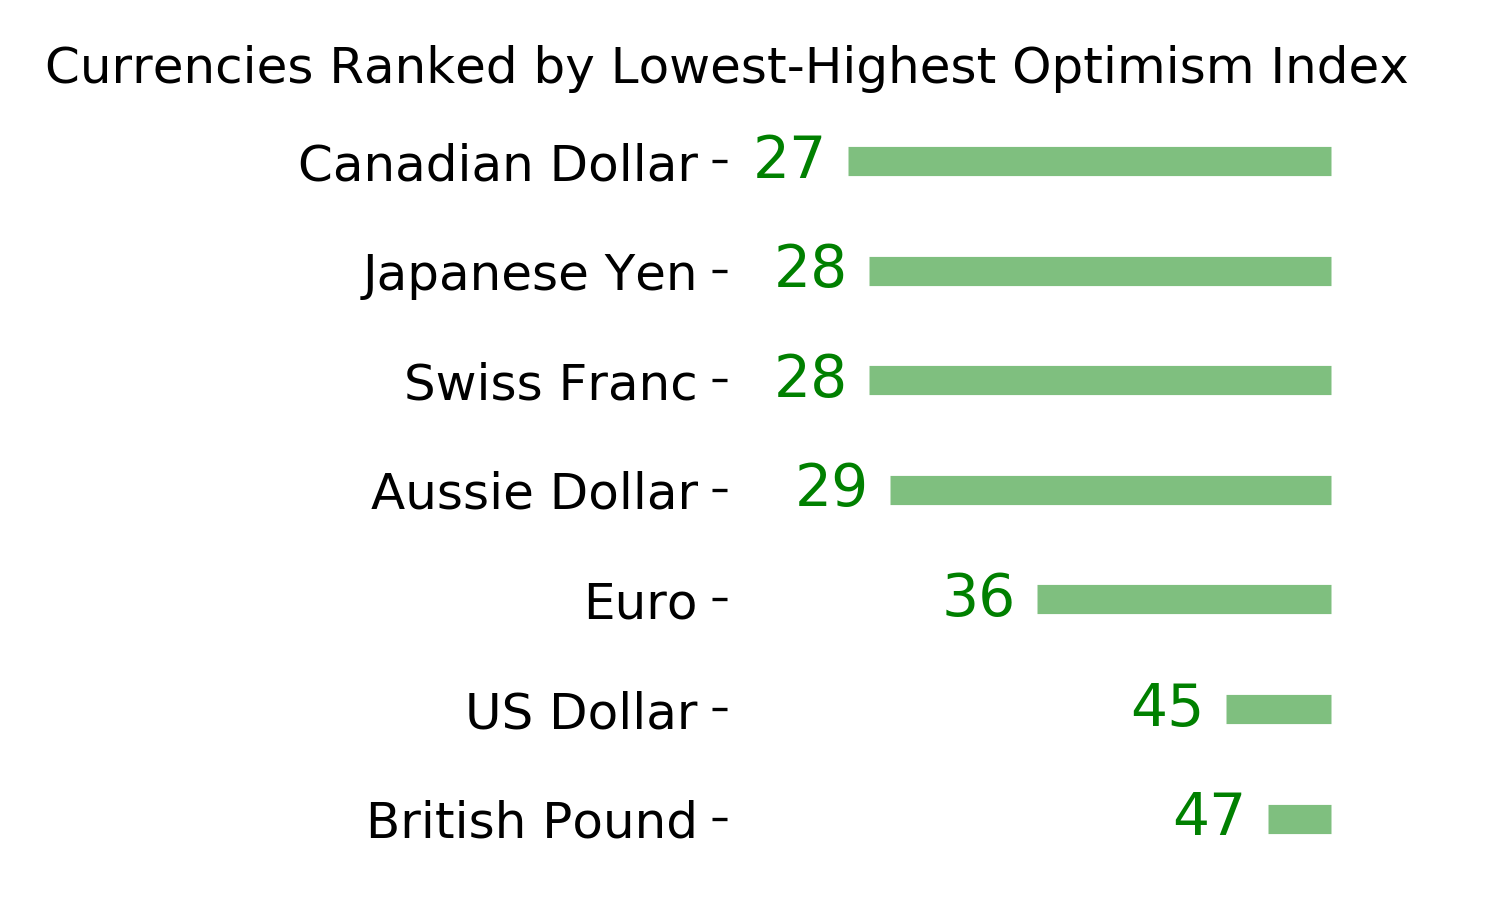
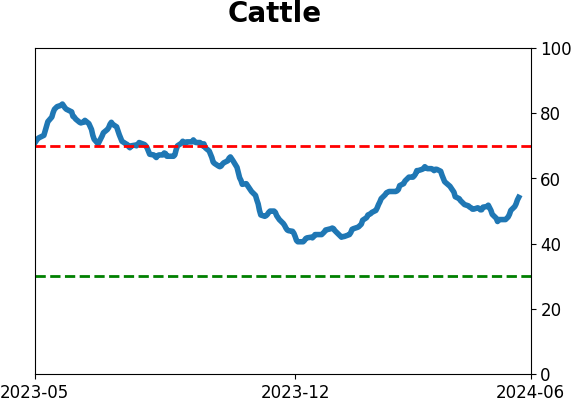
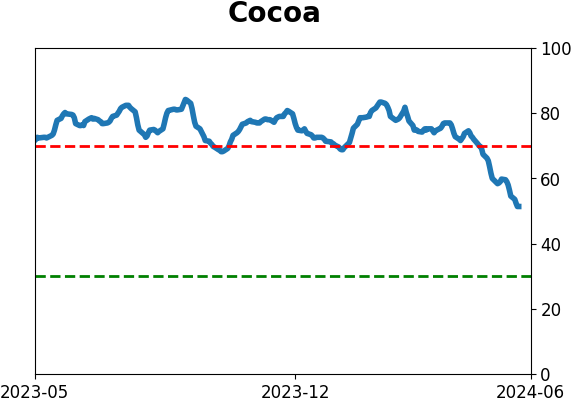
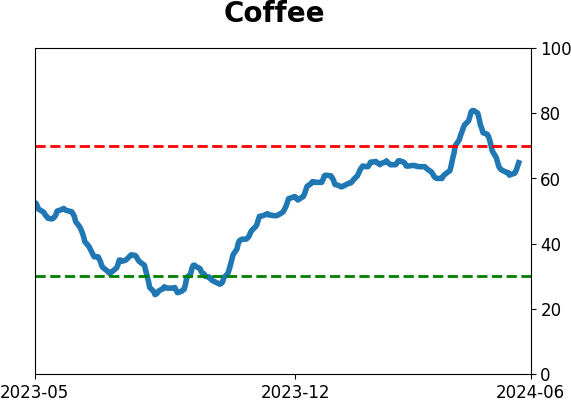
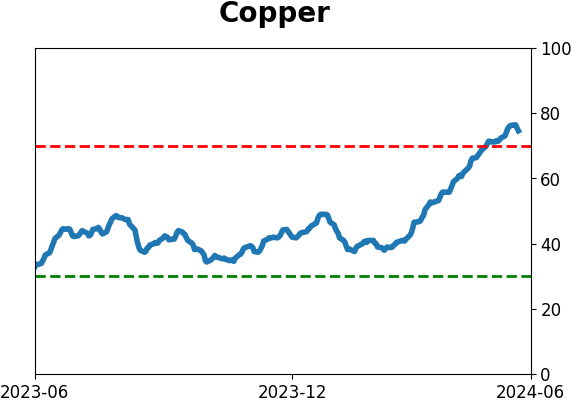
Optimism Index Thumbnails
|
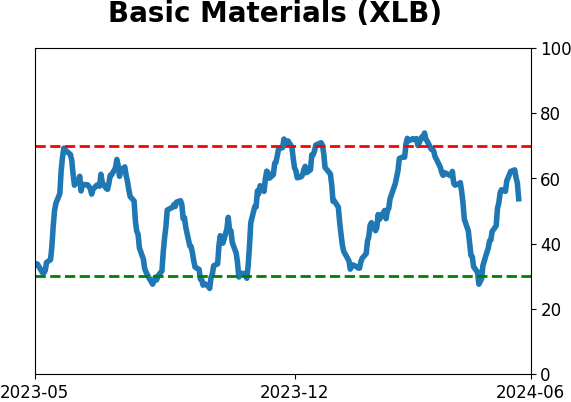
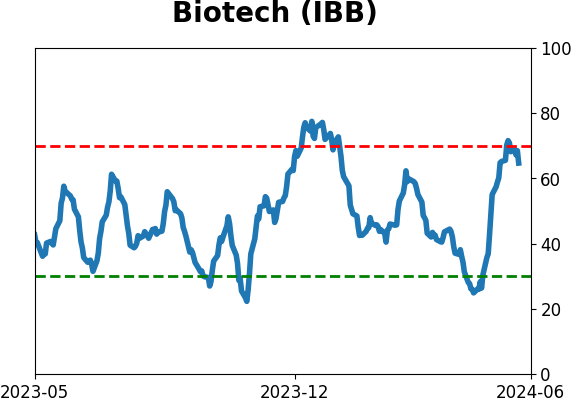
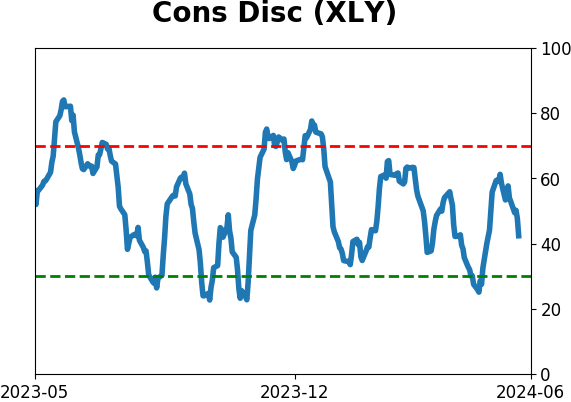
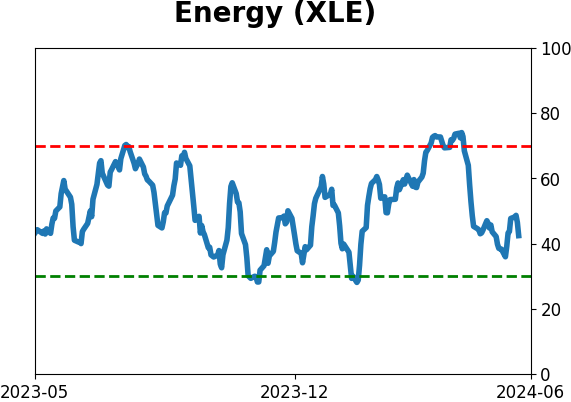
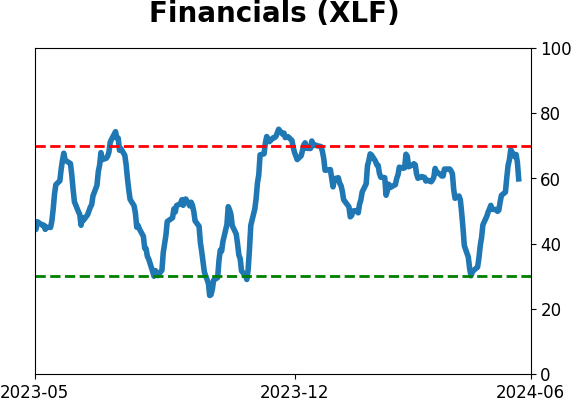
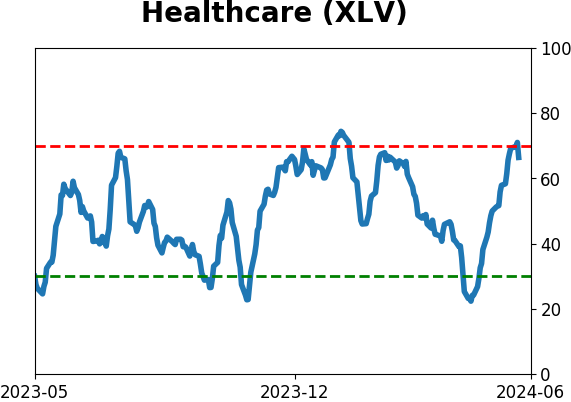
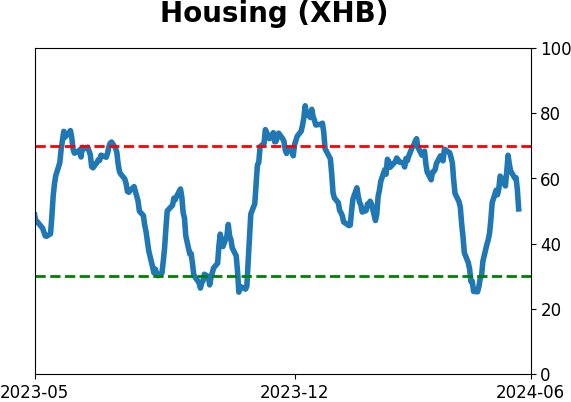
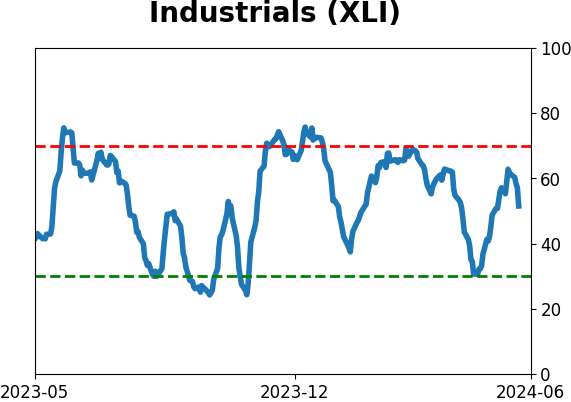
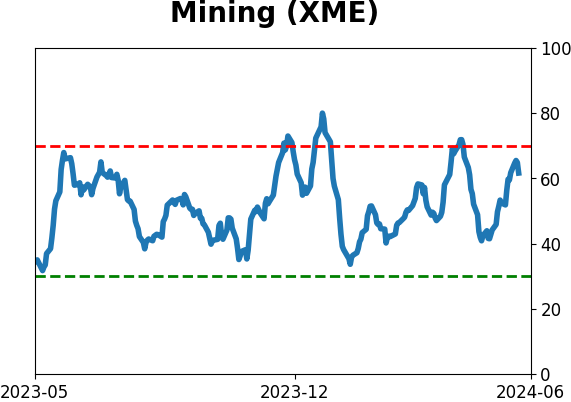
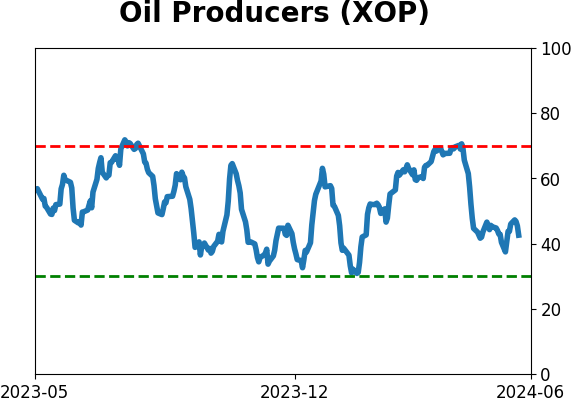
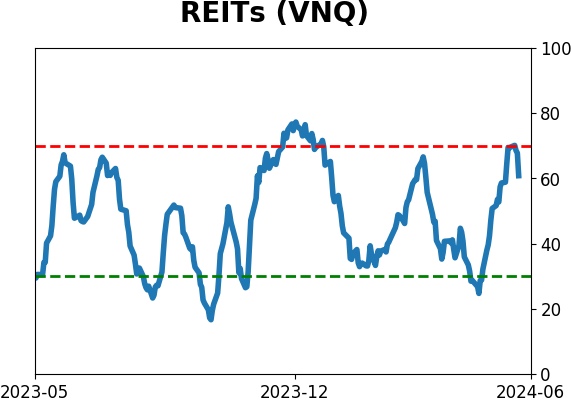
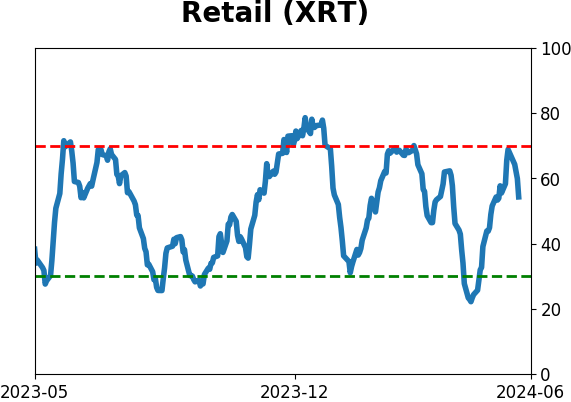
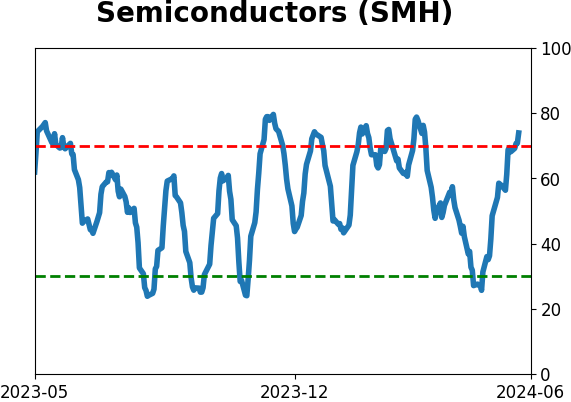
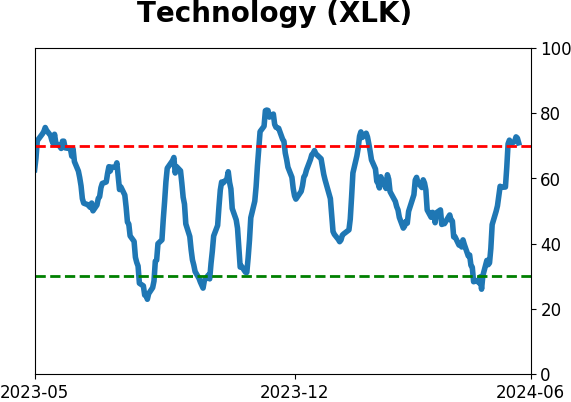
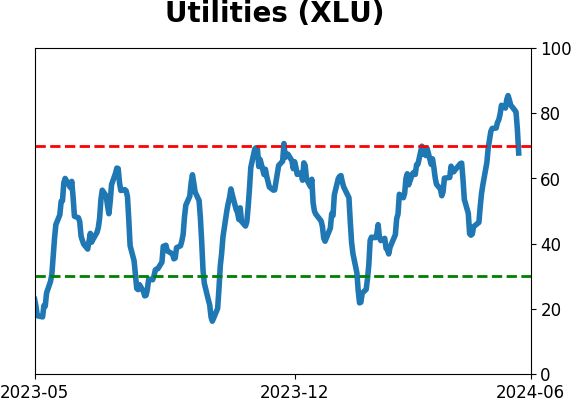
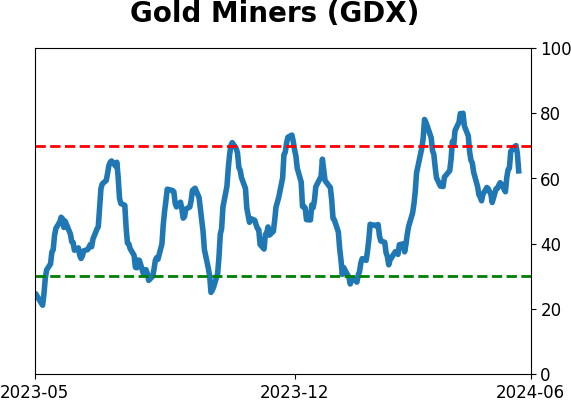
Sector ETF's - 10-Day Moving Average
|
|
|
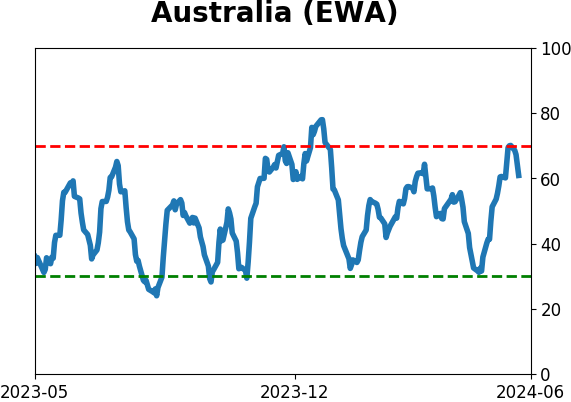
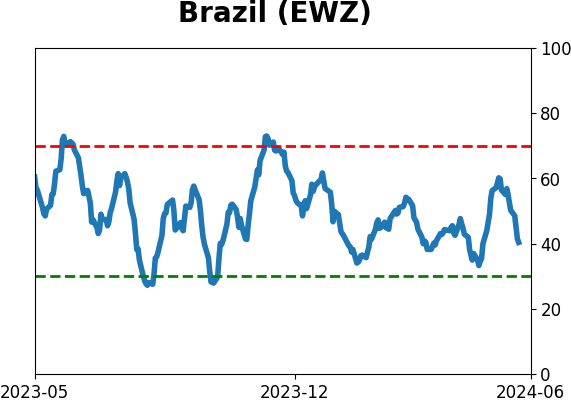
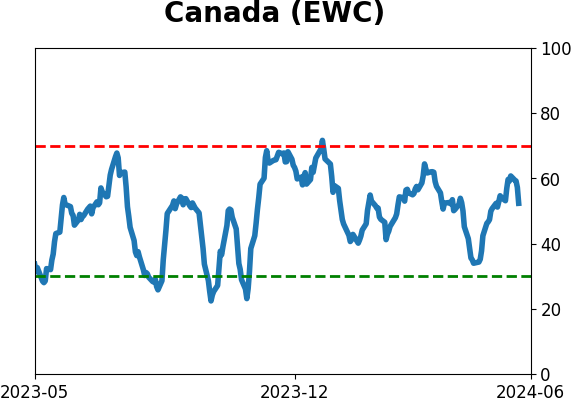
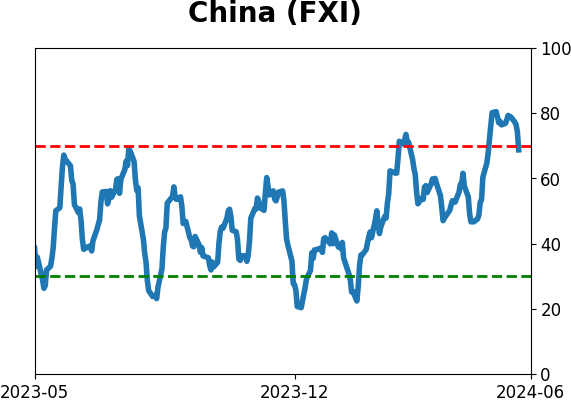
Country ETF's - 10-Day Moving Average
|
|
|
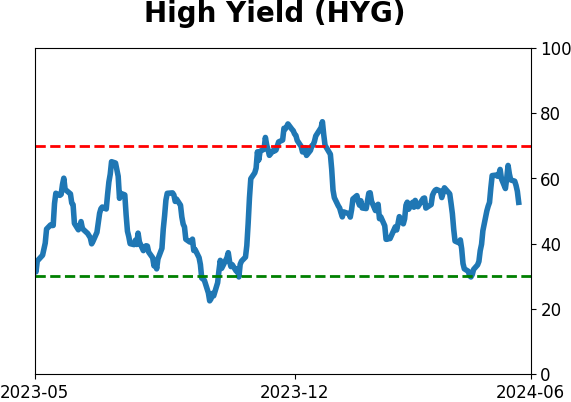
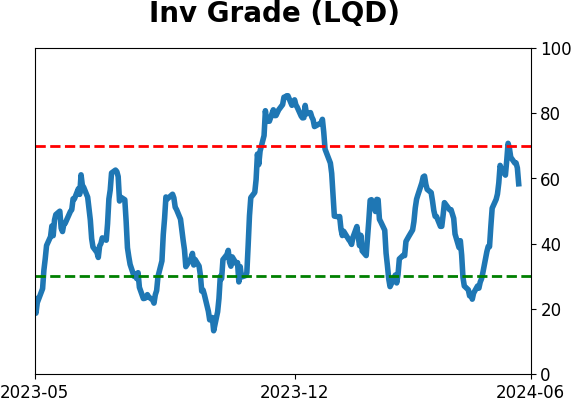
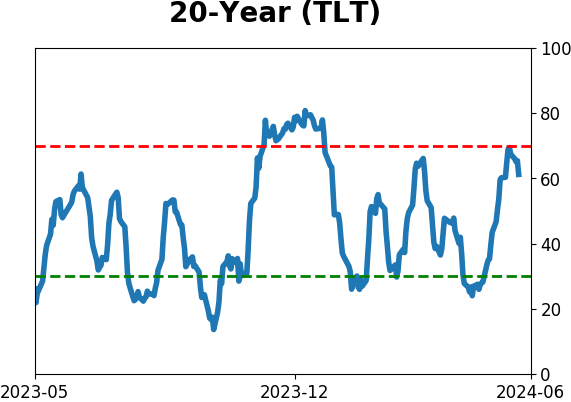
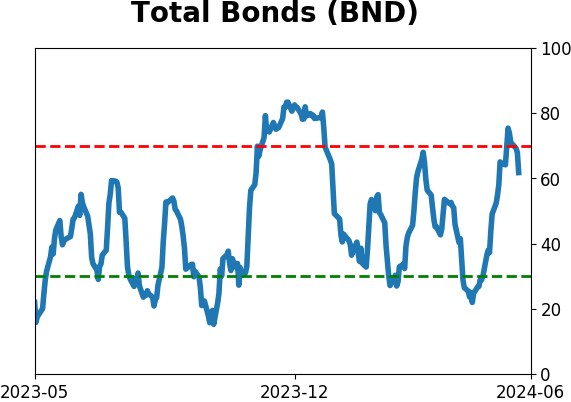
Bond ETF's - 10-Day Moving Average
|
|
|
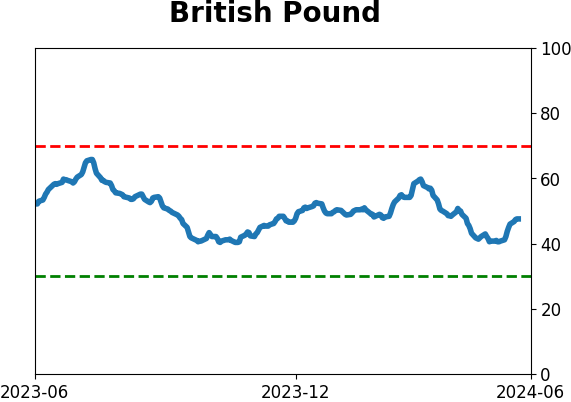
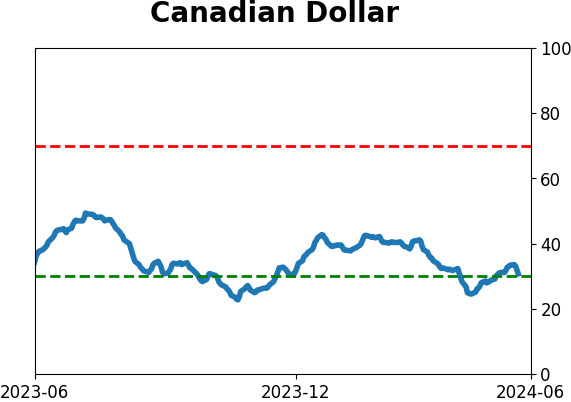
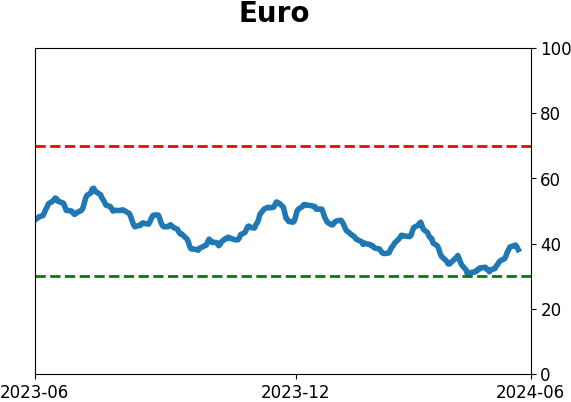
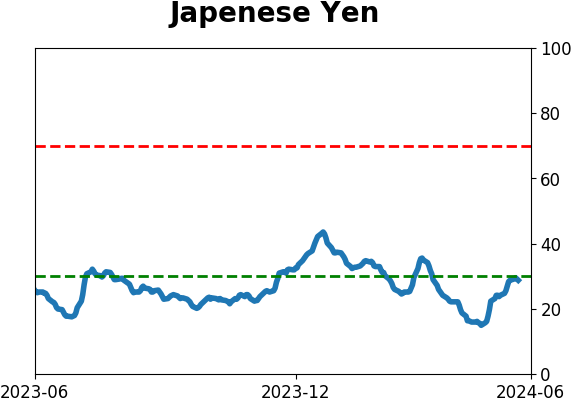
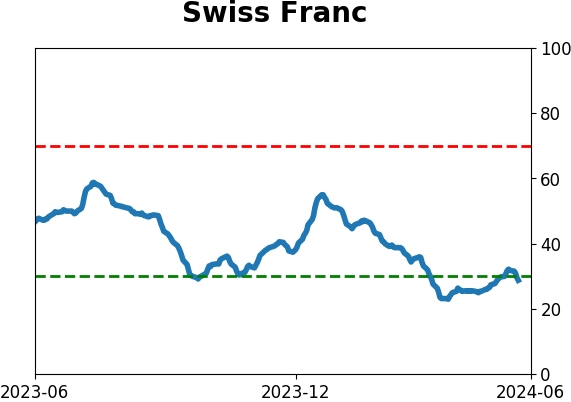
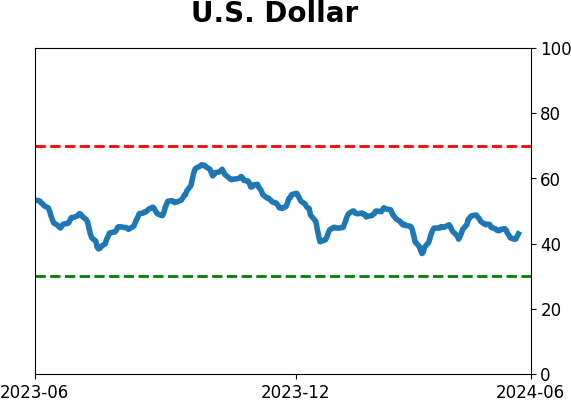
Currency ETF's - 5-Day Moving Average
|
|
|
Commodity ETF's - 5-Day Moving Average
|
|