Headlines
|
|
Commodities struggle - and may continue to do so in the near-term:
Commodities as an asset class have been beaten down in recent months. Despite their current oversold condition, history suggests waiting a little longer before adding exposure on the long side of the commodities markets.
The Chart Report interview with Jay Kaeppel of Sentimentrader:
In an interview with The Chart Report, Jay Kaeppel of Sentimentrader discusses the latest trends regarding sentiment and seasonality in stocks, sectors, commodities, and gold.
|
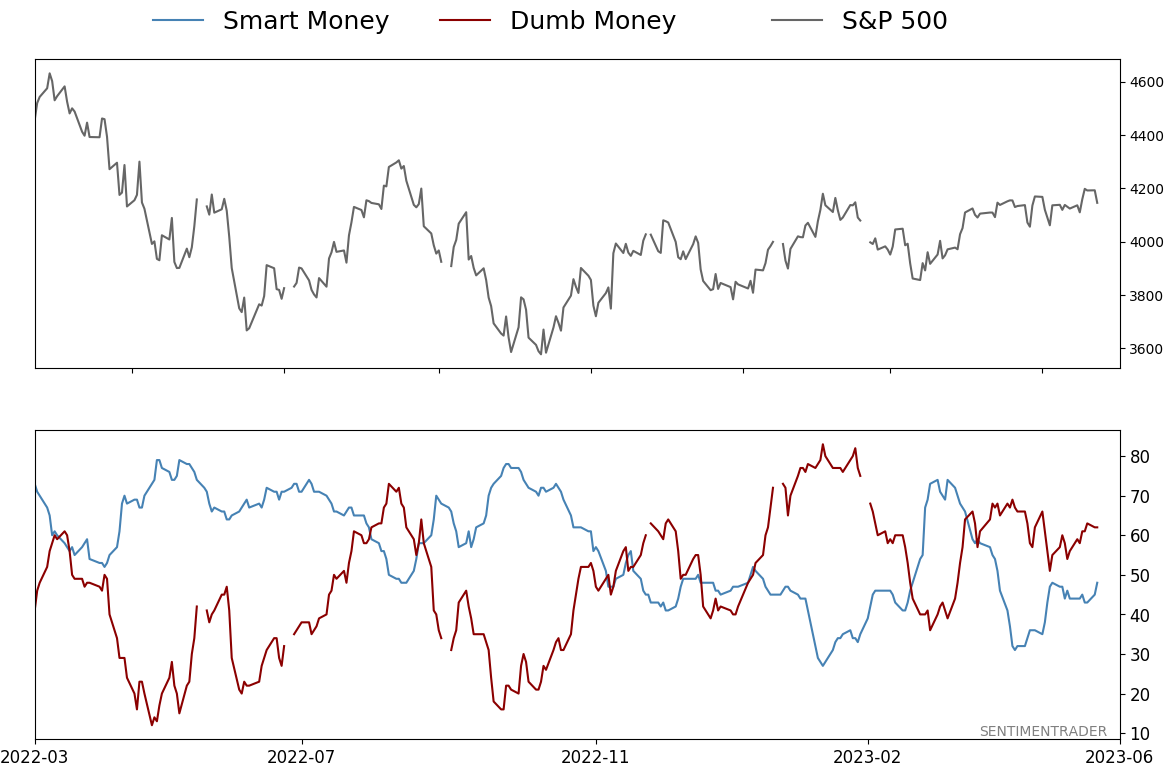
Smart / Dumb Money Confidence
|
Smart Money Confidence: 48%
Dumb Money Confidence: 62%
|
|
Risk Levels
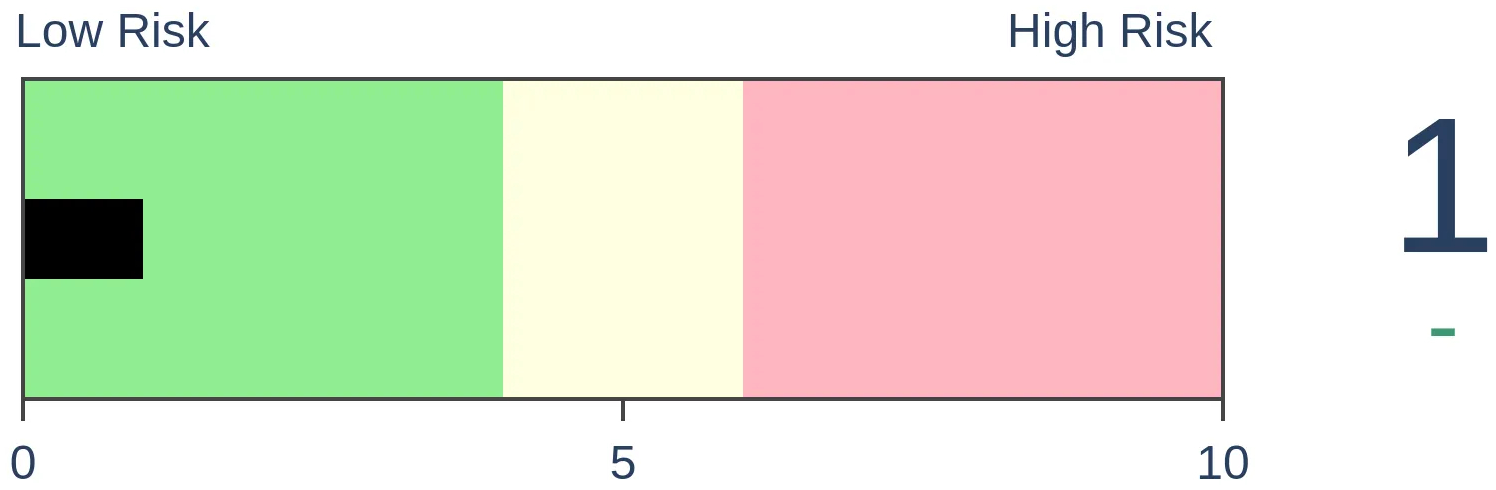
Stocks Short-Term
|
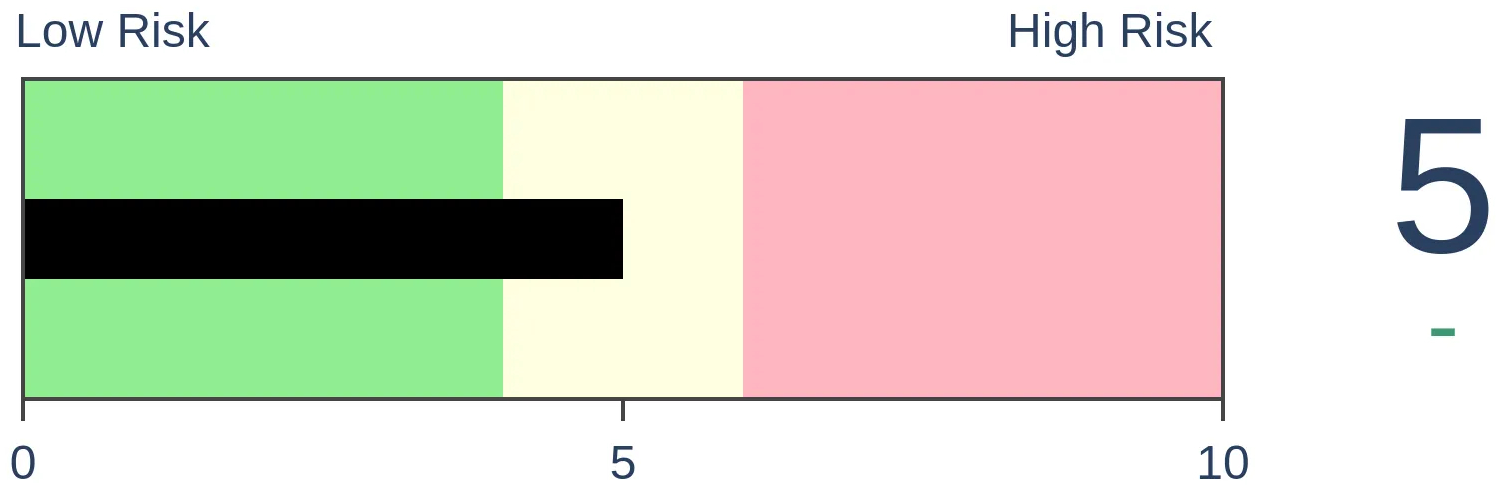
Stocks Medium-Term
|
|
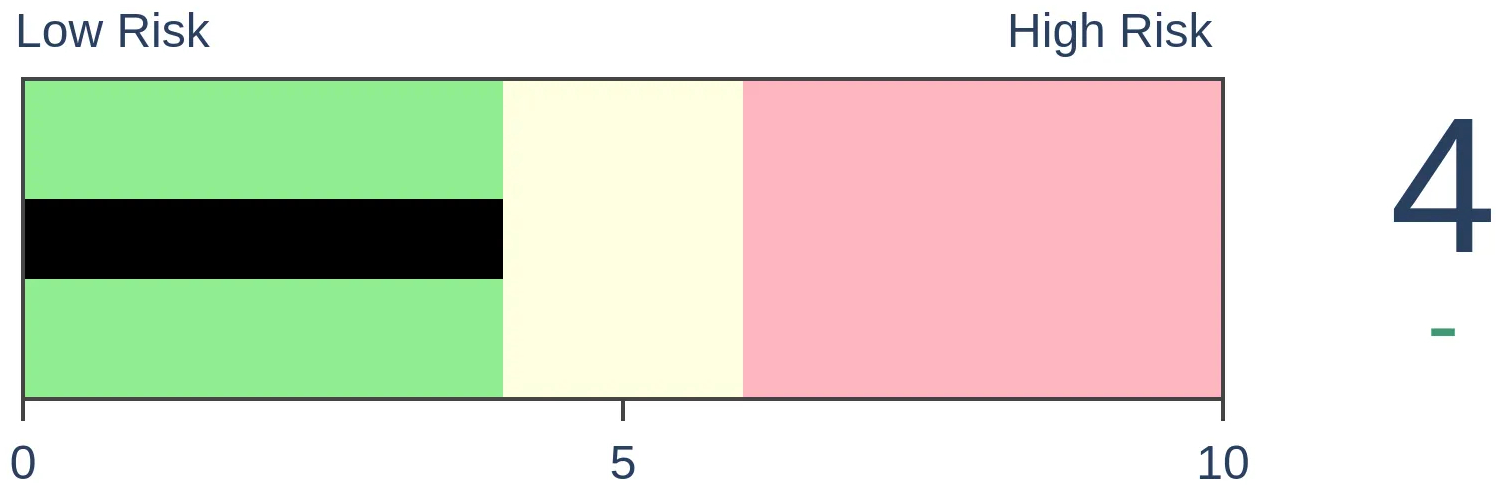
Bonds
|
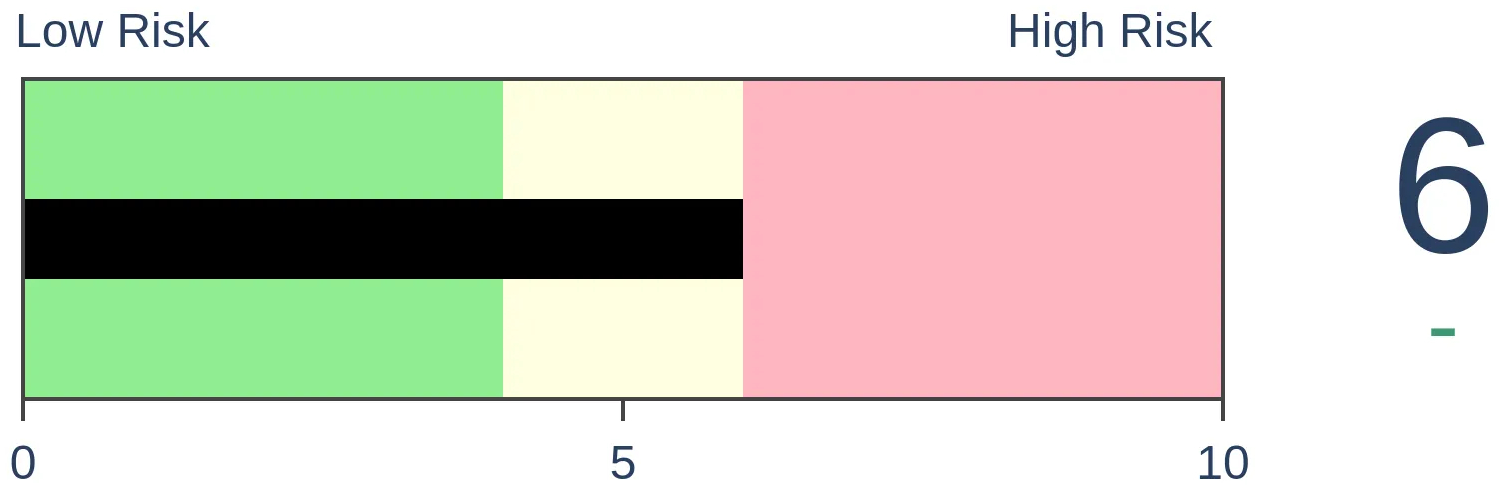
Crude Oil

|
|
Gold
|
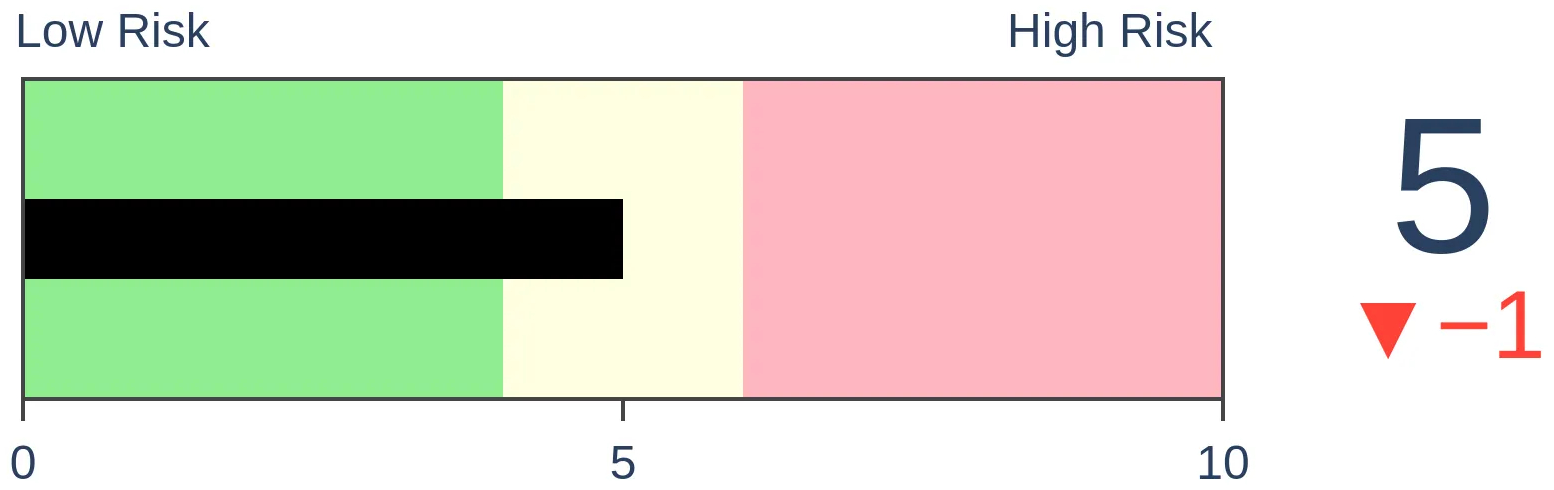
Agriculture
|
|
Research
By Jay Kaeppel
BOTTOM LINE
Commodities as an asset class have been beaten down in recent months. Despite their current oversold condition, history suggests waiting a little longer before adding exposure on the long side of the commodities markets.
FORECAST / TIMEFRAME
None
|
Key points
- Commodities as an asset class tend to show weakness during late spring into early summer
- A seasonally unfavorable period is starting now
A look at CRB seasonality
According to Investopedia:
The Commodity Research Bureau Index (CRBI) acts as a representative indicator of today's global commodity markets. It measures the aggregated price direction of various commodity sectors.
This commodity index comprises a basket of 19 commodities, with 39% allocated to energy contracts, 41% to agriculture, 7% to precious metals, and 13% to industrial metals. The CRB is designed to isolate and reveal the directional movement of prices in overall commodity trades.
The chart below displays the annual seasonal trend for the CRB Index. Note that a period of weakness from Trading Day of Year #98 through TDY #123 is highlighted. For 2023, this period extends from the close on 2023-05-23 through the close on 2023-06-28.
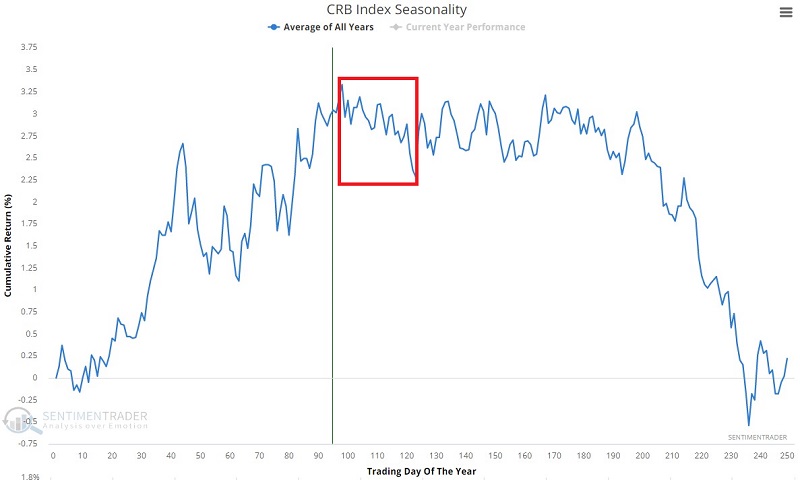
Let's take a closer look at CRB Index performance during this highlighted period.
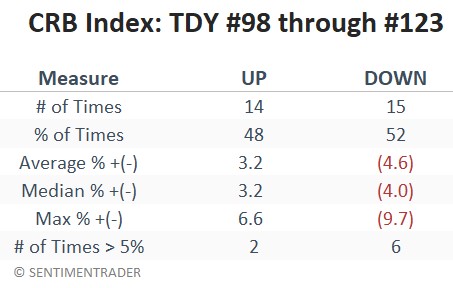
CRB late spring weakness
The chart below displays the growth of $1 in the CRB Index only between TDY #98 and #123 every year starting in 1994.
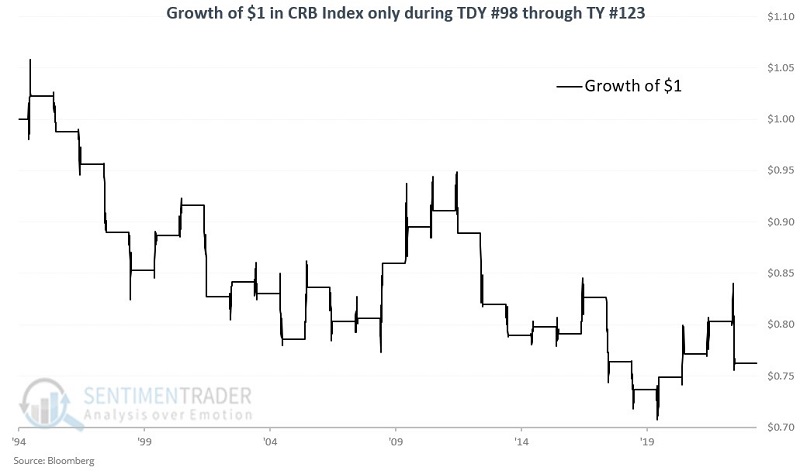
The table below shows that the Win Rate has essentially been a coin flip but that the down years have shown more significant weakness than the up years have shown strength. These results suggest that now is not the time to gain or increase exposure to the commodity markets.
Extending the test with the Bloomberg Commodities Index
We will use commodity index data compiled by Dean Christians with data from Bloomberg to extend the test above. From 1933 to 1960, we used the Dow Jones AIG Commodity Index, and from 1960 to the present, we used the Bloomberg Spot Commodity Index (which measures prices in the cash market).
The chart and table below display the results using these indexes.
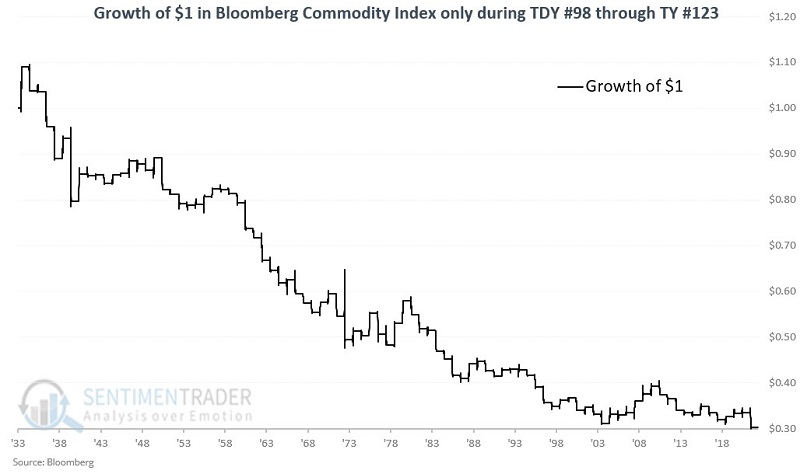
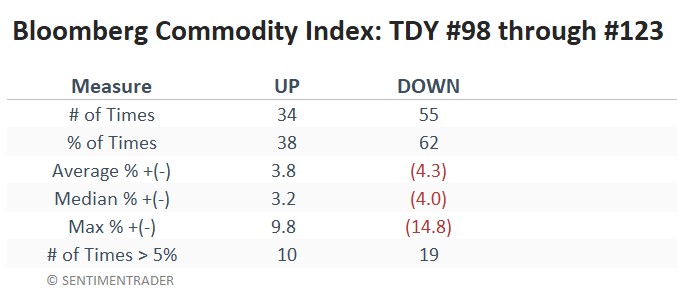
The results above confirm that mid-to-late May through late June is a less-than-ideal time for traders to pile into the long side of the commodities markets.
What the research tells us…
The good news is that via ETFs and ETNs, even non-futures traders can now gain exposure to commodities as an asset class just as they would buy shares of stock - and without the exposure to the leverage involved in futures trading. But as always, there is a time for everything in the financial markets. The late-spring, early summer period does not appear to be a great time to be long commodities in general.
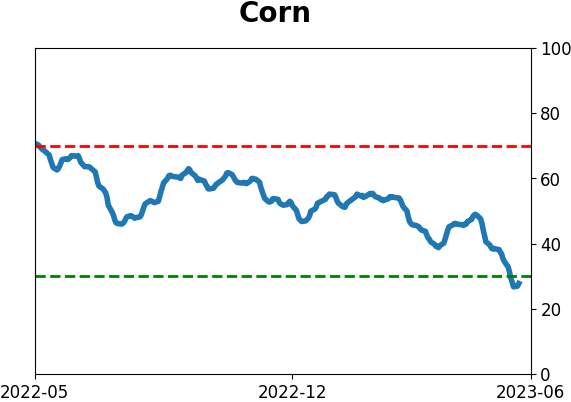
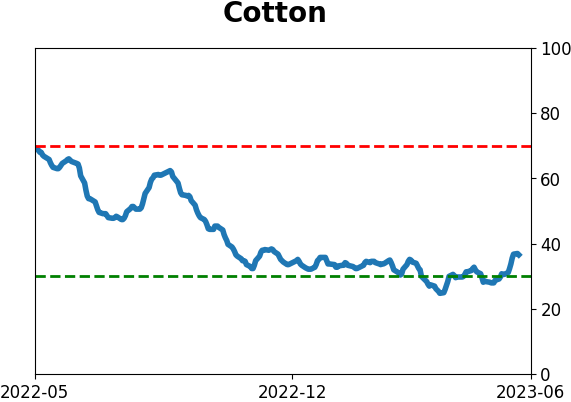
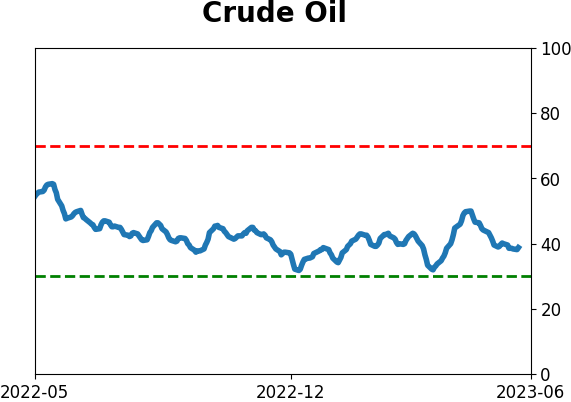
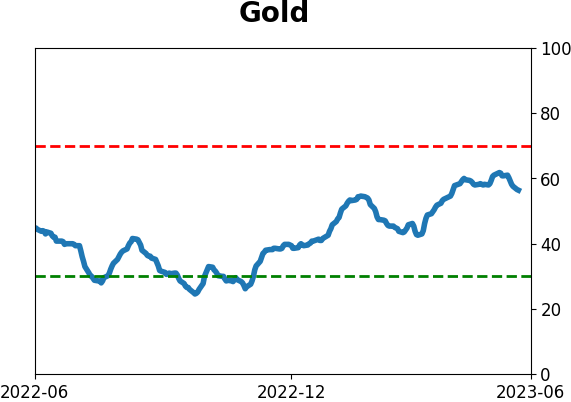
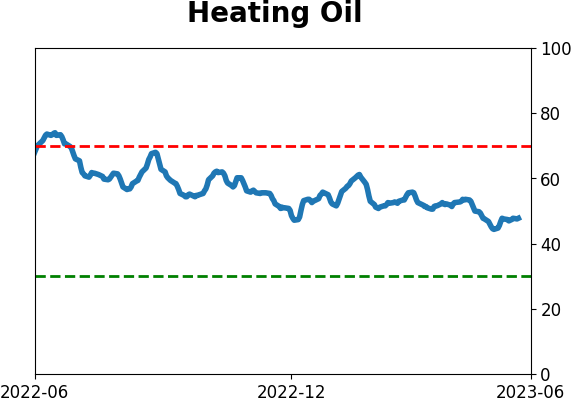
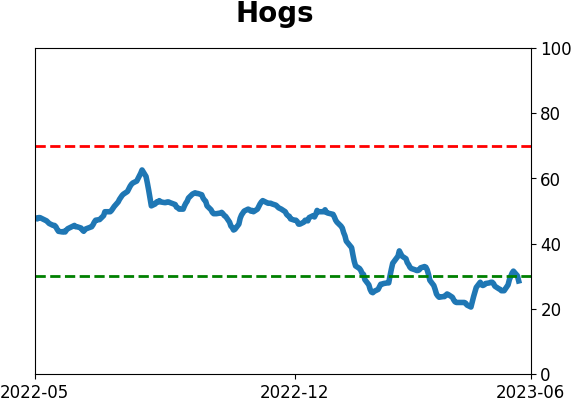
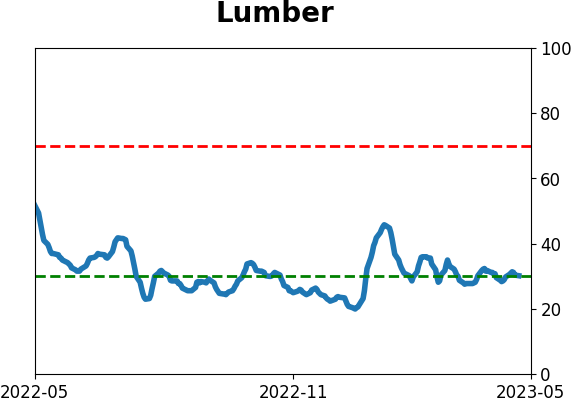
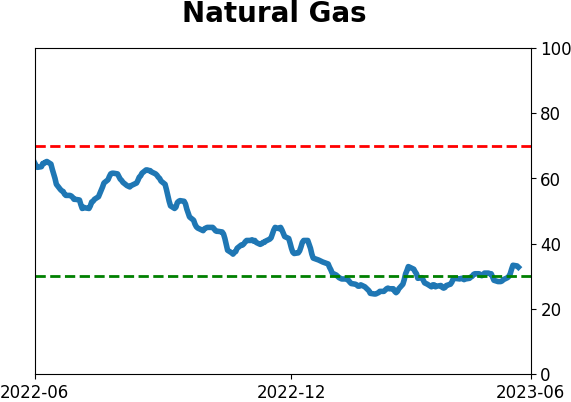
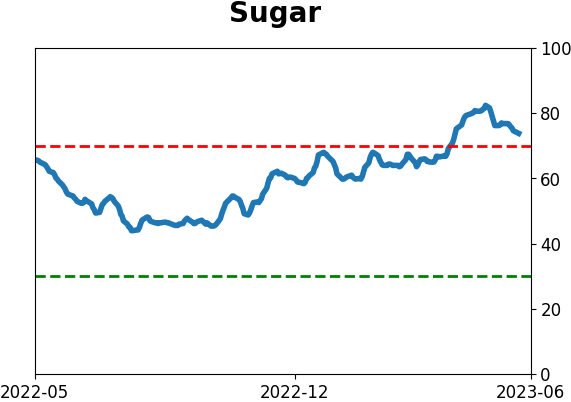
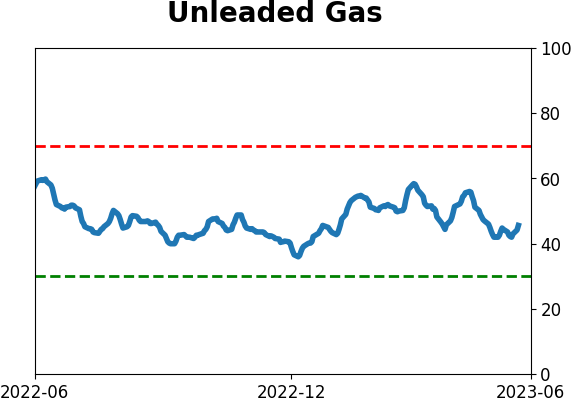
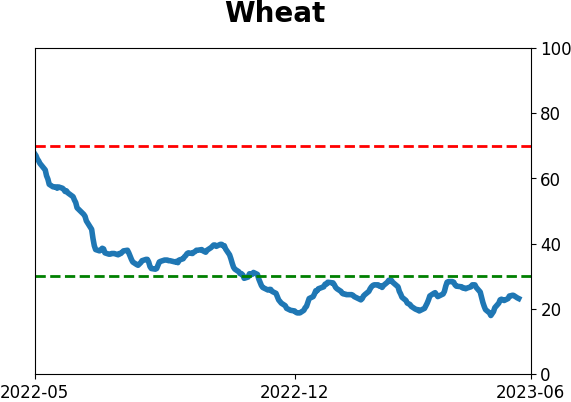
It is important to take a moment to recognize that during some years, commodities as an asset class can and will power higher, despite the subpar results displays above. Likewise, individual commodities all trade based on their own specific fundamentals, and a given commodity or class of commodity (energy, grains, metals, etc.) can completely ignore the overarching tendency for commodities to show weakness in spring. Several commodities have already been beaten down recently (most notably grains, meats, metals, and energies) and would appear to be due for a bounce on a technical basis. All that said, the real question at any point is how best to allocate your capital to give yourself the best odds of success.
By Jay Kaeppel
BOTTOM LINE
In an interview with The Chart Report, Jay Kaeppel of Sentimentrader discusses the latest trends regarding sentiment and seasonality in stocks, sectors, commodities, and gold.
FORECAST / TIMEFRAME
None
|
Key points
- There is a link below to a video interview with Jay Kaeppel of Sentimentrader on May 18th
- The interview was conducted by Patrick Dunuwila of The Chart Report
- Topics include sentiment and seasonality in stocks, sectors, commodities, and gold. All information is Jay's view and not that of Sentimentrader and is intended for informational and educational purposes only
- Nothing in the interview should be considered a recommendation or investment advice
Link to interview
The Chart Report Interview with Jay Kaeppel
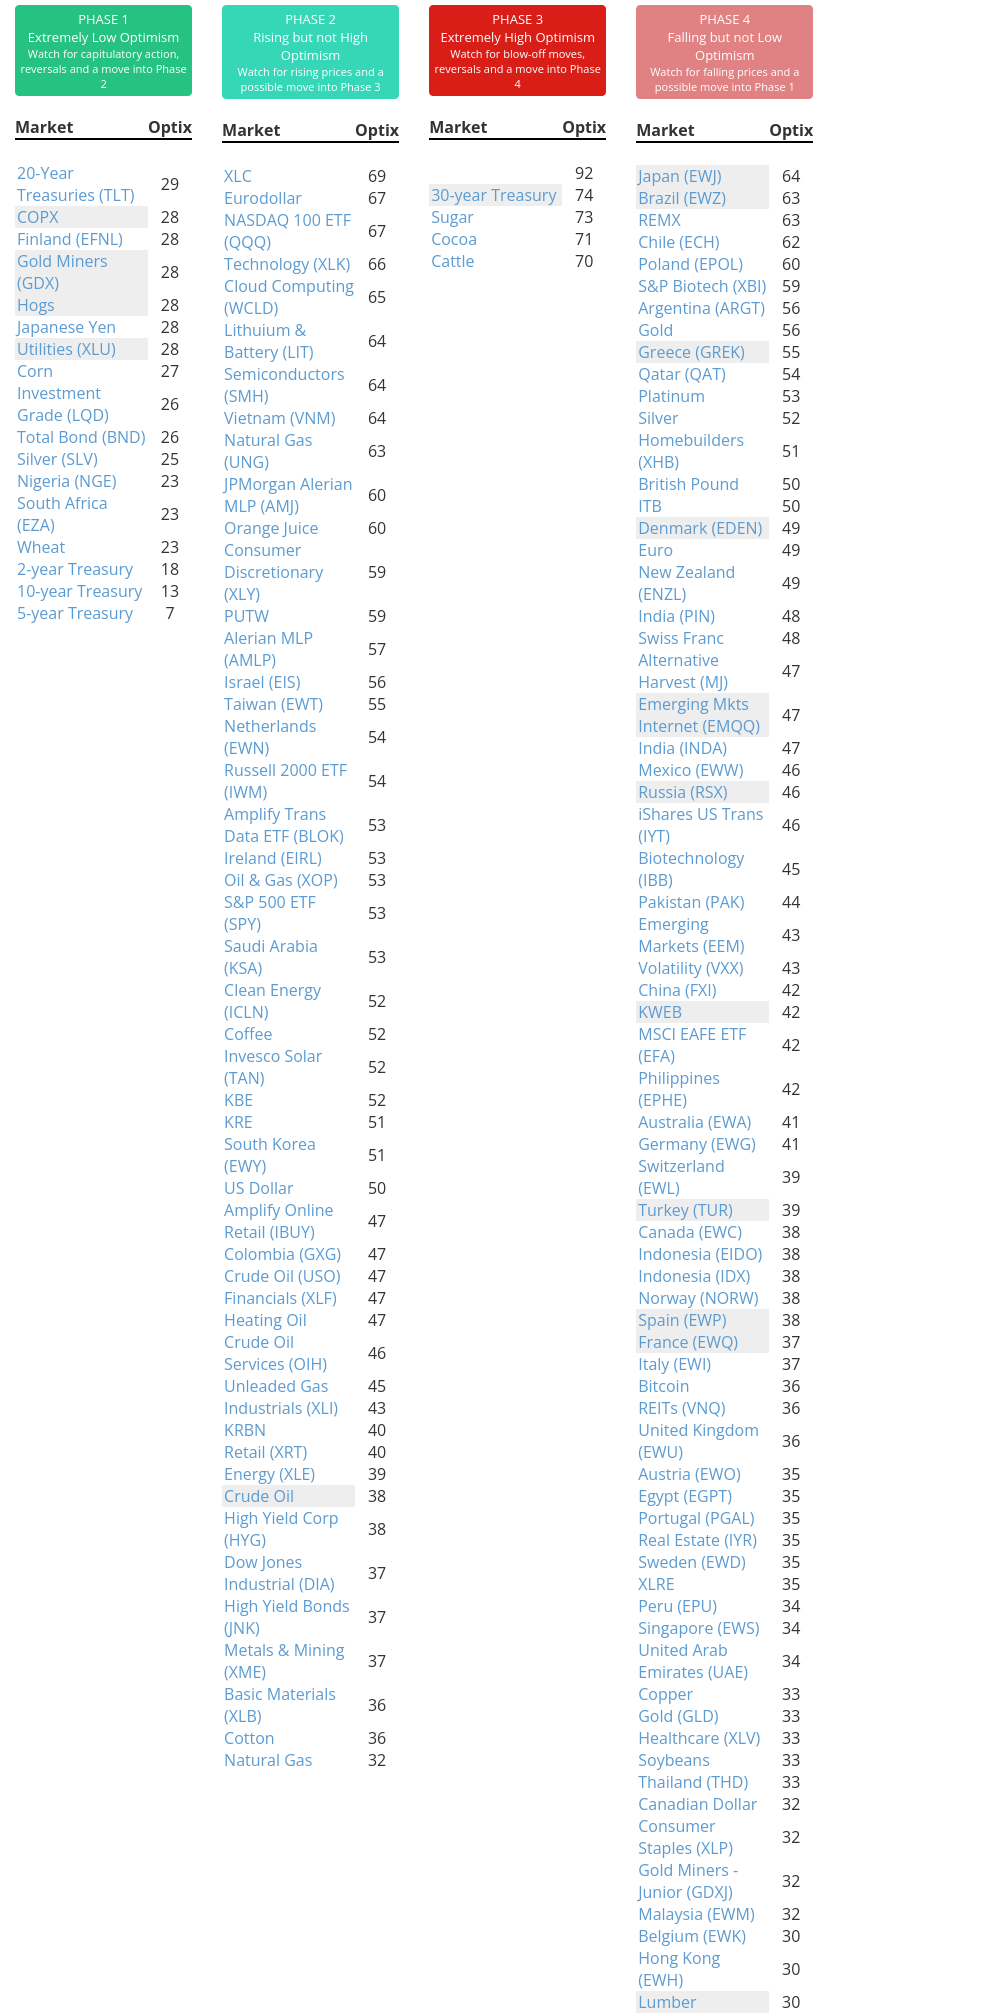
Indicators at Extremes
Phase Table
Ranks
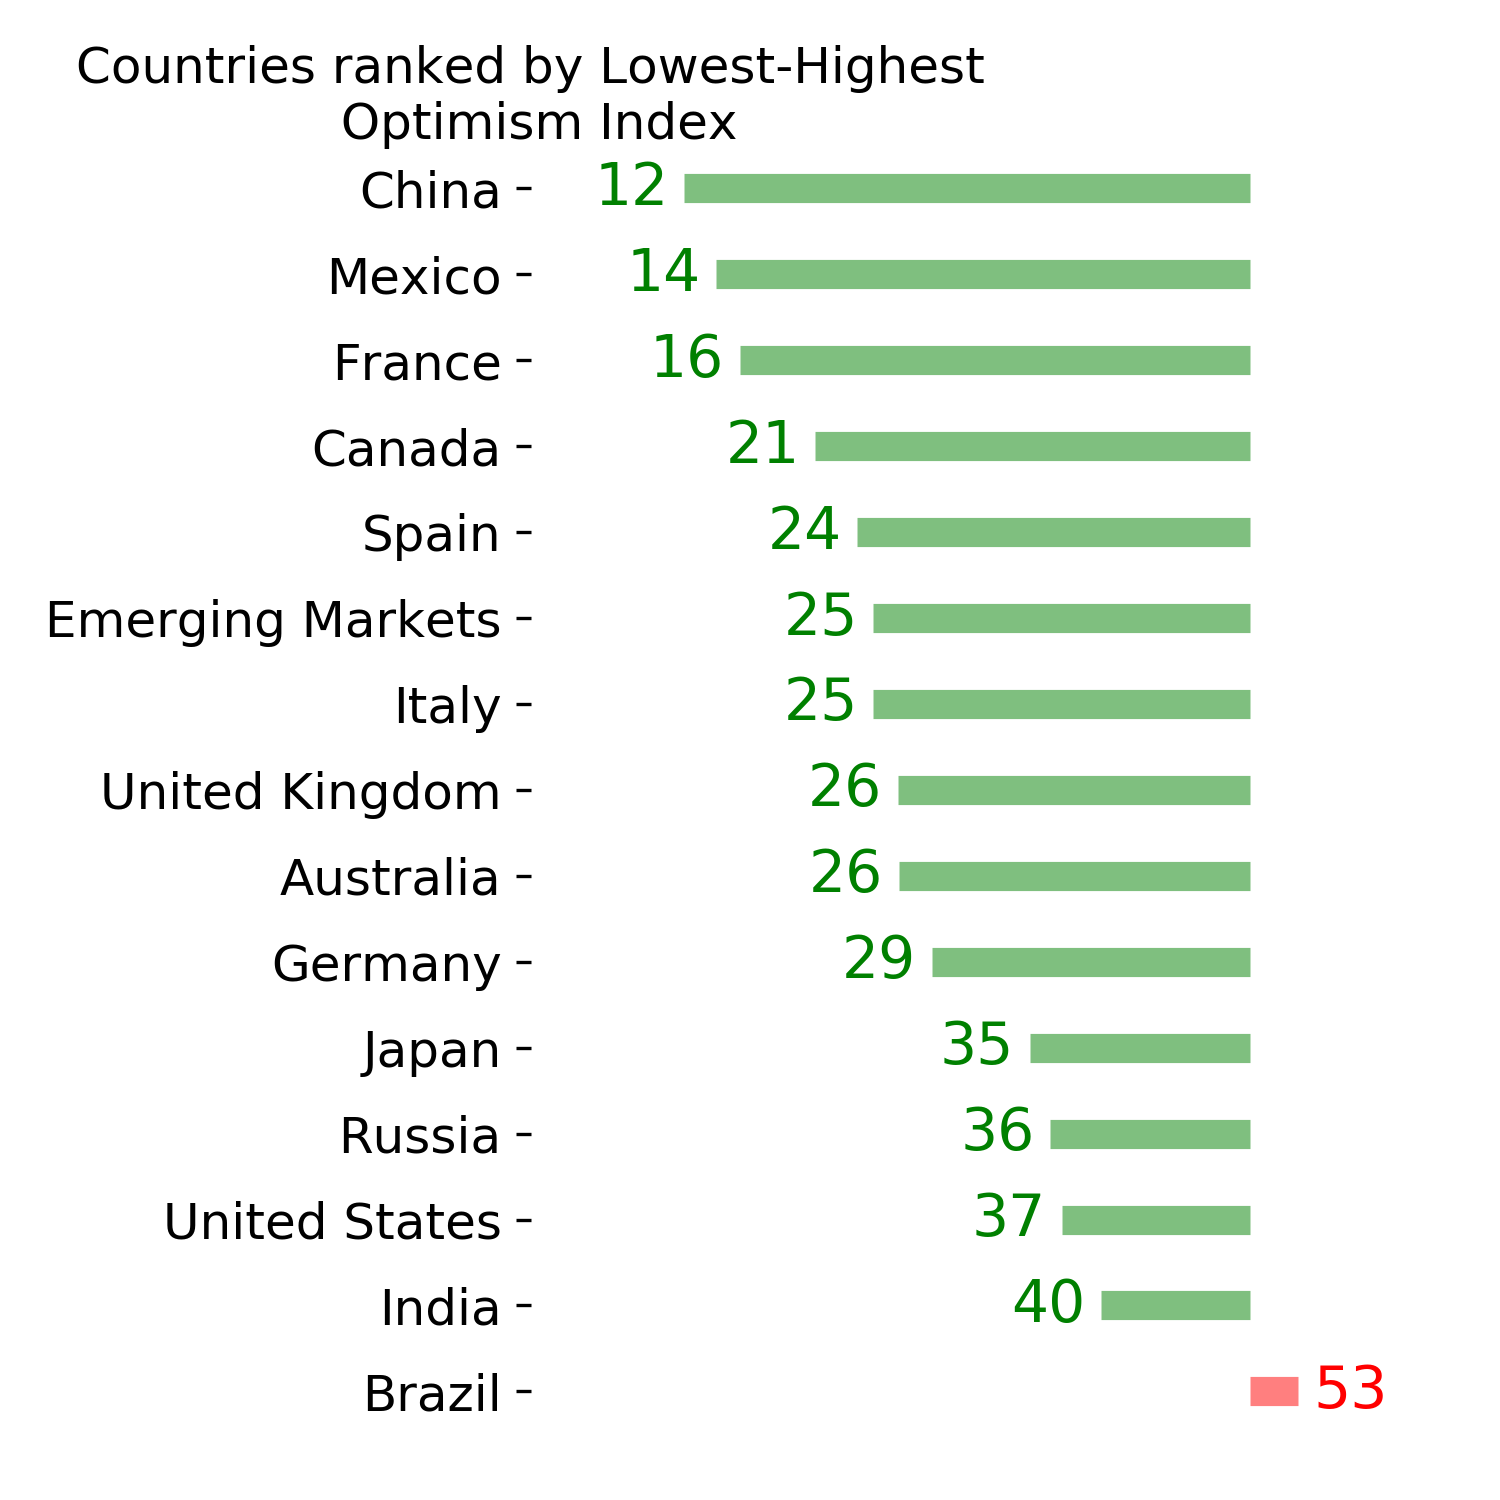
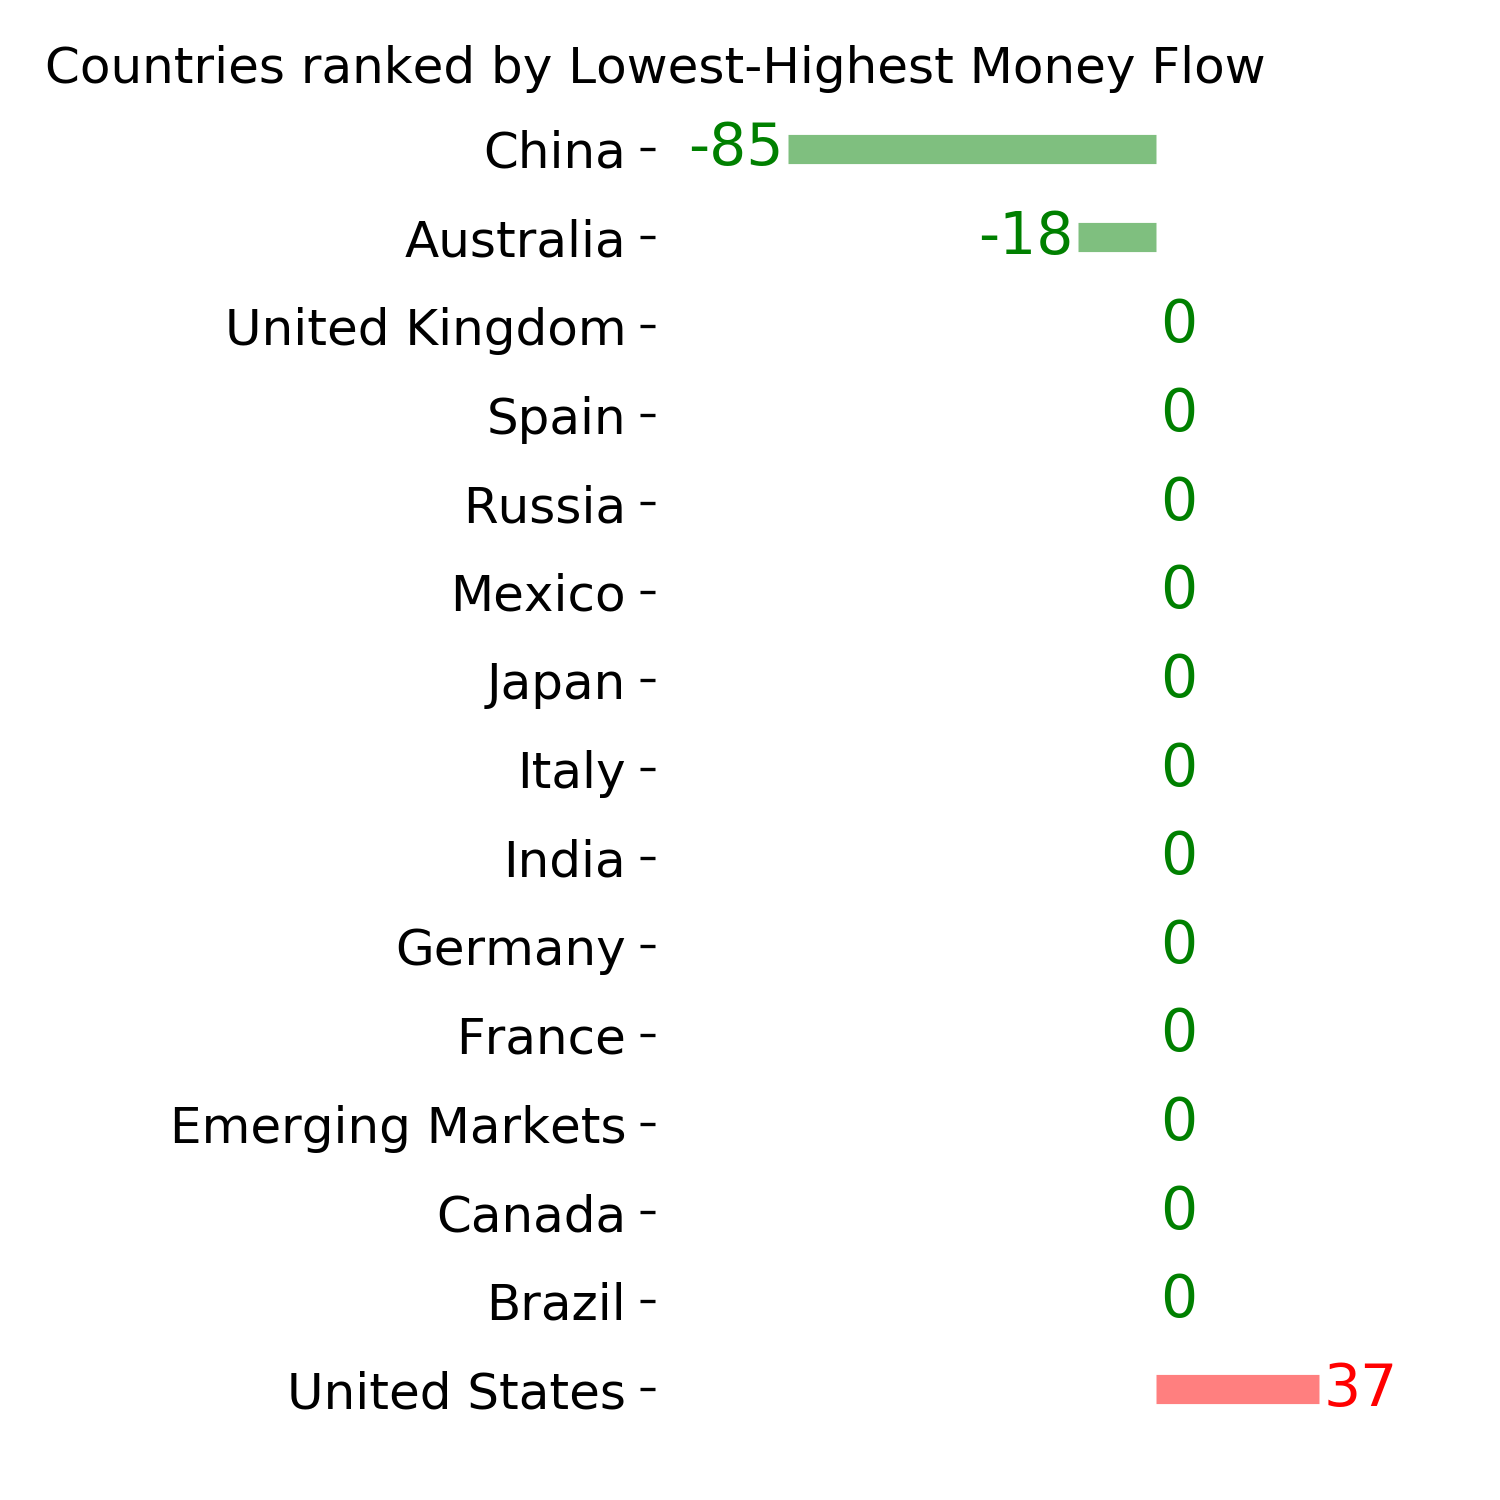
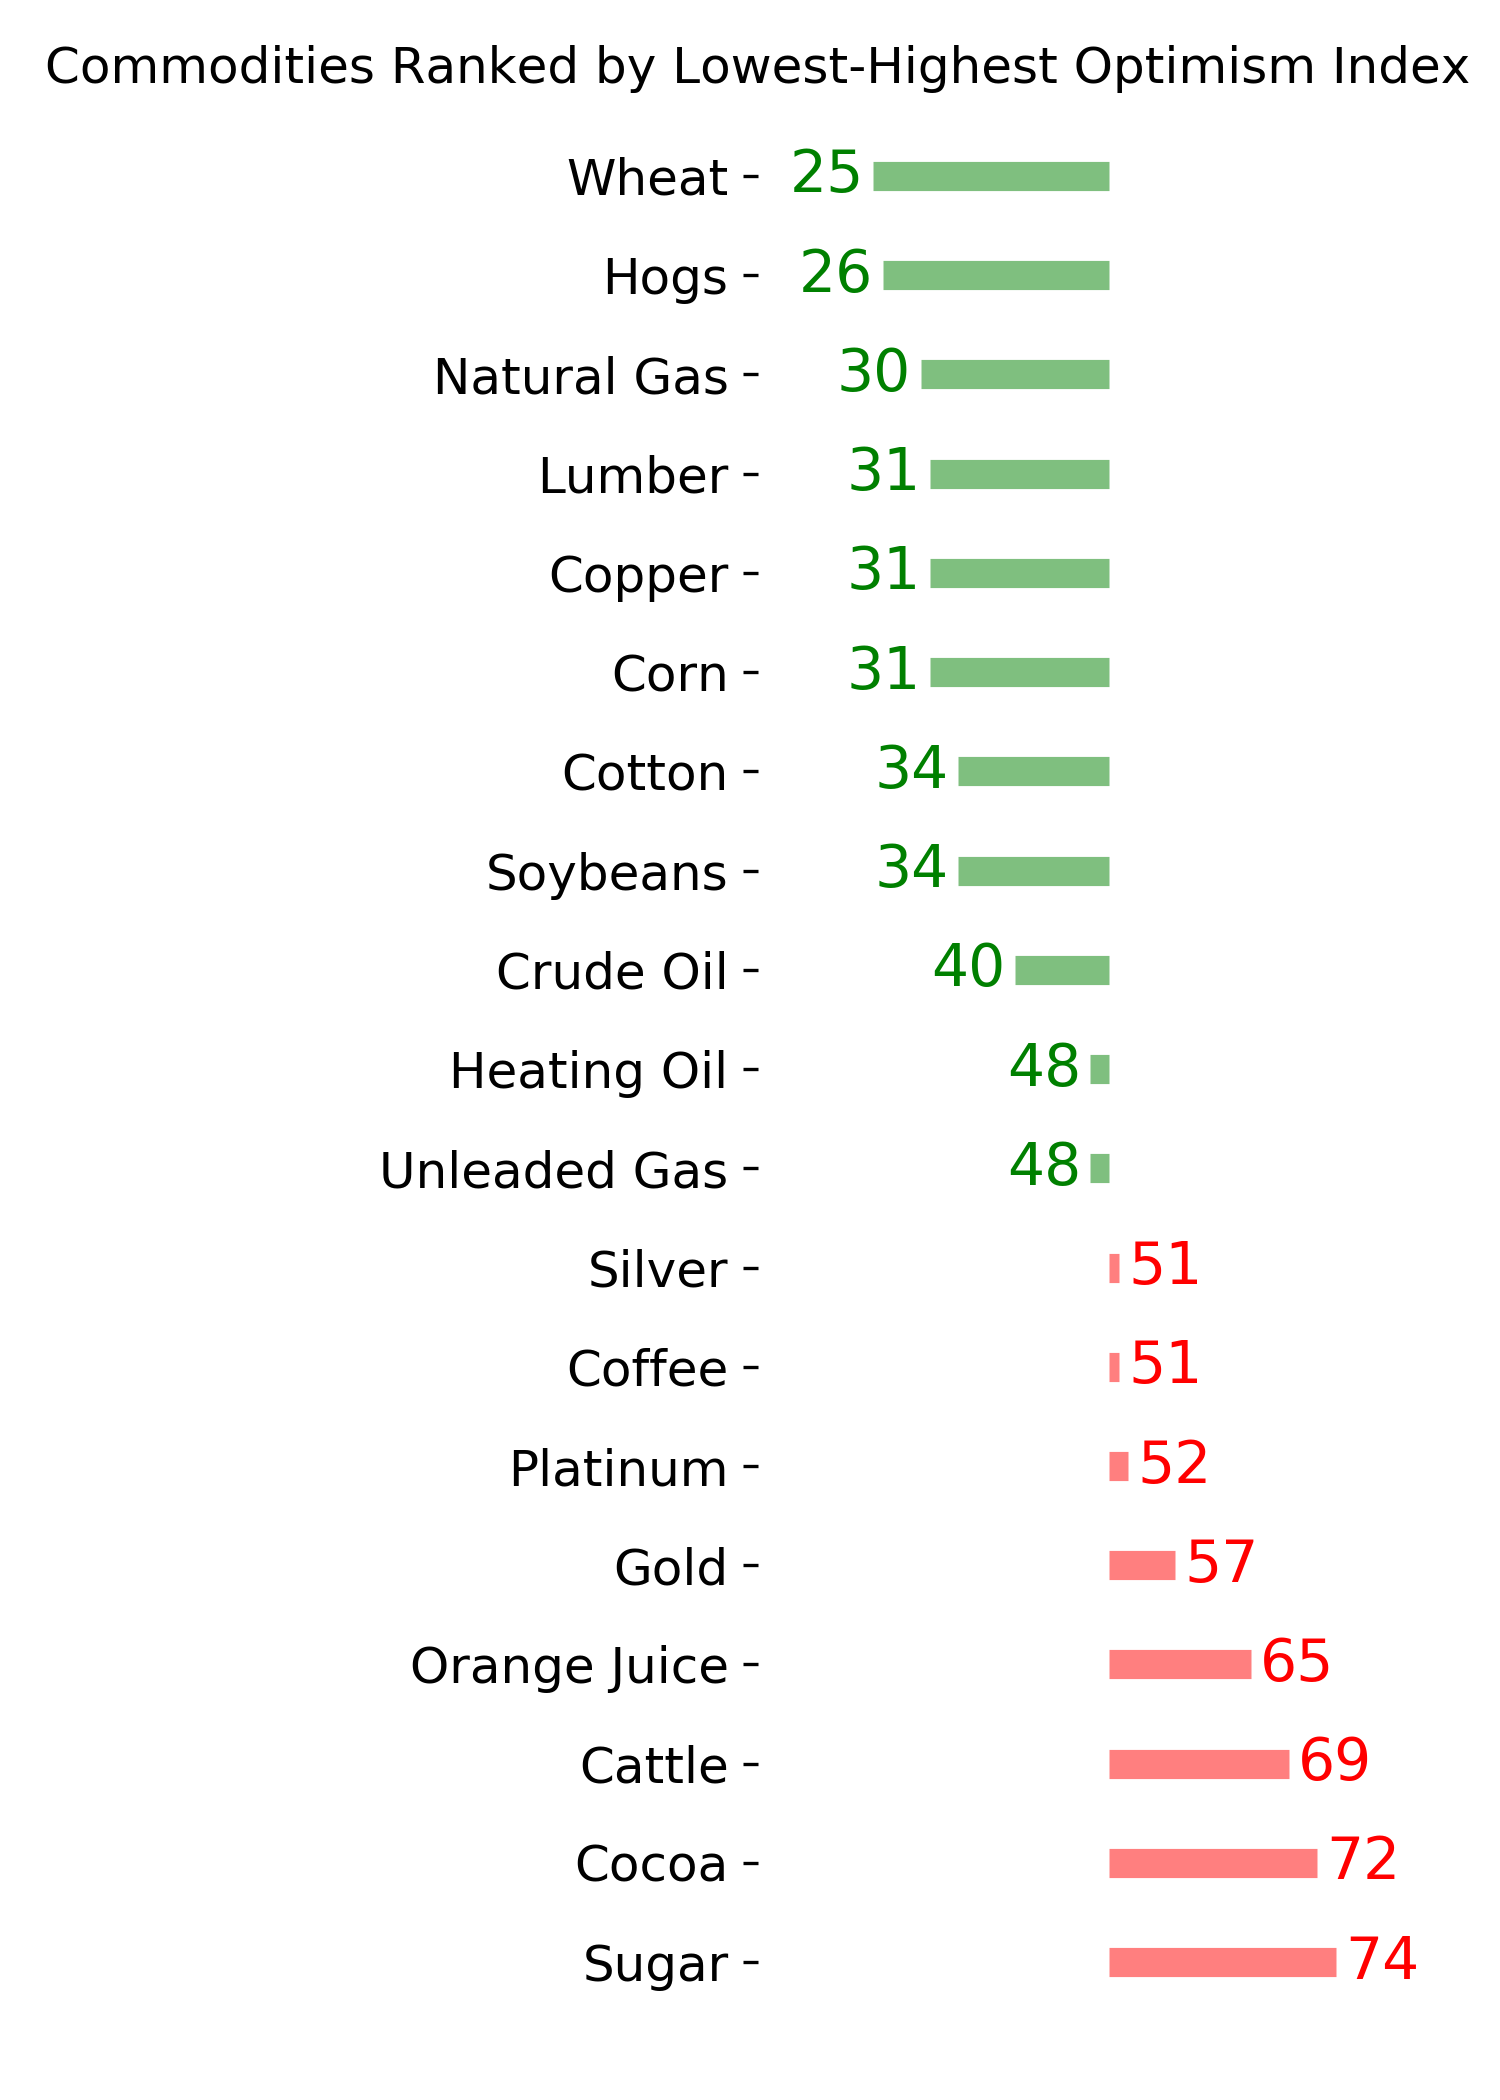
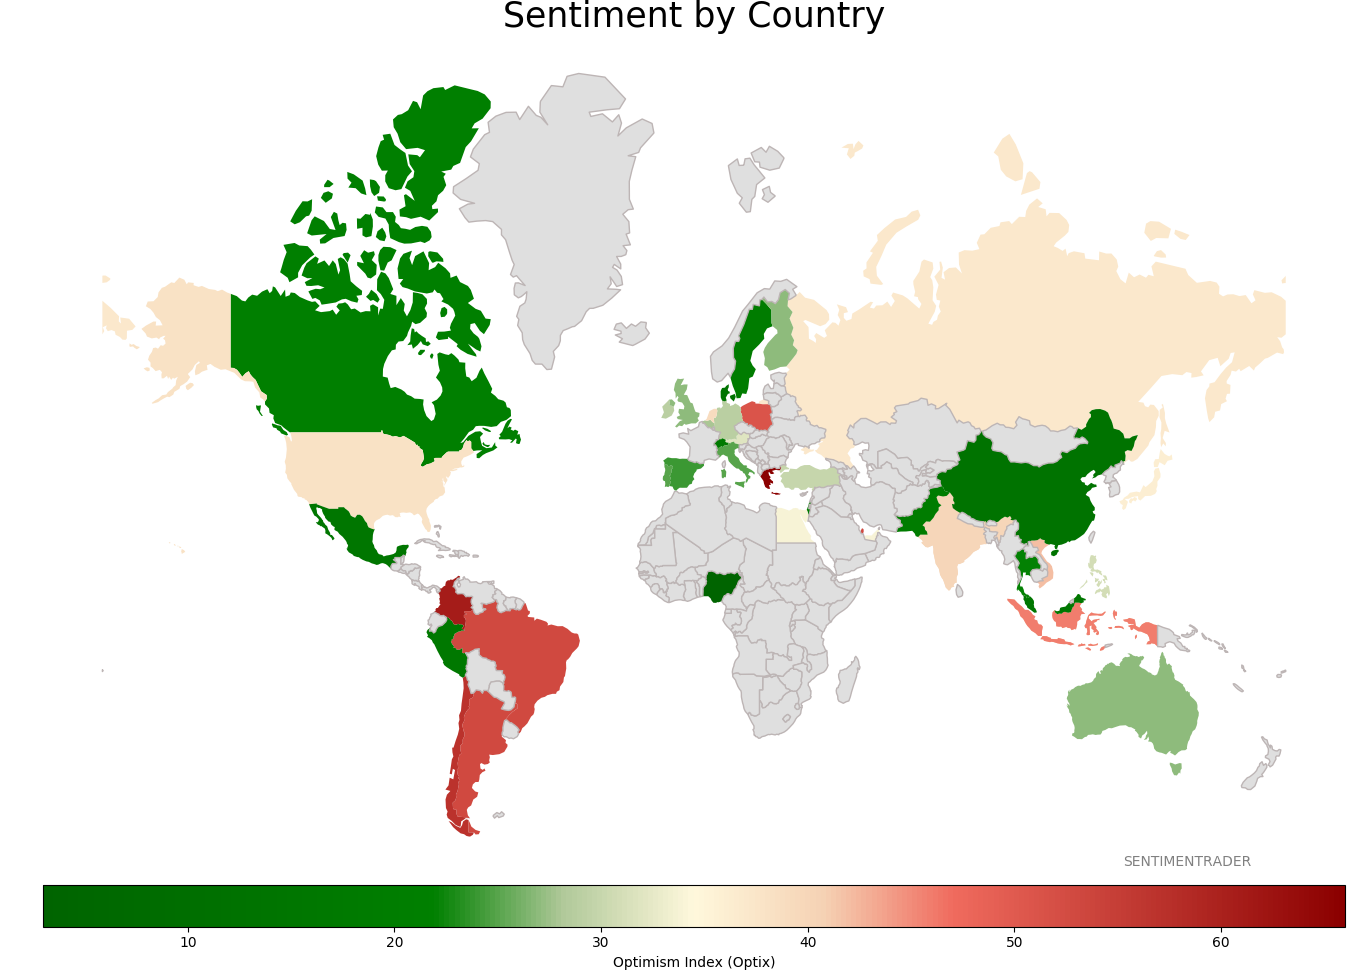
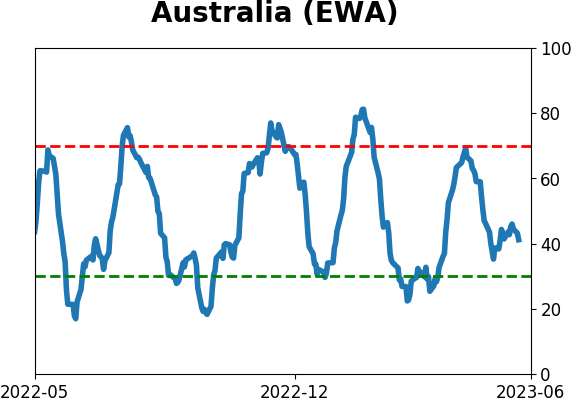
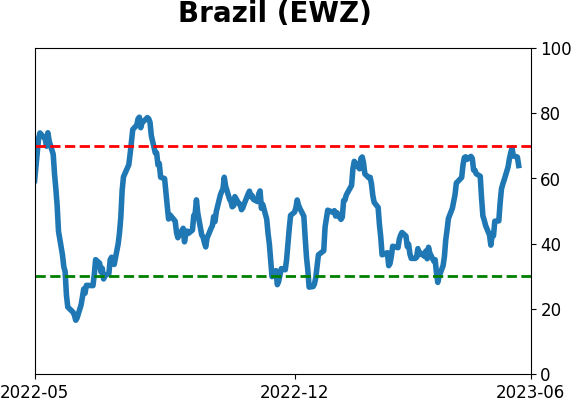
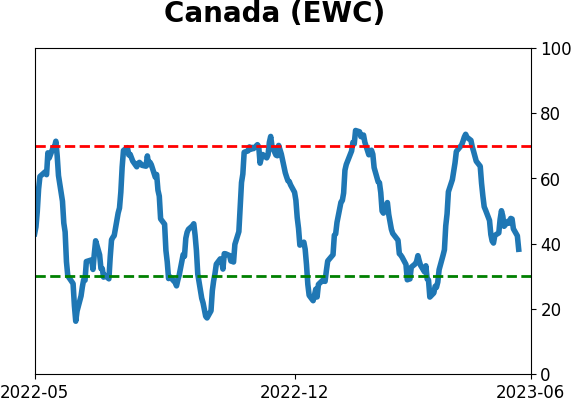
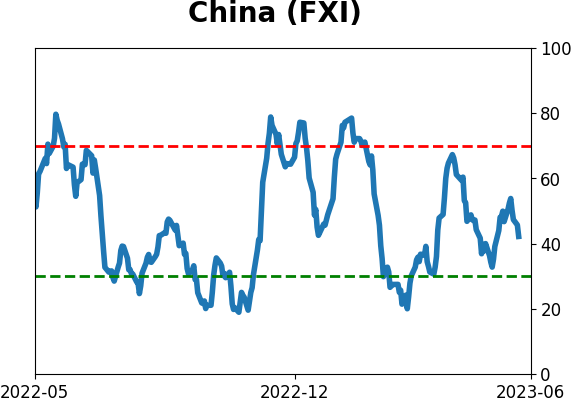
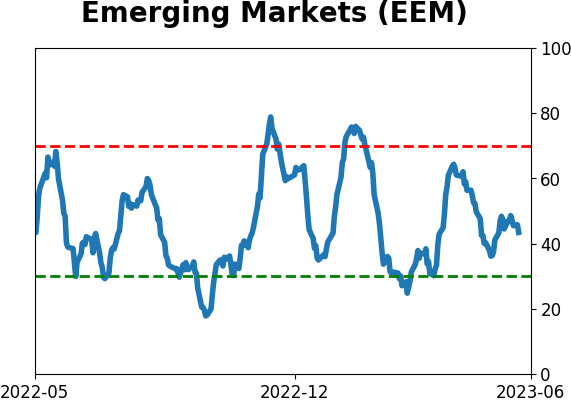
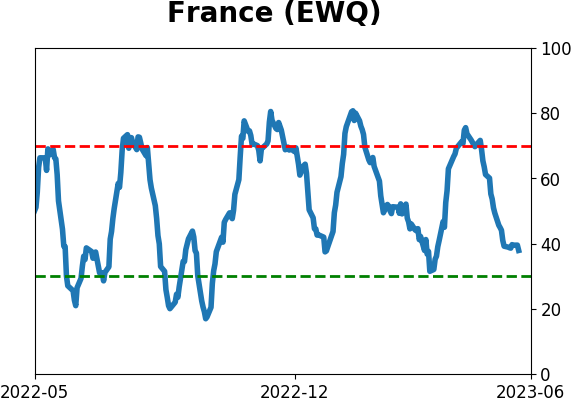
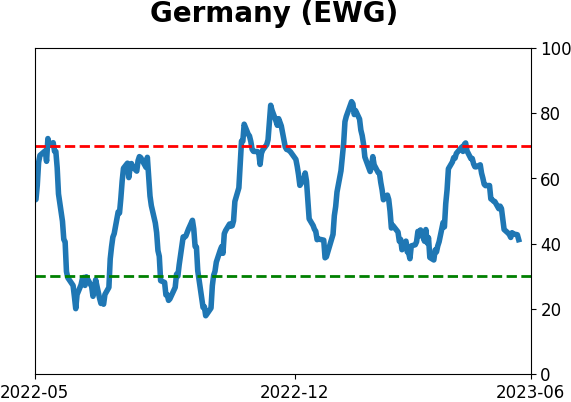
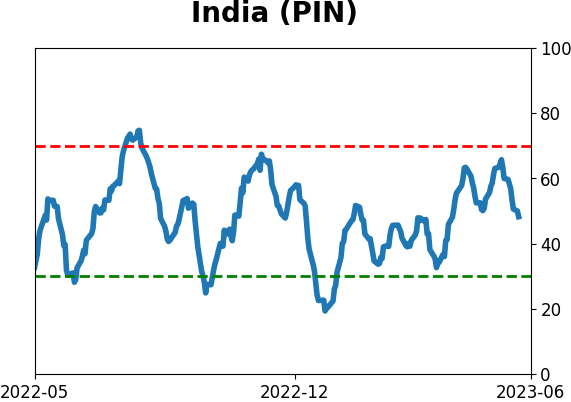
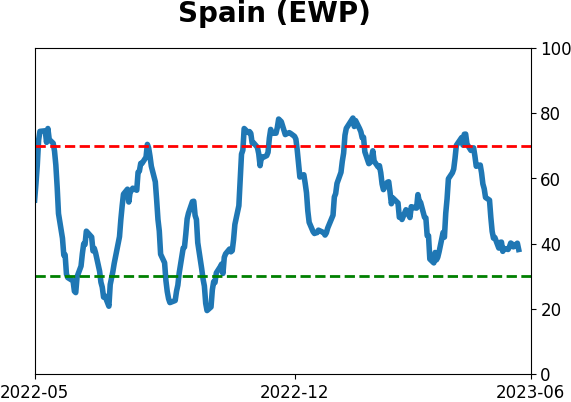
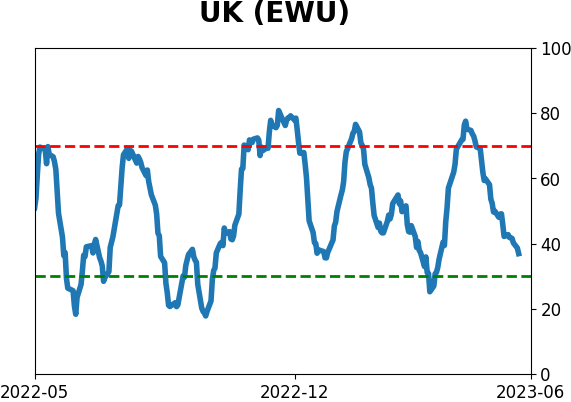
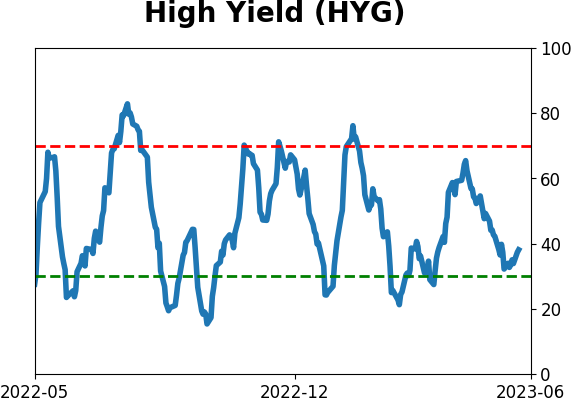
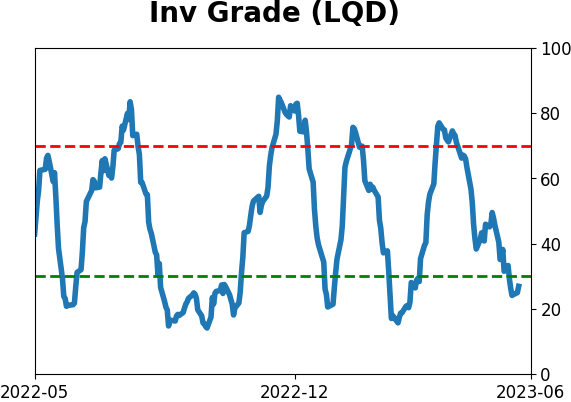
Sentiment Around The World
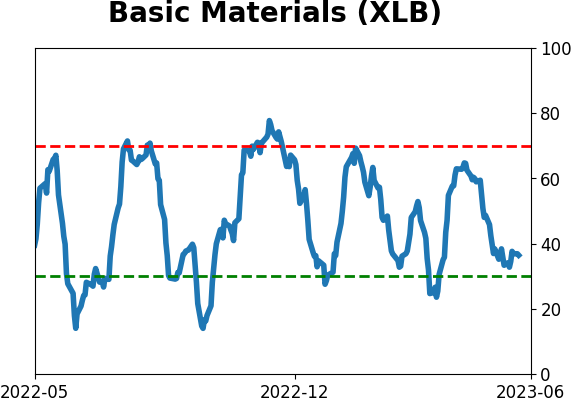
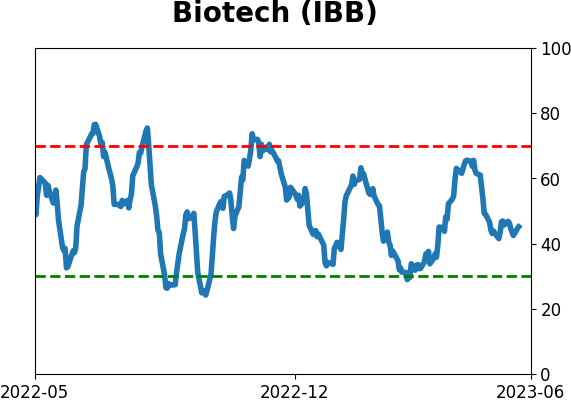
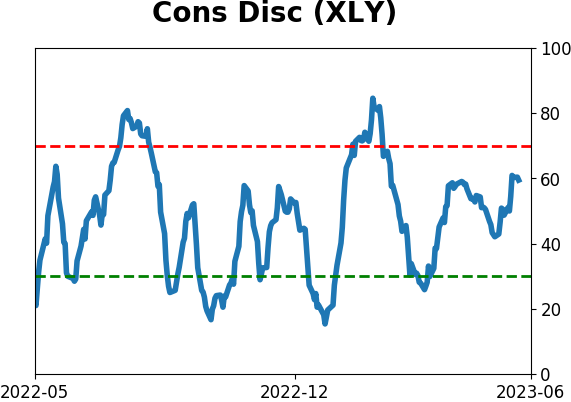
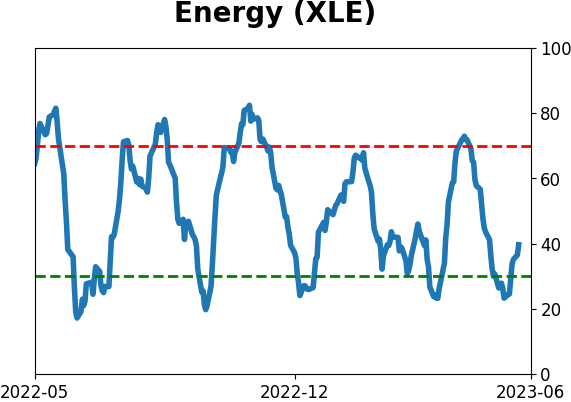
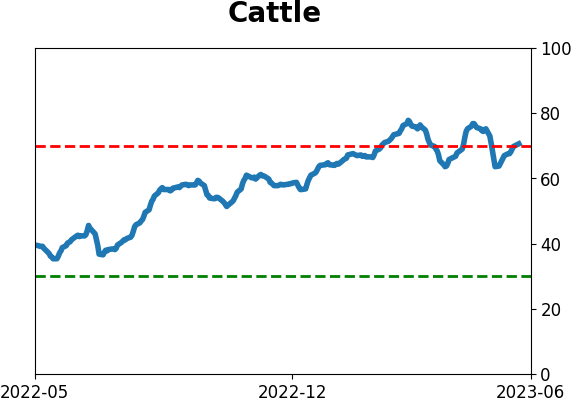
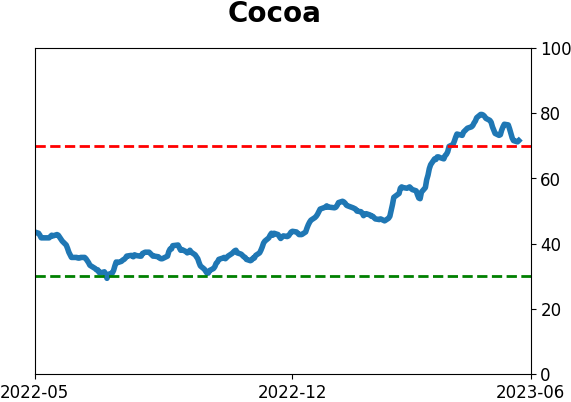
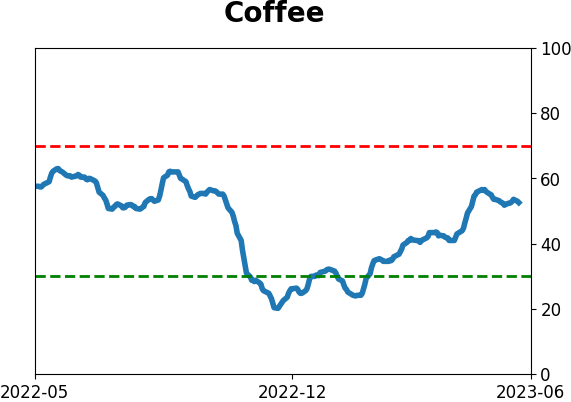
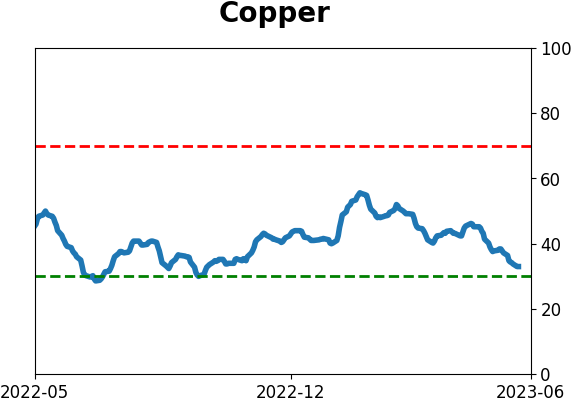
Optimism Index Thumbnails
|
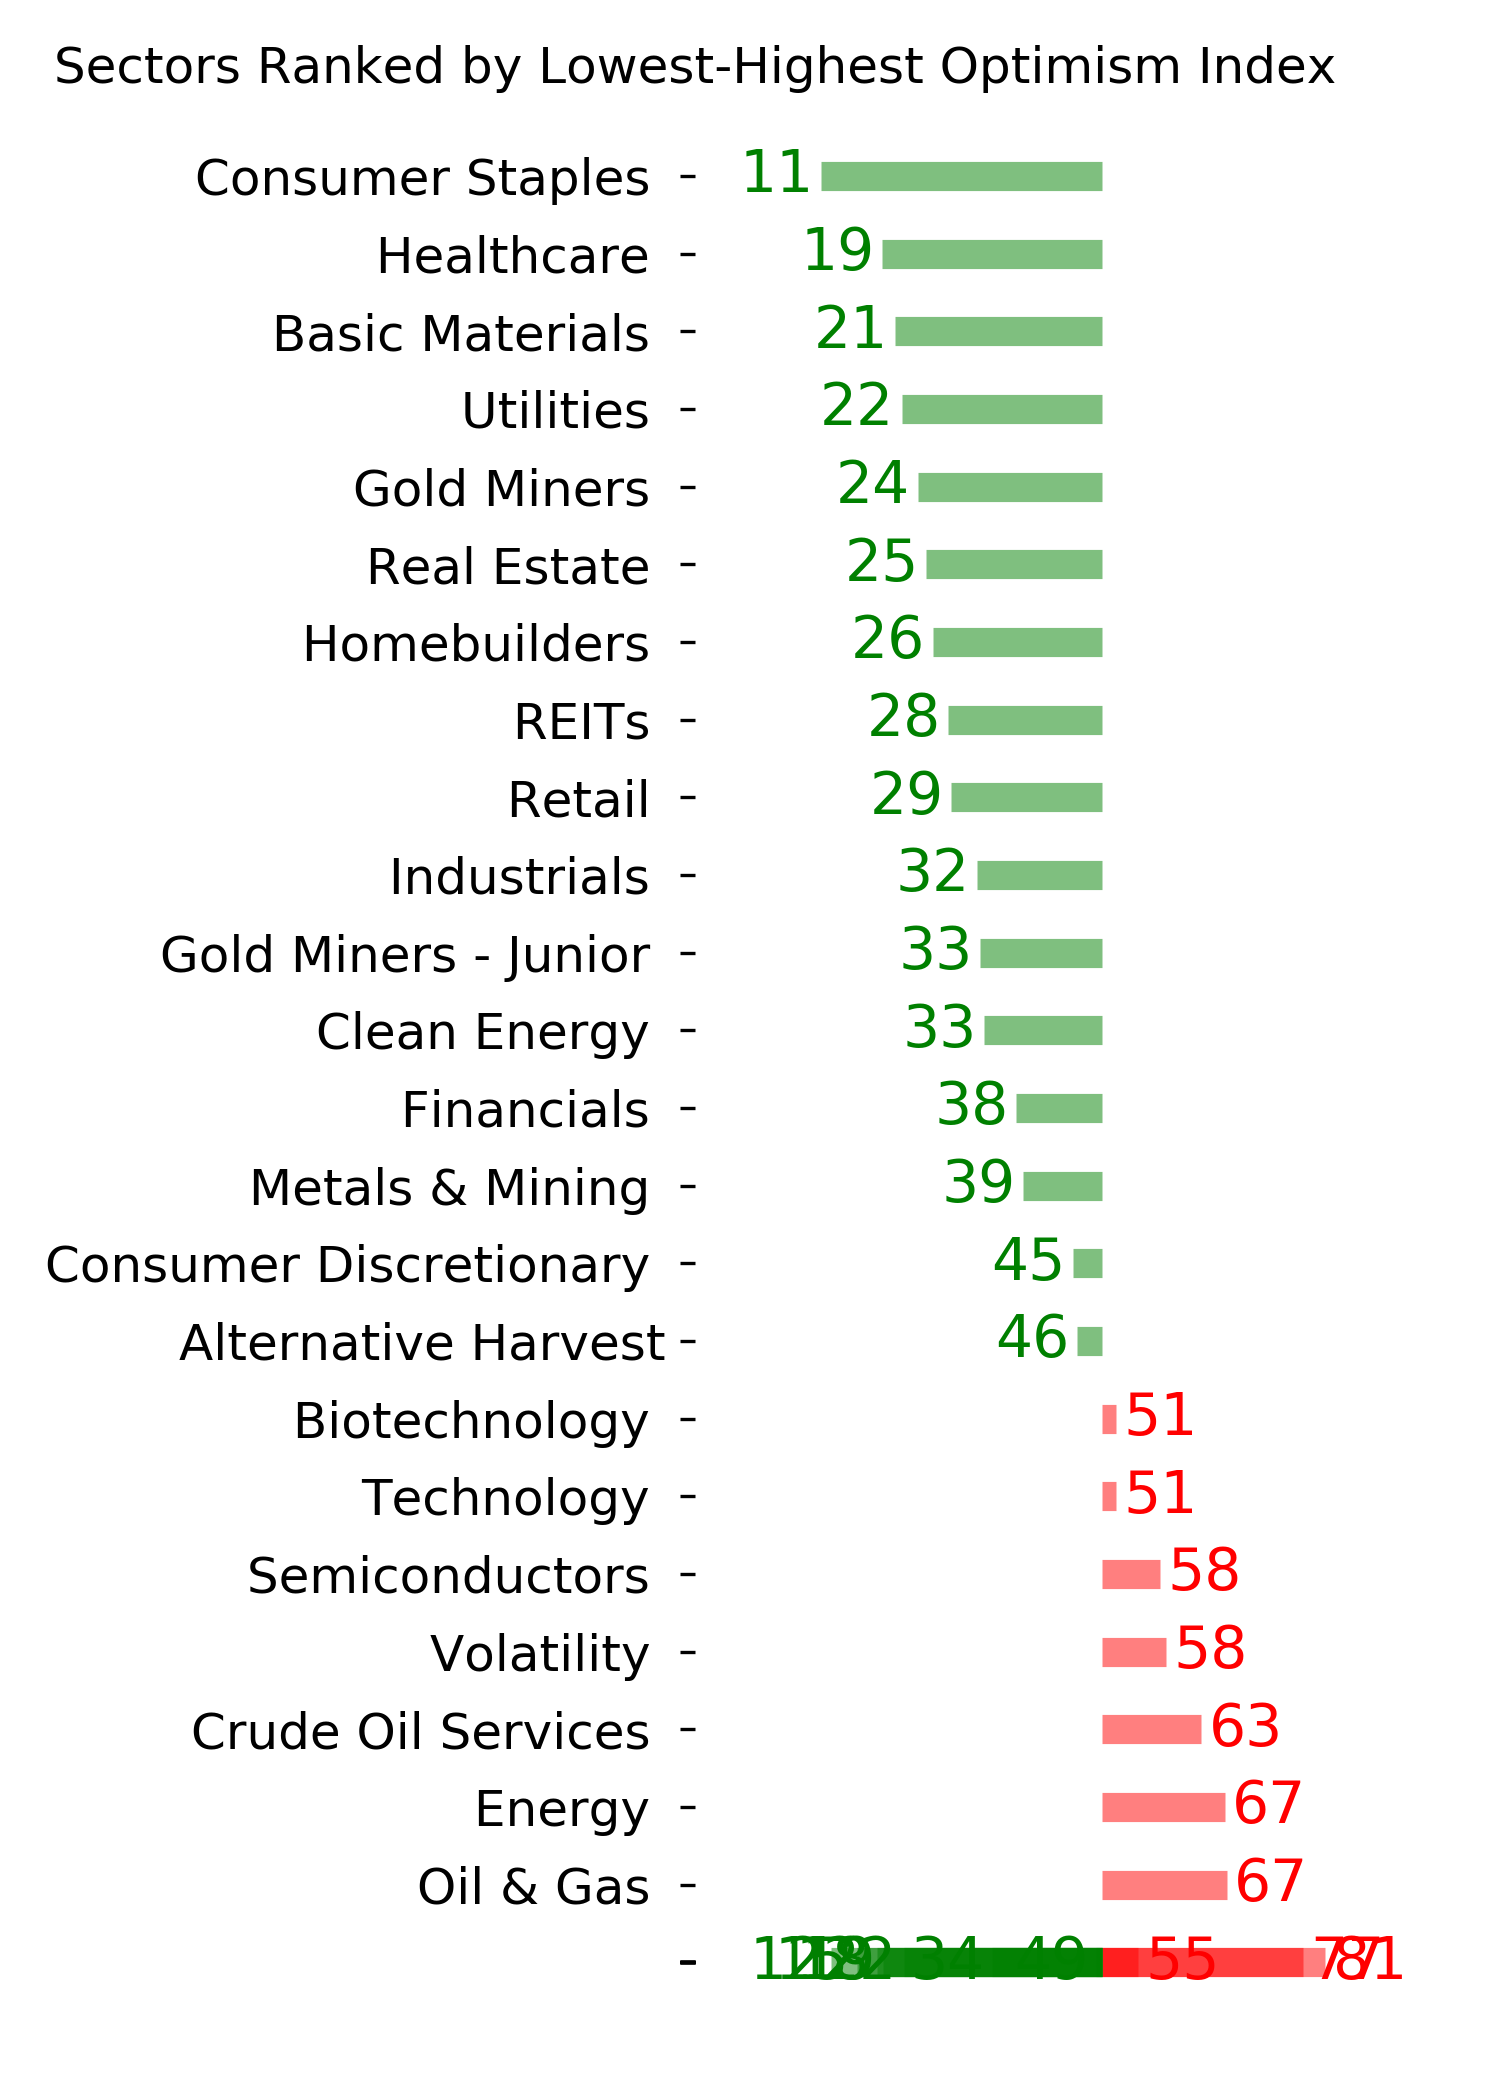
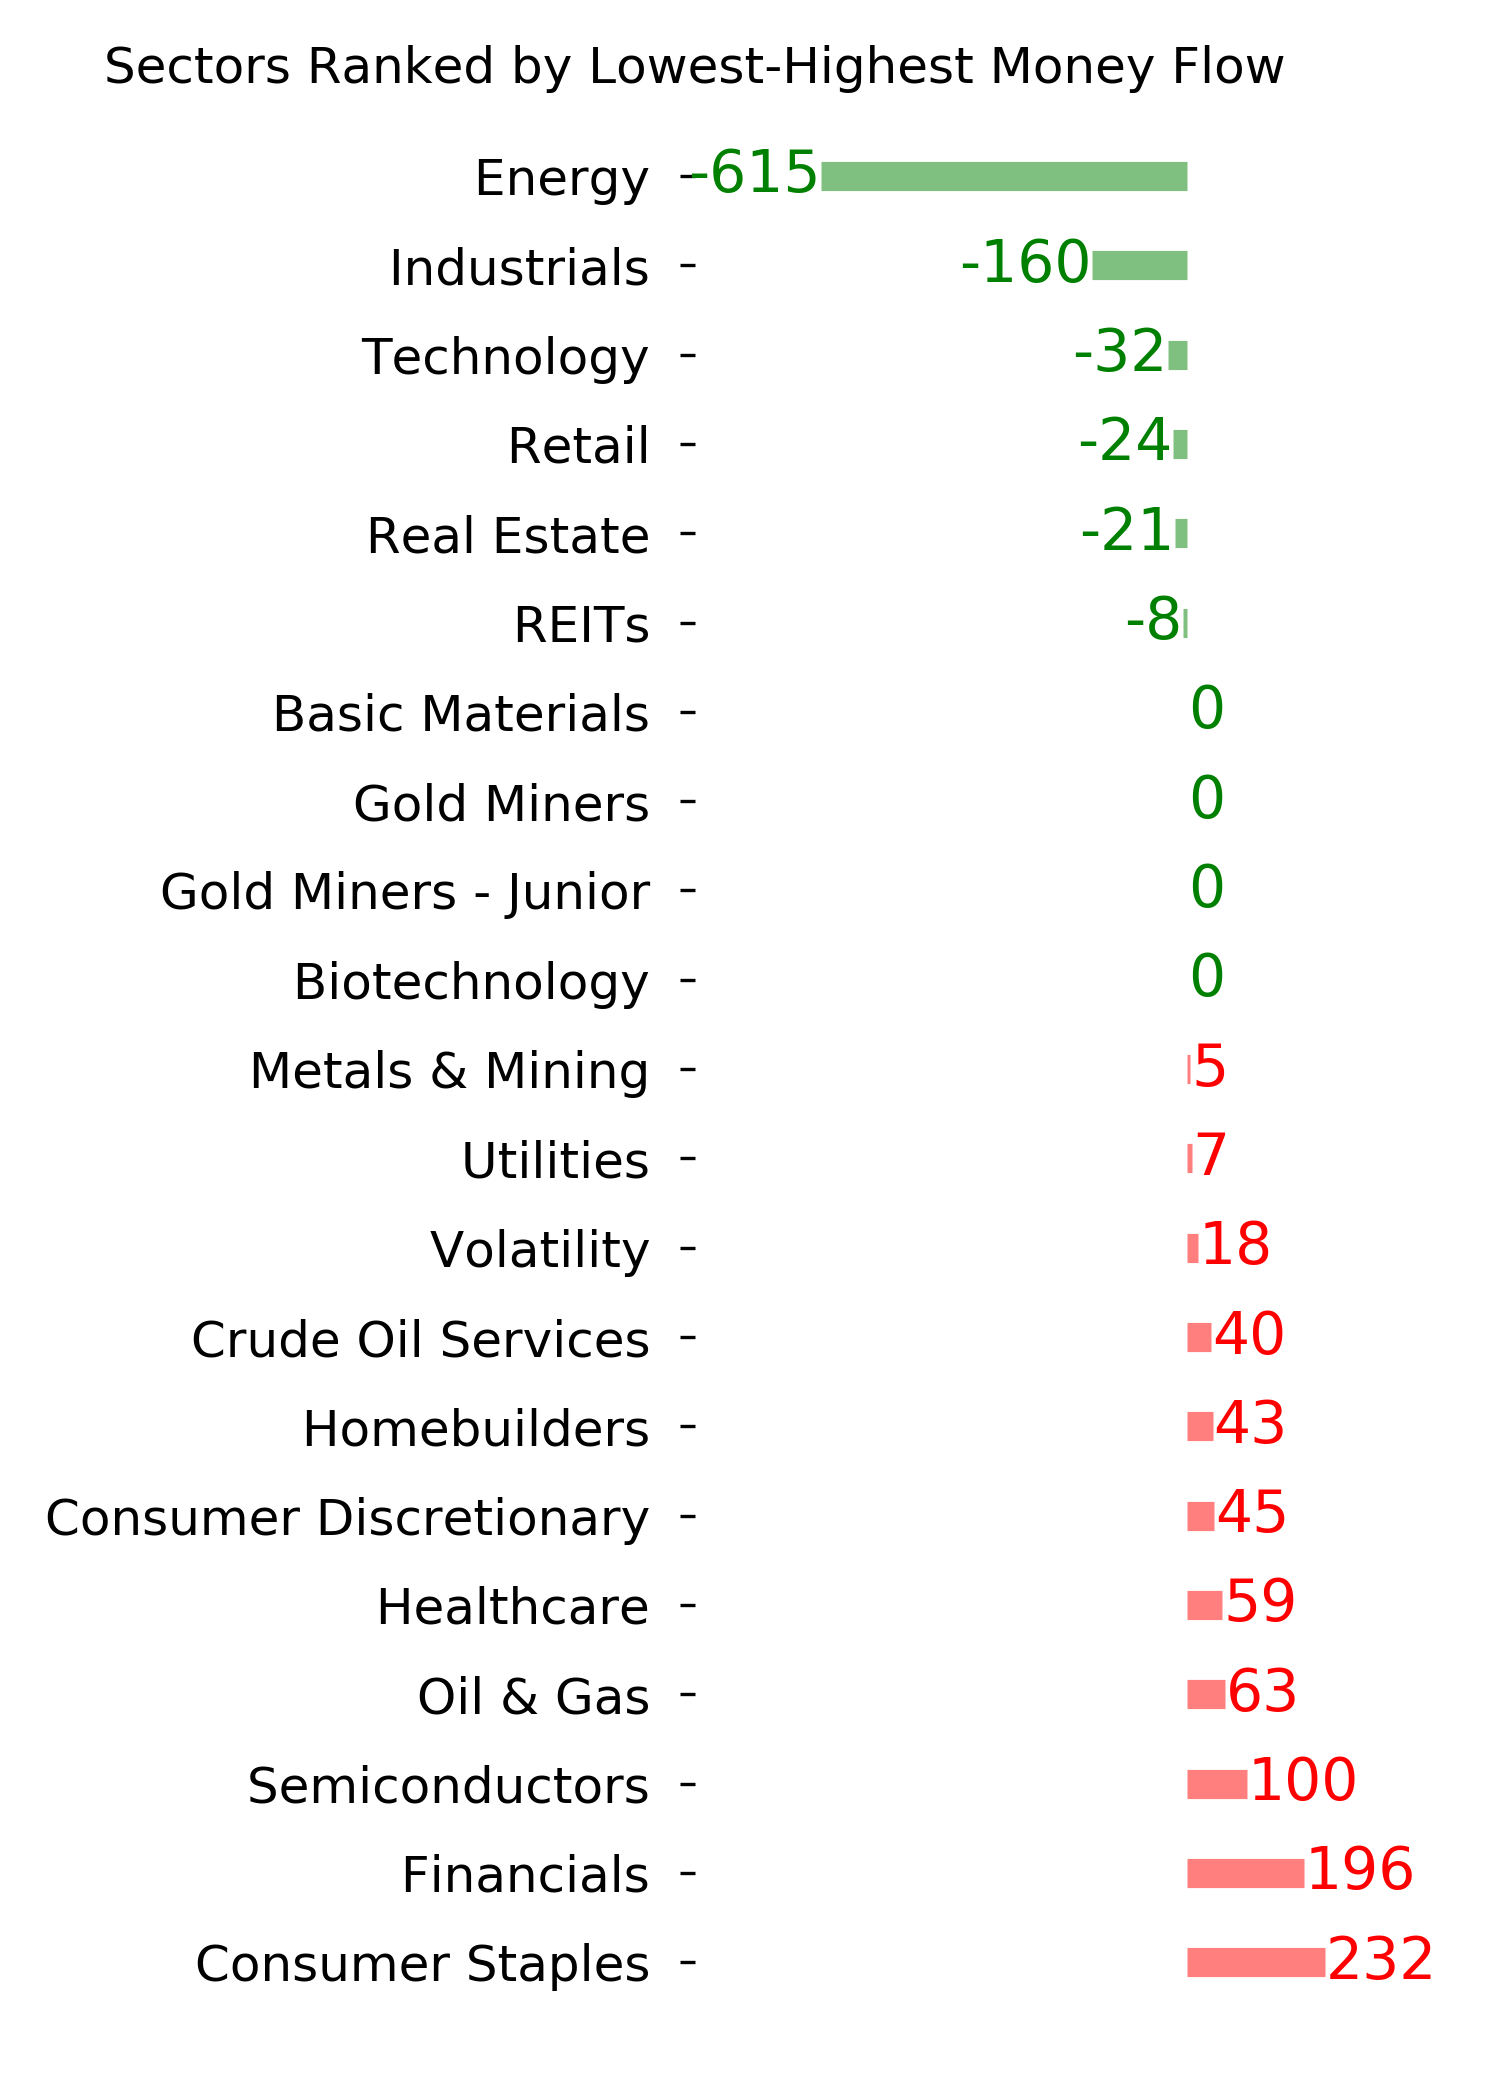
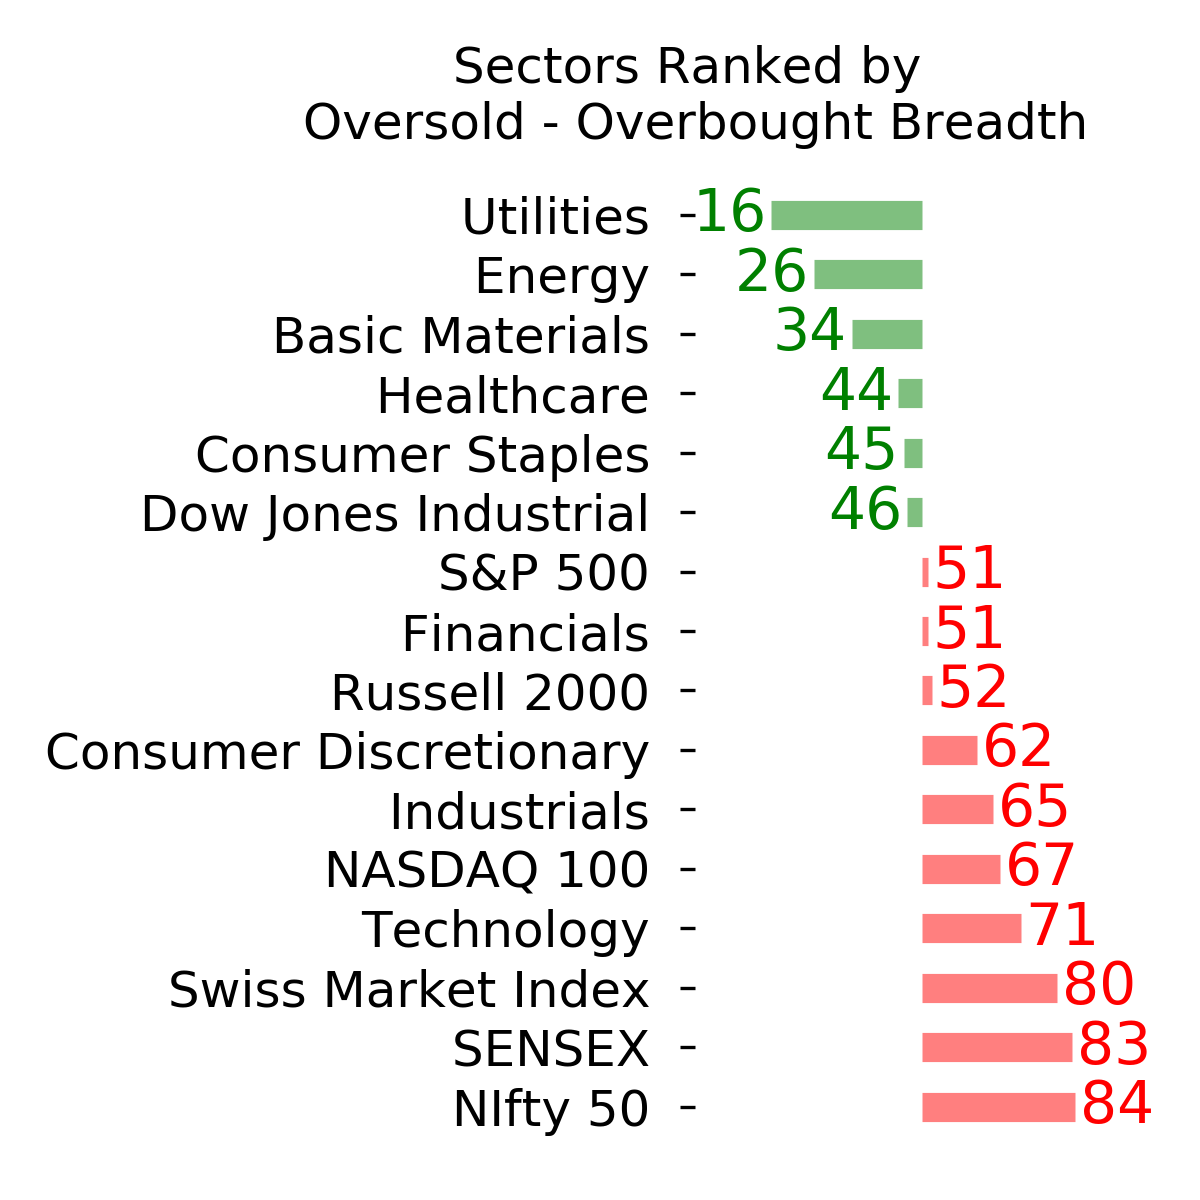
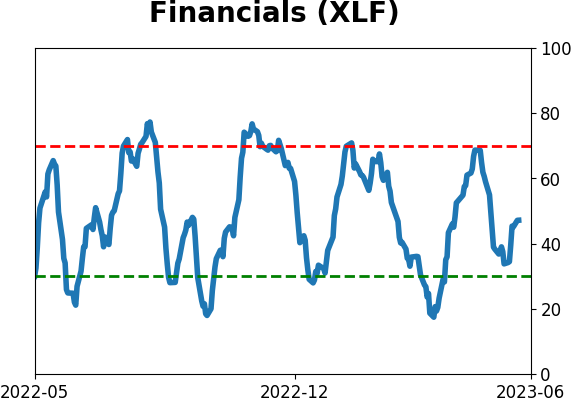
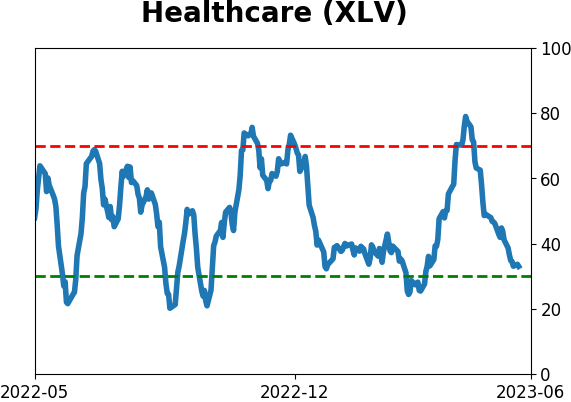
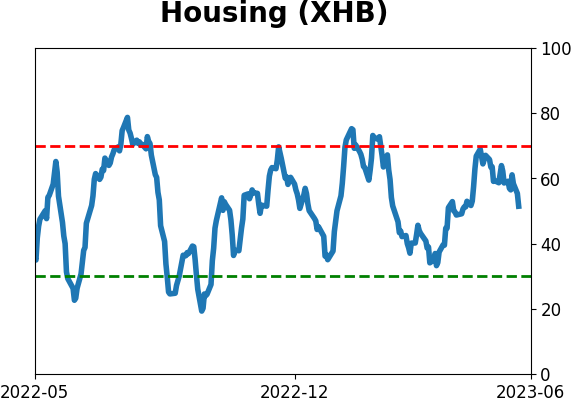
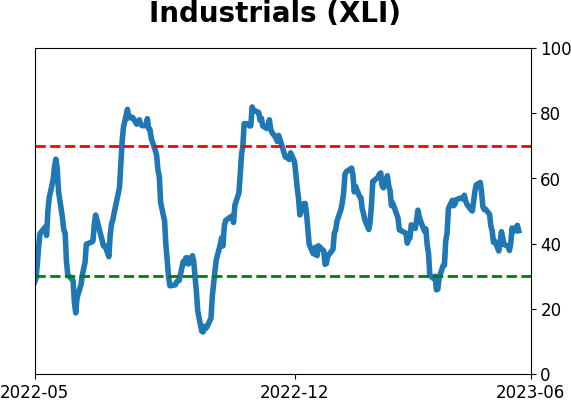
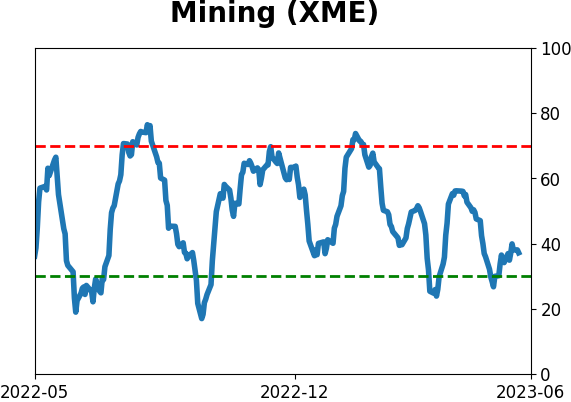
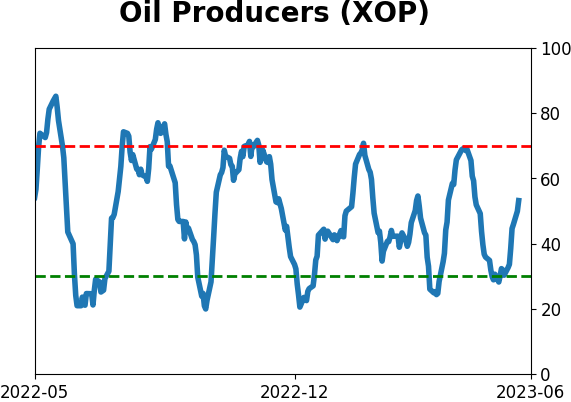
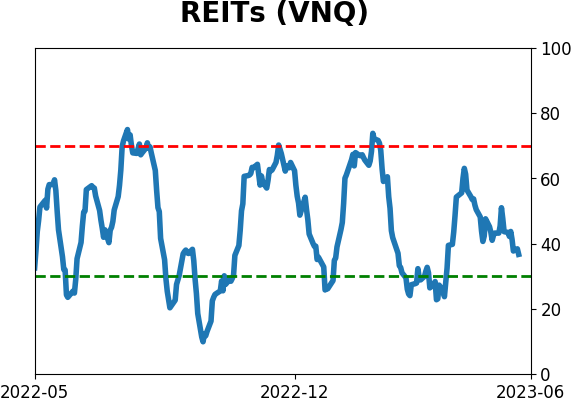
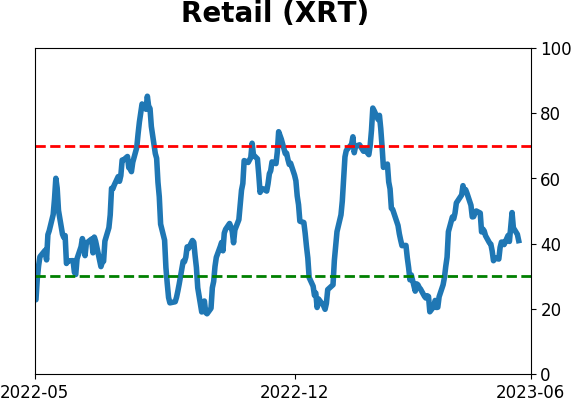
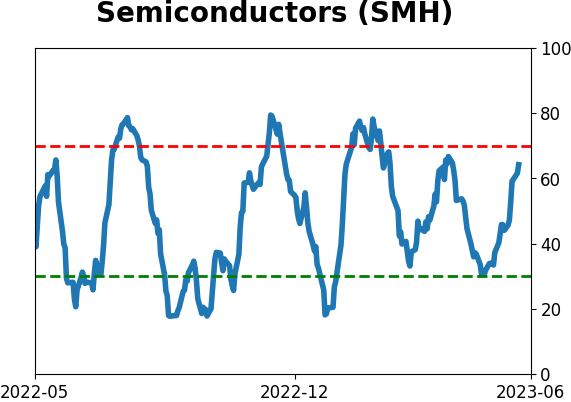
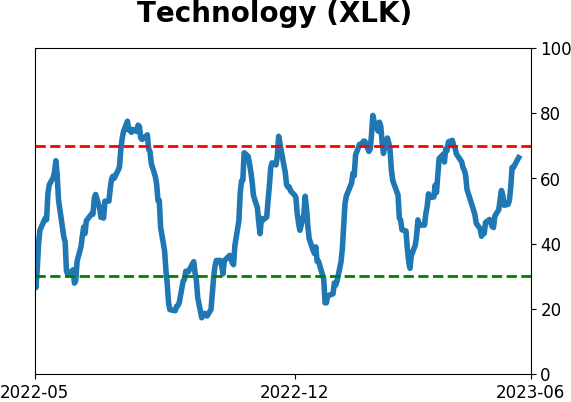
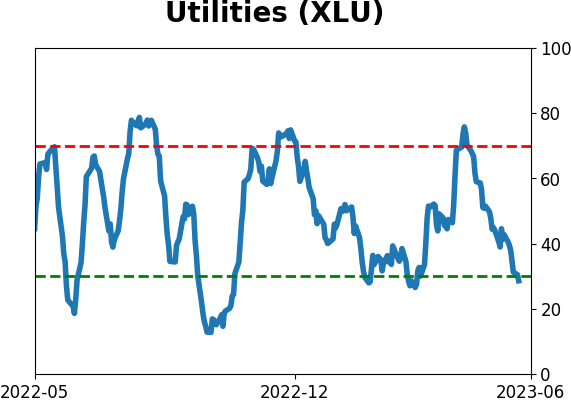
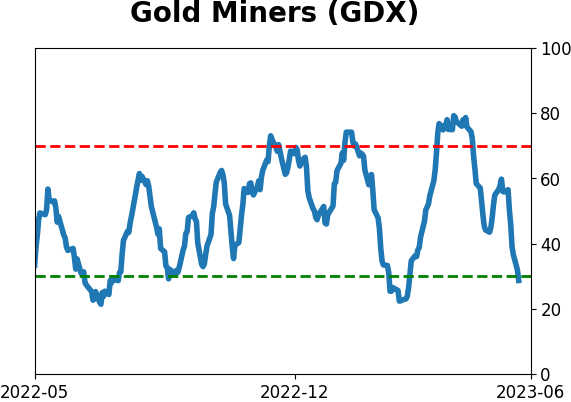
Sector ETF's - 10-Day Moving Average
|
|
|
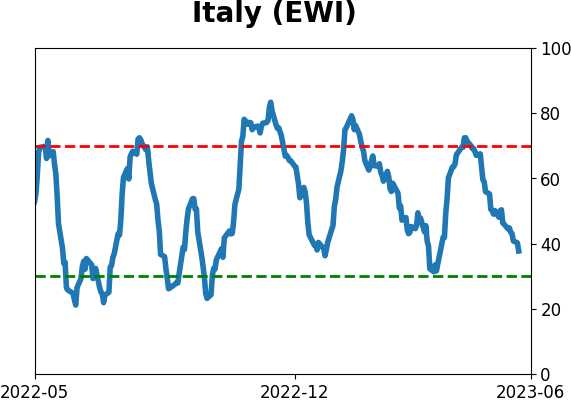
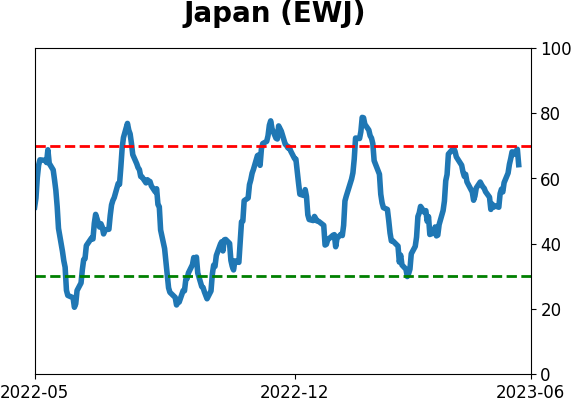
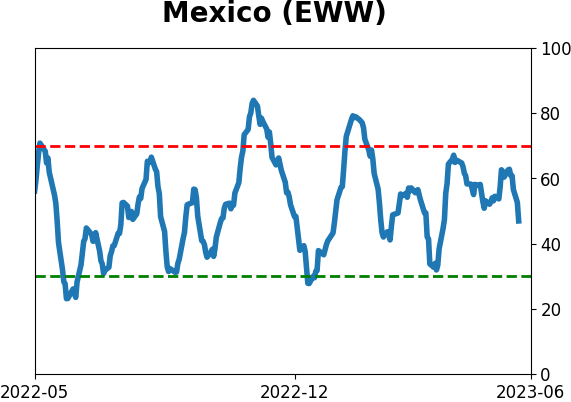
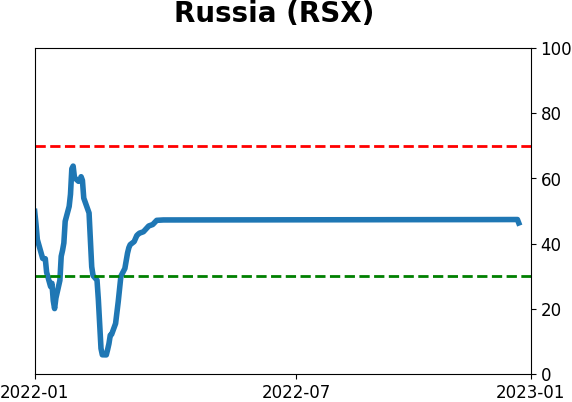
Country ETF's - 10-Day Moving Average
|
|
|
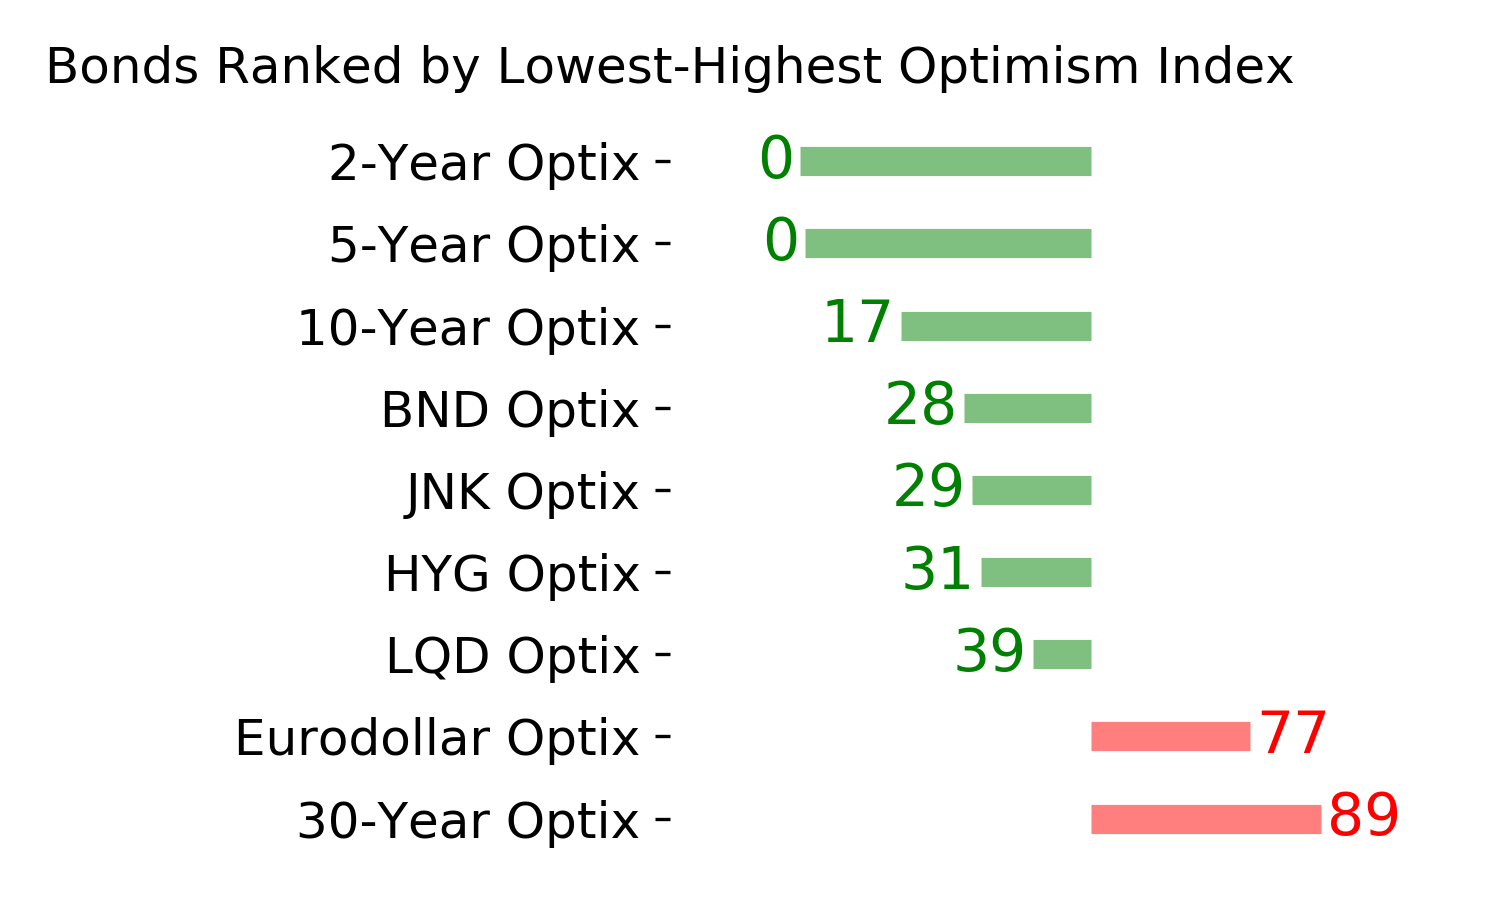
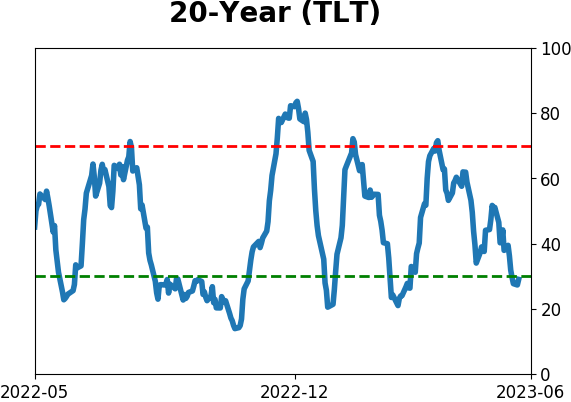
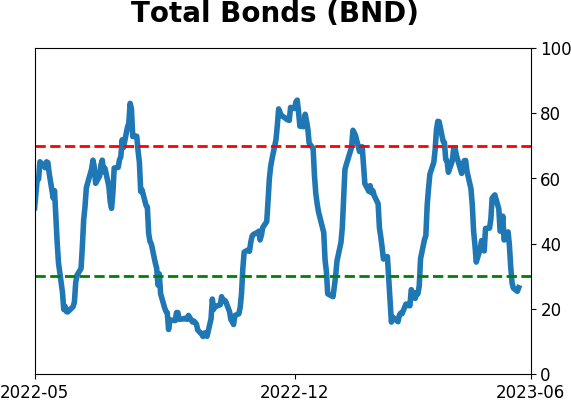
Bond ETF's - 10-Day Moving Average
|
|
|
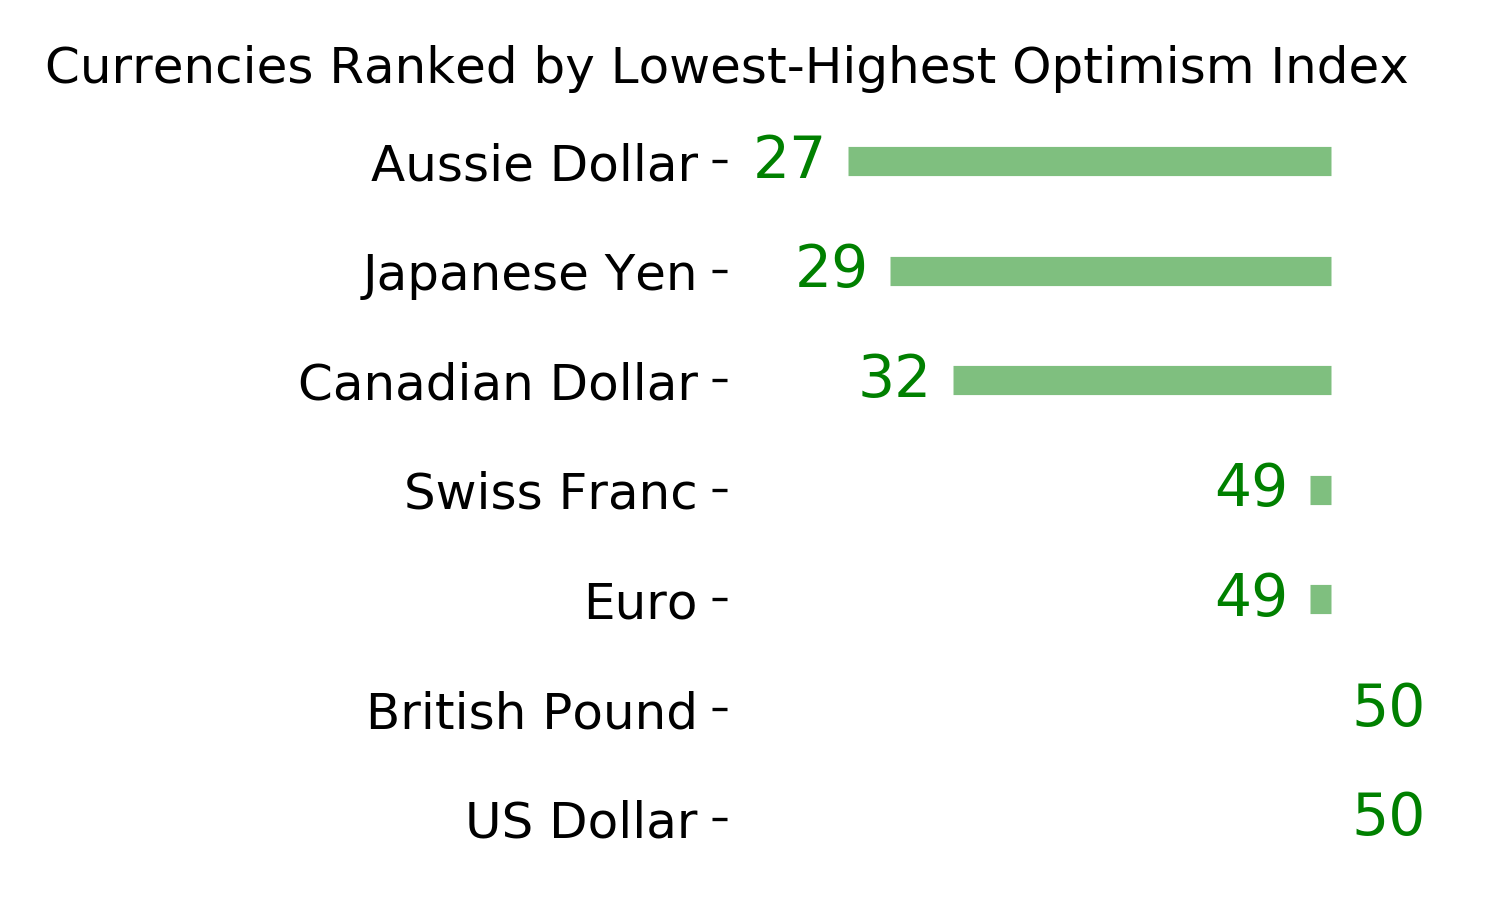
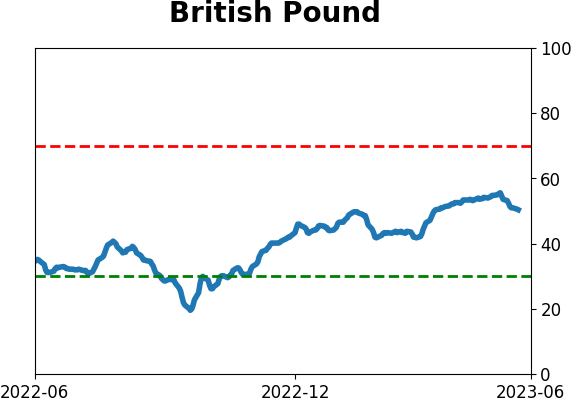
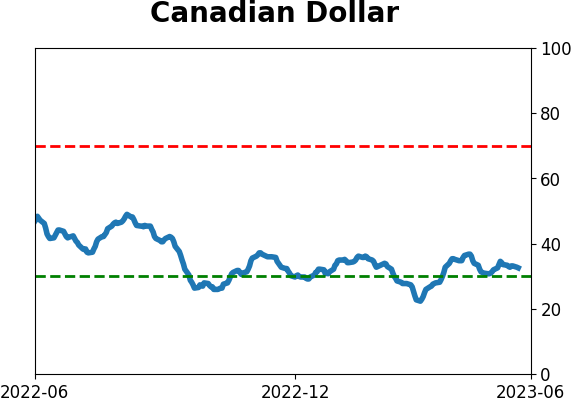
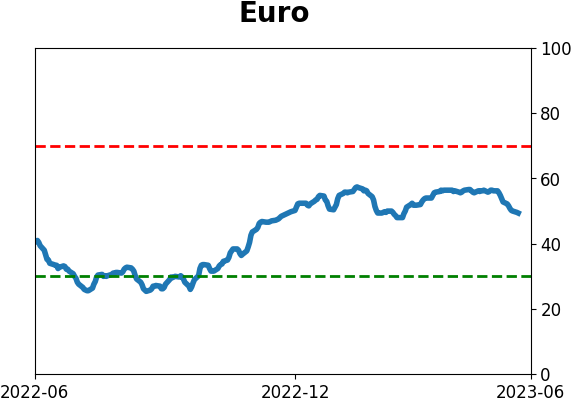
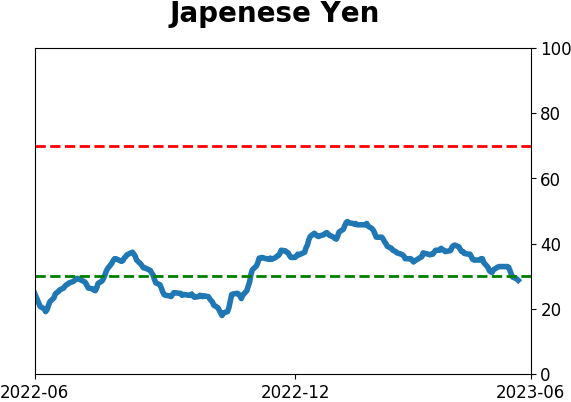
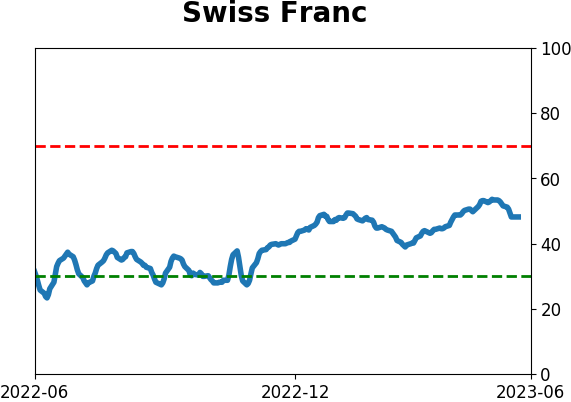
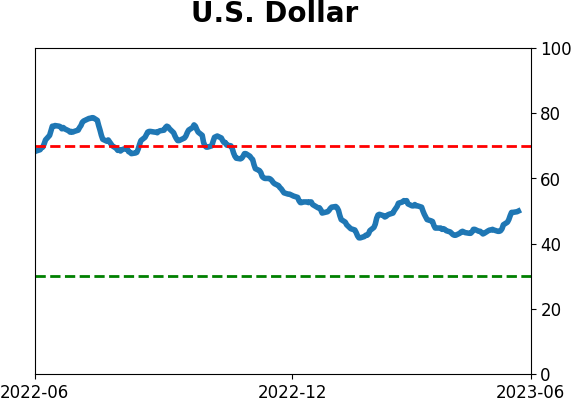
Currency ETF's - 5-Day Moving Average
|
|
|
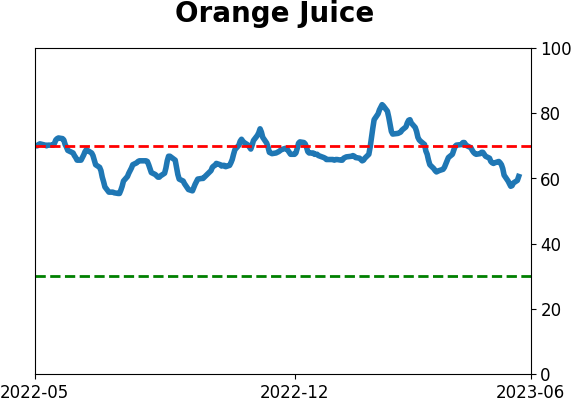
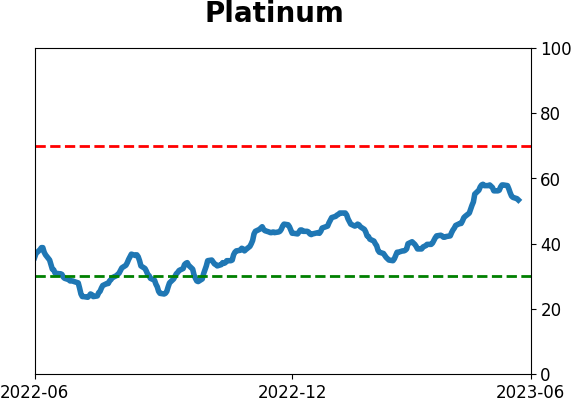
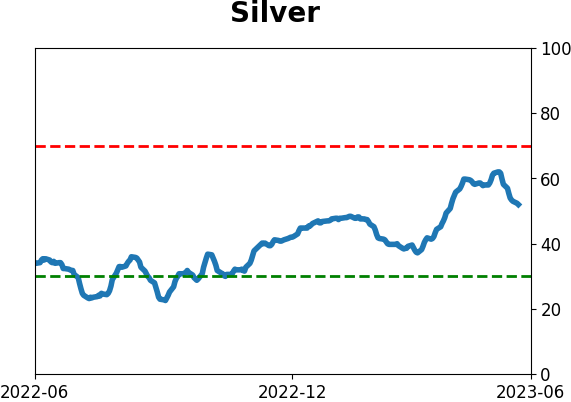
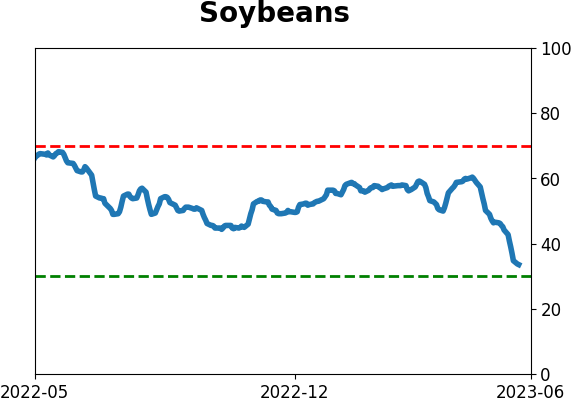
Commodity ETF's - 5-Day Moving Average
|
|