Headlines
|
|
Record losing streaks strike fear as sentiment sours:
The most venerable equity indexes in the world, the Dow Industrials and S&P 500, are at or near record streaks of weekly selling pressure. In the S&P, it has been severe, with 5 of 6 weeks showing 2% or greater losses. While May isn't a common month for bottoms, it's not all that unlikely. Small options traders are betting against it...heavily.
|
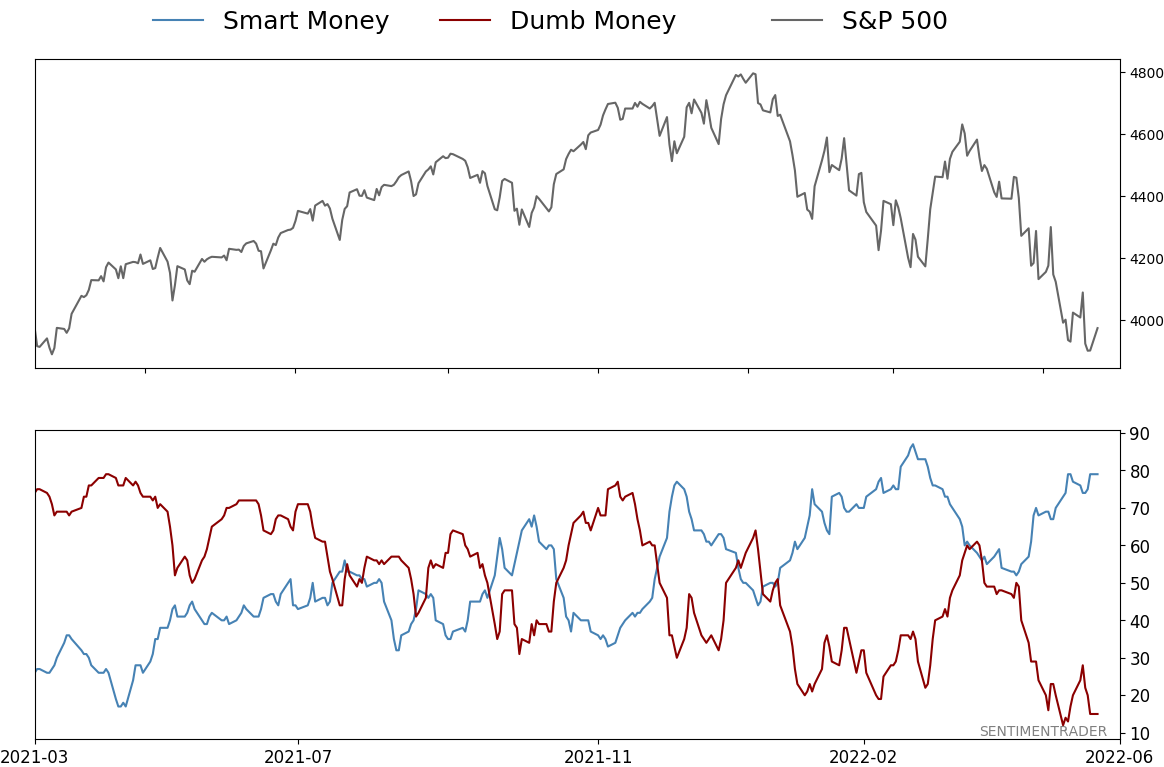
Smart / Dumb Money Confidence
|
Smart Money Confidence: 79%
Dumb Money Confidence: 15%
|
|
Risk Levels
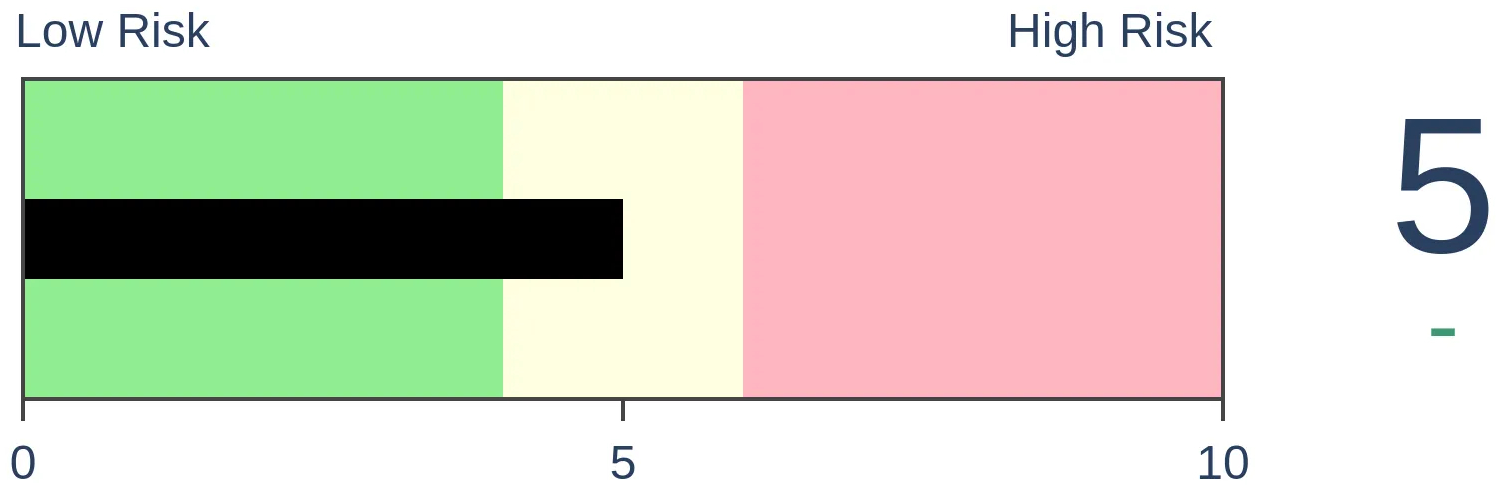
Stocks Short-Term
|
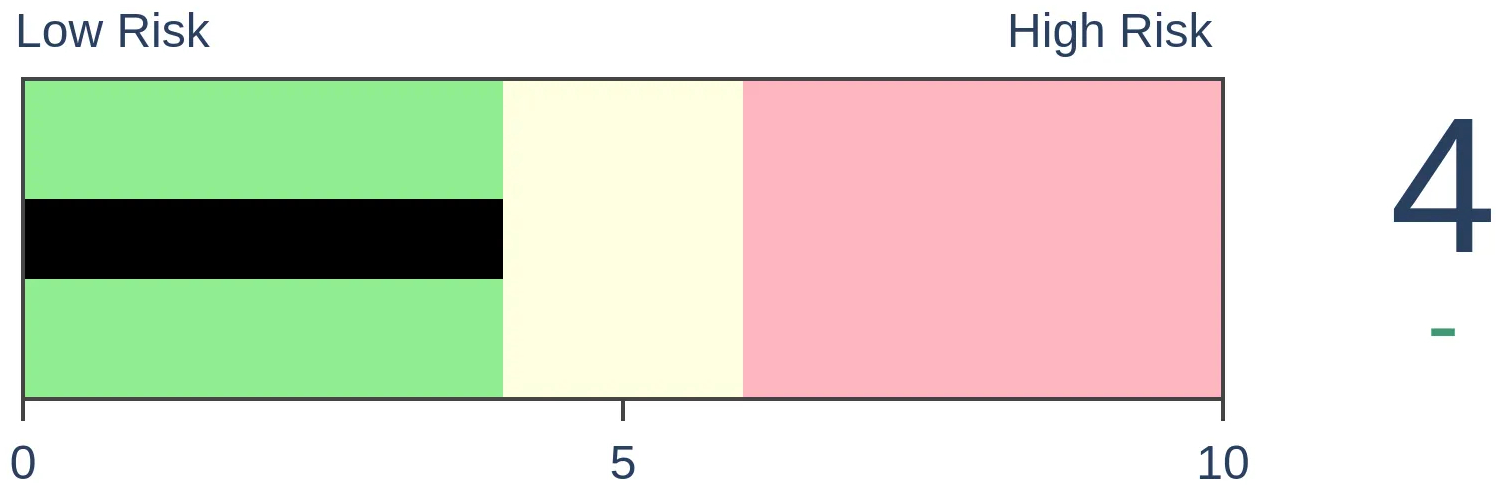
Stocks Medium-Term
|
|
Bonds
|
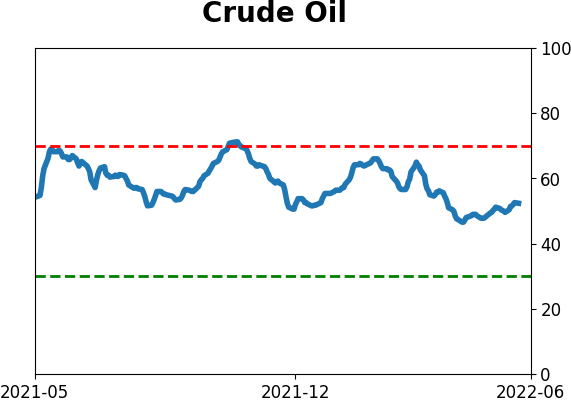
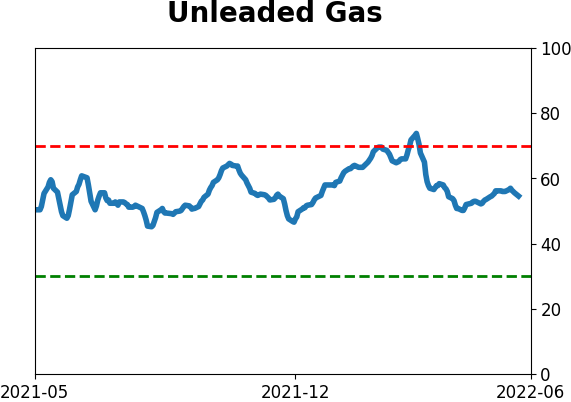
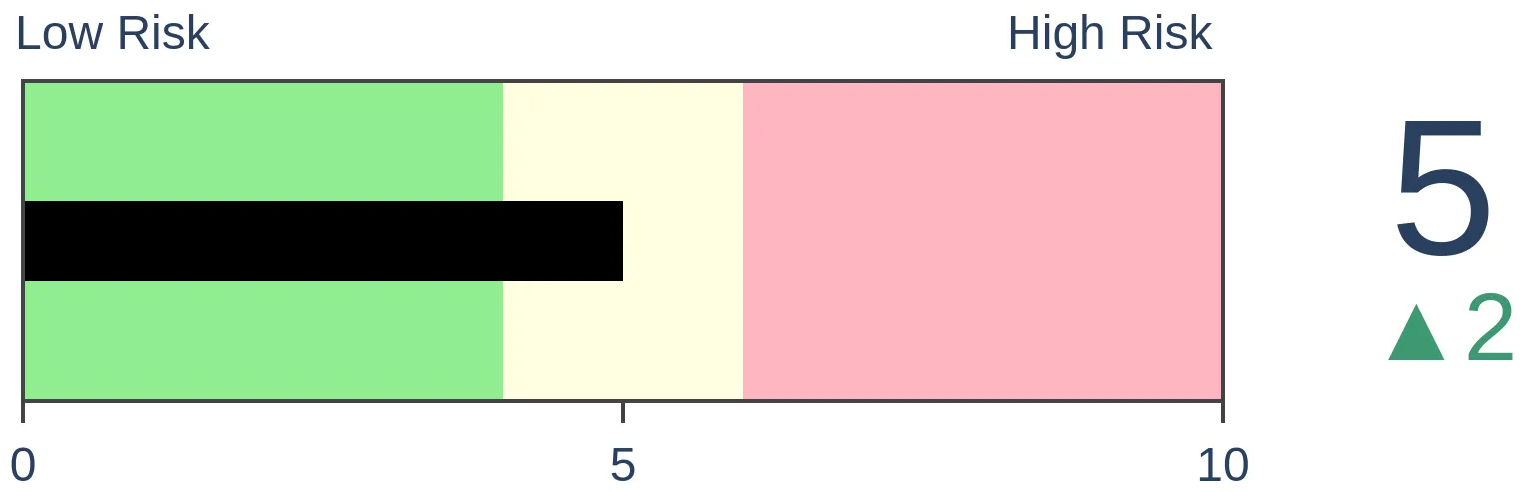
Crude Oil
|
|
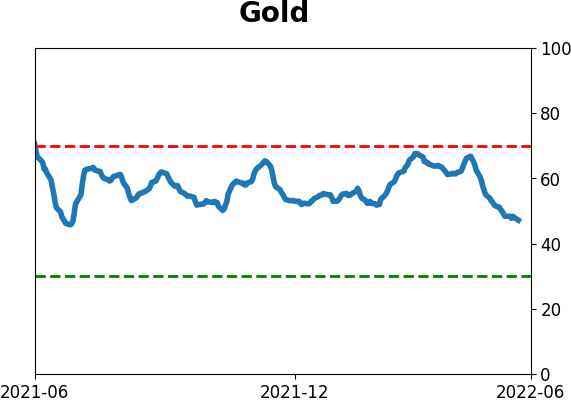
Gold

|
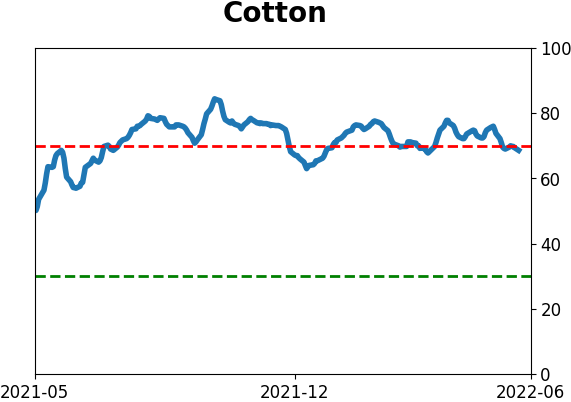
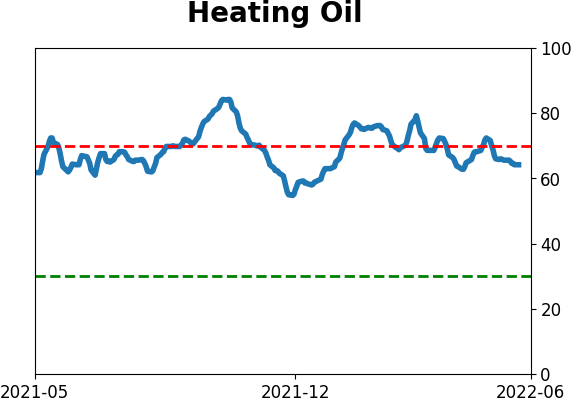
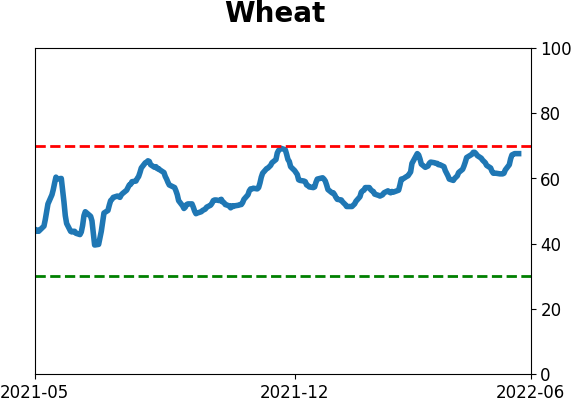
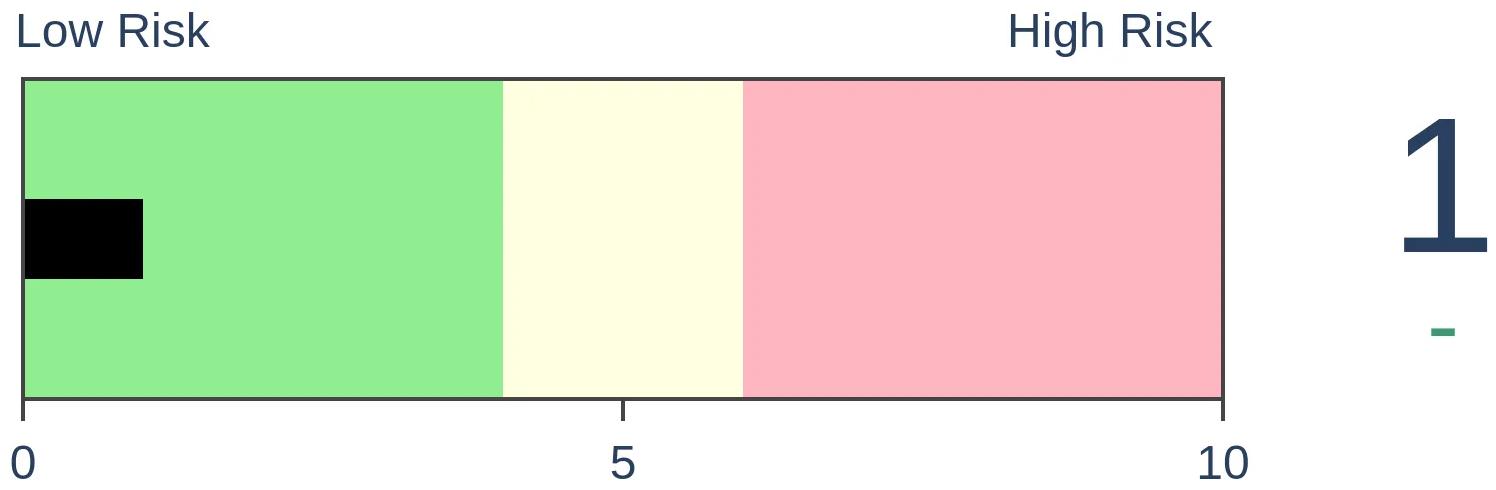
Agriculture

|
|
Research
By Jason Goepfert
BOTTOM LINE
The most venerable equity indexes in the world, the Dow Industrials and S&P 500, are at or near record streaks of weekly selling pressure. In the S&P, it has been severe, with 5 of 6 weeks showing 2% or greater losses. While May isn't a common month for bottoms, it's not all that unlikely. Small options traders are betting against it...heavily.
FORECAST / TIMEFRAME
SPY -- Up, Long-Term
|
Key points:
- The Dow Industrials and S&P 500 are at or near record streaks of selling pressure
- Seasonality may play a role, but a bottom in May/June is not unlikely
- Volatility and correlations are about average for potential medium-term bottoms
- Small options traders continue to bet that the selling isn't over
A record-setting selling streak
We might as well get this out of the way because it's already cited just about everywhere: the most venerable equity indexes in the world are on the cusp of setting all-time losing streaks.
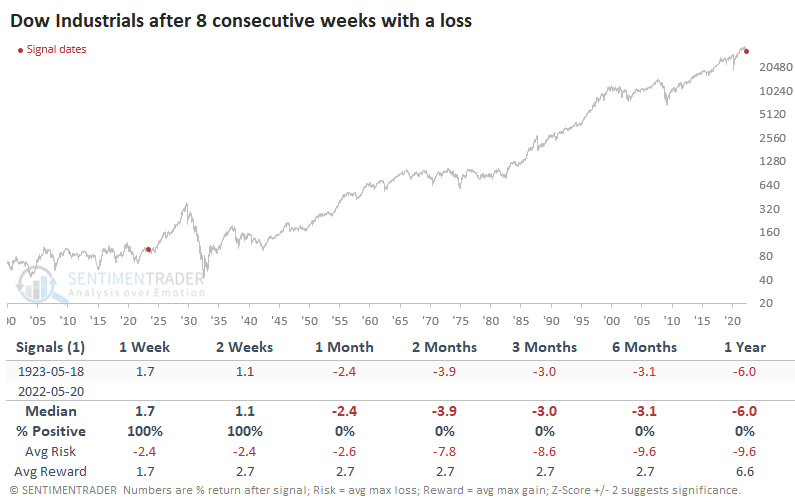
With another loss last week, the Dow Industrials Average tied its record for the longest stretch of consecutive losing streaks.
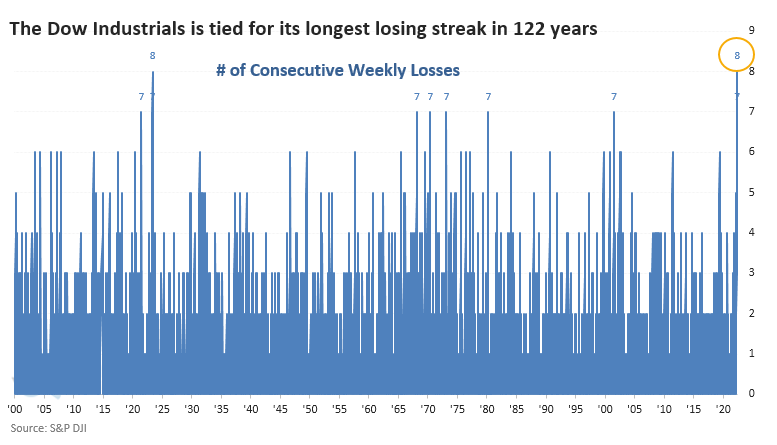
Its other 8-week losing streak, in 1923, preceded a bumpy road, but it never lost more than another 10% at any point within the following year. Of course, it also didn't gain more than +10% until that year passed, before embarking on an incredible run into the 1929 peak.
The most benchmarked index in the world, the S&P 500, is just a week away from also tying its record losing streak.
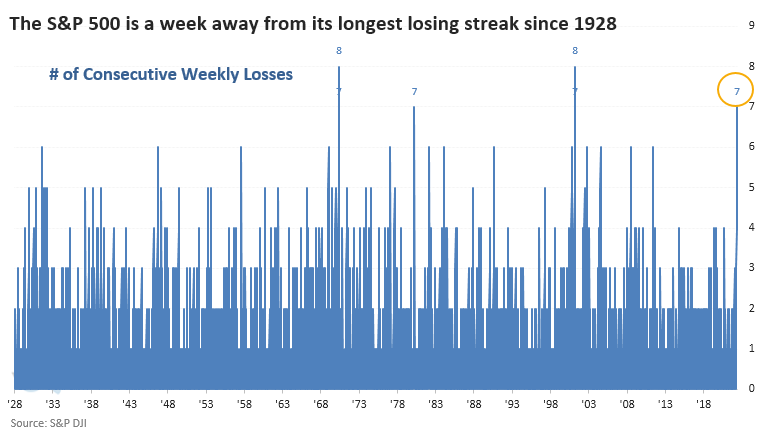
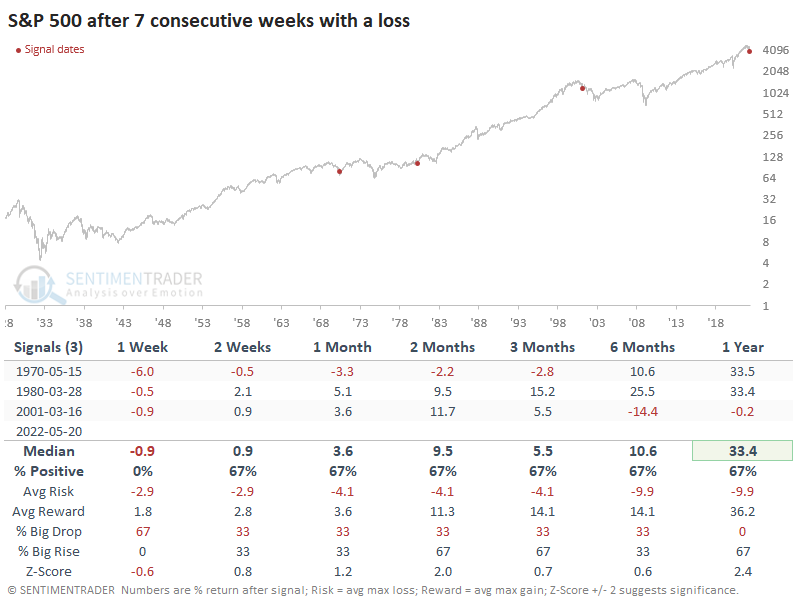
The three other times it went 7 in a row, its future returns were pretty good, at least through the next few months.
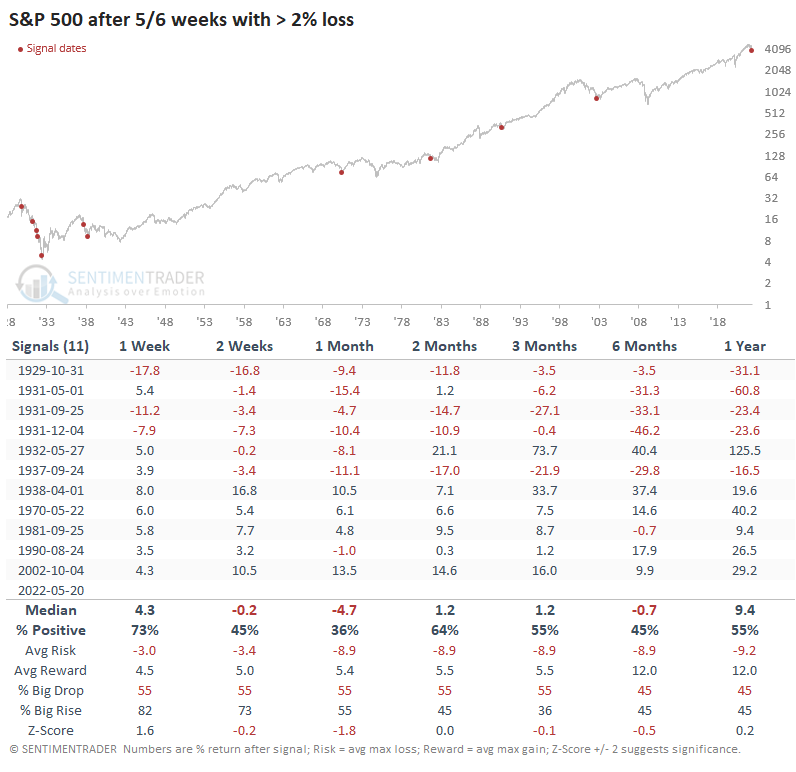
What's especially notable about the S&P's losing streak is how heavy the losses have been. Out of the past six weeks, five of them saw losses greater than 2%. This was a hallmark of the horrid 1930s.
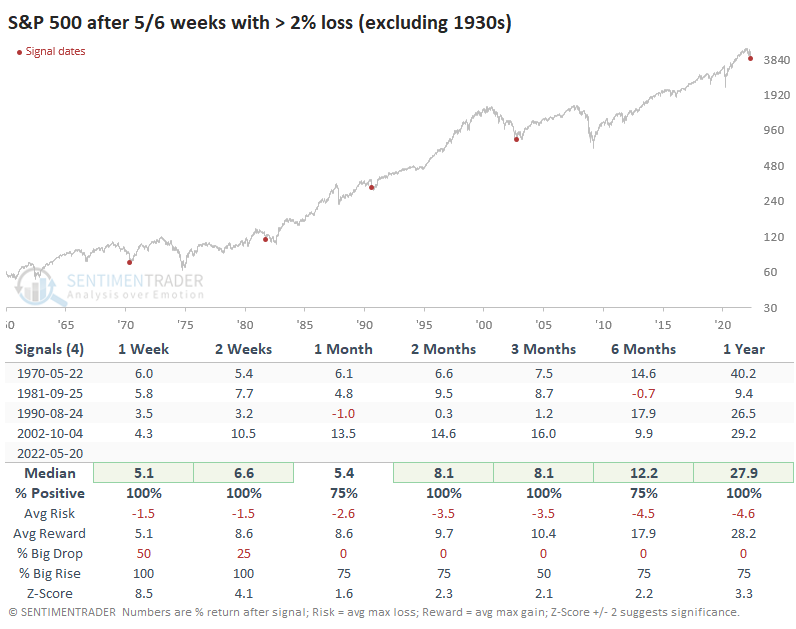
Outside of the 1930s, however, it proved to be a sign of exhaustive selling pressure. Over the next year, the S&P 500 returned more than +26% after three of the four precedents.
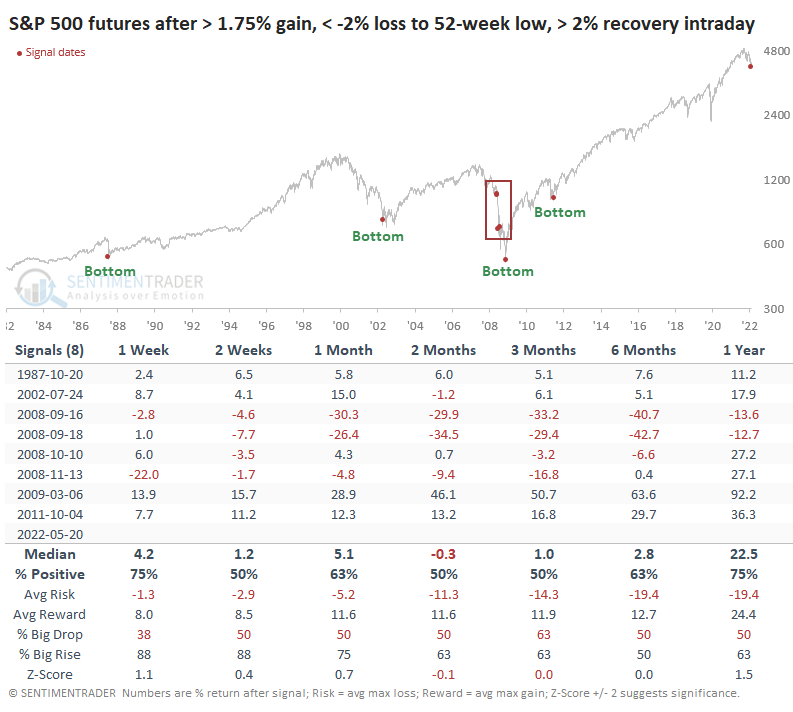
Friday's price pattern was interesting because of how volatile it was. Since the inception of the S&P 500 futures, it's happened a handful of times. What's notable about it is that it either essentially marked the bottom or, in 2008, the period right before the waterfall decline.
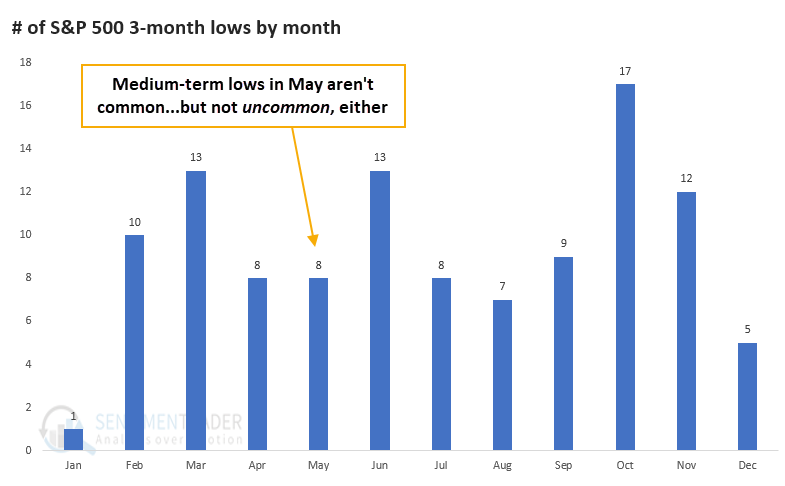
Some might say that we're less likely to bottom here because of "sell in May" seasonality. If we look at all 3-month lows in the S&P 500 since 1928, May ranked about in the middle in terms of frequency. It was more common to see multi-month lows in October, March, June, or November...but at least this isn't January.
Not enough fear?
One of the tropes being trotted out constantly over the past week is that stocks can't bottom because investors are just too darned complacent. We haven't seen capitulation. There isn't enough fear out there.
The most-cited excuse is the VIX "fear gauge," which reflects the implied volatility that options traders expect in the S&P 500 over the next 30 days or so. It has risen significantly but has not yet spiked above arbitrary levels that suggest "fear."
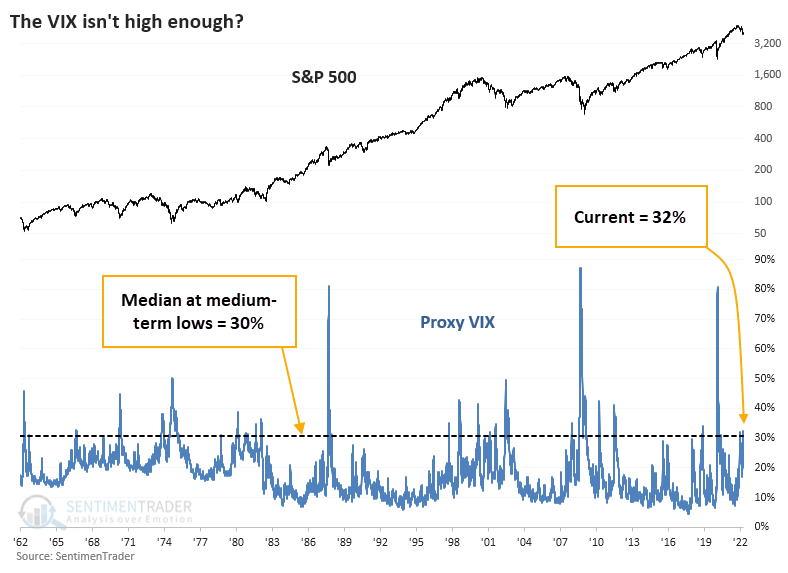
The chart below shows the Proxy VIX that we've discussed many times over the decades. It approximates the actual VIX calculation using five different mathematical models. Since the inception of the actual VIX, this Proxy has a correlation of +0.89 out of a scale from -1.0 to +1.0, so it's a decent substitution.
As of Friday, the Proxy VIX was at 32%. If we go back to 1962 and look at every date when the S&P 500 fell to a one-year low, and that was the lowest price for at least the next three months, the median Proxy VIX was 30%. So, according to this version, fear is higher than it has been at most medium-term troughs.
When investors panic, they sell everything at once. They don't discriminate between the pros and cons of various stocks; they just sell everything en masse. So, the correlation in daily price movements between individual stocks and their benchmark index tend to rise rapidly toward +1.0.
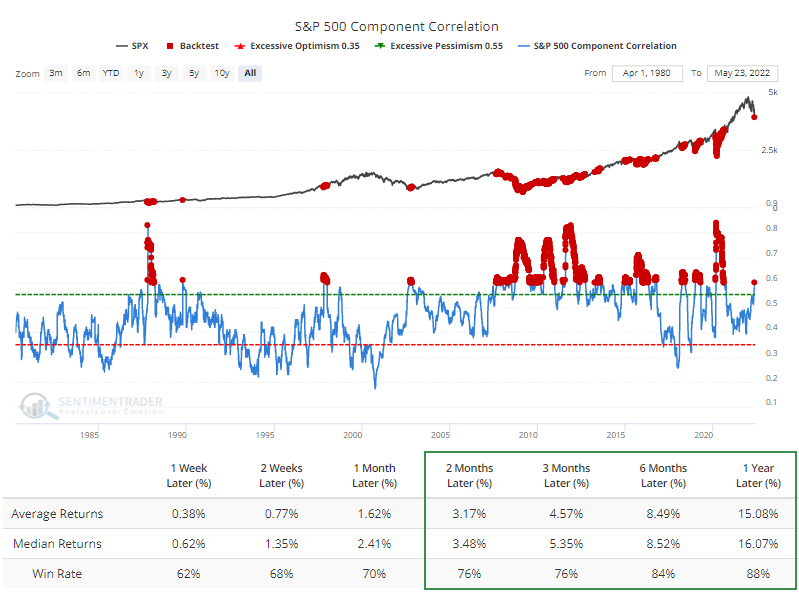
Within the S&P 500, correlations have risen quickly and are currently at an average of +0.60. That's still below the all-out panic level of +0.75, but the Backtest Engine shows above-average returns when it has been this high.
Both of these measures can get significantly higher, and that would, indeed, signal that investors have become genuinely fearful. But are they high enough for at least a medium-term relief rally? Objectively, yes.
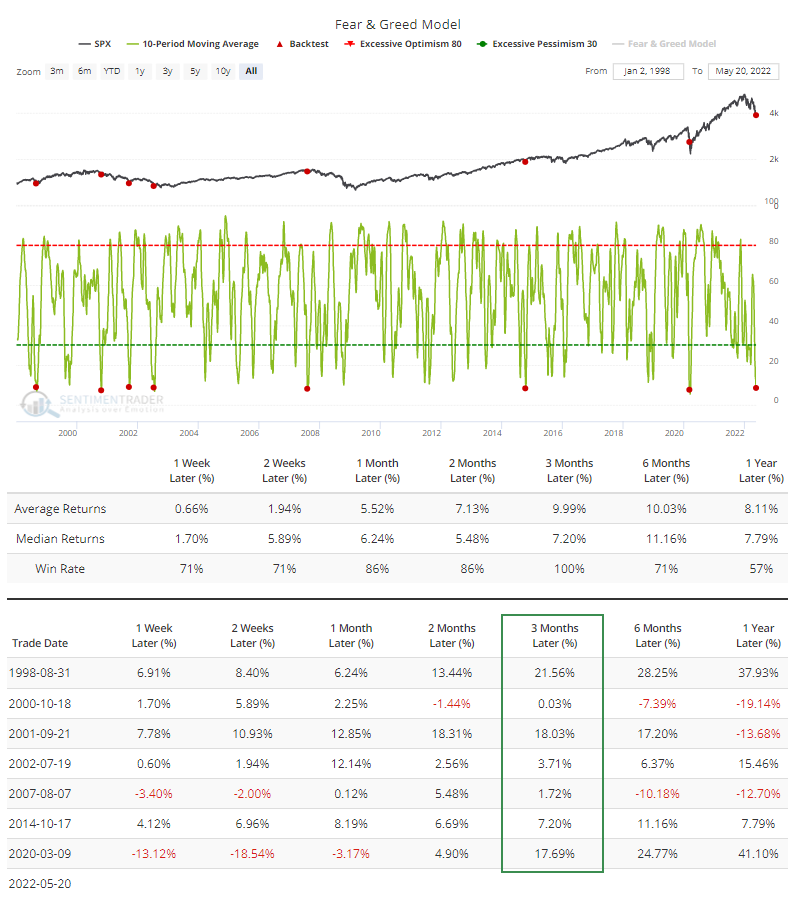
If we look at the model that literally has "fear" in the name, Fear & Greed, then the 10-day moving average dropped below 9% last week. Each of the other times it has done this - even during bear markets - the S&P 500 rebounded over the next few months according to the Backtest Engine.
Small traders are betting heavily that the selling is not done yet
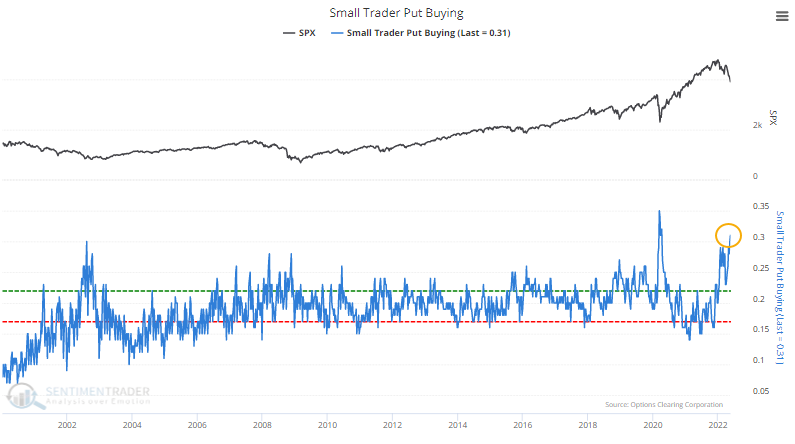
Checking in on the smallest options traders, they continued to increase their leveraged bets against stocks, spending 31% of their volume on buying put options to open. Since the year 2000, only a few weeks in March and April 2020 exceeded this.
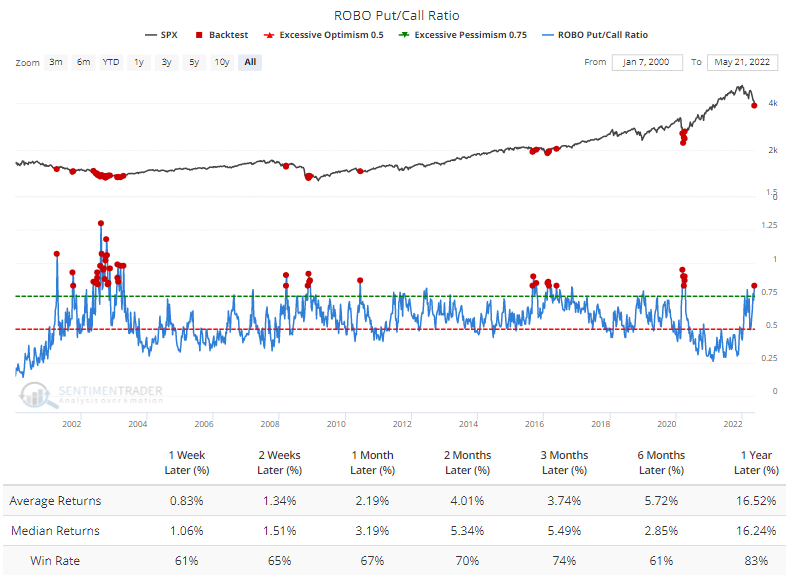
They're still buying quite a few speculative call options relative to their long-term history. Still, the ROBO Put/Call Ratio, a ratio between the two data series, has risen to one of the higher levels in 22 years. Outside of the June/July 2002 meltdown, it coincided with at least medium-term rallies.
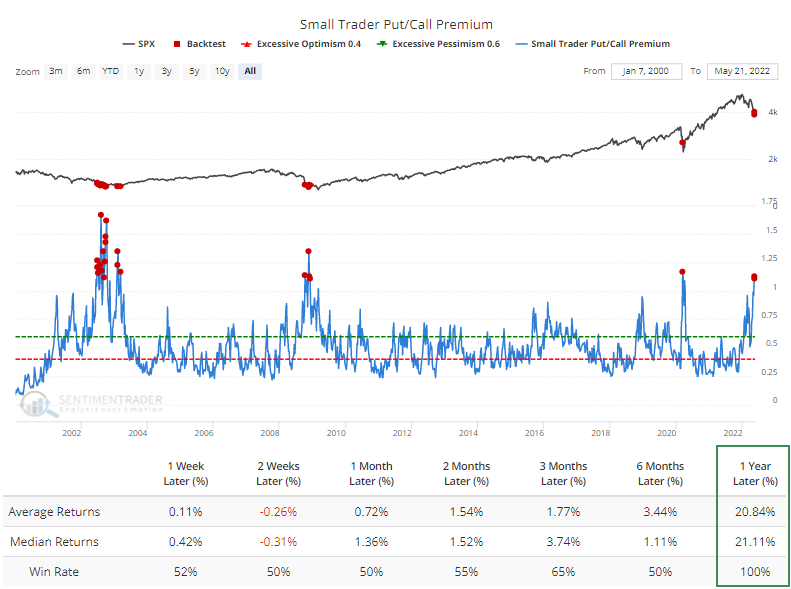
When these traders were so fearful that they spent at least 11% more on premiums protecting their backsides than on betting on a rally, the Backtest Engine showed a perfect record of gains over the next year. It took some pain to get there, but we have to acknowledge that the only other times this happened were during the bottoming phases of the three substantial bear markets of the past 22 years.
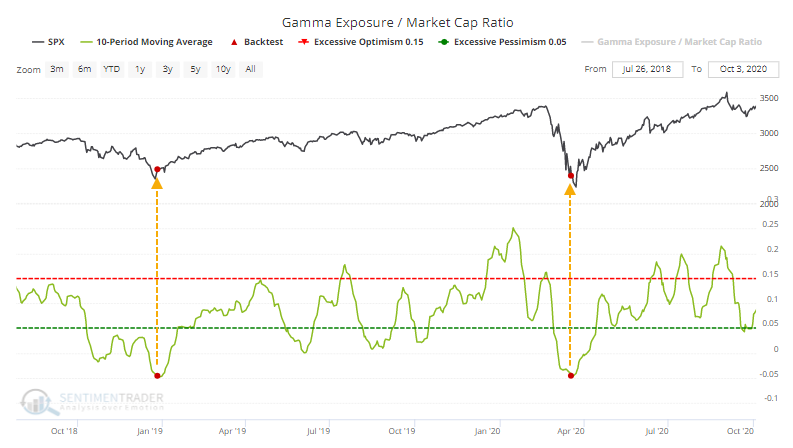
Because of all the put buying, dealers taking the other side have accumulated some of the most skewed Gamma Exposure relative to the market capitalization of stocks. The only other times it averaged about -5% of market cap were at the bottoms in December 2018 and March 2020.
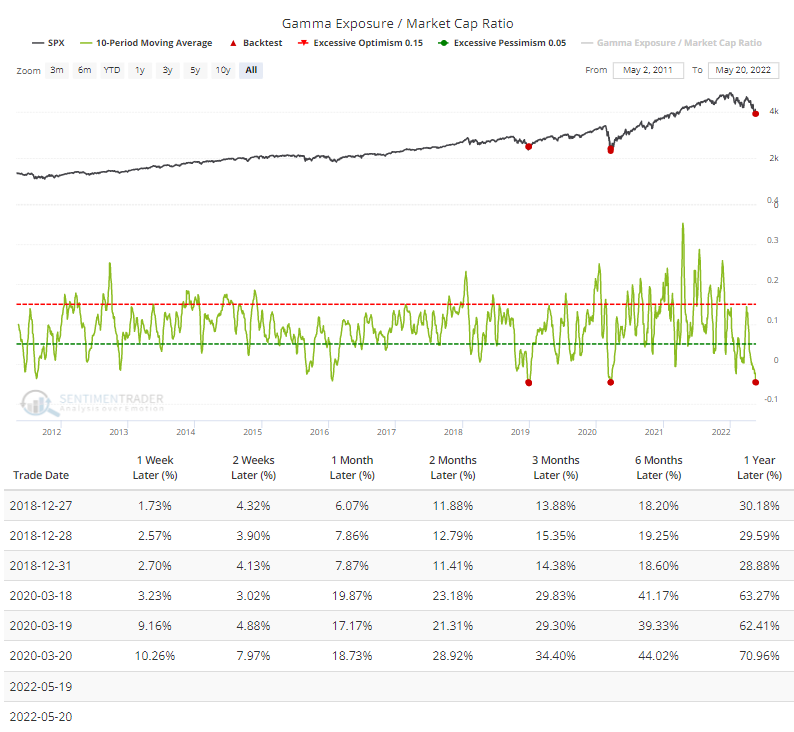
We can clearly see the implications if we zoom in on the only two precedents.
What the research tells us...
In a purely objective sense, we have not yet seen investors truly capitulate. Several reliable indicators have not thoroughly washed out as they have at several important market bottoms. There is never a turning point when every indicator agrees; I distinctly recall arguments that we couldn't be at bottoms in March 2003 and March 2009 because put/call ratios were well off their highs. And yet.
Sure, it's nice when everything agrees and conclusions are tied up with a nice, pretty bow. Those opportunities are rare, and even then, they can fail. From what we have objectively measured so far, sentiment is horrid enough, fear is palpable enough, and selling has been overwhelming enough that even if we're in the midst of a long, drawn-out bear market, pressing short sales here is riskier than buying or holding. At least over a multi-week to multi-month time frame.
Indicators at Extremes
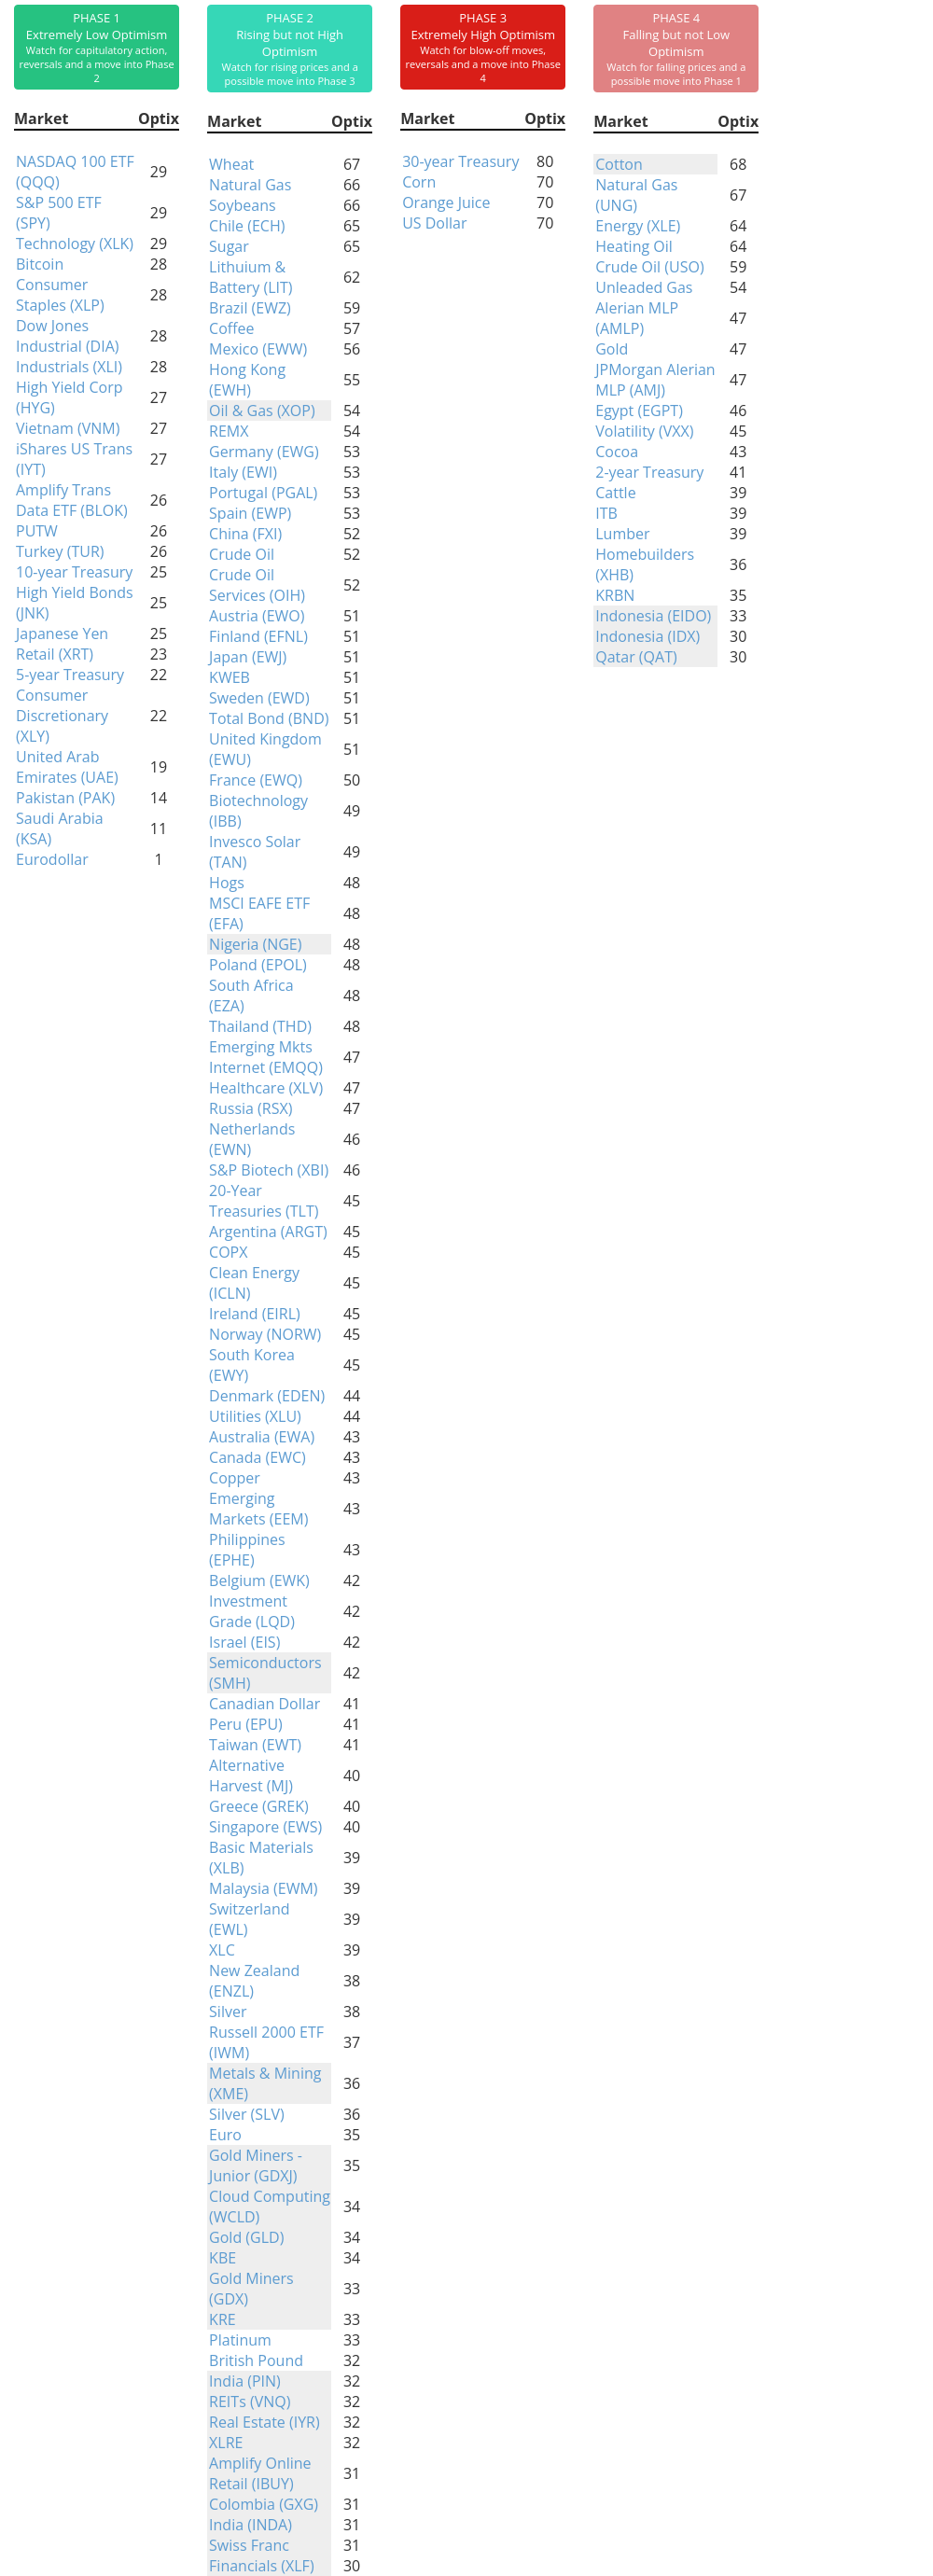
Phase Table
Ranks
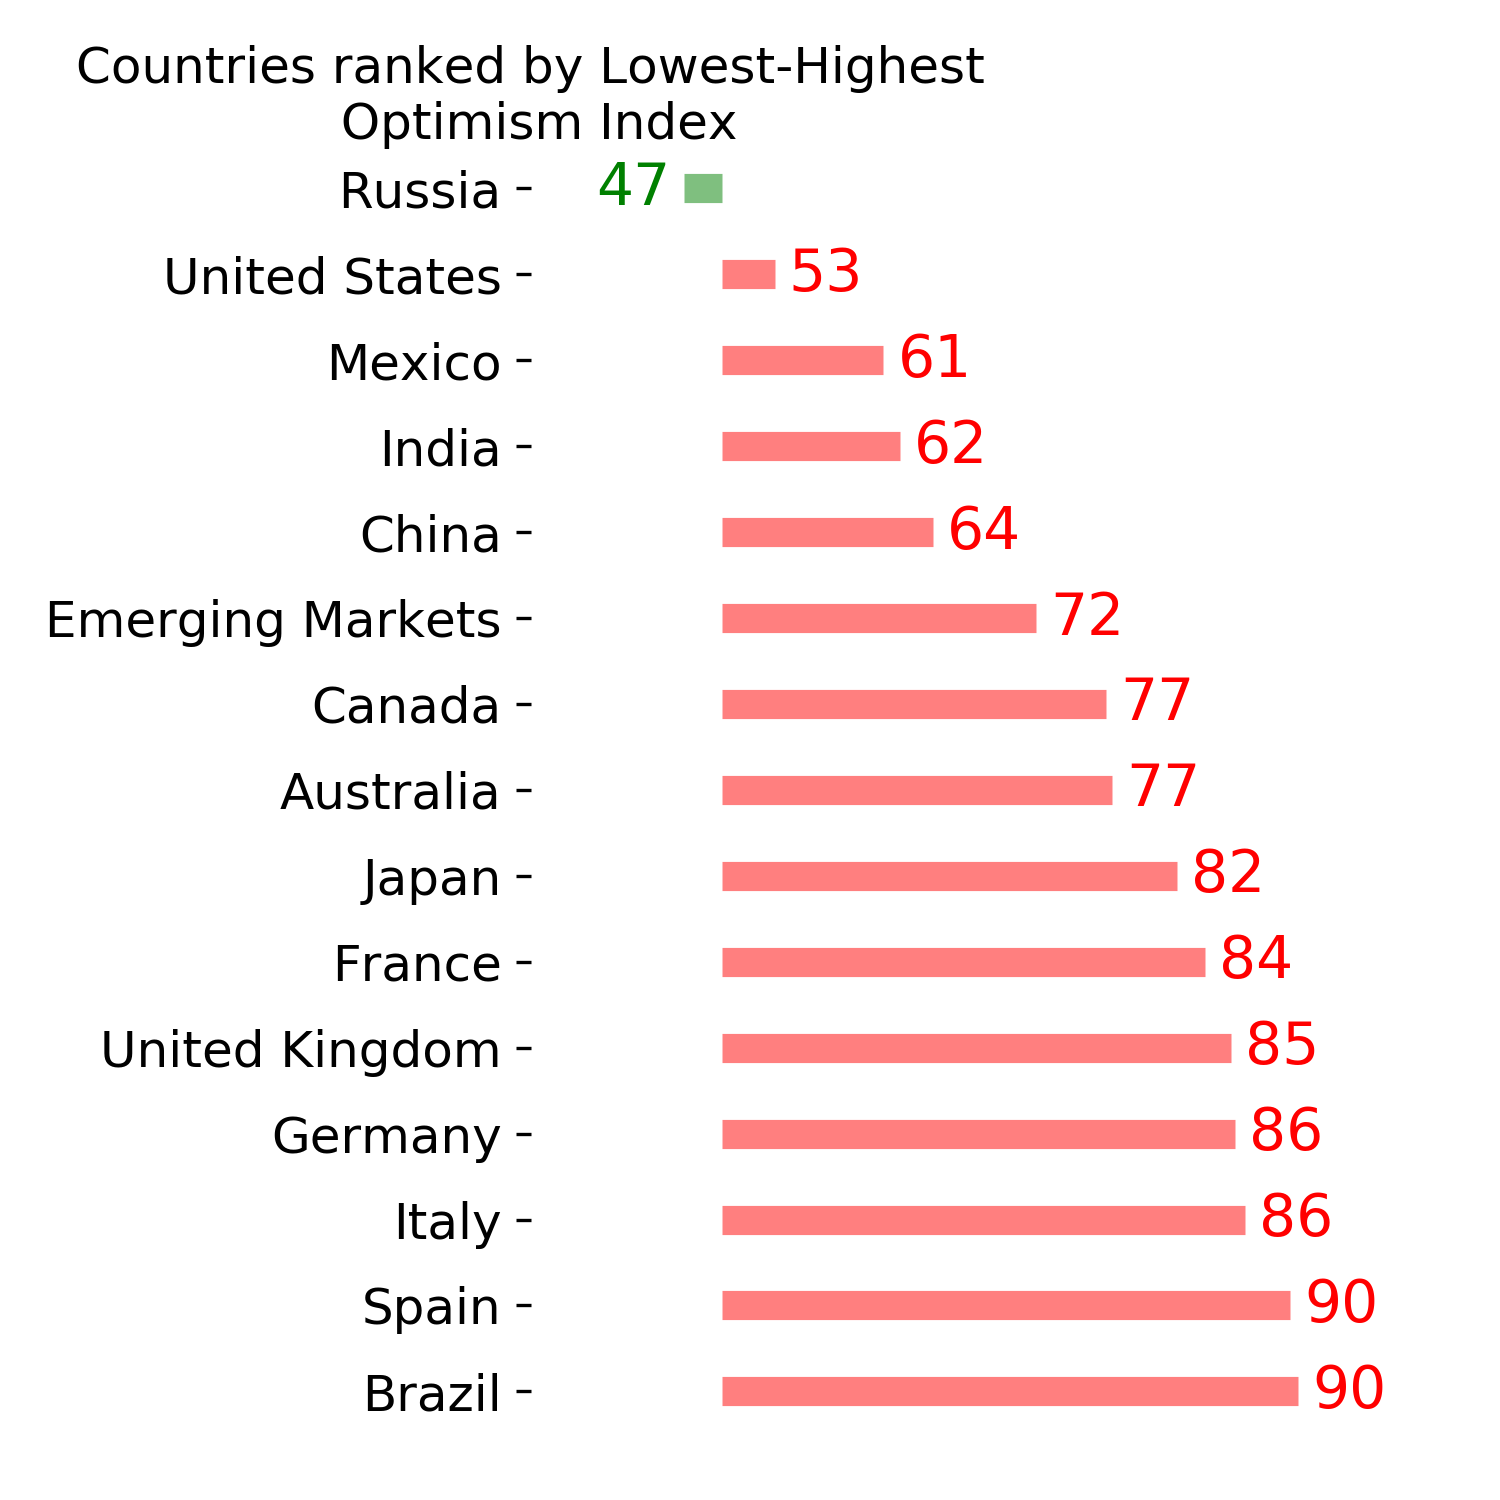
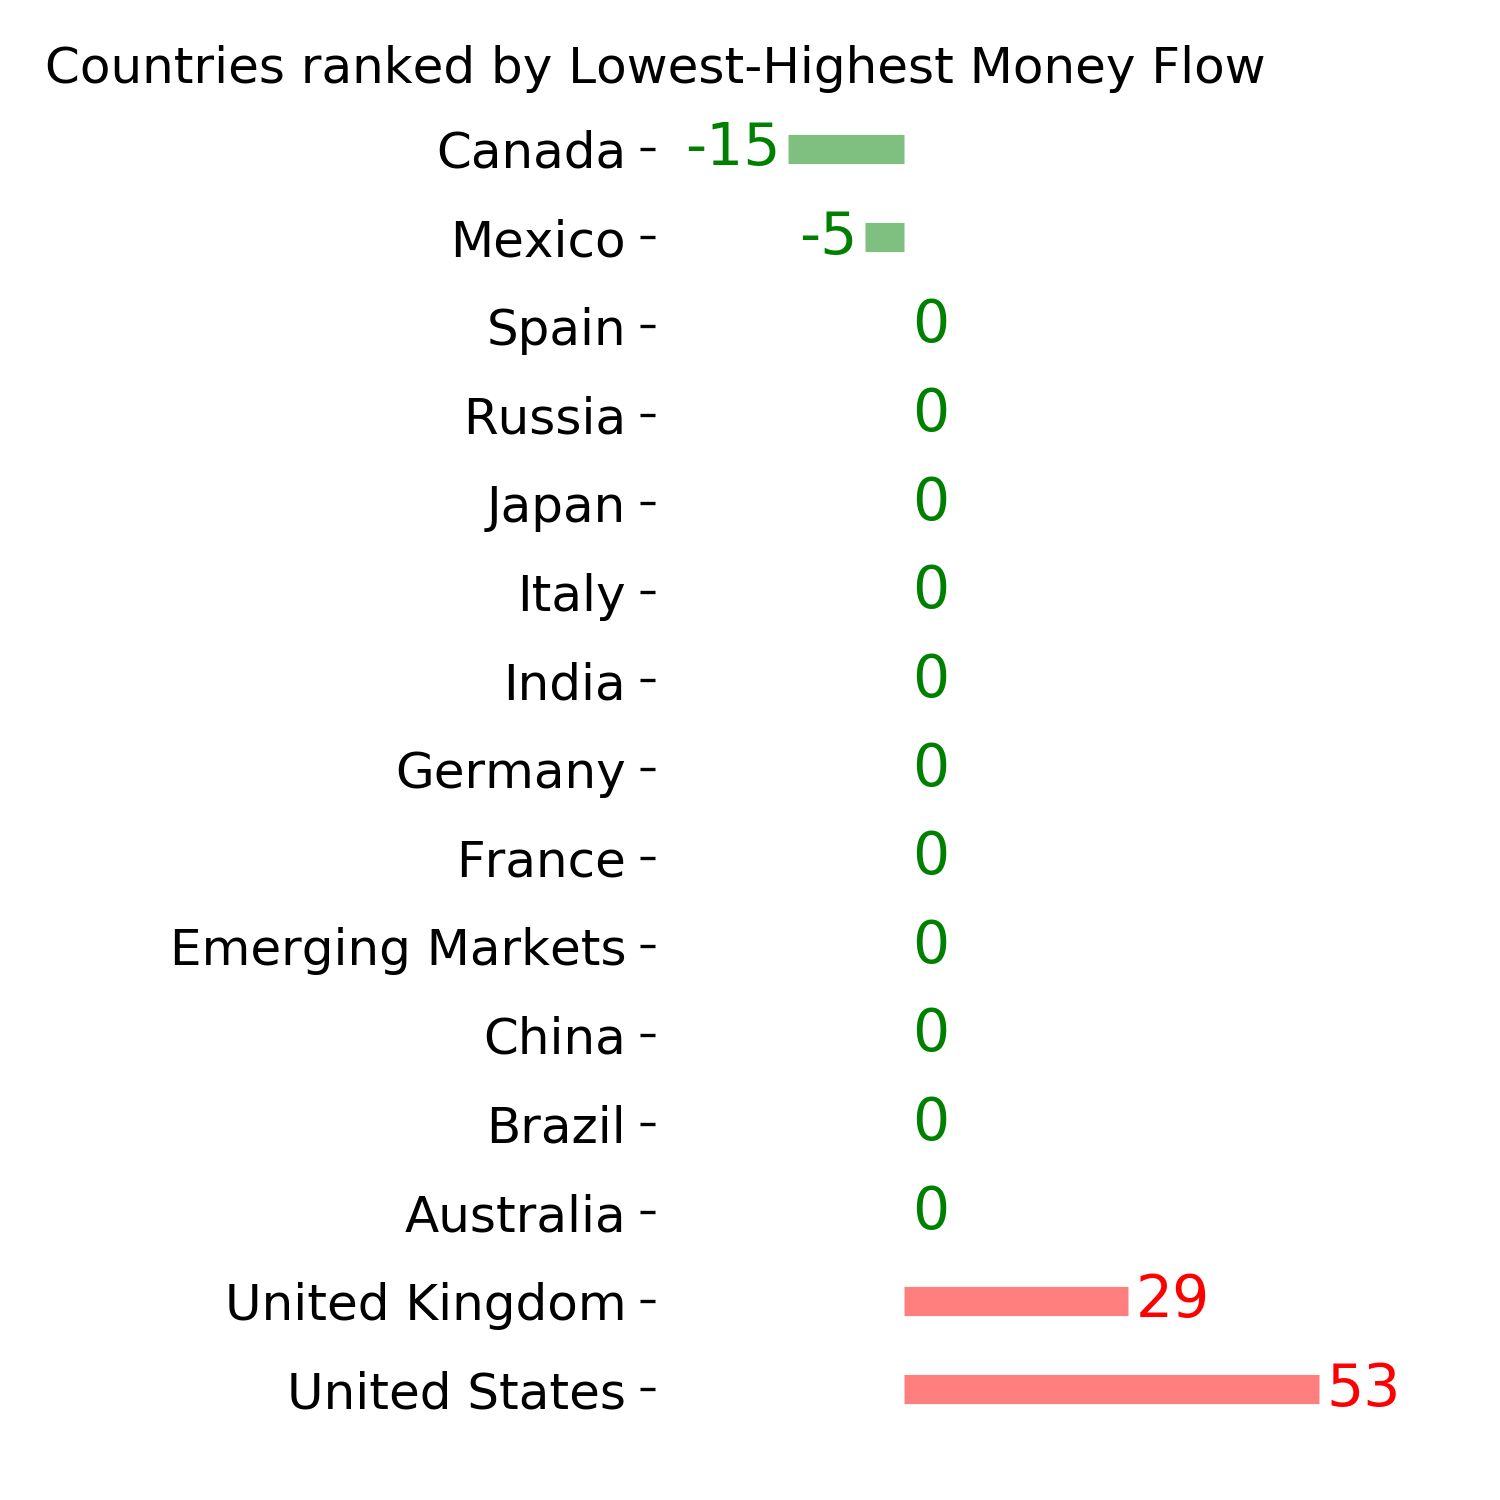
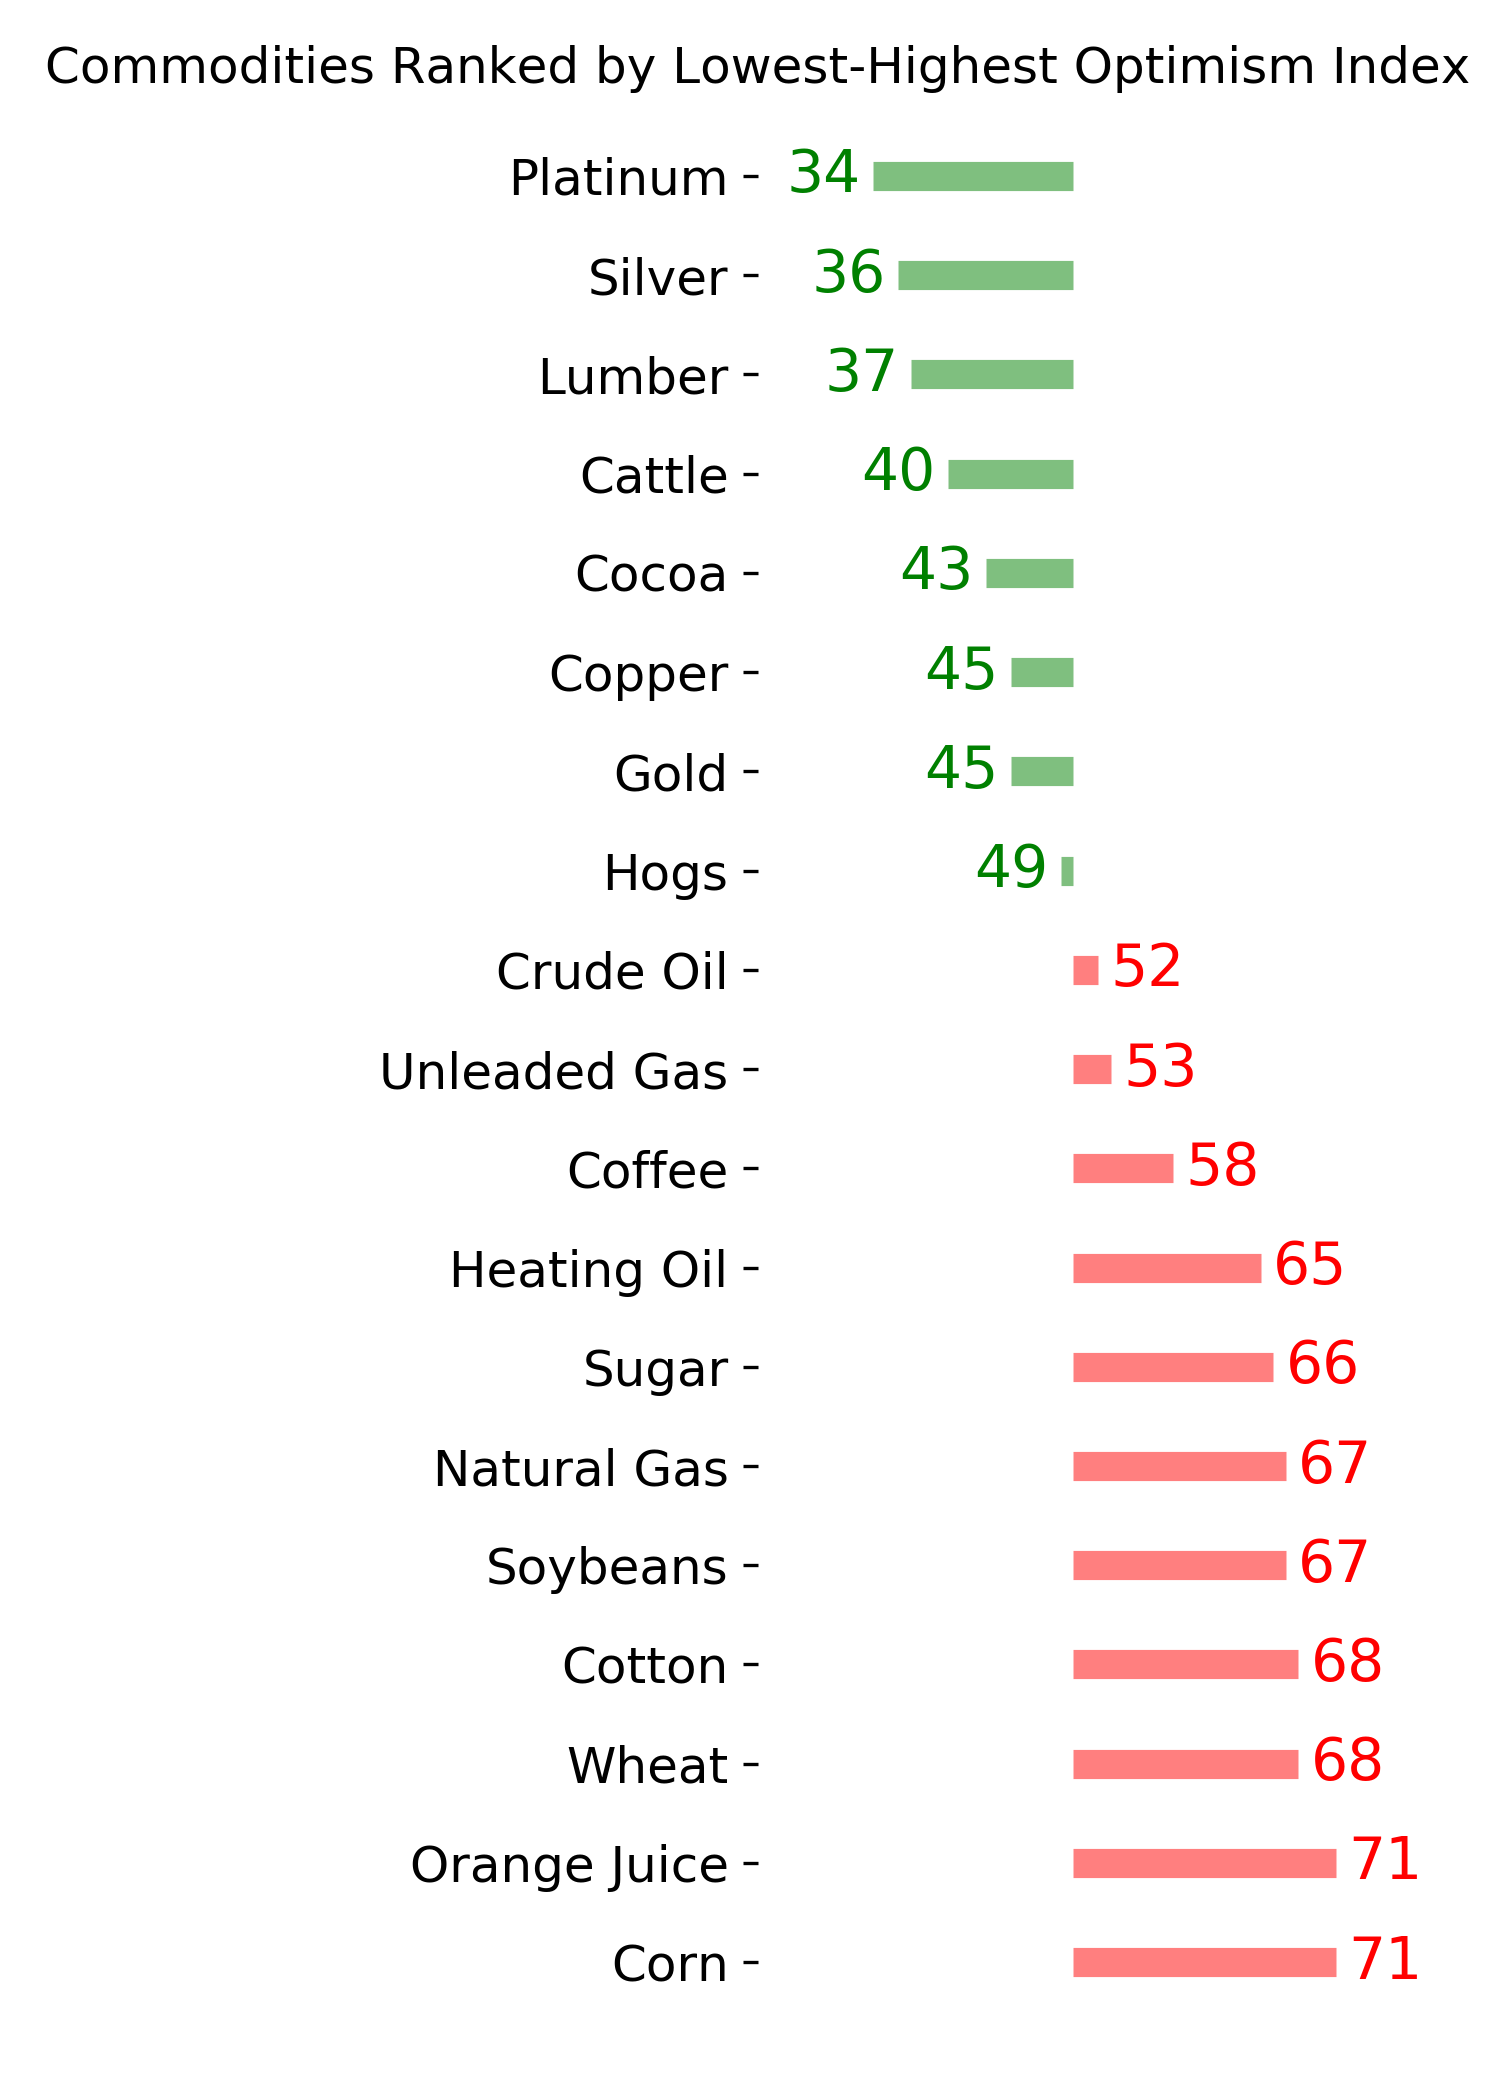
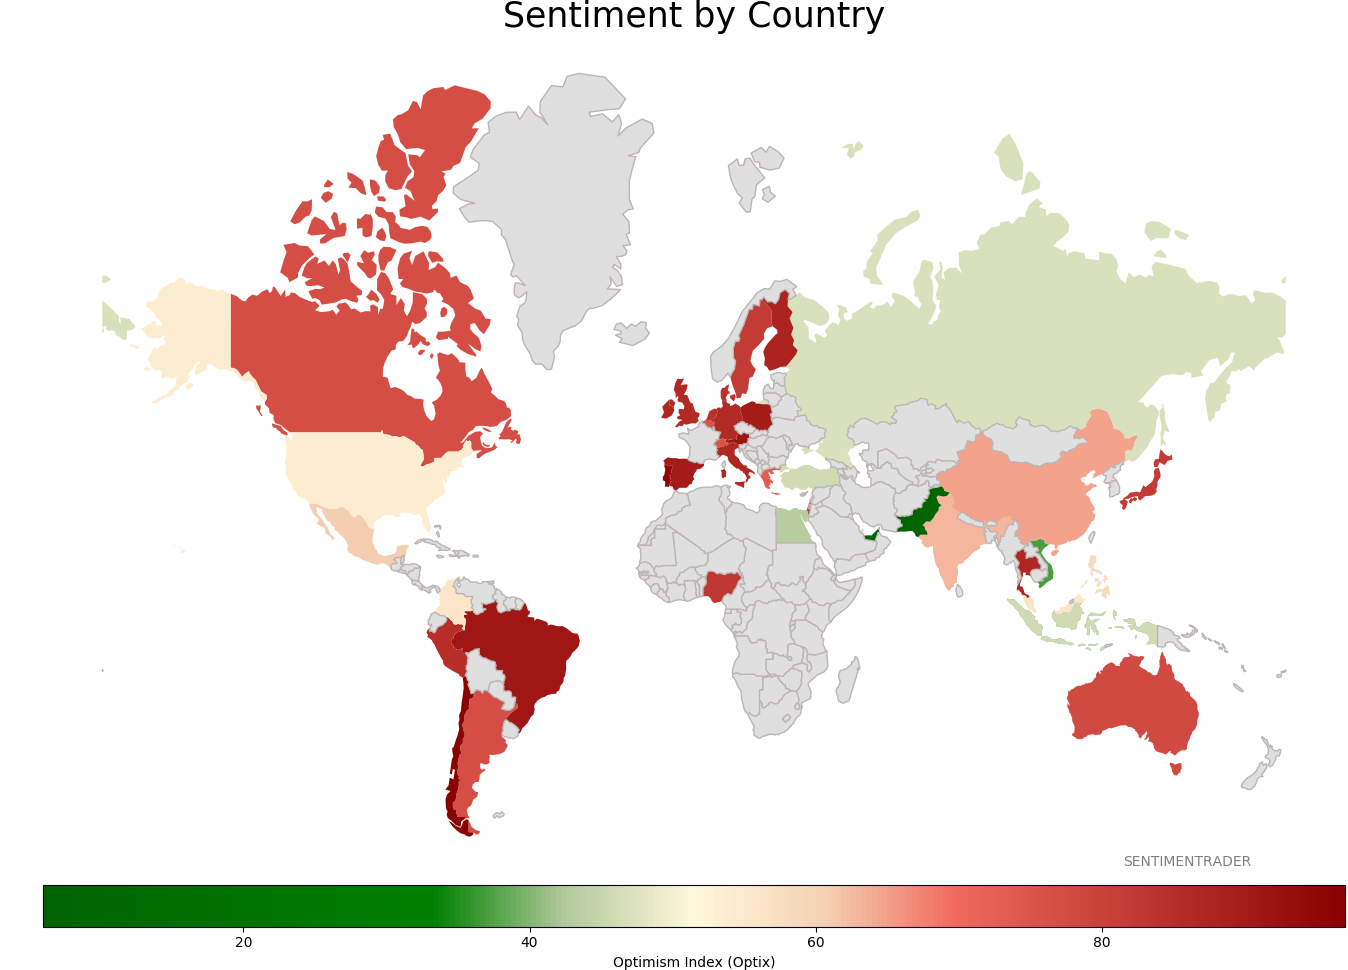
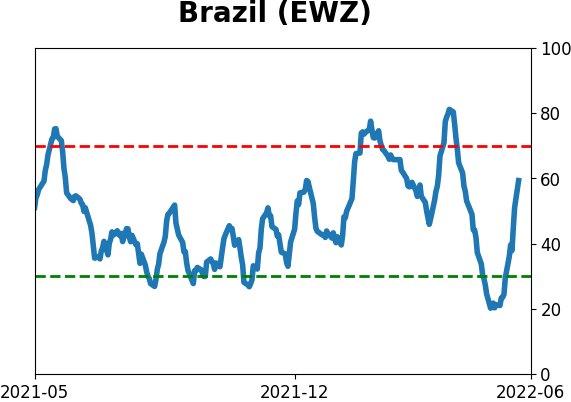
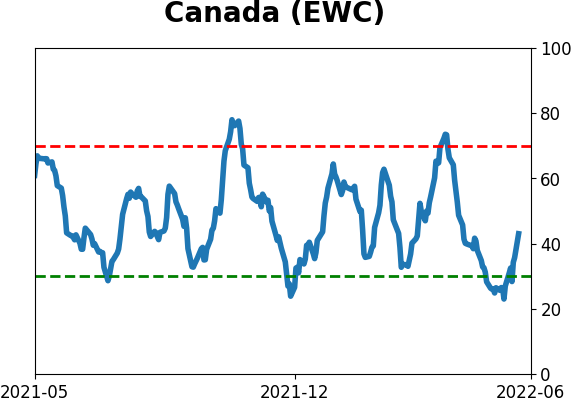
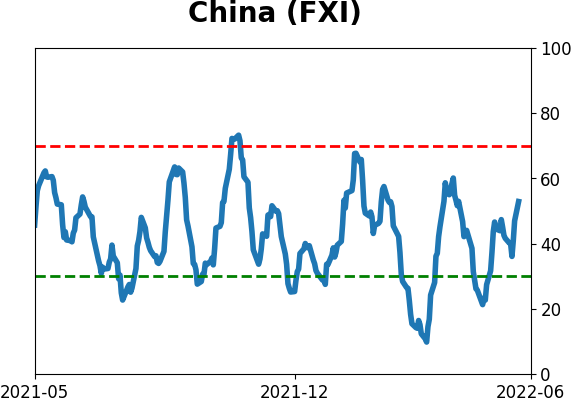
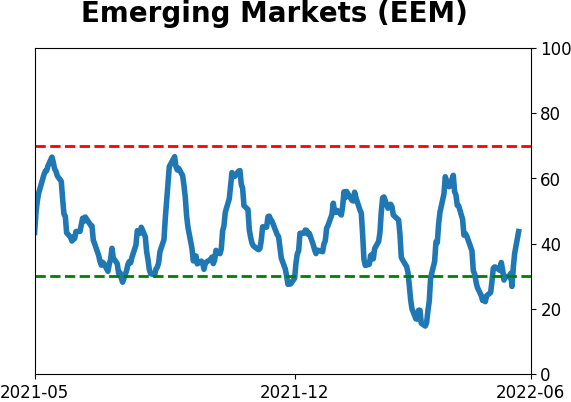
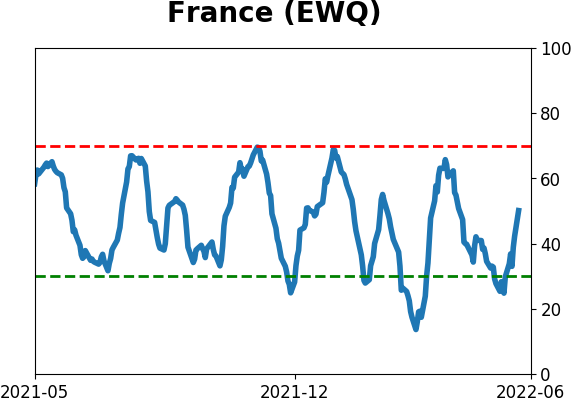
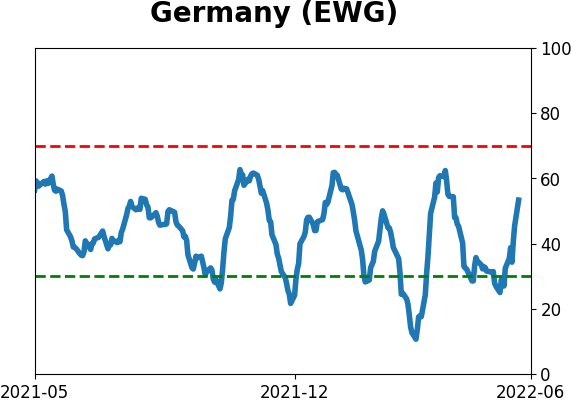
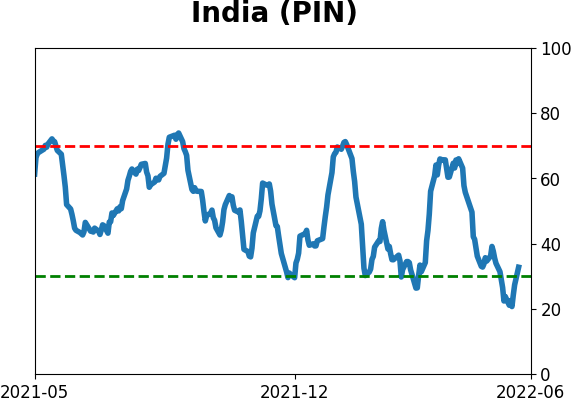
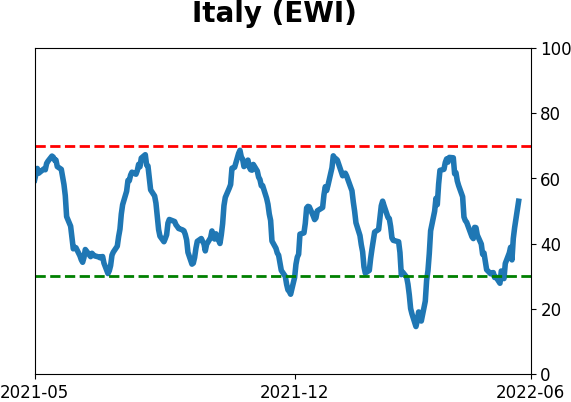
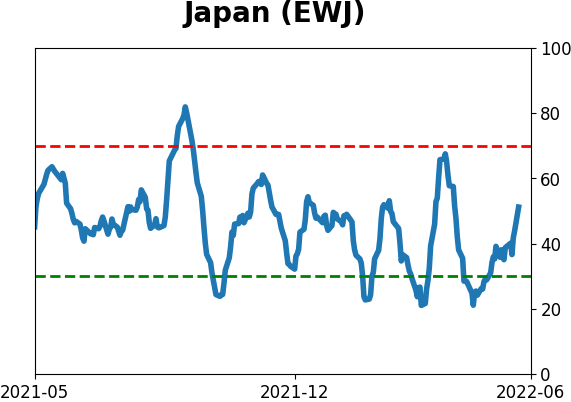
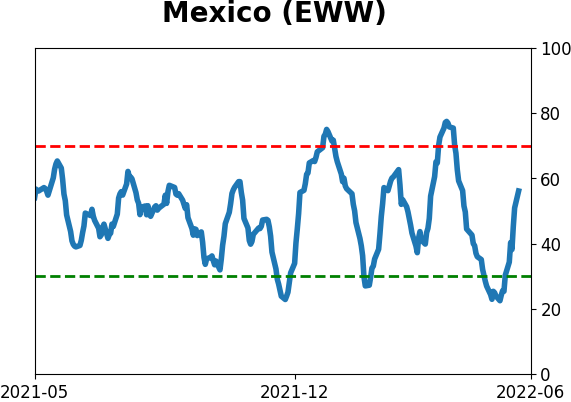
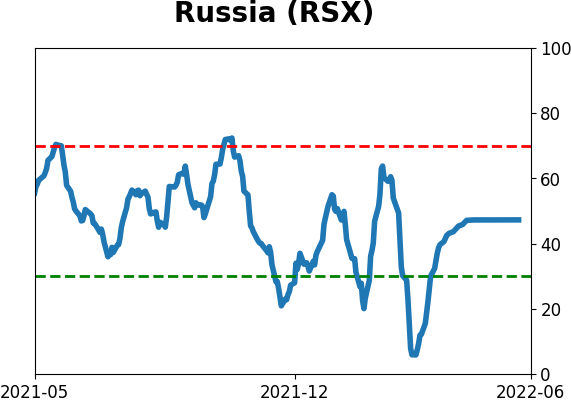
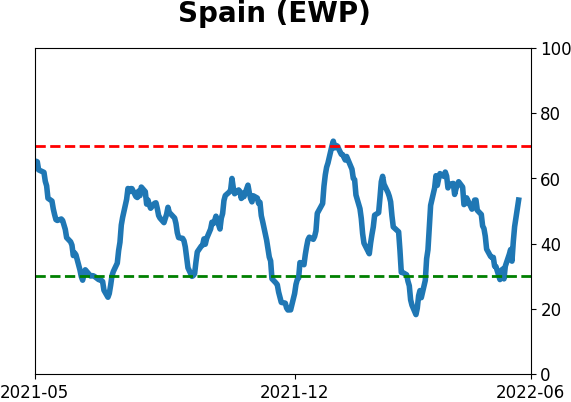
Sentiment Around The World
Optimism Index Thumbnails
|
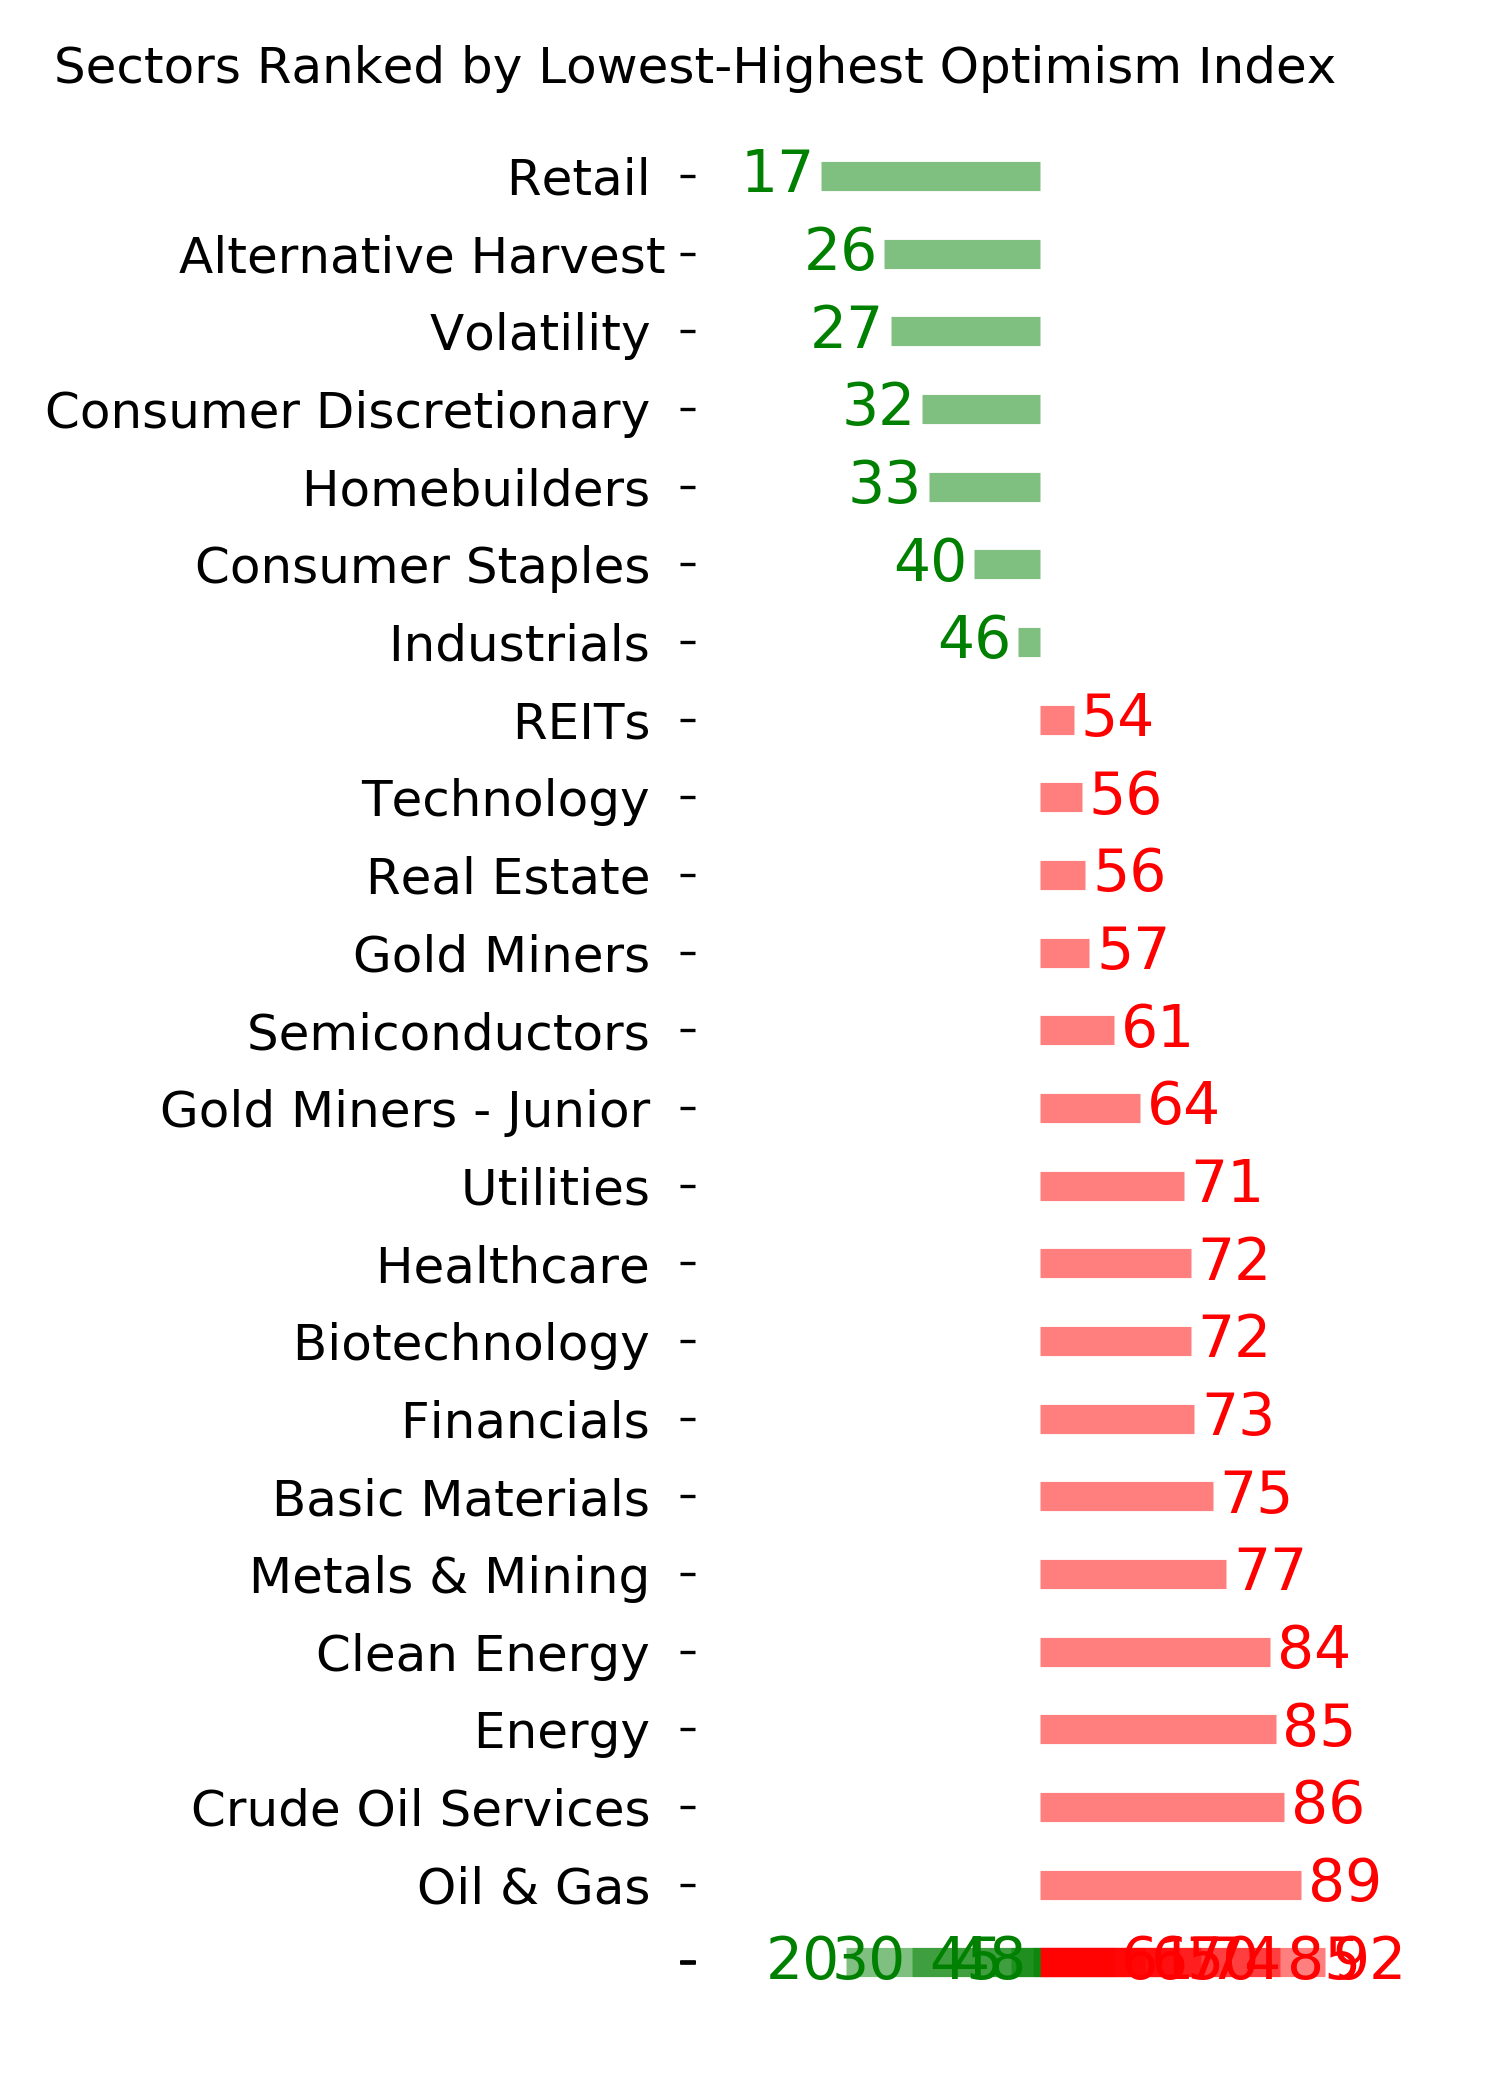
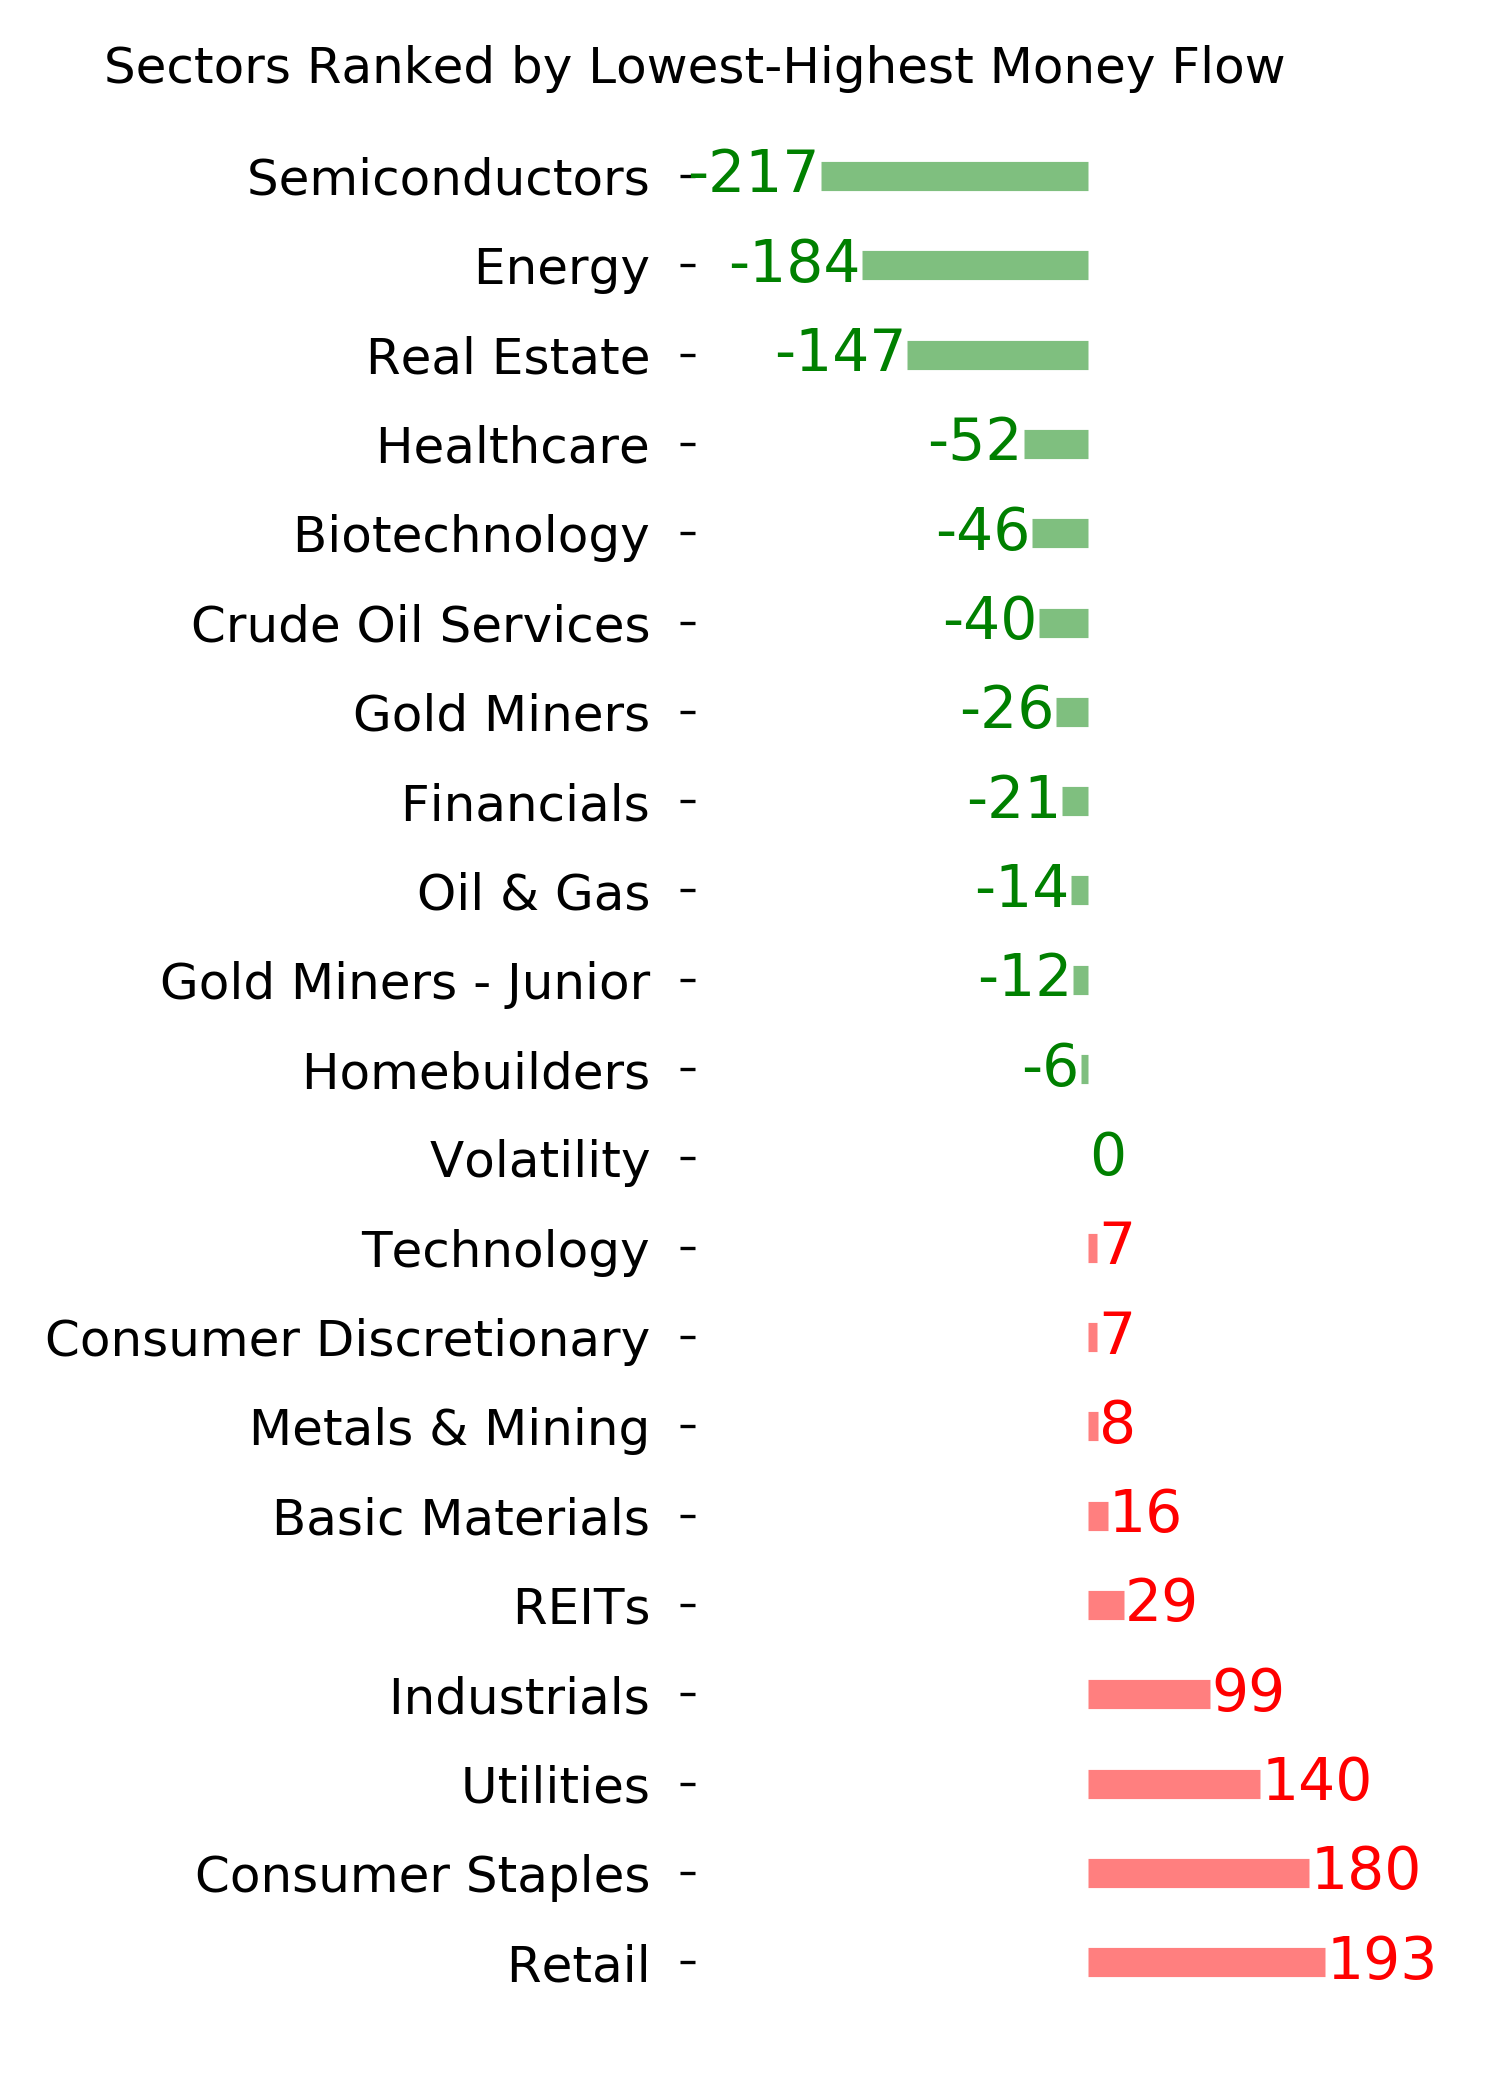
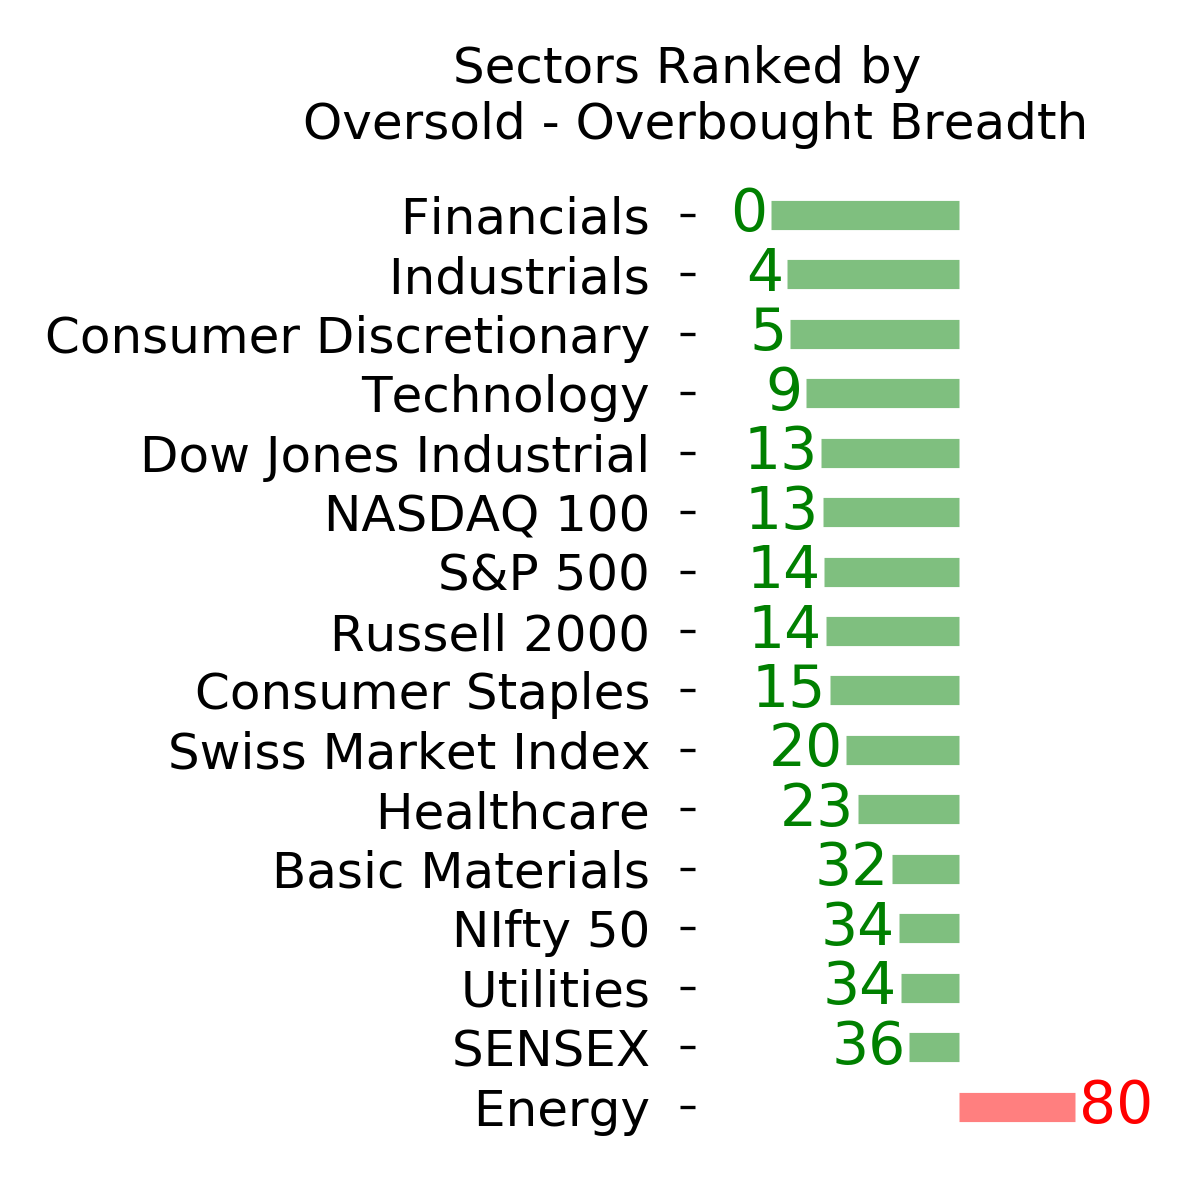
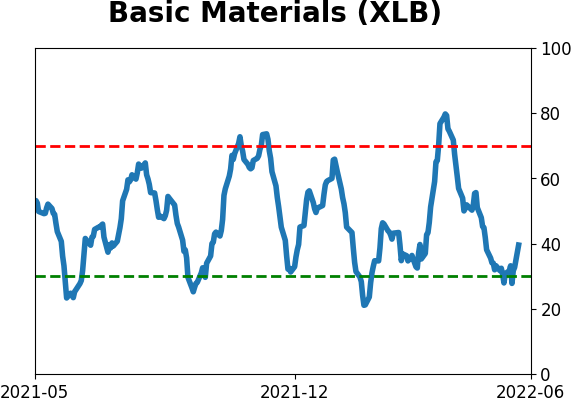
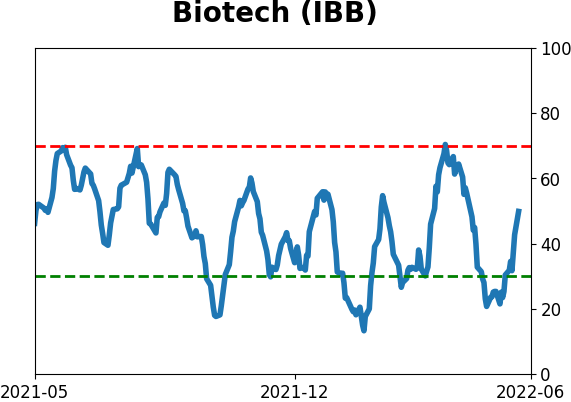
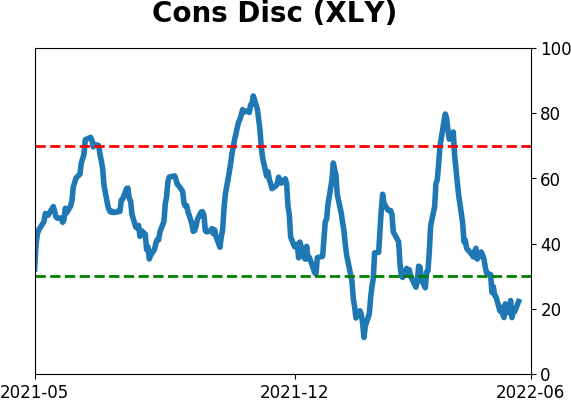
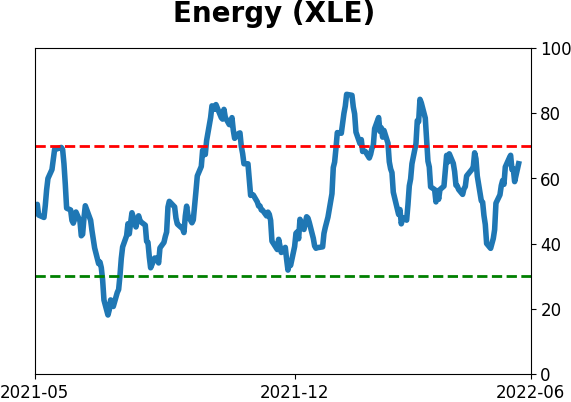
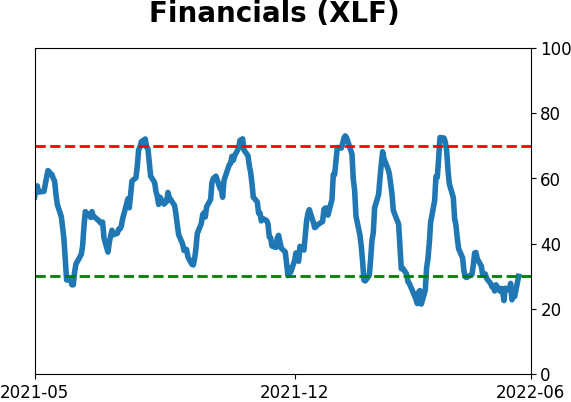
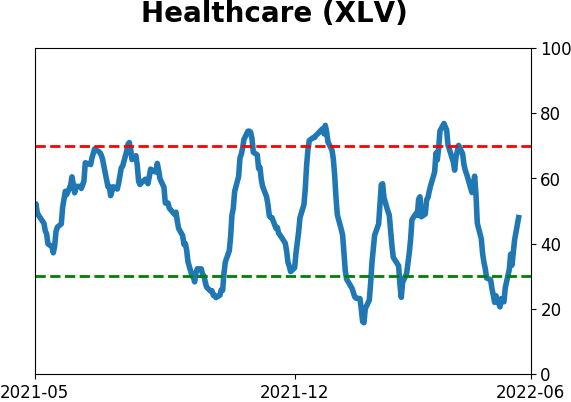
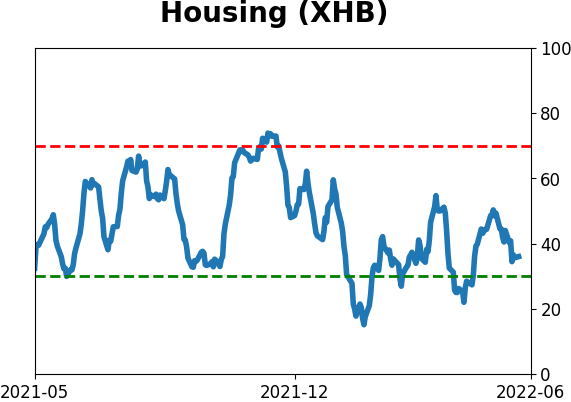
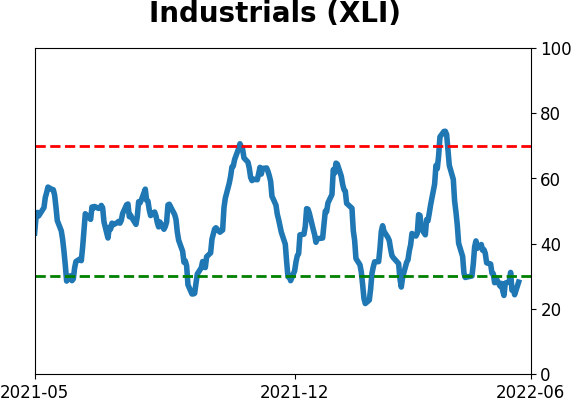
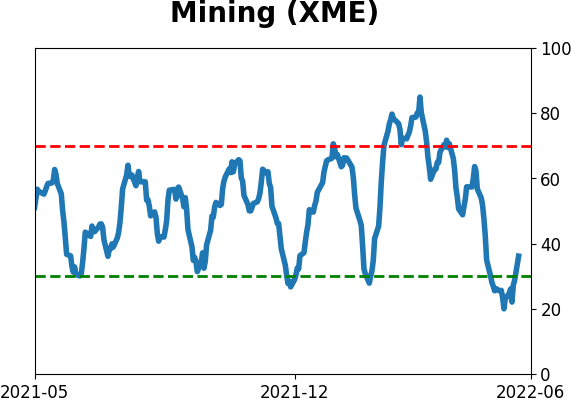
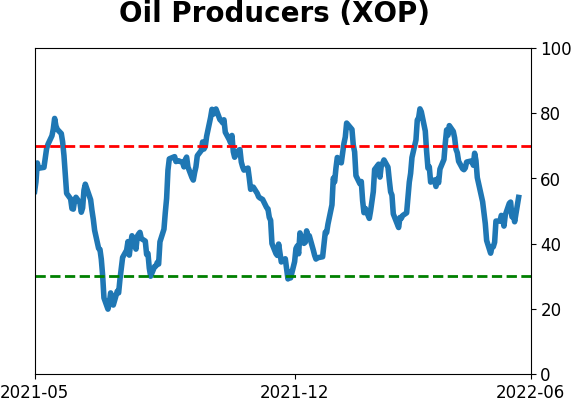
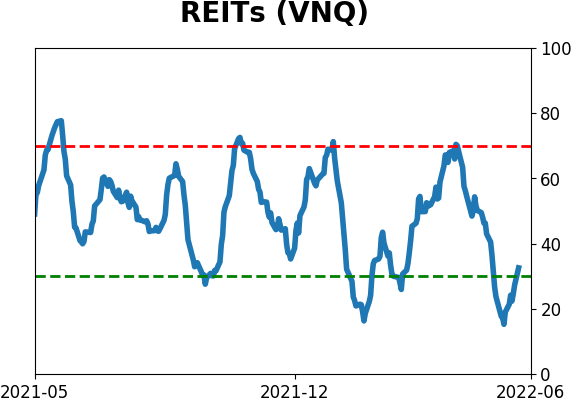
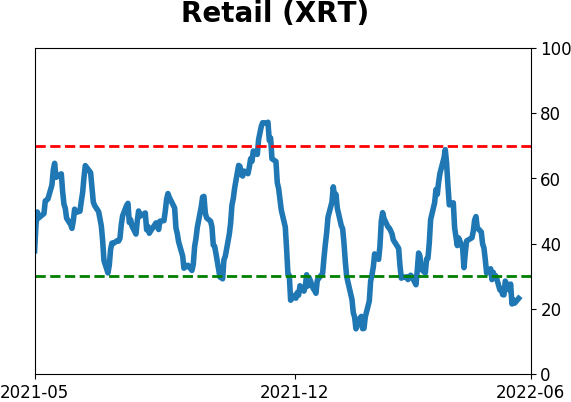
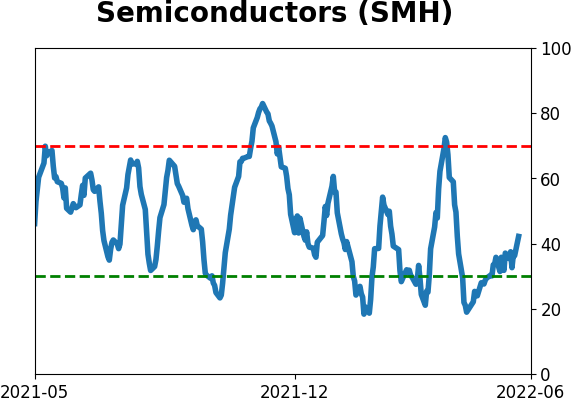
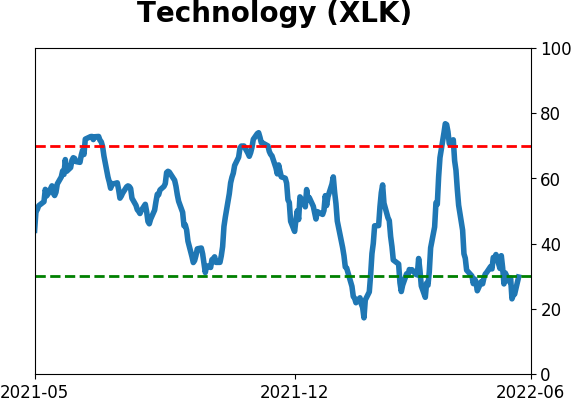
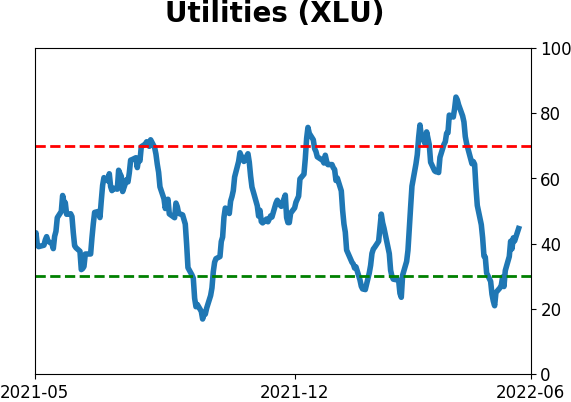
Sector ETF's - 10-Day Moving Average
|
|
|
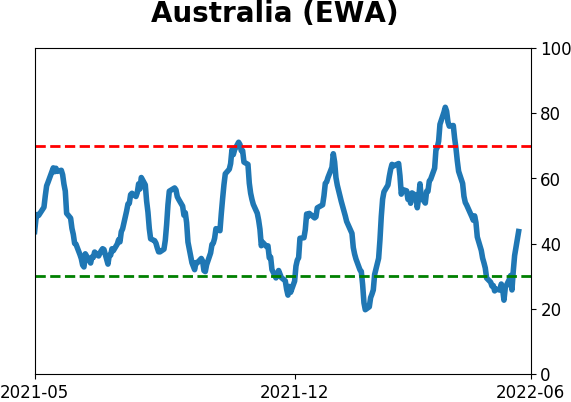
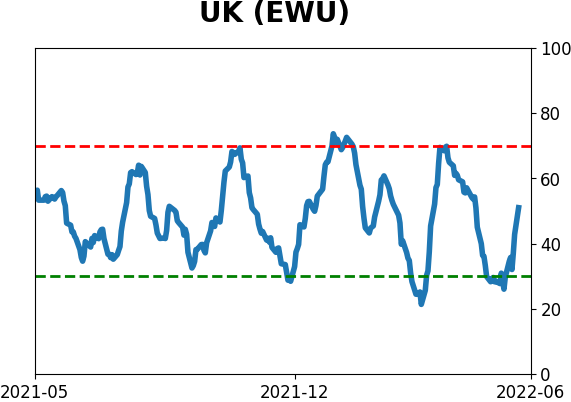
Country ETF's - 10-Day Moving Average
|
|
|
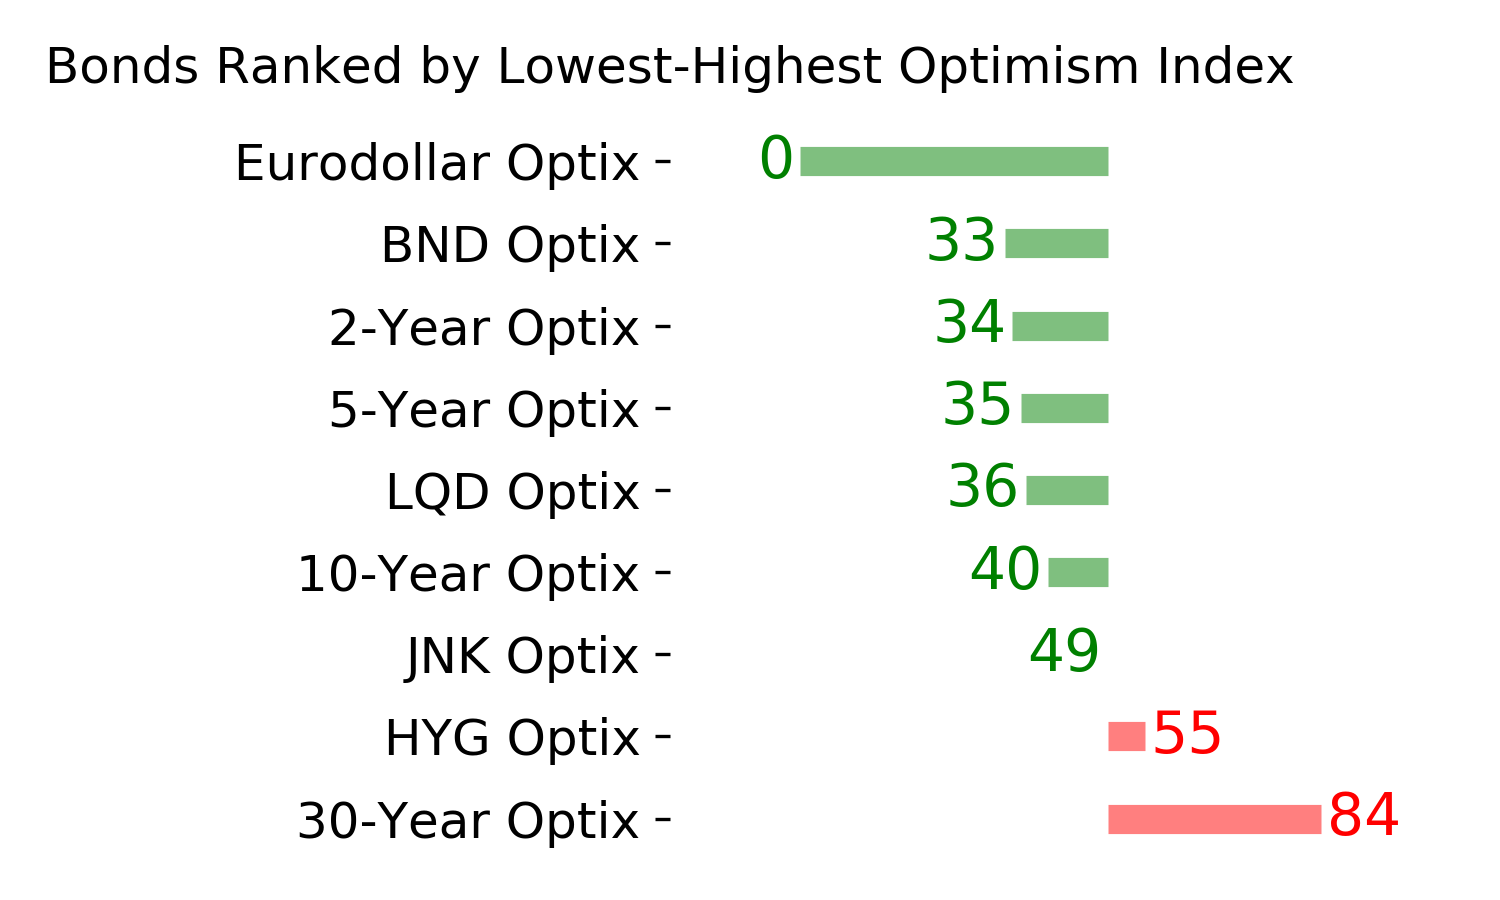
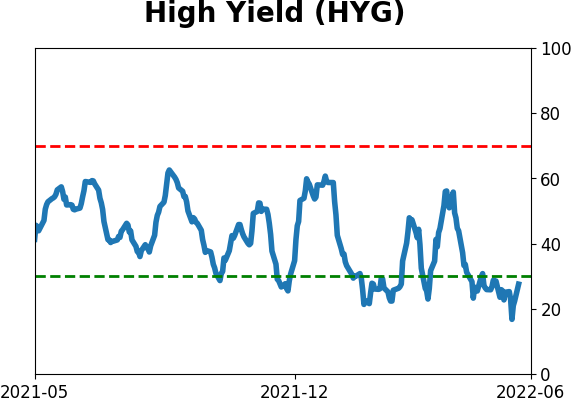
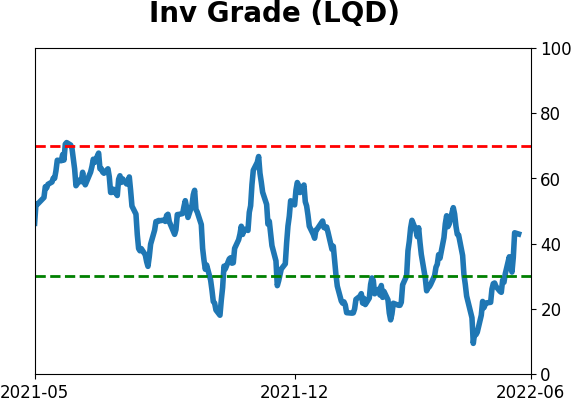
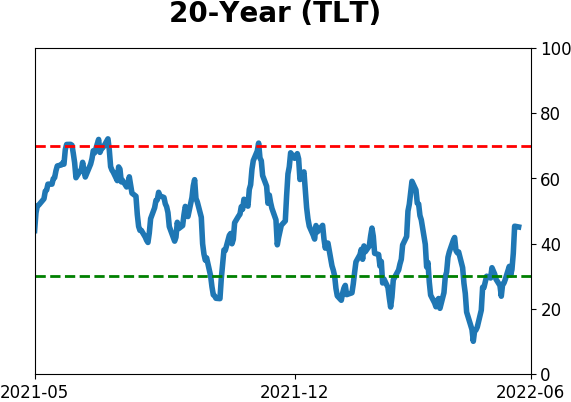
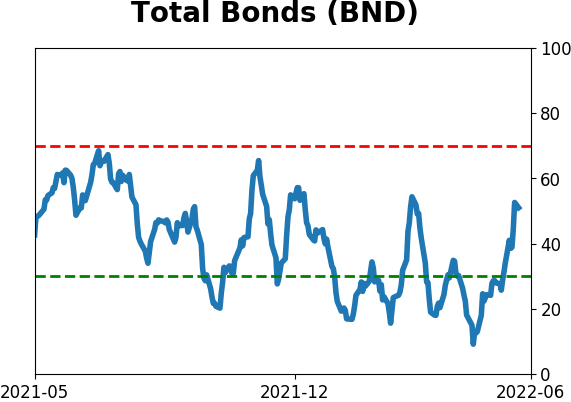
Bond ETF's - 10-Day Moving Average
|
|
|
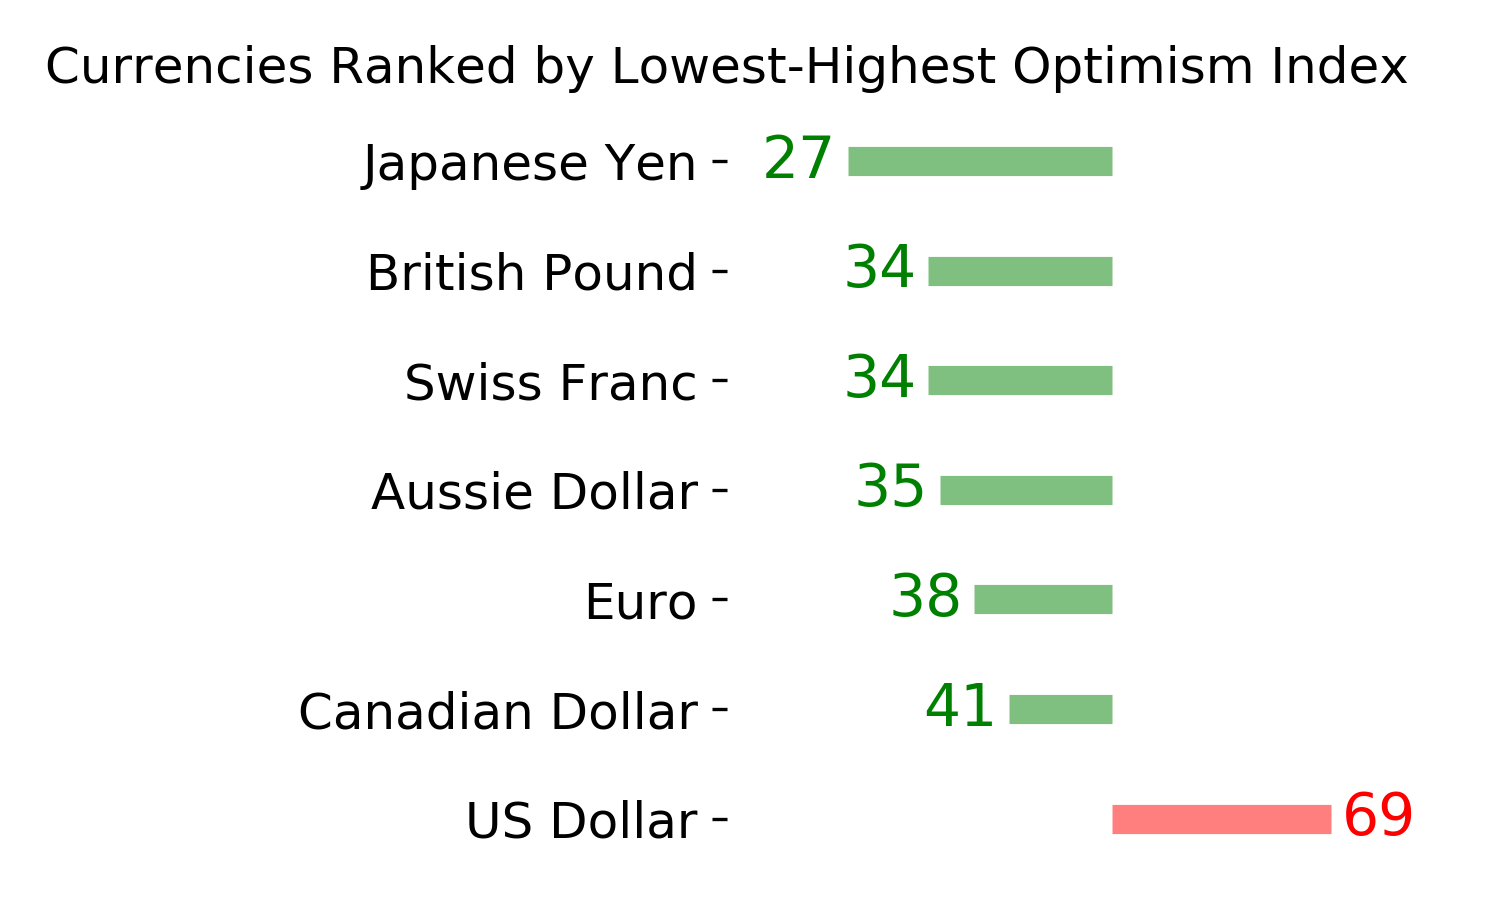
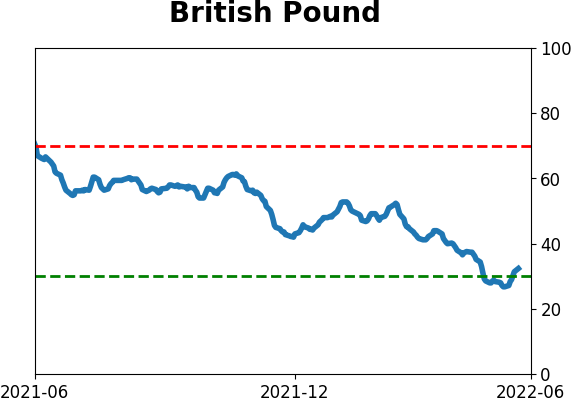
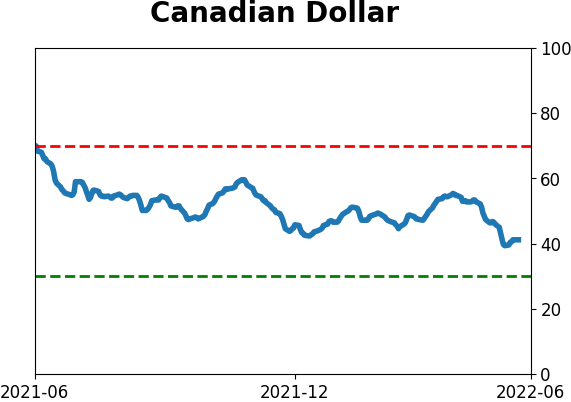
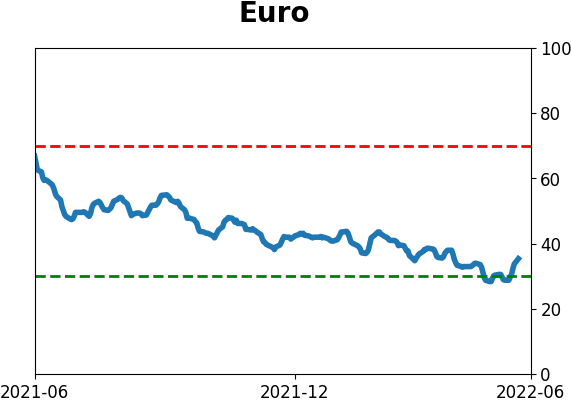
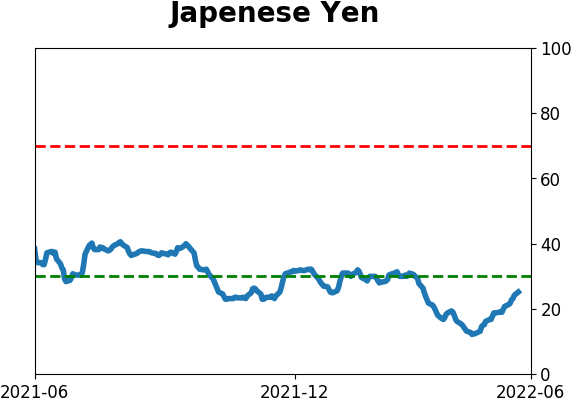
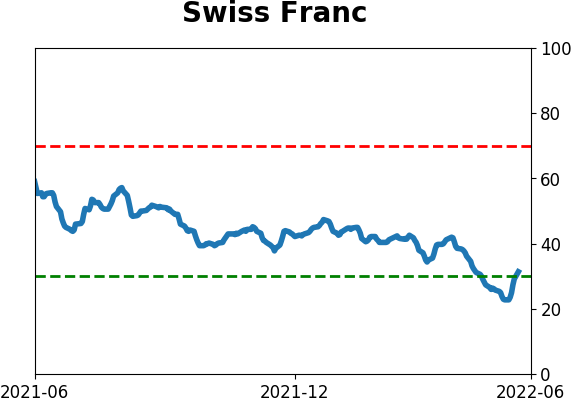
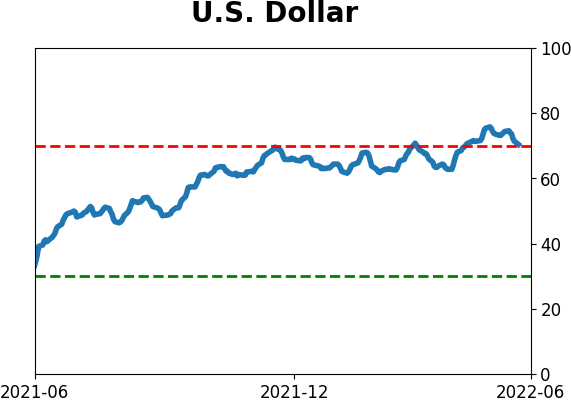
Currency ETF's - 5-Day Moving Average
|
|
|
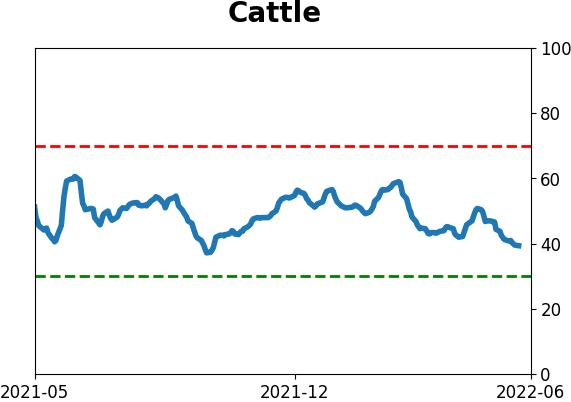
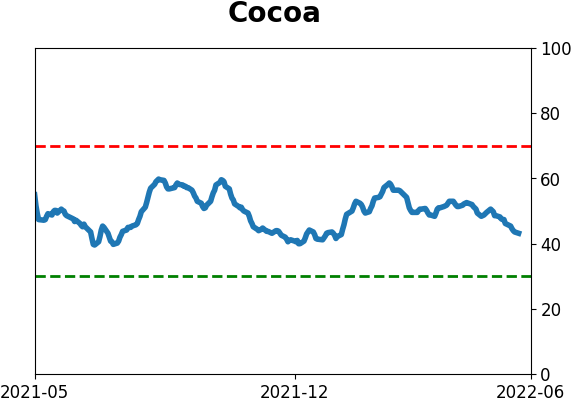
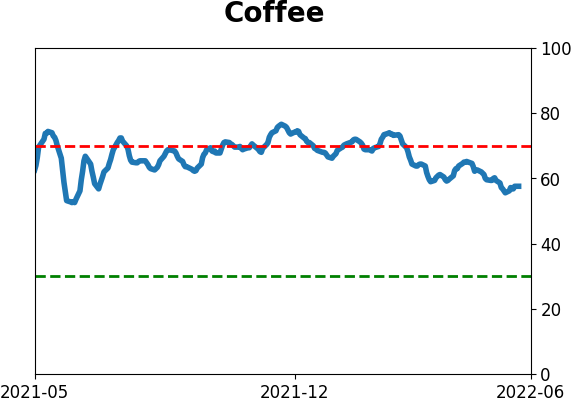
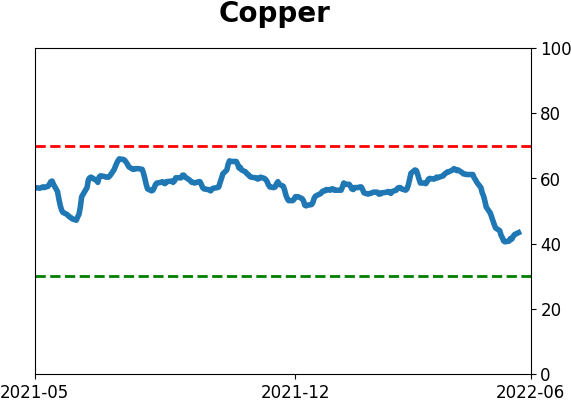
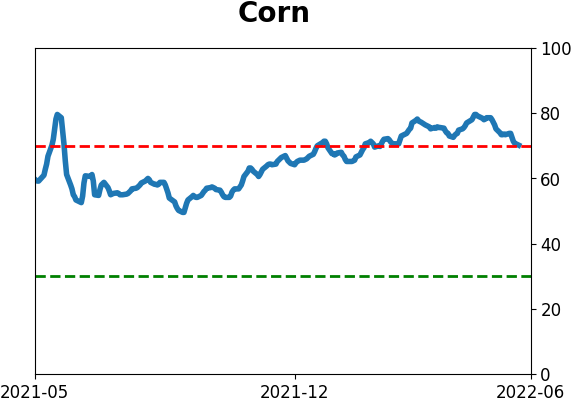
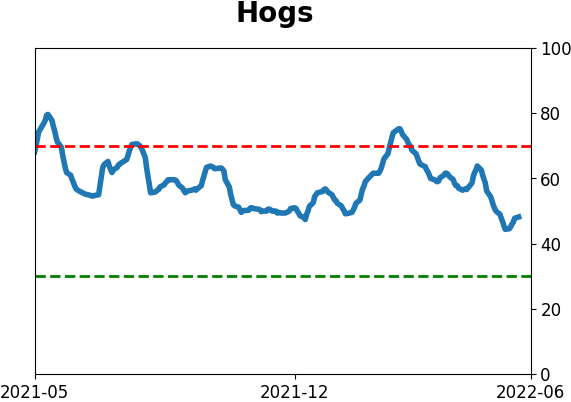
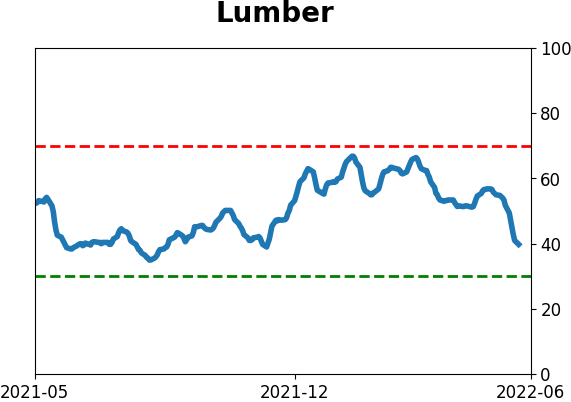
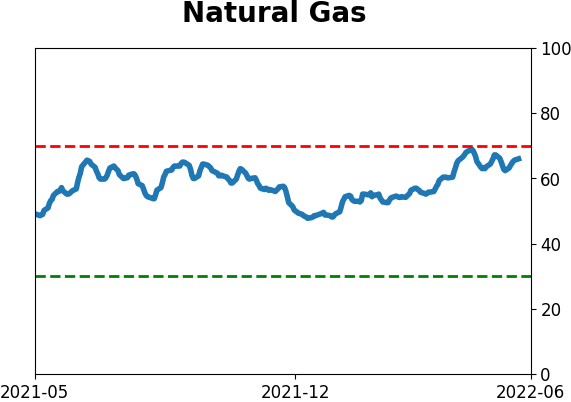
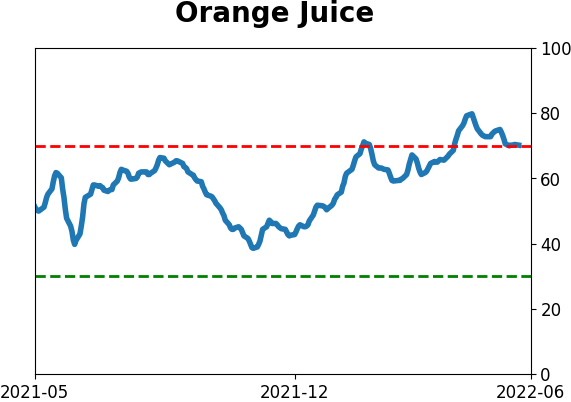
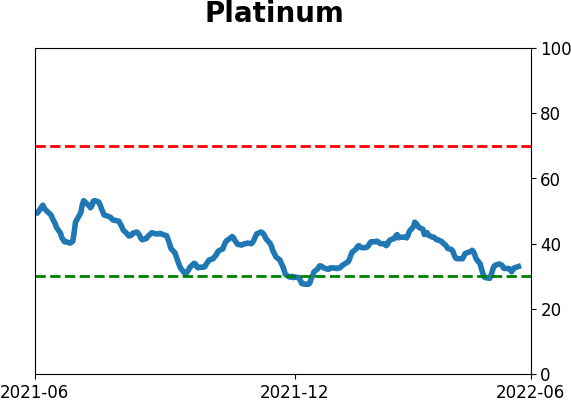
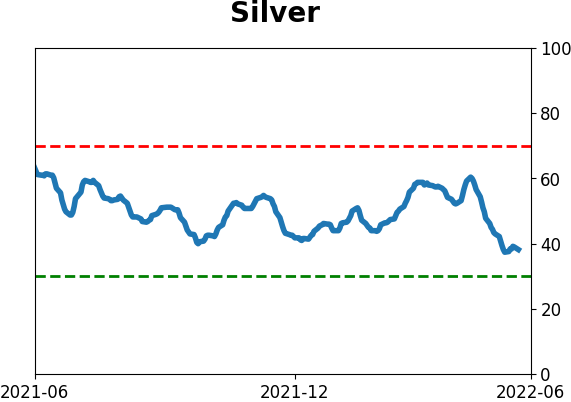
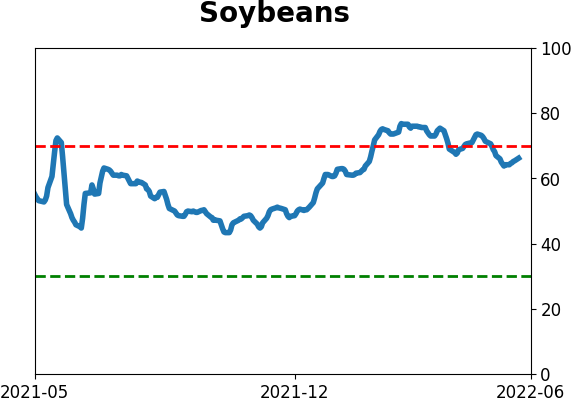
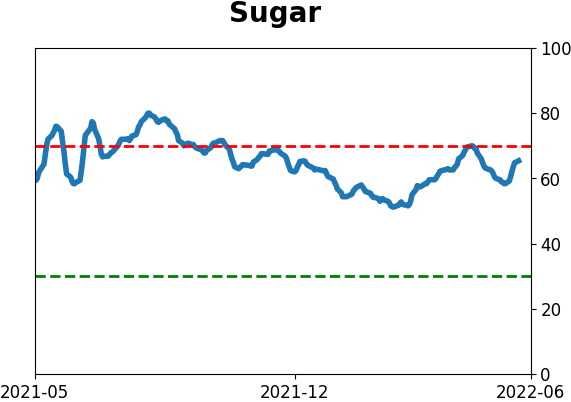
Commodity ETF's - 5-Day Moving Average
|
|