Headlines
|
|
The first 100 days go to the bulls:
Stocks are about to close out the first 100 days of the year with a bevy of record closes. The S&P 500 has notched more than 20 of them during the 100 days, among the strongest starts since 1928. Other super strong starts, with many record closes, tended to see further gains into year-end.
|
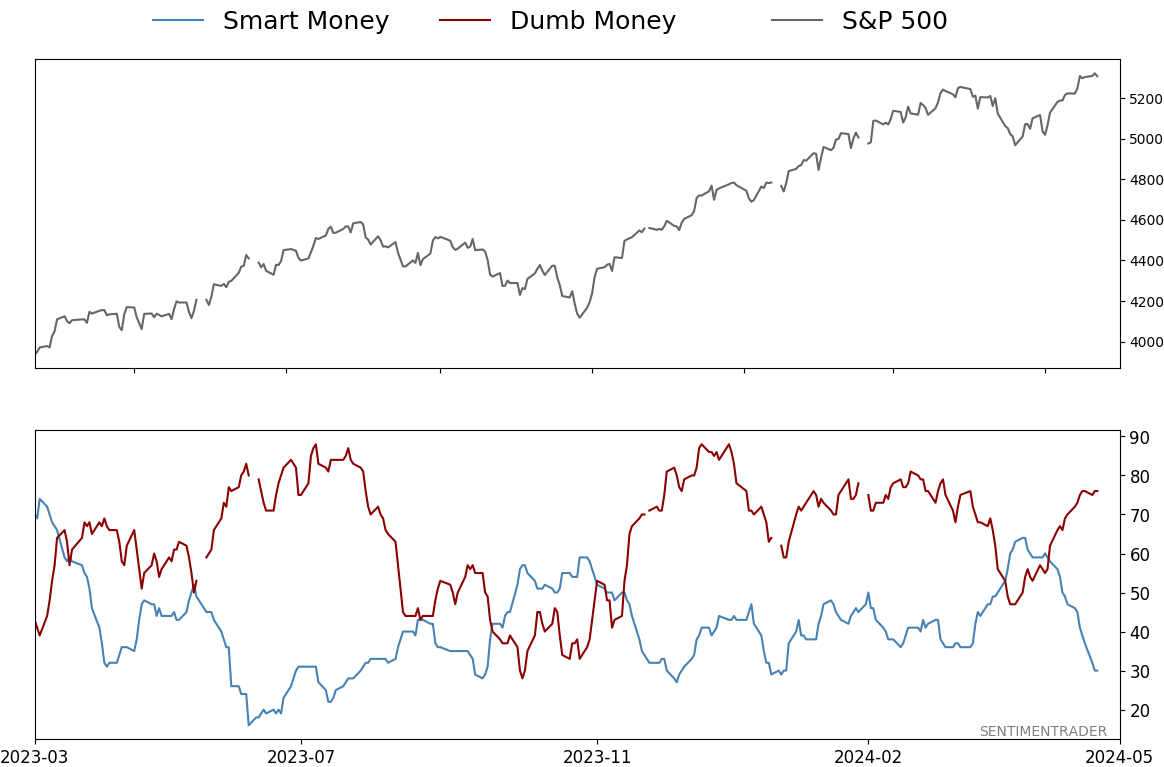
Smart / Dumb Money Confidence
|
Smart Money Confidence: 30%
Dumb Money Confidence: 76%
|
|
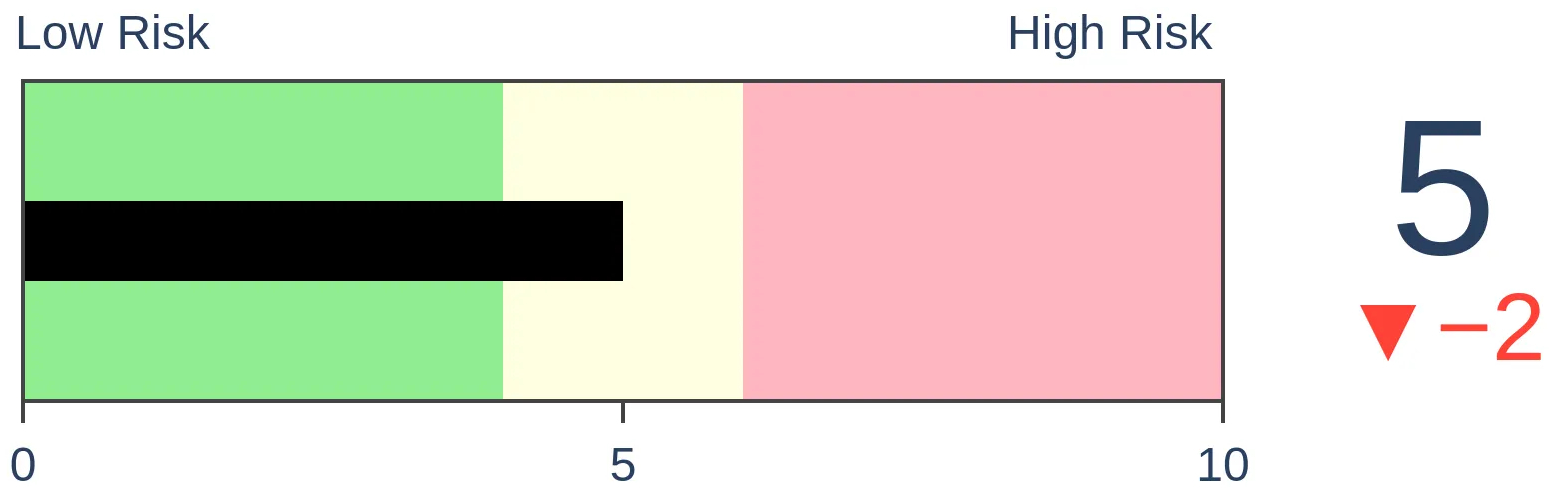
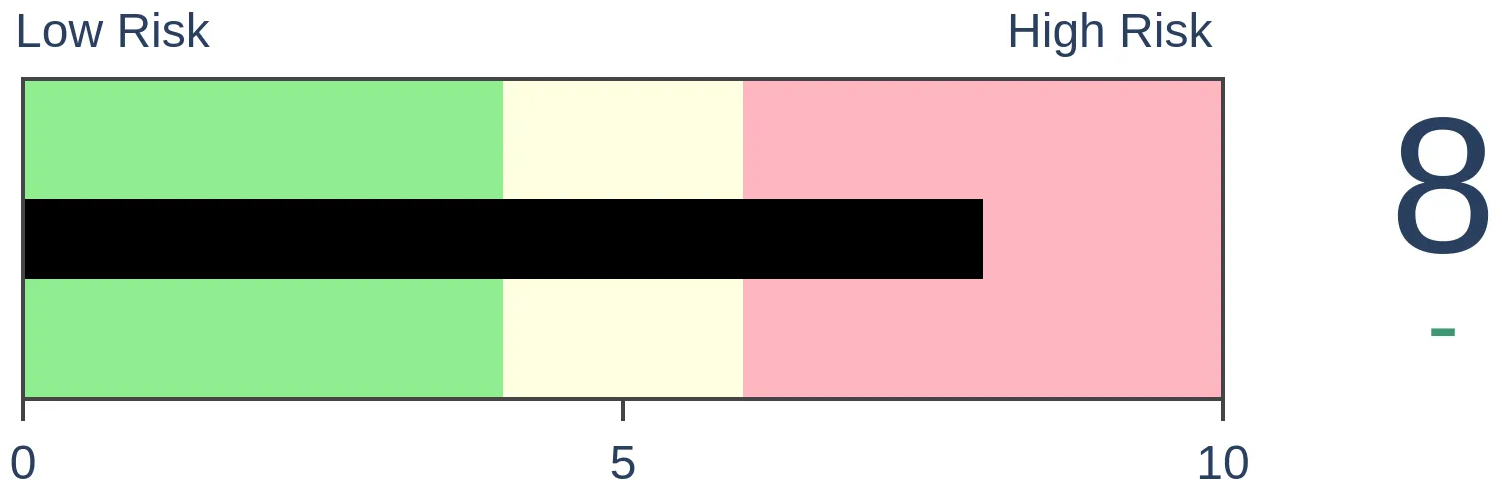
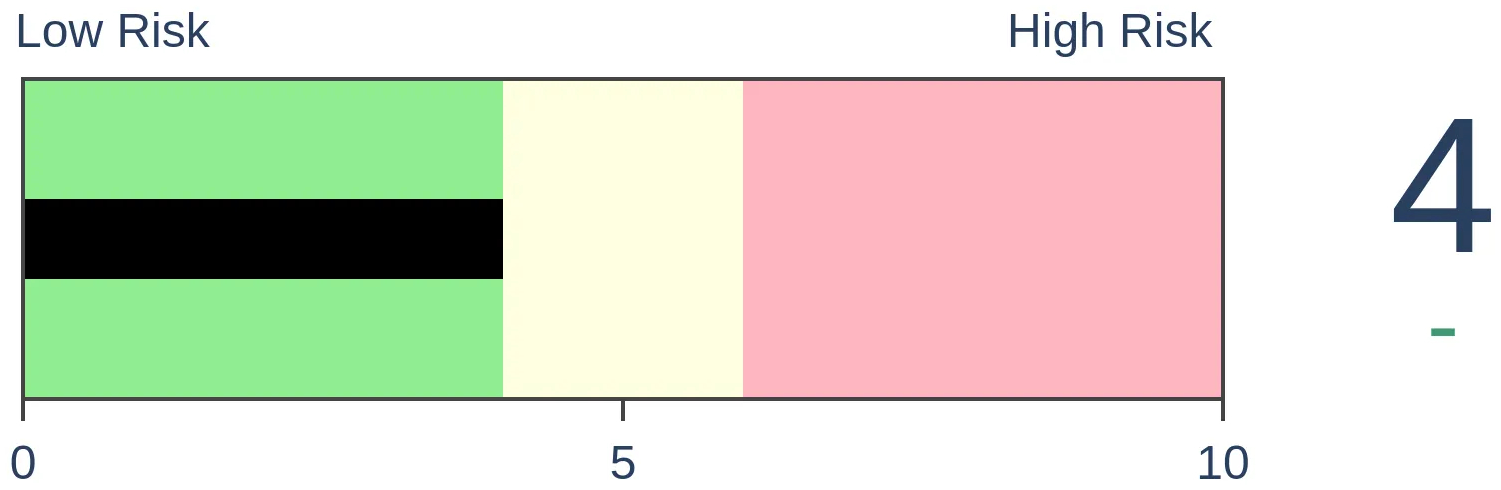
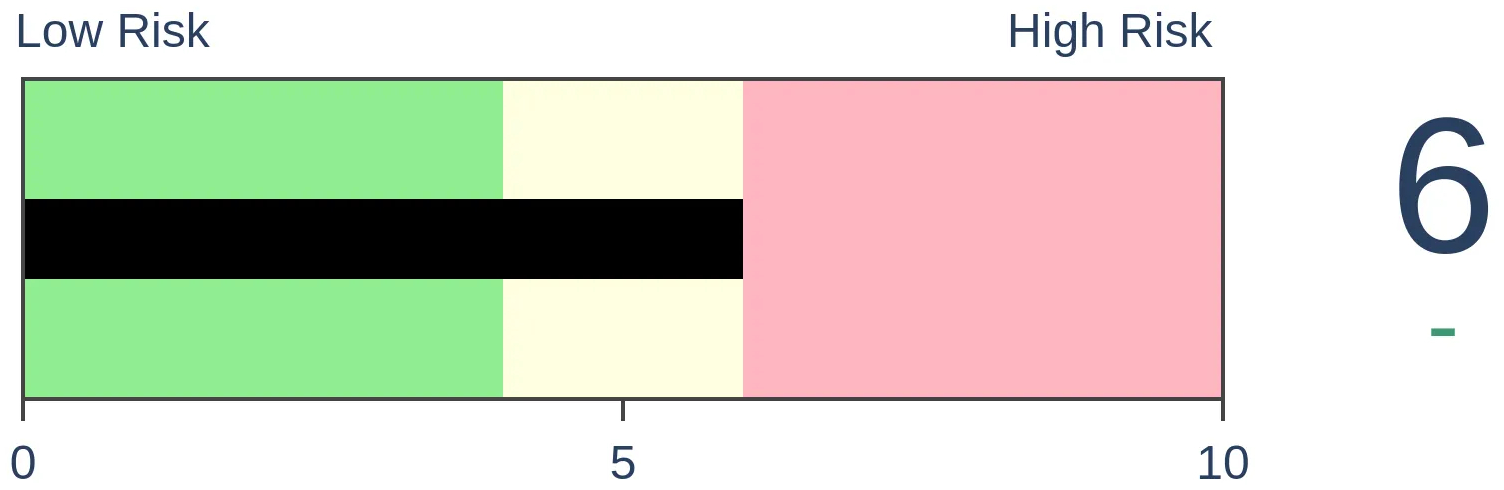
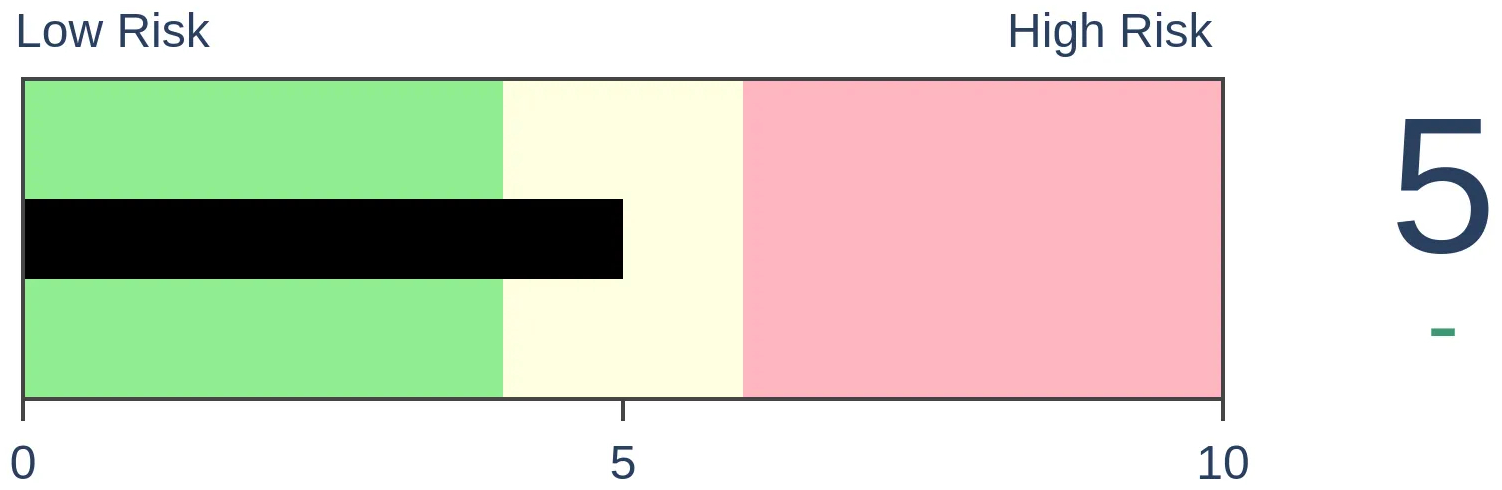
Risk Levels
Stocks Short-Term
|
Stocks Medium-Term
|
|
Bonds

|
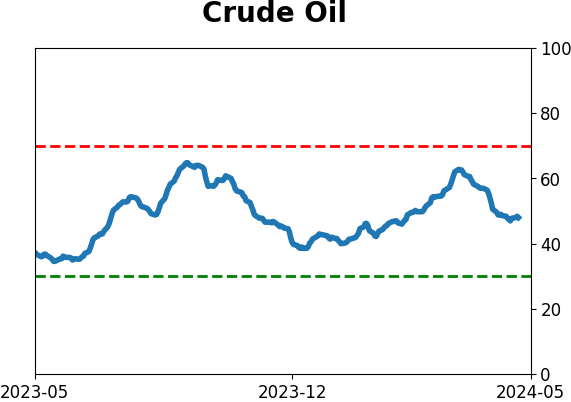
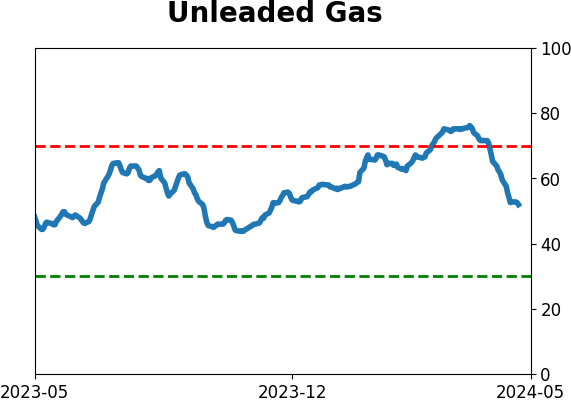
Crude Oil
|
|
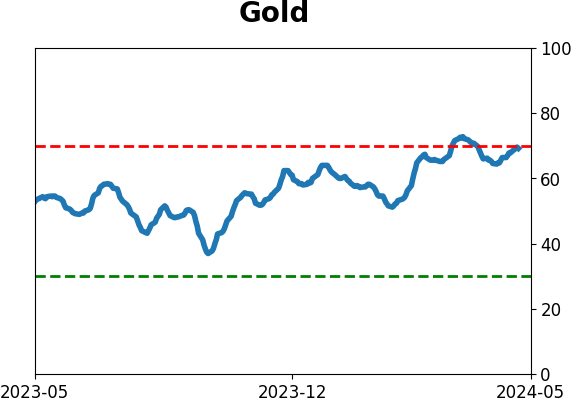
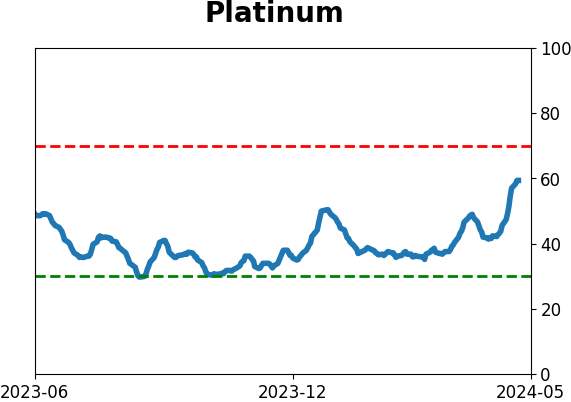
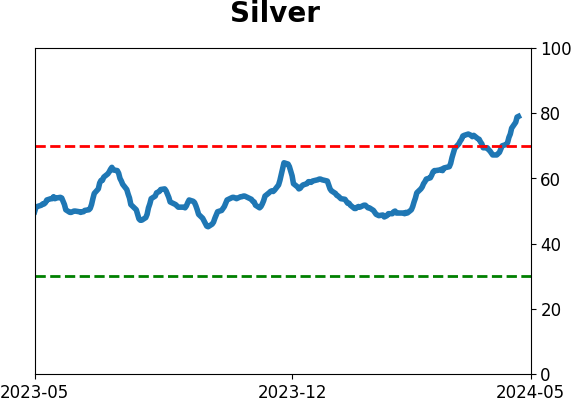
Gold
|
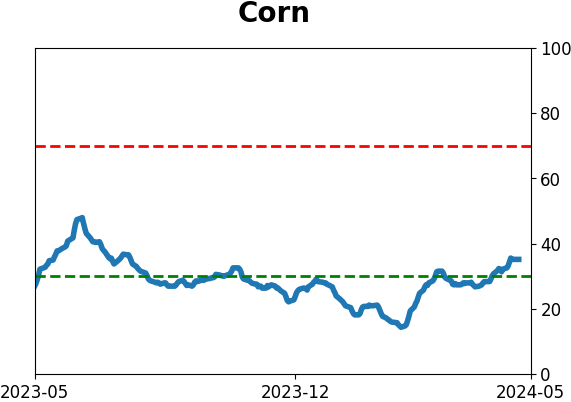
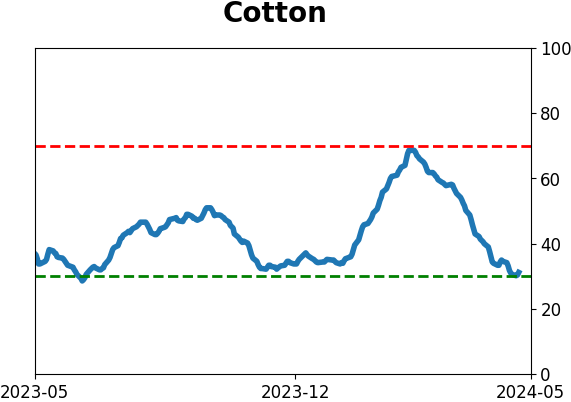
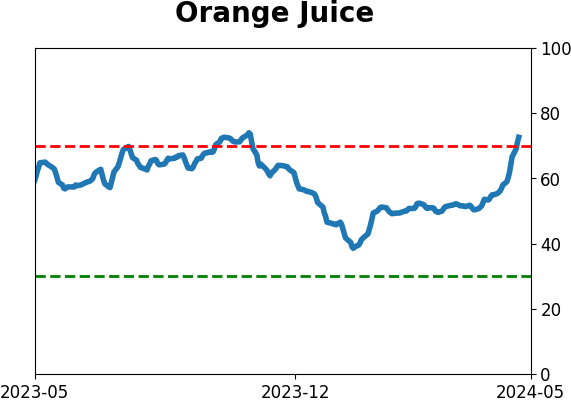
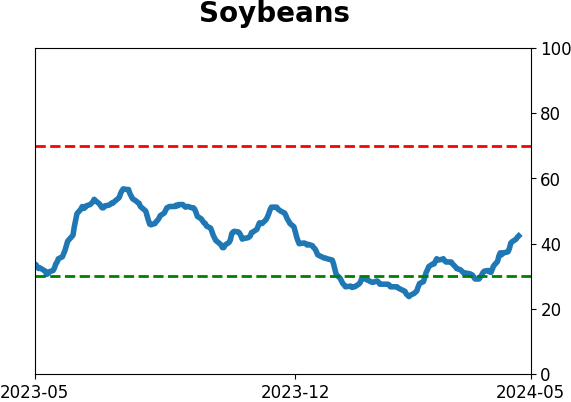
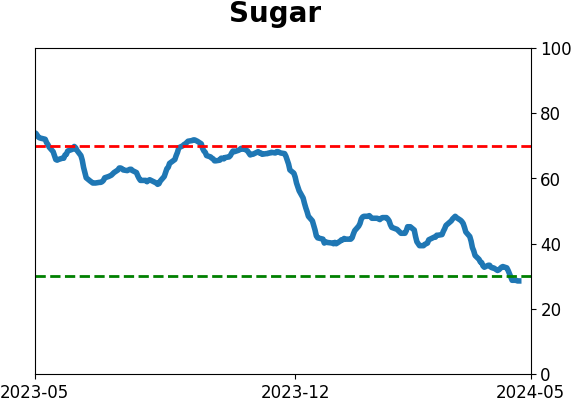
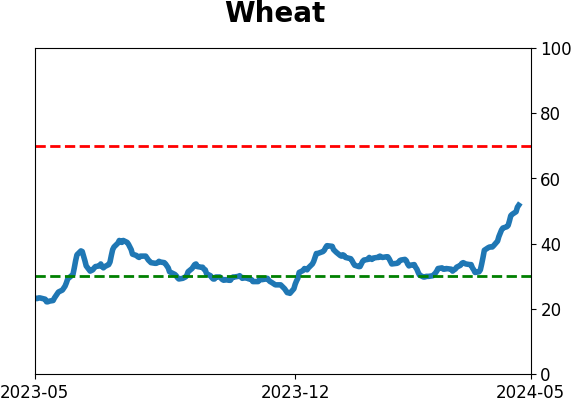
Agriculture
|
|
Research
By Jason Goepfert
BOTTOM LINE
Stocks are about to close out the first 100 days of the year with a bevy of record closes. The S&P 500 has notched more than 20 of them during the 100 days, among the strongest starts since 1928. Other super strong starts, with many record closes, tended to see further gains into year-end.
FORECAST / TIMEFRAME
None
|
Key points:
- The S&P 500 has notched more than 20 record closes during the first 100 days of the year
- This makes 2024 one of the best-ever starts to the year since 1928
- Other strong starts, with many record highs in the first 100 days, tended to see further gains into year-end
A hundred days to remember
Tomorrow, the market will reach the 100-day mark of the year. And what a year it's been for the most benchmarked equity index in the world, as the S&P 500 has set (at least) 24 record high closes during these 100 days.
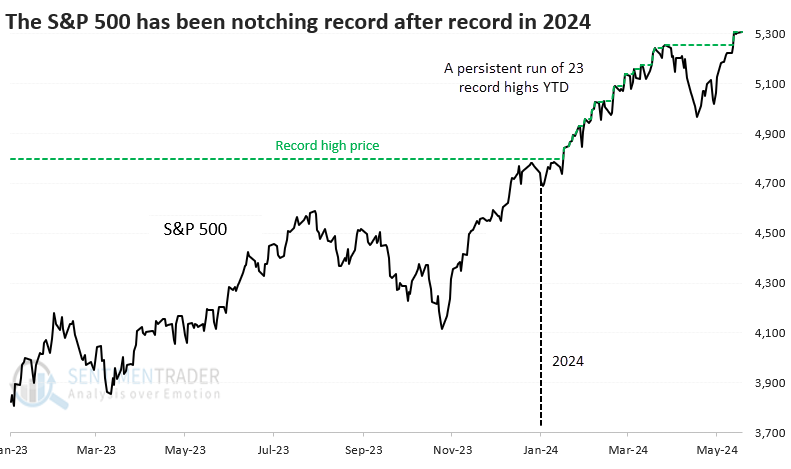
This year qualifies as one of the best since 1928 in terms of persistent record highs. Only a handful of other years have matched or exceeded this performance, including only one over the past 25 years.
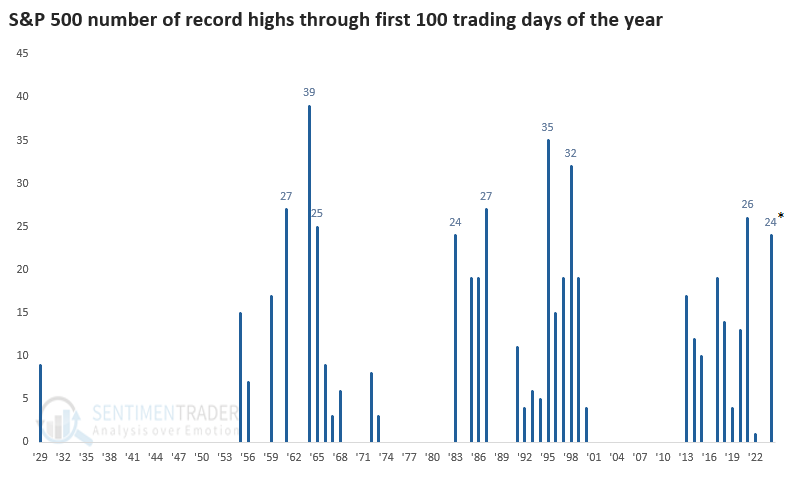
Strong starts = strong finishes (usually)
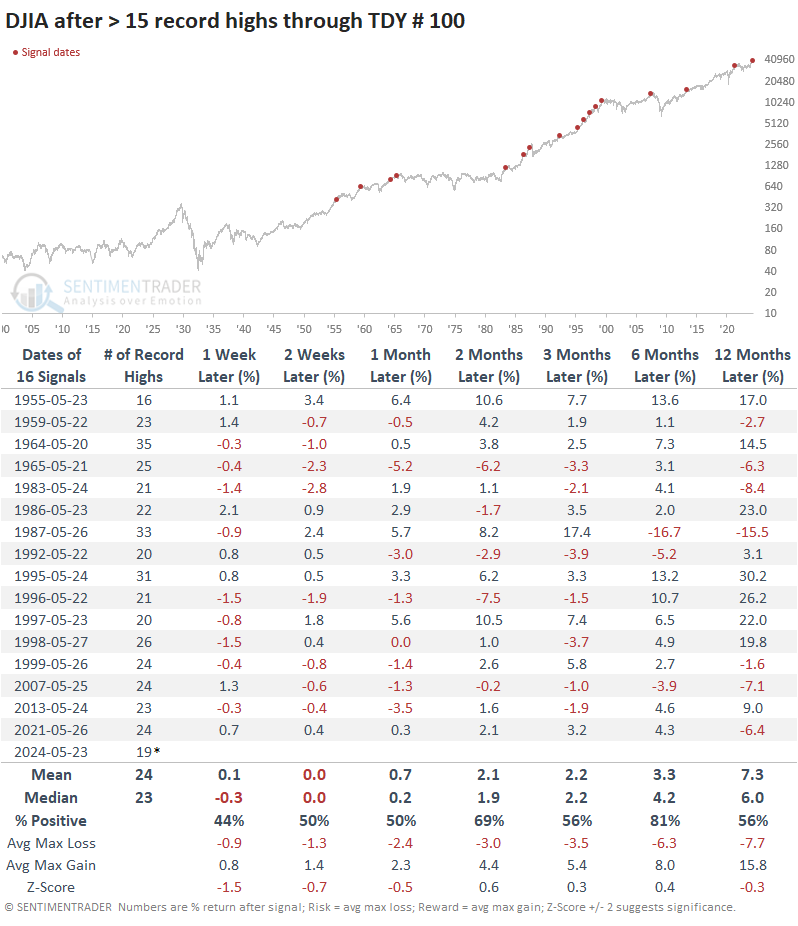
The table below shows each year that notched 20 or more record highs through the first 100 trading days of the year. The current year has an asterisk as the S&P may add to the total before Friday.
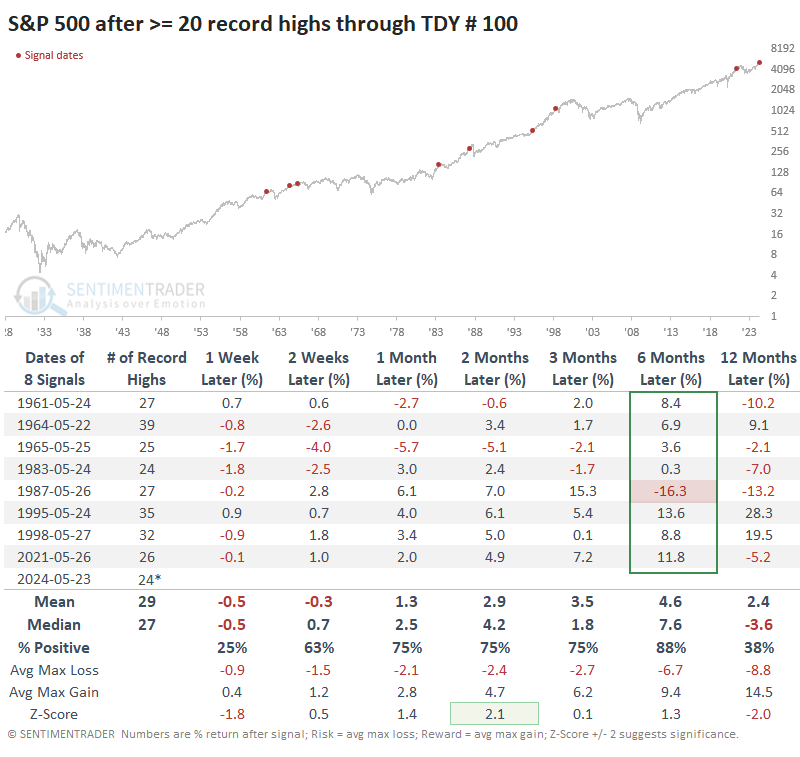
The first week after the 100-day mark showed some weakness, and none of the signals went gangbusters during the first week or two. But that was about it for weakness, at least over the summer months. During the next two to three months, there were some isolated weak returns but nothing significant through year-end (roughly the 6-month time frame). Only the 1987 crash interrupted what would have been a perfect record.
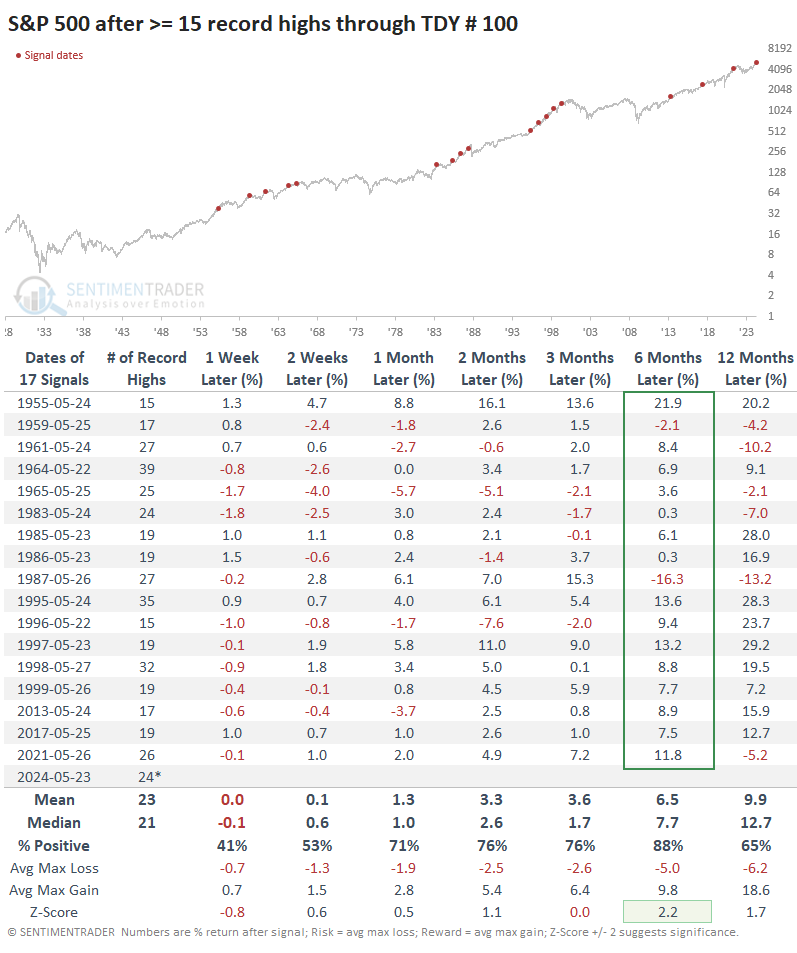
If we relax the parameters to look at years that enjoyed at least 15 record highs through the first 100 days, the biases persisted - weak in the very short term but strong into year-end. Over the next six months, only 2 signals out of 17 suffered a loss.
When we compare those returns to years when the S&P didn't manage any record highs during the first 100 sessions, the good starts underperformed in the short term but outperformed after that. After good 100-day starts, the S&P rallied into year-end 88% of the time compared to only 60% after bad starts, with significantly less risk.

The Dow Jones Industrial Average has also recorded an impressive number of record highs during its first 100 days of the year. Like the S&P 500, the Dow showed weak returns in the short term but consistently rallied into year-end. Of the three losses, only one was much larger than -5%.
What the research tells us...
Over the past year and a half, we have shown many momentum studies, virtually all showing larger-than-average and more consistent-than-average returns over medium to long time frames. When stocks exhibit strong momentum, it often runs roughshod over sentiment extremes, and we've seen that during this latest cycle.
An excellent start to a year can be added to these momentum studies as a bullish data point. It's not as strong or consistent as many of the others we've looked at, but it is enough to be compelling into year-end.
Indicators at Extremes
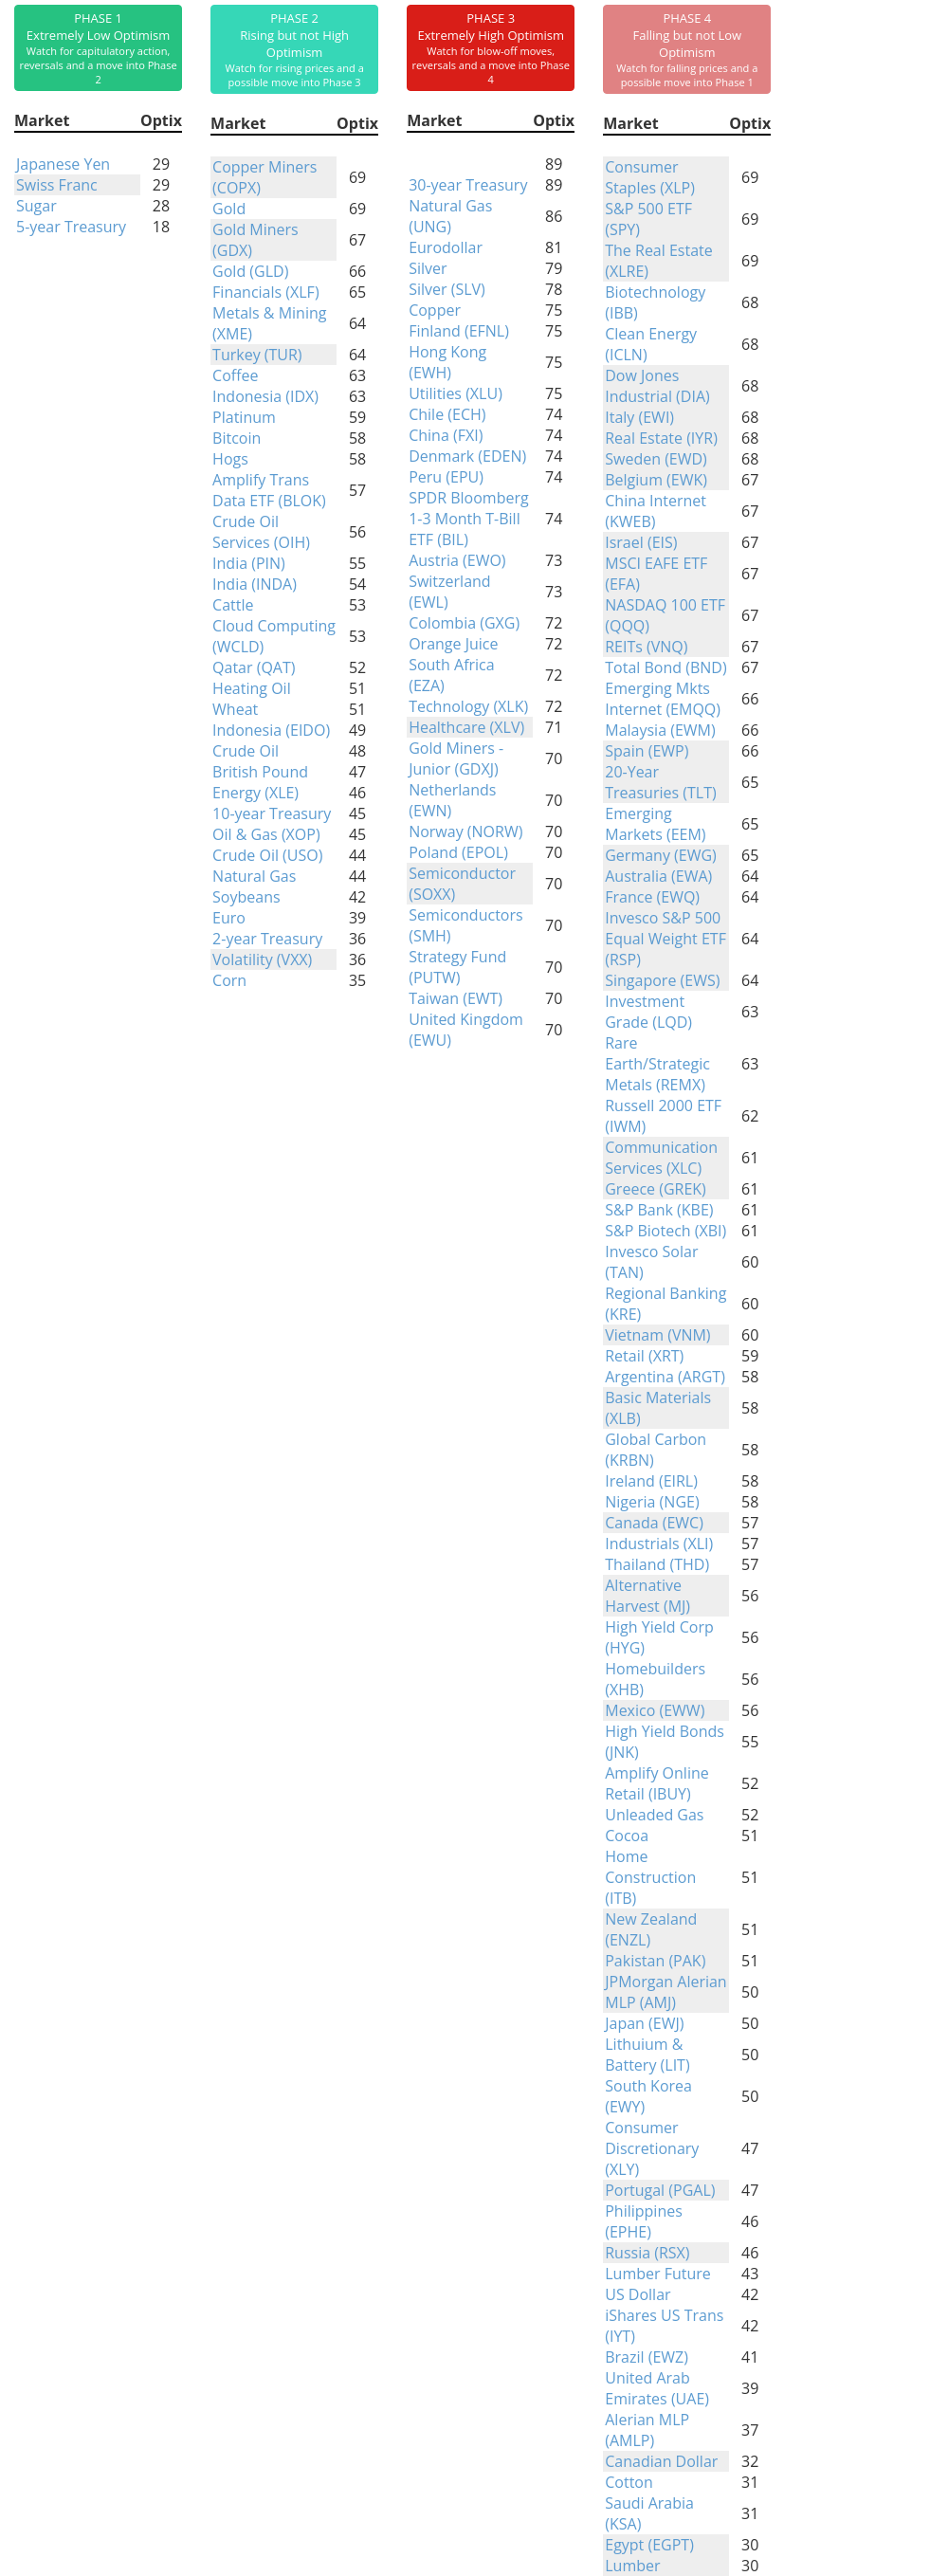
Phase Table
Ranks
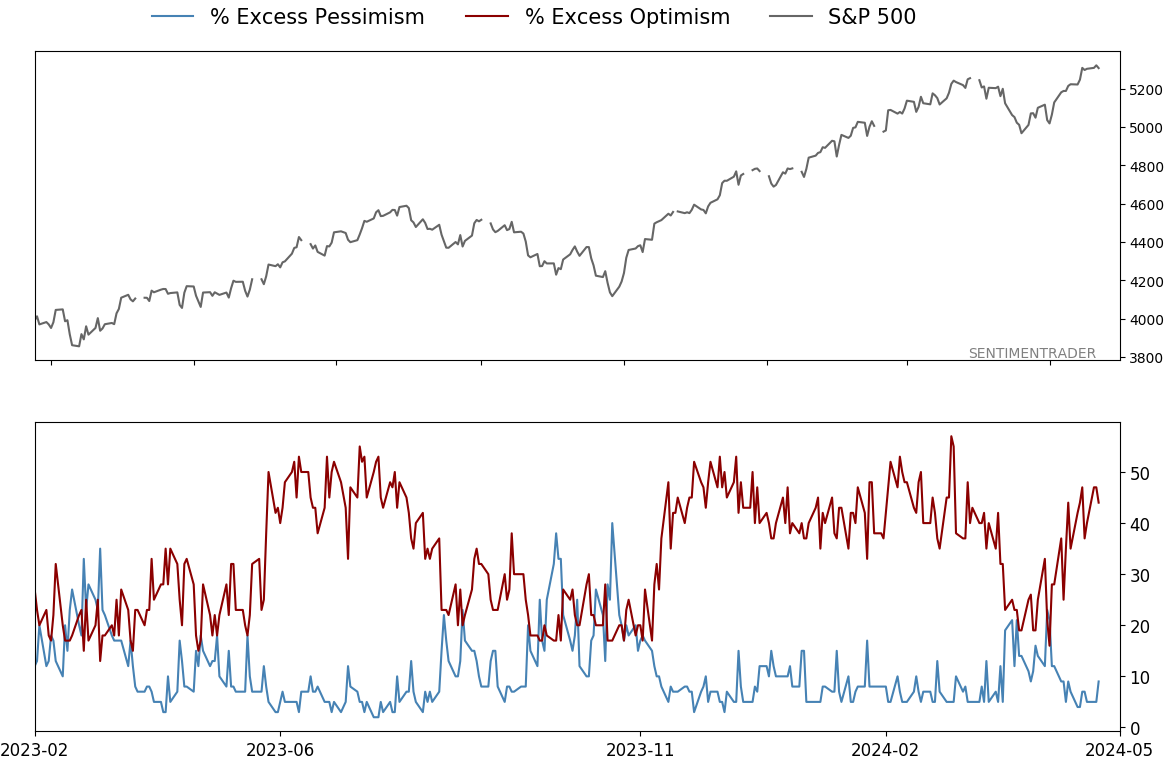
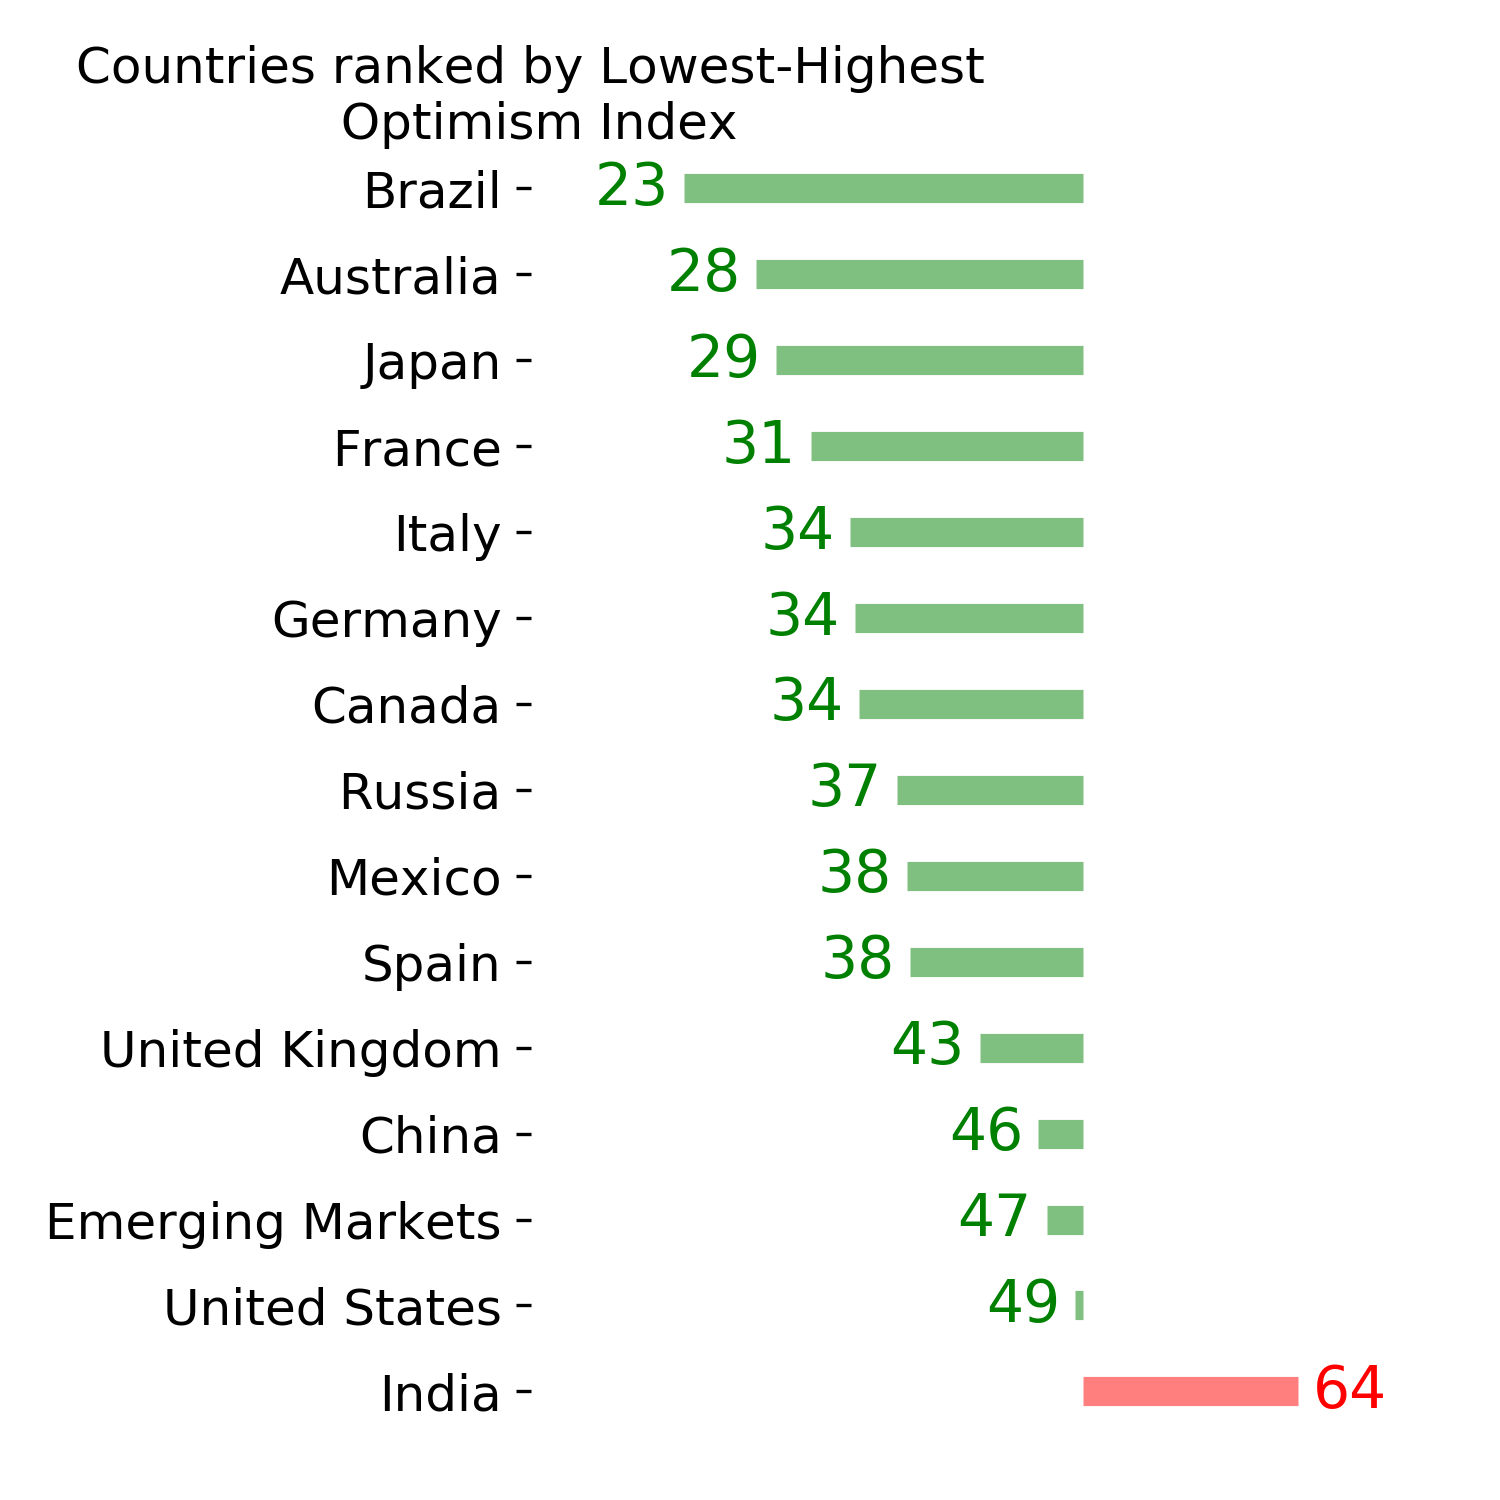
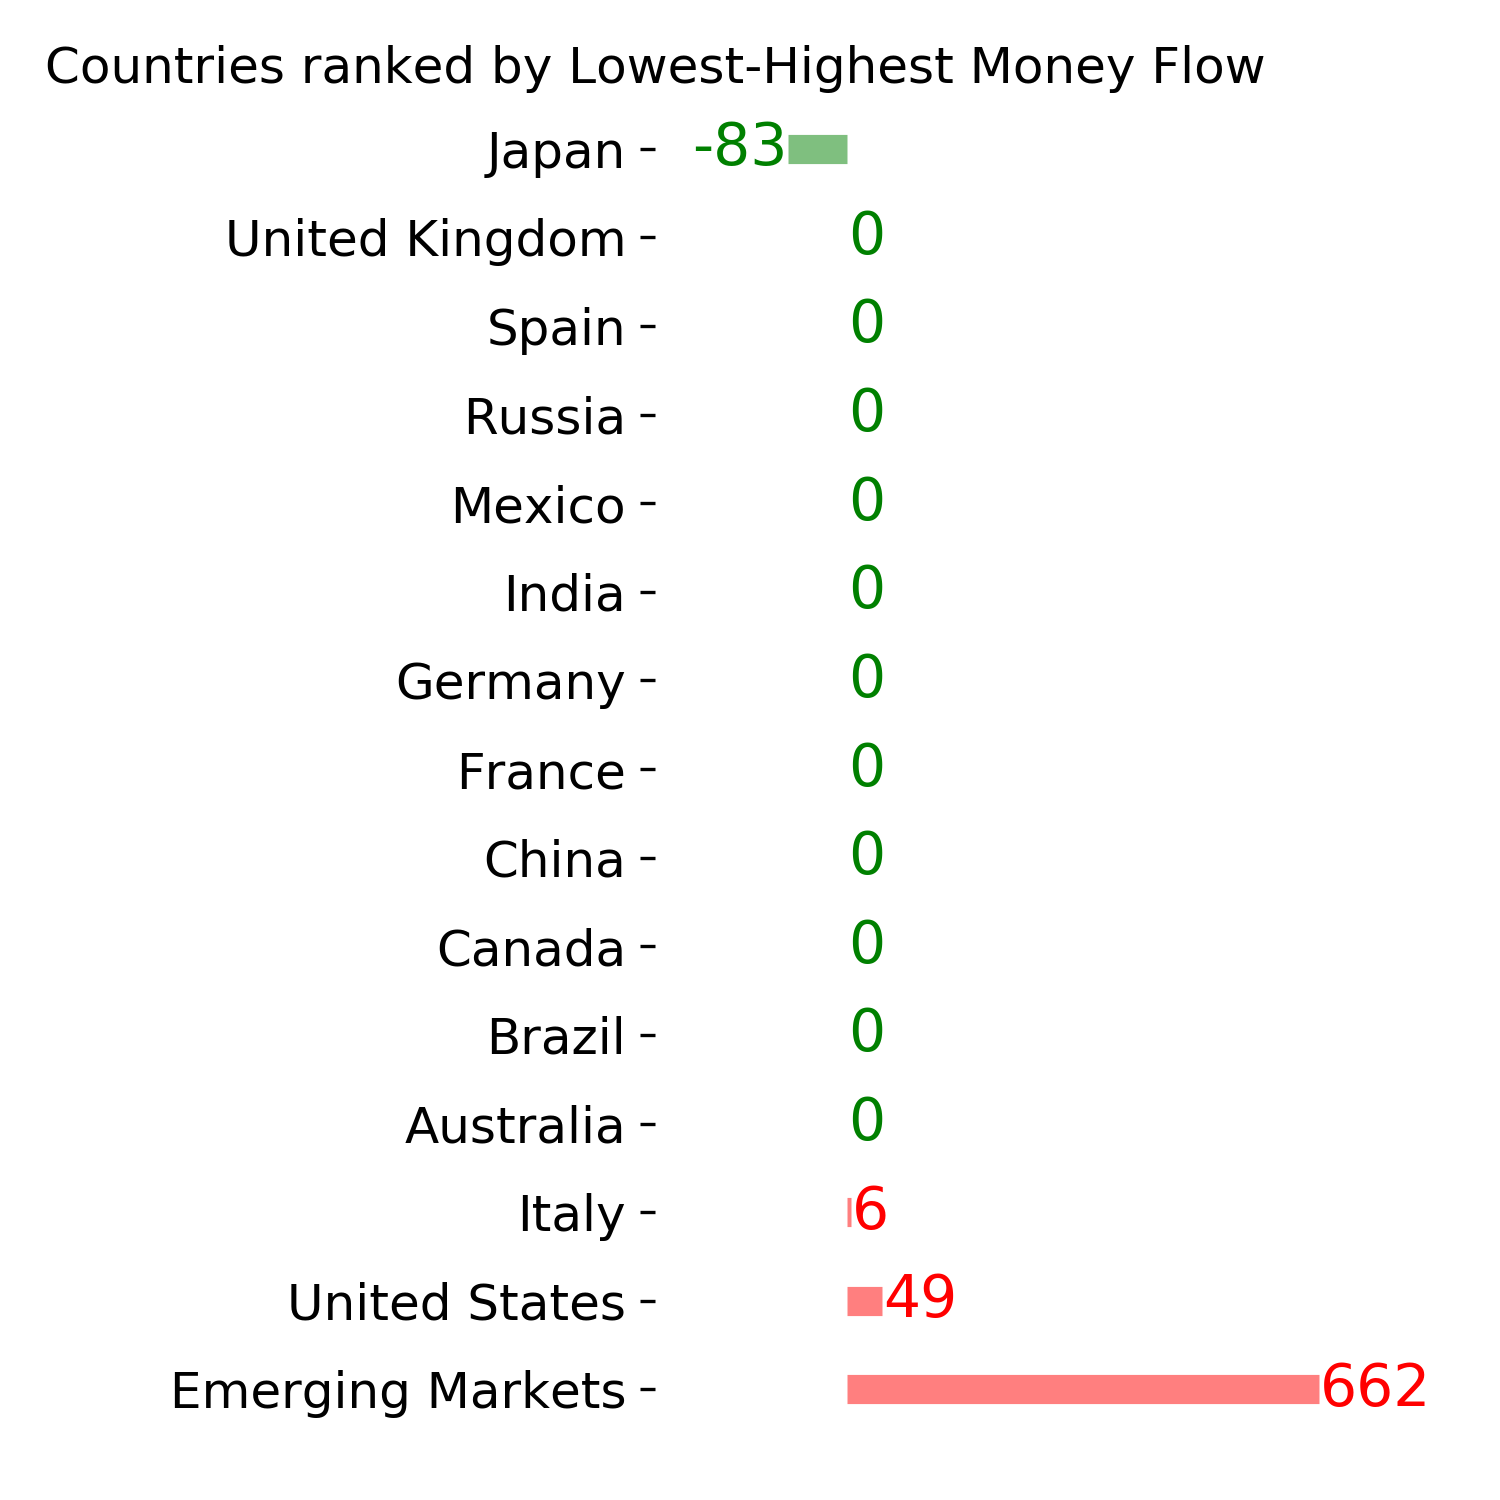
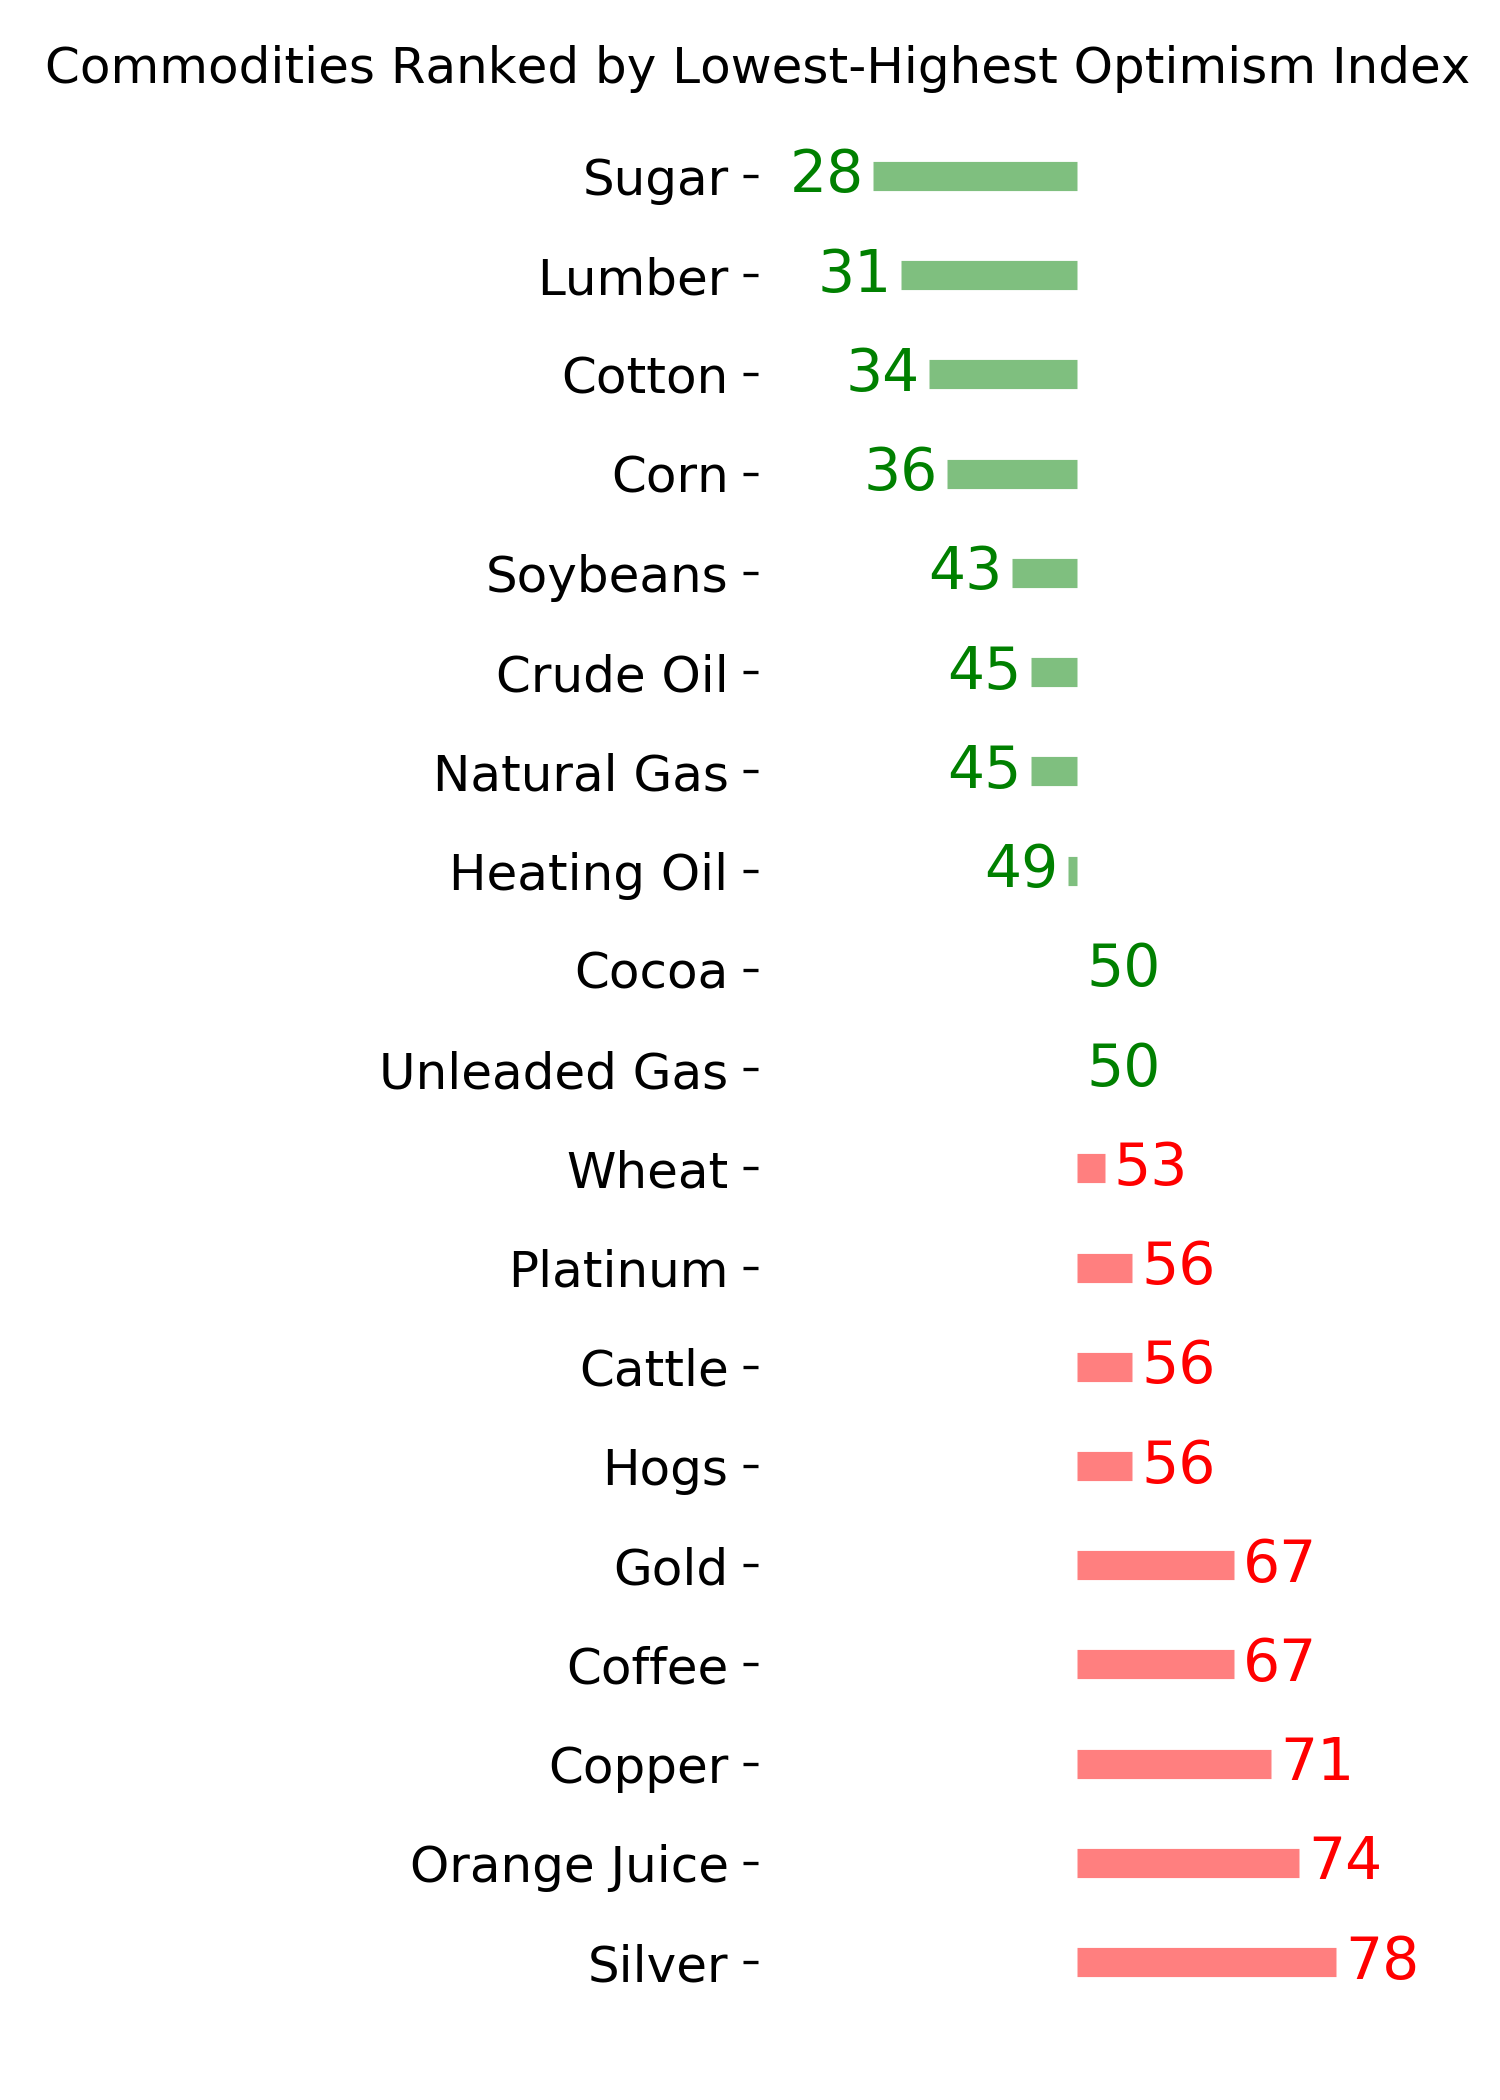
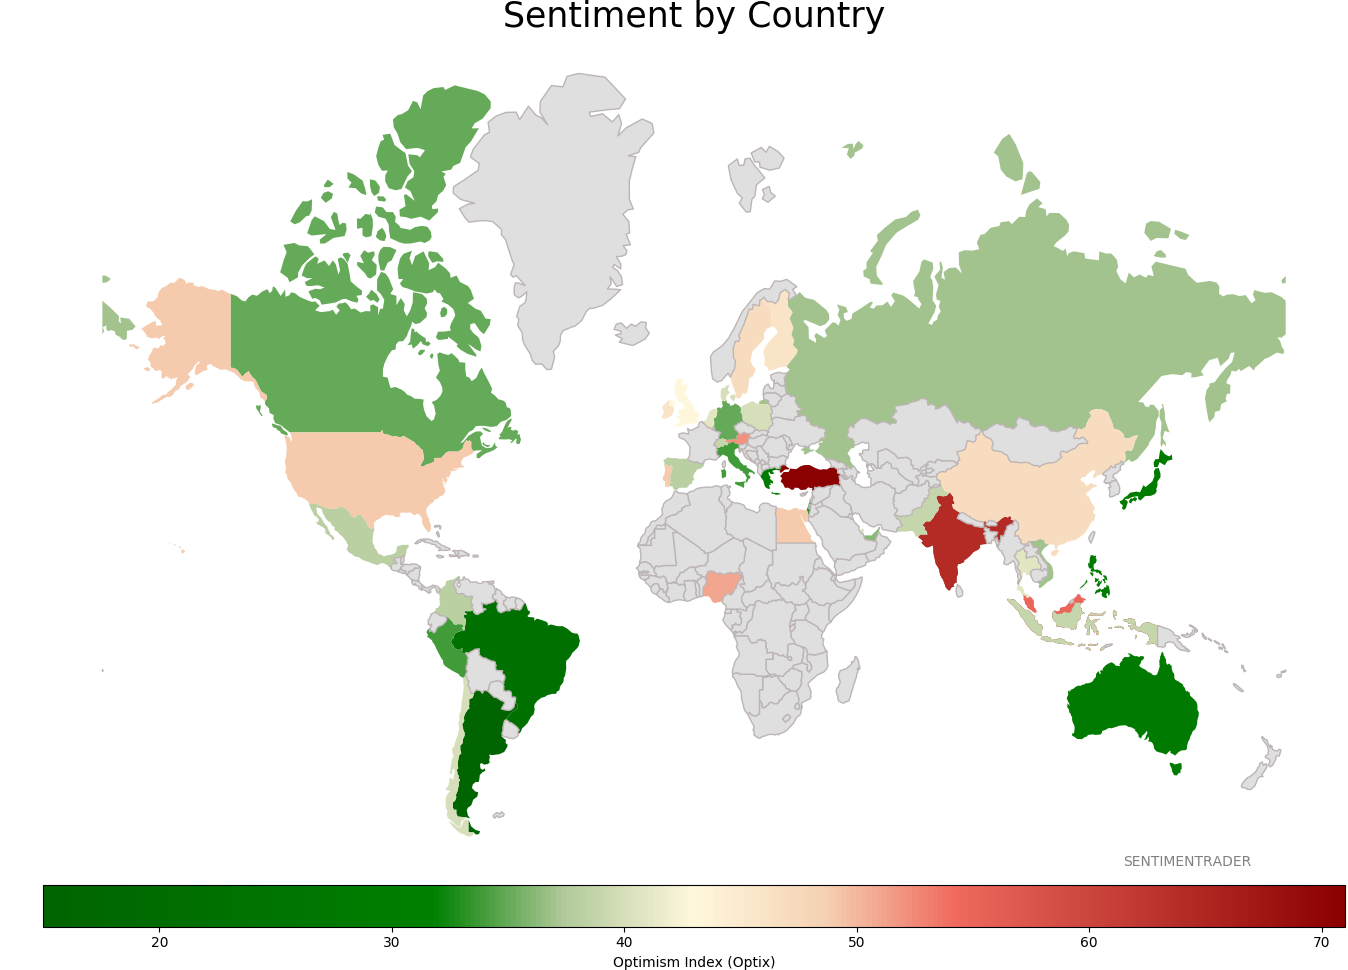
Sentiment Around The World
Optimism Index Thumbnails
|
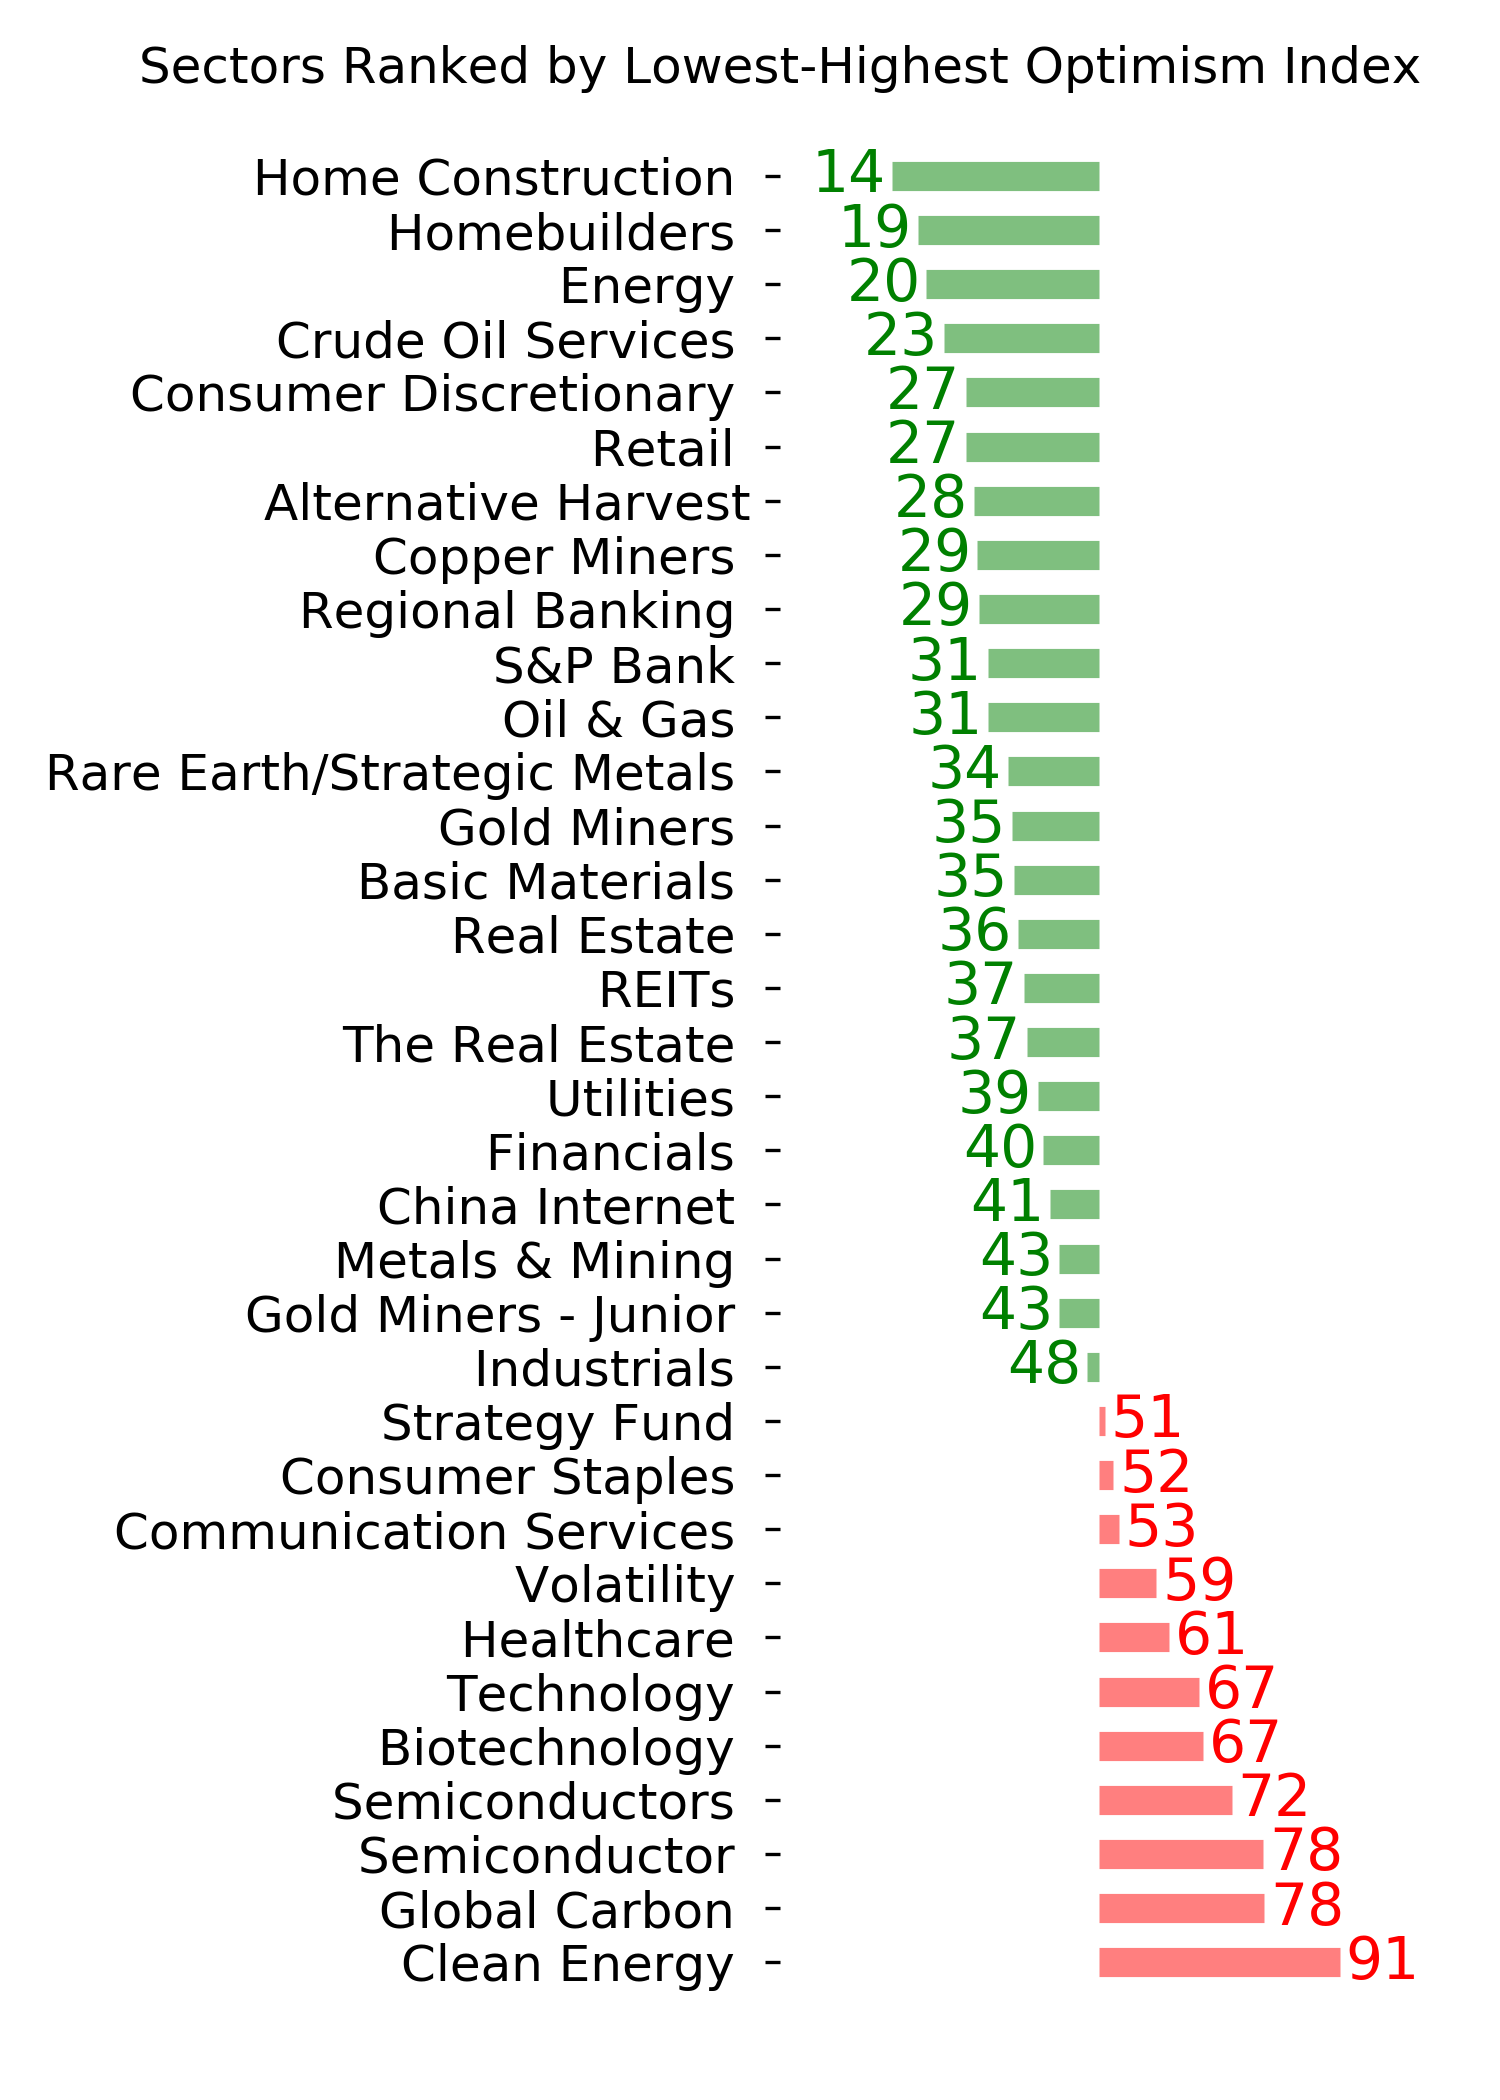
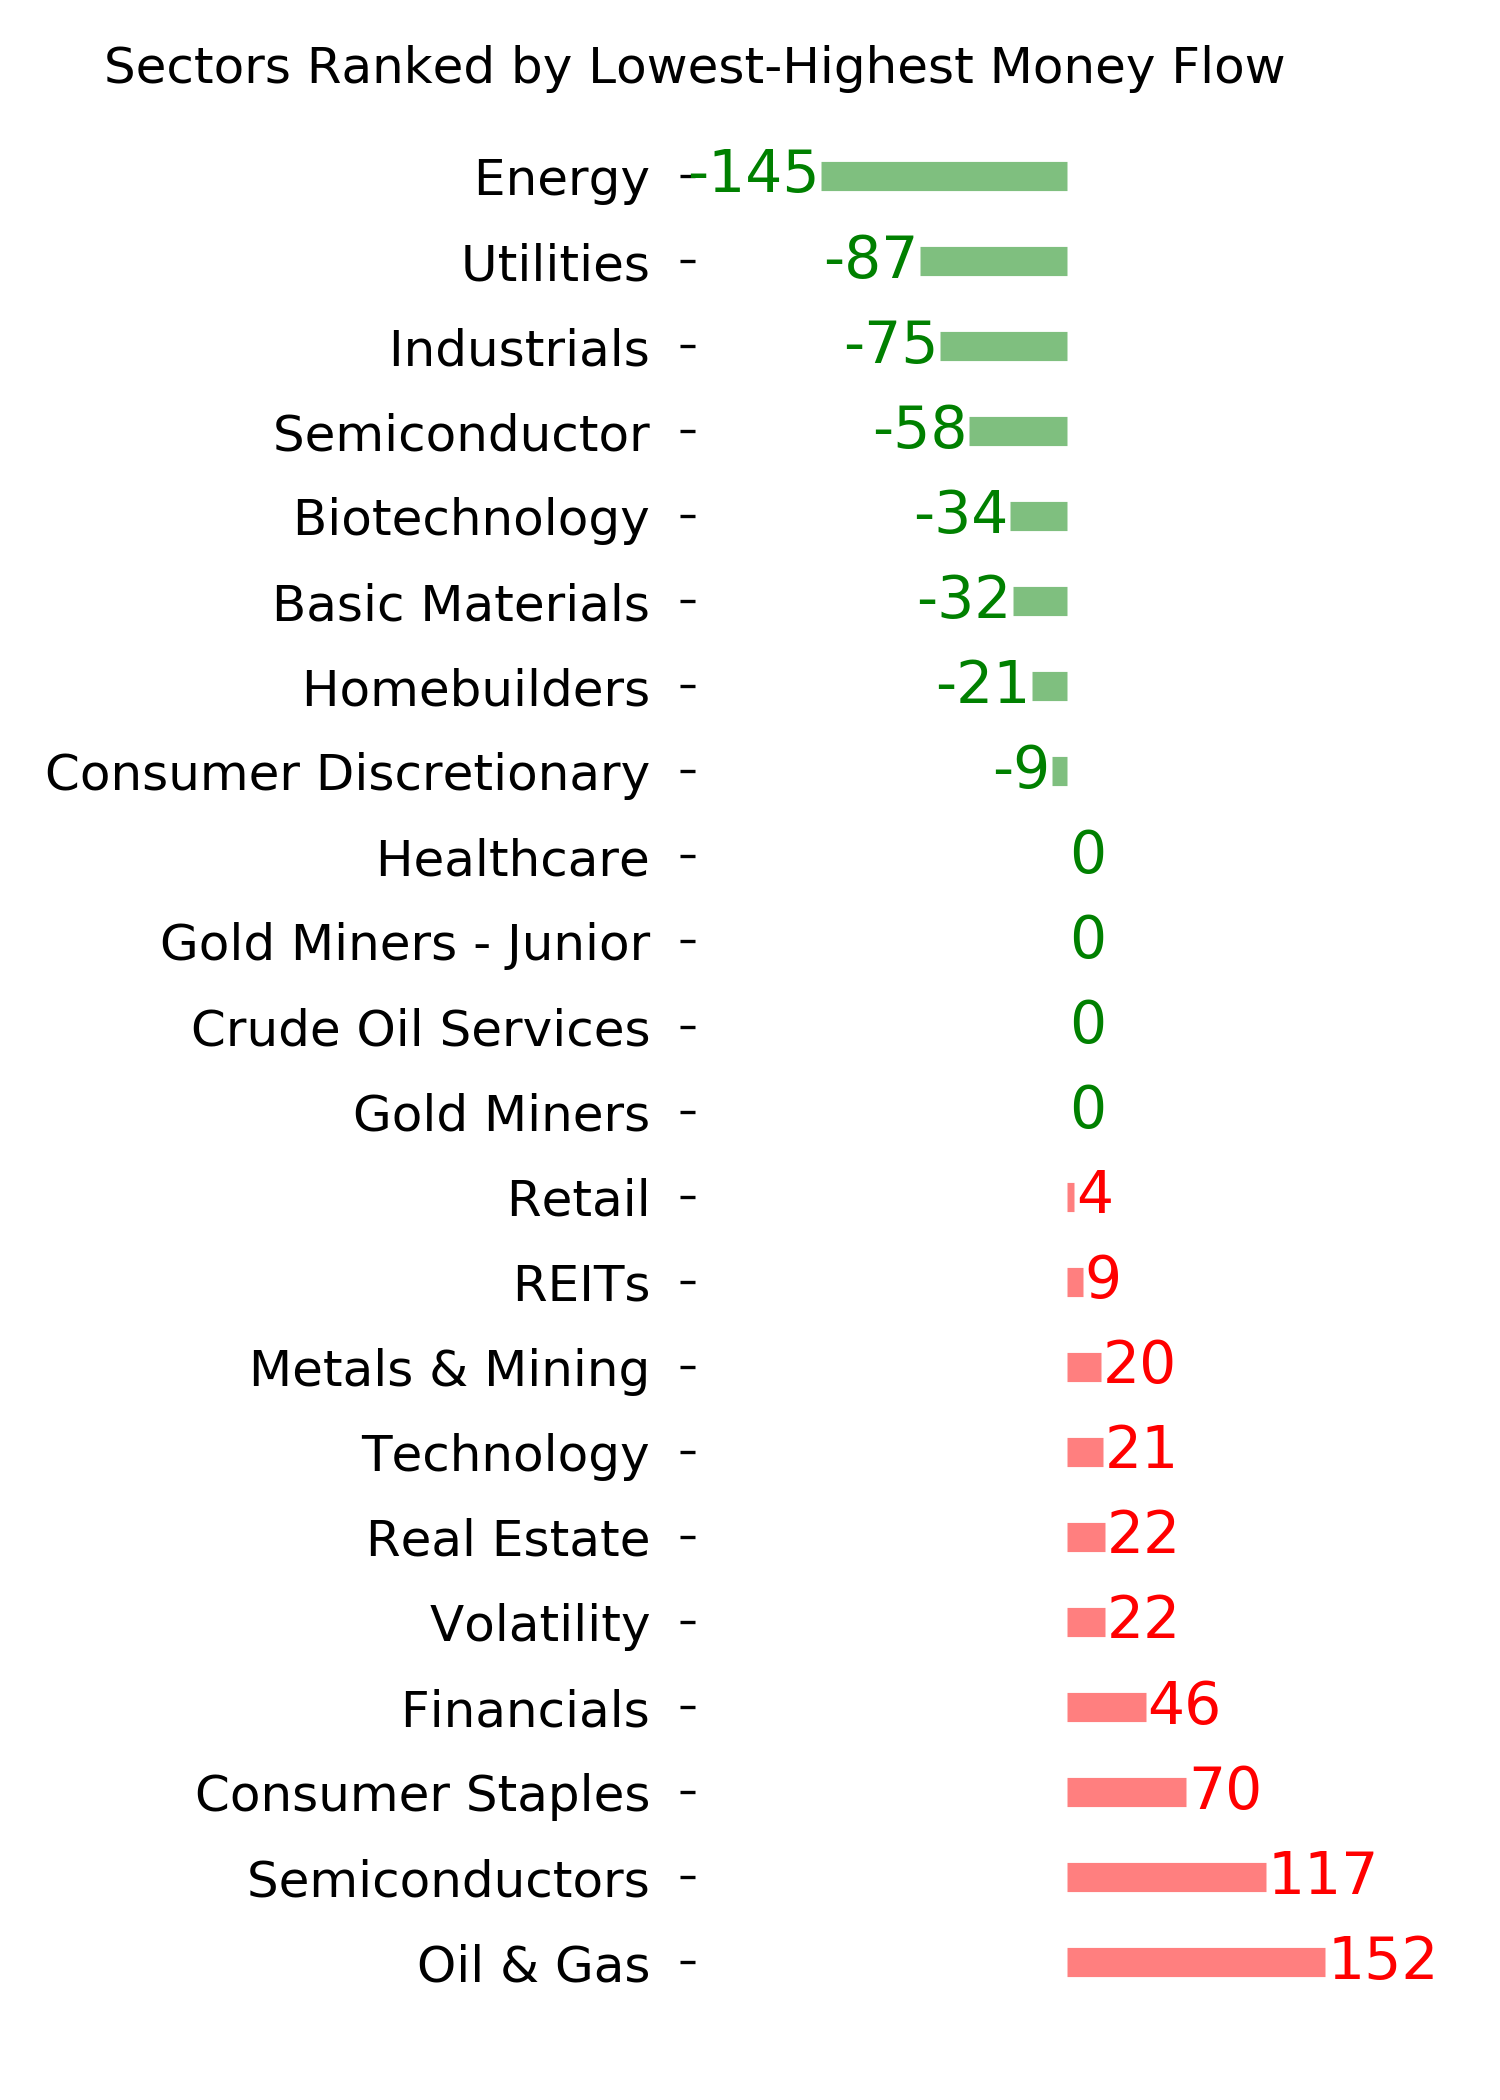
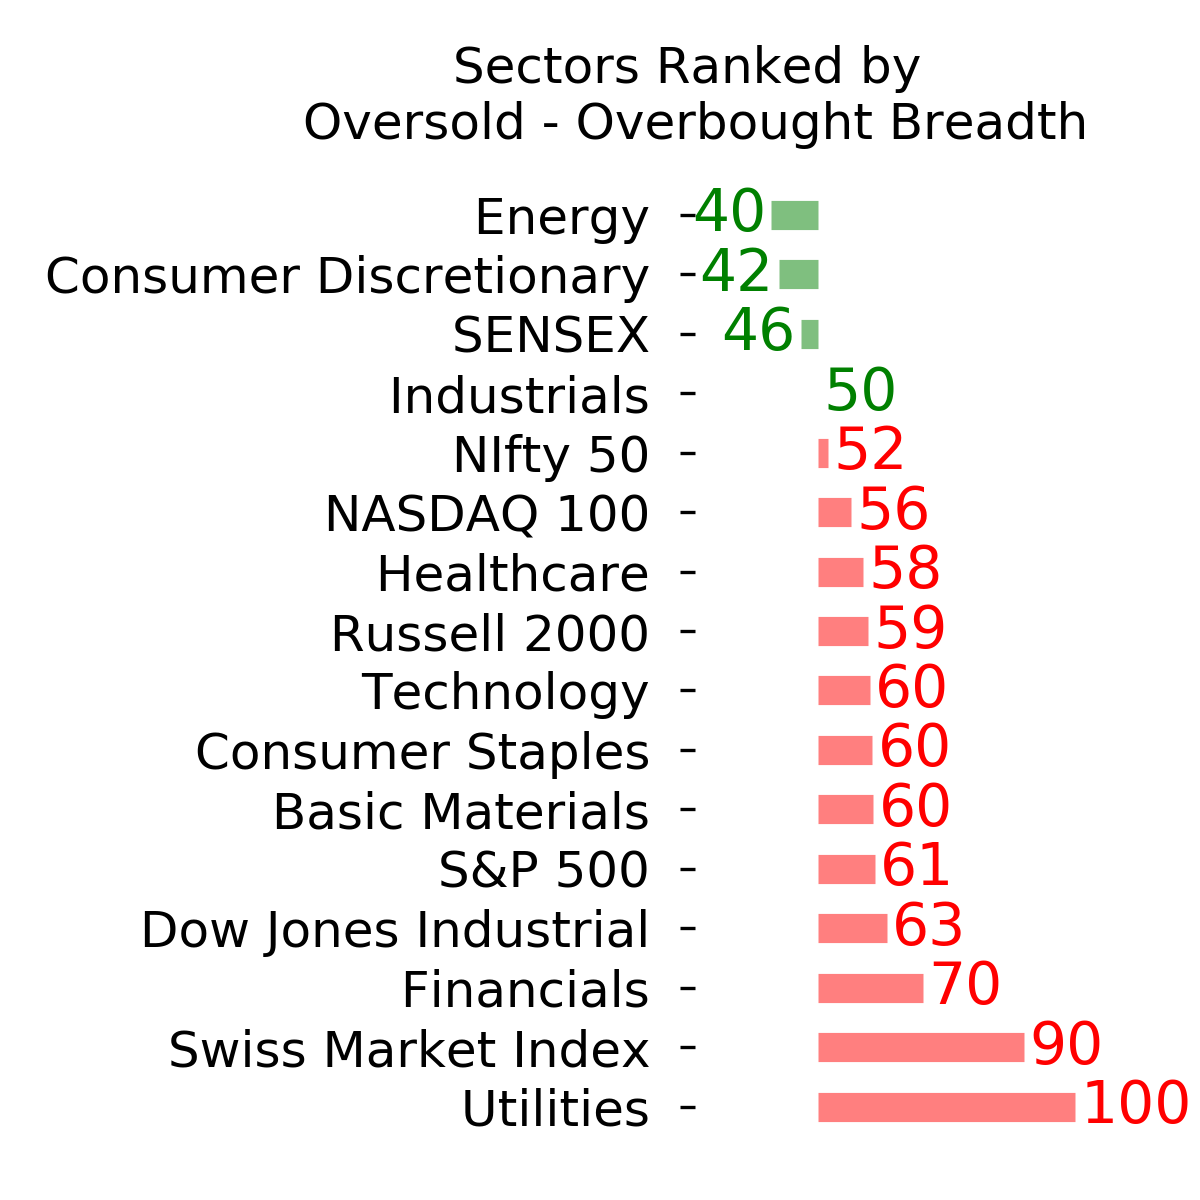
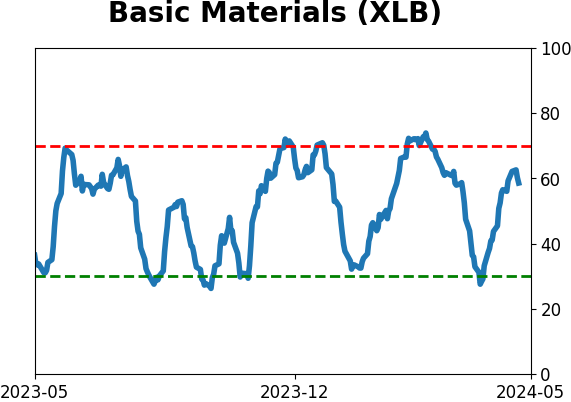
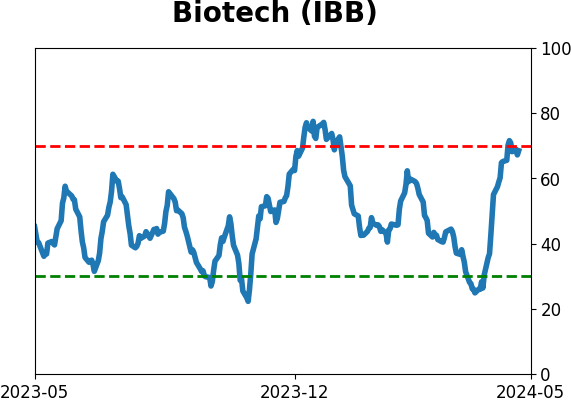
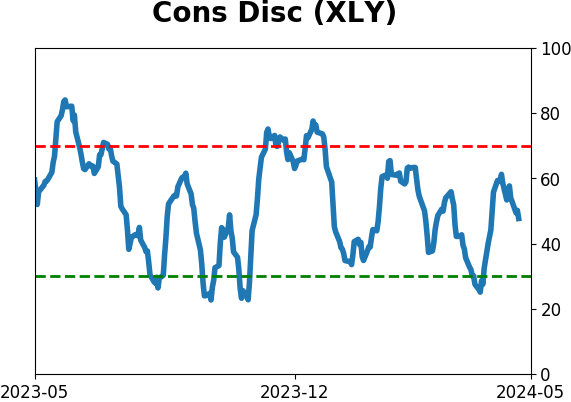
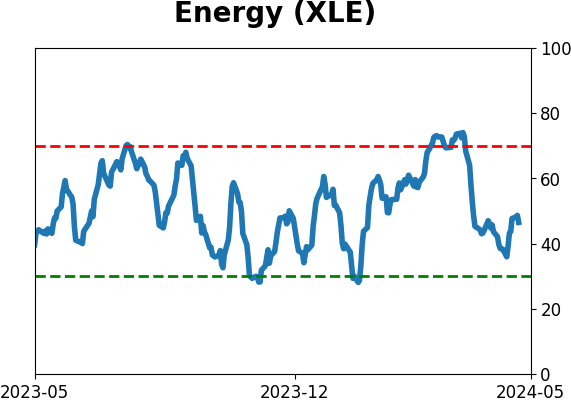
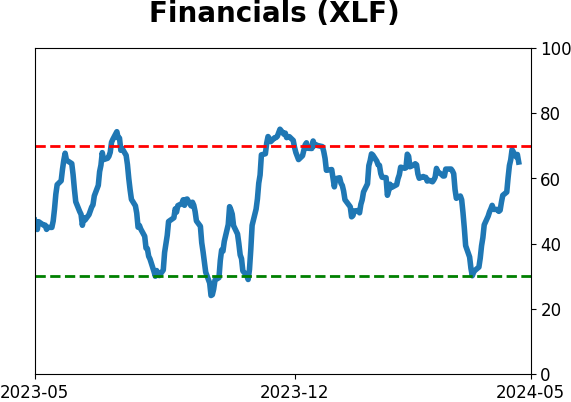
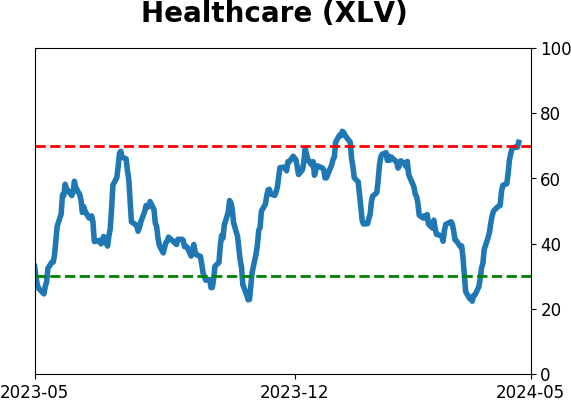
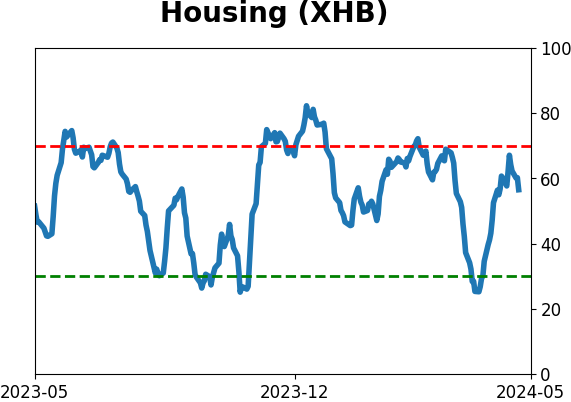
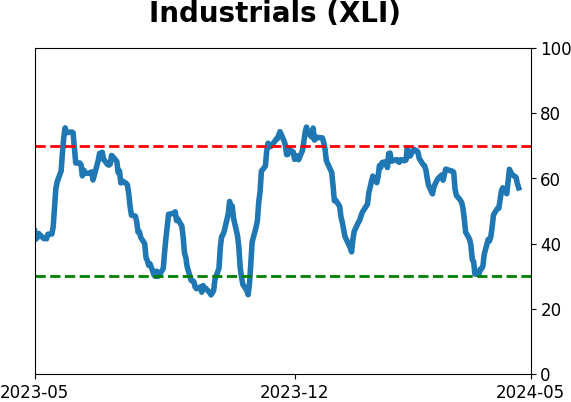
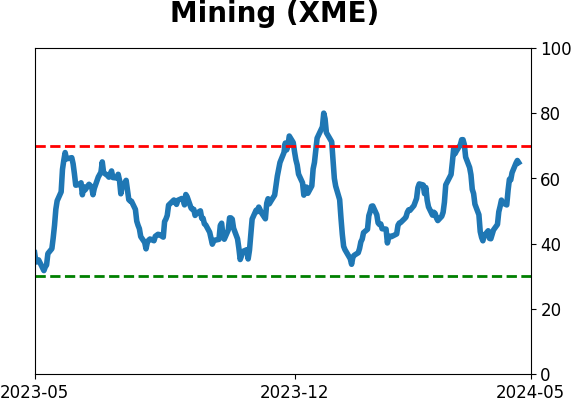
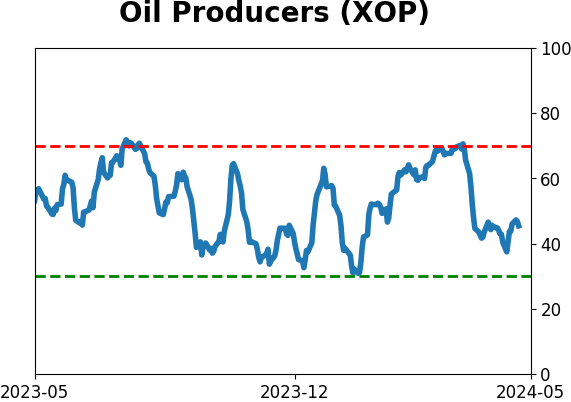
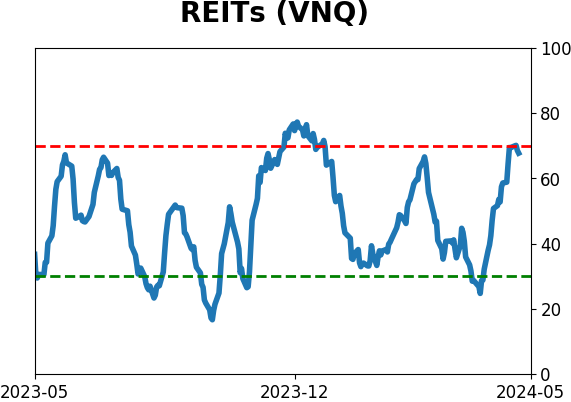
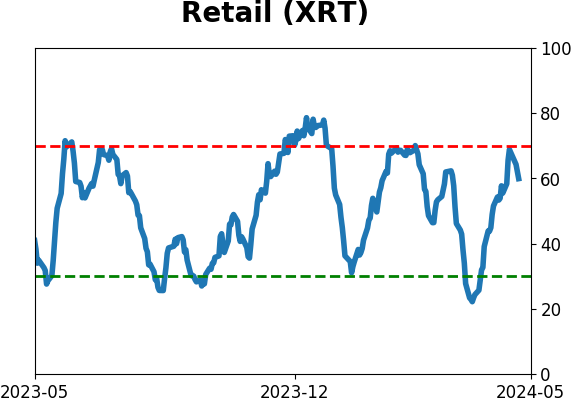
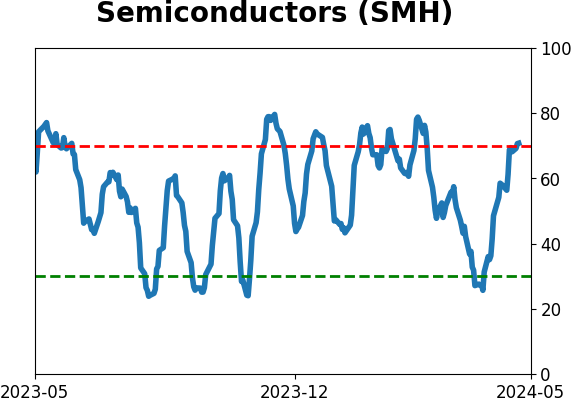
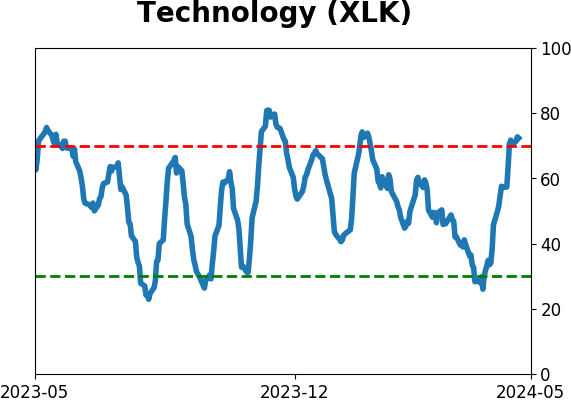
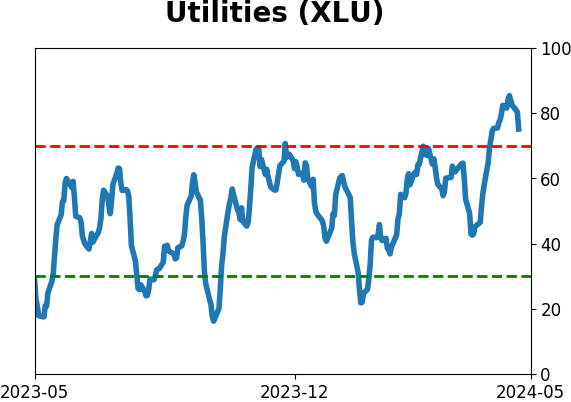
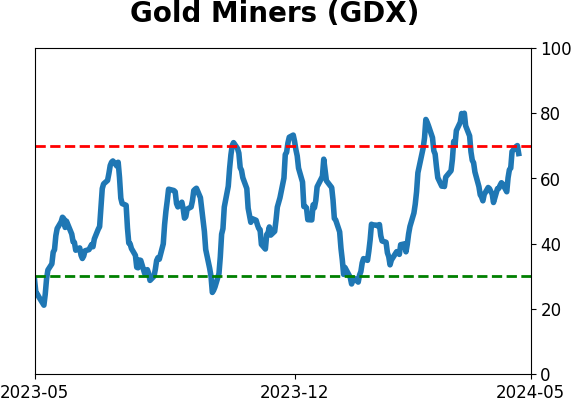
Sector ETF's - 10-Day Moving Average
|
|
|
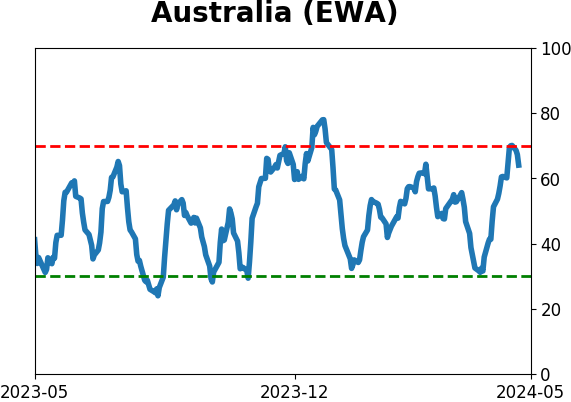
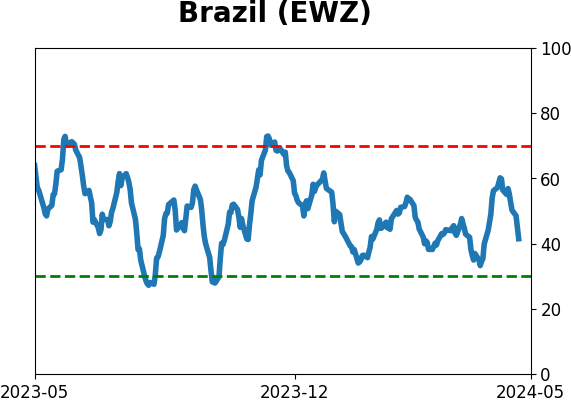
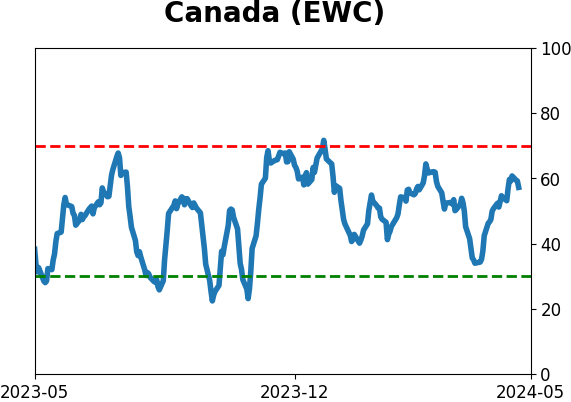
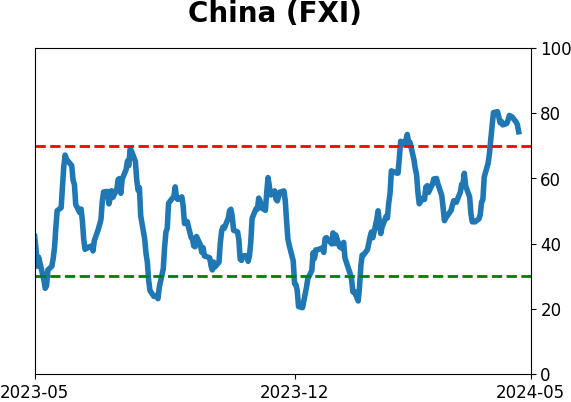
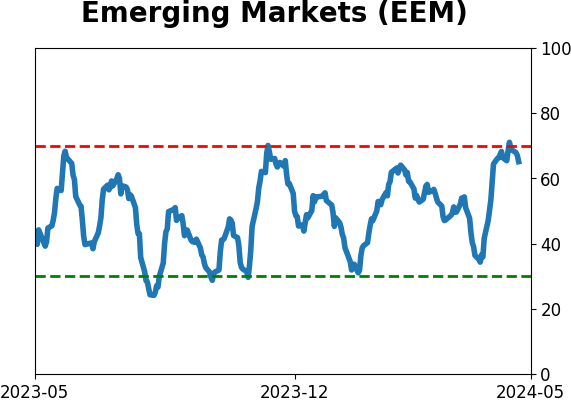
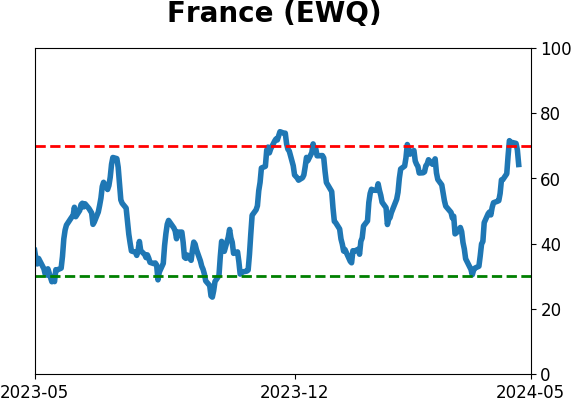
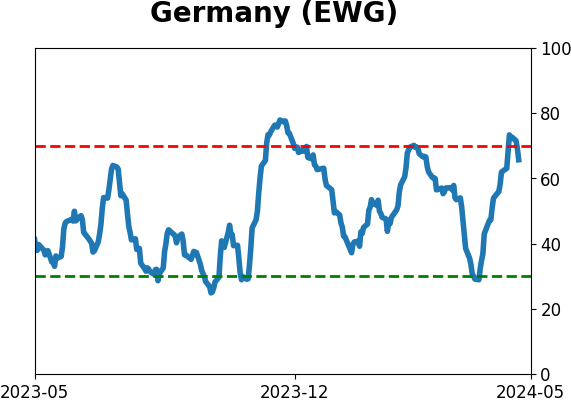
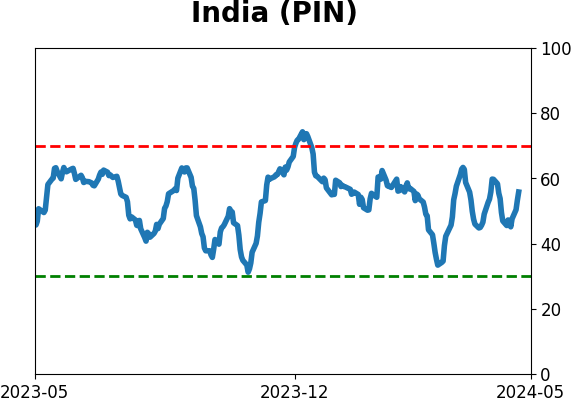
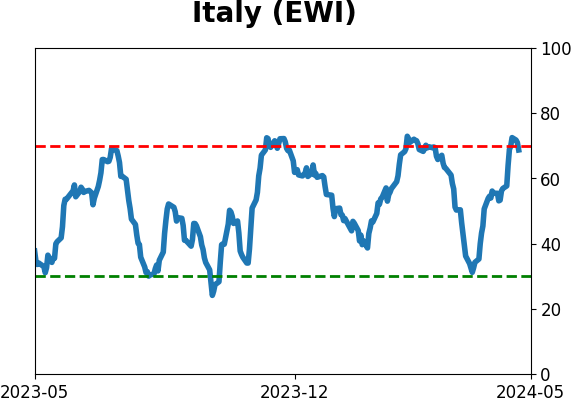
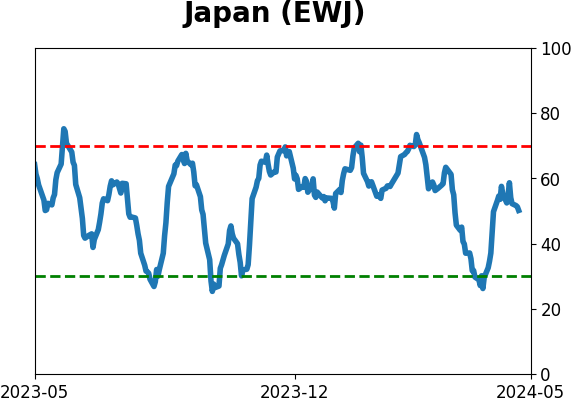
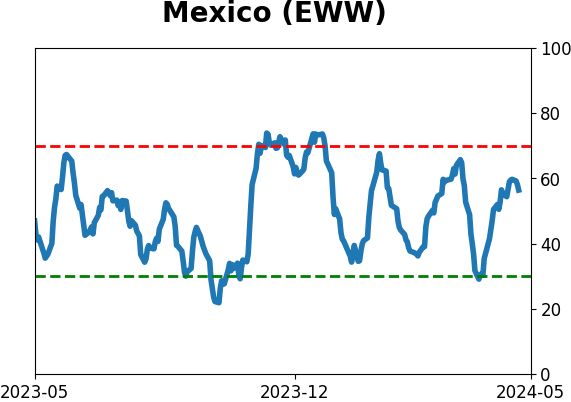
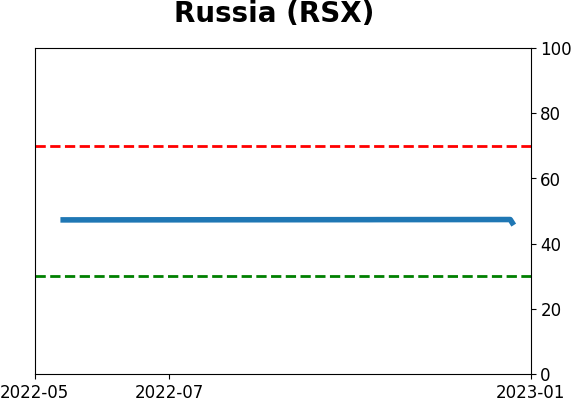
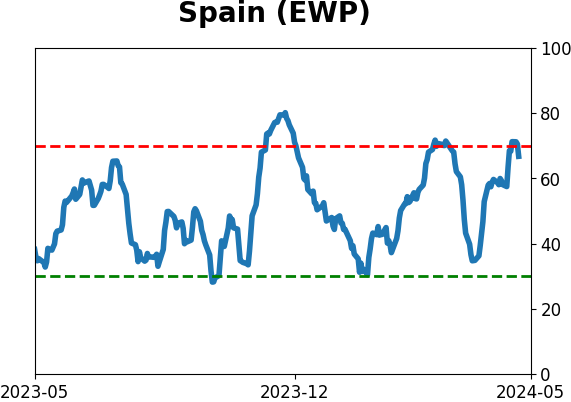
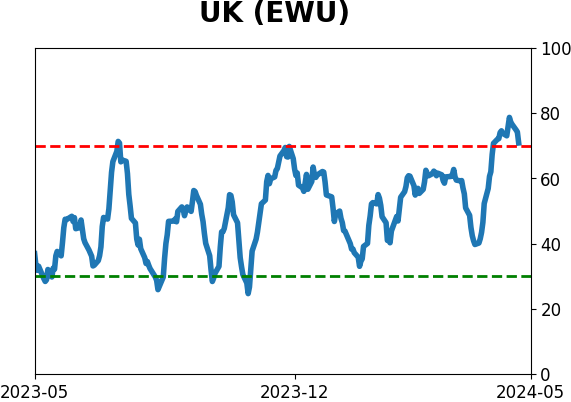
Country ETF's - 10-Day Moving Average
|
|
|
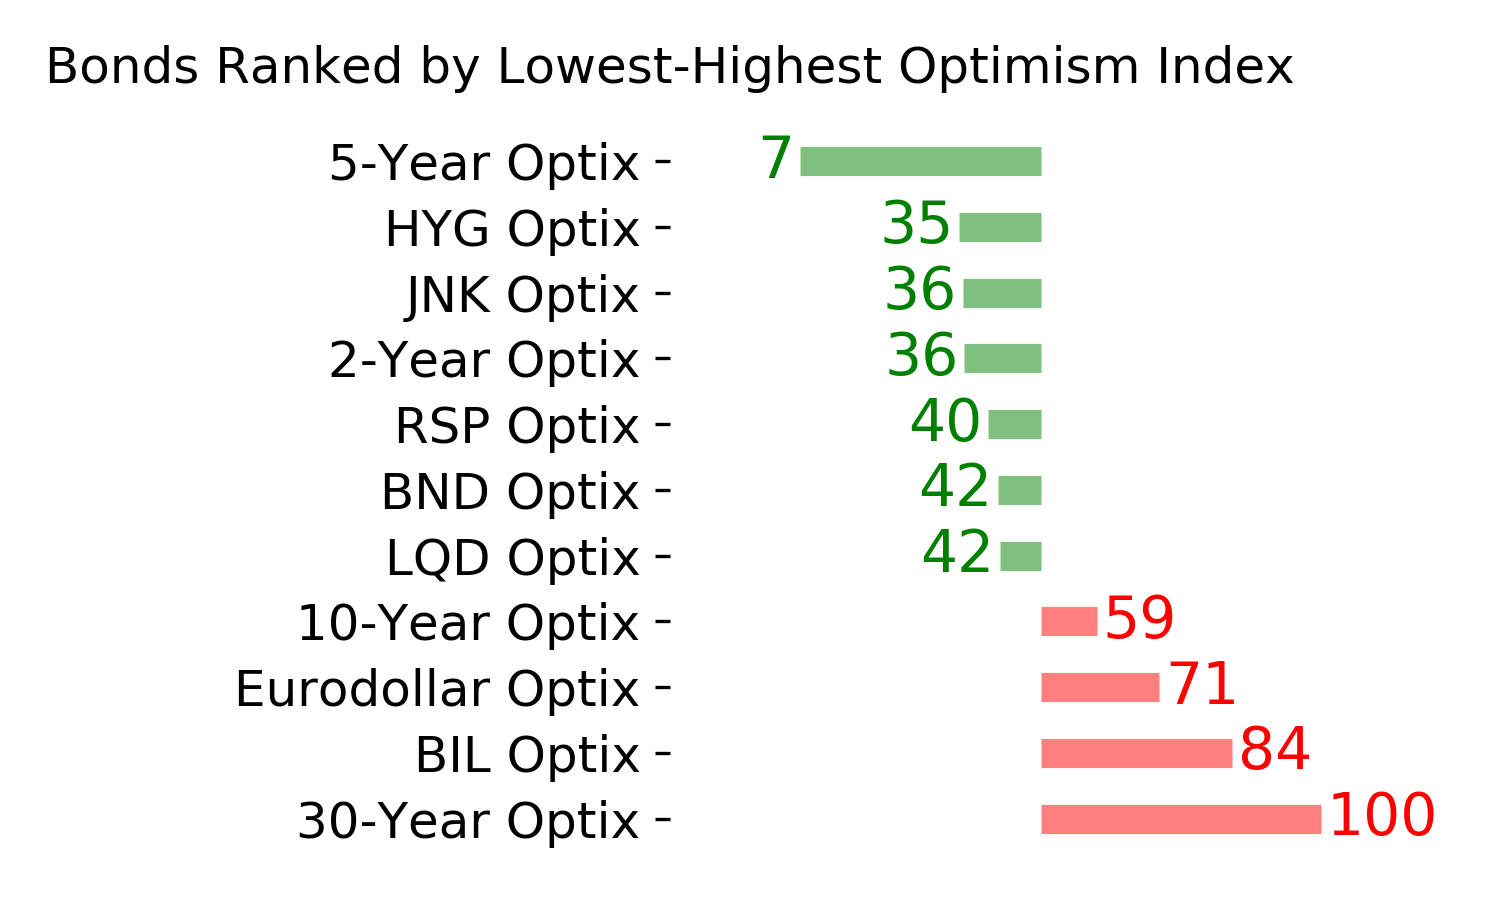
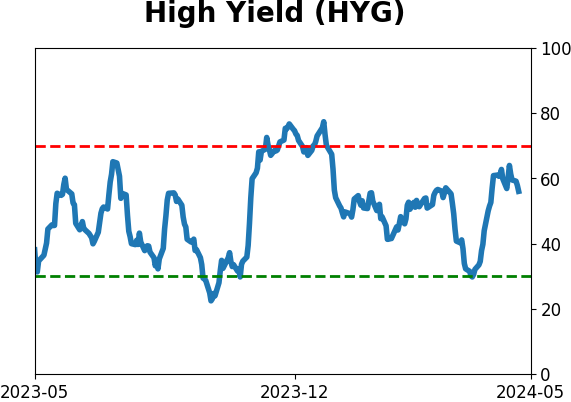
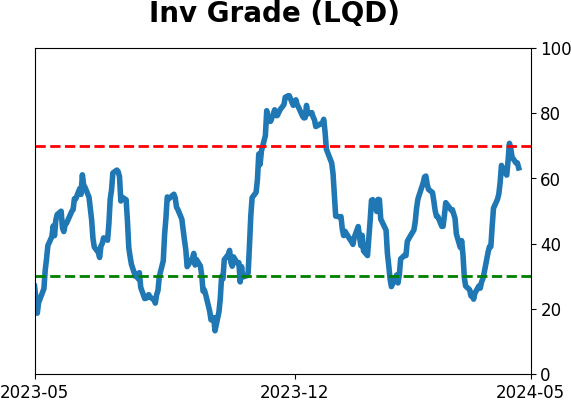
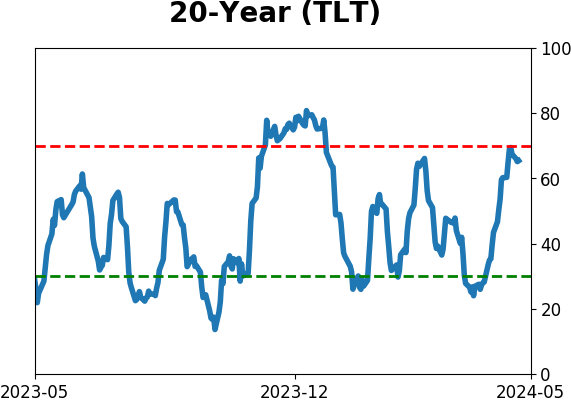
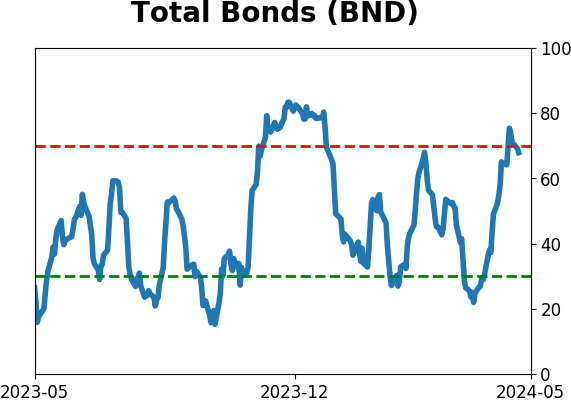
Bond ETF's - 10-Day Moving Average
|
|
|
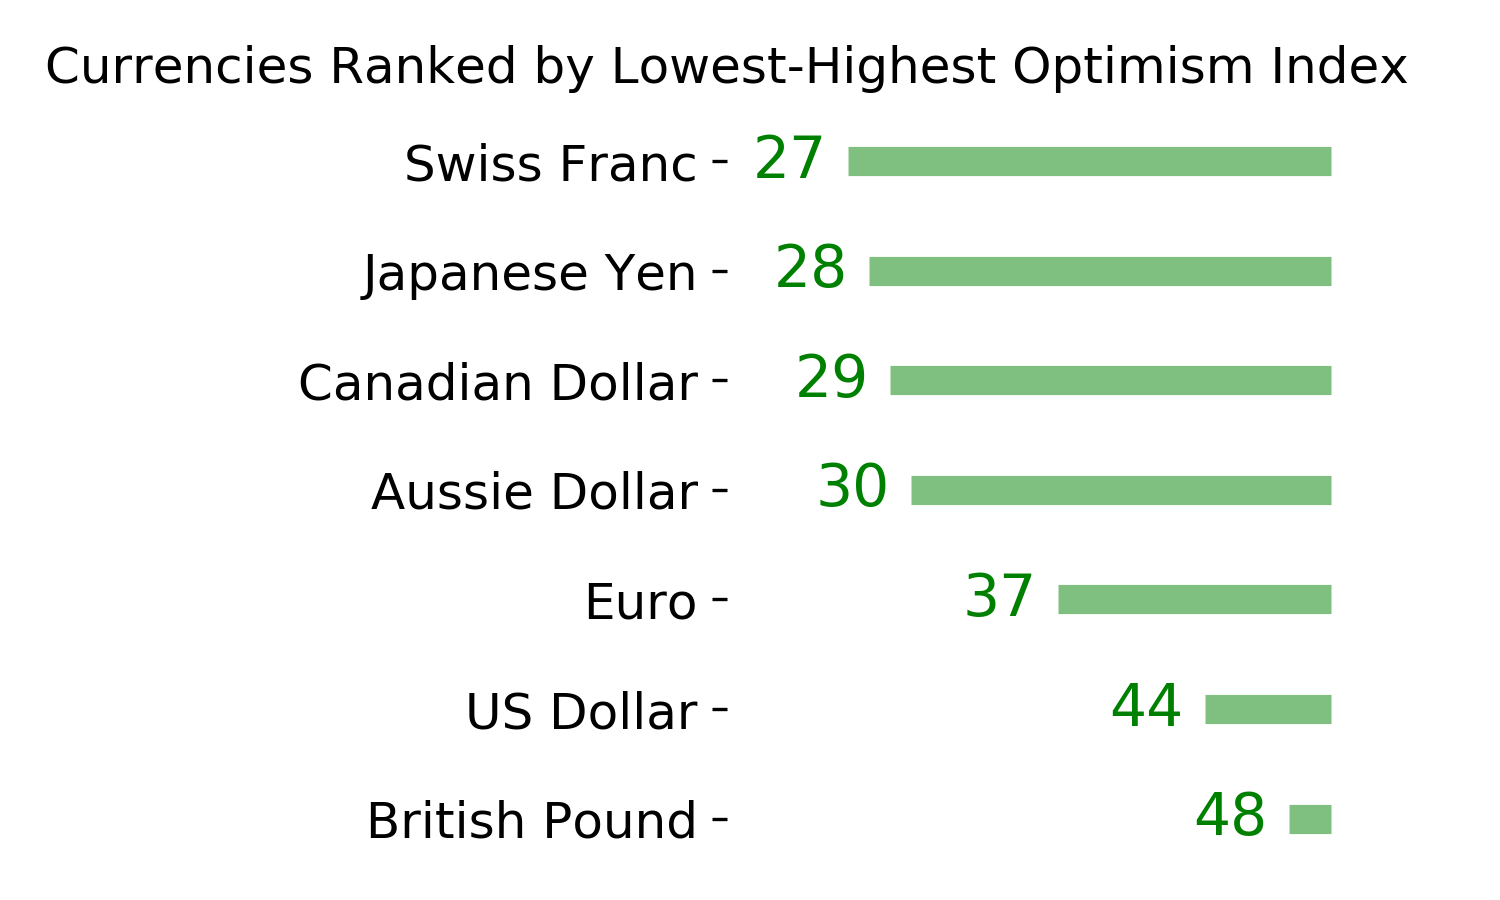
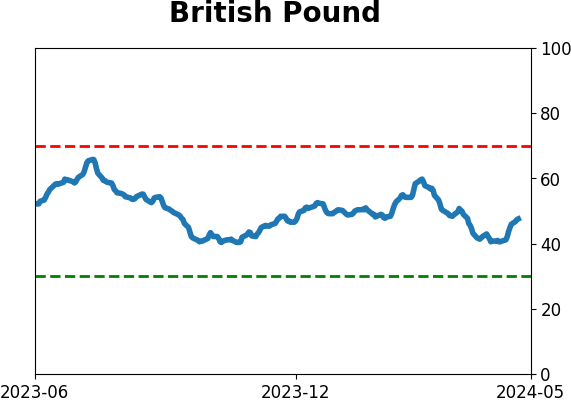
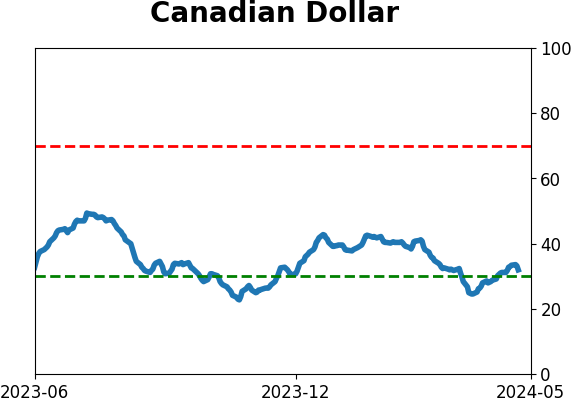
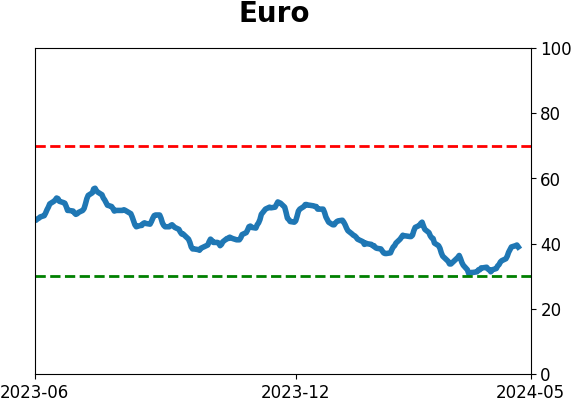
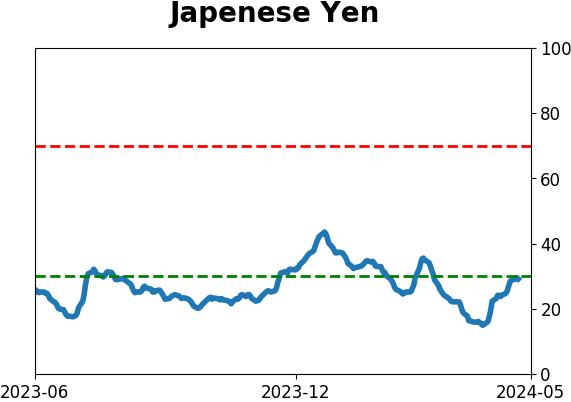
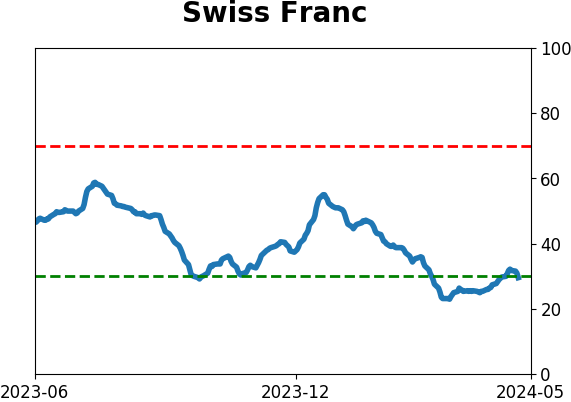
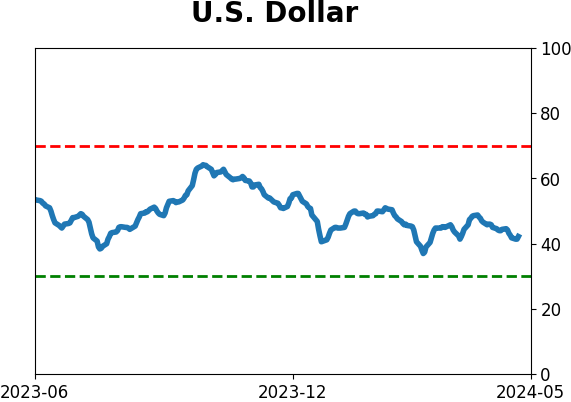
Currency ETF's - 5-Day Moving Average
|
|
|
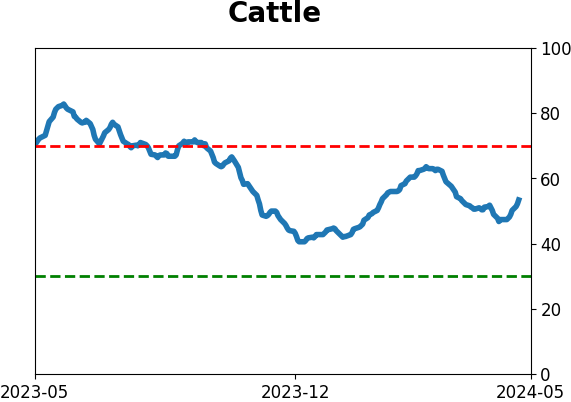
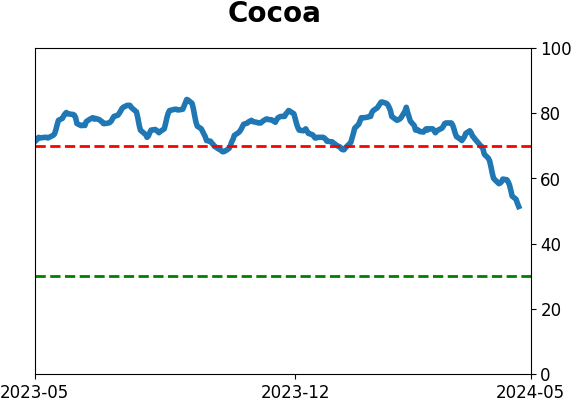
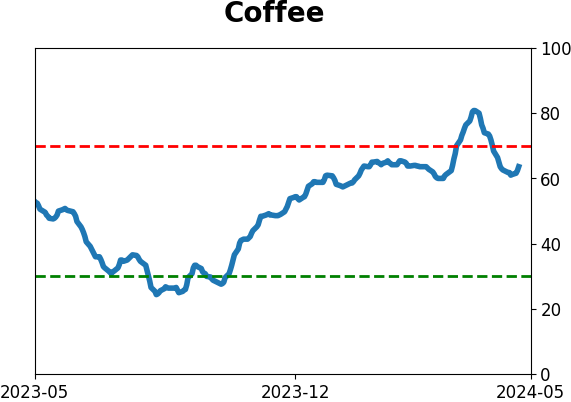
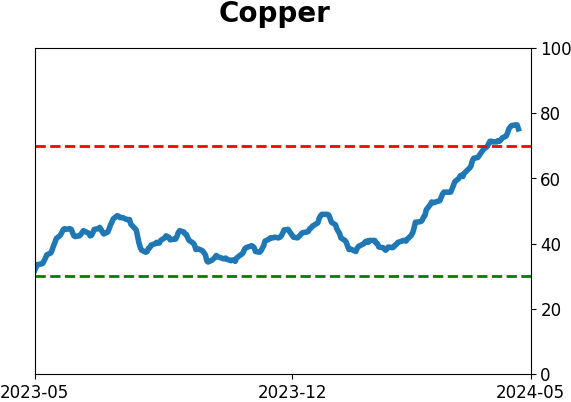
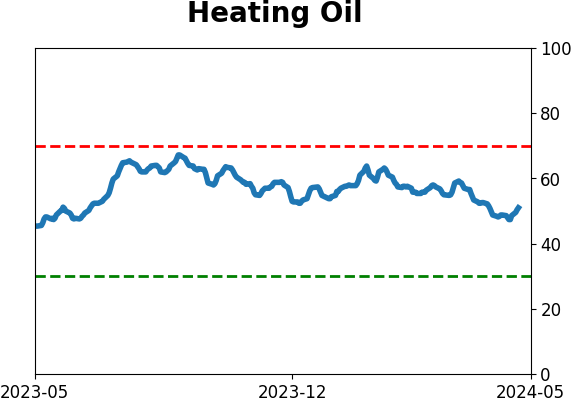
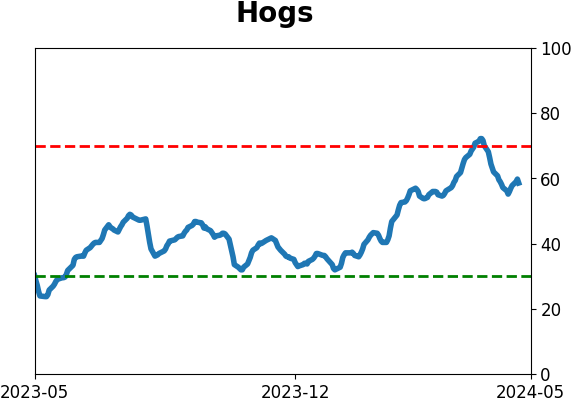
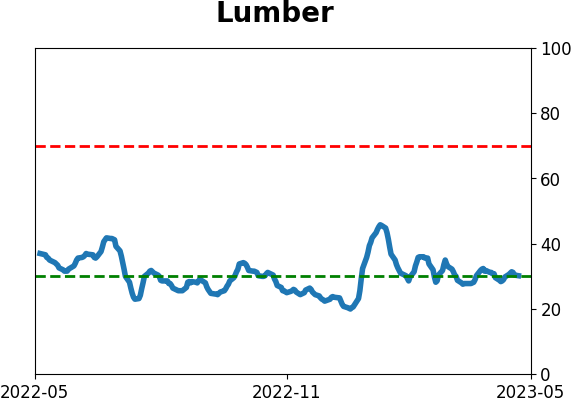
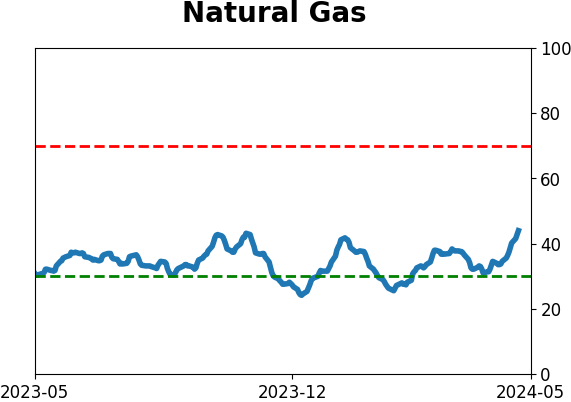
Commodity ETF's - 5-Day Moving Average
|
|