Headlines
|
|
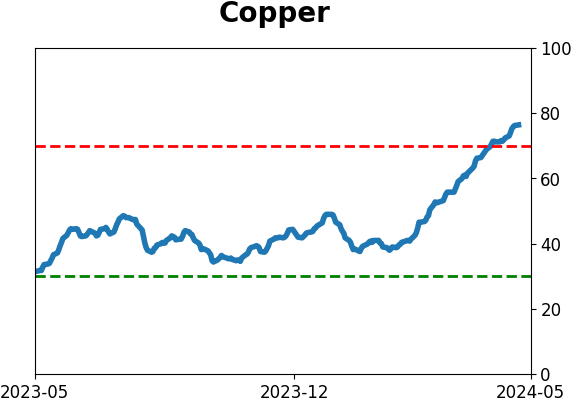
Copper's record high:
Copper prices broke out to a record high last week, which has been a good sign for further gains since 1959. Other markets mostly reacted positively to copper breakouts, especially stocks over the next couple of months. Bond prices tended to suffer, as did the U.S. dollar.
|
Smart / Dumb Money Confidence
|
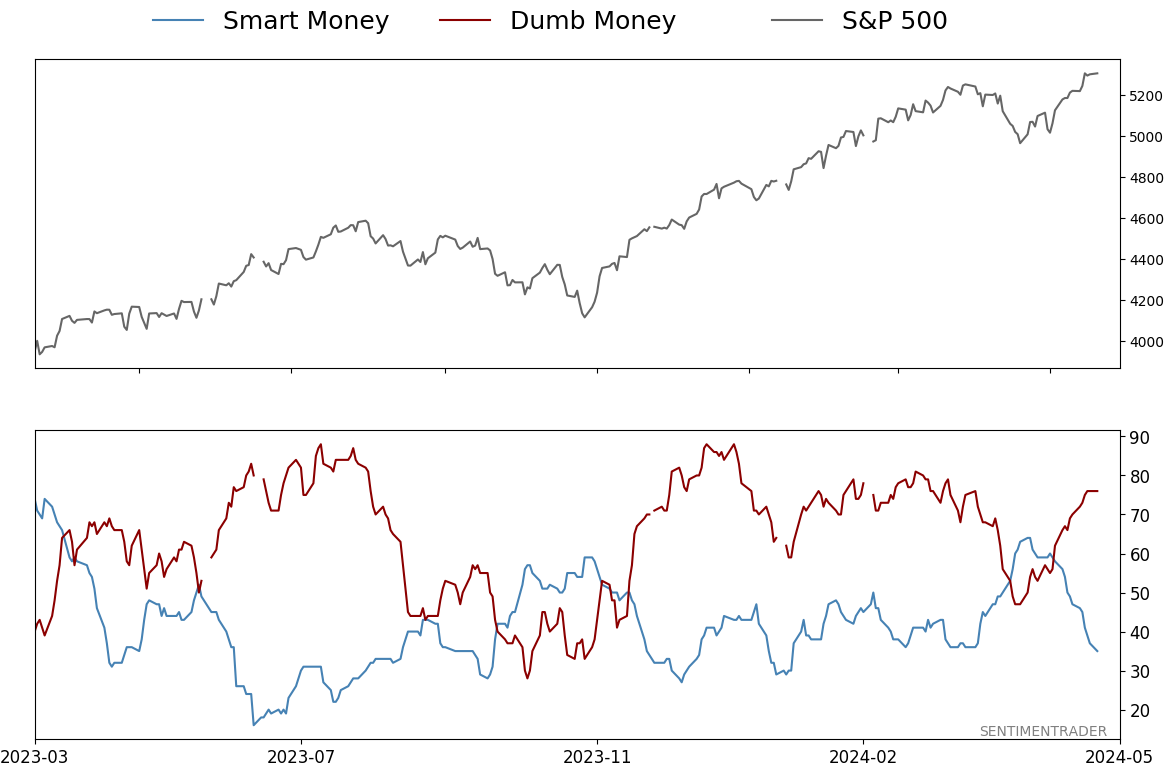
Smart Money Confidence: 35%
Dumb Money Confidence: 76%
|
|
Risk Levels
Stocks Short-Term
|
Stocks Medium-Term
|
|
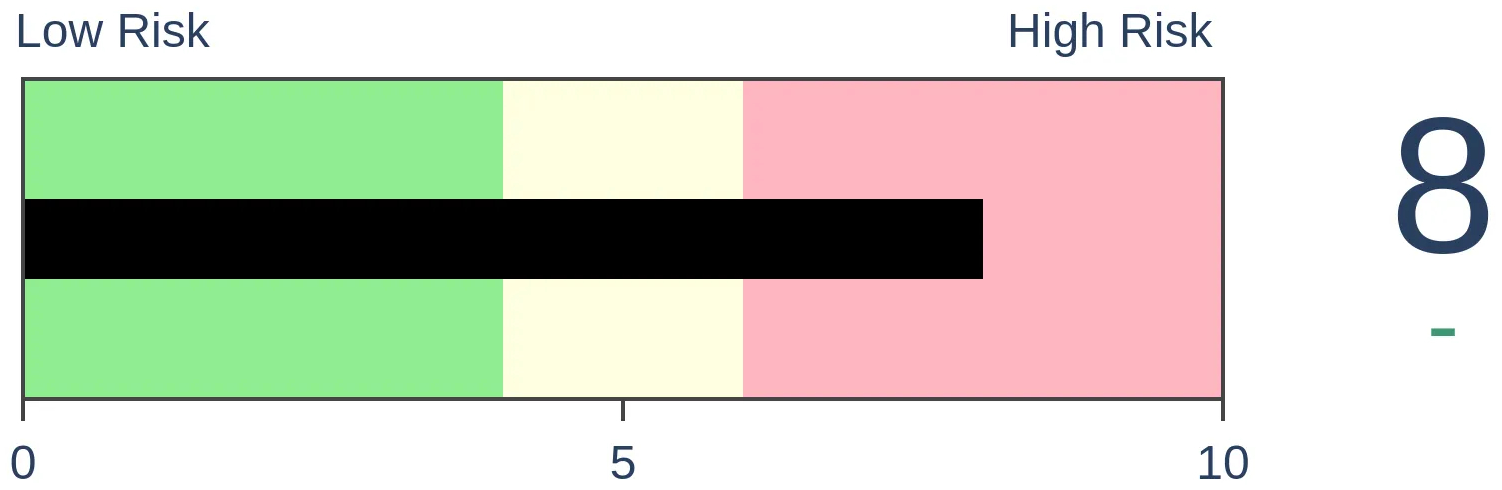
Bonds
|
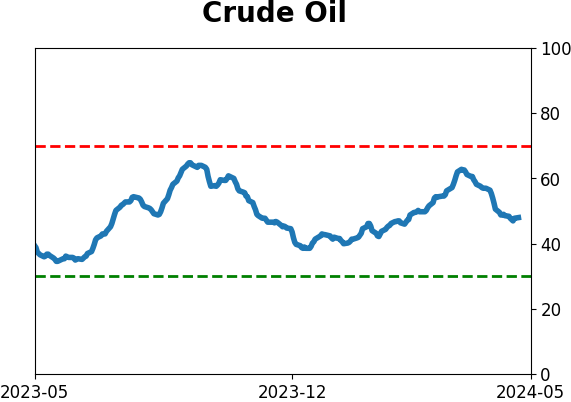
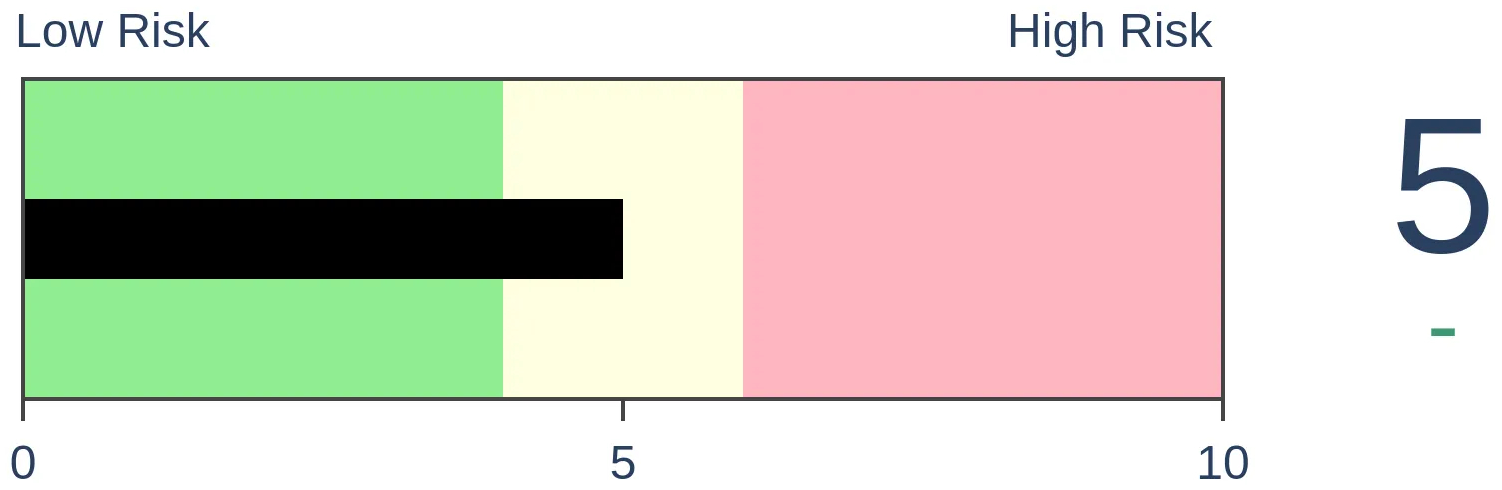
Crude Oil
|
|
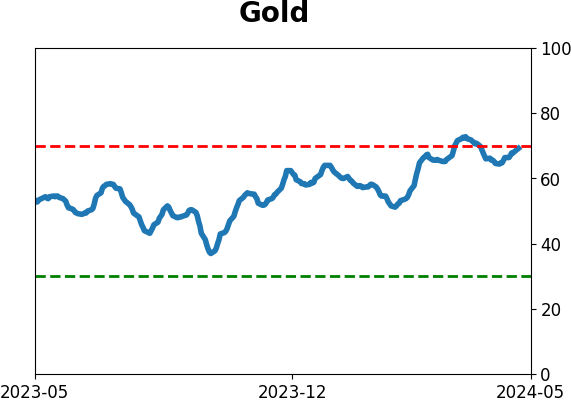
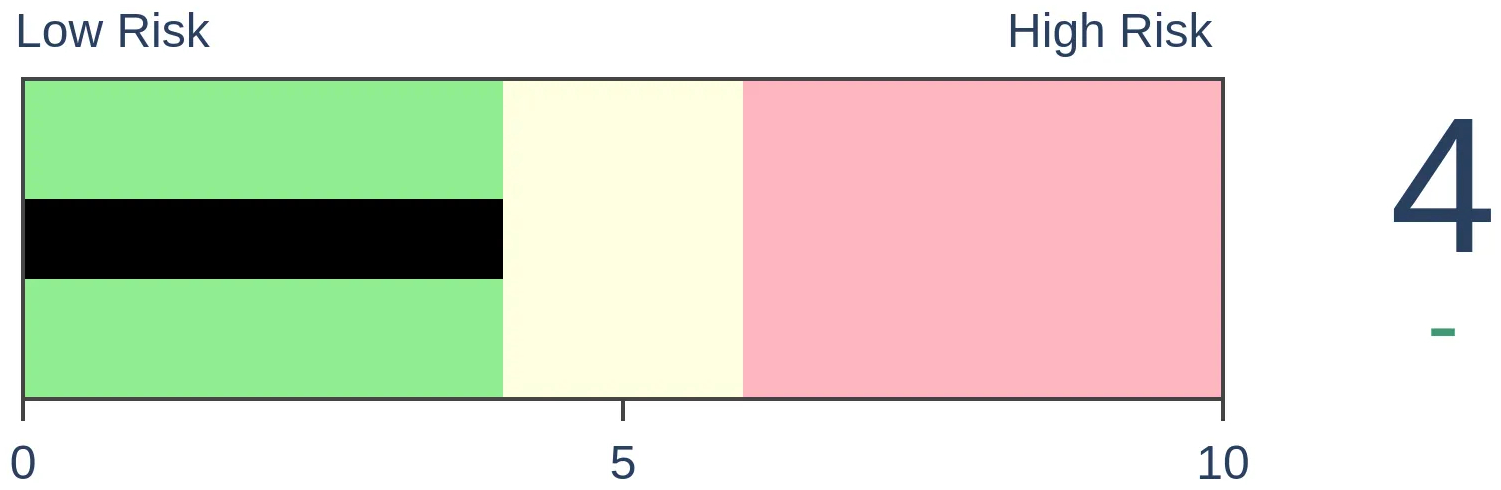
Gold
|
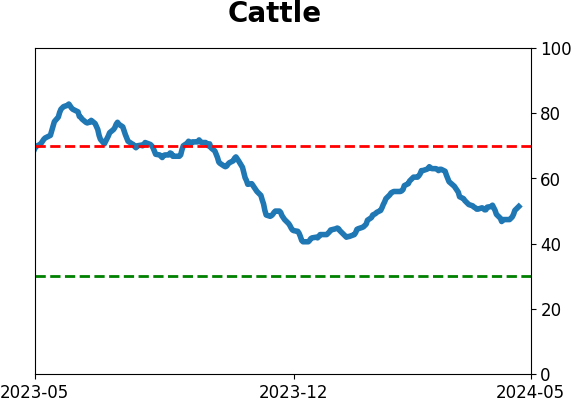
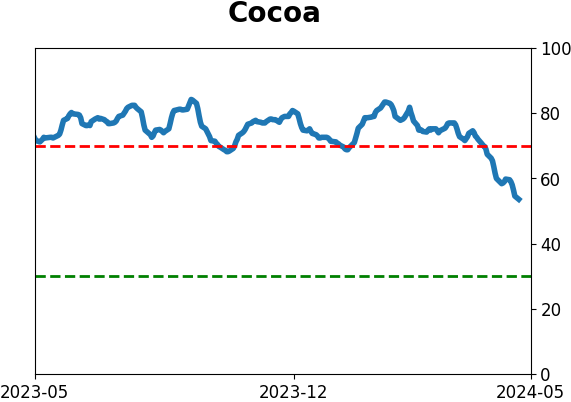
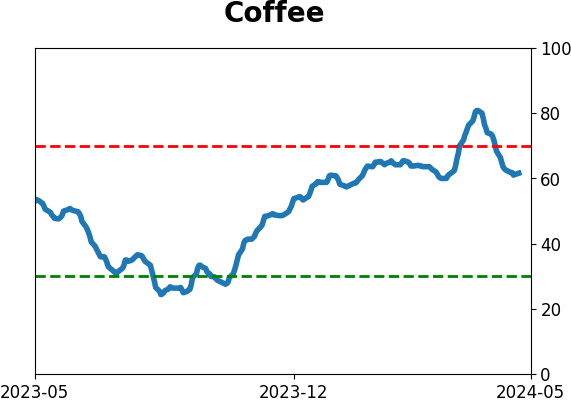
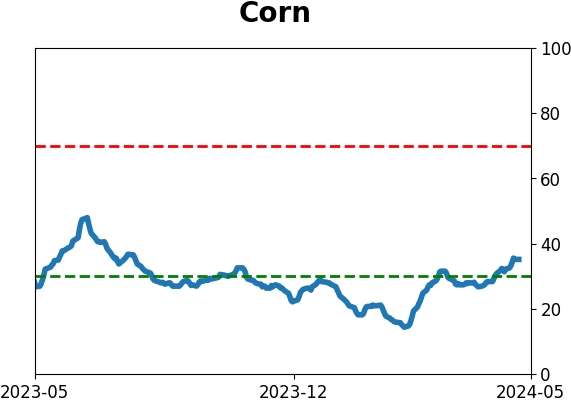
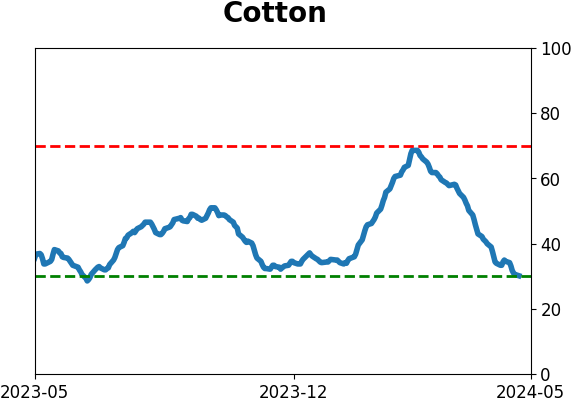
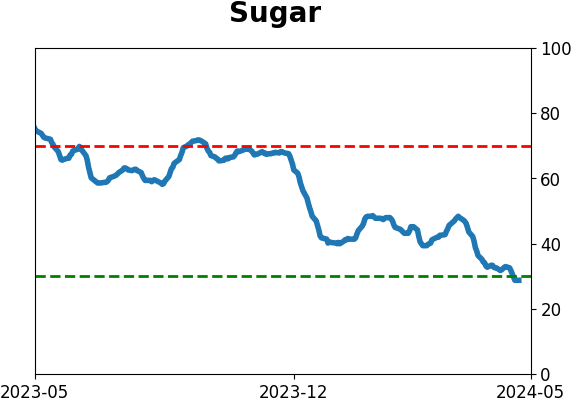
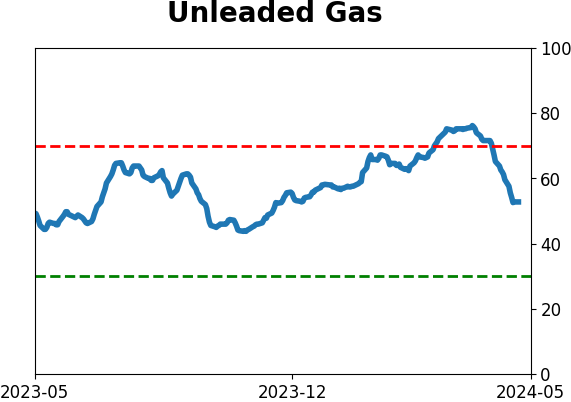
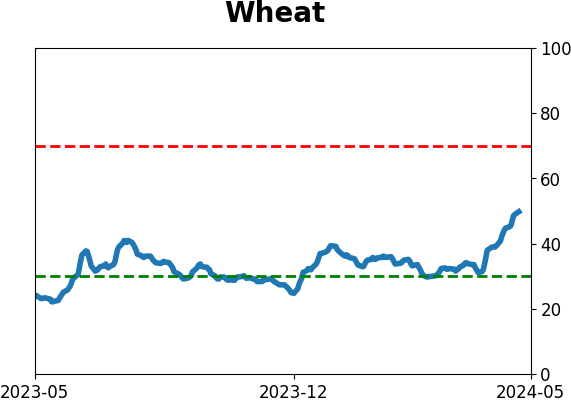
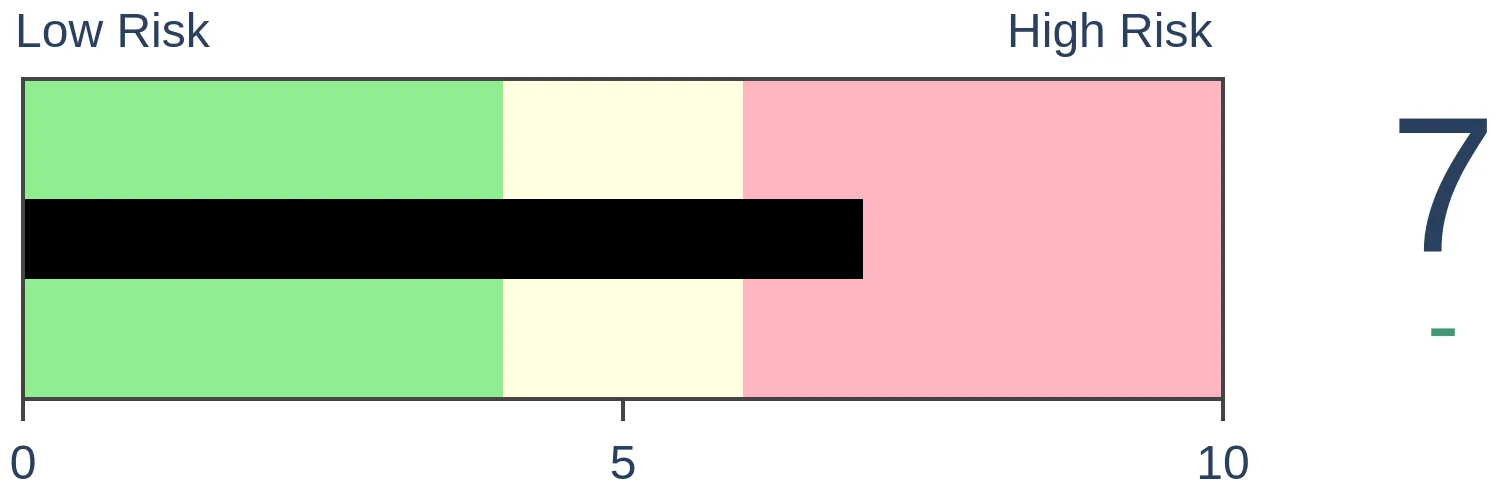
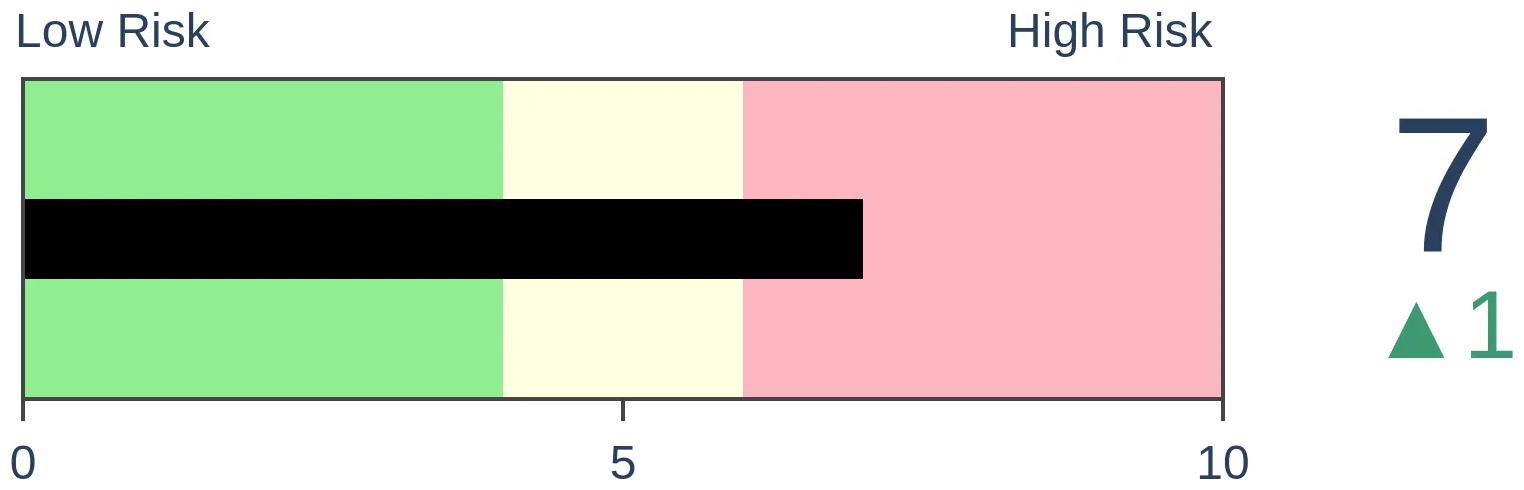
Agriculture

|
|
Research
By Jason Goepfert
BOTTOM LINE
Copper prices broke out to a record high last week, which has been a good sign for further gains since 1959. Other markets mostly reacted positively to copper breakouts, especially stocks over the next couple of months. Bond prices tended to suffer, as did the U.S. dollar.
FORECAST / TIMEFRAME
None
|
Key points:
- Copper broke out to a new multi-year (and all-time) high last week
- This is the first multi-year high in over a year, which has tended to precede further gains
- Copper breakouts were also mostly a good sign for other markets, especially stocks, but not bonds or the dollar
A massive breakout in a small market
In a market suddenly overflowing with extreme moves, copper stands out. Though relatively small (less than a third the size of the gold market), it's a global benchmark that has repercussions beyond just being something dug out of the ground.
The metal jumped in March, continued rising in April, and spurted higher once again to a new high.
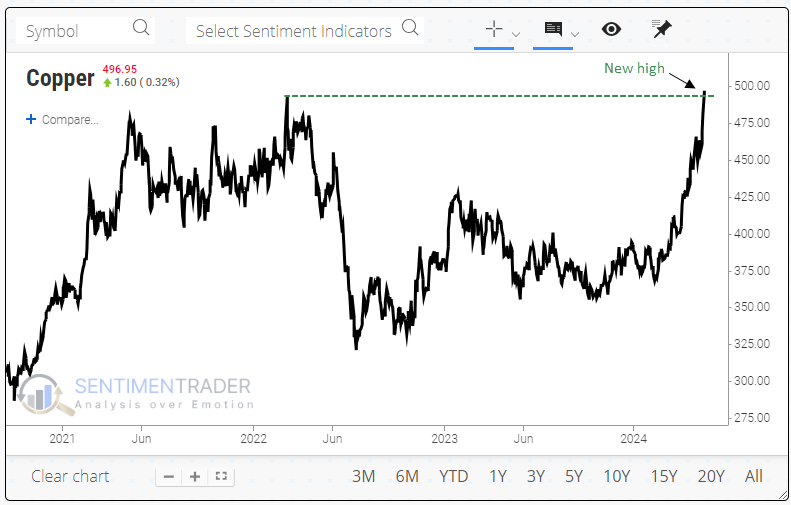
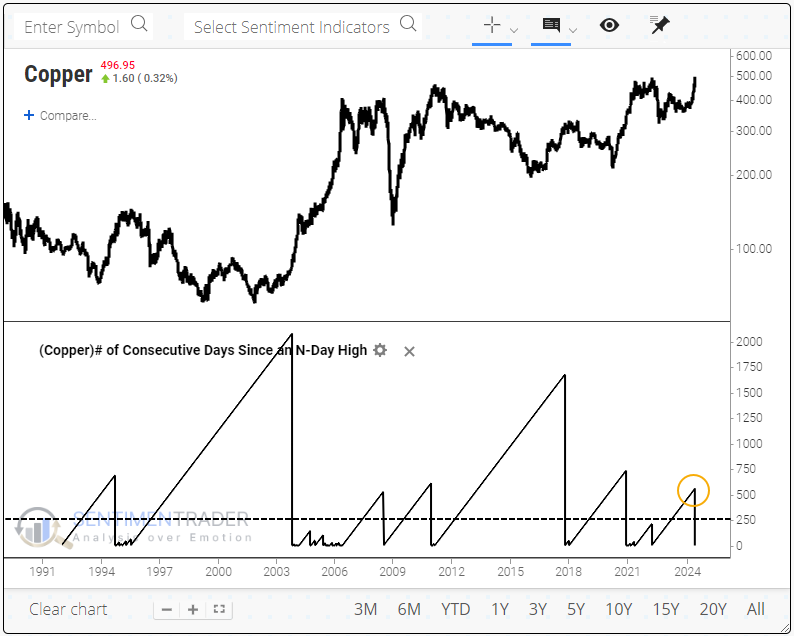
This was copper's first multi-year high in more than two years. Historically, there have only been a dozen instances when it went at least a year between making new multi-year highs.
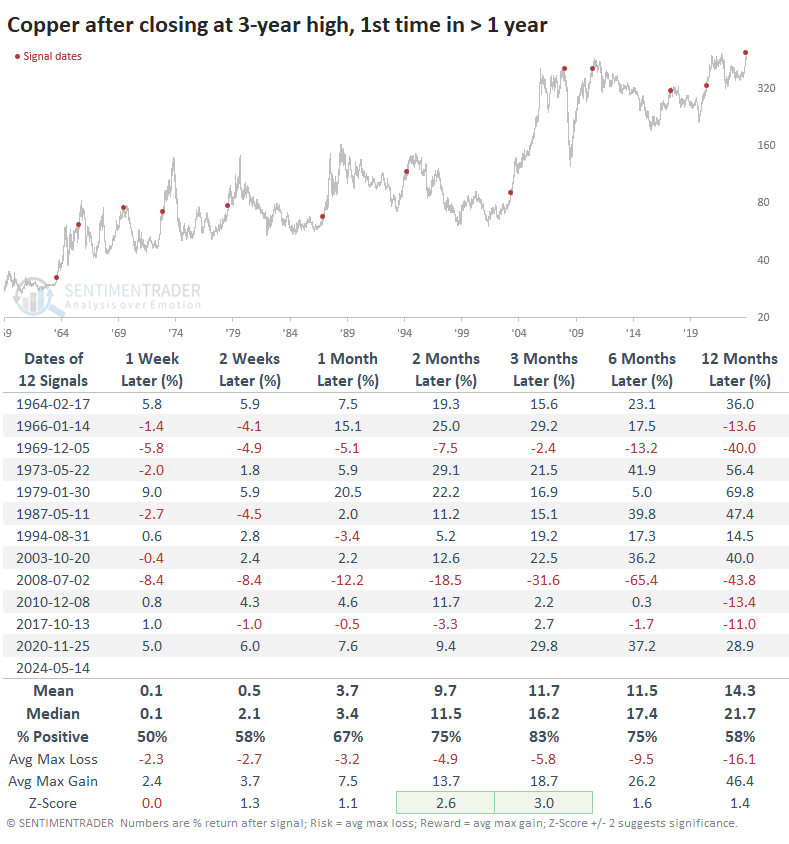
These breakouts were a decent sign for the metal itself over the medium term. During the next three months, copper added to its gains 10 times out of 12, but the exceptions were painful failures right at the peak, leading to massive declines during 1970 and 2008. One clue was that both witnessed losses of more than -5% during the first week after the breakouts, while none of the others did.
Overall, the risk versus reward over the next few months was healthy, with average drawups more than triple the average drawdowns.
Other markets mostly reacted positively
The metal's reputation as "Dr. Copper" is mixed at best.
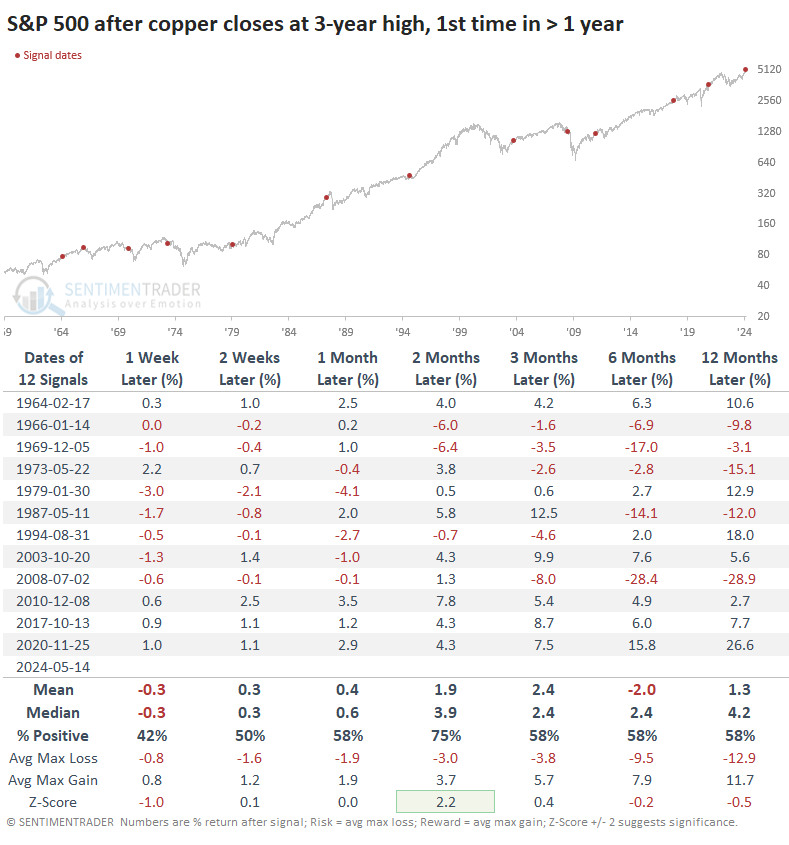
Copper breakouts led to mostly good returns for stocks, especially over the next couple of months. Its record over the past 40 years is better, though that's probably mainly due to a more persistent secular uptrend than during the 1960s and 70s.
Since the early 1980s, these copper breakouts did precede the '87 Black Monday crash, but not before the S&P 500 rallied double-digits first. And it also preceded the 2008 global financial crisis, but again, the S&P rallied a bit in the first couple of months following the copper breakout before rolling over.
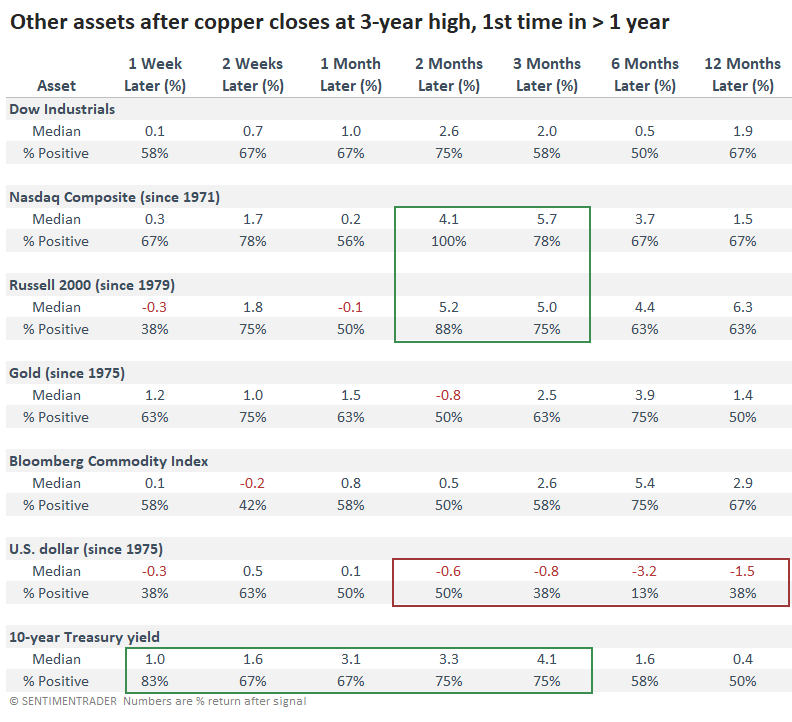
Among other indexes and assets, the Dow, Nasdaq, and Russell all mostly outperformed the S&P up to two months later, especially the Nasdaq Composite over the next two months.
These were not good signals for the U.S. dollar, which suffered losses every time but once over the next six months. And 10-year Treasury notes showed consistent losses as well (meaning yields rose), which makes sense as a breakout in copper indicates strong economic activity and the likelihood of higher interest rates. Even so, again, stocks did well over the medium term.
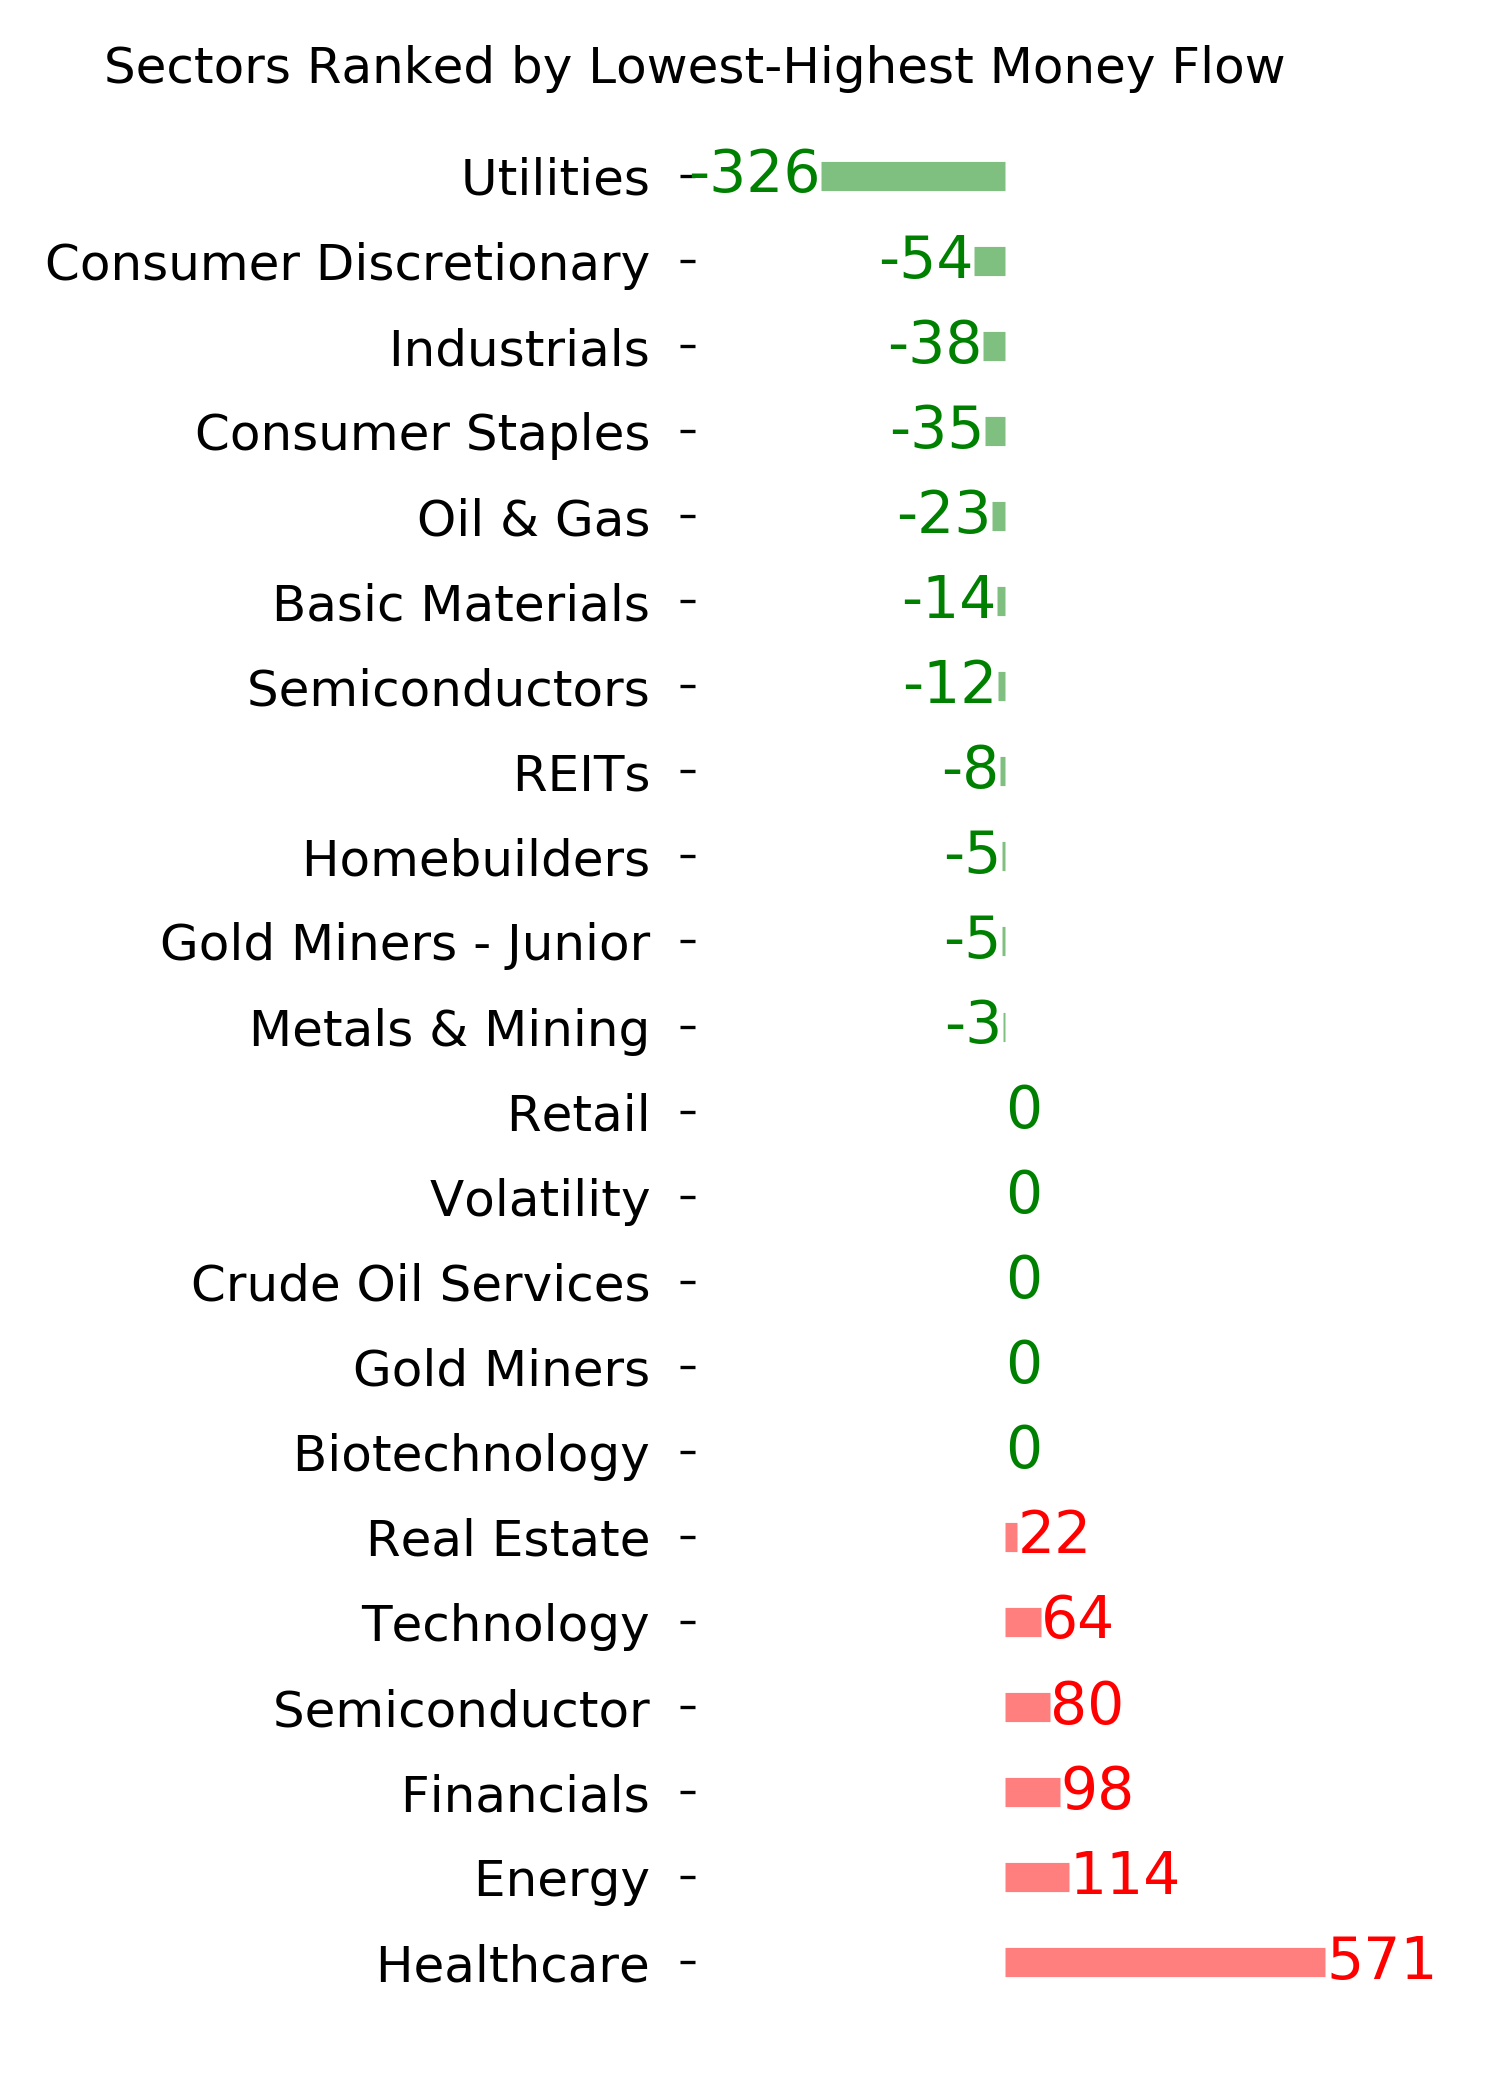
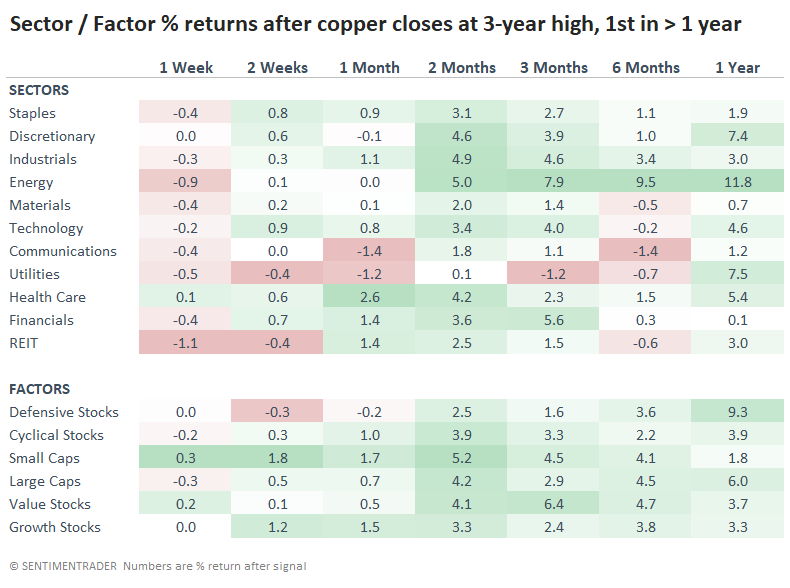
Among sectors and factors, energy stocks enjoyed some of the strongest returns across time frames. It was the only one showing an average double-digit median return over the following year. Utilities suffered the worst returns across most time frames, likely due to the tendency to see higher interest rates. Small-cap stocks enjoyed a short- to medium-term boost, likely due to investors' improved confidence that high copper prices suggested improved economic activity.
What the research tells us...
Trend followers have jumped firmly on the uptrend in copper, with speculators betting heavily that further gains are in store. That worked well for them in 2020-21, but historically, the copper market has been exceptionally cruel to specs when they load the boat on net long positions. Between that, copper's tendency to rest after a breakout, and some poor early summer seasonal tendencies, the metal's risk looks relatively high right now.
The message for other markets is mostly positive for stocks, especially "riskier" areas like small caps and technology. However, this is hard to square because it also tended to precede a short- to medium-term jump in interest rates. These copper breakouts were not a good sign for the dollar over more extended time frames.
Indicators at Extremes
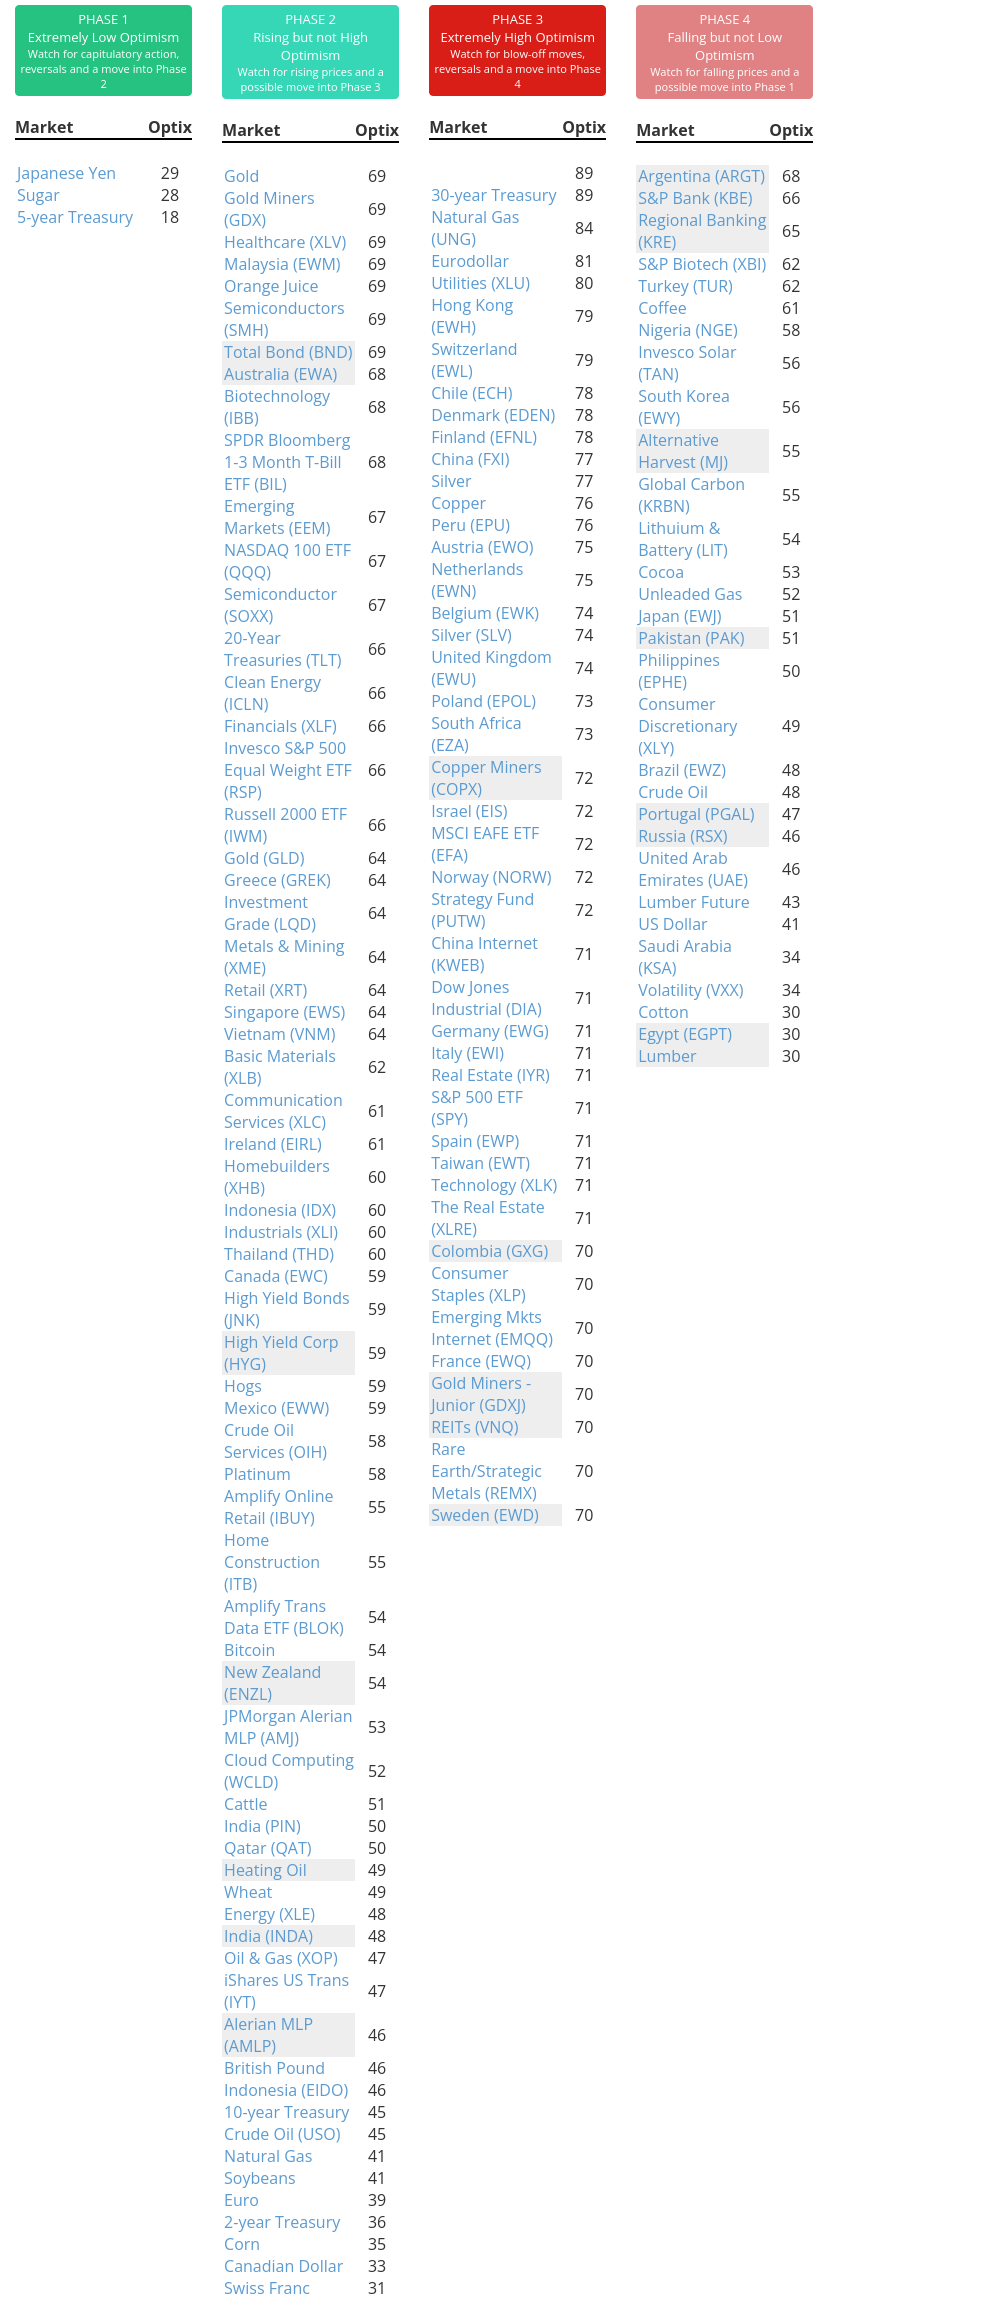
Phase Table
Ranks
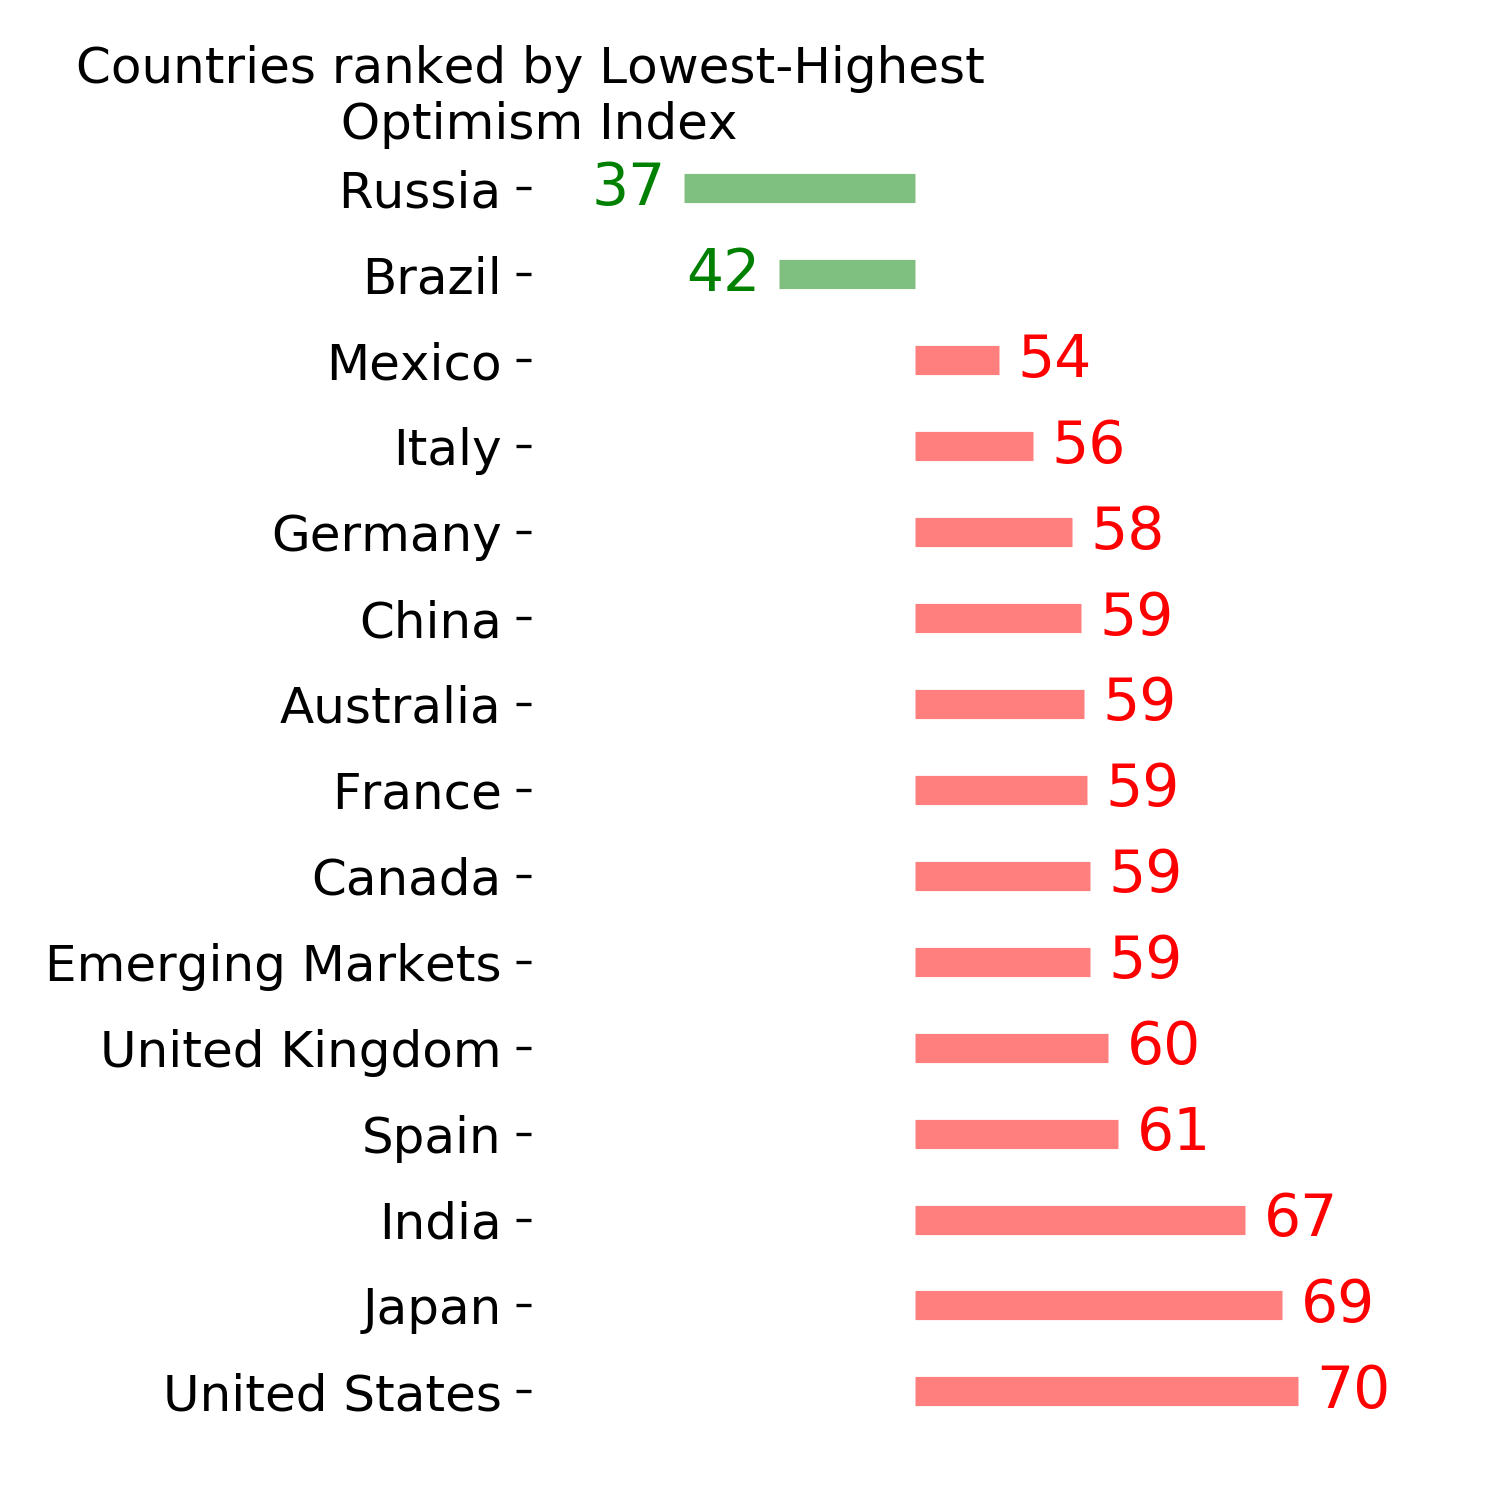
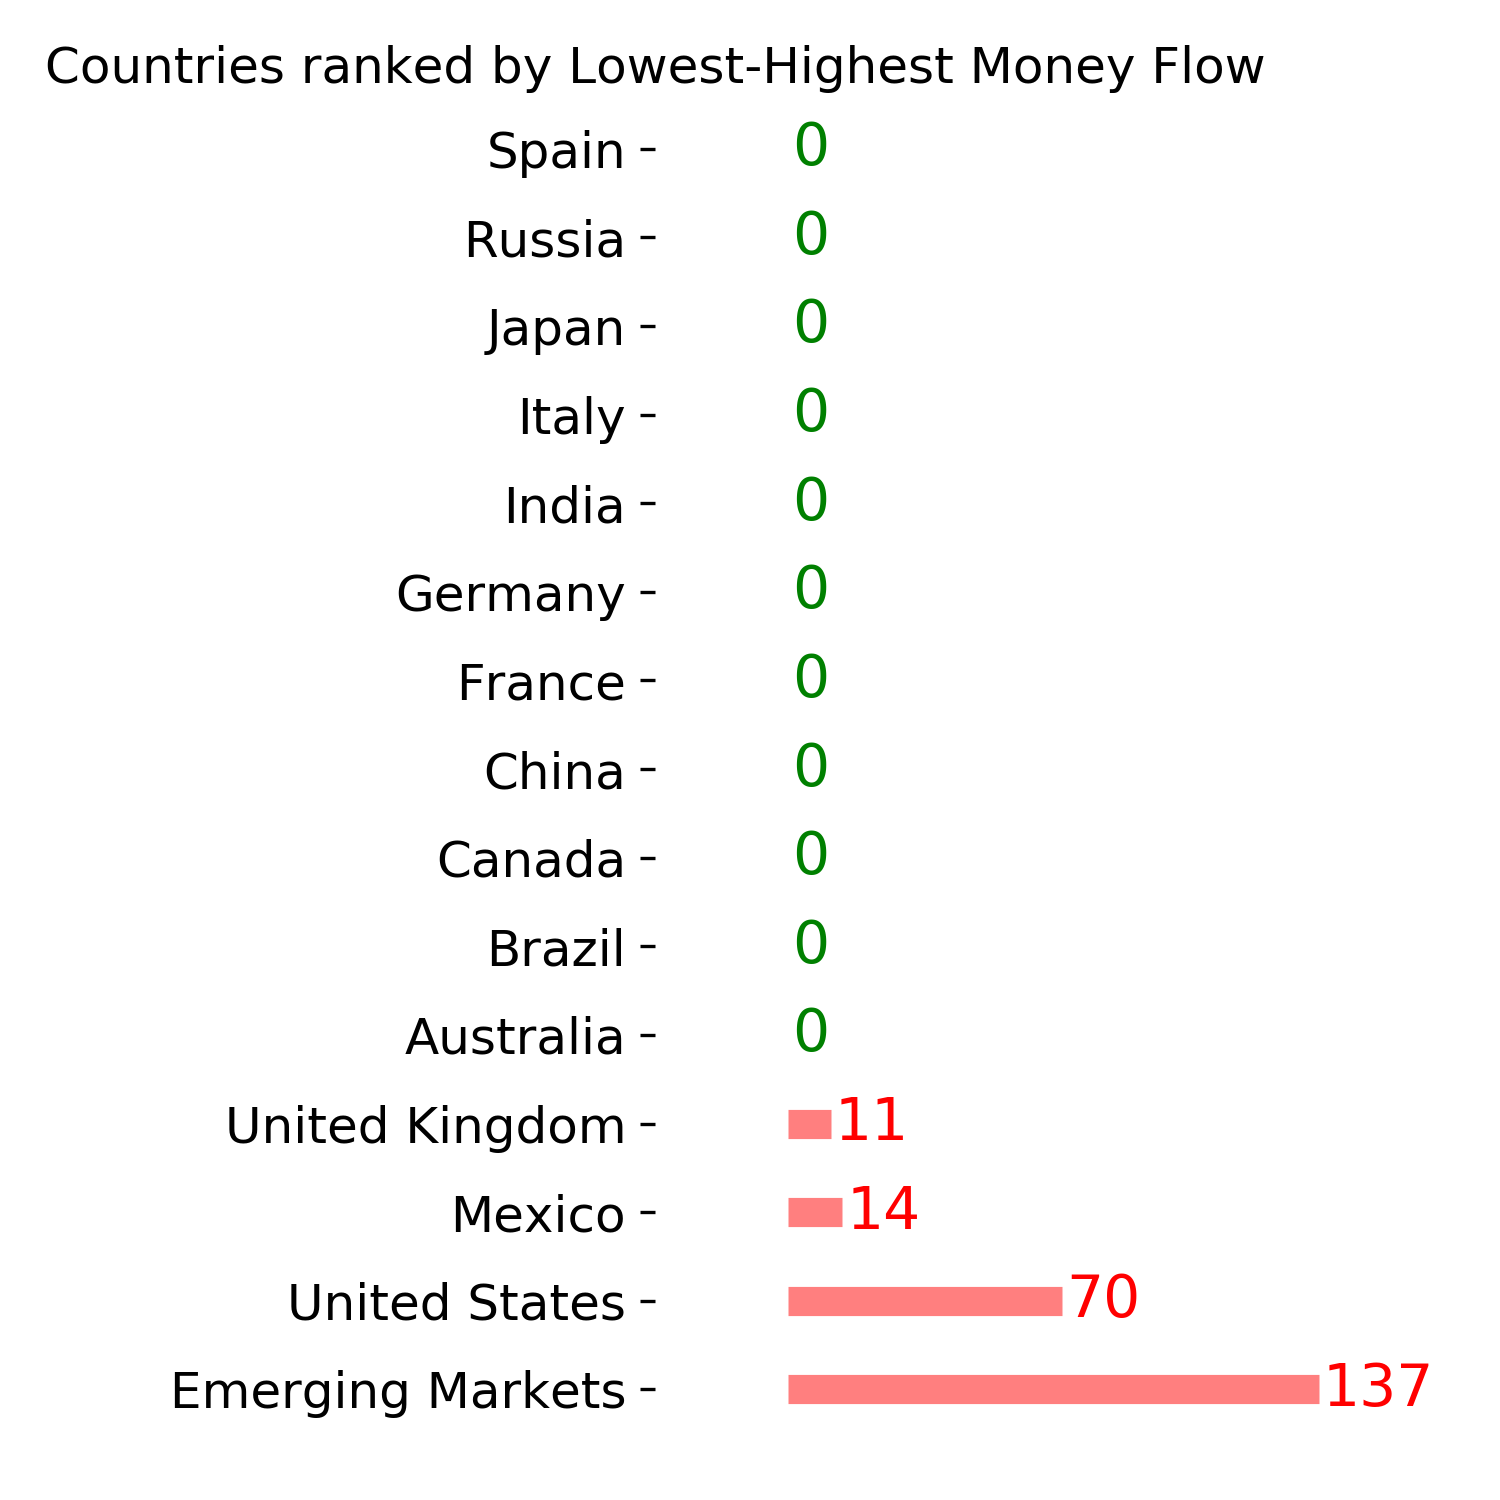
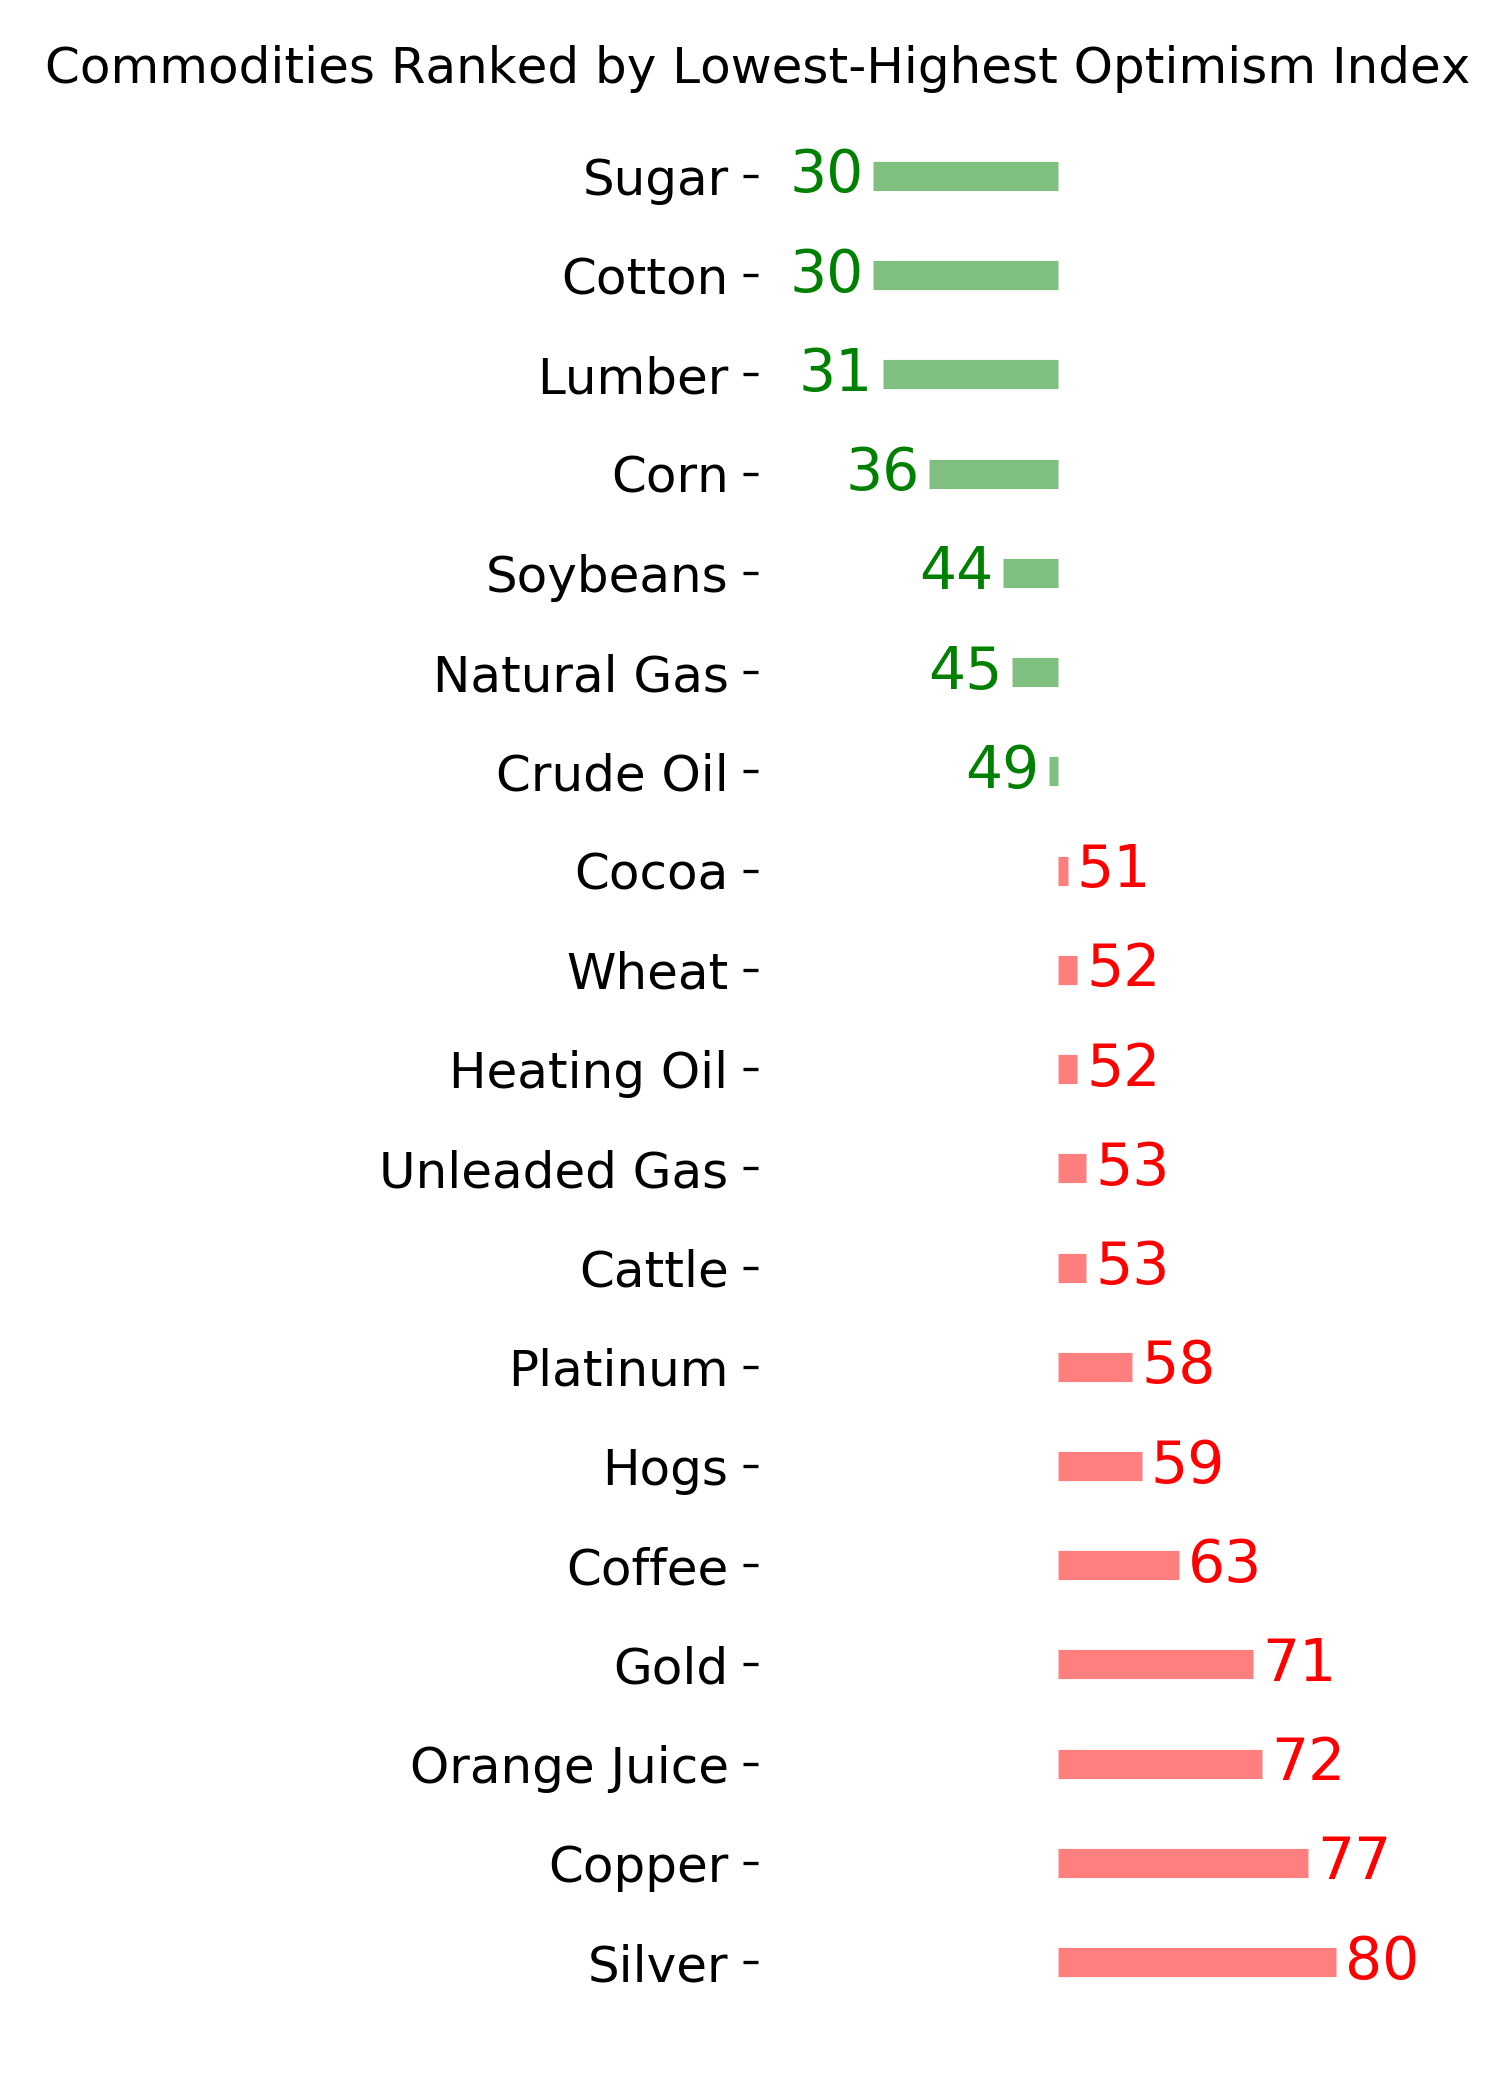
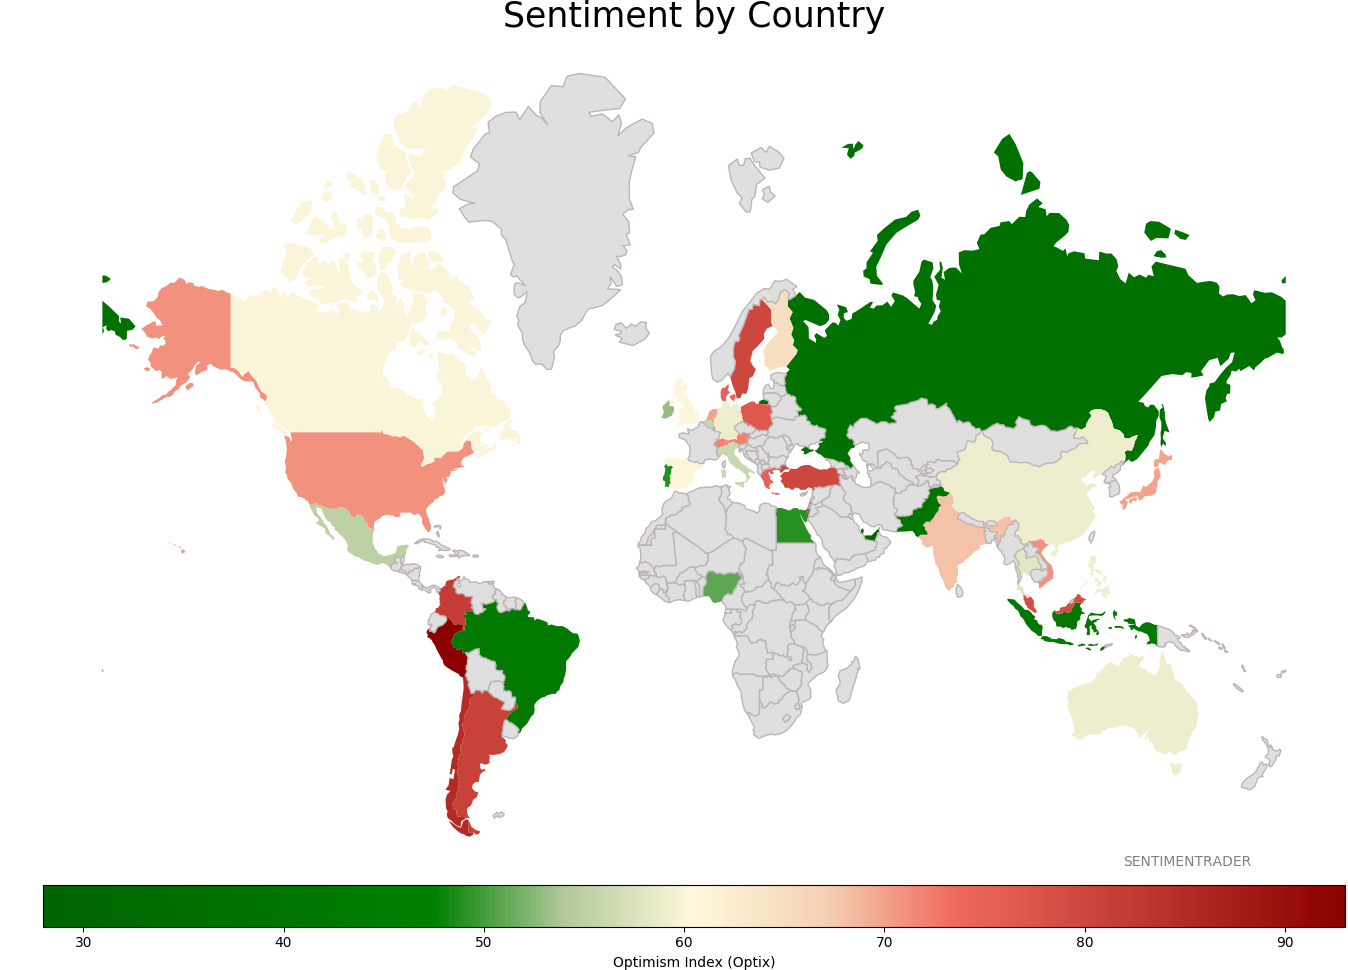
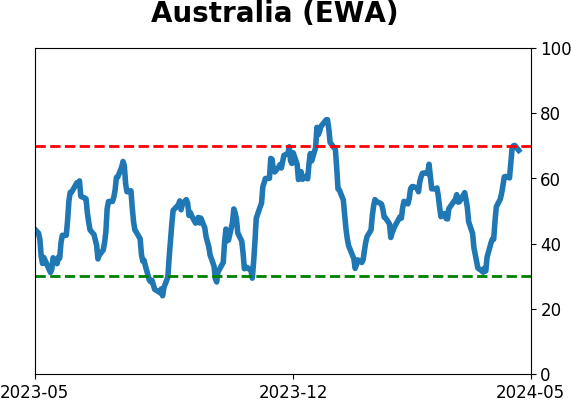
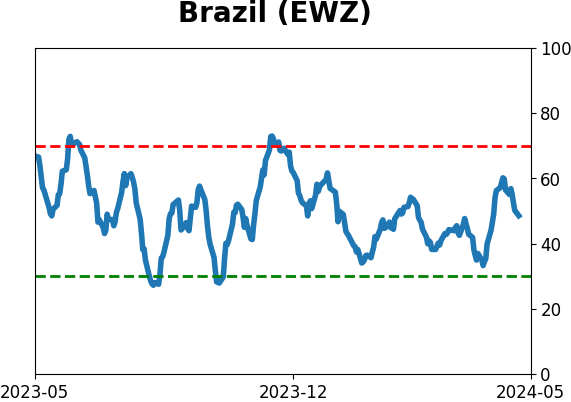
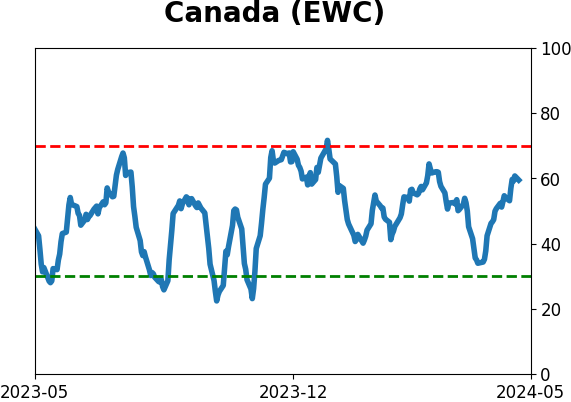
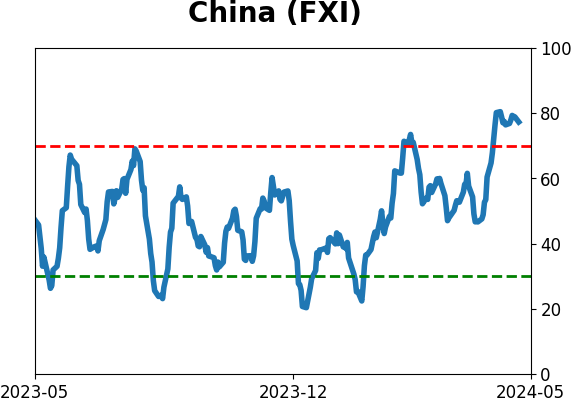
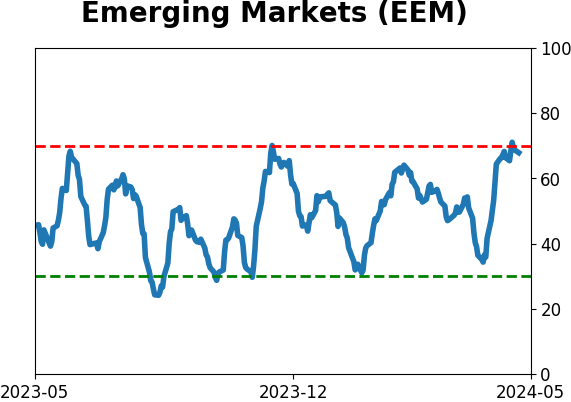
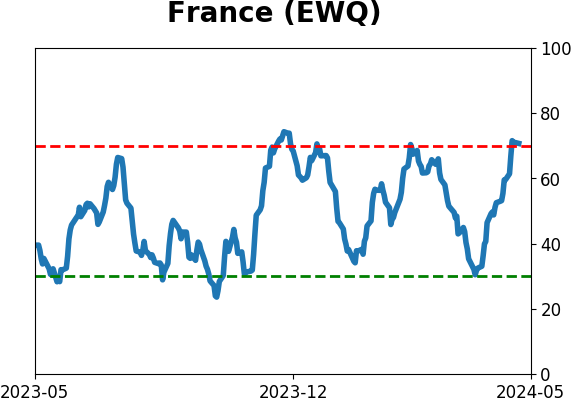
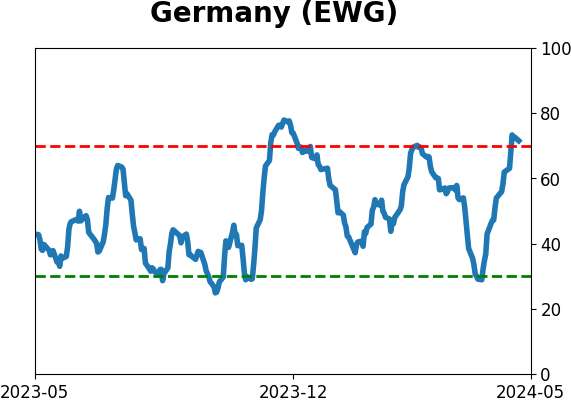
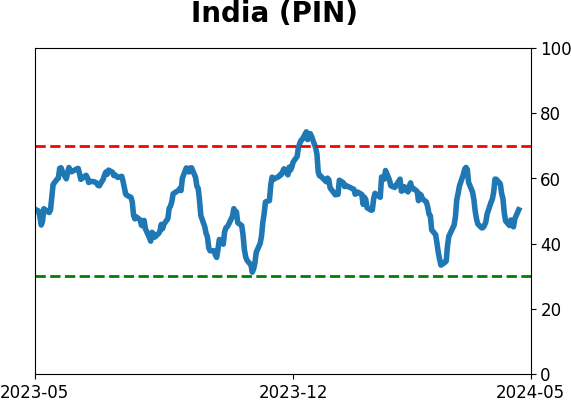
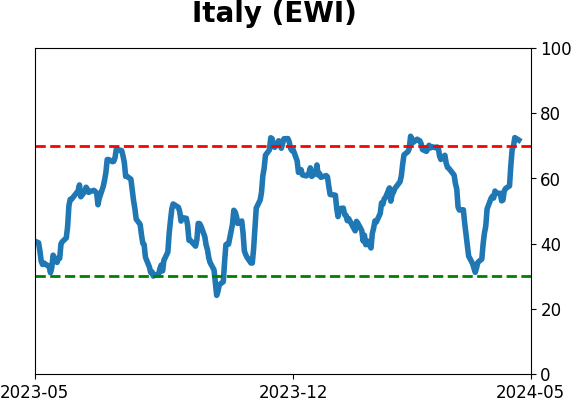
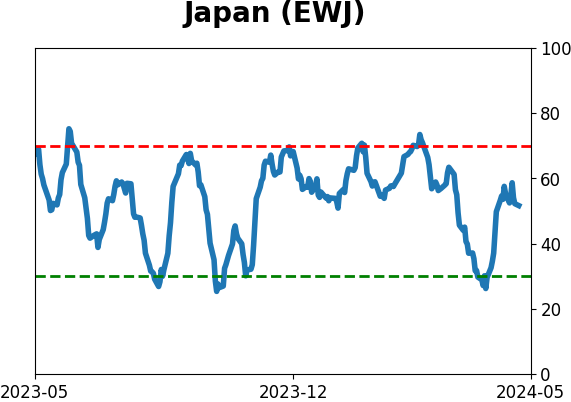
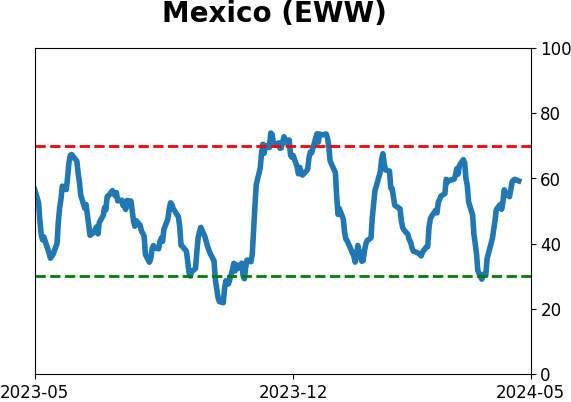
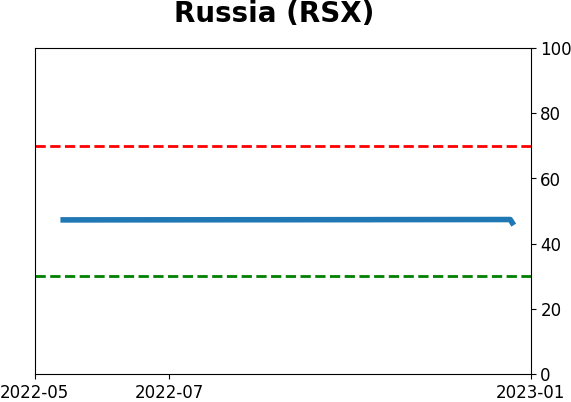
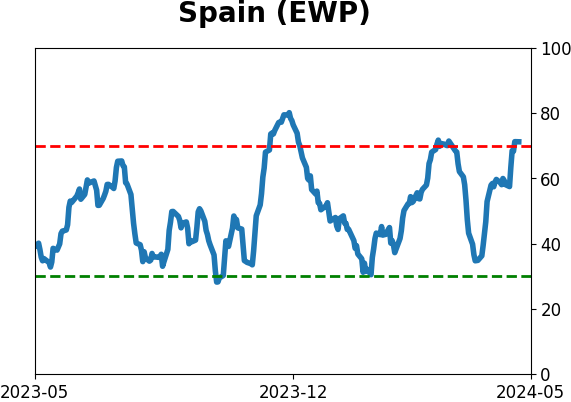
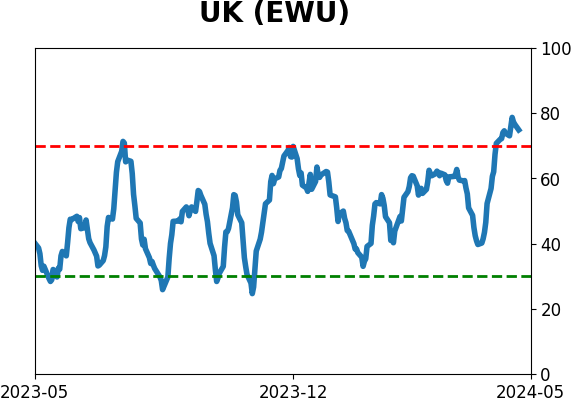
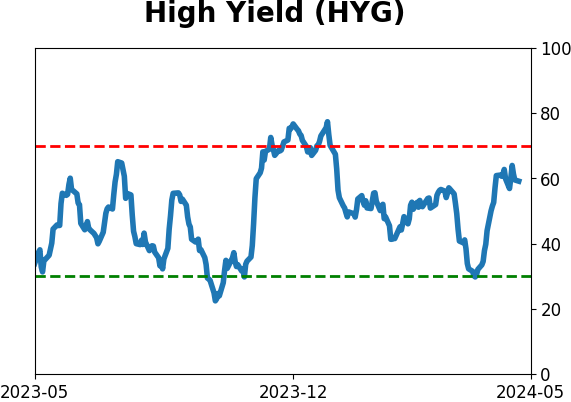
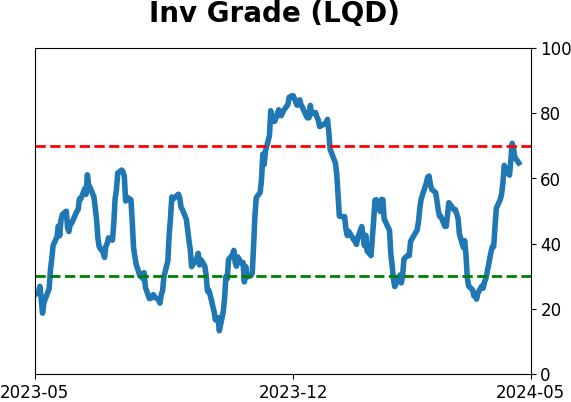
Sentiment Around The World
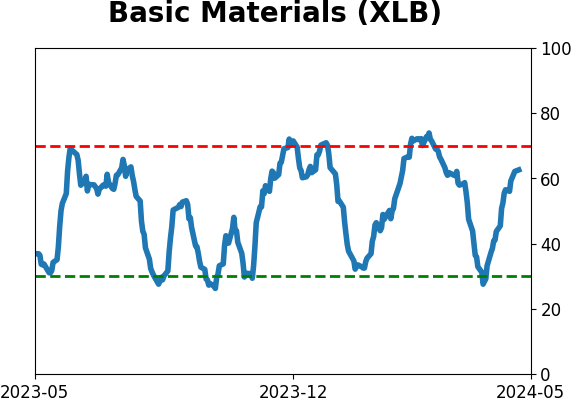
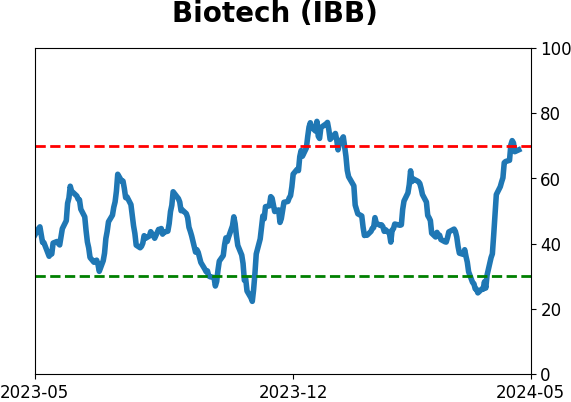
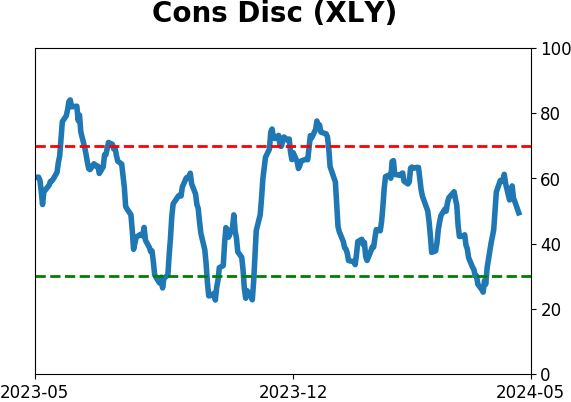
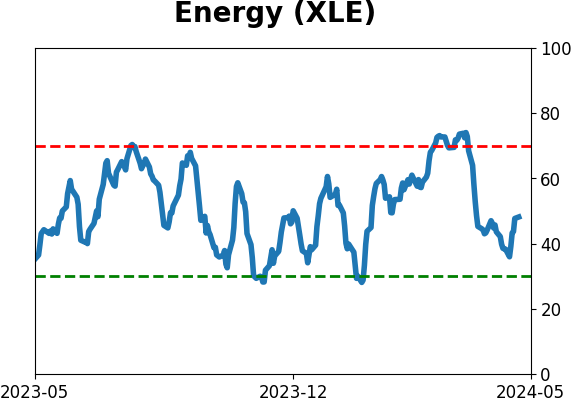
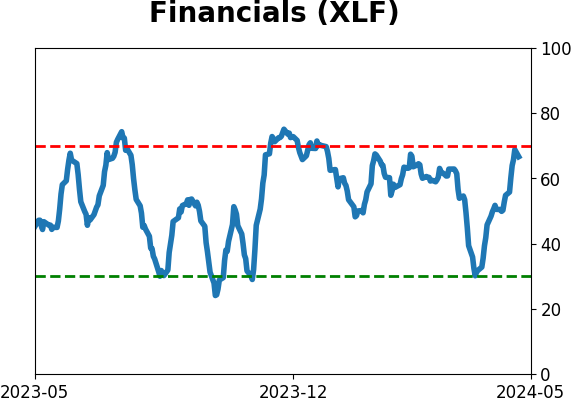
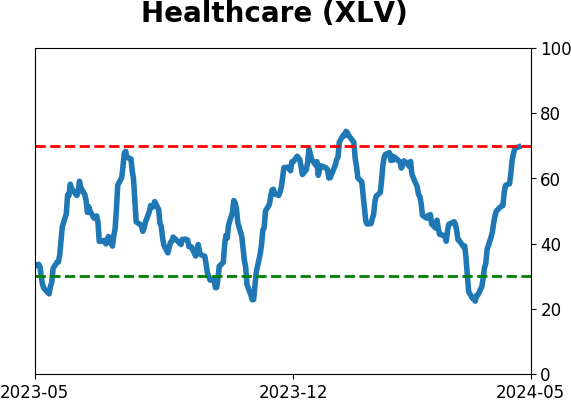
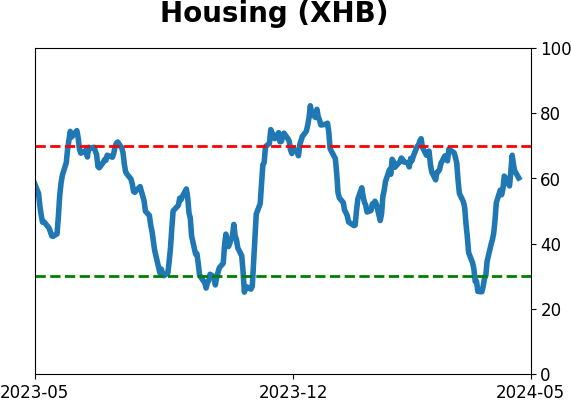
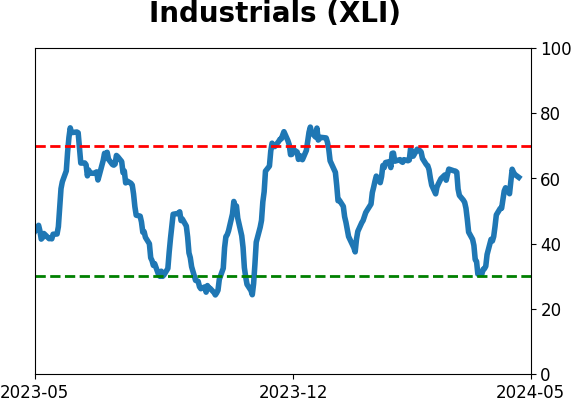
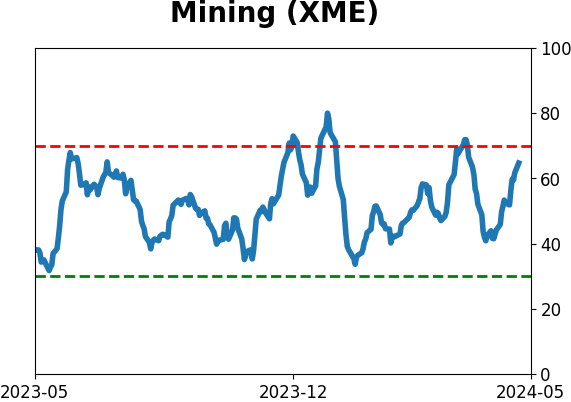
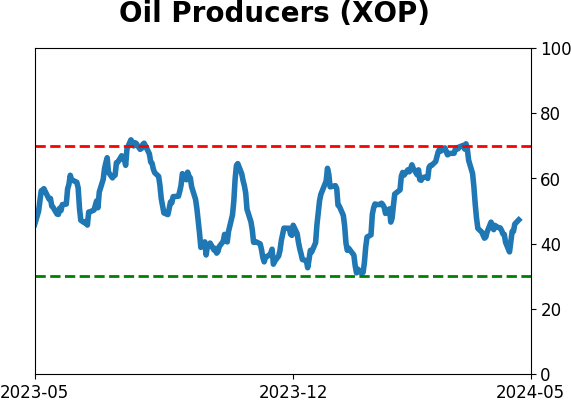
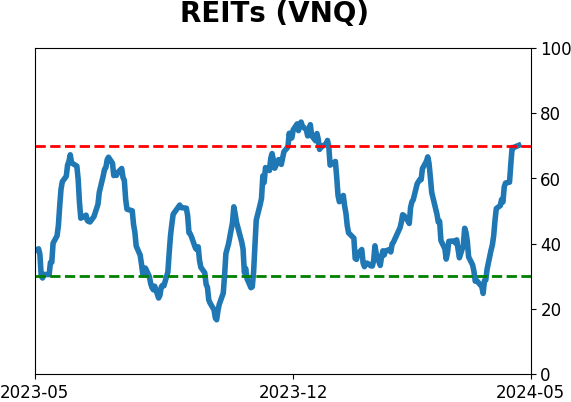
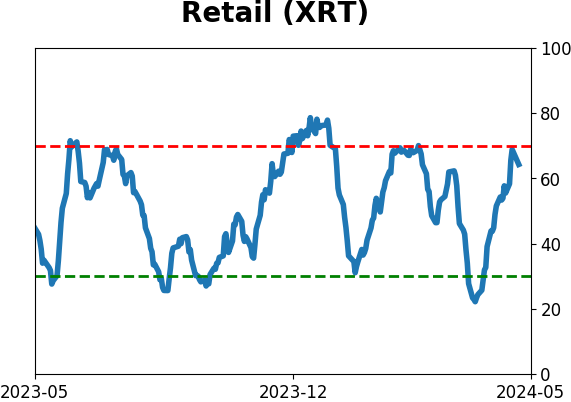
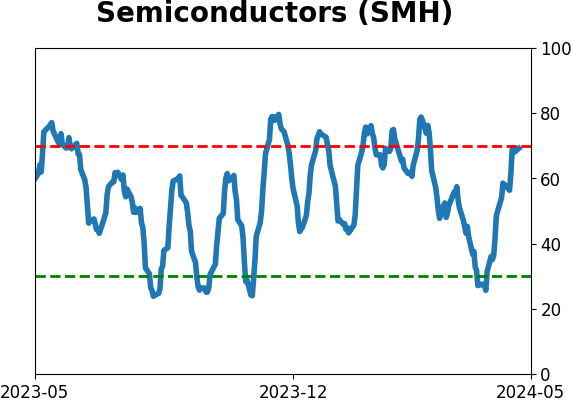
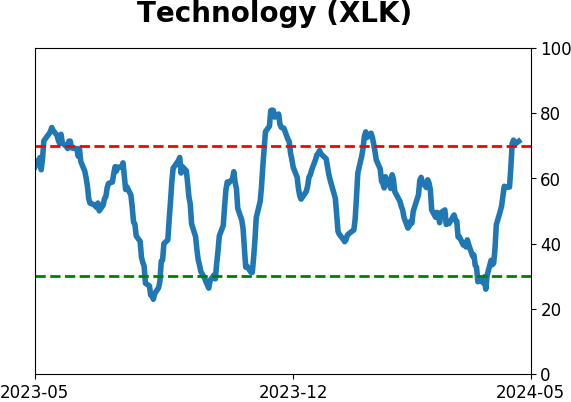
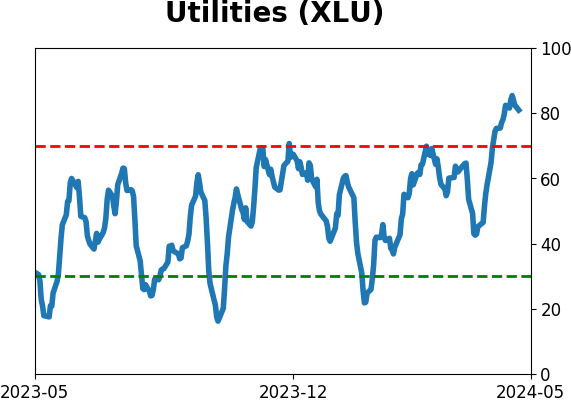
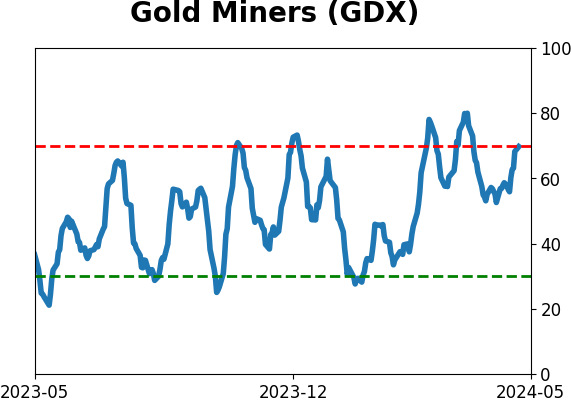
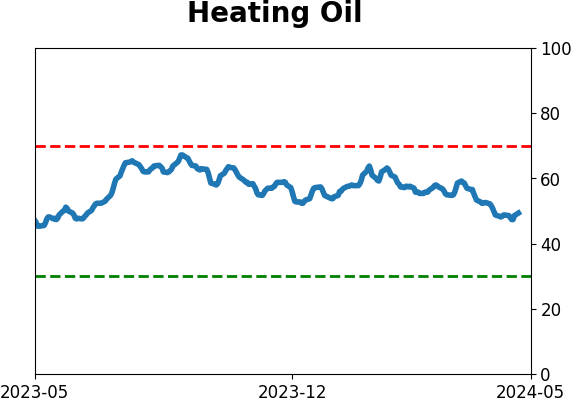
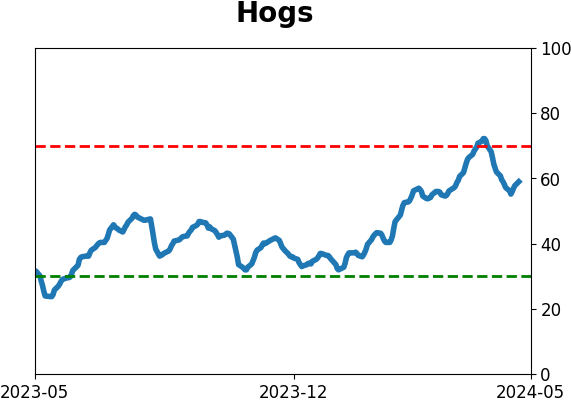
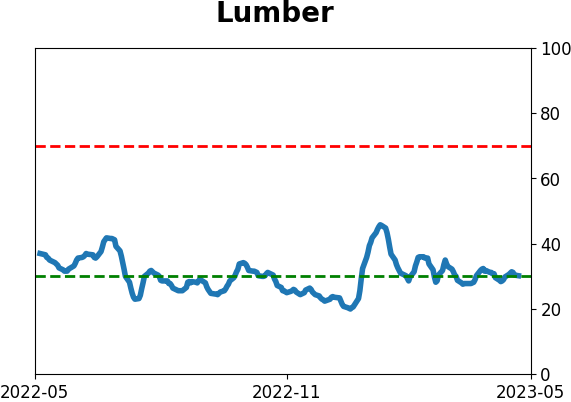
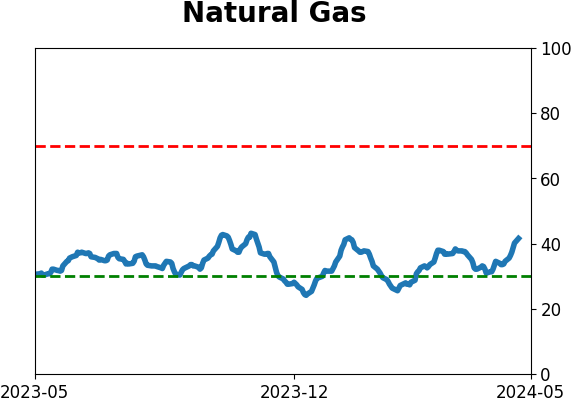
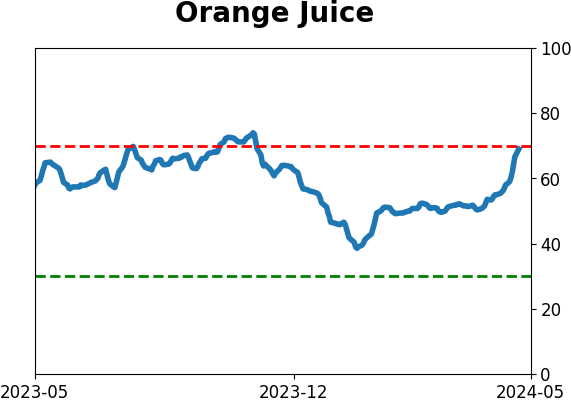
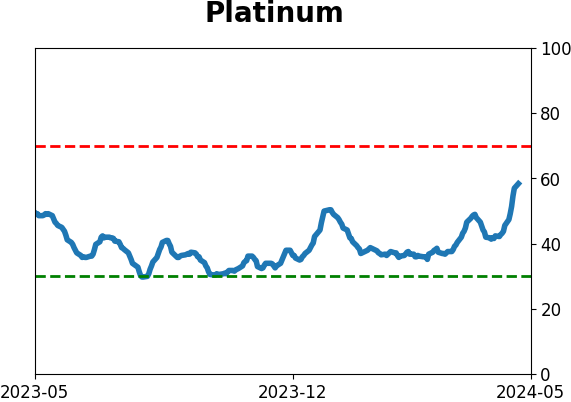
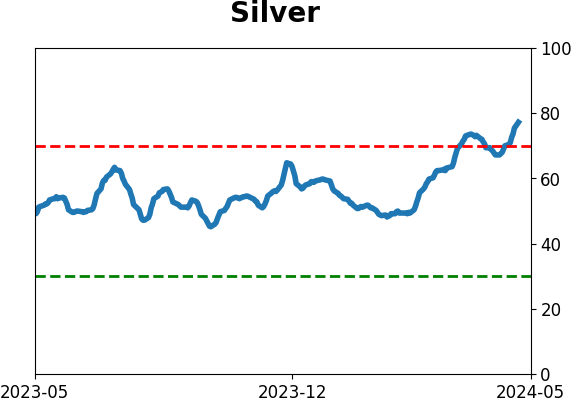
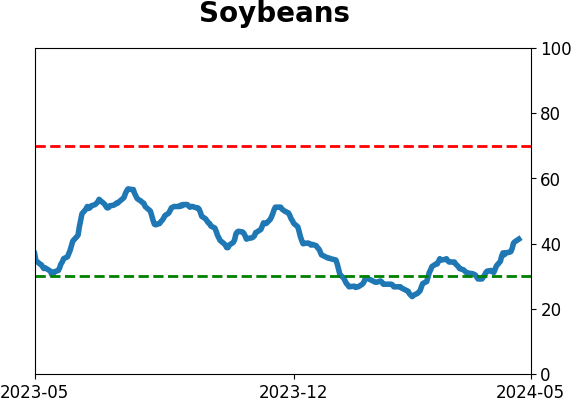
Optimism Index Thumbnails
|
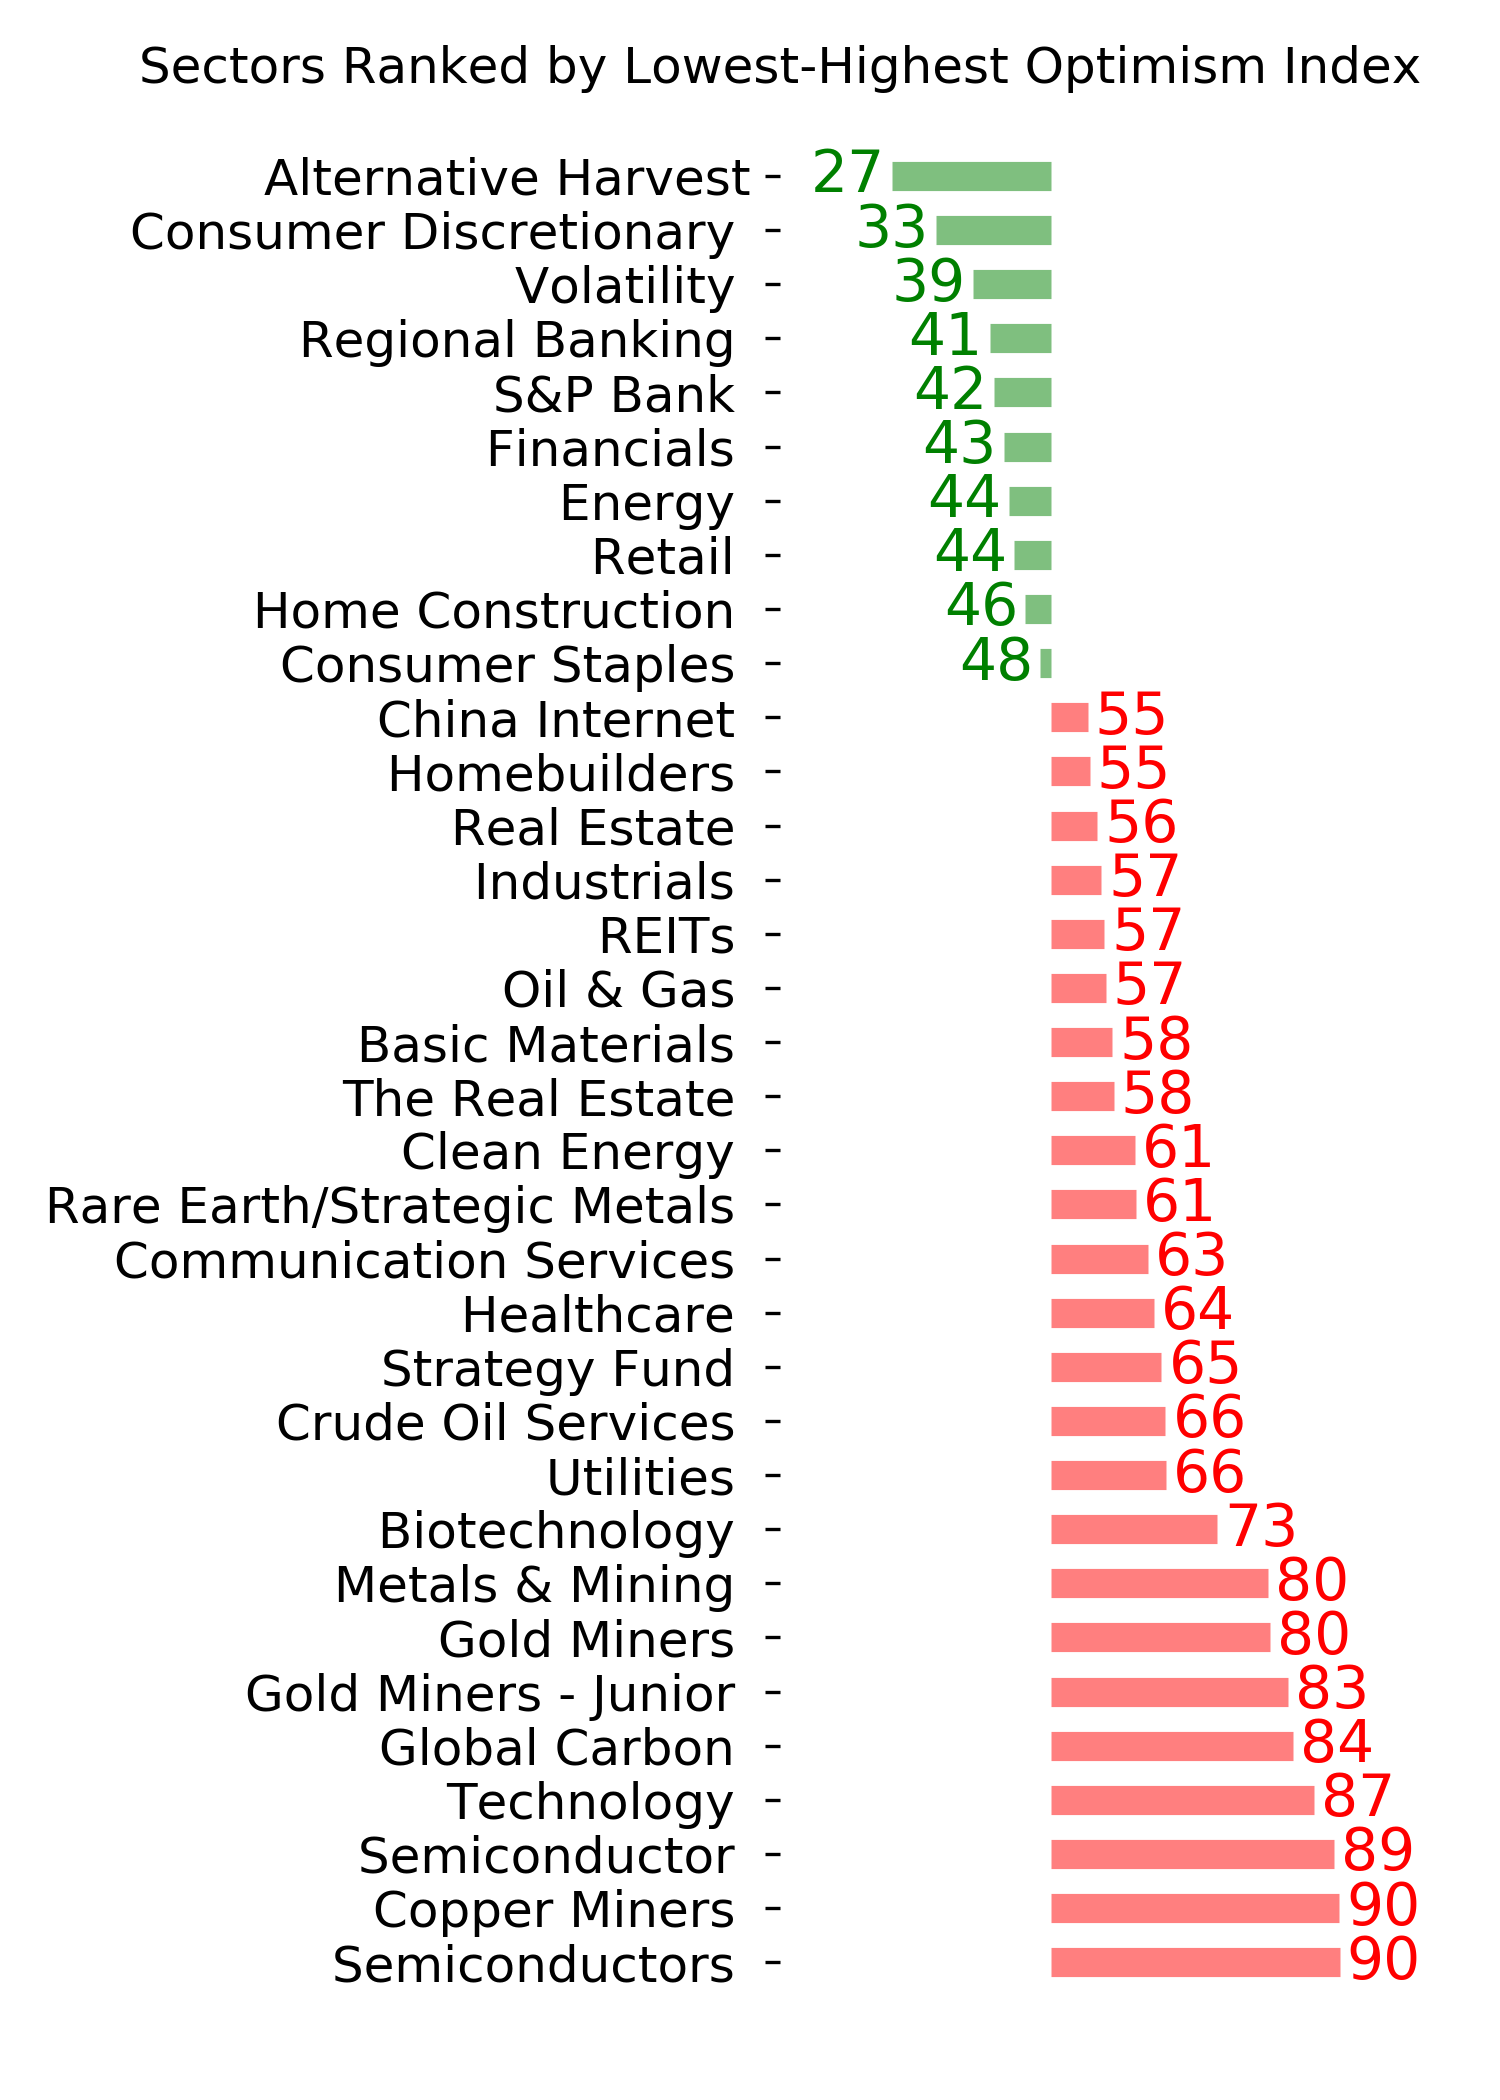
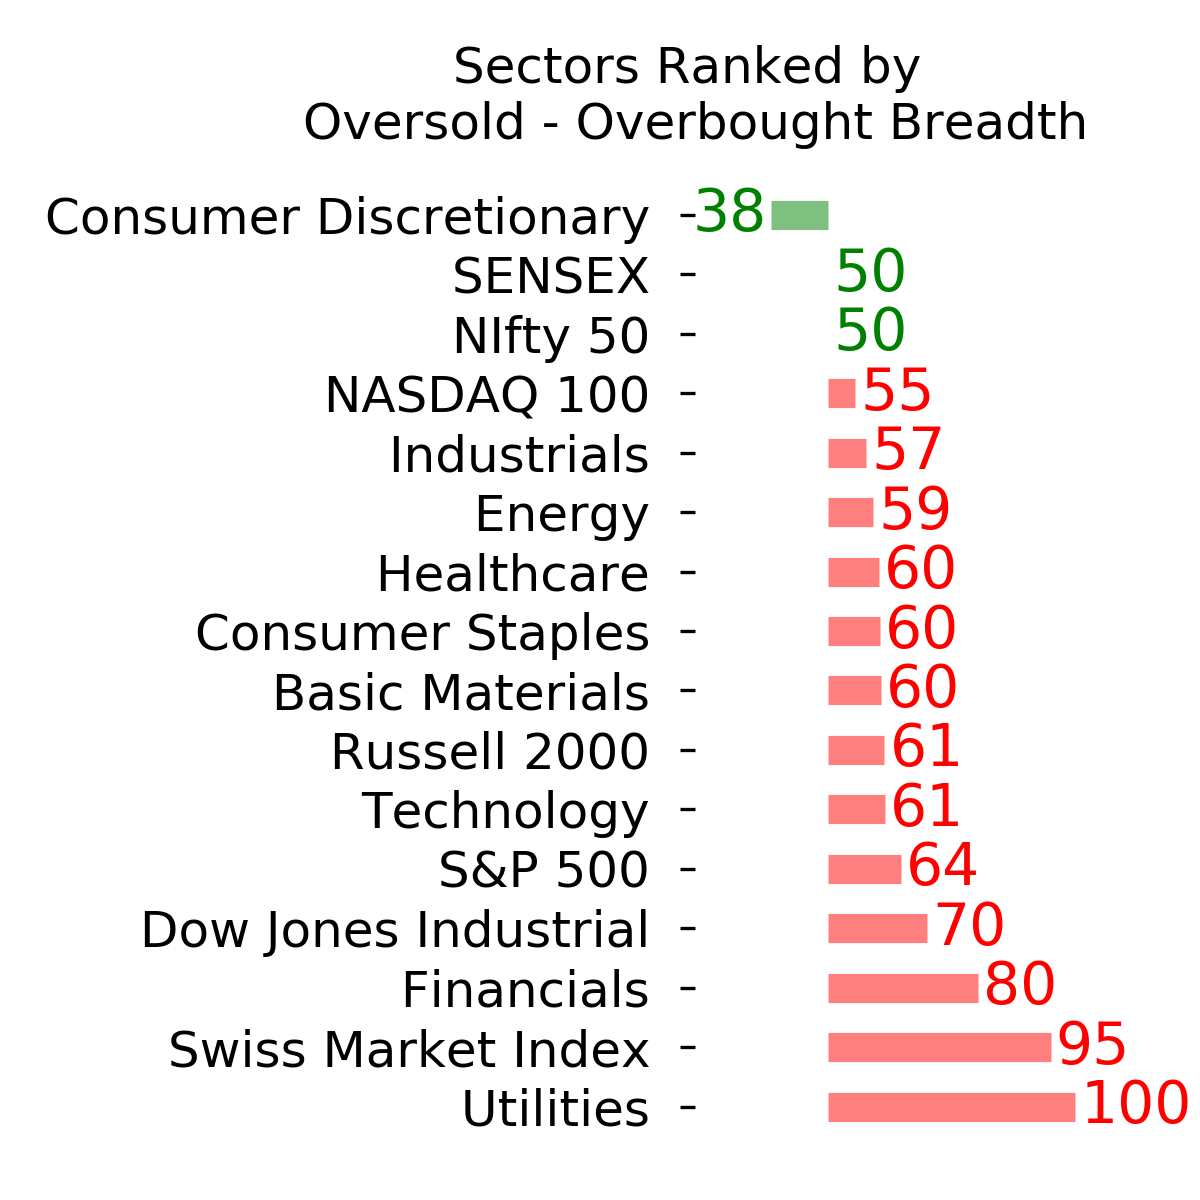
Sector ETF's - 10-Day Moving Average
|
|
|
Country ETF's - 10-Day Moving Average
|
|
|
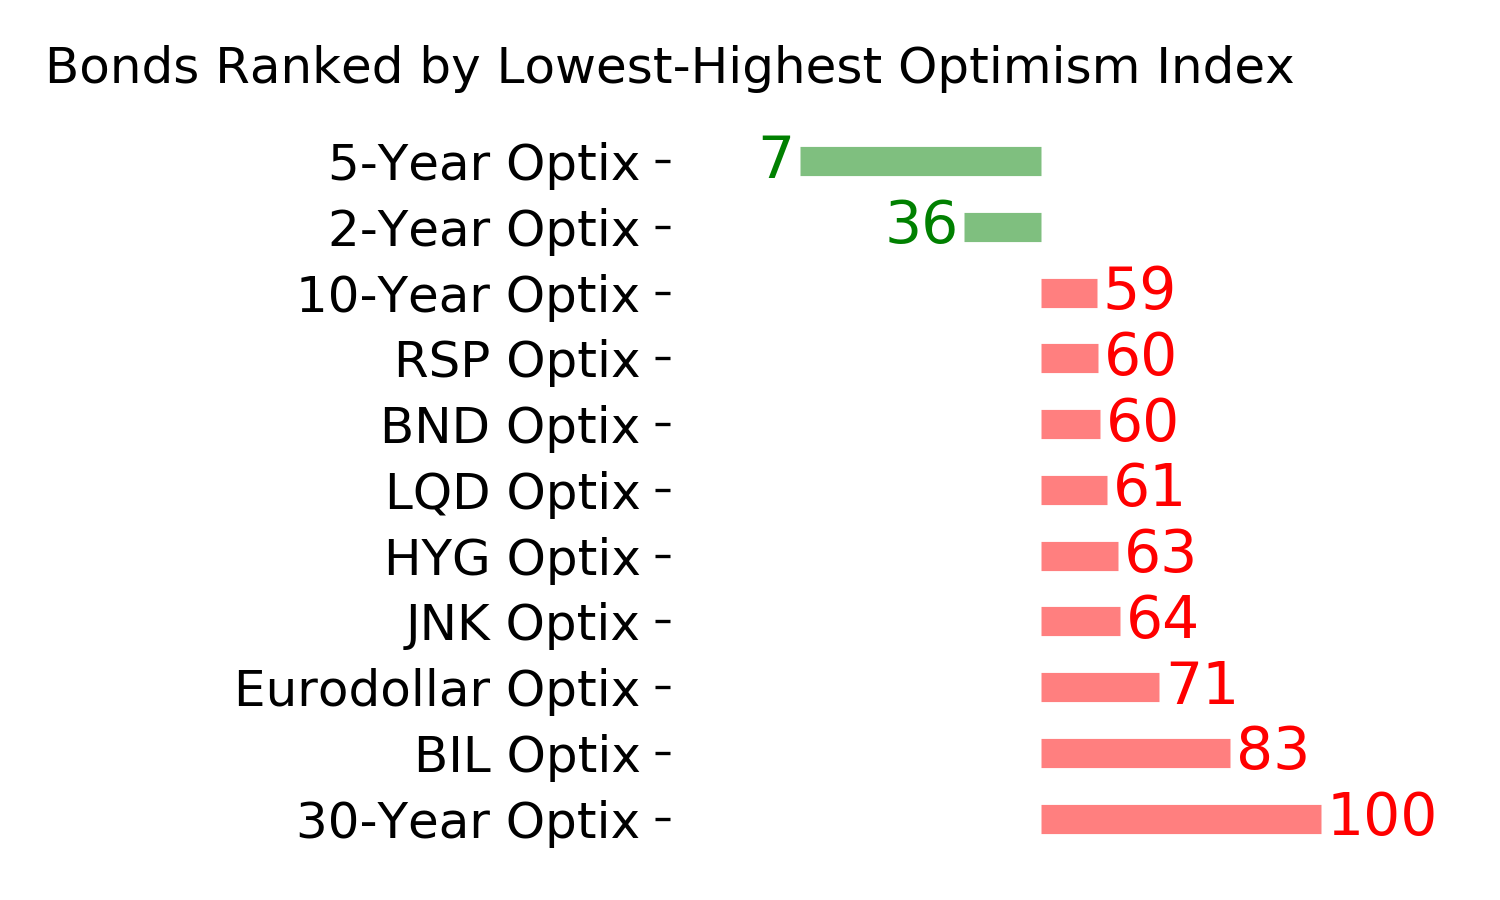
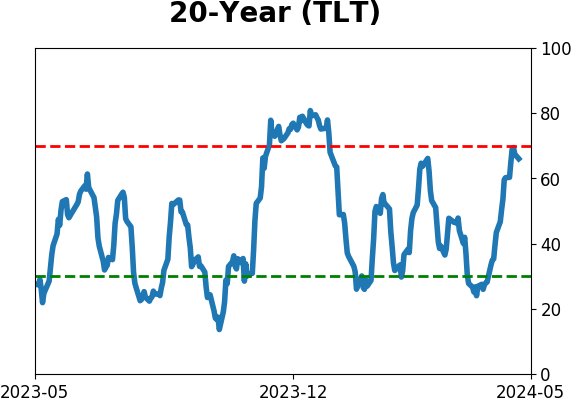
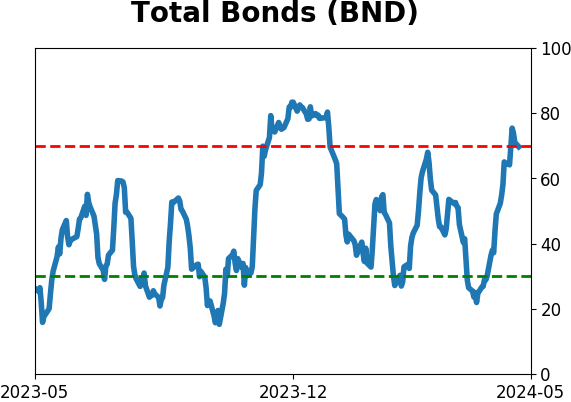
Bond ETF's - 10-Day Moving Average
|
|
|
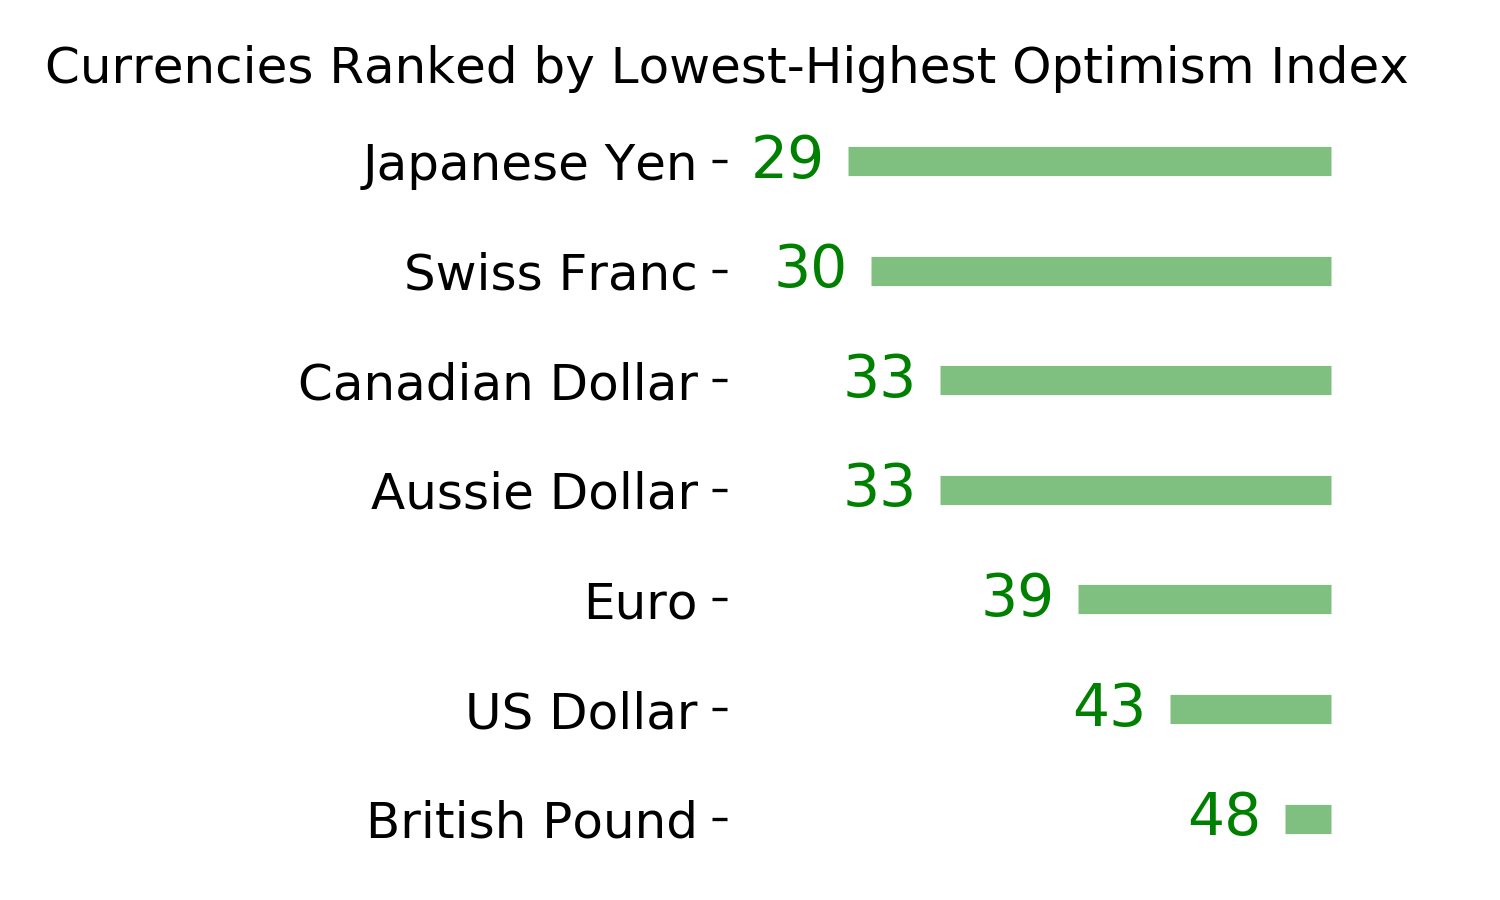
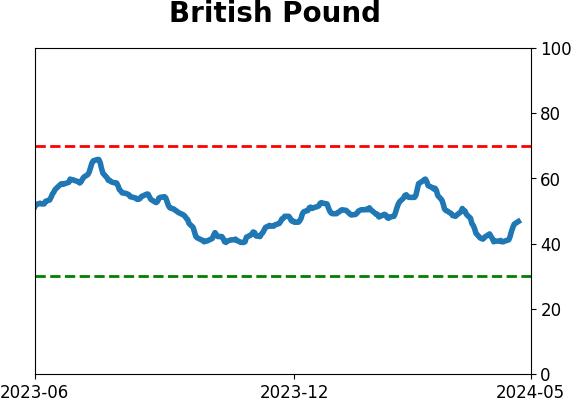
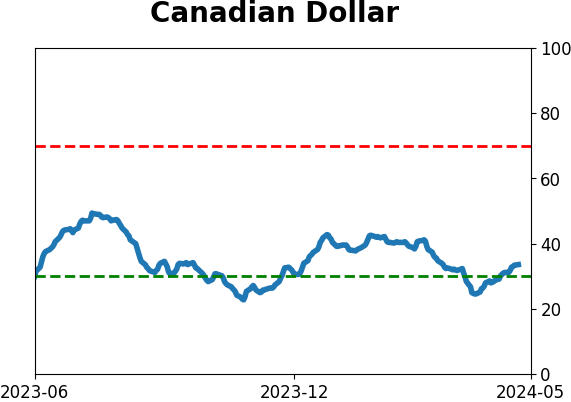
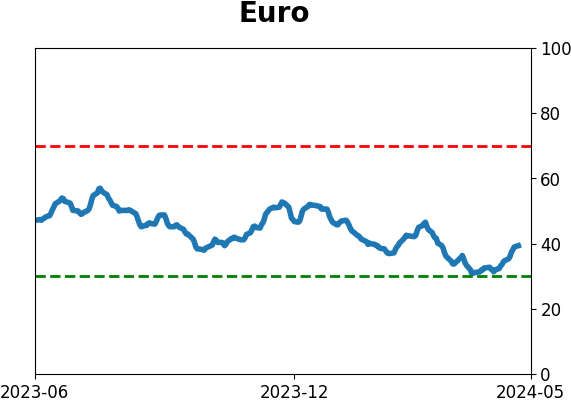
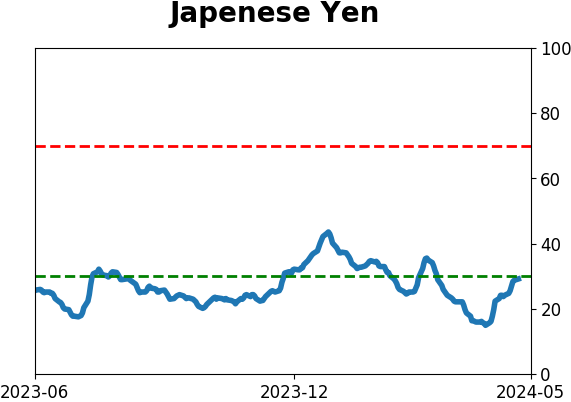
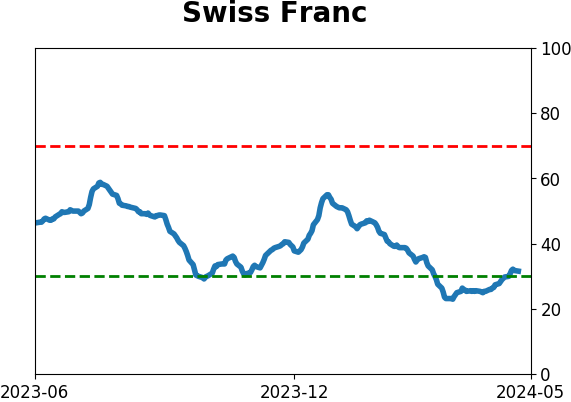
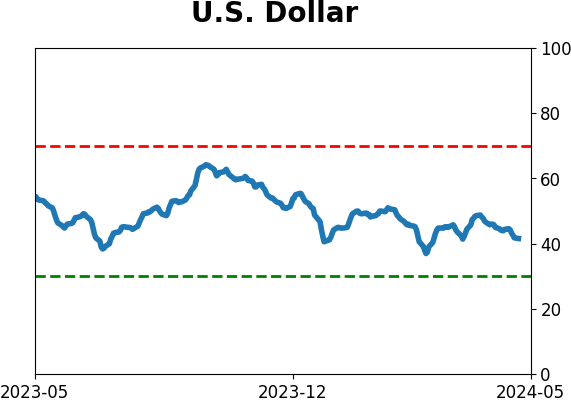
Currency ETF's - 5-Day Moving Average
|
|
|
Commodity ETF's - 5-Day Moving Average
|
|