Headlines
|
|
Hedging Activity Is Picking Up:
Over the last couple of weeks, traders have been trading more protective put options as a hedge. It's high enough to be extreme relative to other readings over the past year, which is generally a good sign...unless we're transitioning to a more corrective phase.
Bottom Line:
See the Outlook & Allocations page for more details on these summaries STOCKS: Hold
The speculative frenzy in February is wrung out. Internal dynamics have mostly held up, with some exceptions. Many of our studies still show a mixed to poor short-term view, with medium- and long-term ones turning more positive. BONDS: Hold
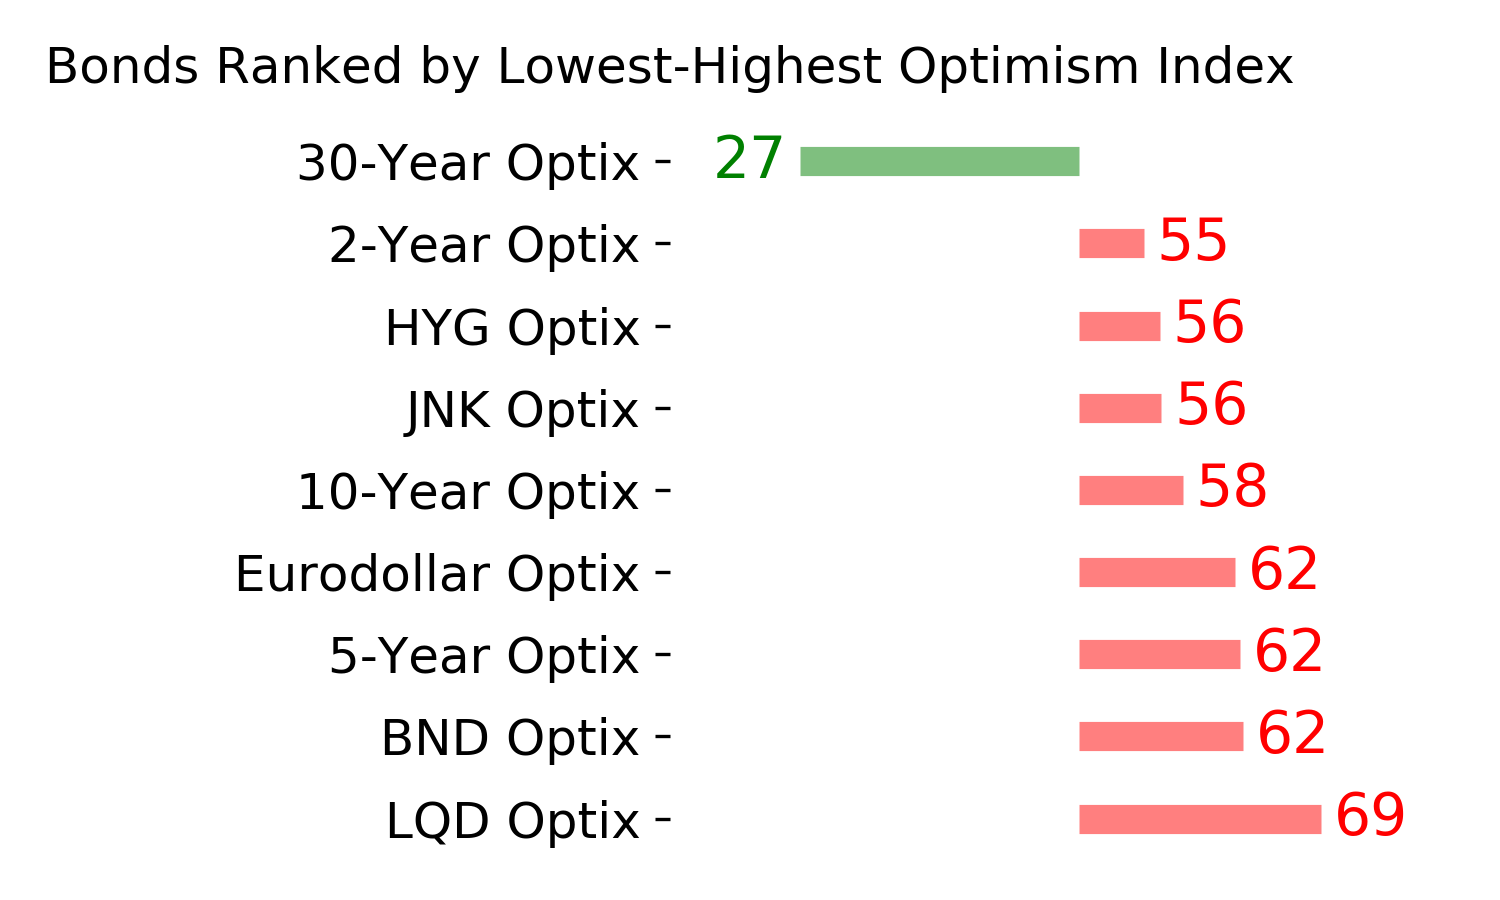
Various parts of the market got hit in March, with the lowest Bond Optimism Index we usually see during healthy environments. After a shaky couple of weeks, the broad bond market has modestly recovered. Not a big edge here either way. GOLD: Hold
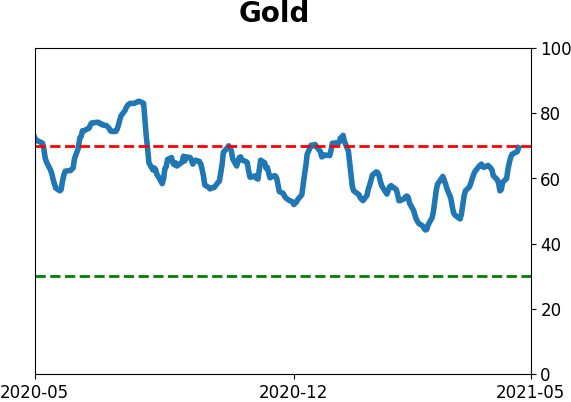
Gold and miners have done very well, recovering above long-term trend lines. The issue is that both have tended to perform poorly after similar situations - will have to wait and see how it plays out.
|
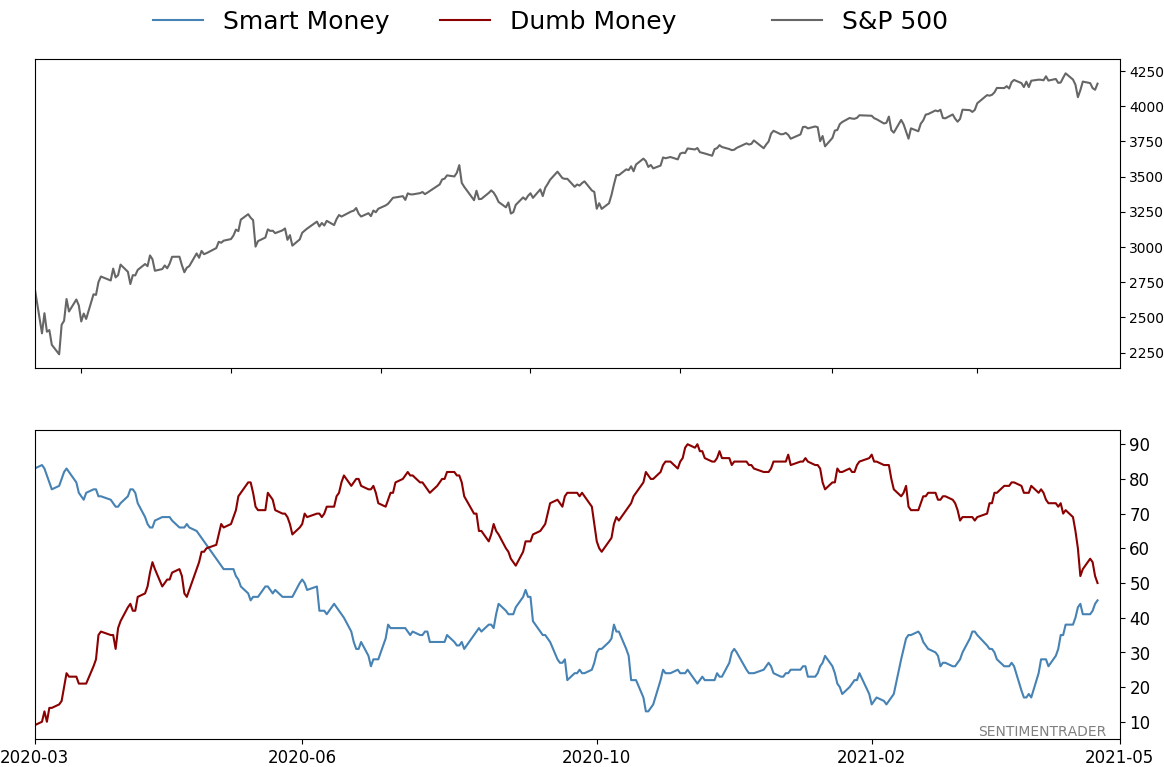
Smart / Dumb Money Confidence
|
Smart Money Confidence: 45%
Dumb Money Confidence: 50%
|
|
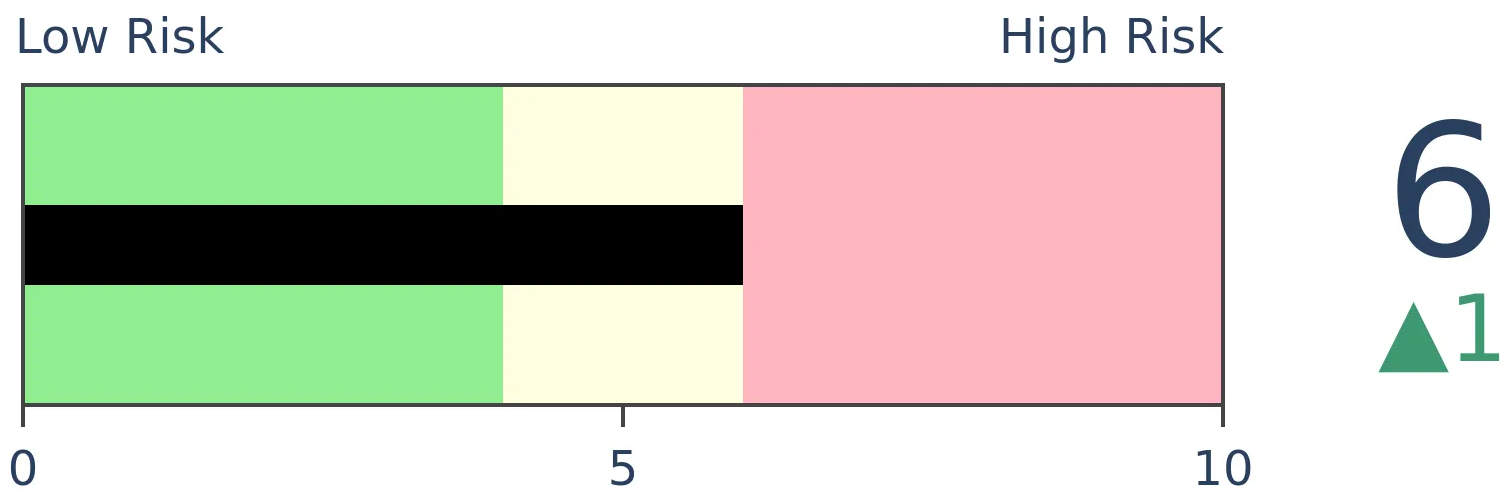
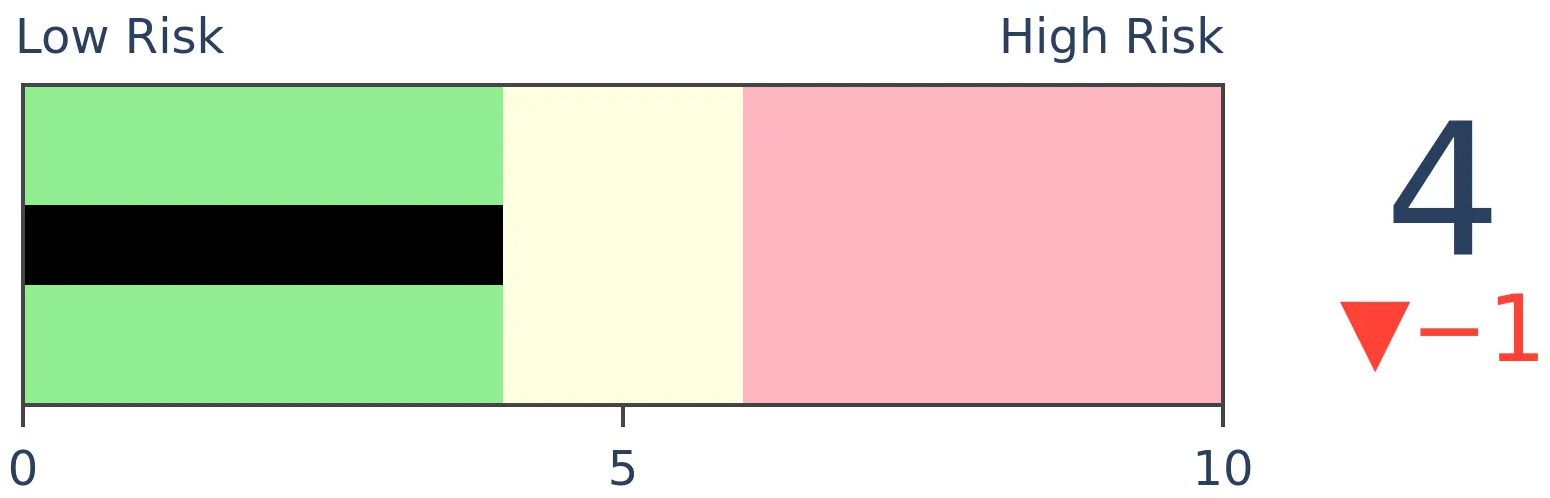
Risk Levels
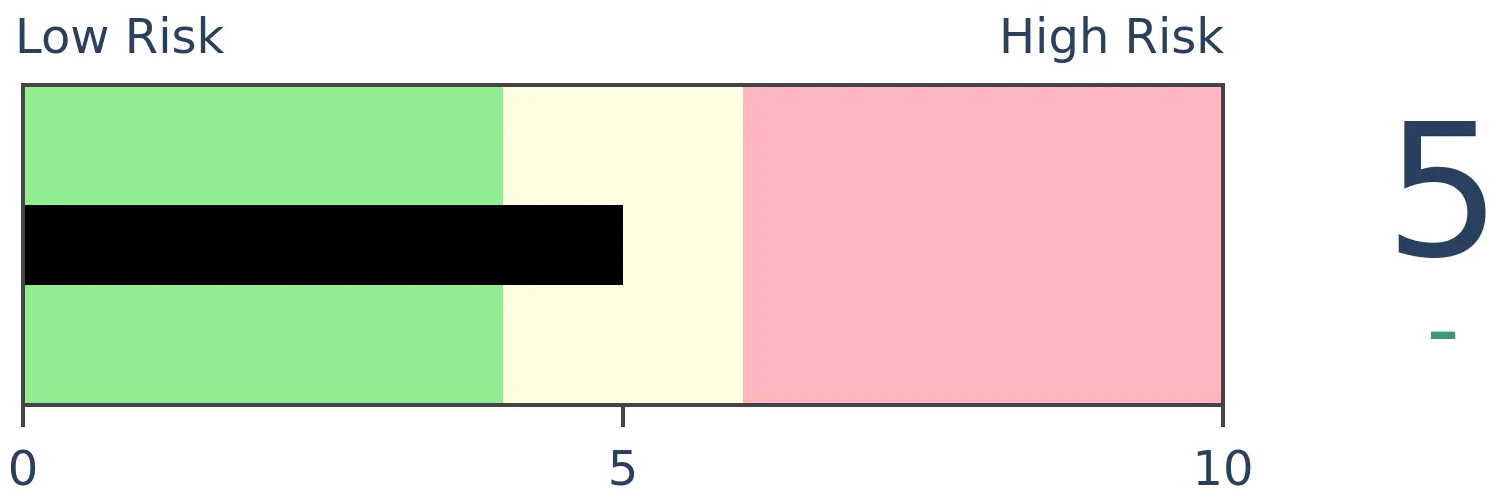
Stocks Short-Term
|
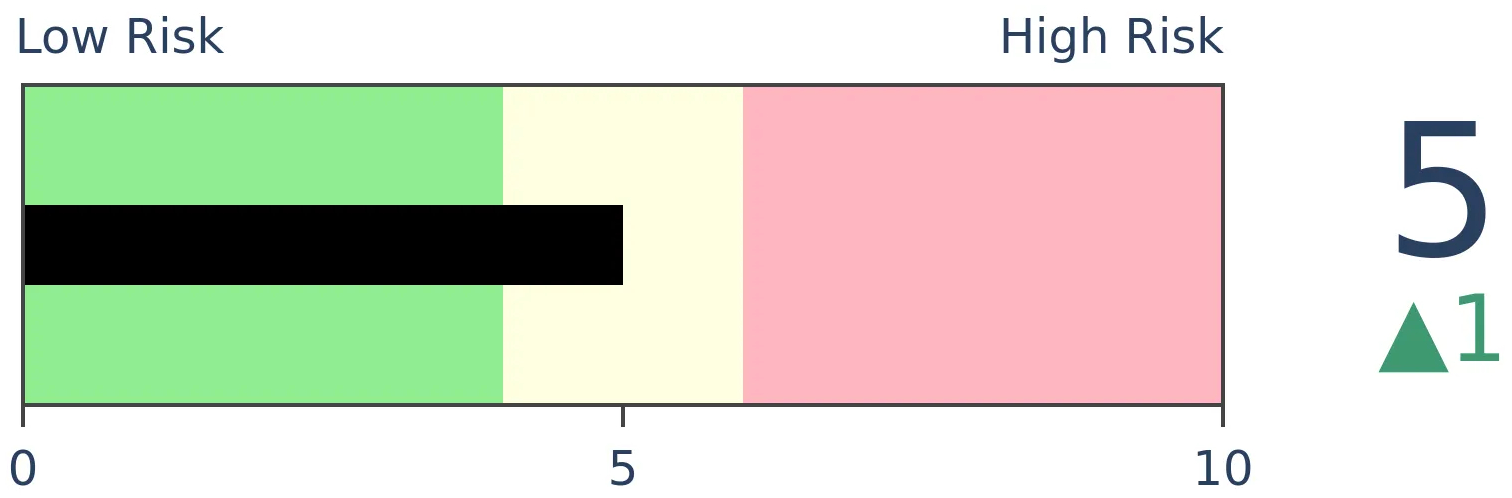
Stocks Medium-Term
|
|
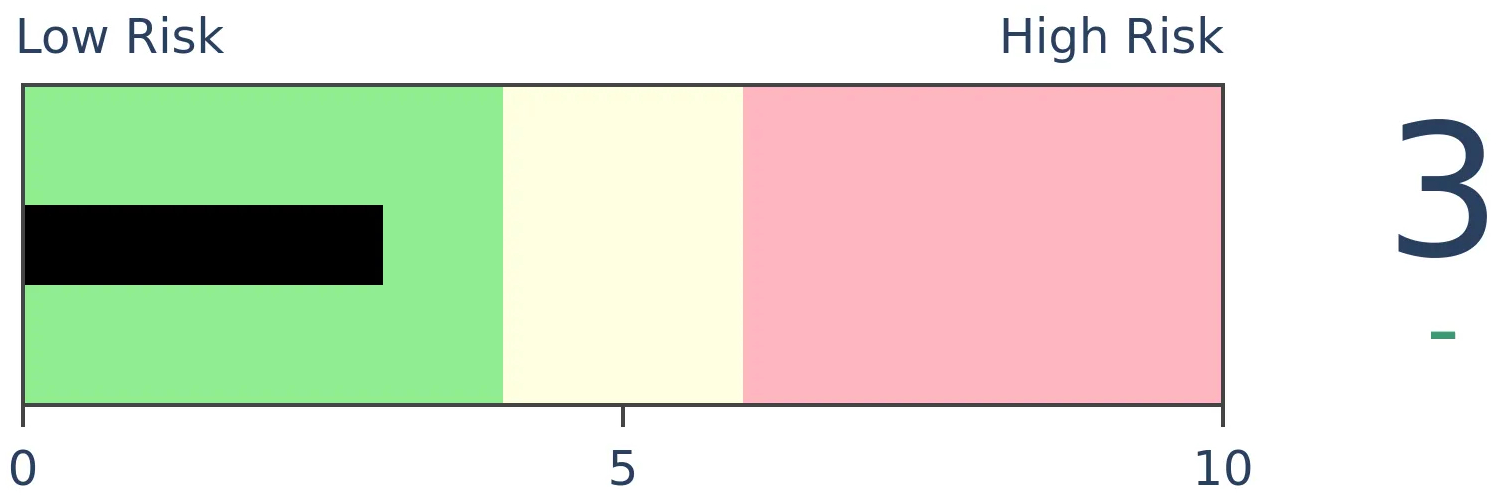
Bonds
|
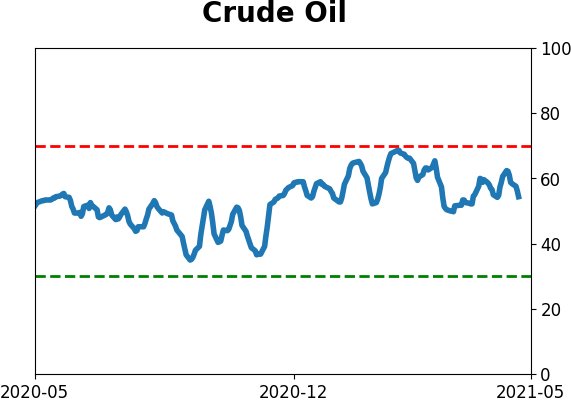
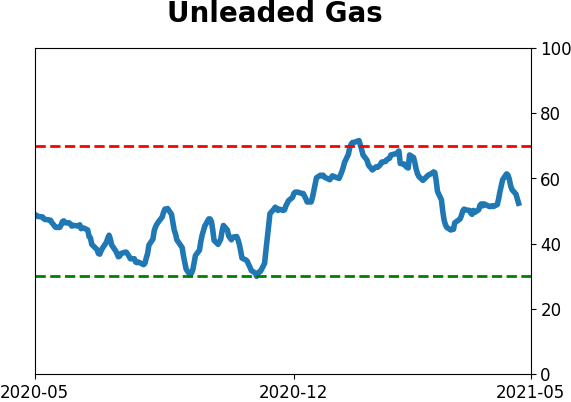
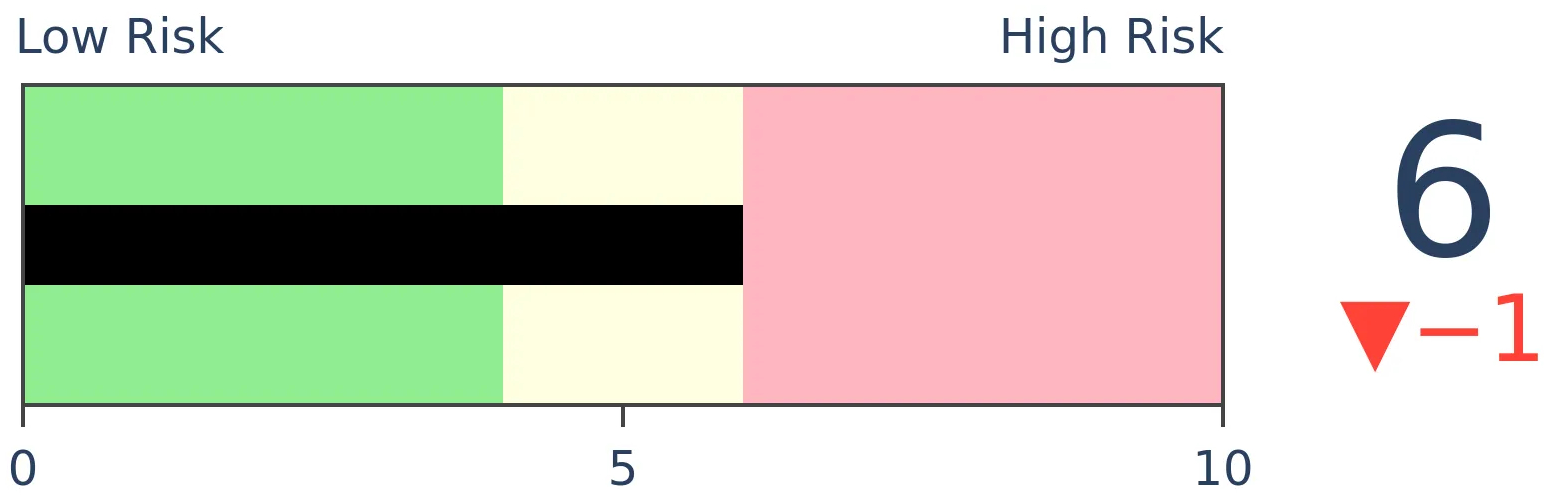
Crude Oil
|
|
Gold
|
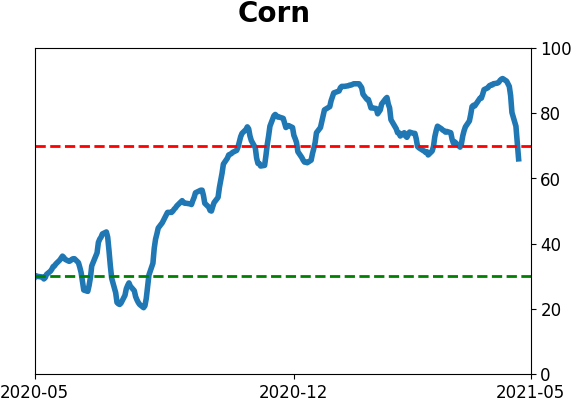
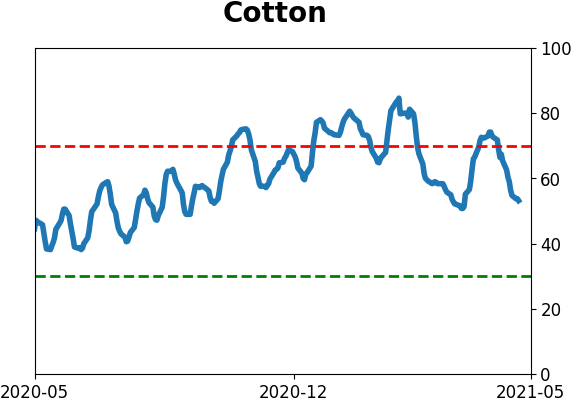
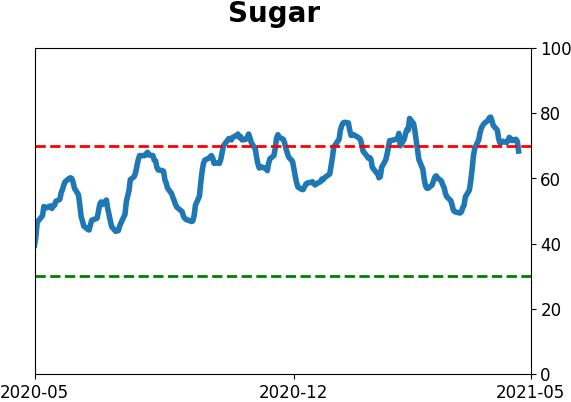
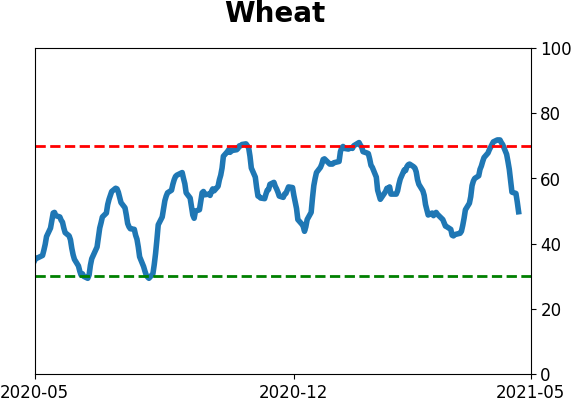
Agriculture
|
|
Research
BOTTOM LINE
Over the last couple of weeks, traders have been trading more protective put options as a hedge. It's high enough to be extreme relative to other readings over the past year, which is generally a good sign...unless we're transitioning to a more corrective phase.
FORECAST / TIMEFRAME
None
|
Stocks are holding up pretty well, especially in the broader market, yet options traders are getting nervous.
Small options traders have spent 22% of their volume buying put options to open, tied for the 2nd-largest amount since last July.
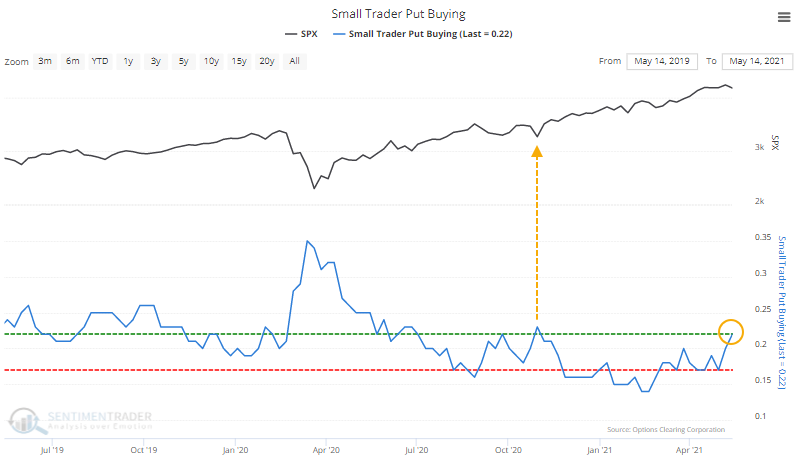
Granted, it's still low compared to past years, and large options traders are still buying relatively few puts.
HEAVY HEDGING...RELATIVELY
This rise in put volume - both buying and selling - has pushed the Equity Put/Call Ratio to one of its highest levels of the past year, even though losses on stocks have been minor. The De-Trended version of the ratio shows that a shorter-term moving average is more than 20% higher than a long-term moving average. This has preceded a very favorable annualized return since 1997.
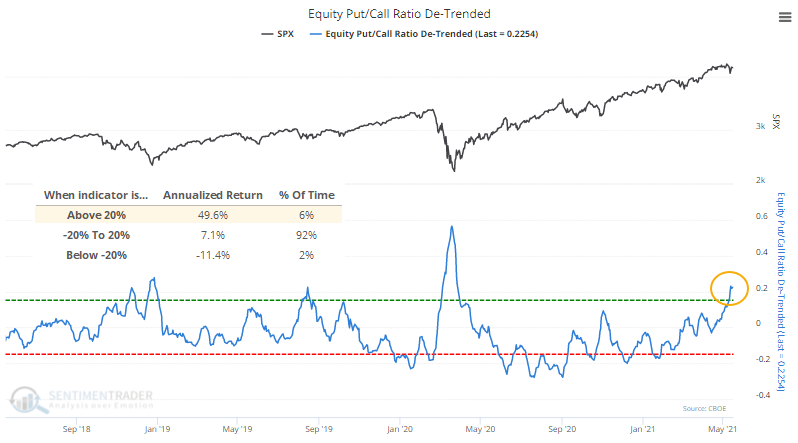
Likewise, the Backtest Engine shows that forward returns were consistently positive when the ratio crosses above 20%.
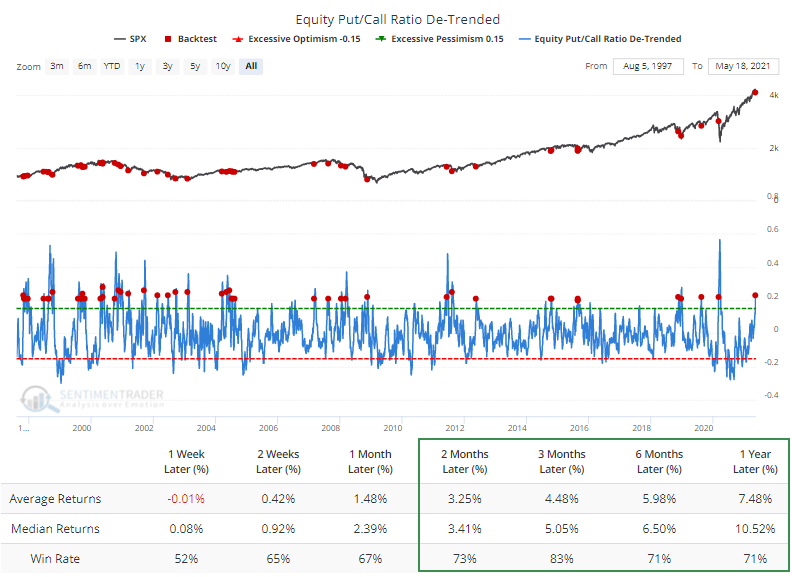
PICKUP IN PUTS, DESPITE ONLY SMALL LOSSES
What's especially notable about the current instance is that it triggered while the S&P was within 1.5% of a 52-week high. The only other times that's happened were early December 1997 and late June 1998. The former preceded short-term weakness then medium-term strength. The latter showed the opposite.
Looking for times when the ratio got this high with the S&P within 5% of a peak, returns were mixed.
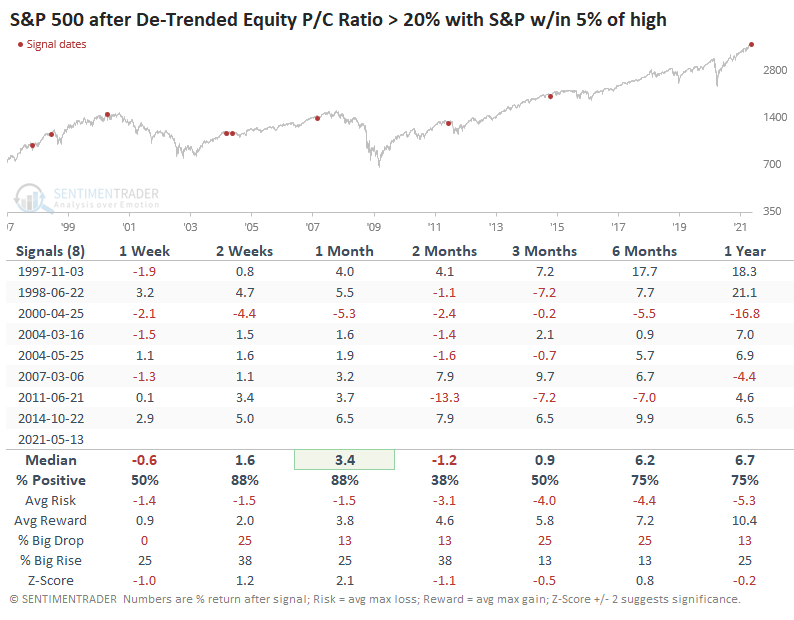
Every time but once, the S&P rallied over the next month, but then 4 of them failed and led to losses a month after that, preceding haircuts of more than 10% in 2000 and 2011.
Markets do better when optimism and speculation are rising, not falling. At least until it gets to an extreme, and even then, momentum can carry a market higher. A rising put/call ratio is generally not a good thing. Still, it's gotten to a point now where it's kinda-sorta extreme, at least relative to the past year or so, suggesting relatively heavy hedging activity that could be a short- to medium-term positive.
The biggest risk is that after the massive speculative bubble reached in February, we could be heading into a larger corrective phase, in which case a modestly high put/call ratio won't help at all. The biggest clue to that will be how markets react to the current display of modestly high hedging activity in options. If buyers aren't interested and stocks continue to struggle, it will increase the probability that there's a larger trend change afoot.
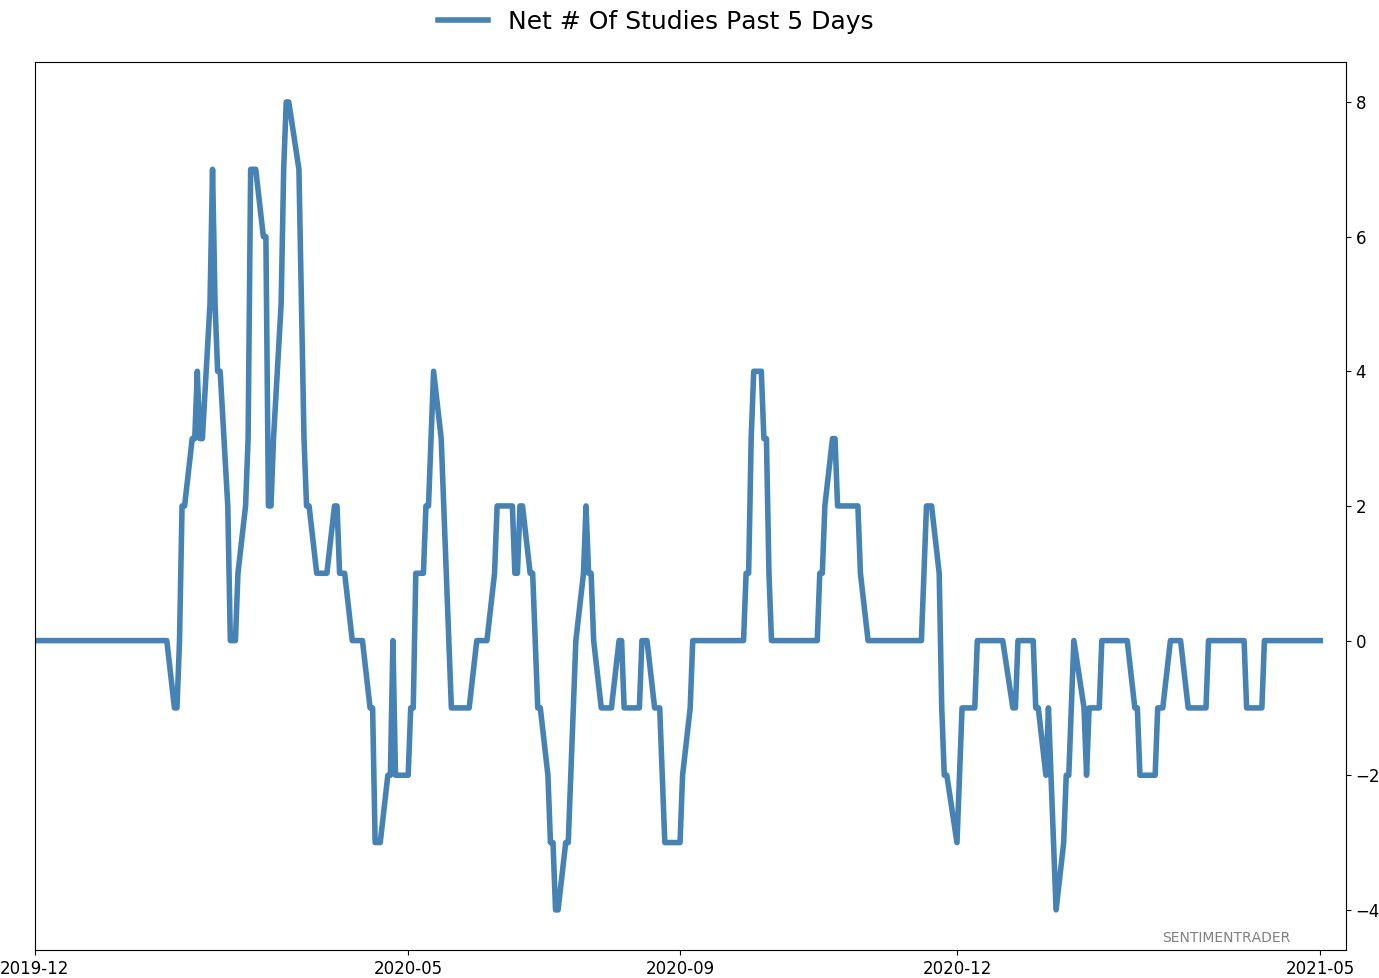
Active Studies
| Time Frame | Bullish | Bearish | | Short-Term | 0 | 0 | | Medium-Term | 1 | 11 | | Long-Term | 11 | 4 |
|
Indicators at Extremes
Portfolio
| Position | Description | Weight % | Added / Reduced | Date | | Stocks | RSP | 4.1 | Added 4.1% | 2021-05-19 | | Bonds | 23.9% BND, 6.9% SCHP | 30.8 | Reduced 7.1% | 2021-05-19 | | Commodities | GCC | 2.5 | Reduced 2.1%
| 2020-09-04 | | Precious Metals | GDX | 5.6 | Reduced 4.2% | 2021-05-19 | | Special Situations | 4.3% XLE, 2.2% PSCE | 7.2 | Reduced 5.6% | 2021-04-22 | | Cash | | 49.8 | | |
|
Updates (Changes made today are underlined)
Much of our momentum and trend work has remained positive for several months, with some scattered exceptions. Almost all sentiment-related work has shown a poor risk/reward ratio for stocks, especially as speculation drove to record highs in exuberance in February. Much of that has worn off, and most of our models are back toward neutral levels. There isn't much to be excited about here. The same goes for bonds and even gold. Gold has been performing well lately and is back above long-term trend lines. The issue is that it has a poor record of holding onto gains when attempting a long-term trend change like this, so we'll take a wait-and-see approach. RETURN YTD: 9.1% 2020: 8.1%, 2019: 12.6%, 2018: 0.6%, 2017: 3.8%, 2016: 17.1%, 2015: 9.2%, 2014: 14.5%, 2013: 2.2%, 2012: 10.8%, 2011: 16.5%, 2010: 15.3%, 2009: 23.9%, 2008: 16.2%, 2007: 7.8%
|
|
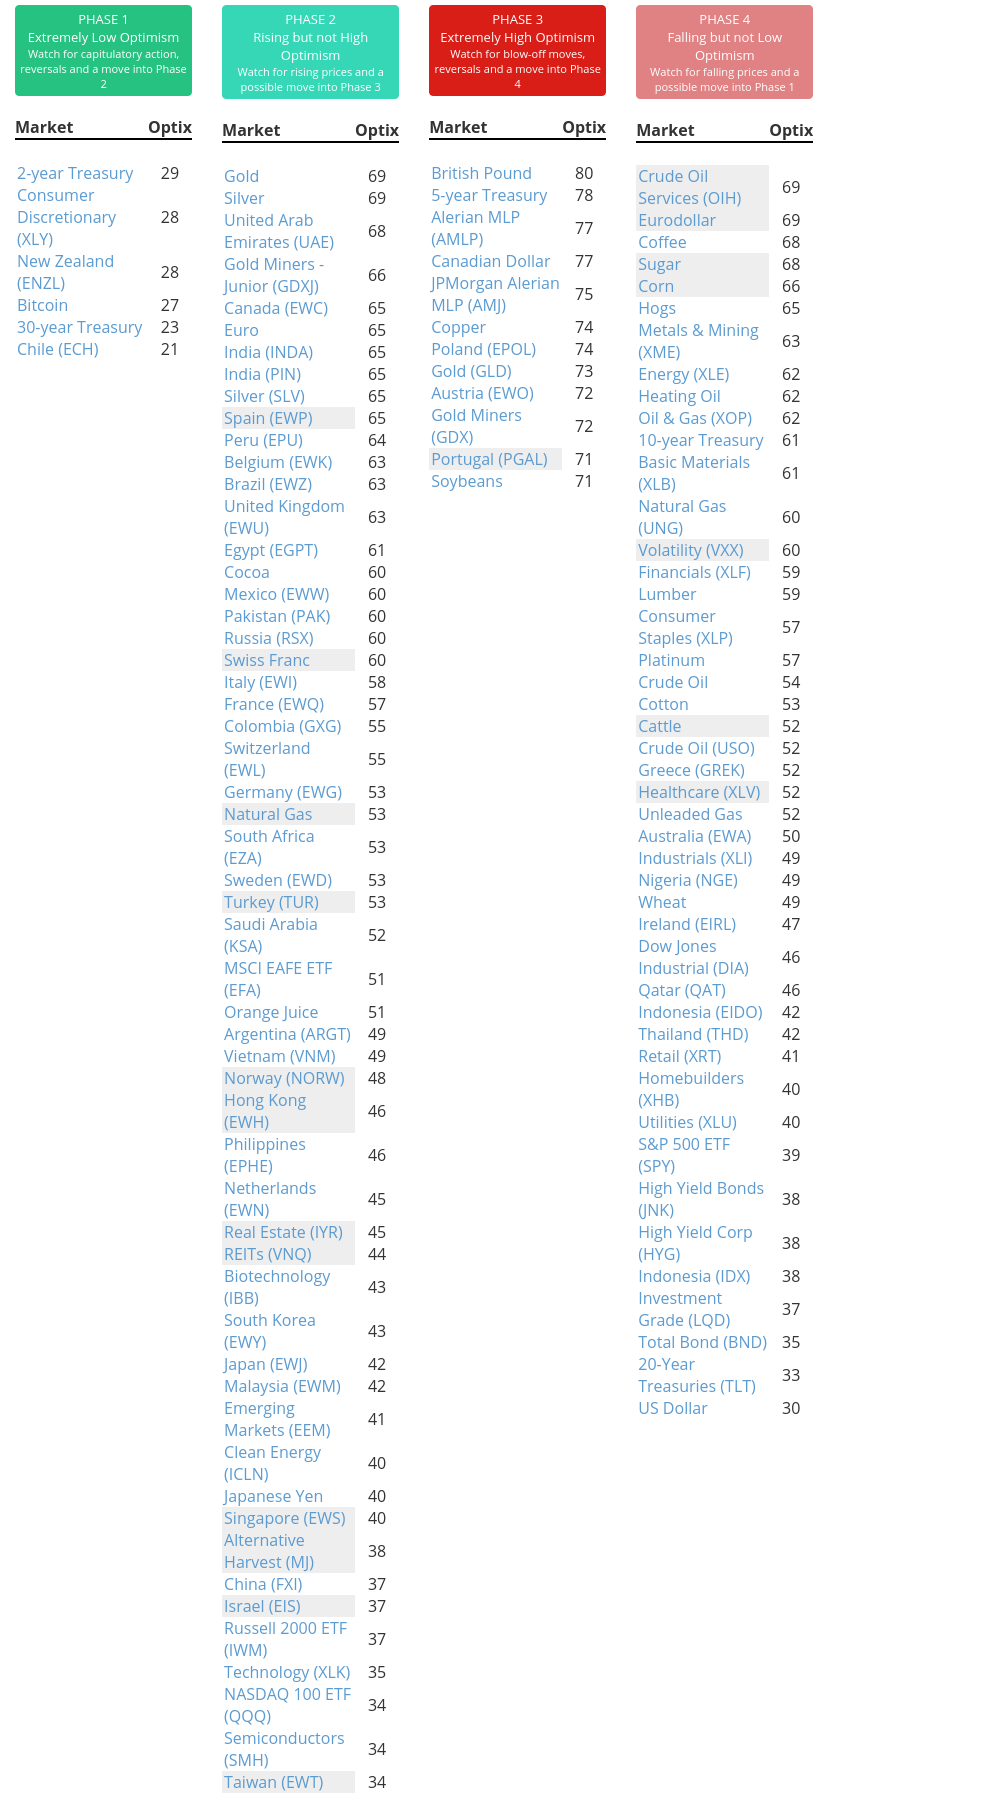
Phase Table
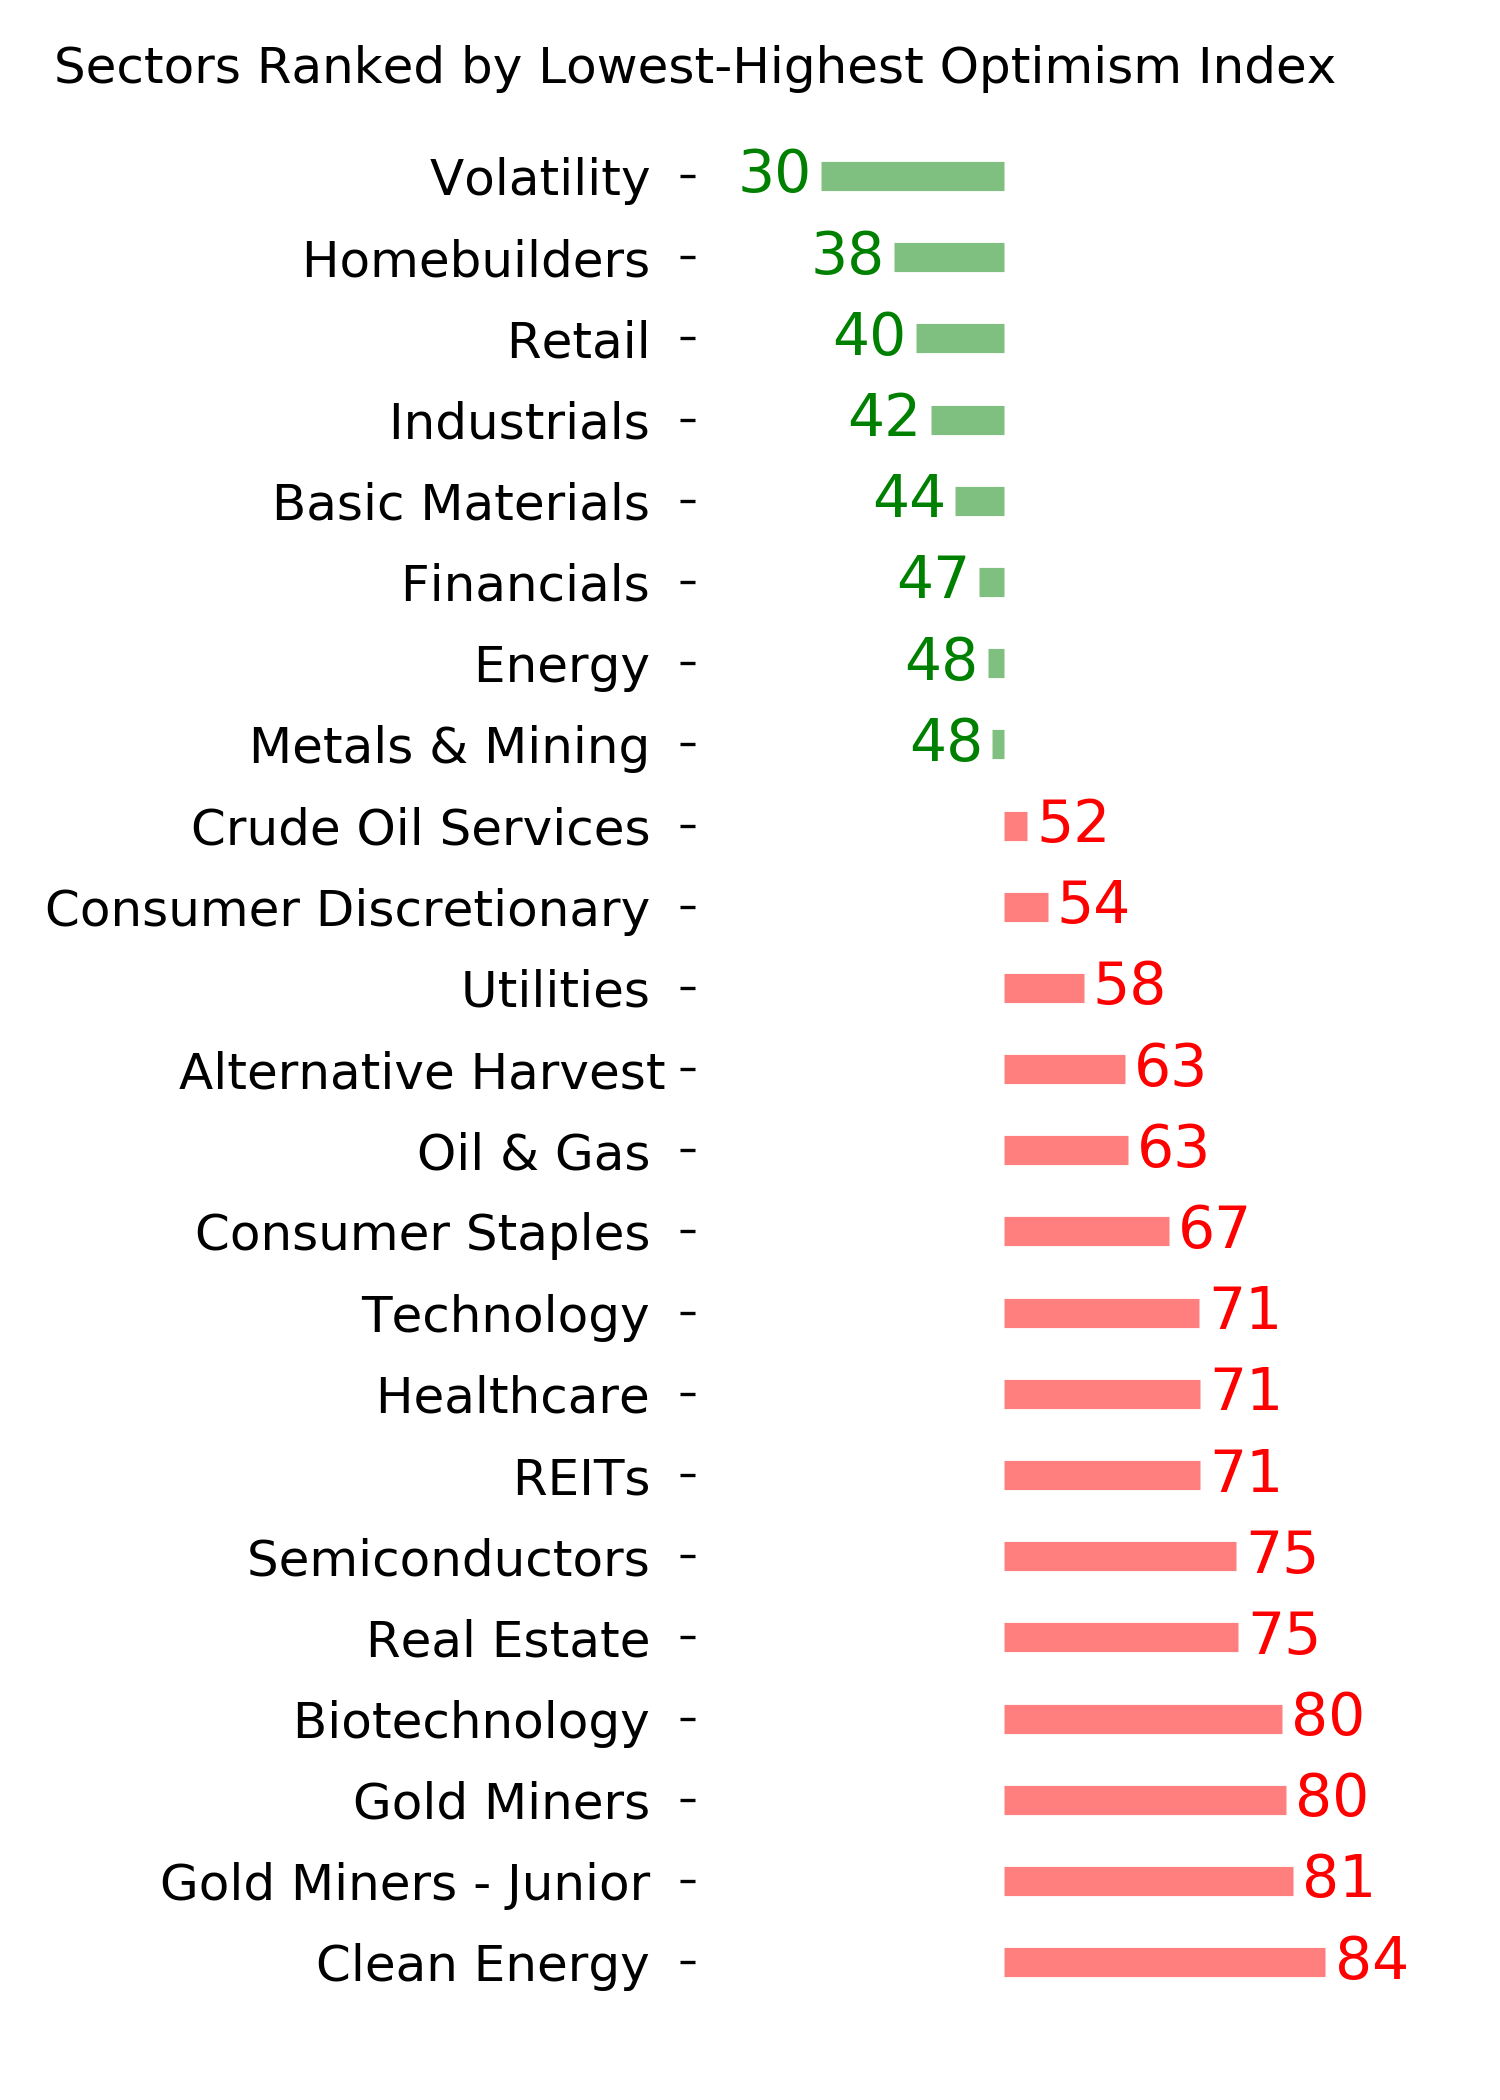
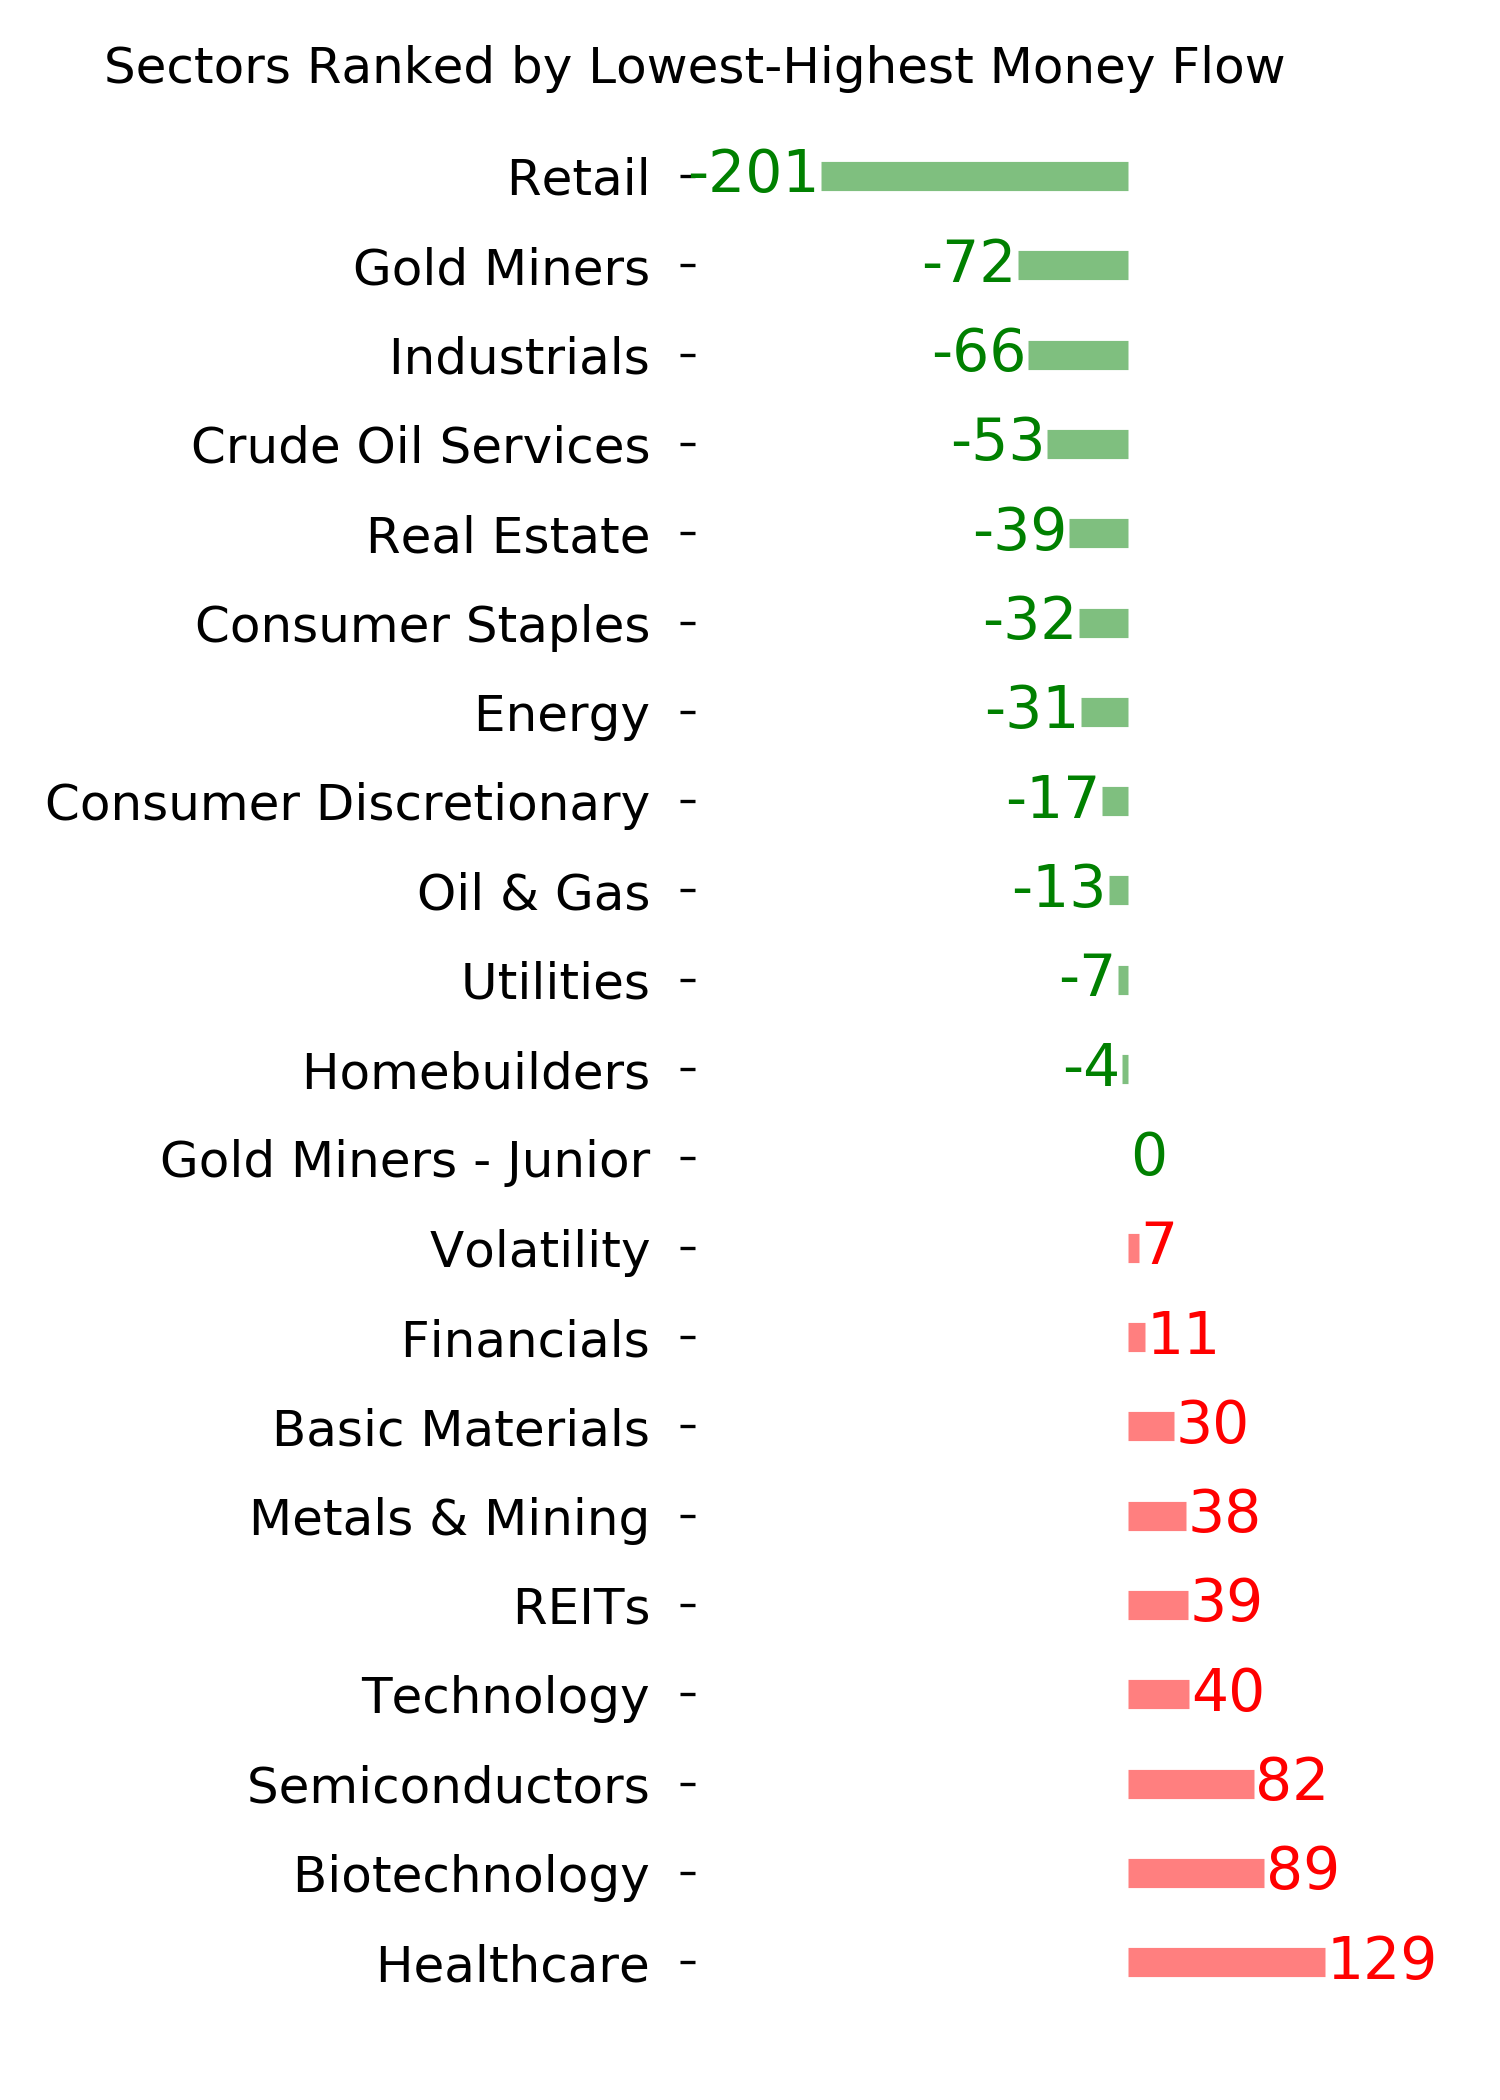
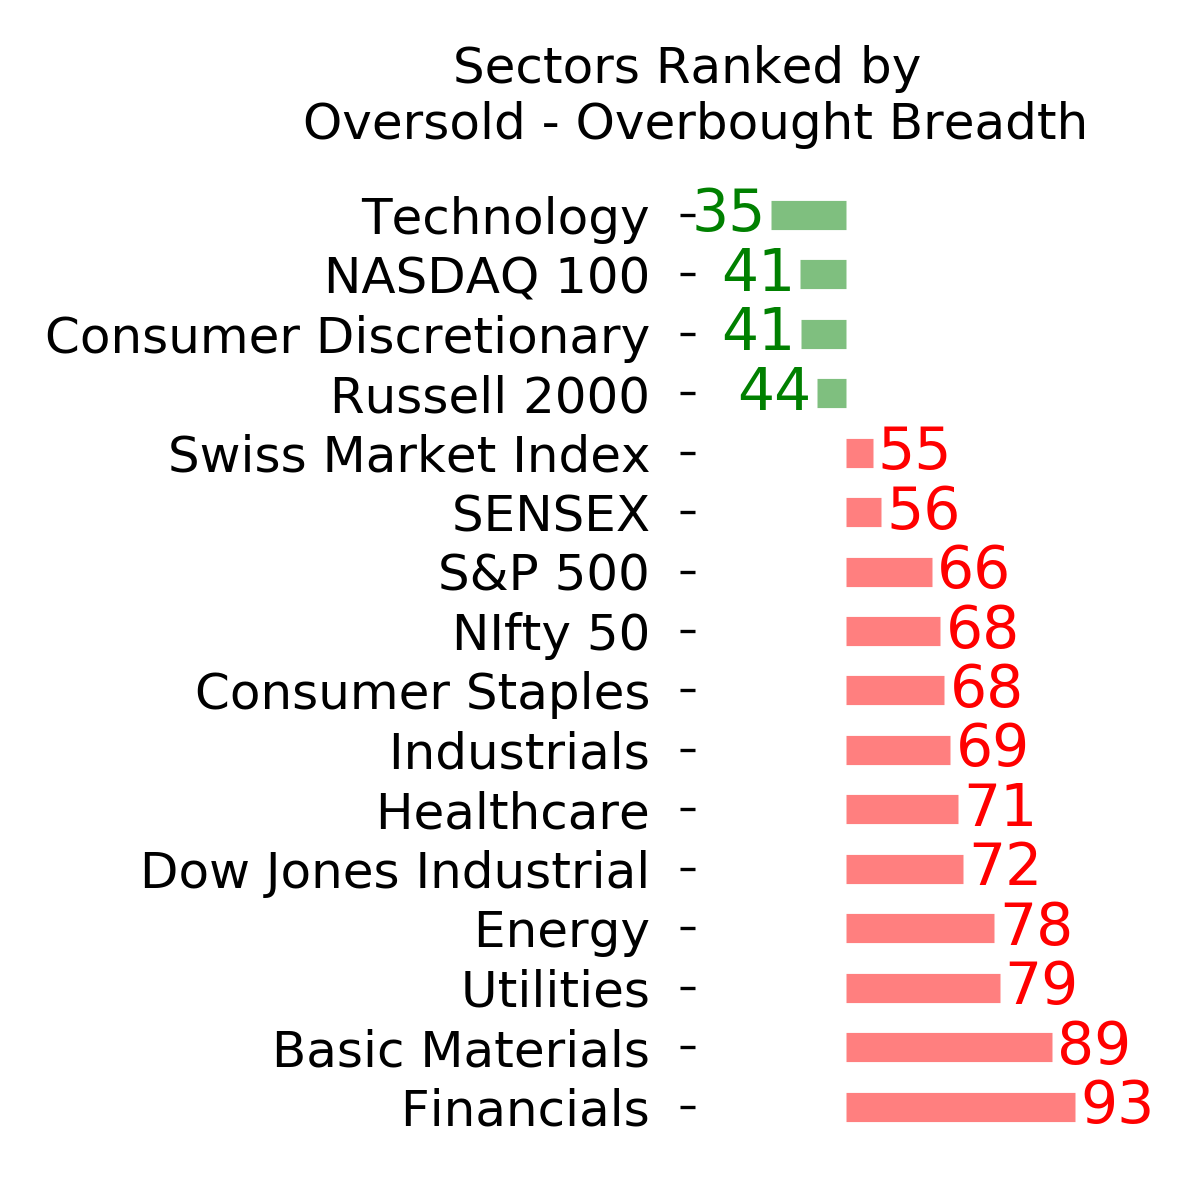
Ranks
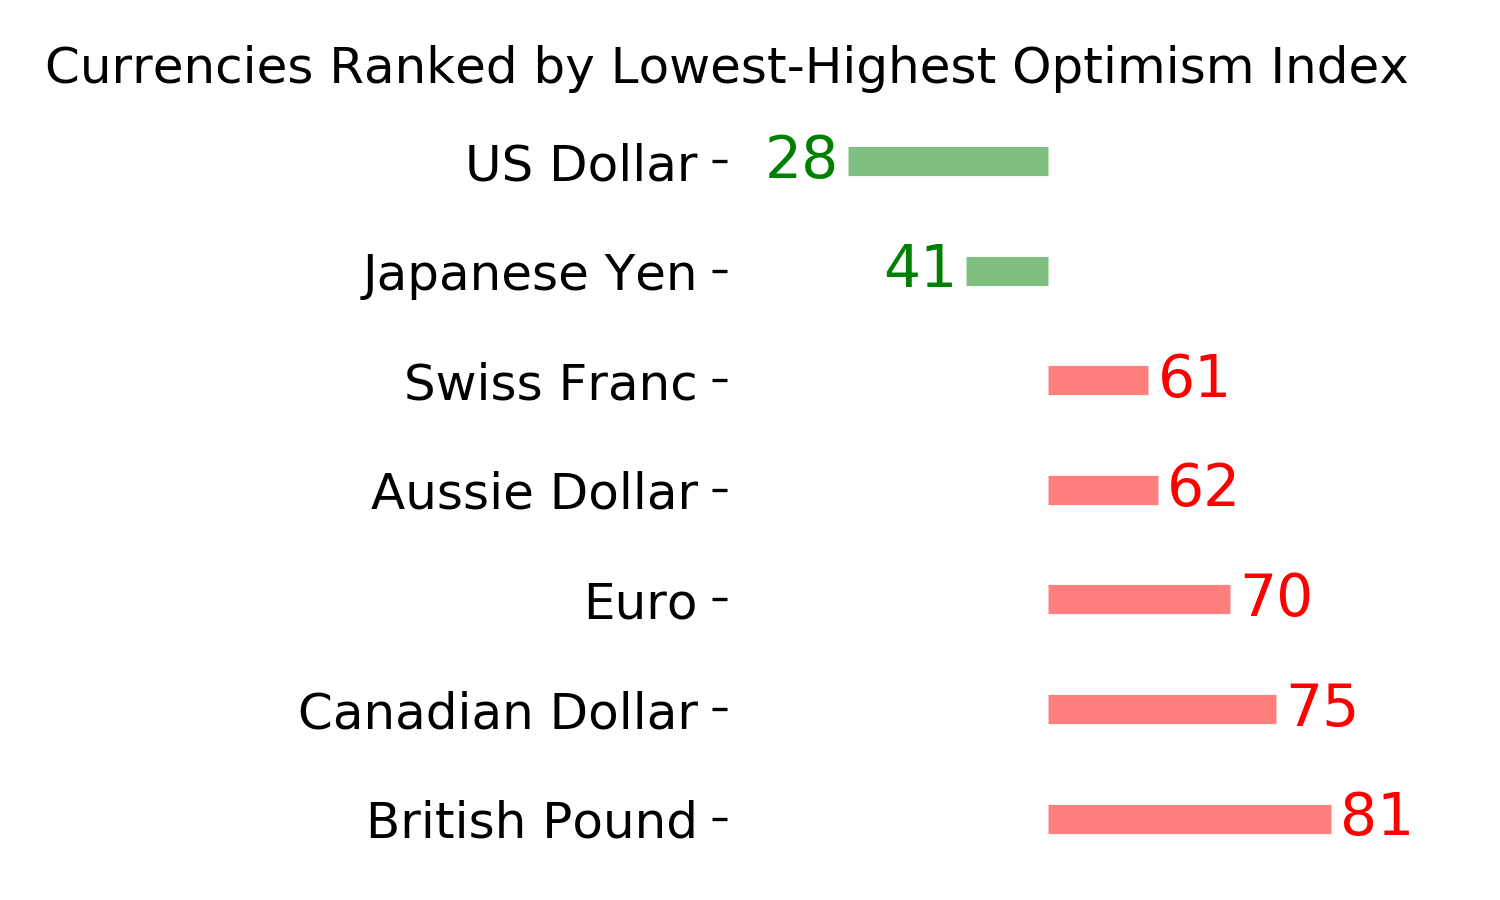
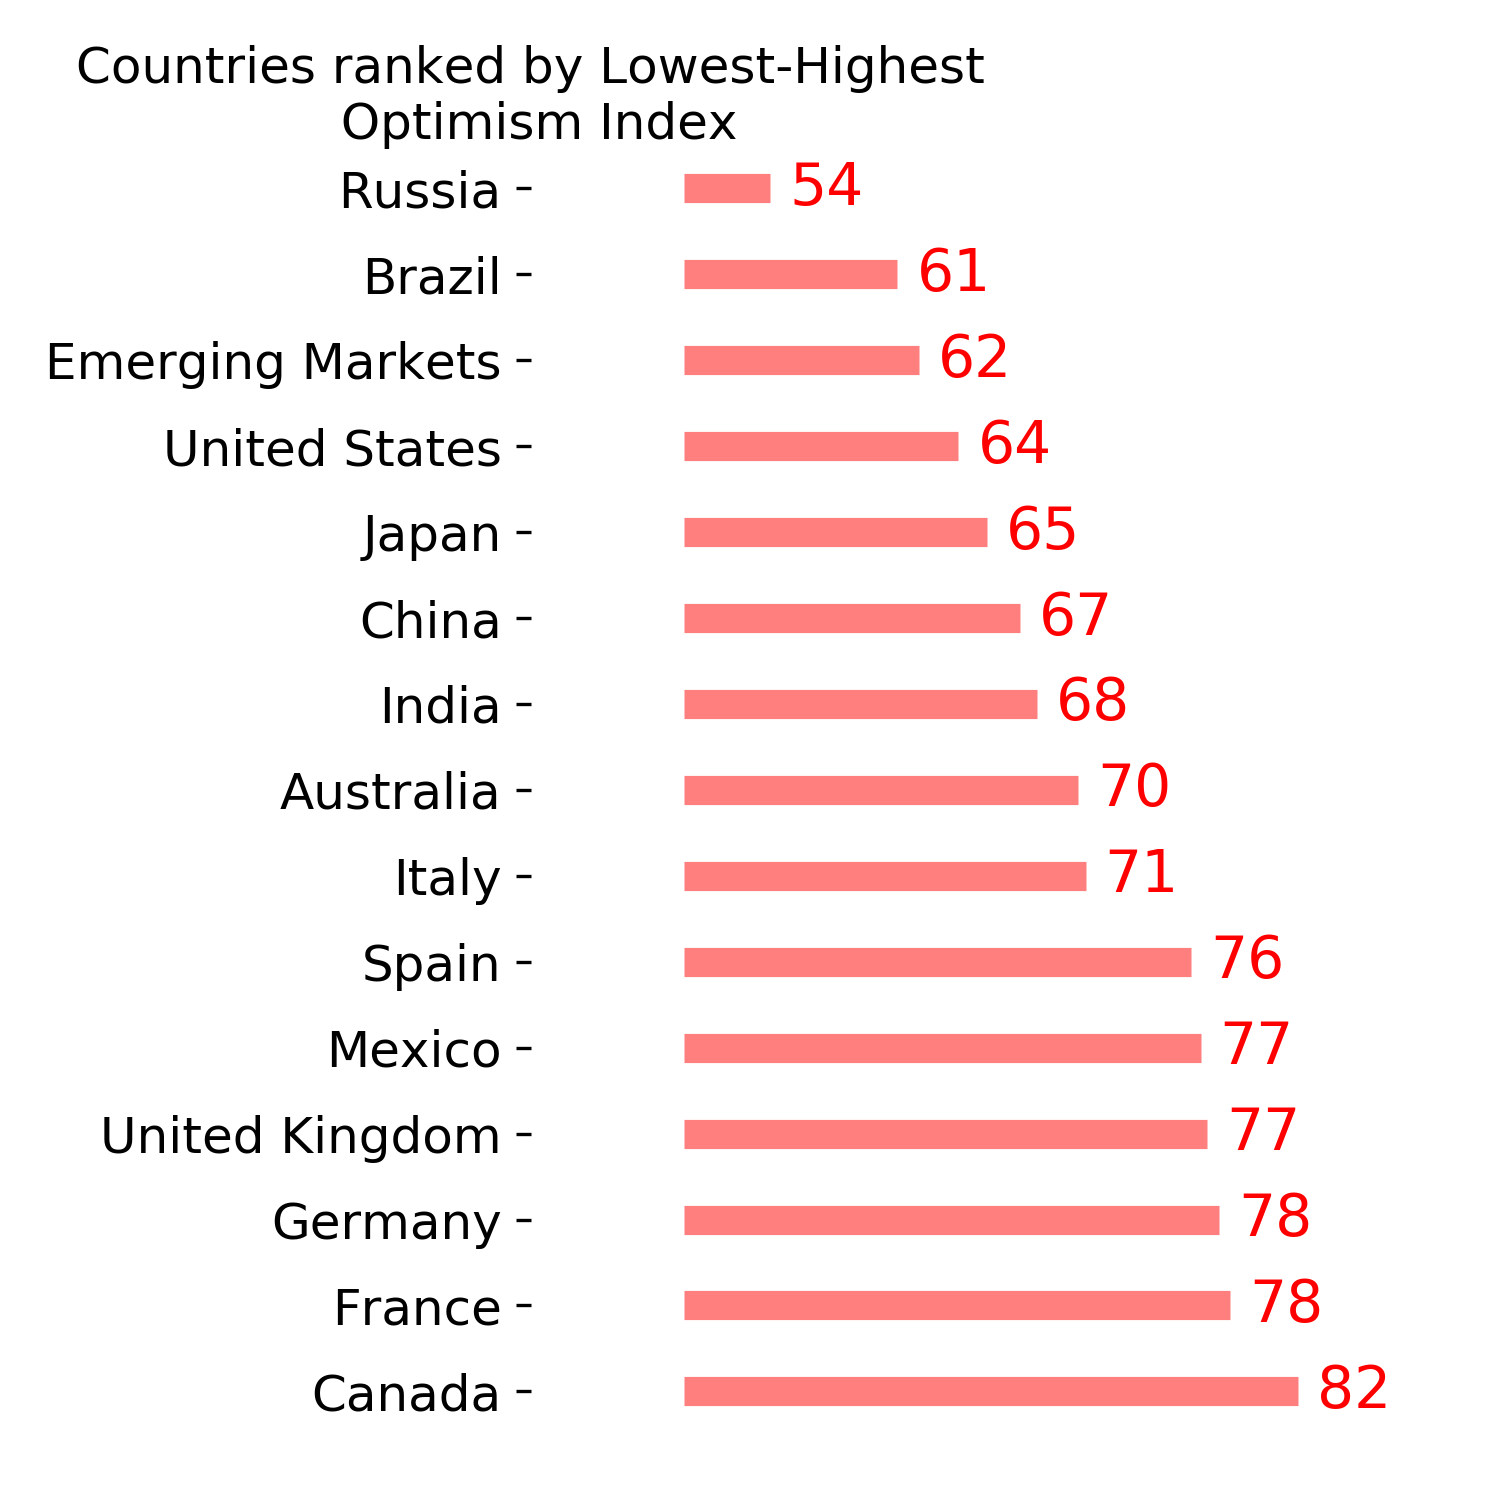
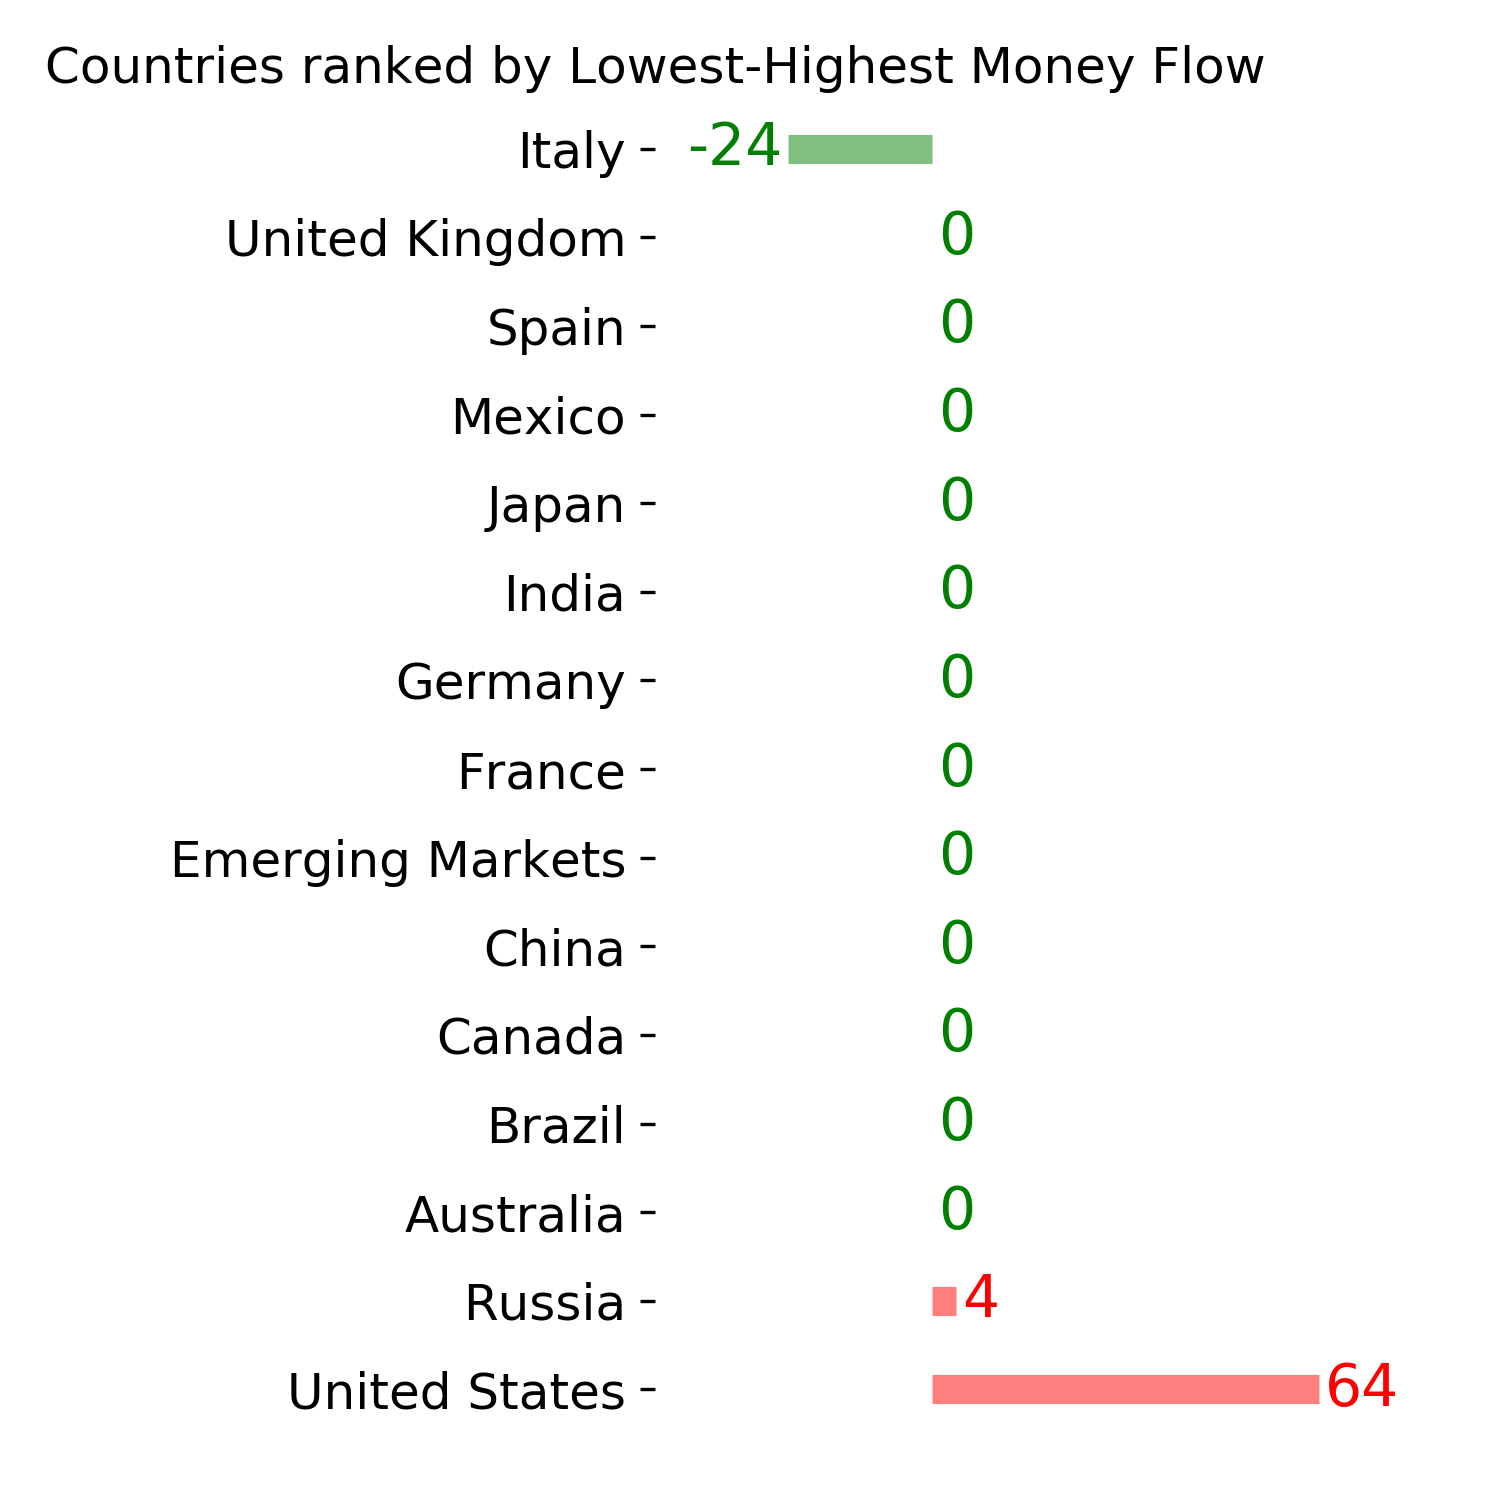
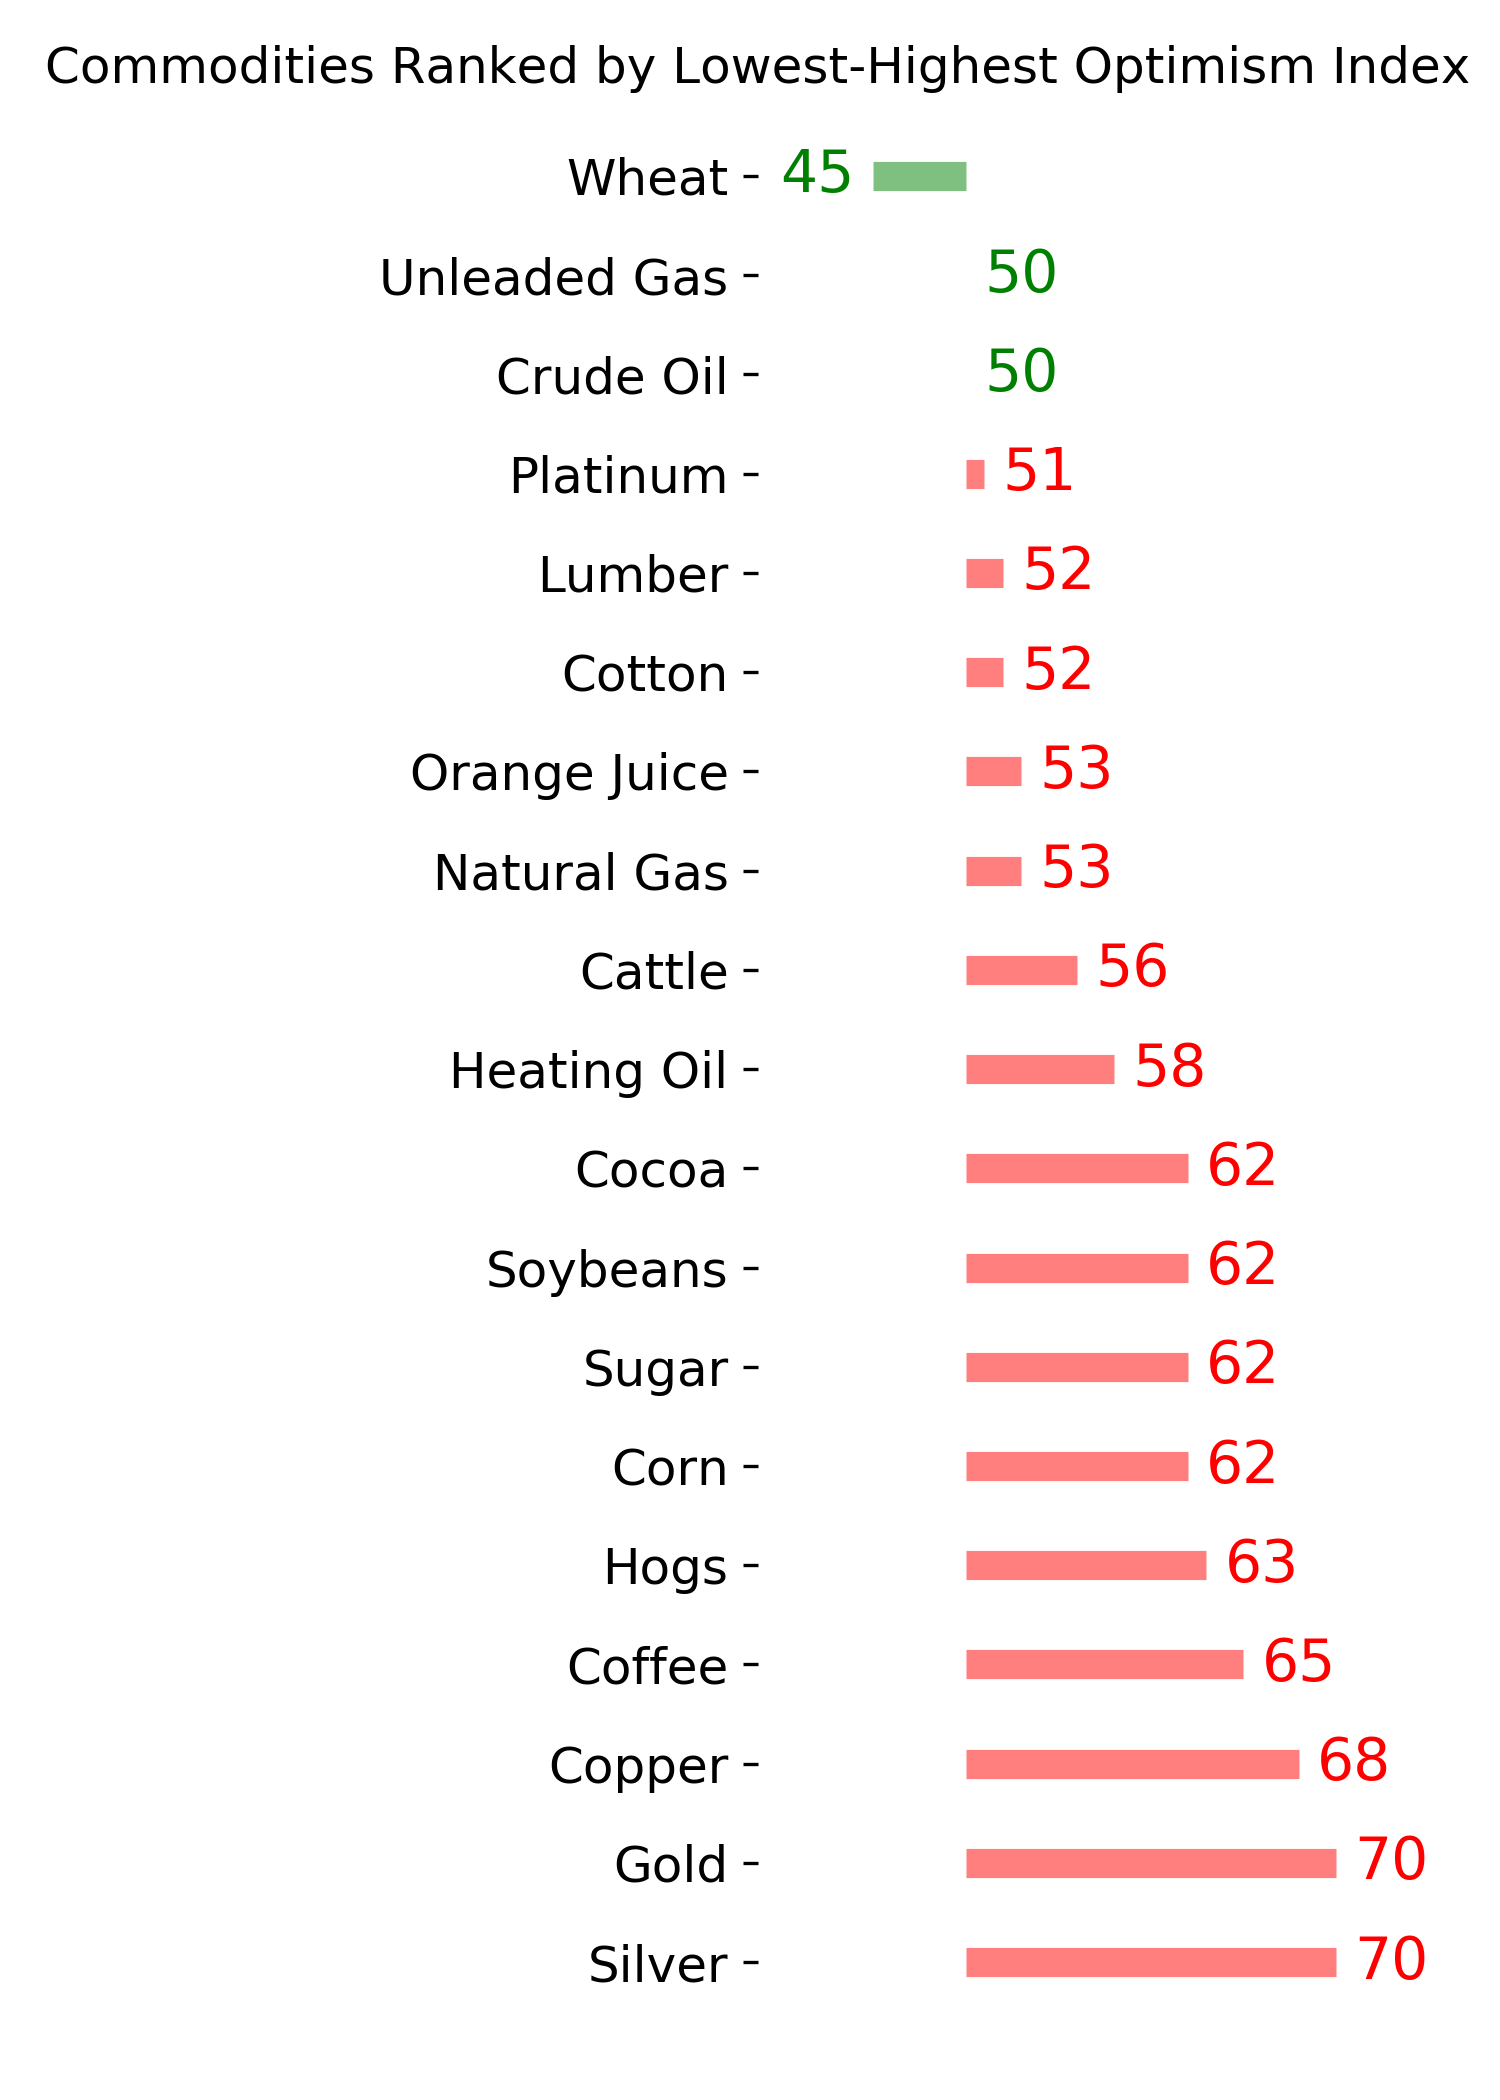
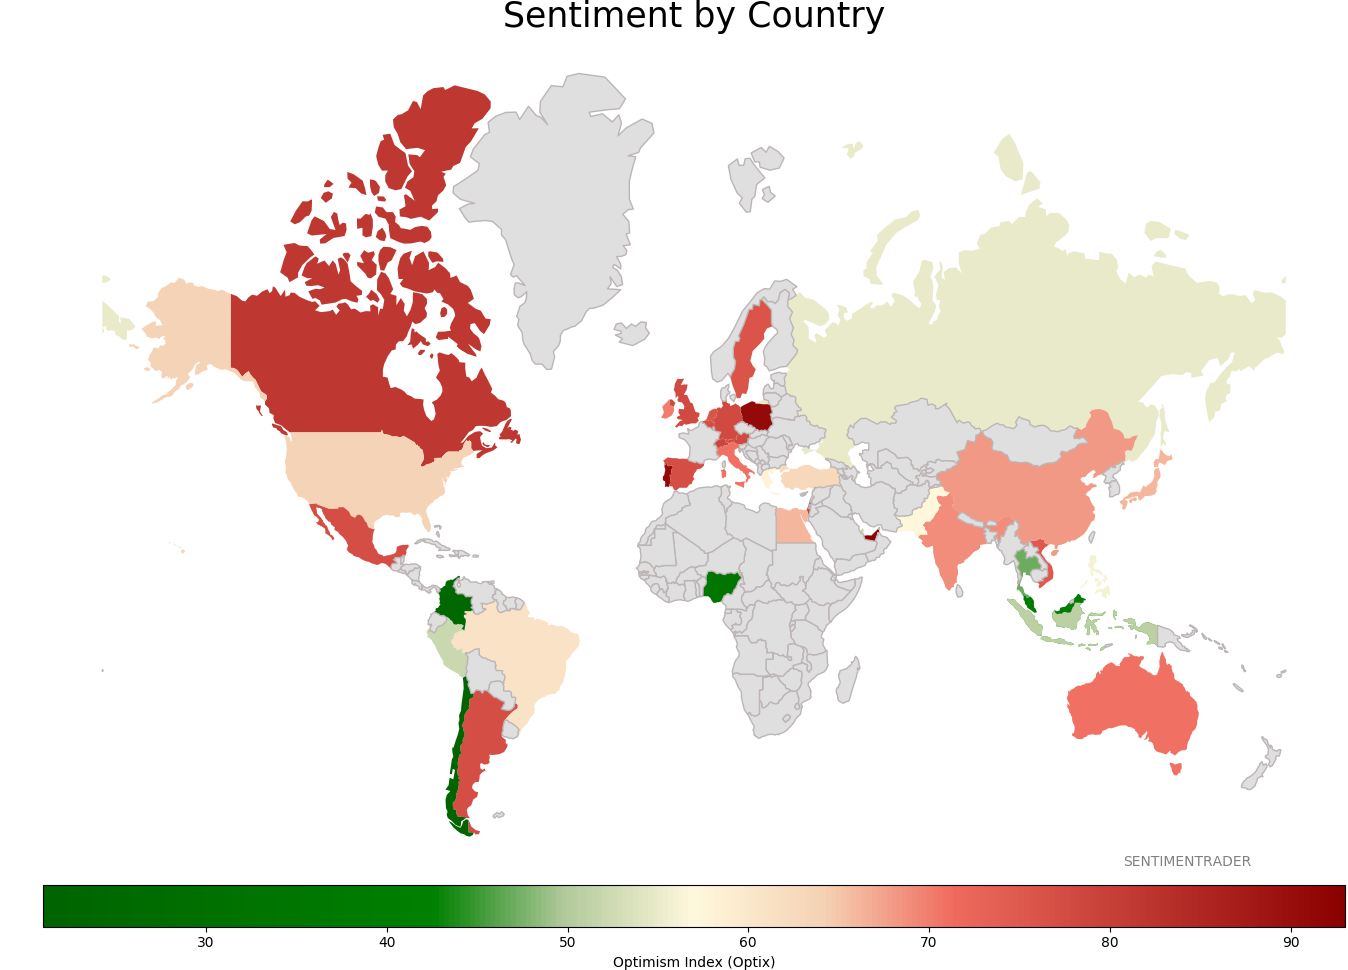
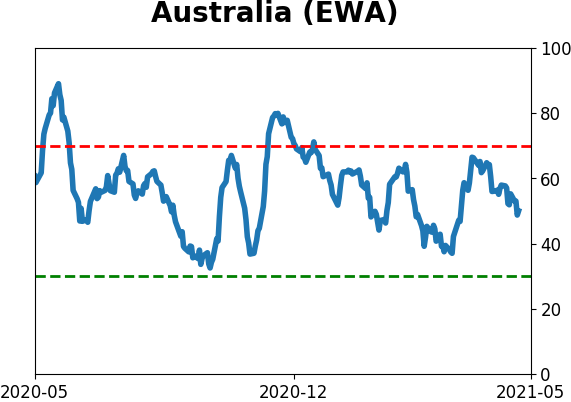
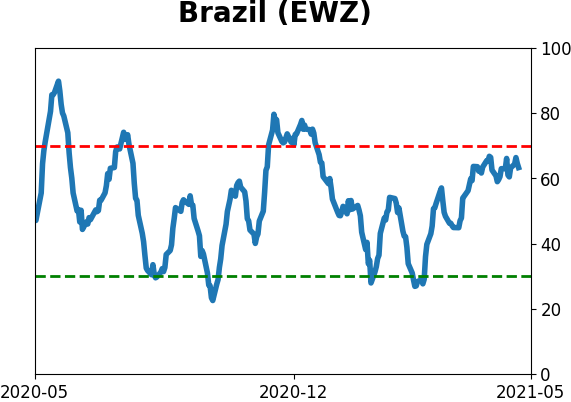
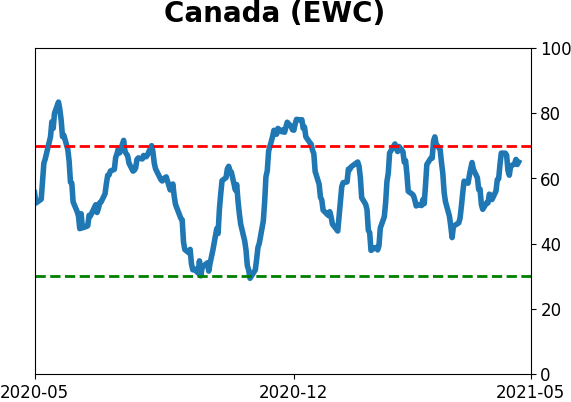
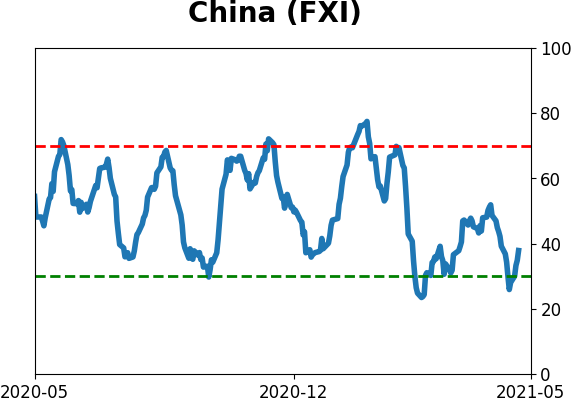
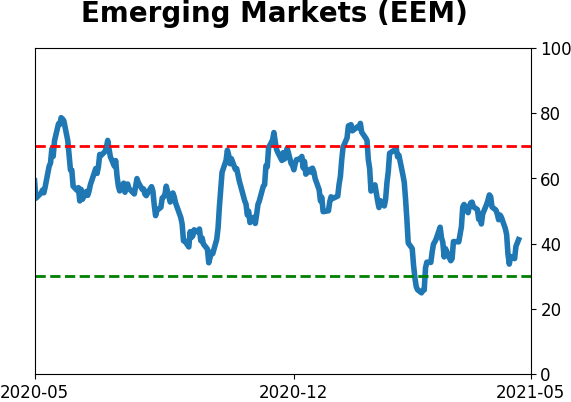
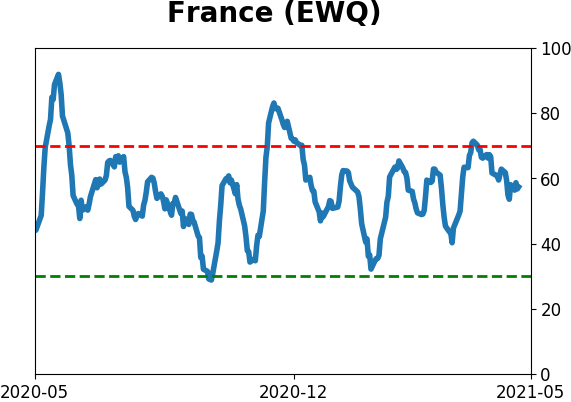
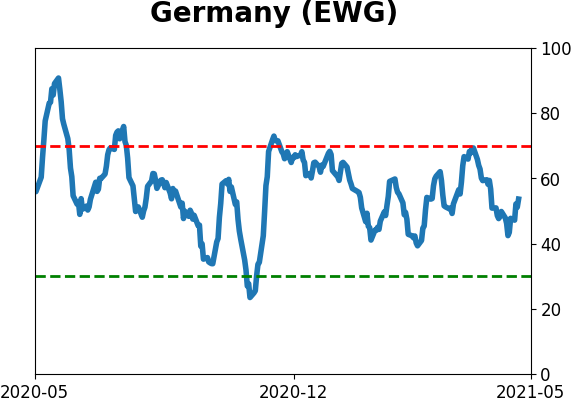
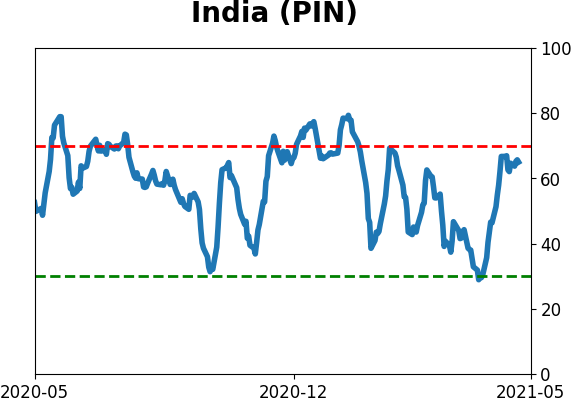
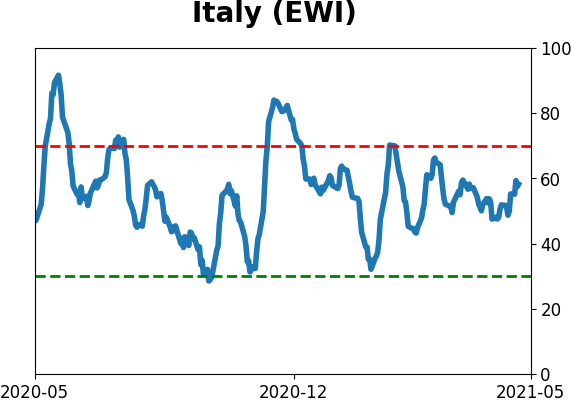
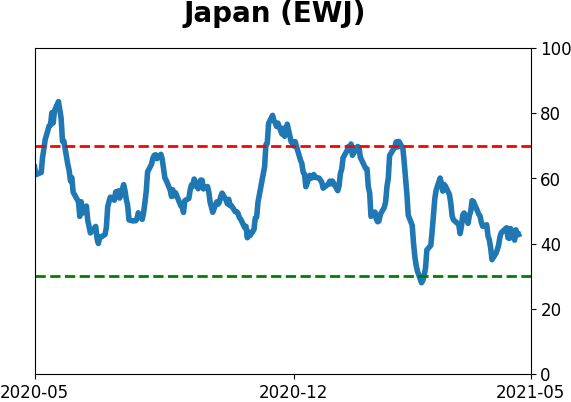
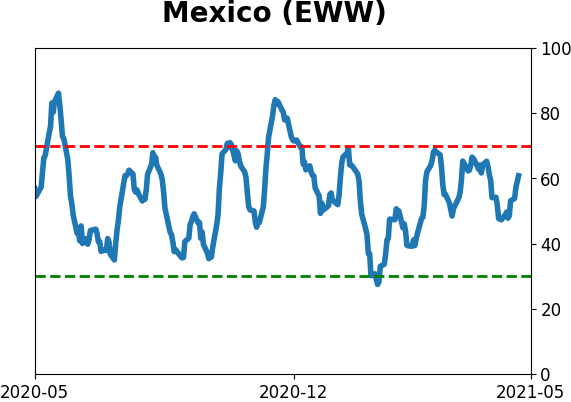
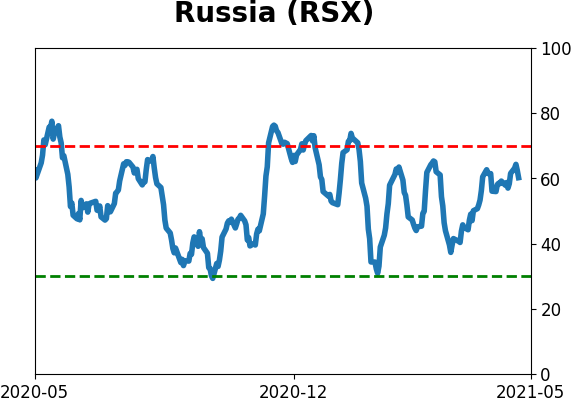
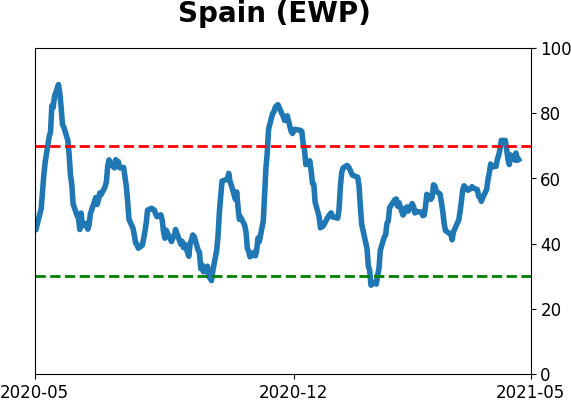
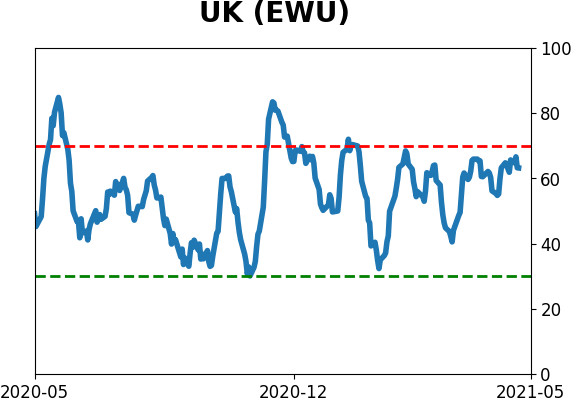
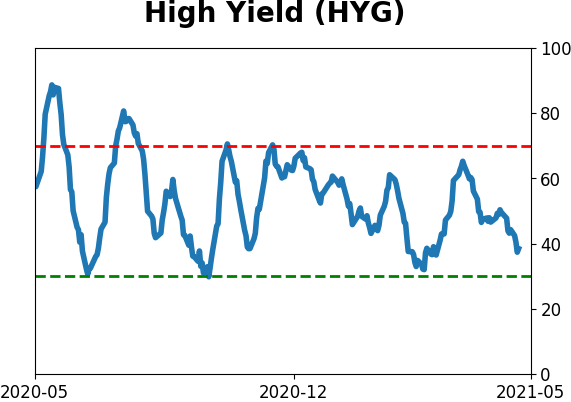
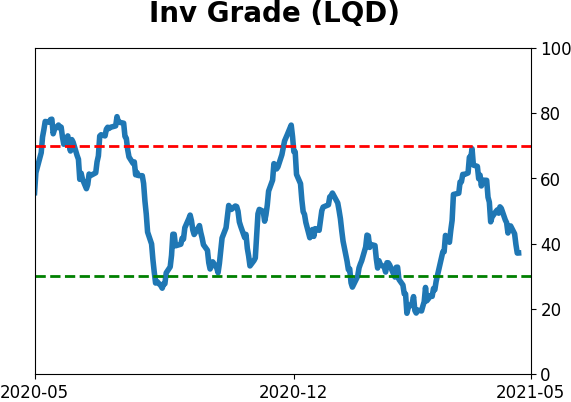
Sentiment Around The World
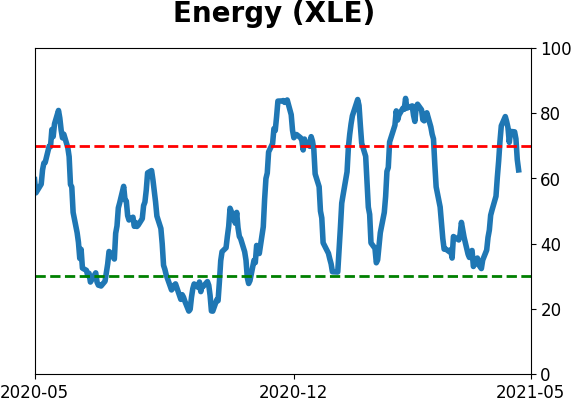
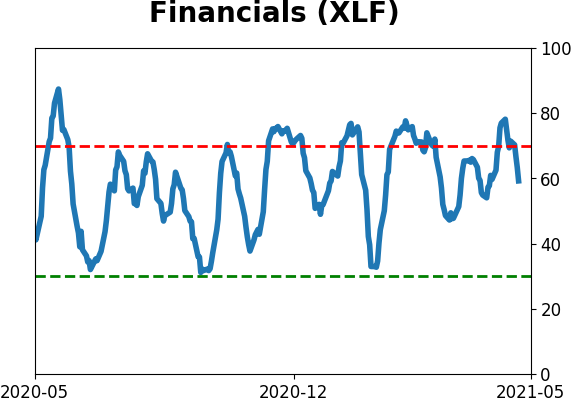
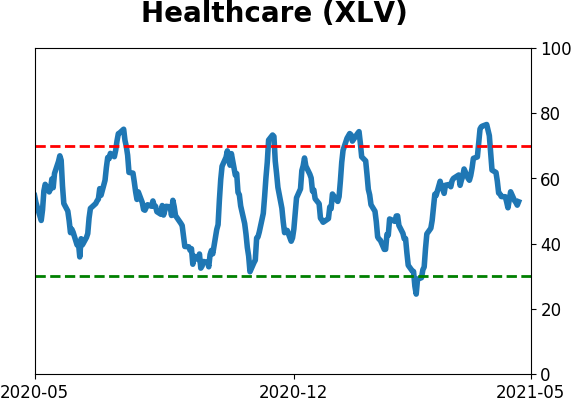
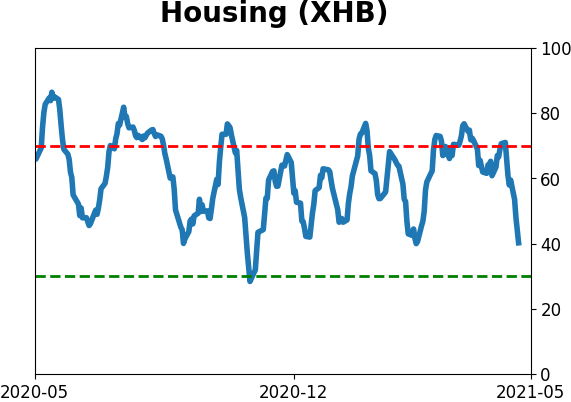
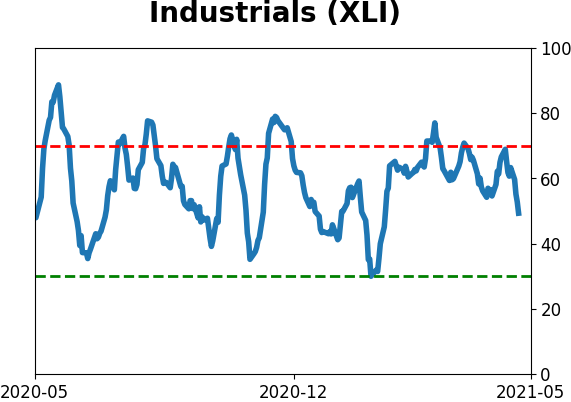
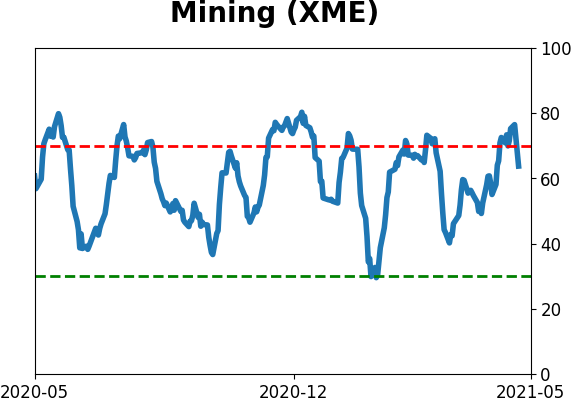
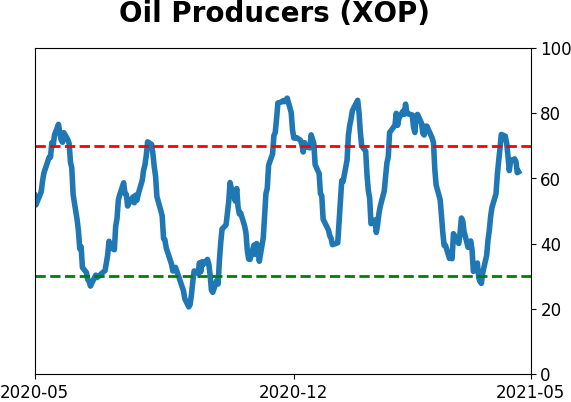
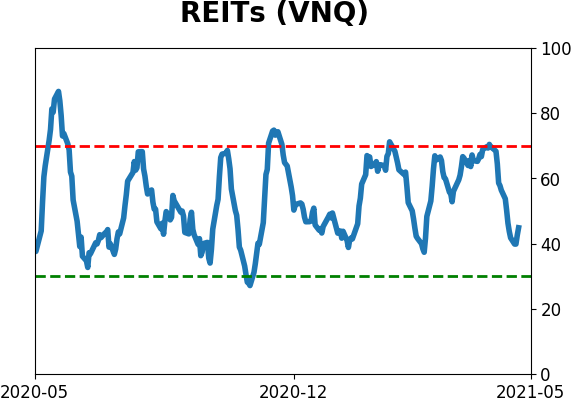
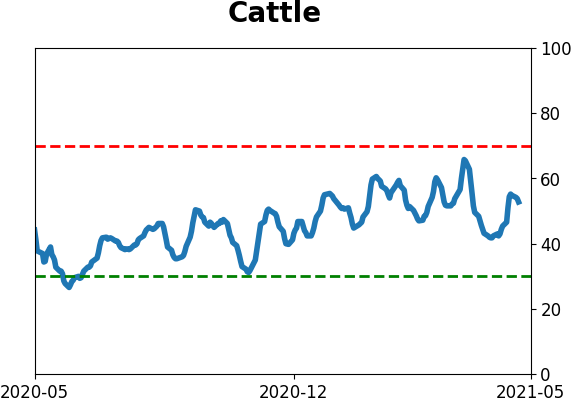
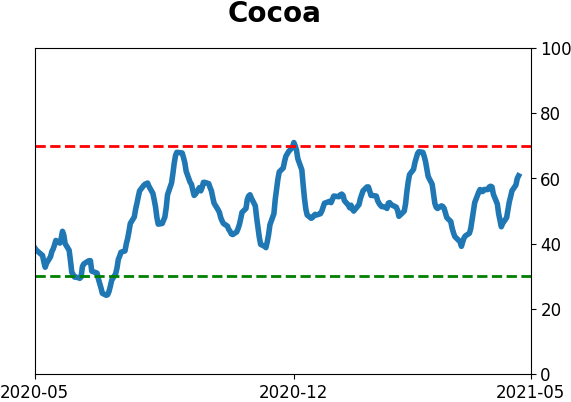
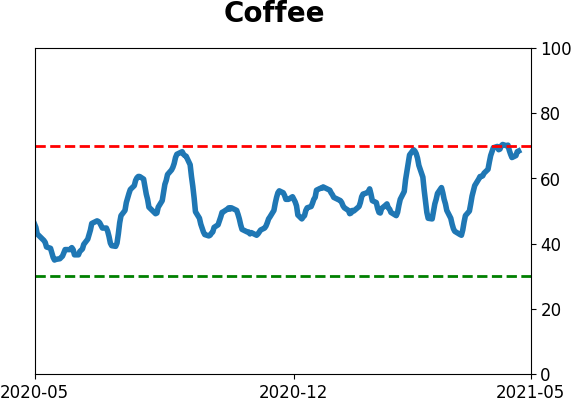
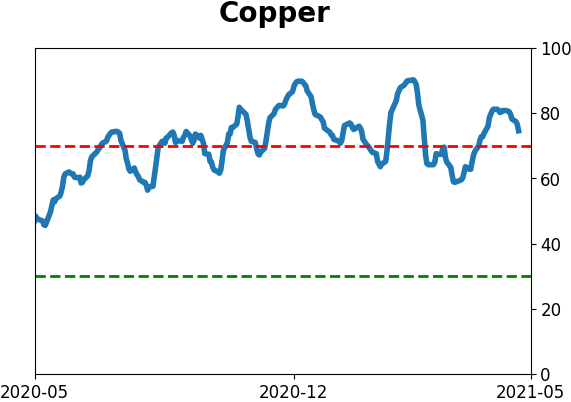
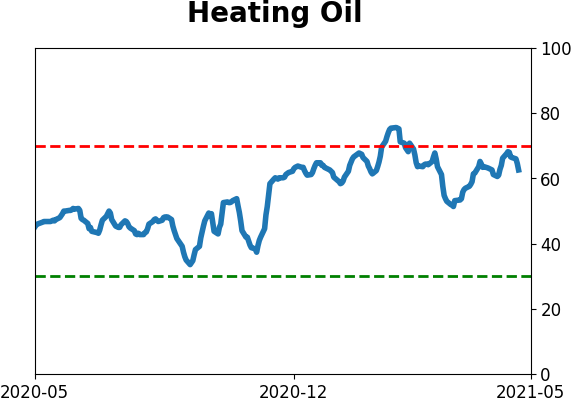
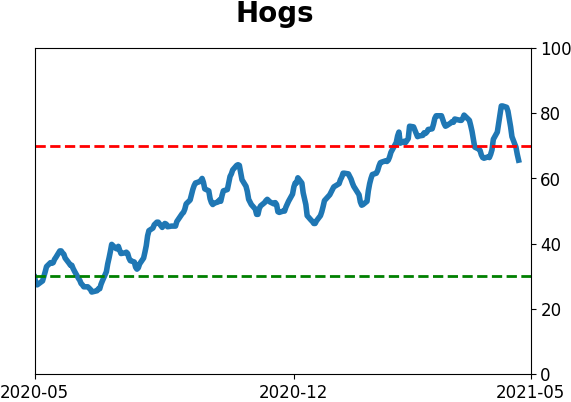
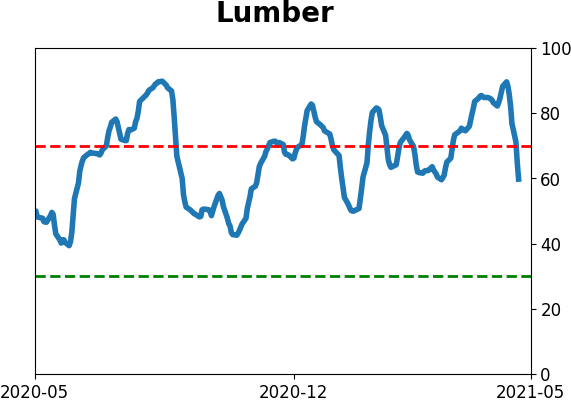
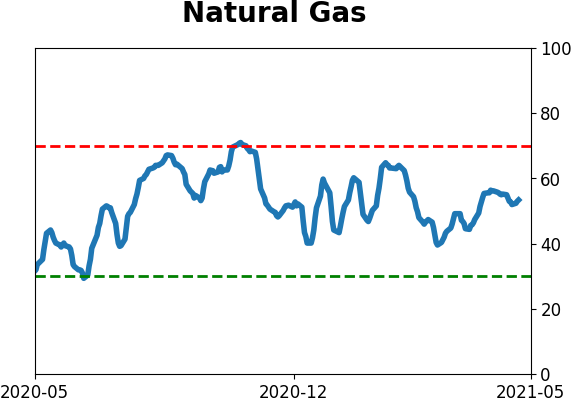
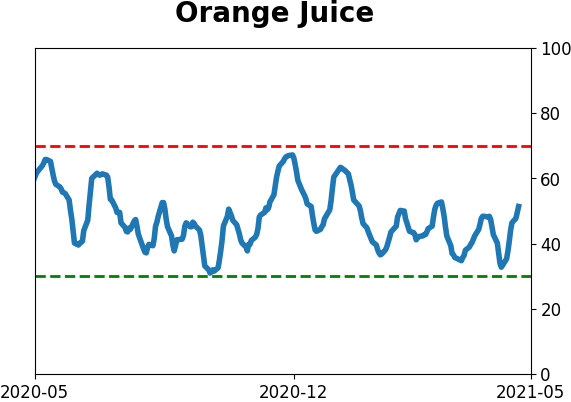
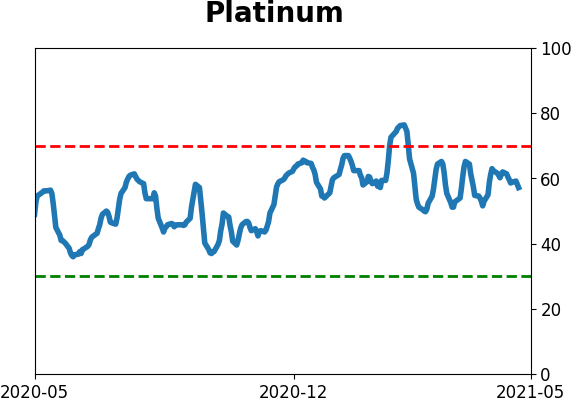
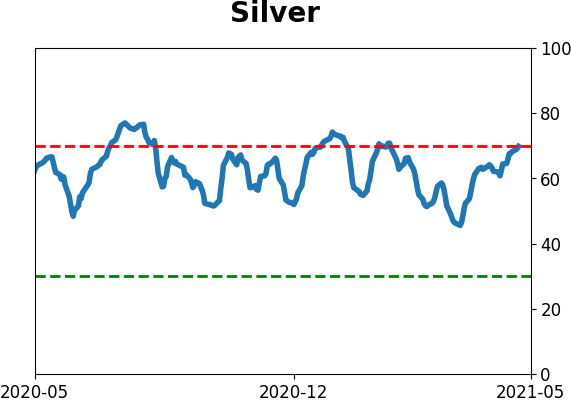
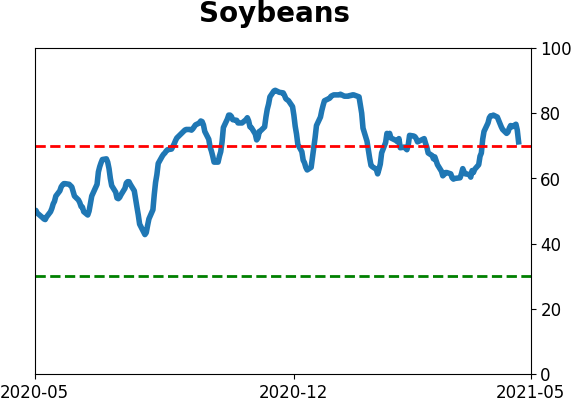
Optimism Index Thumbnails
|
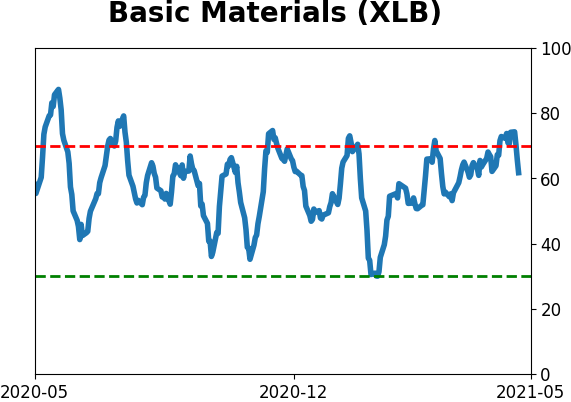
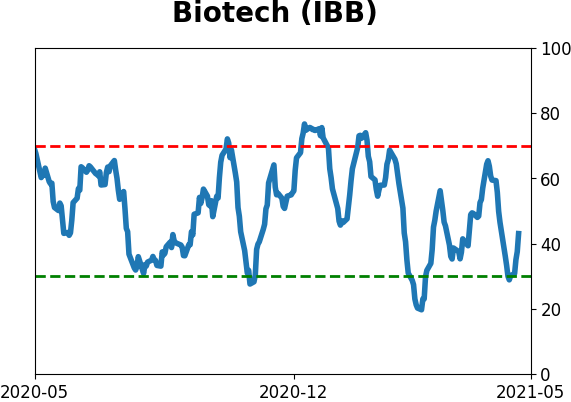
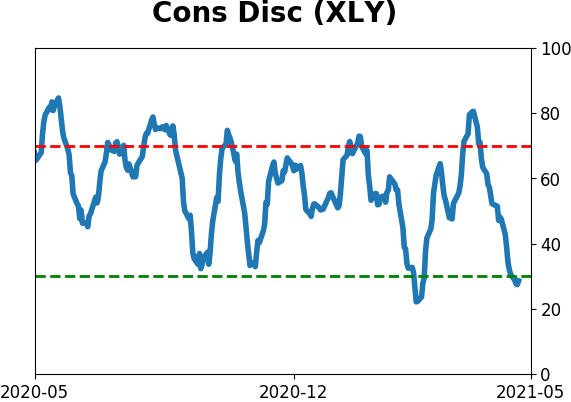
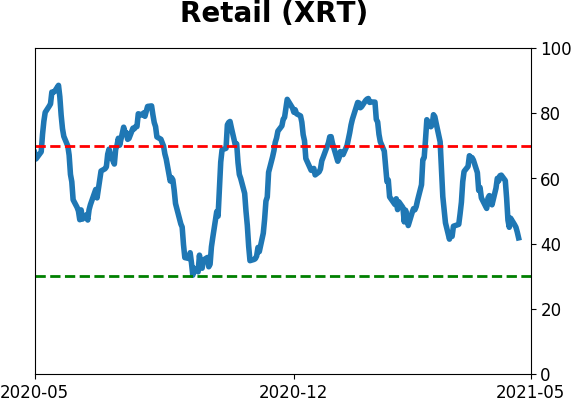
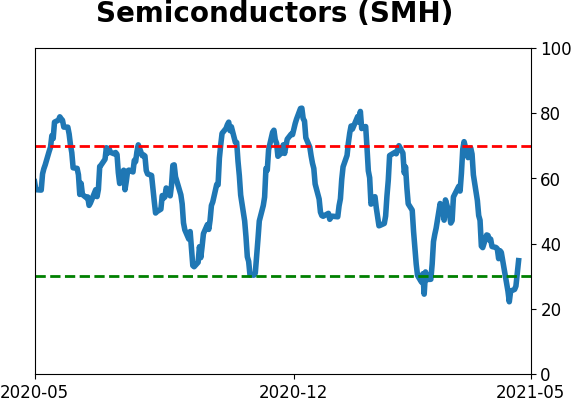
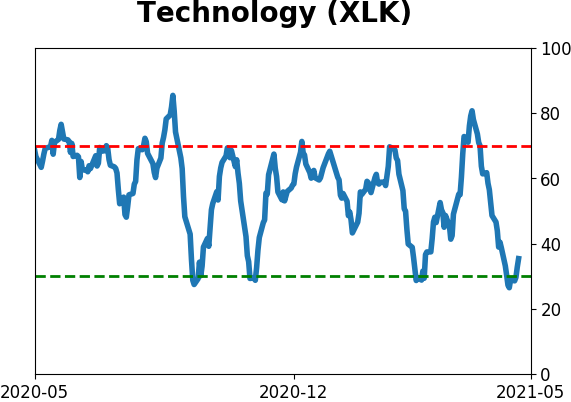
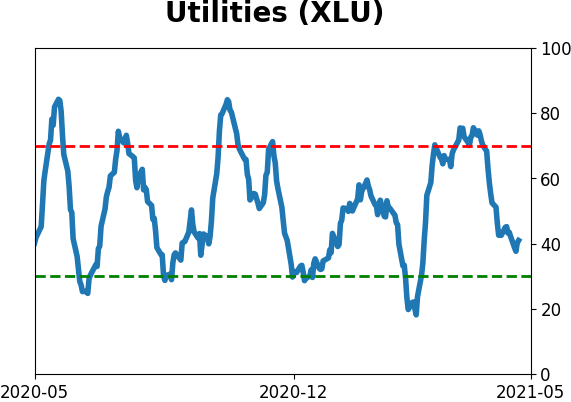
Sector ETF's - 10-Day Moving Average
|
|
|
Country ETF's - 10-Day Moving Average
|
|
|
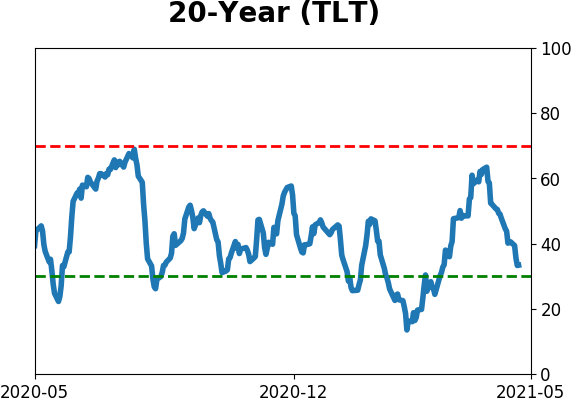
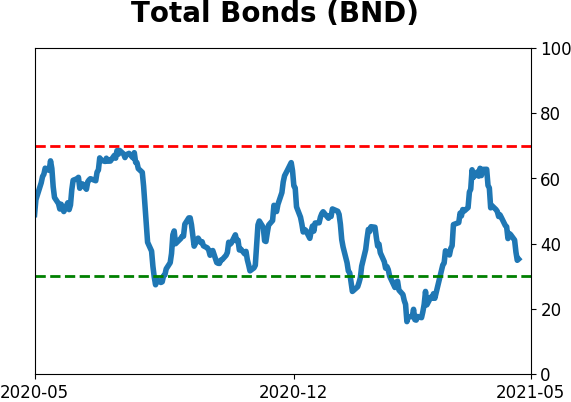
Bond ETF's - 10-Day Moving Average
|
|
|
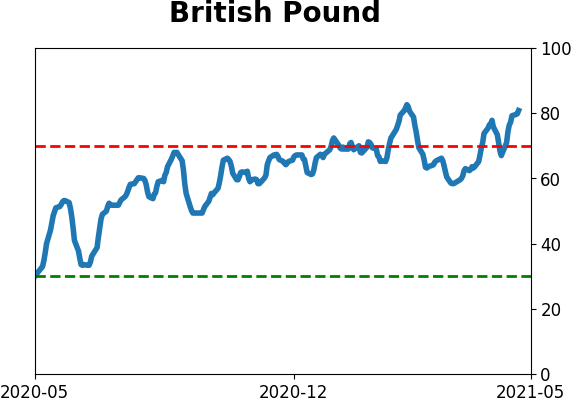
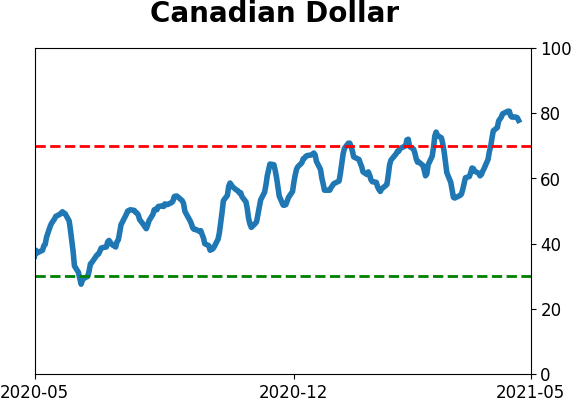
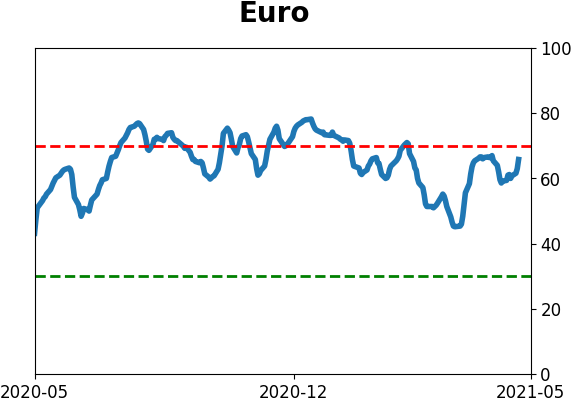
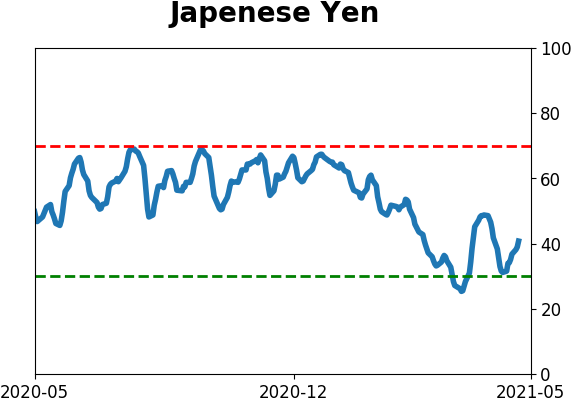
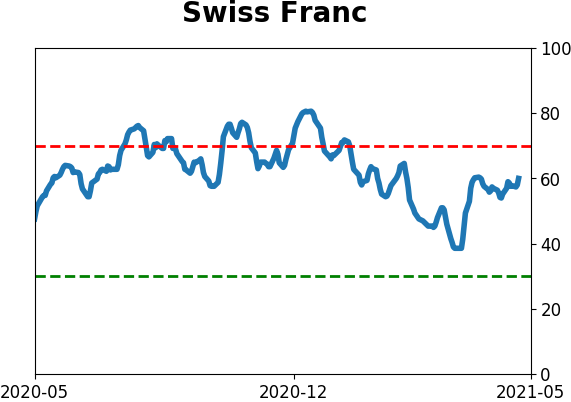
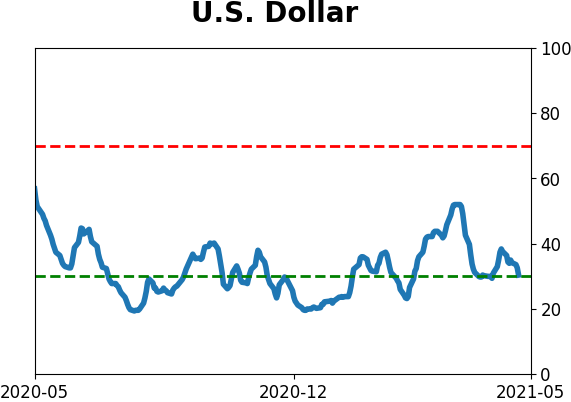
Currency ETF's - 5-Day Moving Average
|
|
|
Commodity ETF's - 5-Day Moving Average
|
|