Headlines
|
|
One of the largest selling clusters in 60 years:
Investors have been selling heavily and Wednesday saw another day with less than 10% of NYSE volume flowing into advancing stocks. That caps a cluster of such days over the past two weeks. Breadth has been historically volatile, and pessimism is rampant.
|
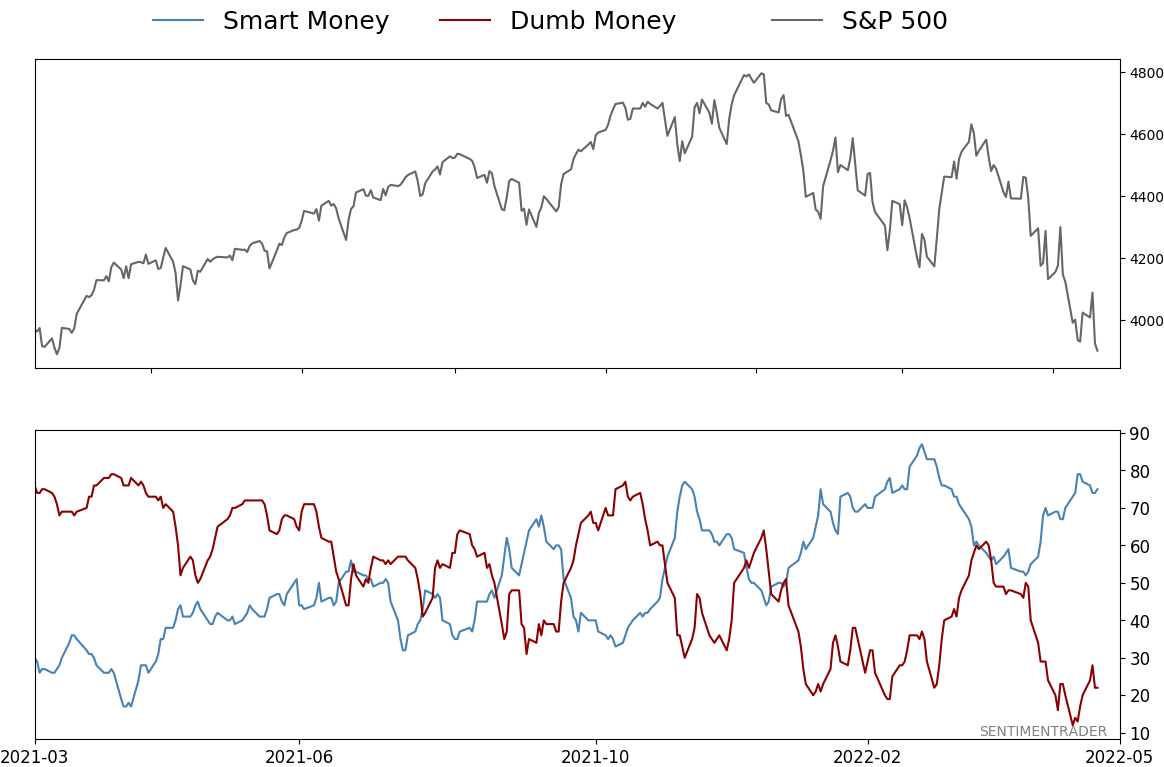
Smart / Dumb Money Confidence
|
Smart Money Confidence: 75%
Dumb Money Confidence: 22%
|
|
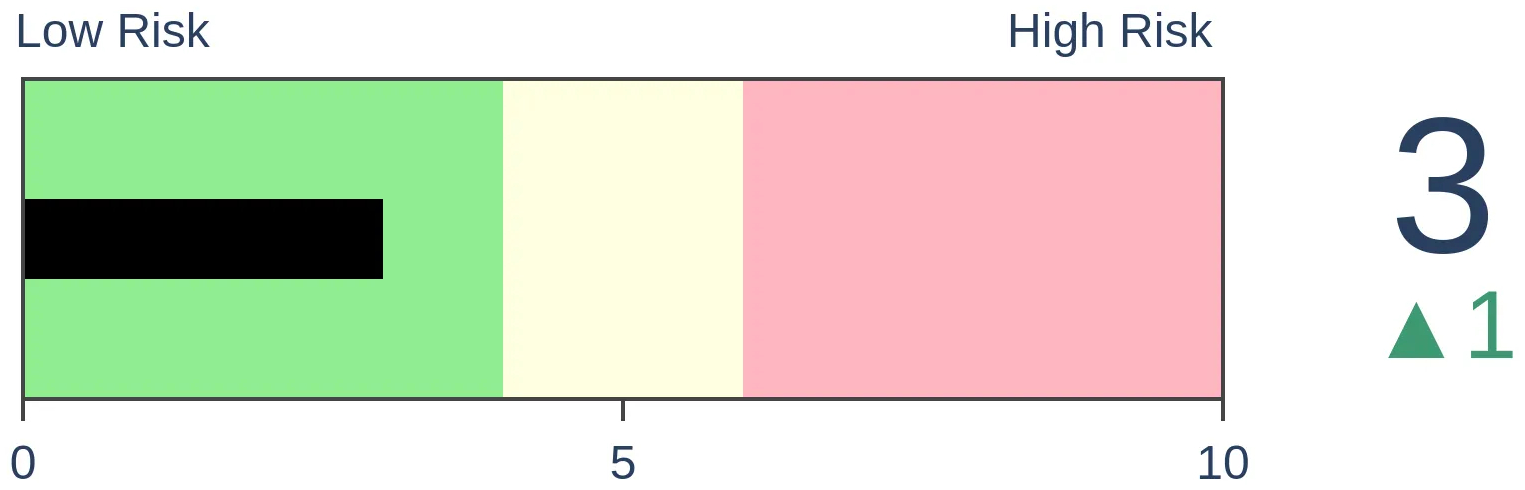
Risk Levels
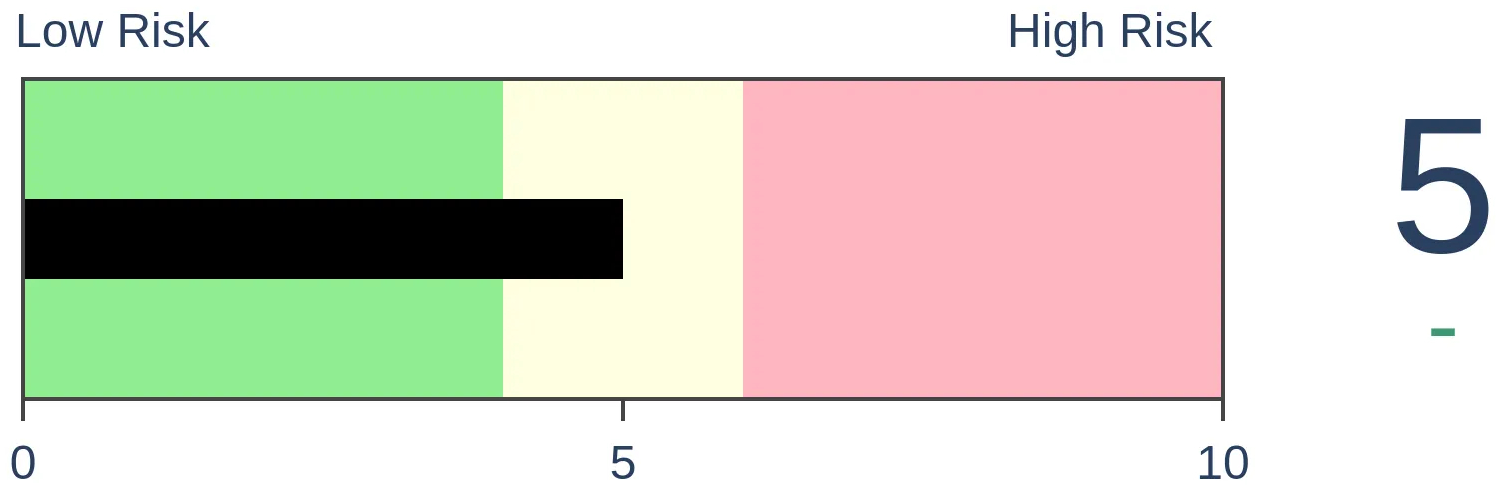
Stocks Short-Term
|
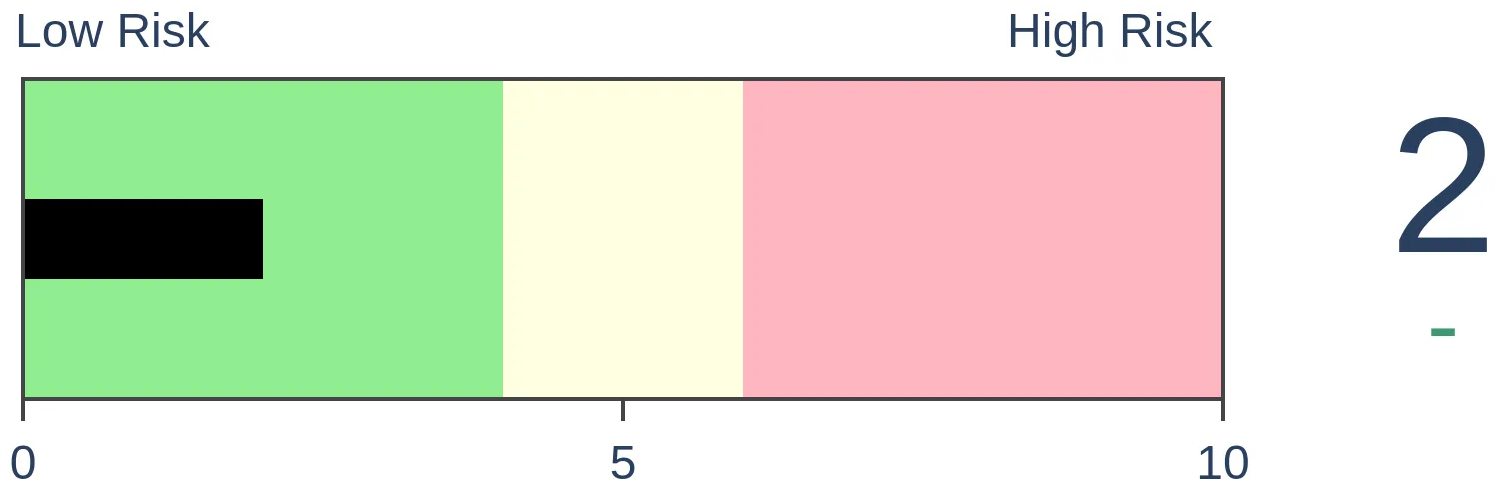
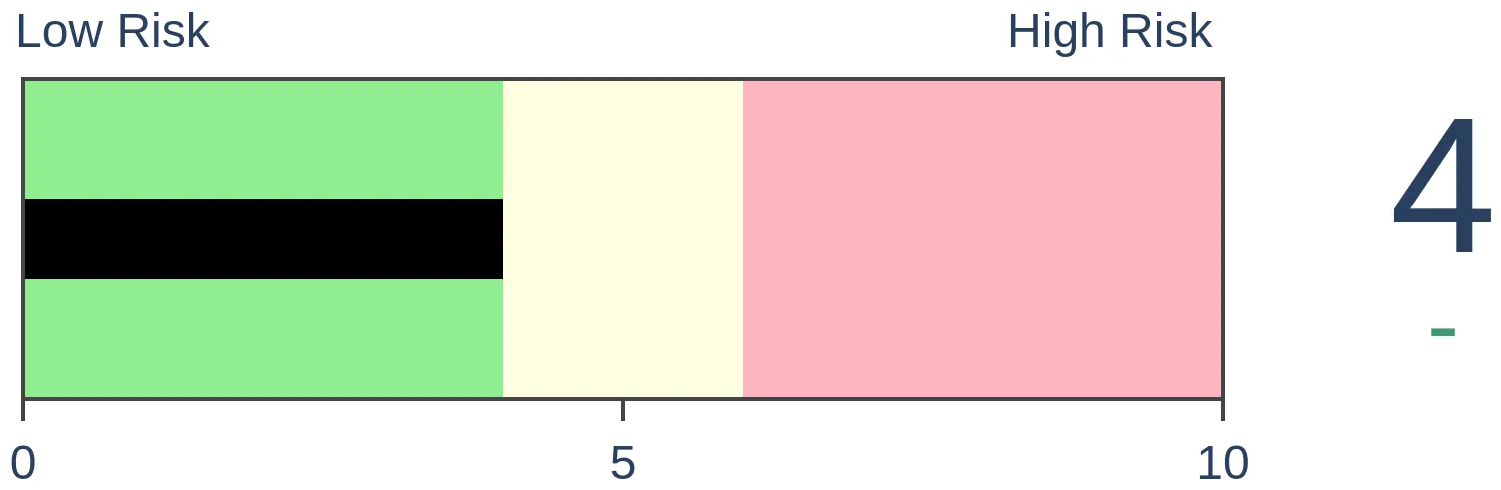
Stocks Medium-Term
|
|
Bonds
|
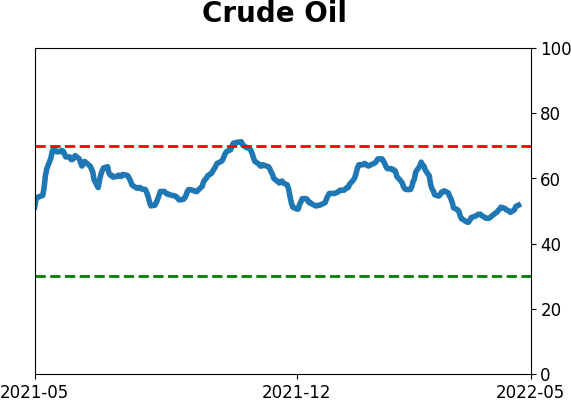
Crude Oil

|
|
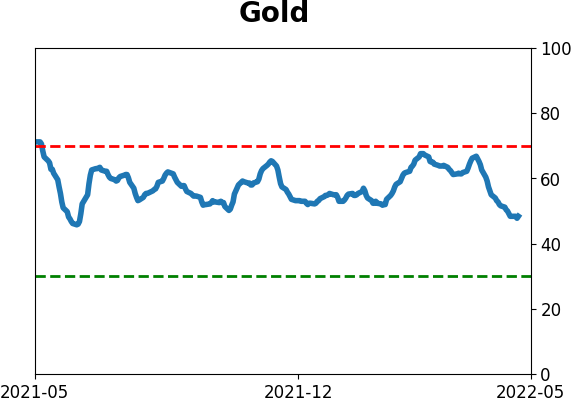
Gold

|
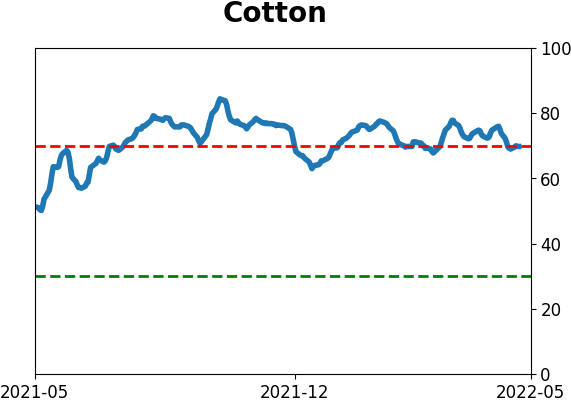
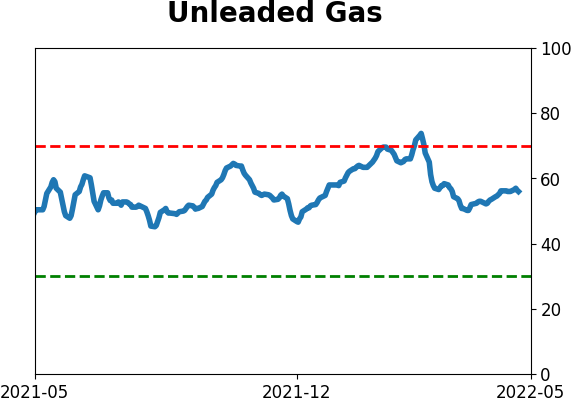
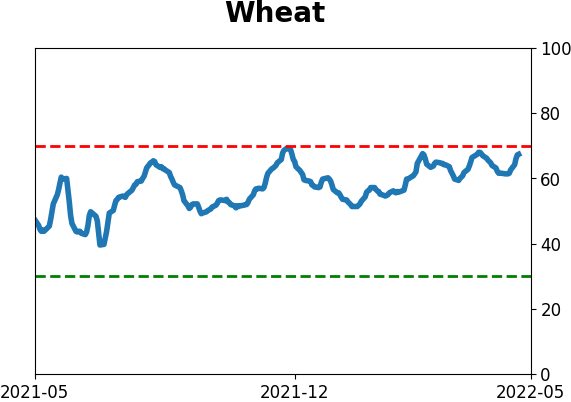
Agriculture
|
|
Research
By Jason Goepfert
BOTTOM LINE
Investors have been selling heavily and Wednesday saw another day with less than 10% of NYSE volume flowing into advancing stocks. That caps a cluster of such days over the past two weeks. Breadth has been historically volatile, and pessimism is rampant.
FORECAST / TIMEFRAME
None
|
Key points:
- Wednesday's heavy selling pressure capped what has been a cluster of selling for two weeks
- Breadth has been extremely volatile, with a large cluster of positive and negative volume flows
- Pessimism has become rampant, with 50% of our indicators at extremes
- Stocks are set to gap down after a huge down day yesterday
- Similar conditions tended to lead to rebounds, except for waterfall declines in July 2002 and October 2008
A historic cluster of selling pressure
This is probably the most brutal market I've encountered in 20 years of publishing, 30 years of investing, and 80 years of data history. The 1930s were more consistently and more egregiously difficult, and maybe the 1970s could rival it. But in terms of value destruction and lack of alternative investments holding value, this will rank among the worst several months for investors ever.
The sheer overwhelming selling pressure has been remarkable. When stocks drop, almost everything drops. And volume has been almost entirely one-sided. Wednesday marked the third session in ten days when less than 10% of NYSE volume flowed into advancing securities.
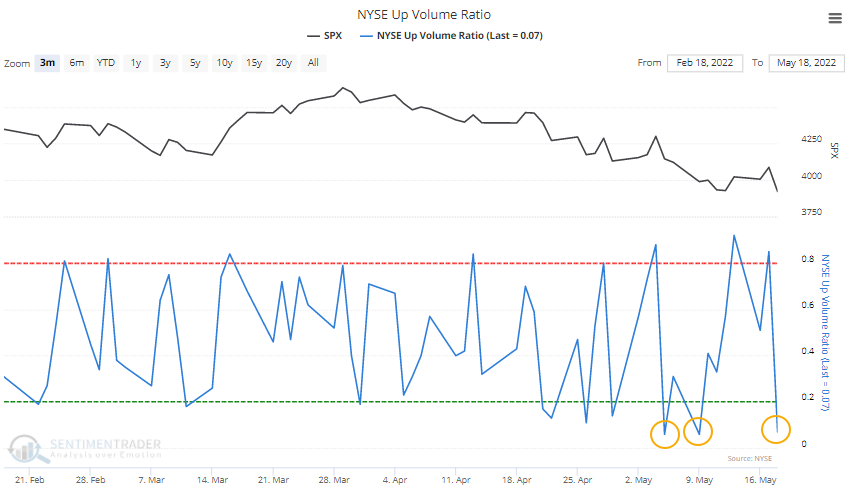
That's enough to rank among the most clustered bouts of severe selling in 60 years.
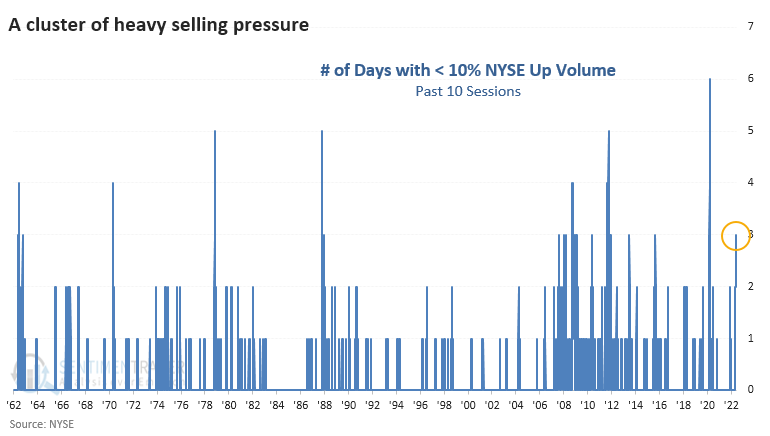
Such severe selling clusters tended to coincide with exhaustive climaxes and positive future returns, with the glaring exception of the financial crisis when it was a regular feature. Outside of that crisis, the S&P 500 rallied during the next 6-12 months after each signal.
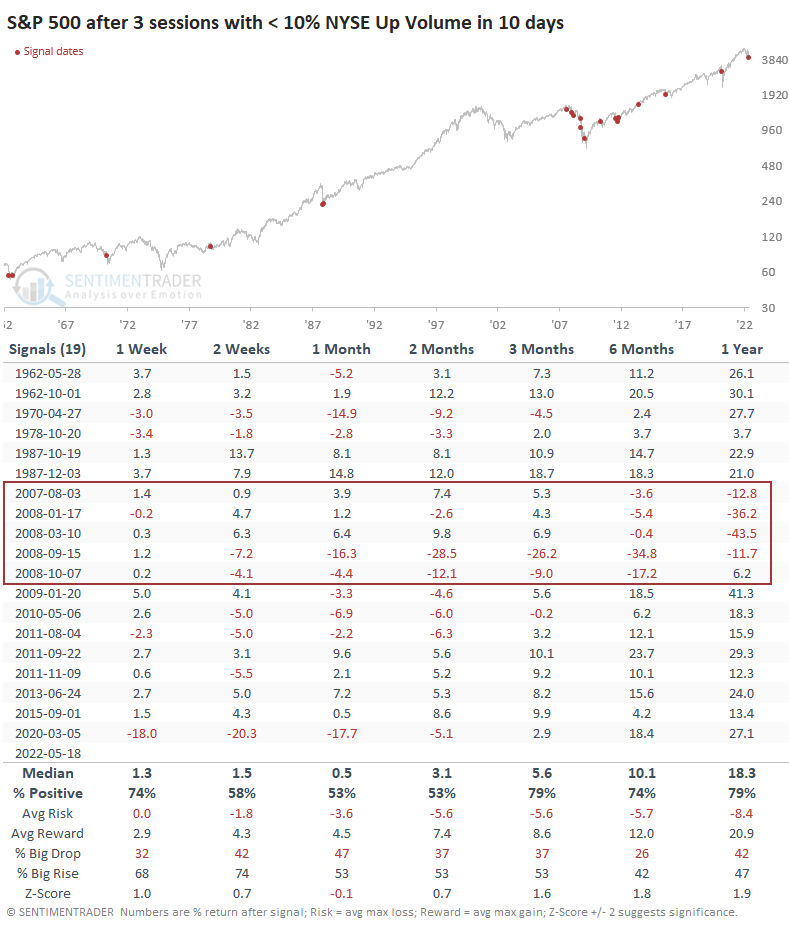
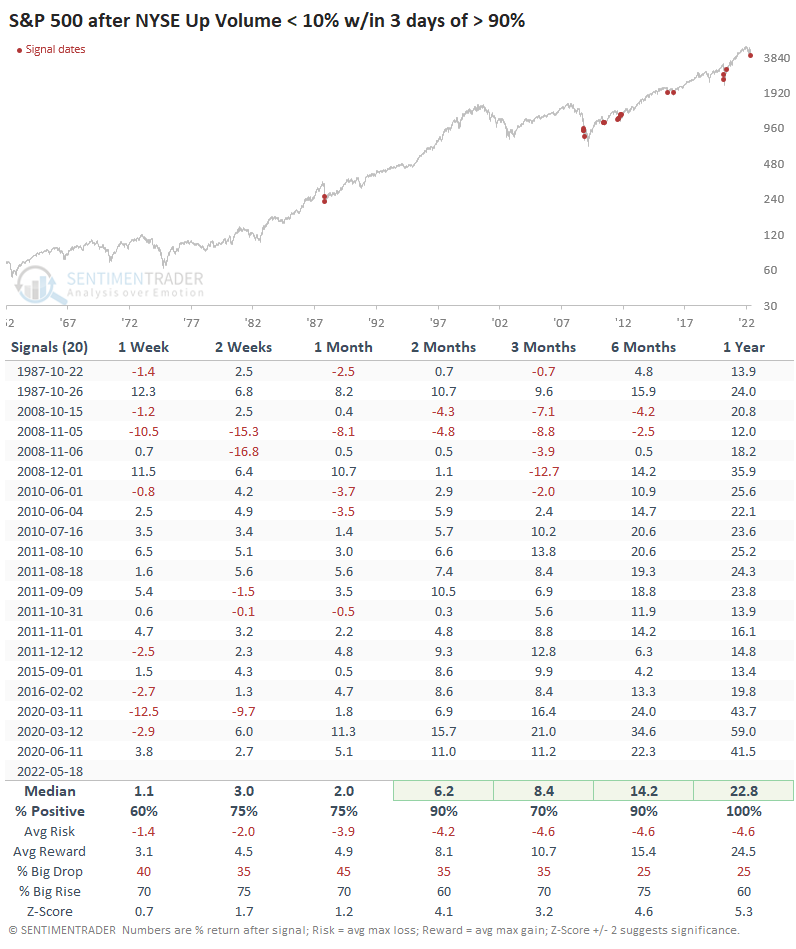
What's depressing about Wednesday's session is that it occurred so soon after investors had been so aggressive the other way. On Friday, more than 90% of volume flowed into advancing stocks. An old market cliche is that we only see severe reversals like this during bear markets. Well, maybe, but if that's the case, it was an excellent time to be a buyer because the S&P sported double-digit gains over the next year.
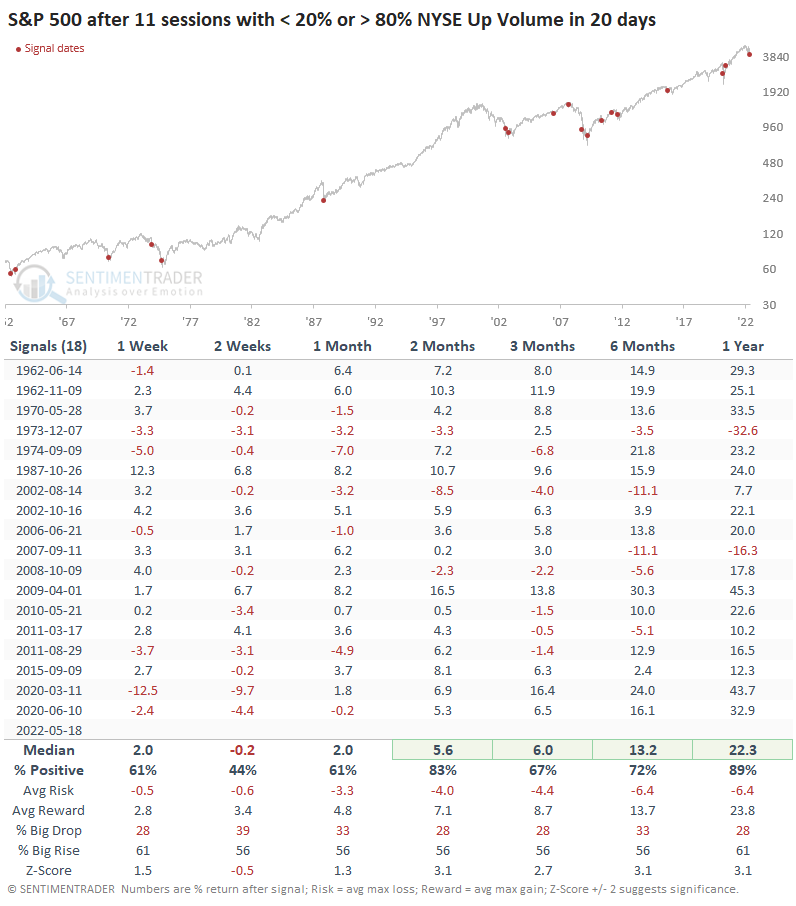
A volatile stretch of all-or-nothing days
This has been a remarkable stretch of volatility in breadth data. While the figures have become more volatile over the past 20 years thanks to structural reasons (decimalization, high-frequency trading, etc.), this still ranks as one of the most significant clusters of extreme volume flows since 1962.
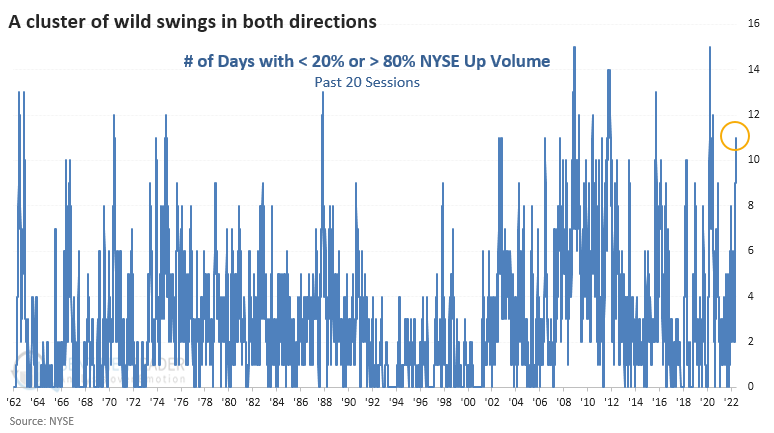
Similar clusters tended to precede positive medium- to long-term returns, but they also triggered relatively early in bear markets in 1973 and 2007.
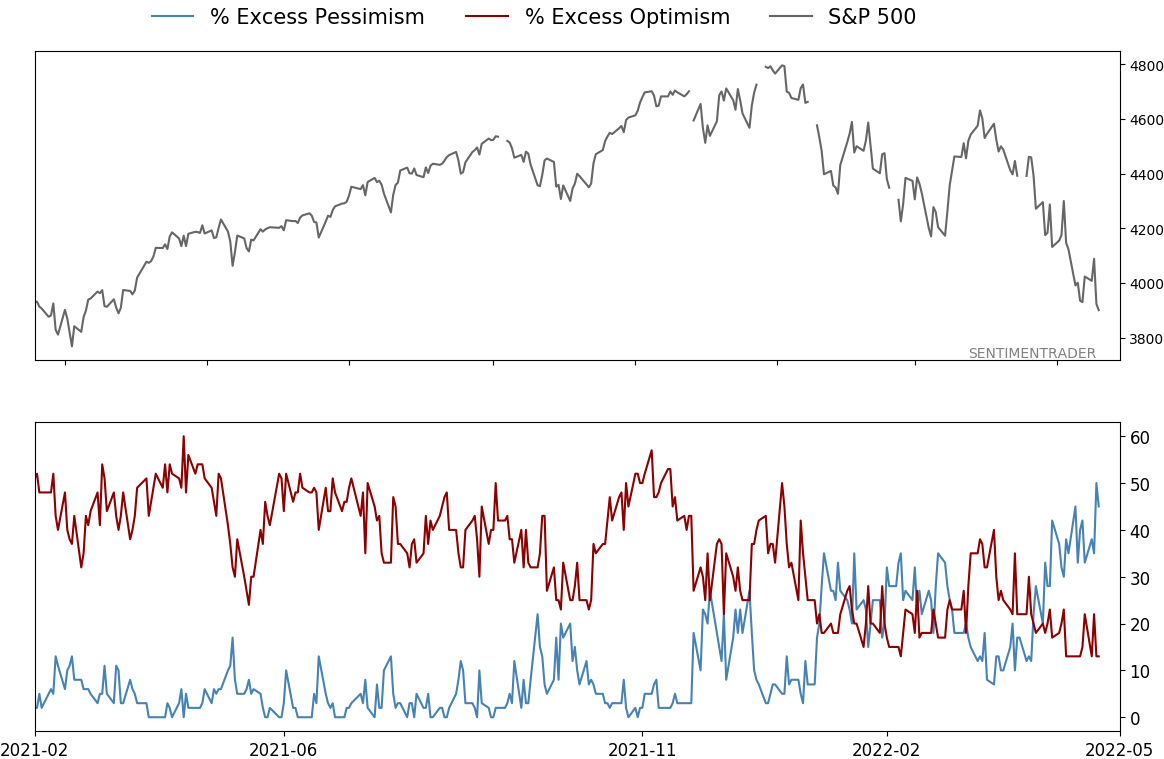
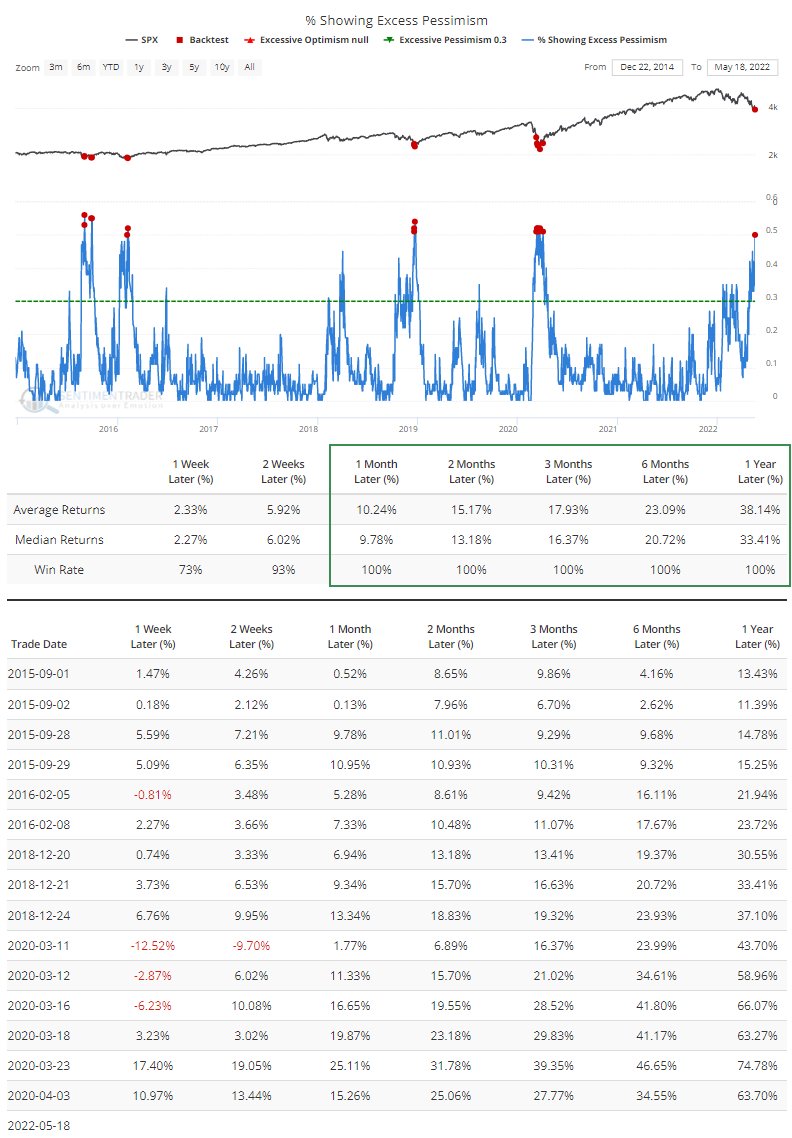
Pessimism is rampant
We already know that sentiment is washed out, but pessimism became even more widespread during Wednesday's session. For one of the few times since the financial crisis, half of our indicators are now showing extreme pessimism. The Backtest Engine shows that the S&P still lost more than 10% when it was triggered during the pandemic, but otherwise, returns were excellent.
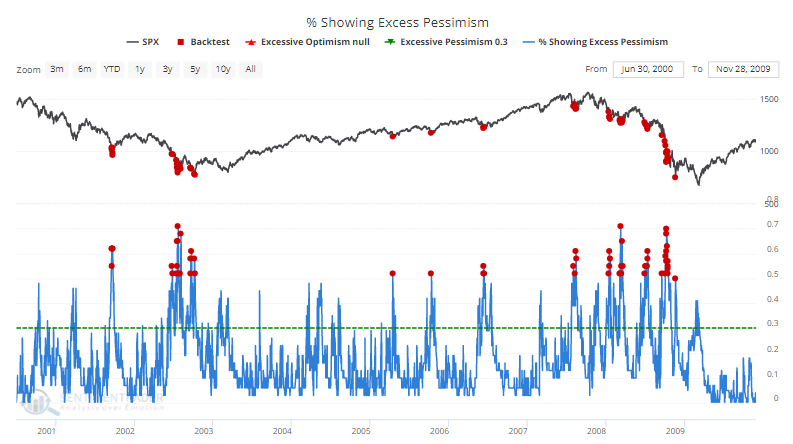
Going back to when we started calculating this, it's not as pretty of a picture for bulls. It mainly occurred during short-term bottoms, but with the notable exceptions of the waterfall declines during July 2002 and October 2008. The biggest caveat is that we had fewer indicators then, so seeing more than 50% of them at extremes was easier.
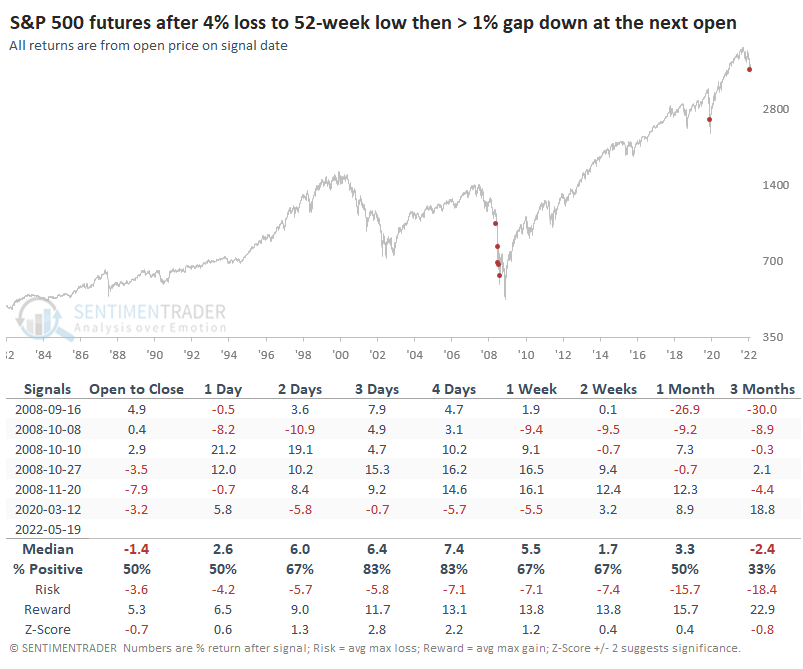
Even more selling at the open
As I'm publishing this, S&P 500 futures were priced to open more than 1% below yesterday's close but that has bounced a little bit. If they recover further, these studies may not trigger.
The indicated opening losses are on the heels of what had been a disastrous day yesterday. Since the inception of the futures in 1982, the only days that traders had to face this kind of one-two punch in the face were in 2008.
If we relax the threshold of yesterday's loss to "only" 3%, then we get a few more days, all during the worst bear markets of the past 40 years.
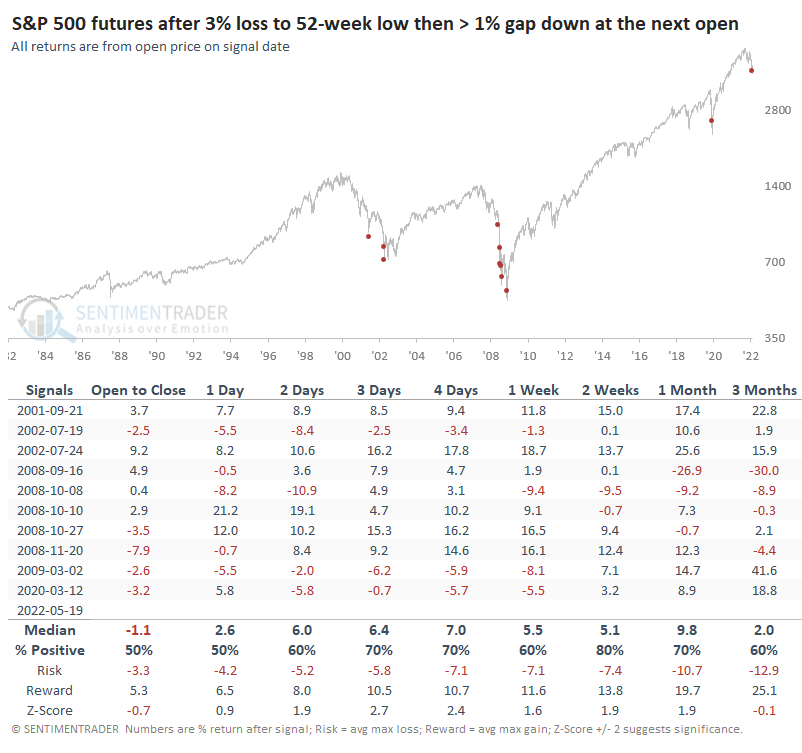
We can see from the tables that the futures tended to rebound from the open when holding over the next several sessions, but with the caveat of some big losses in there.
What the research tells us...
This is a horrible market, no question about it. It's horrible on both an objective and subjective basis - try to find one positive headline in the media these days. No wonder sentiment is in the toilet. We all know that extreme can get more extreme, and bear market sentiment differs from bull market sentiment. Of course. We've been discussing that for months. Decades, even. We're seeing conditions now that have a consistent history of preceding multi-week to multi-month relief rallies, even during some of the worst bear markets. About the only exceptions are several-day to several-week waterfall declines that end protracted bear markets. Perhaps that's what we're in now, I don't know, but it would be odd if we are.
Indicators at Extremes
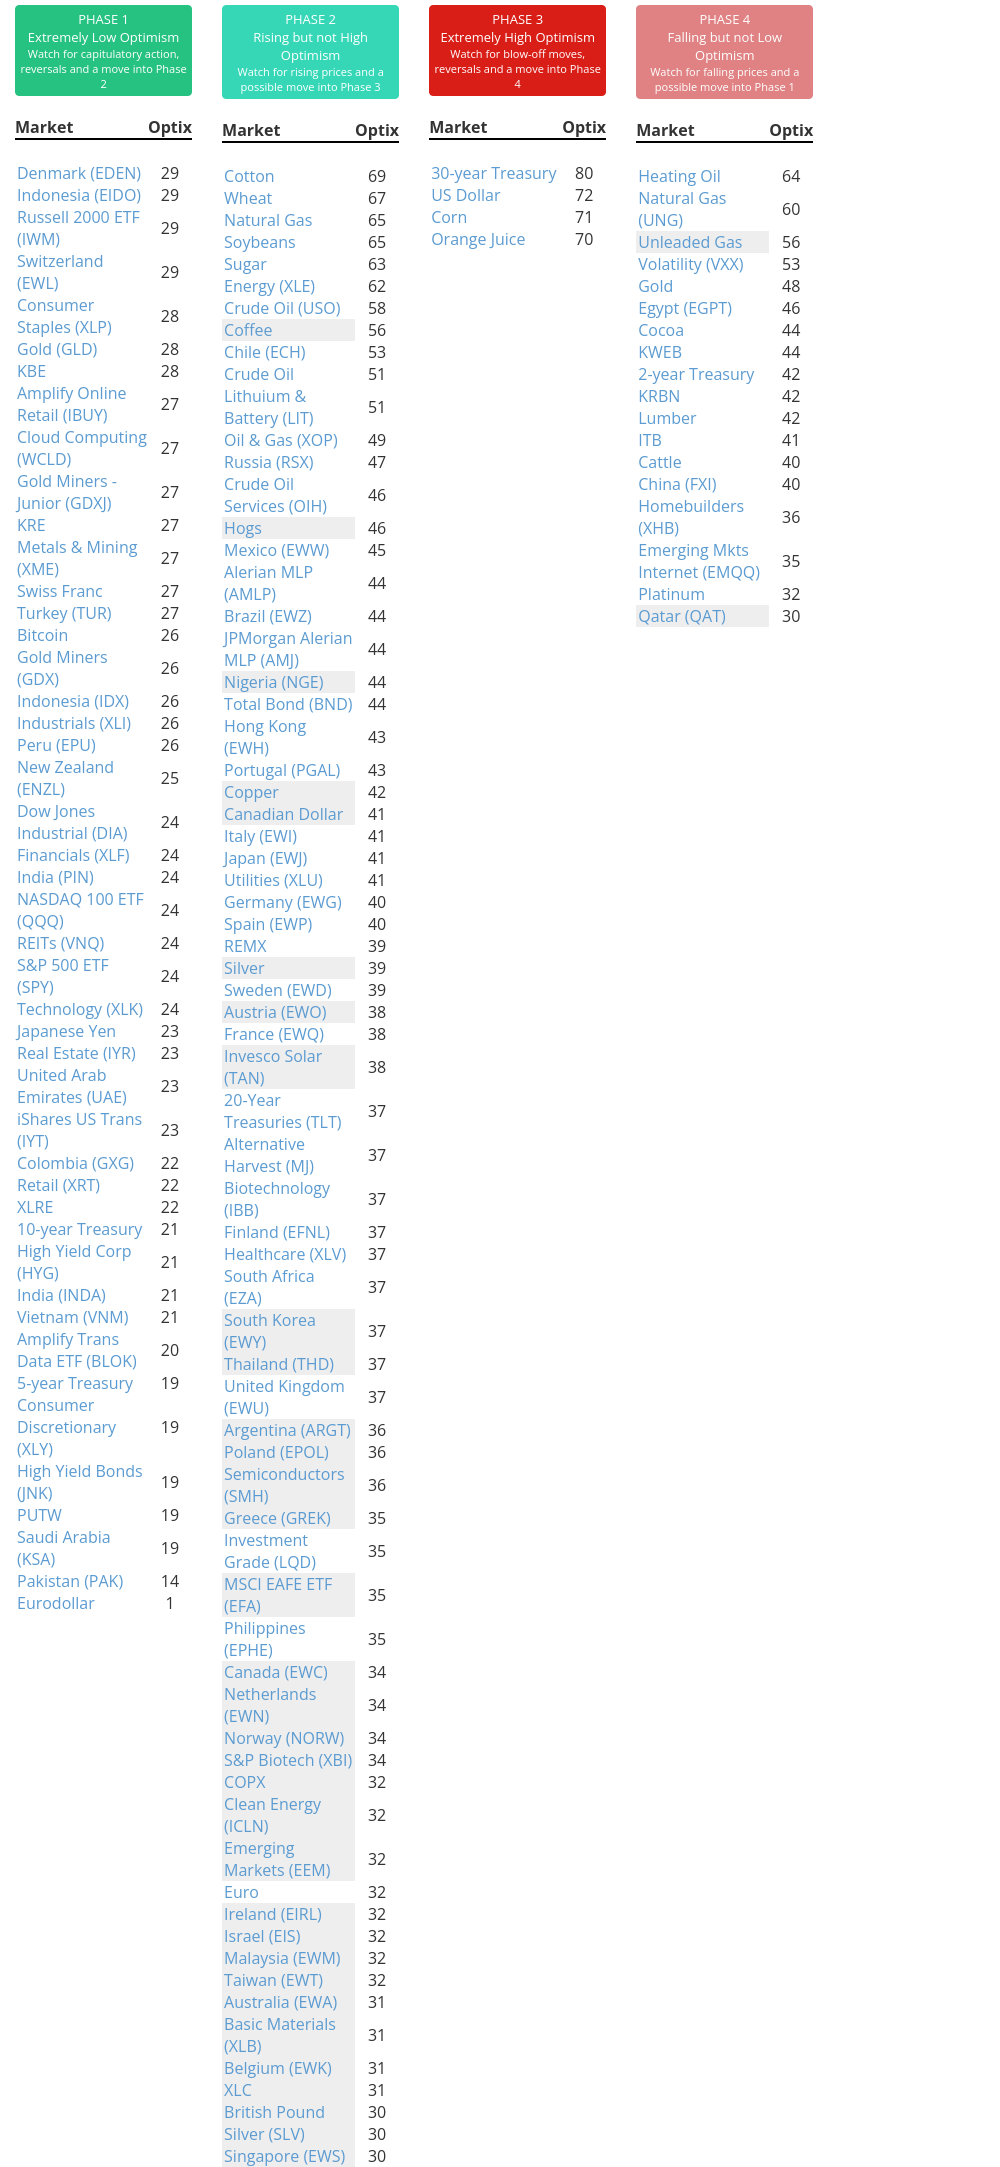
Phase Table
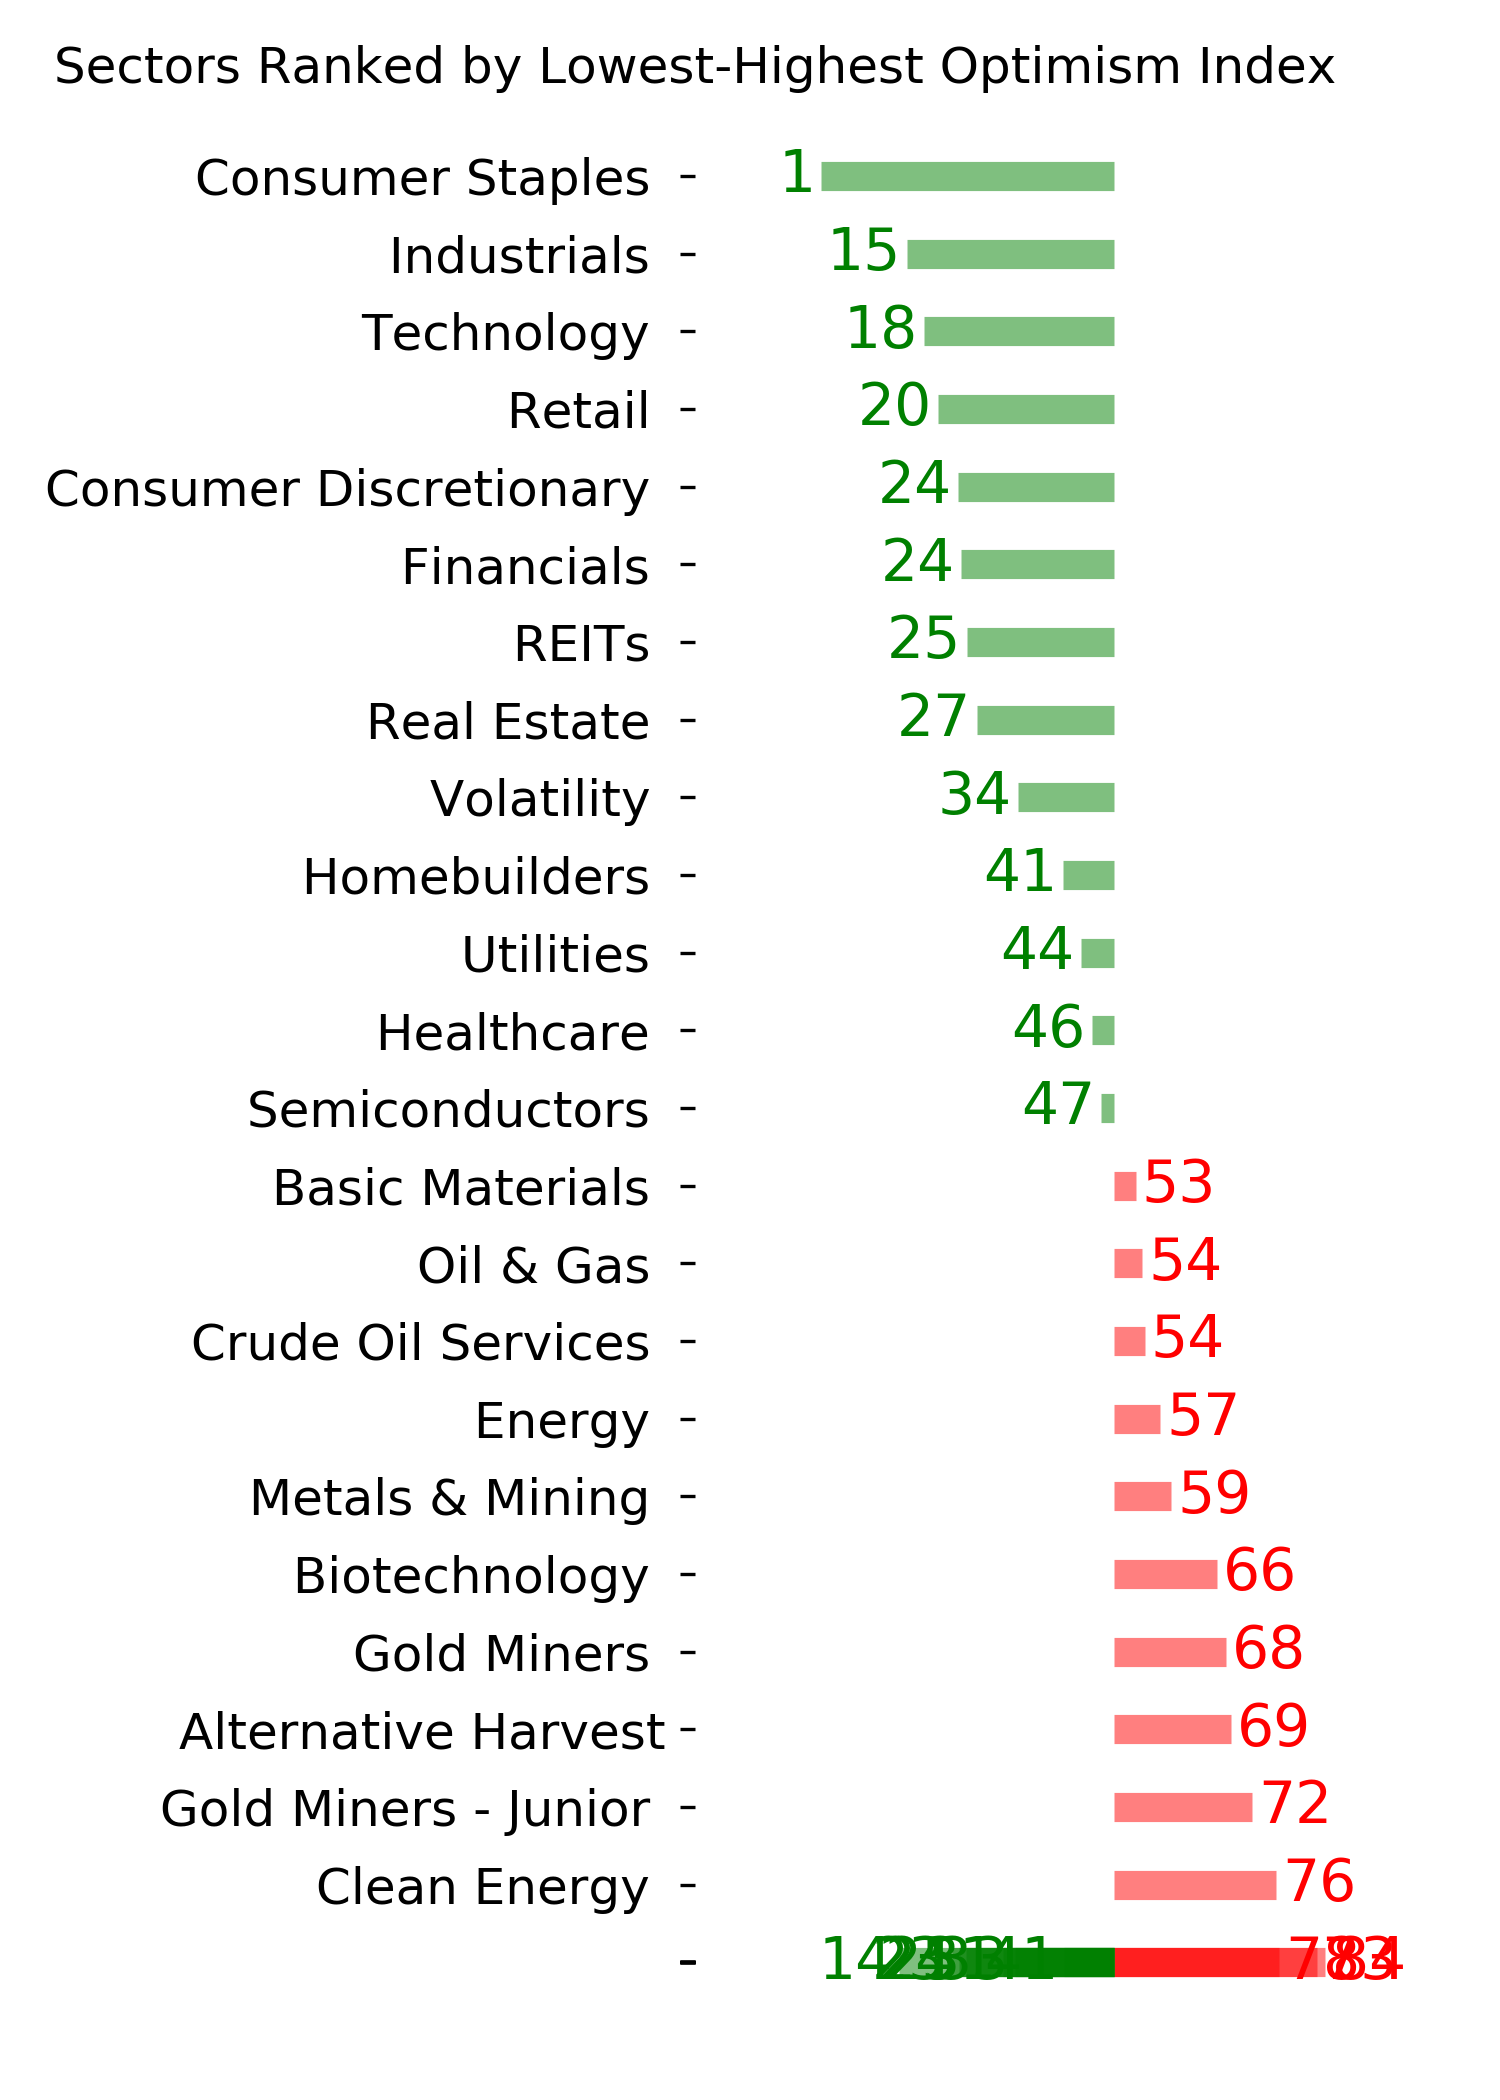
Ranks
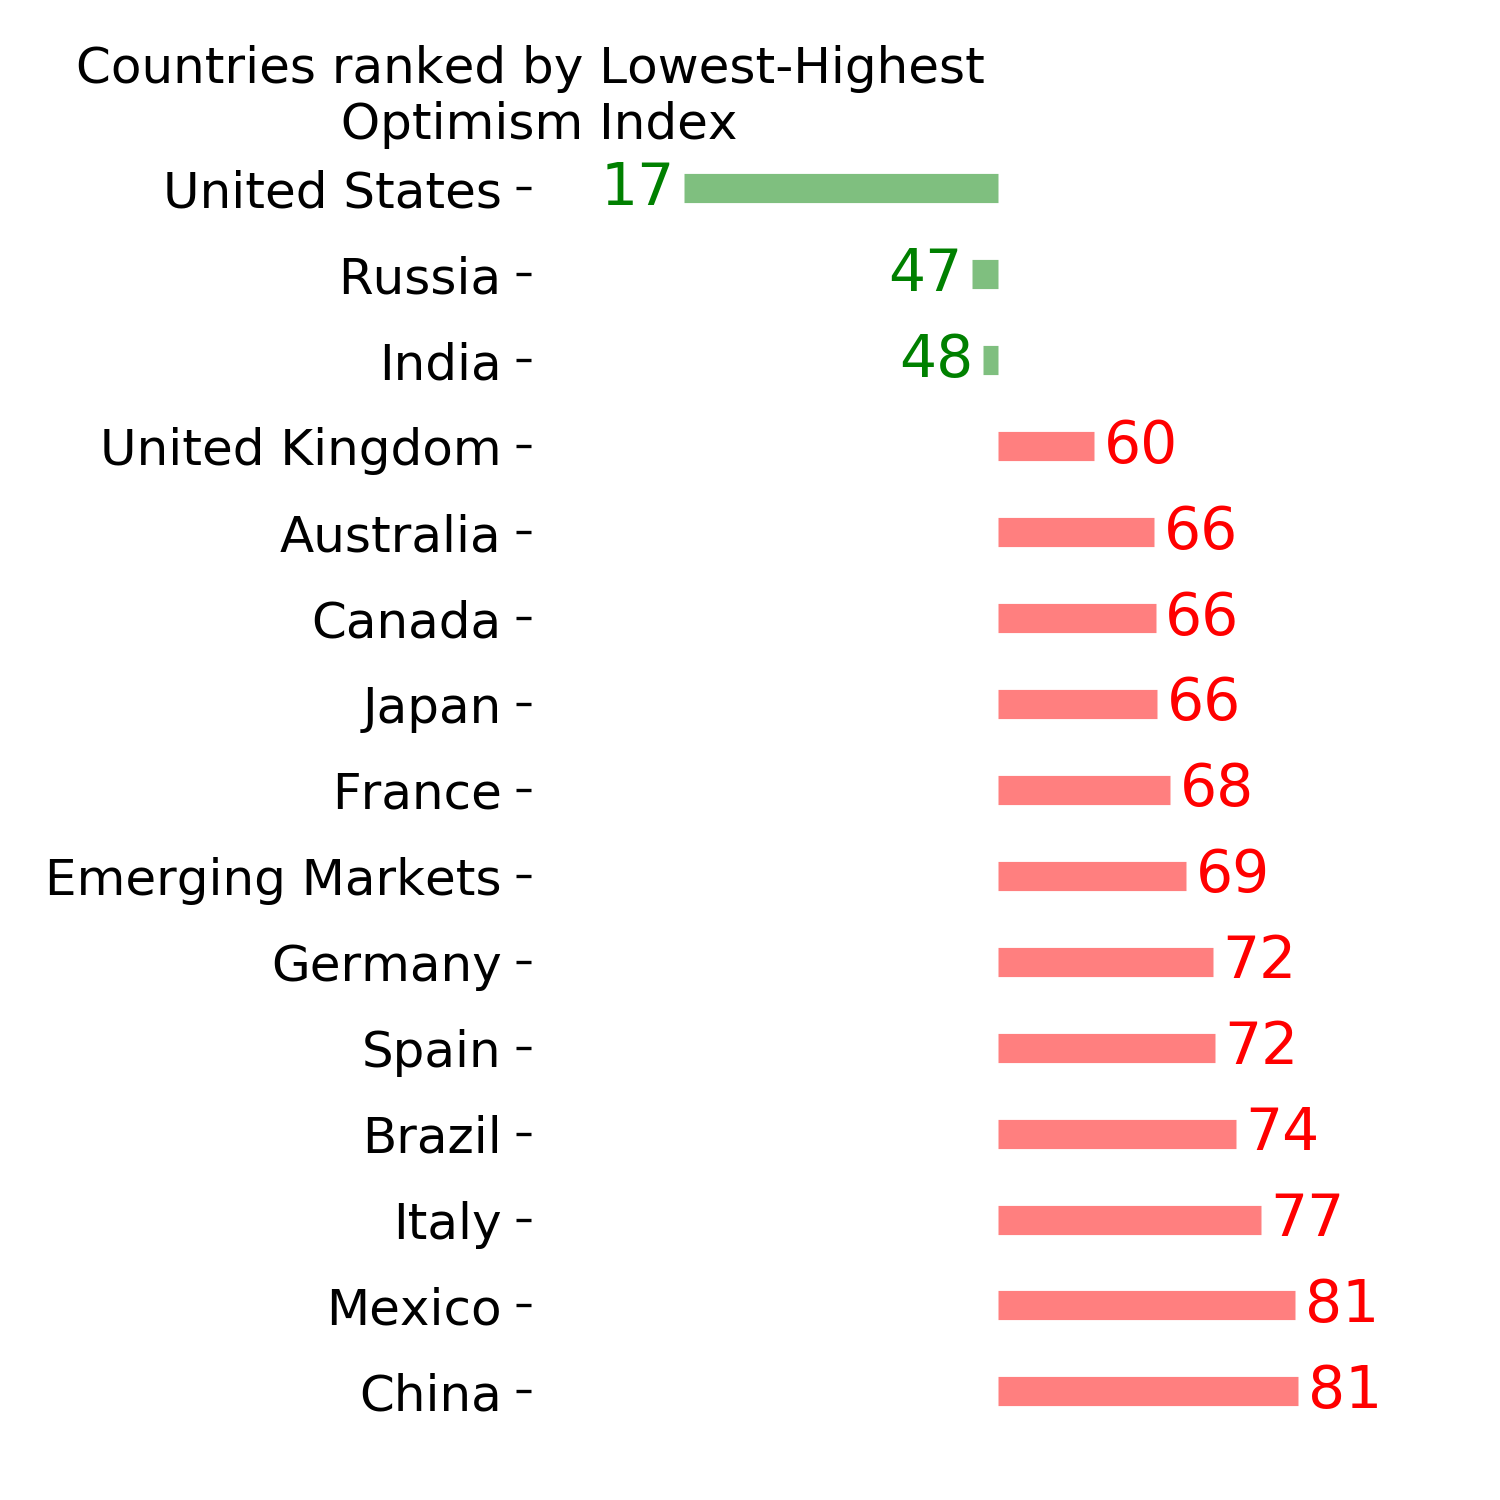
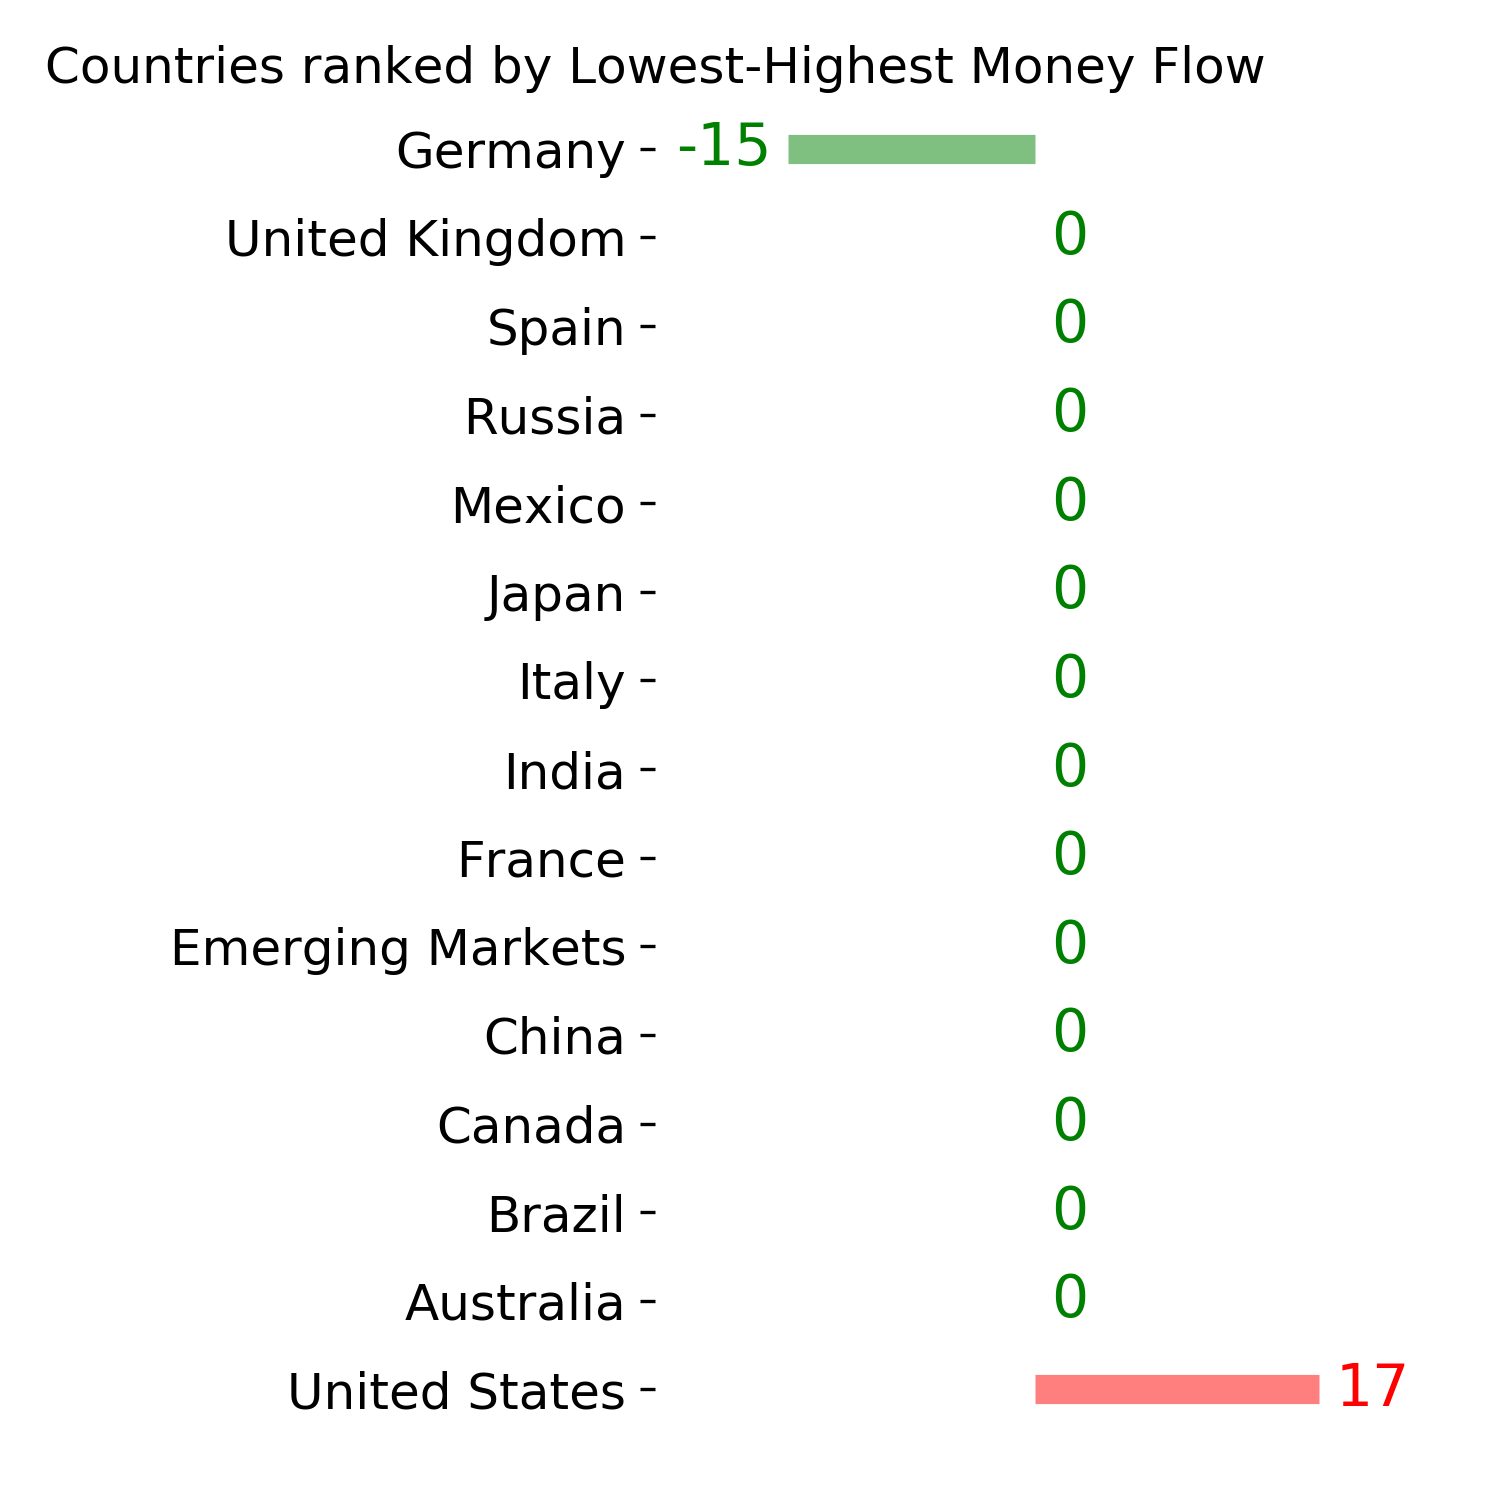
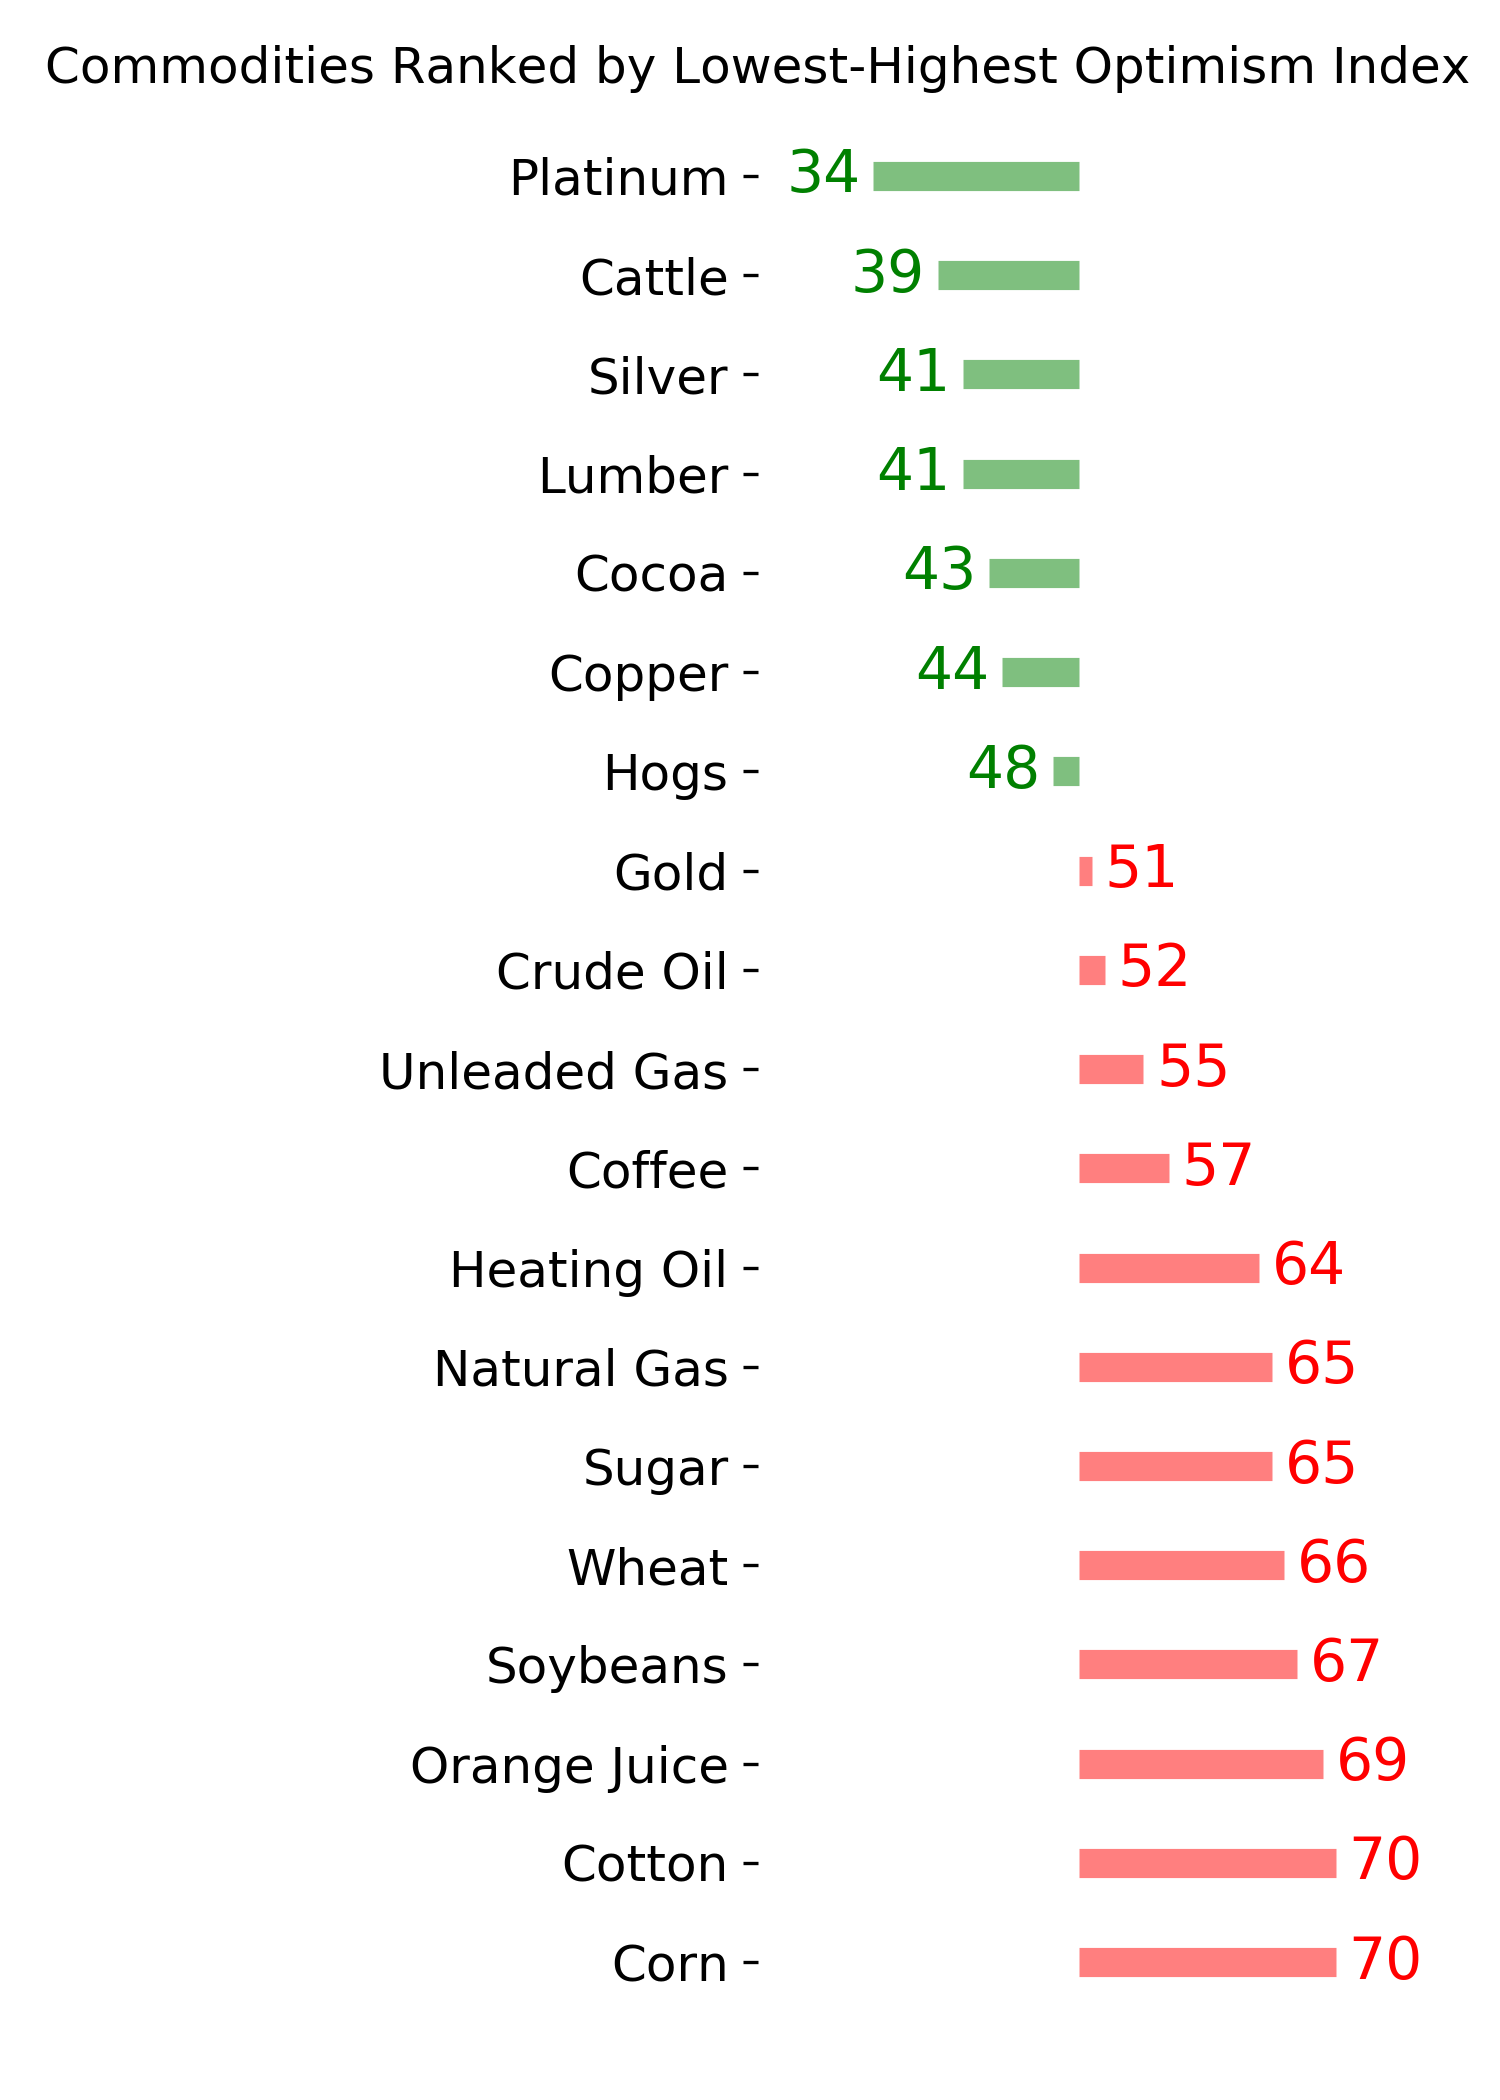
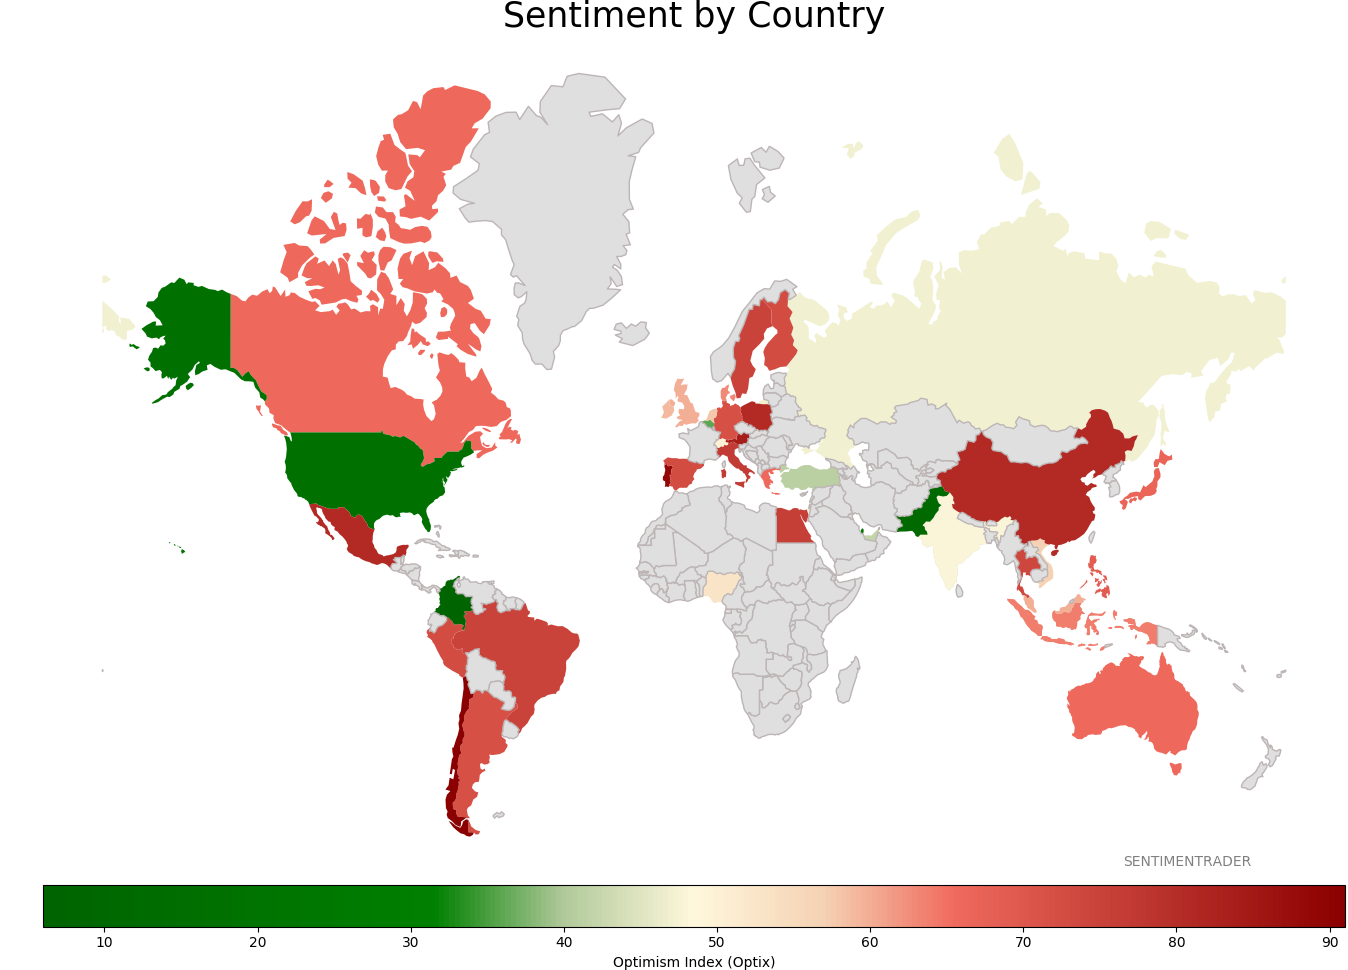
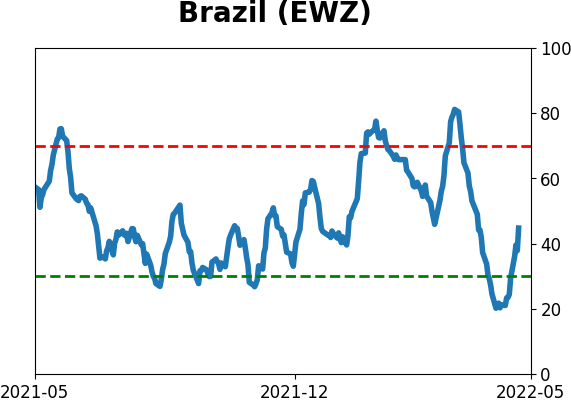
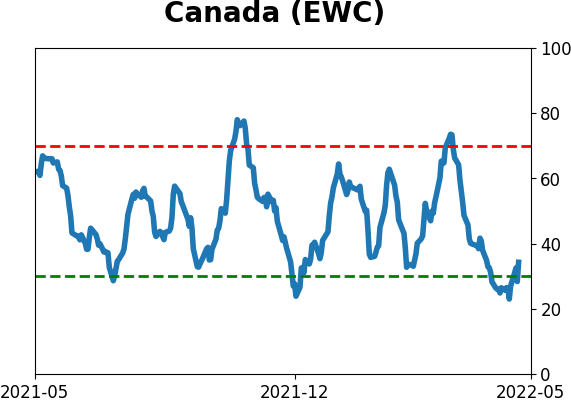
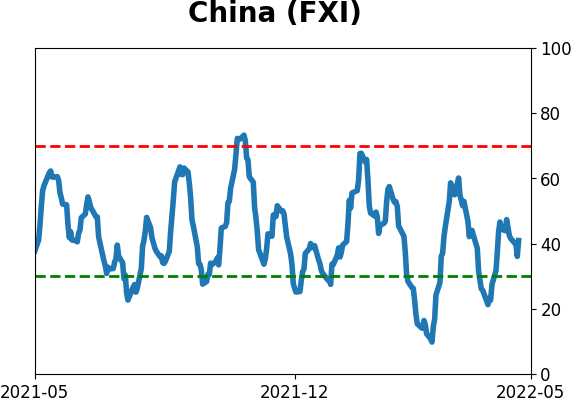
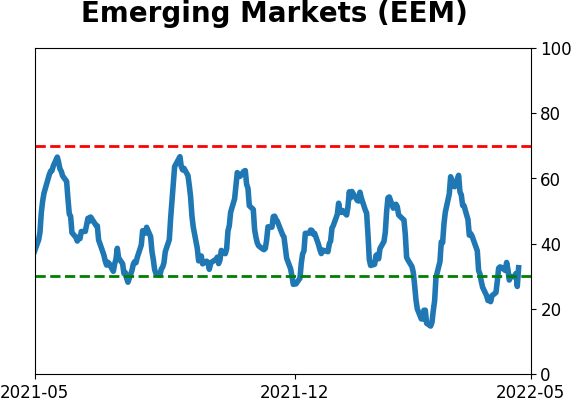
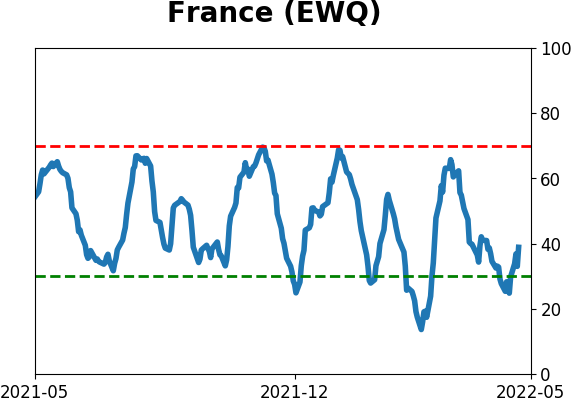
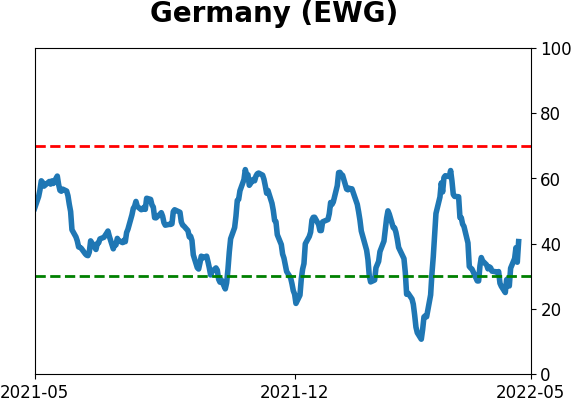
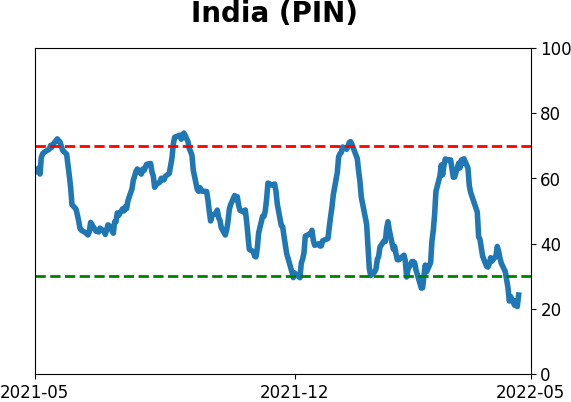
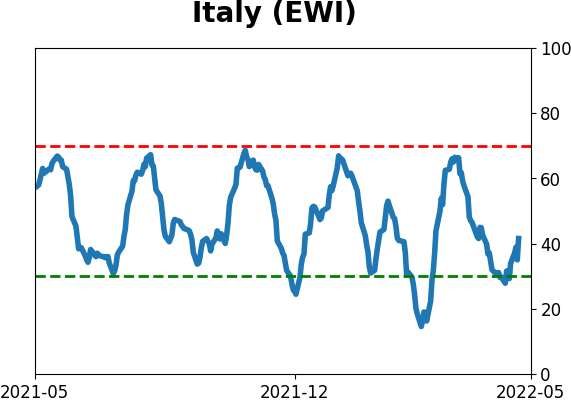
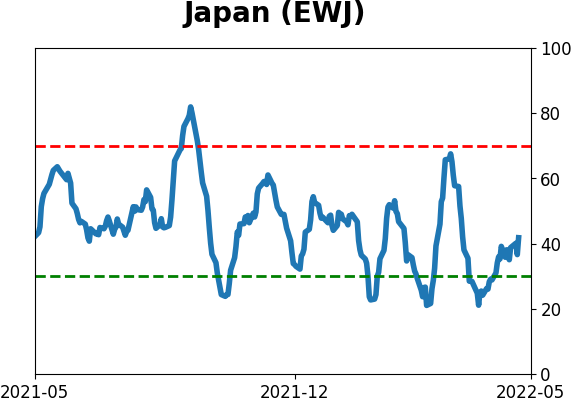
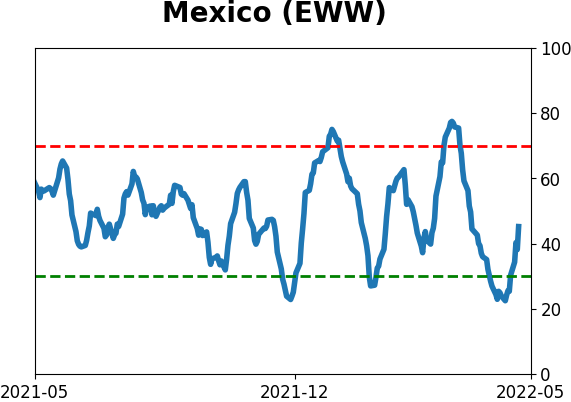
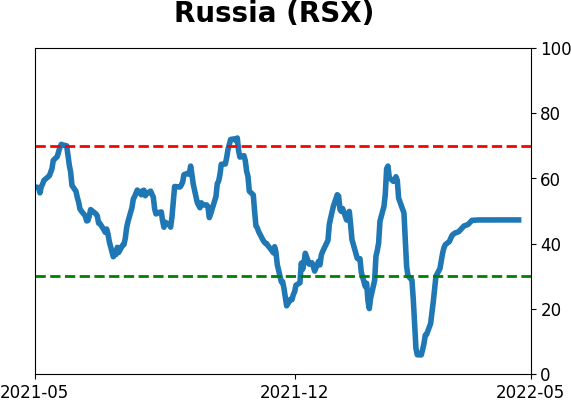
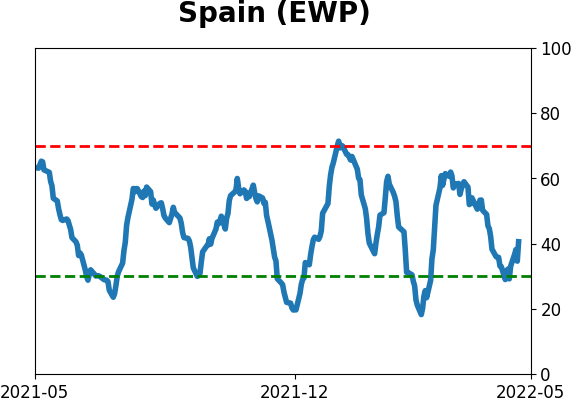
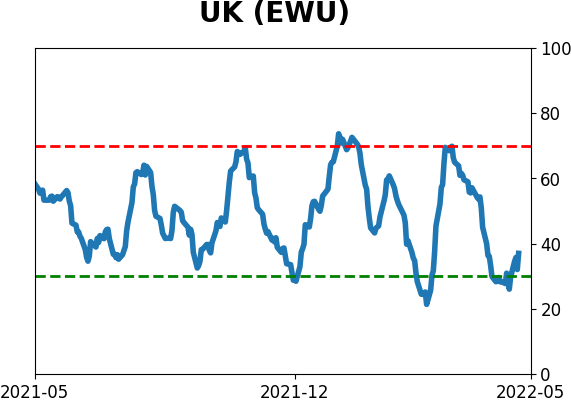
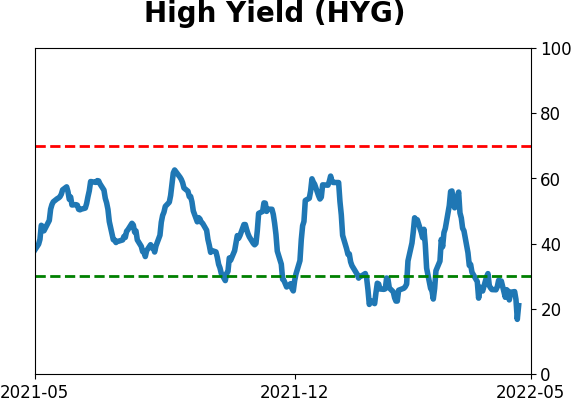
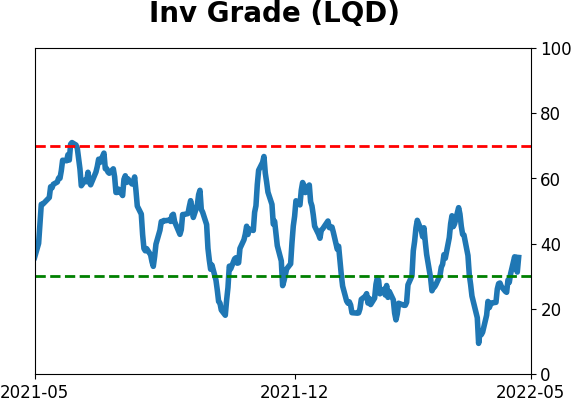
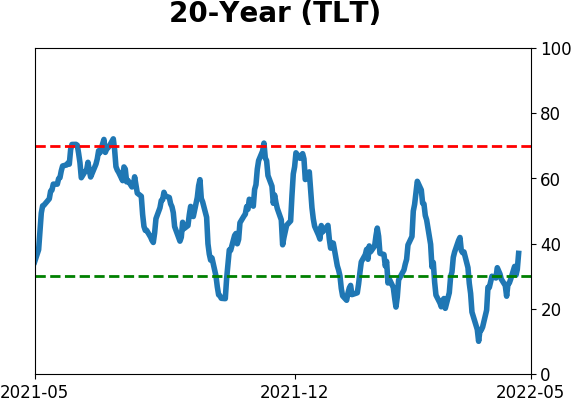
Sentiment Around The World
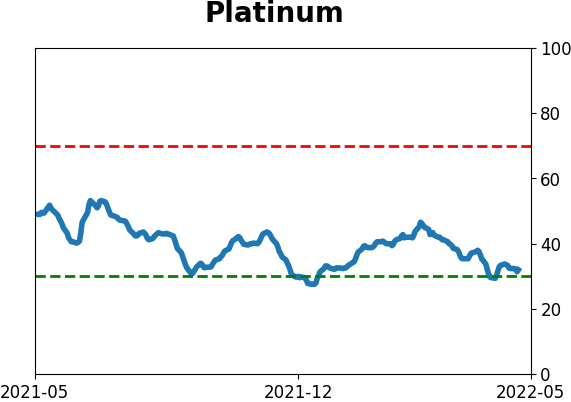
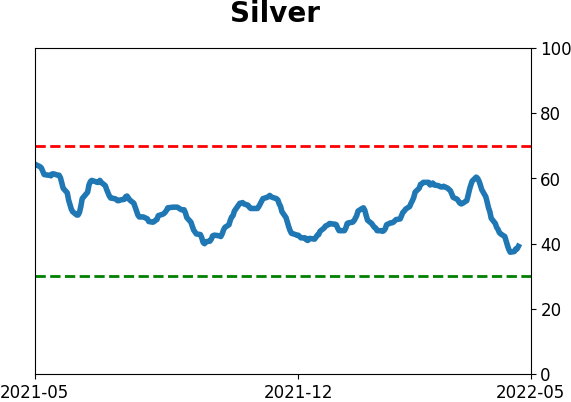
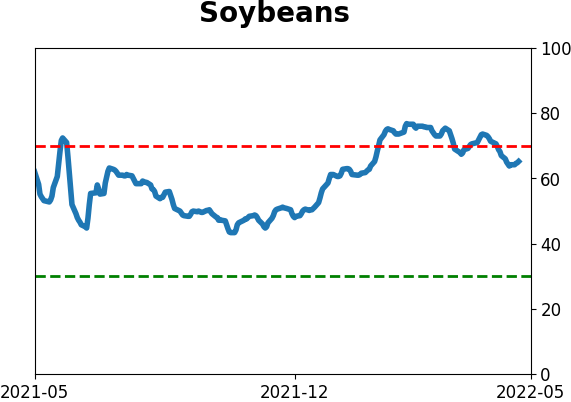
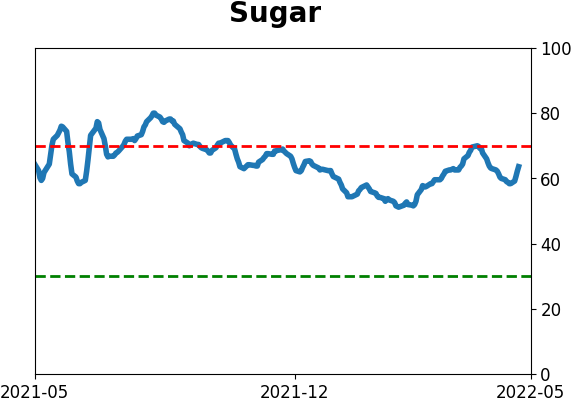
Optimism Index Thumbnails
|
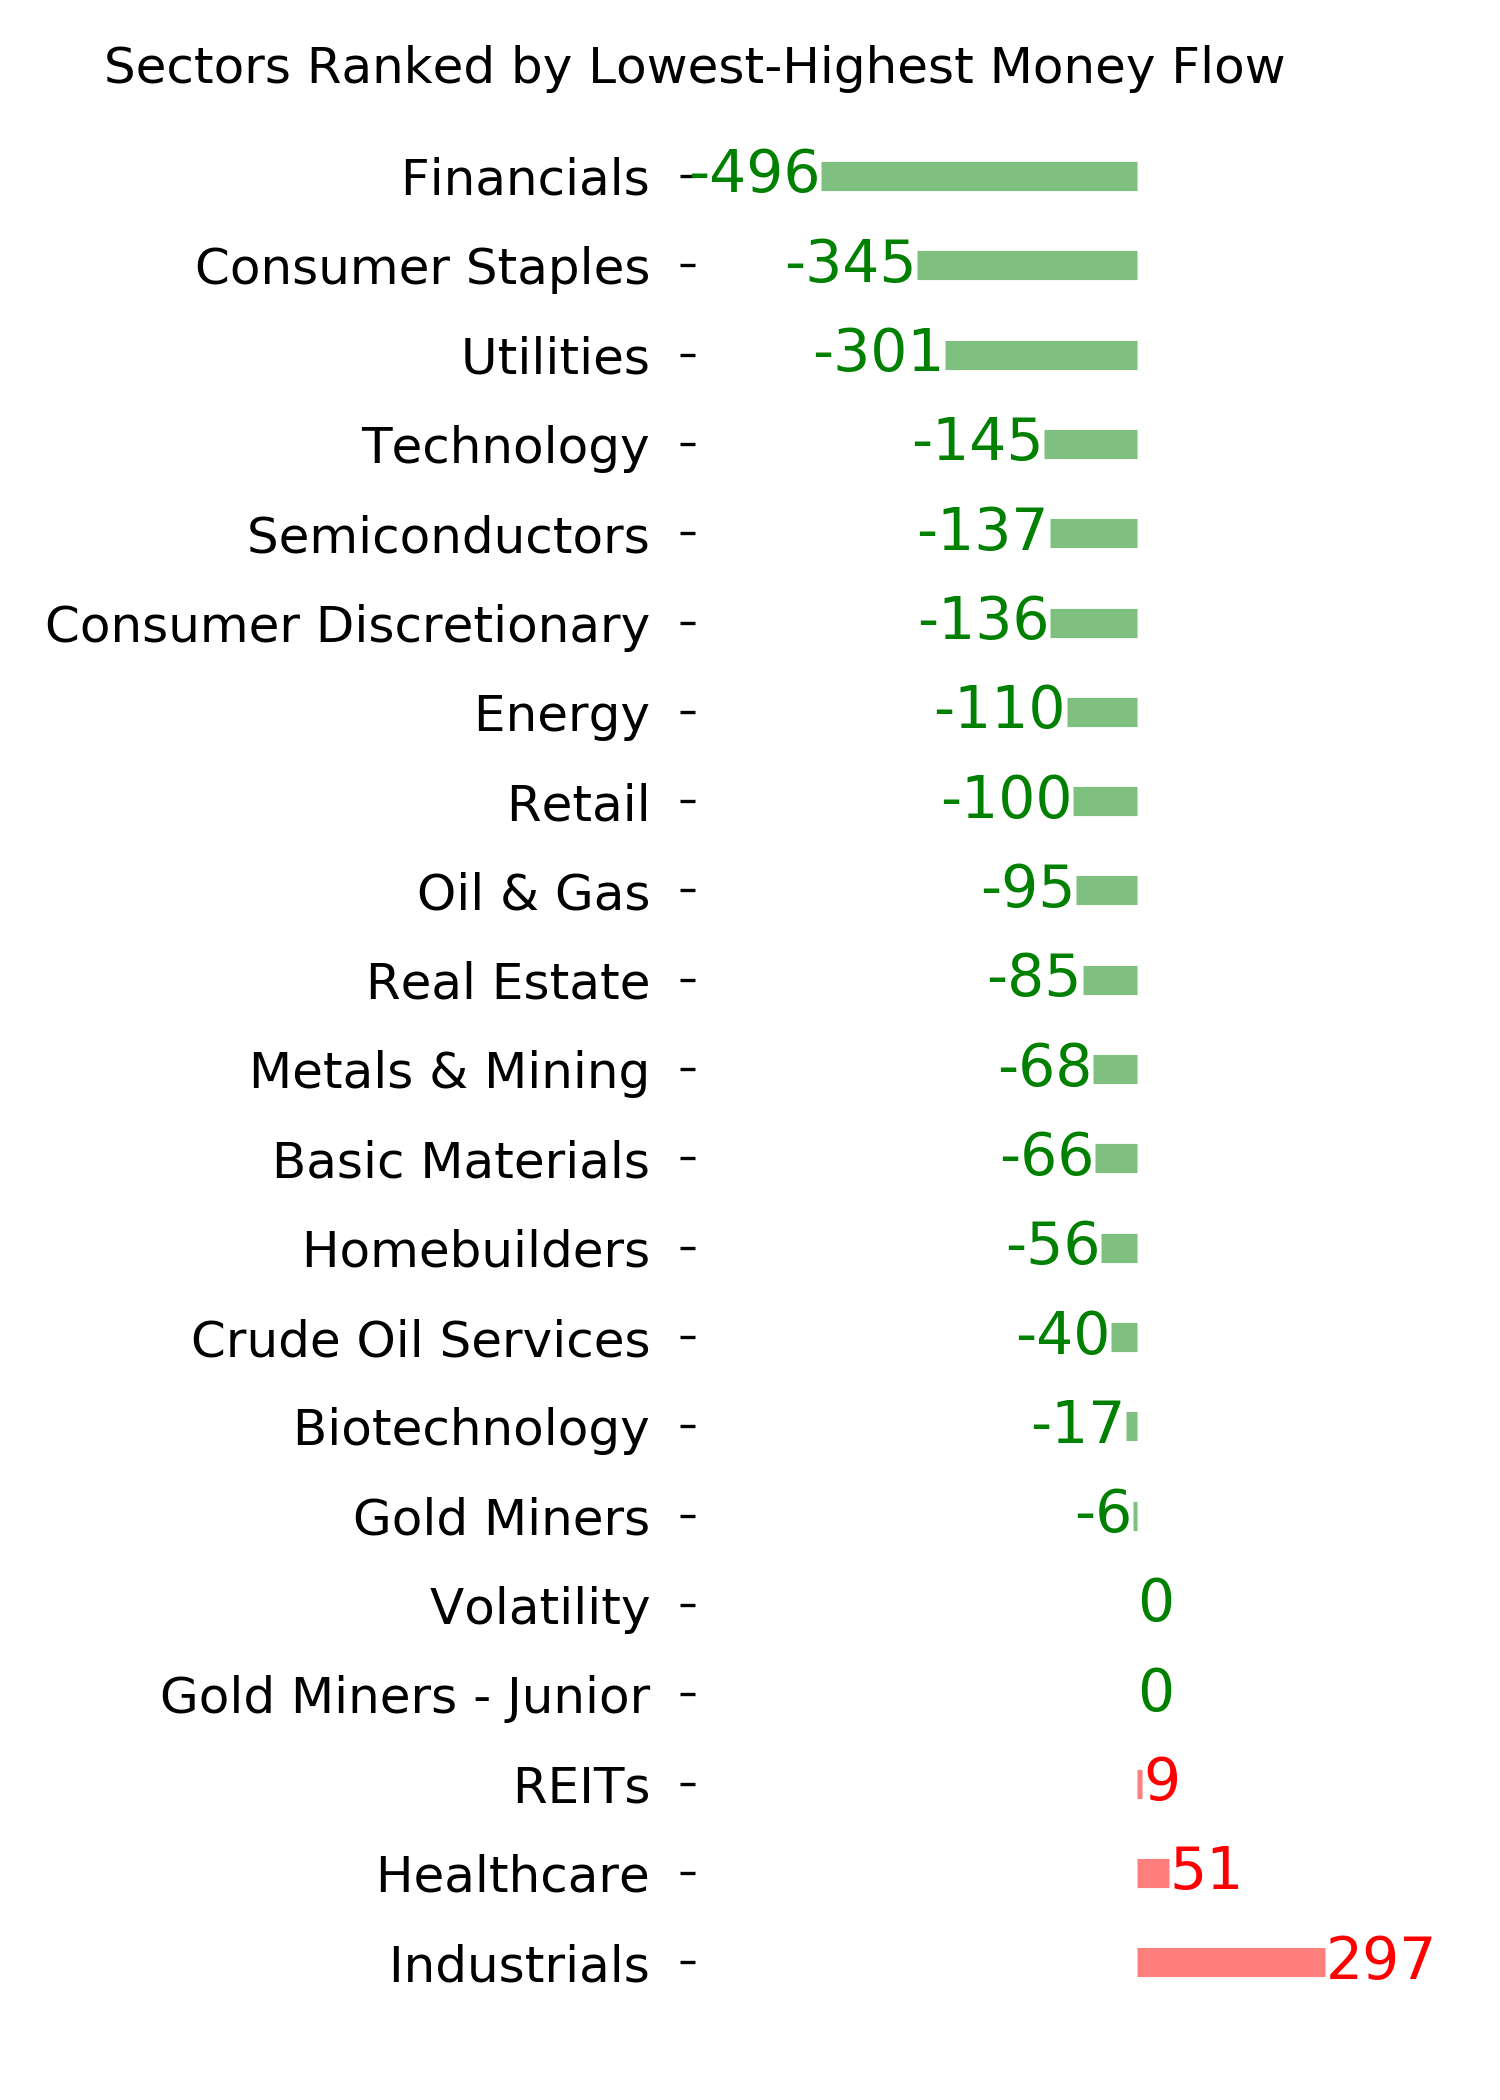
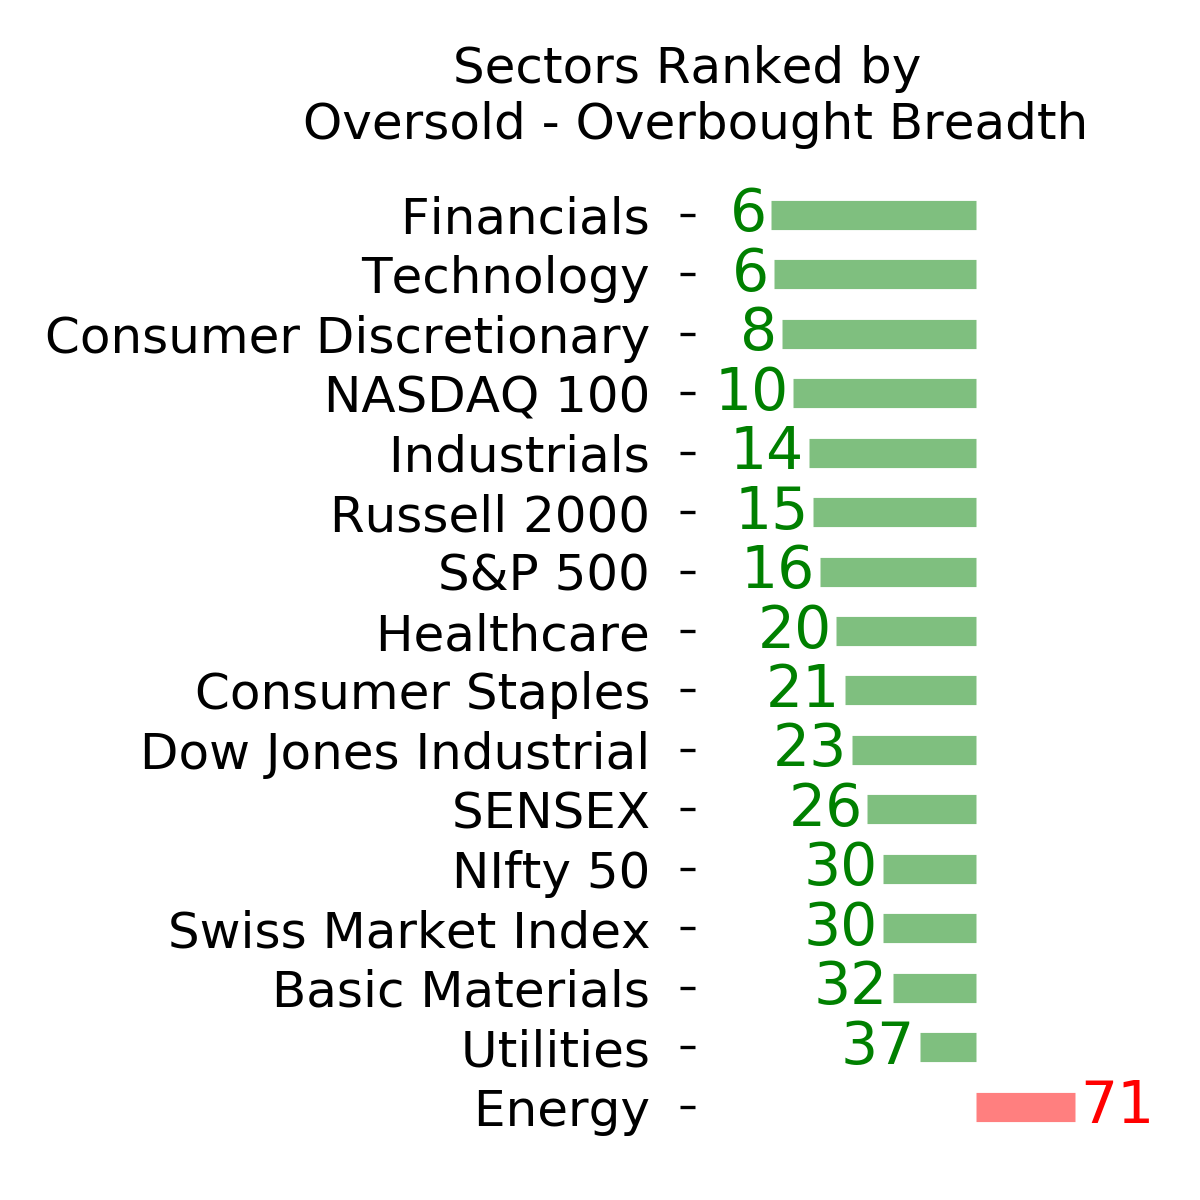
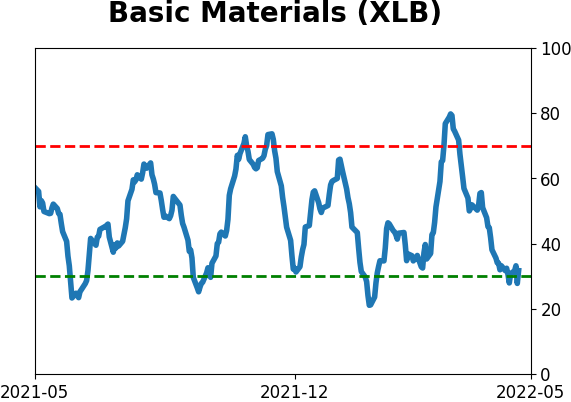
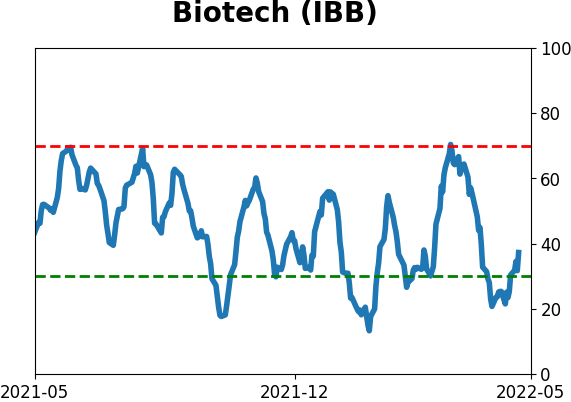
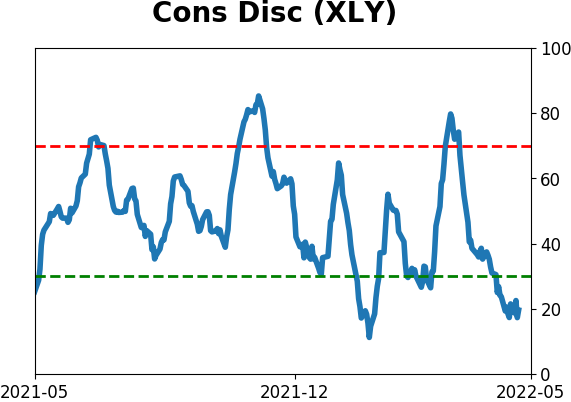
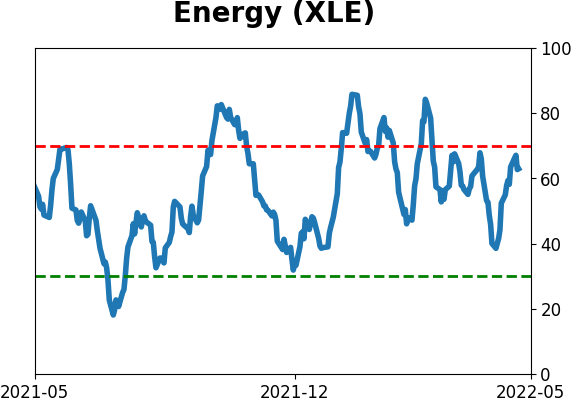
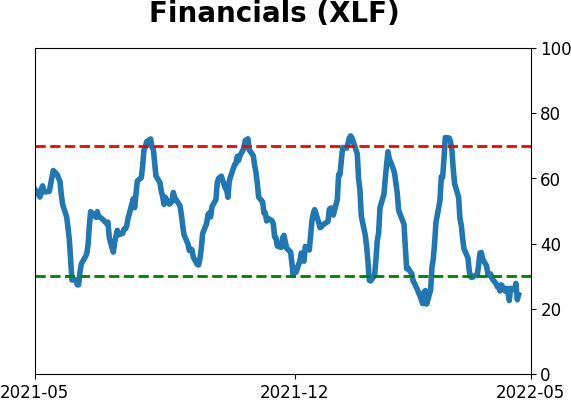
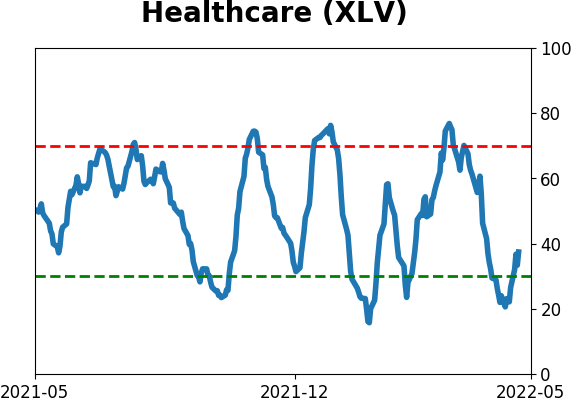
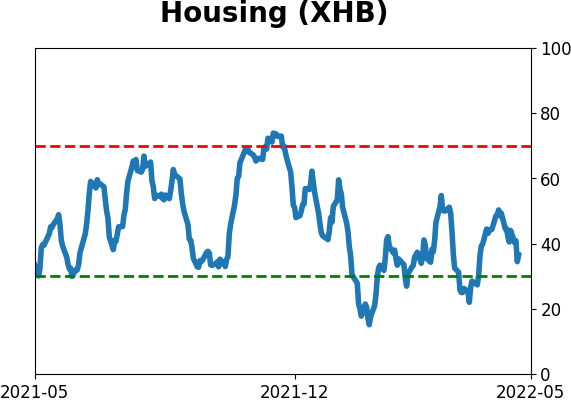
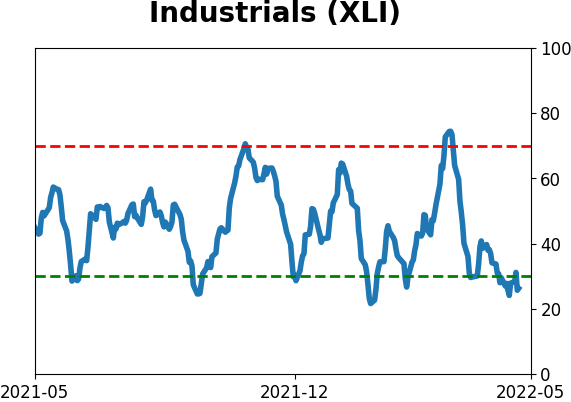
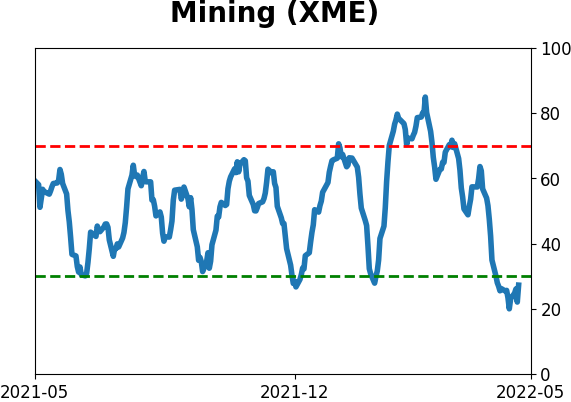
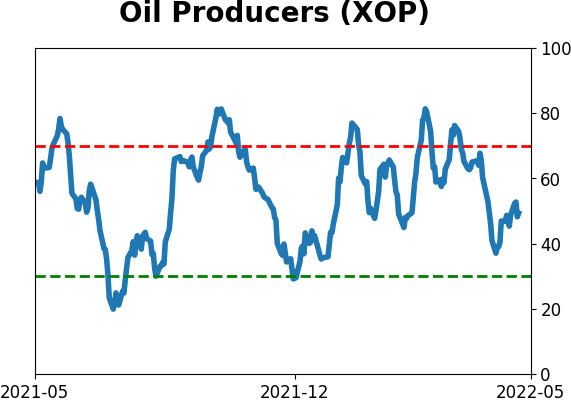
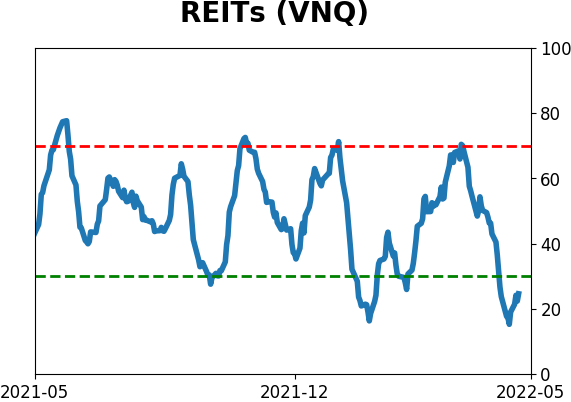
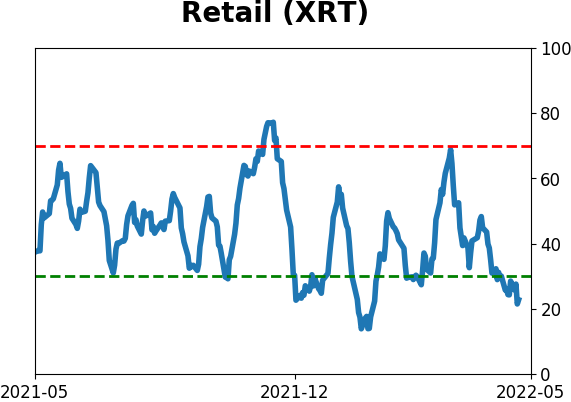
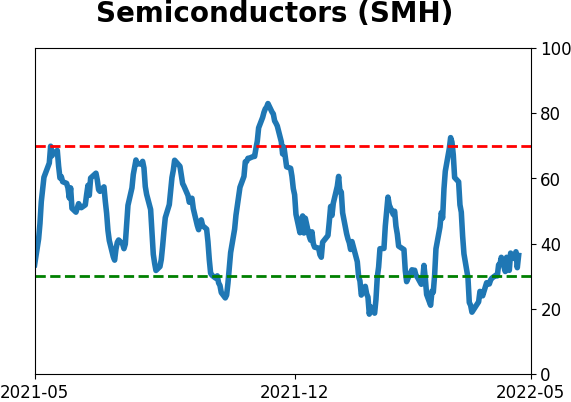
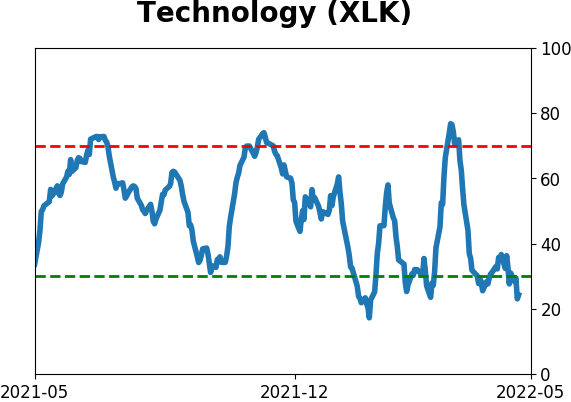
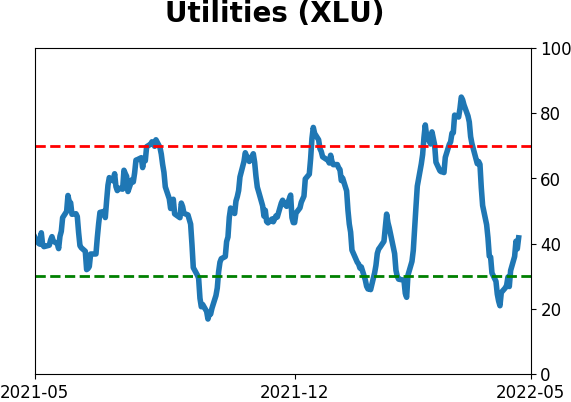
Sector ETF's - 10-Day Moving Average
|
|
|
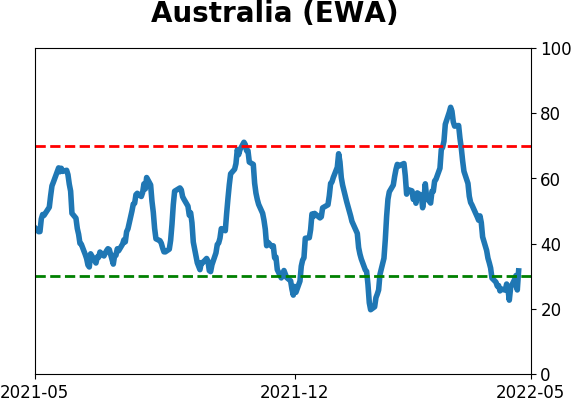
Country ETF's - 10-Day Moving Average
|
|
|
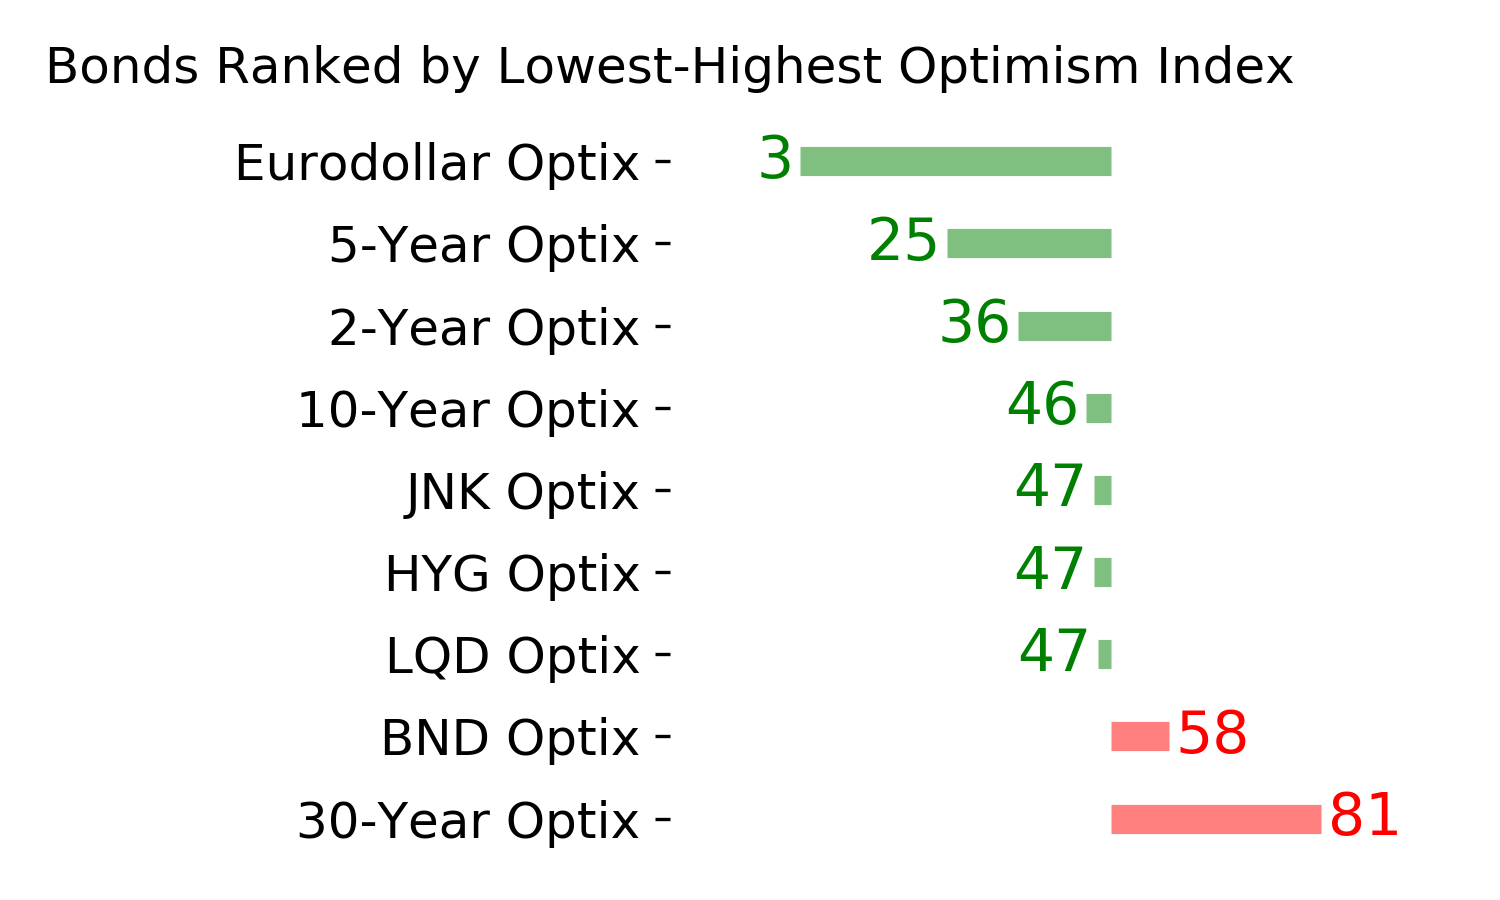
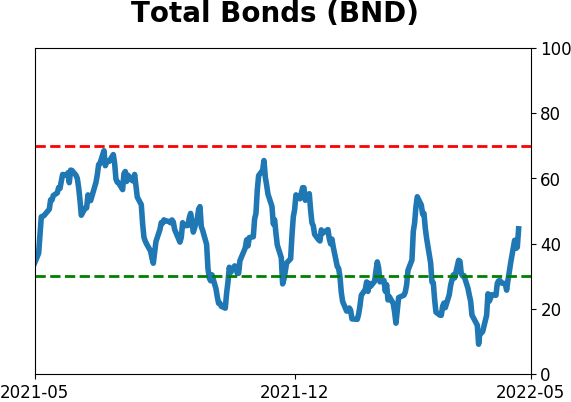
Bond ETF's - 10-Day Moving Average
|
|
|
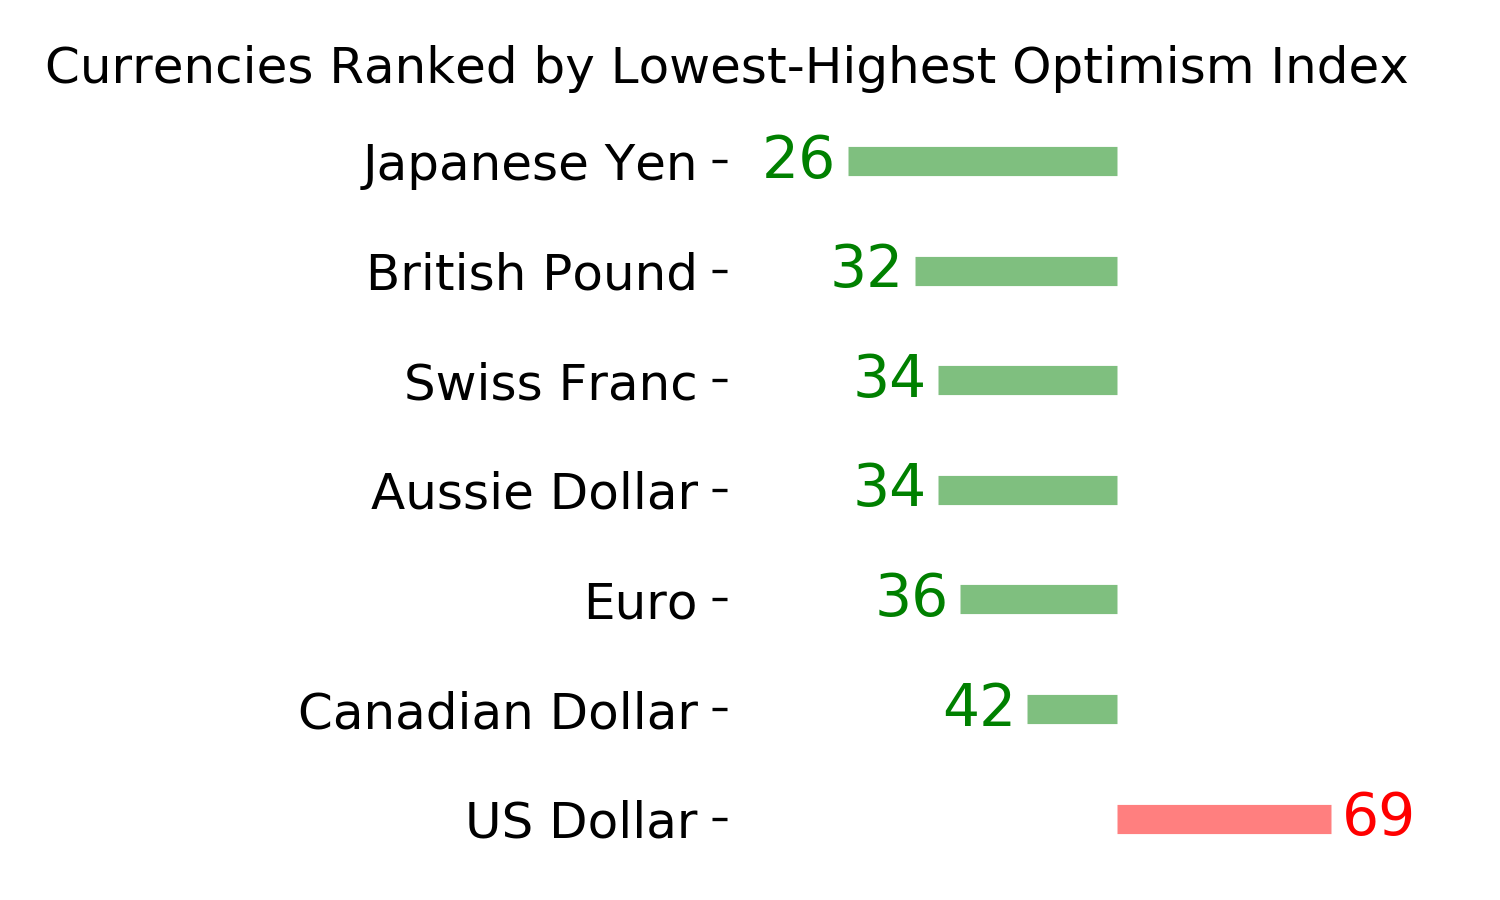
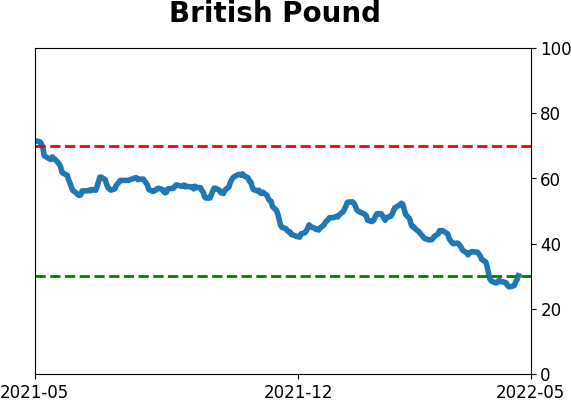
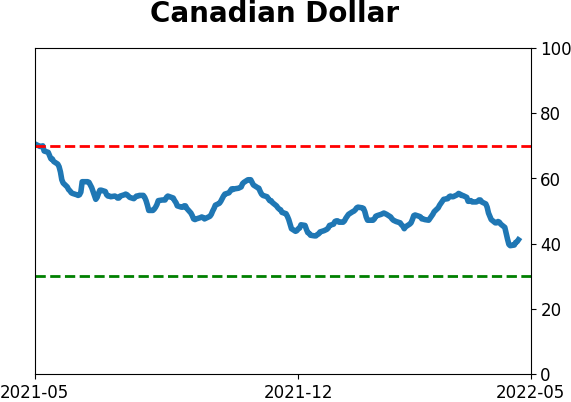
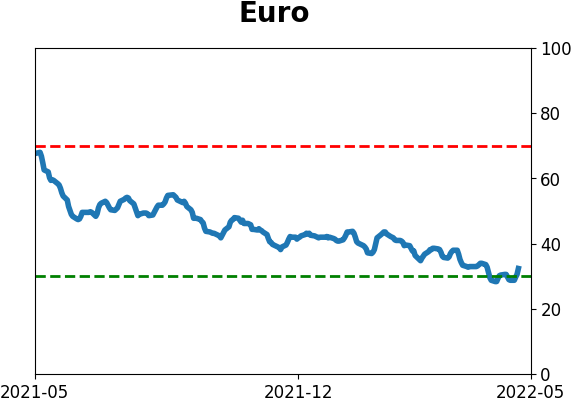
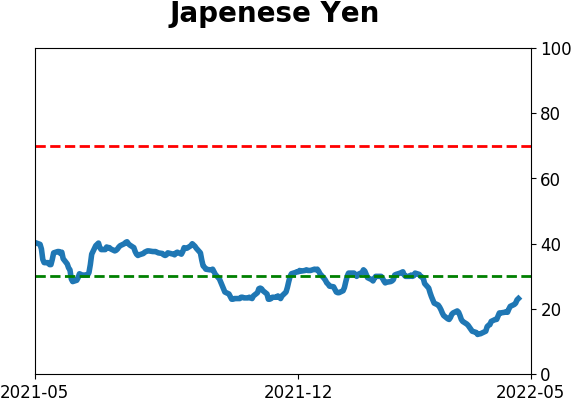
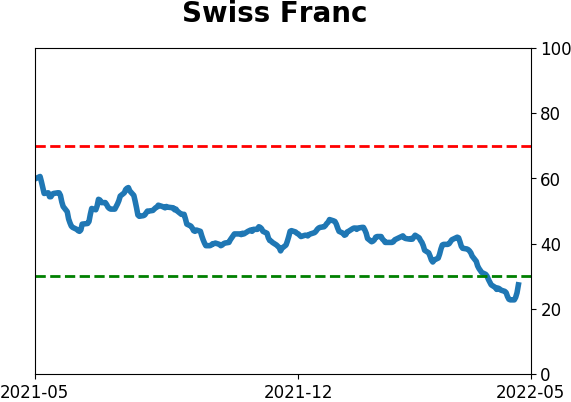
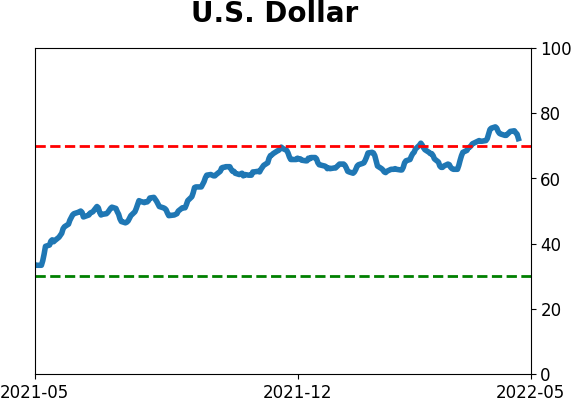
Currency ETF's - 5-Day Moving Average
|
|
|
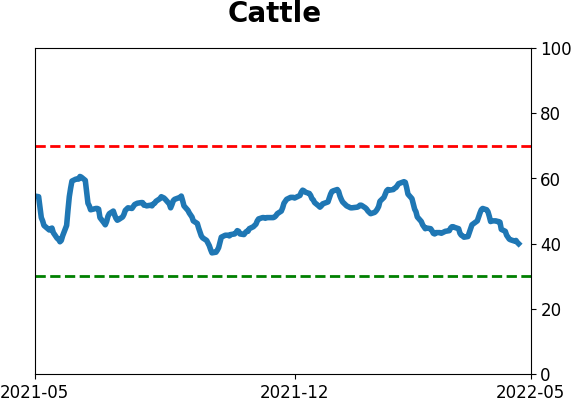
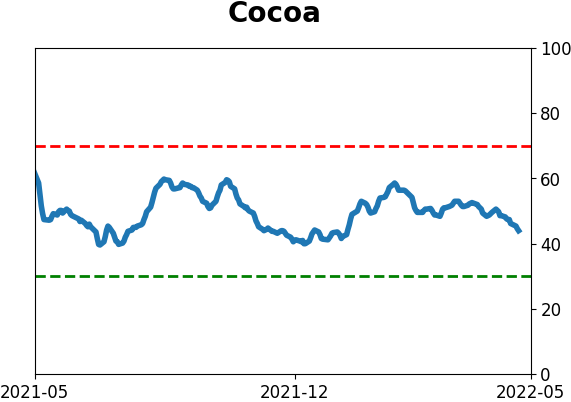
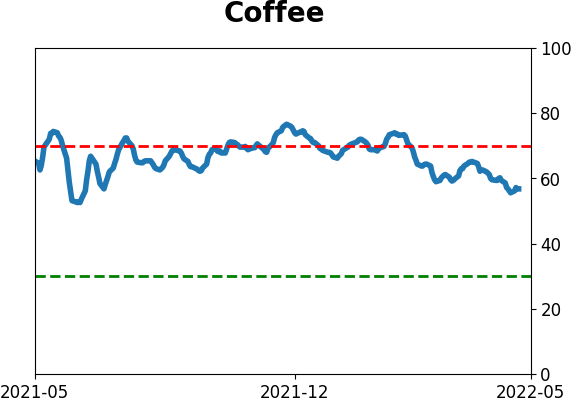
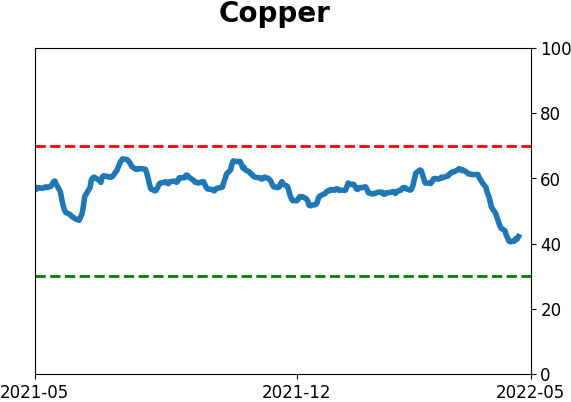
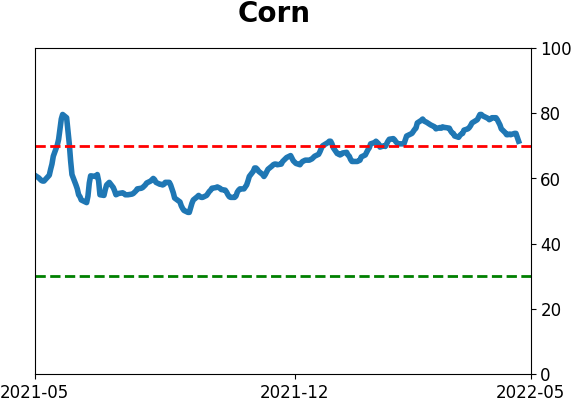
Commodity ETF's - 5-Day Moving Average
|
|