Headlines
|
|
Wall Street is losing faith in higher stock prices:
When stocks lose the faith of Wall Street analysts, then we know things are bad. And lately, they've been more aggressively cutting price targets on S&P 500 companies, though they haven't been as busy downgrading earnings estimates. The sample size is tiny, but similar behavior occurred near market troughs.
|
Smart / Dumb Money Confidence
|
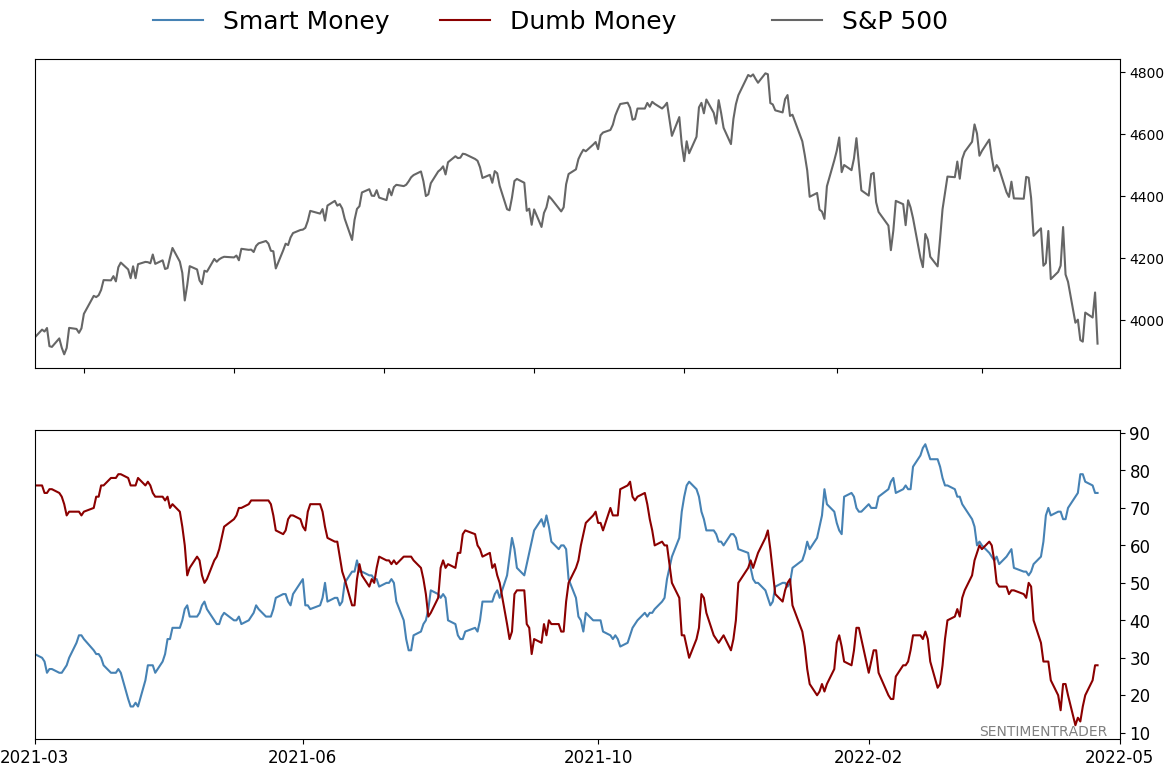
Smart Money Confidence: 74%
Dumb Money Confidence: 28%
|
|
Risk Levels
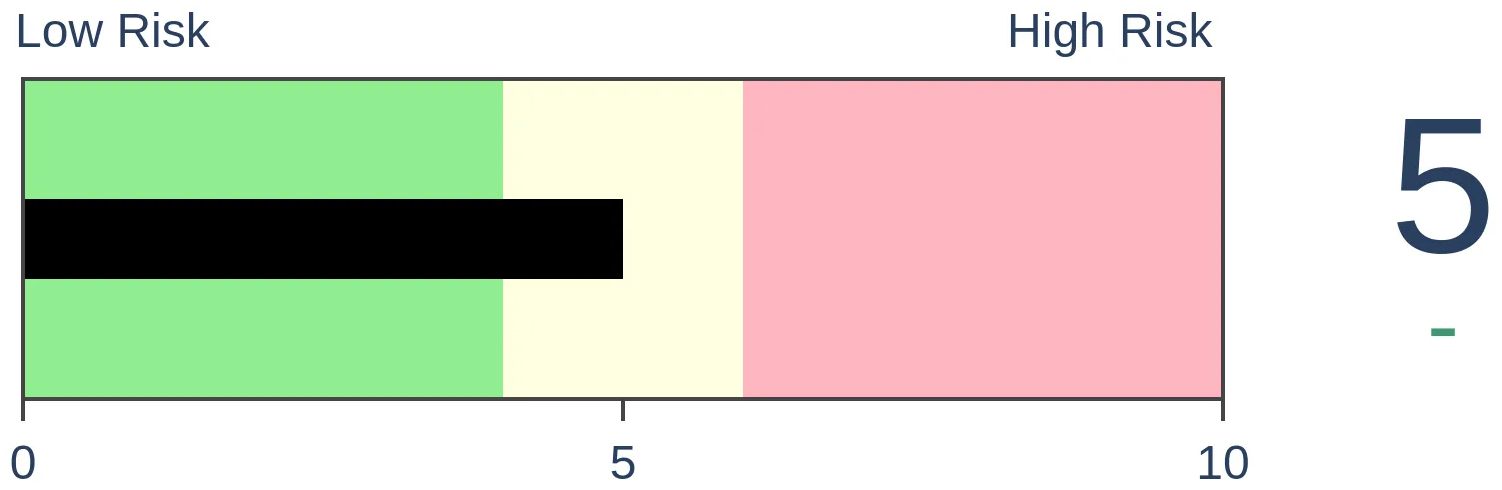
Stocks Short-Term
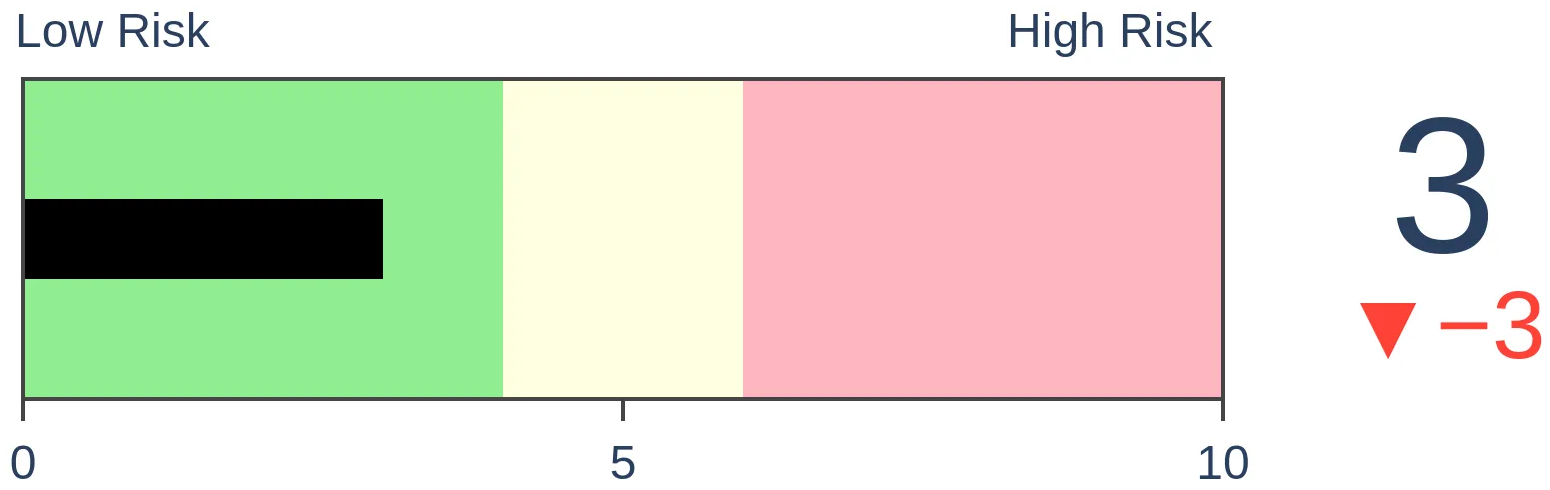
|
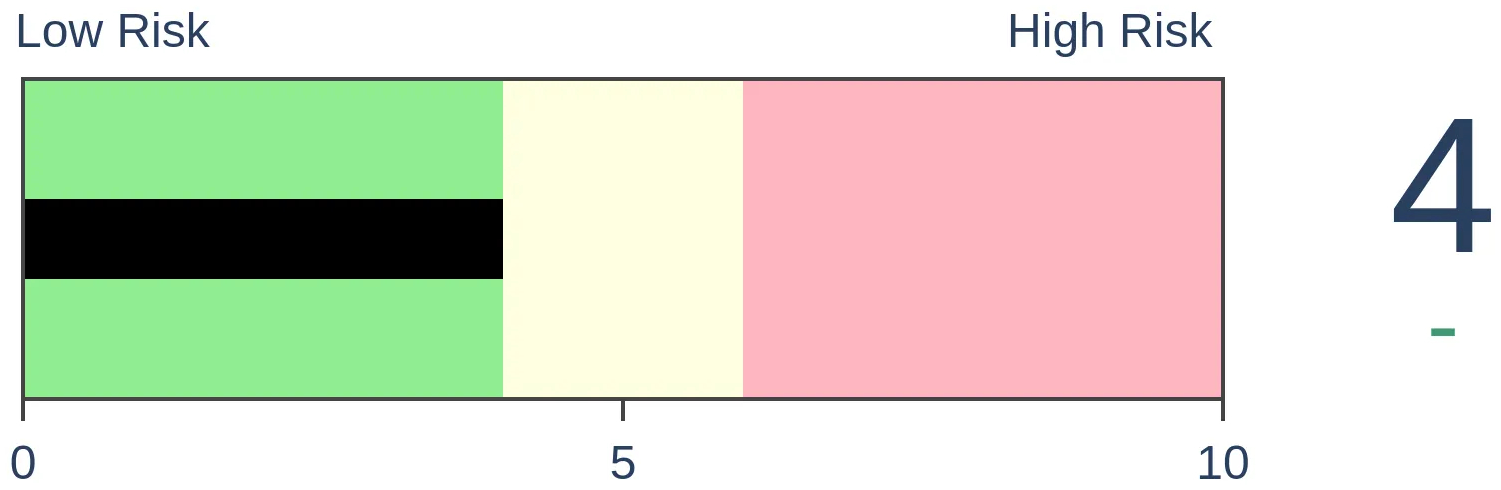
Stocks Medium-Term
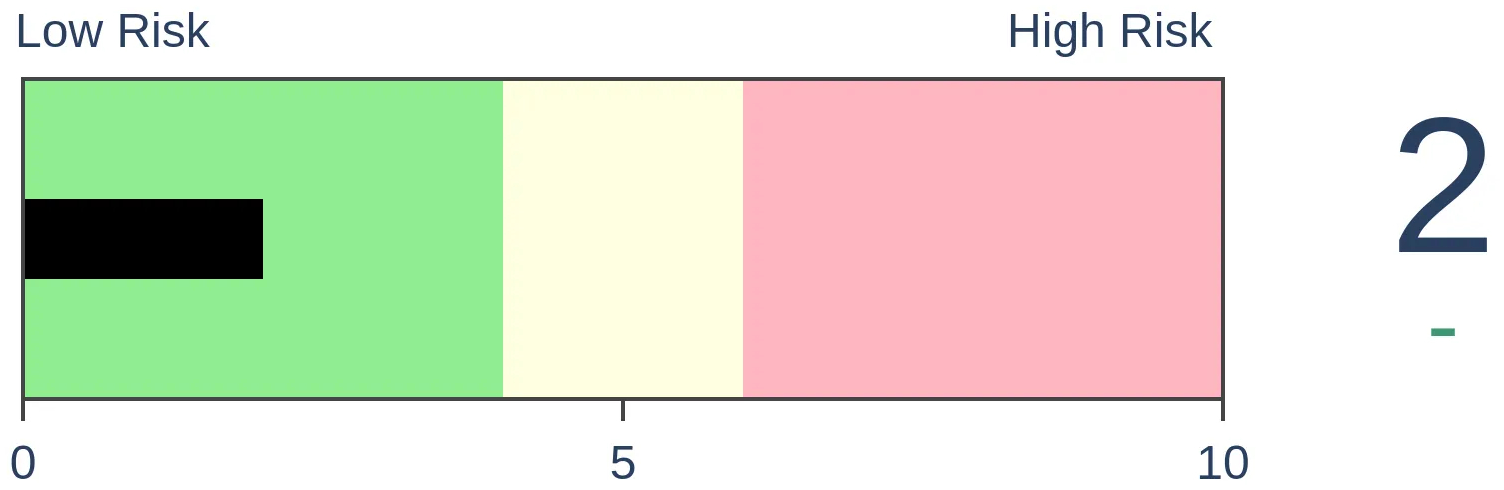
|
|
Bonds
|
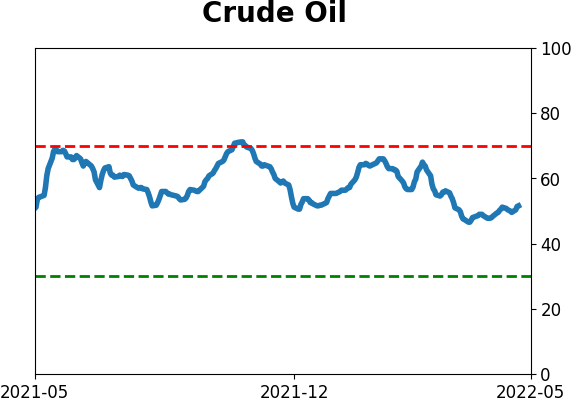
Crude Oil

|
|
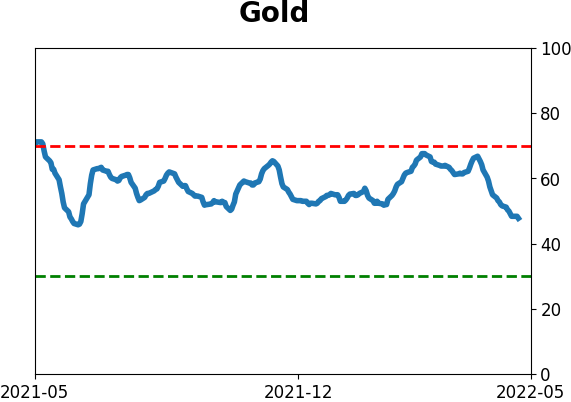
Gold

|
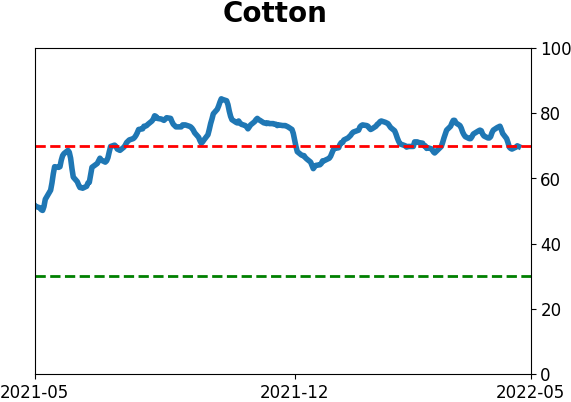
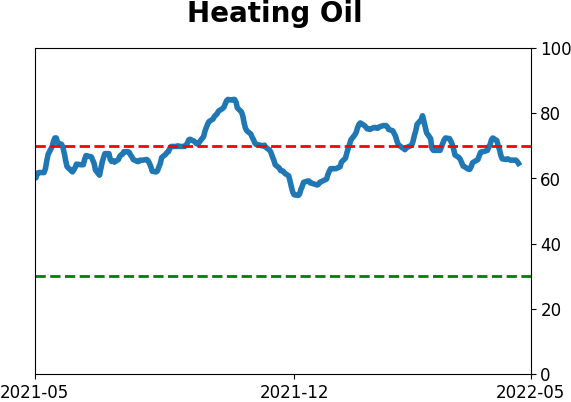
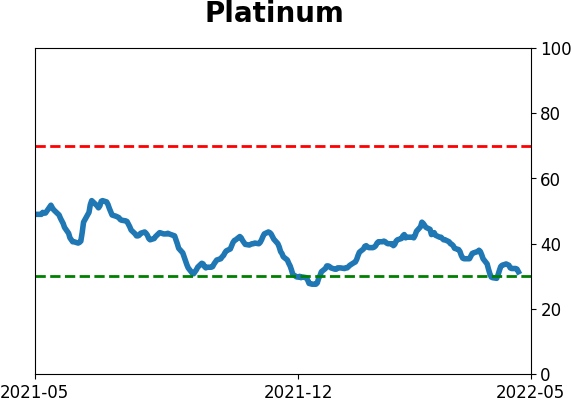
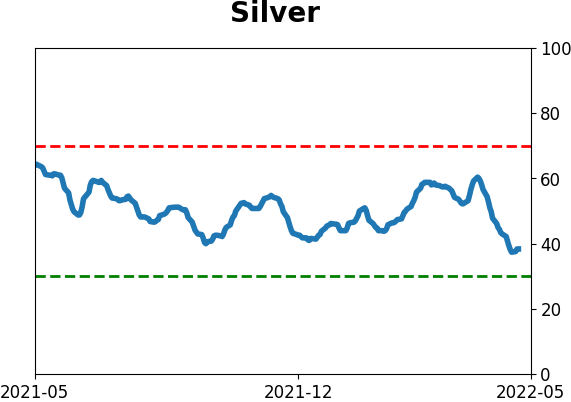
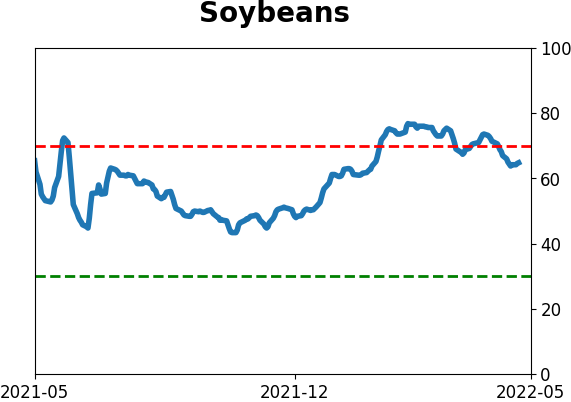
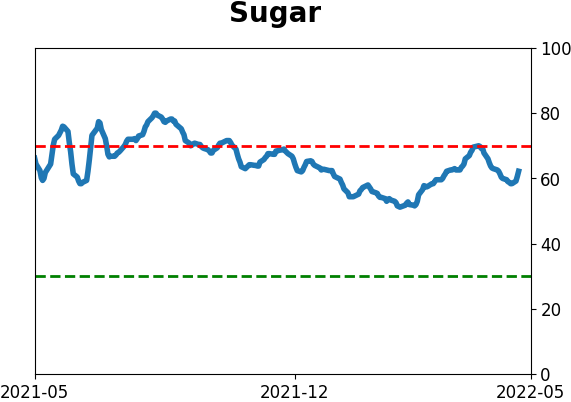
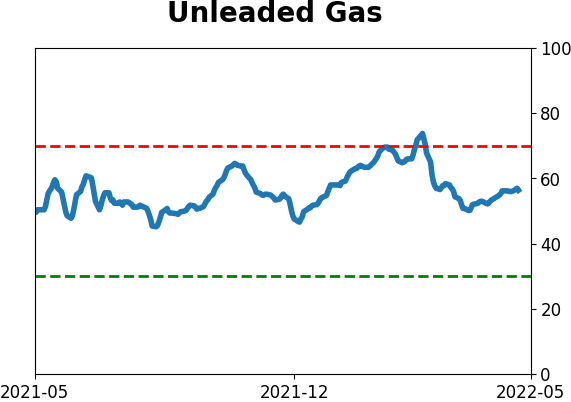
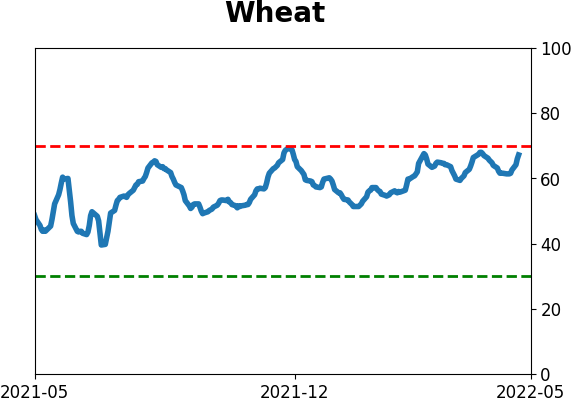
Agriculture
|
|
Research
By Jason Goepfert
BOTTOM LINE
When stocks lose the faith of Wall Street analysts, then we know things are bad. And lately, they've been more aggressively cutting price targets on S&P 500 companies, though they haven't been as busy downgrading earnings estimates. The sample size is tiny, but similar behavior occurred near market troughs.
FORECAST / TIMEFRAME
None
|
Key points:
- Wall Street analysts have been cutting price targets on S&P 500 stocks since January but have picked up the pace
- A long-term moving average of net price target upgrades-downgrades has reached an extreme level
- At the same time, they're not aggressively downgrading the fundamental prospects of the companies they follow
Analysts are starting to cut price targets aggressively
Stocks are losing some of their biggest supporters. When you lose Wall Street, then you know things are bad.
While they haven't yet gotten to the point of panic, analysts on Wall Street have been busy downgrading the price targets on stocks they follow within the S&P 500. Over the past 70 sessions, the net number of their price target upgrades versus downgrades has fallen to an average of -8.
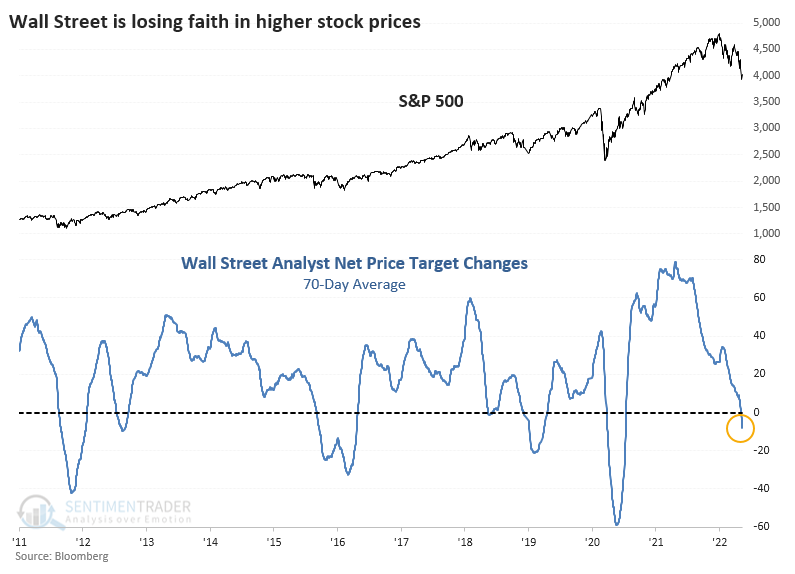
The downgrades are picking up. On Monday, 70 more stocks received target downgrades than upgrades, ranking in the bottom 2.5% of all days since 2010. It was the largest number of net downgrades since April 2020.
By the time a 70-day average of net price target changes fell to the current level, it's been at about the peak of selling pressure during past corrections.

Yes, we only have a mostly bull market environment with a friendly Fed to work with, but the S&P 500 worked higher each time over the next couple of months. As always with limited data sets, it's hard to know how this would have looked in 2002 or 2008 - probably much worse, for much longer.
Technicals = bad; fundamentals = good
Even though data is limited, it's worth noting that while analysts have been consistently knocking down the price targets of companies they follow, they haven't been as busy reducing earnings estimates. In other words, analysts hate the technicals of stocks they're following but seem to be okay with the fundamentals.
Over the past 70 sessions, there have been 23 when analysts showed a net downgrade of price targets, but a net upgrade (or no net movement) in EPS estimates. That's nearing the most days with technicals-bad-fundamentals-good activity that we've seen since 2010.
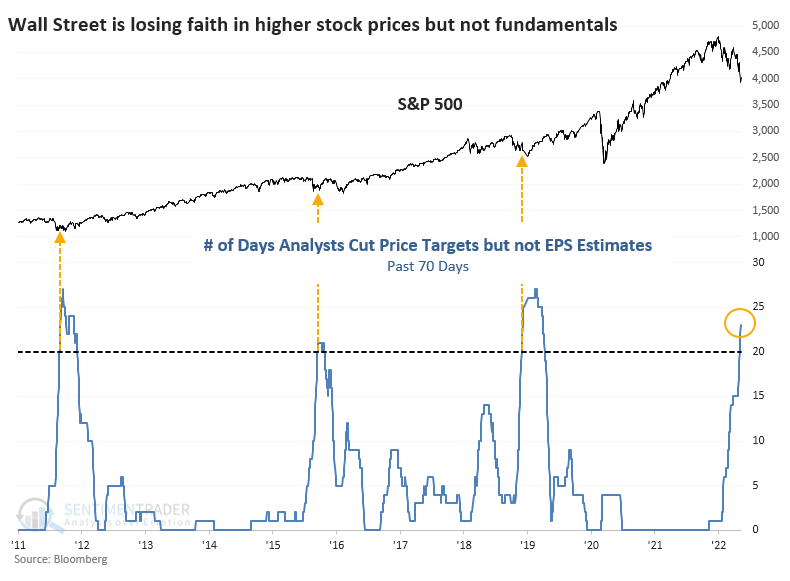
The arrows on the chart coincide with other times this reached 20 days. We can see that it aligns well with troughs in selling pressure in the S&P. Once again, this is with the complete understanding that it's a tiny sample size with a skewed market environment that may be nothing like we're facing now.
Strategists aren't quite so pessimistic
Wall Street analysts tend to work from the bottom up, monitoring and estimating earnings trends for individual companies and sectors. Strategists tend to work from the top down, looking at wide-ranging macro factors and potential impacts on earnings for entire countries or indexes.
Similar to when we looked at this after the late 2018 sell-off, analysts are downgrading price targets heavily on individual stocks, while strategists haven't been as aggressive in lowering their price targets for the S&P 500 index. Over the past ten days, the S&P's price has traded at a 20% discount to the average year-end strategist target.
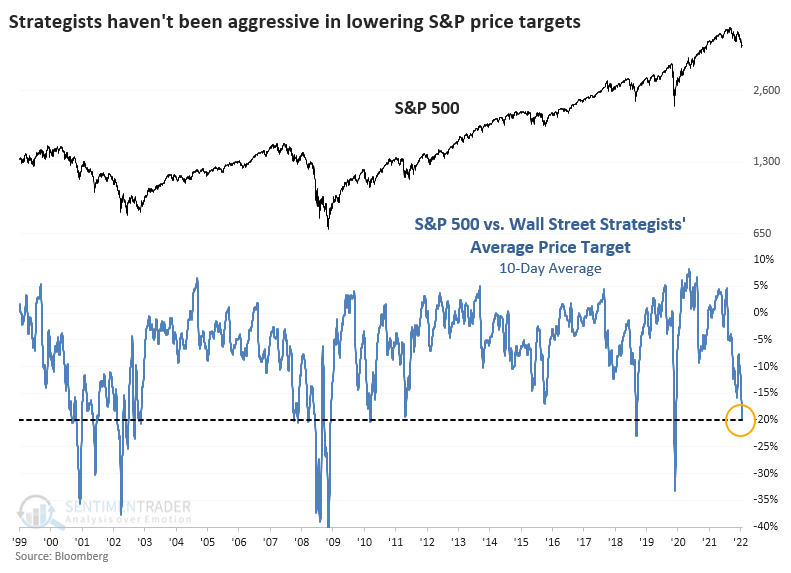
In the past, we've highlighted the historical importance of the S&P falling to a 20% discount from the average strategist price target. Stocks have tended to rebound from such severe discounts.
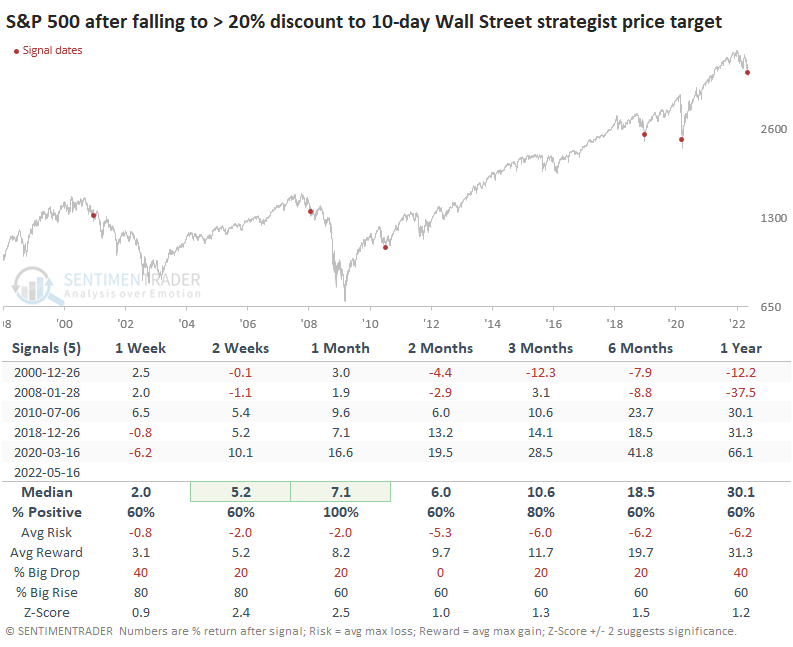
The caveat, which should be immediately apparent, is that this happened early in the last two protracted bear markets. After modest bounces, stocks fell again, and strategists couldn't keep up with falling prices, and the S&P went on to trade at 35% discounts to where strategists thought the index would end the year.
What the research tells us...
We already know that sentiment reached washed-out levels last week, and Friday's nascent sign of renewed buying interest has been a good sign. The behavior of analysts on Wall Street, who face the continual pressure of career risk when updating price and earnings estimates, is also telling. Because stock prices typically rise, analysts tend to skew their price estimates to the high side. It takes a dire market to get them to downgrade targets en masse, which they've done consistently since January. They've recently been picking up the pace of downgrades, which tends to be a decent contrary signal.
Indicators at Extremes
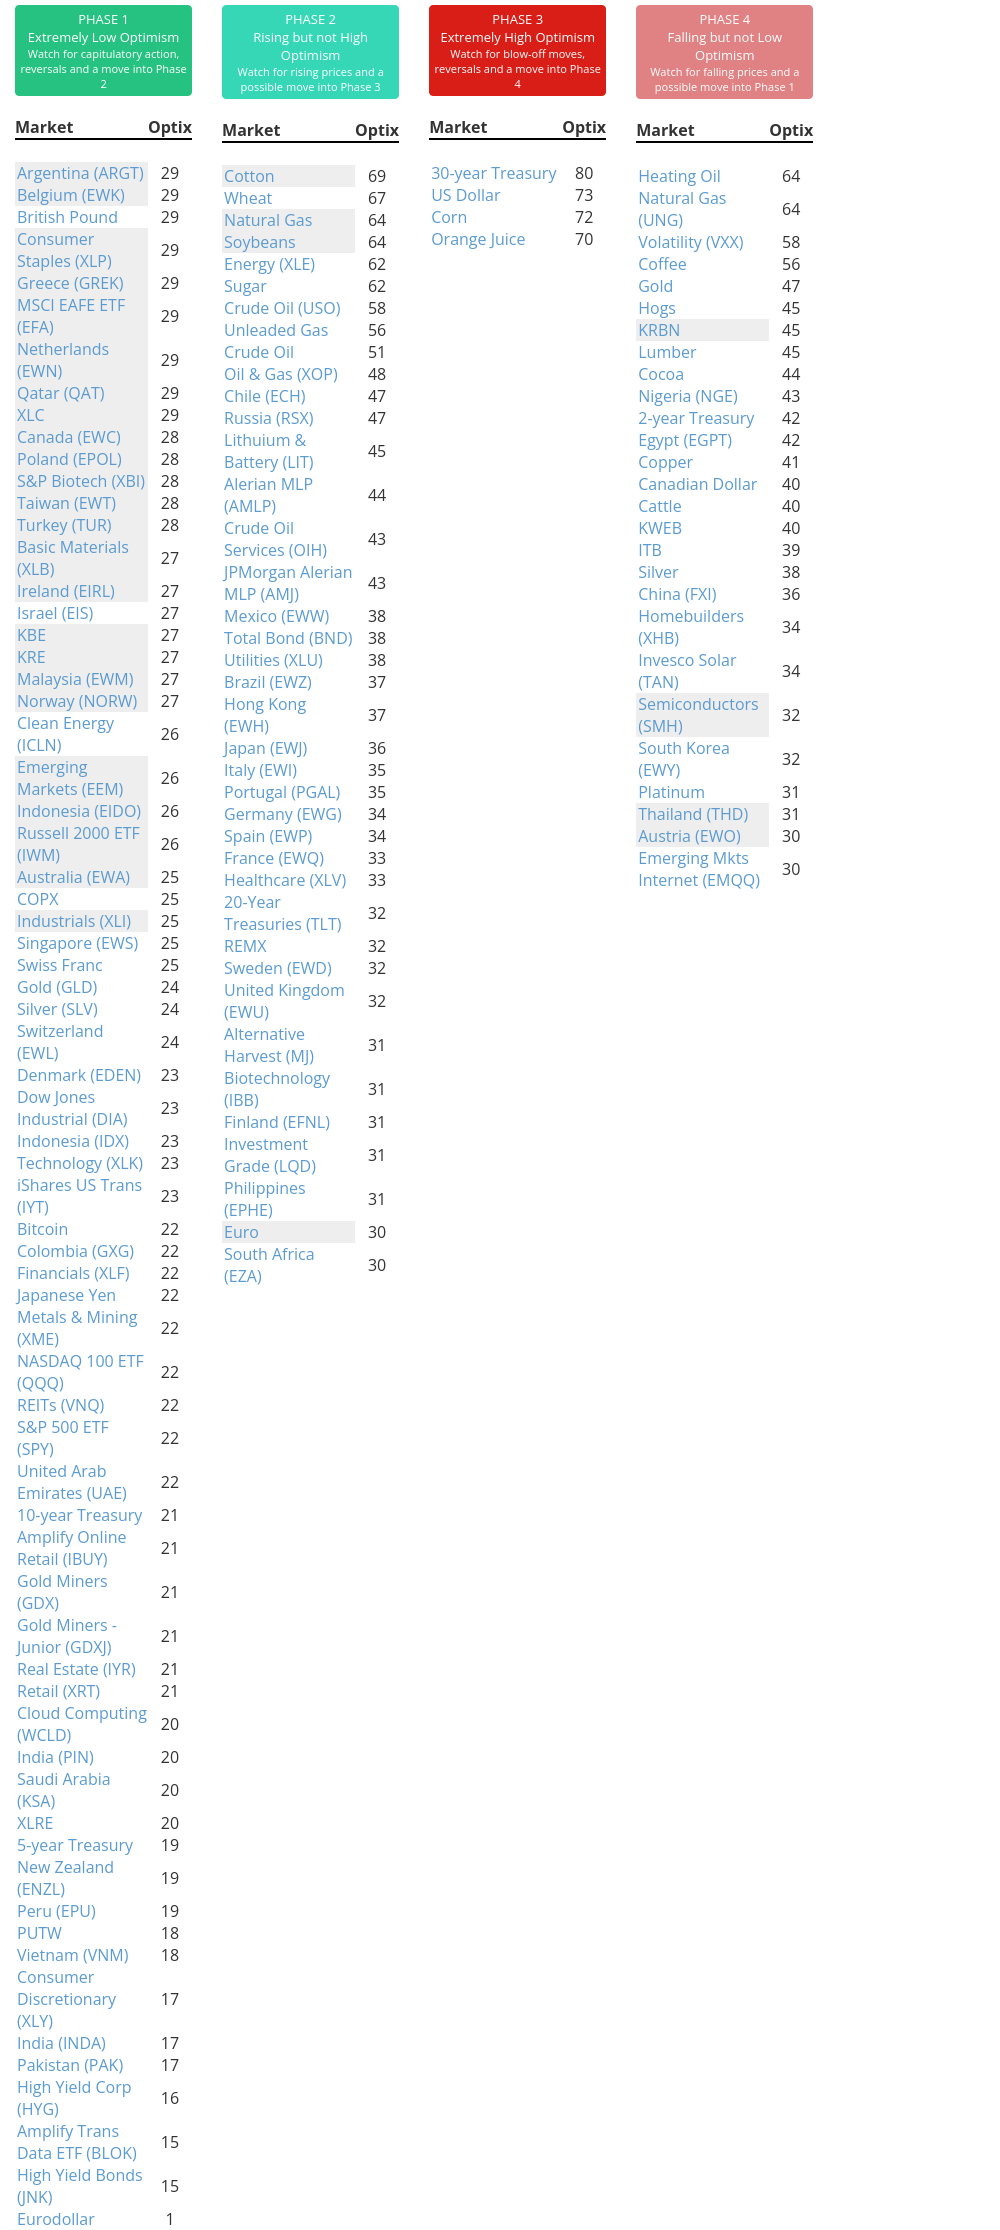
Phase Table
Ranks
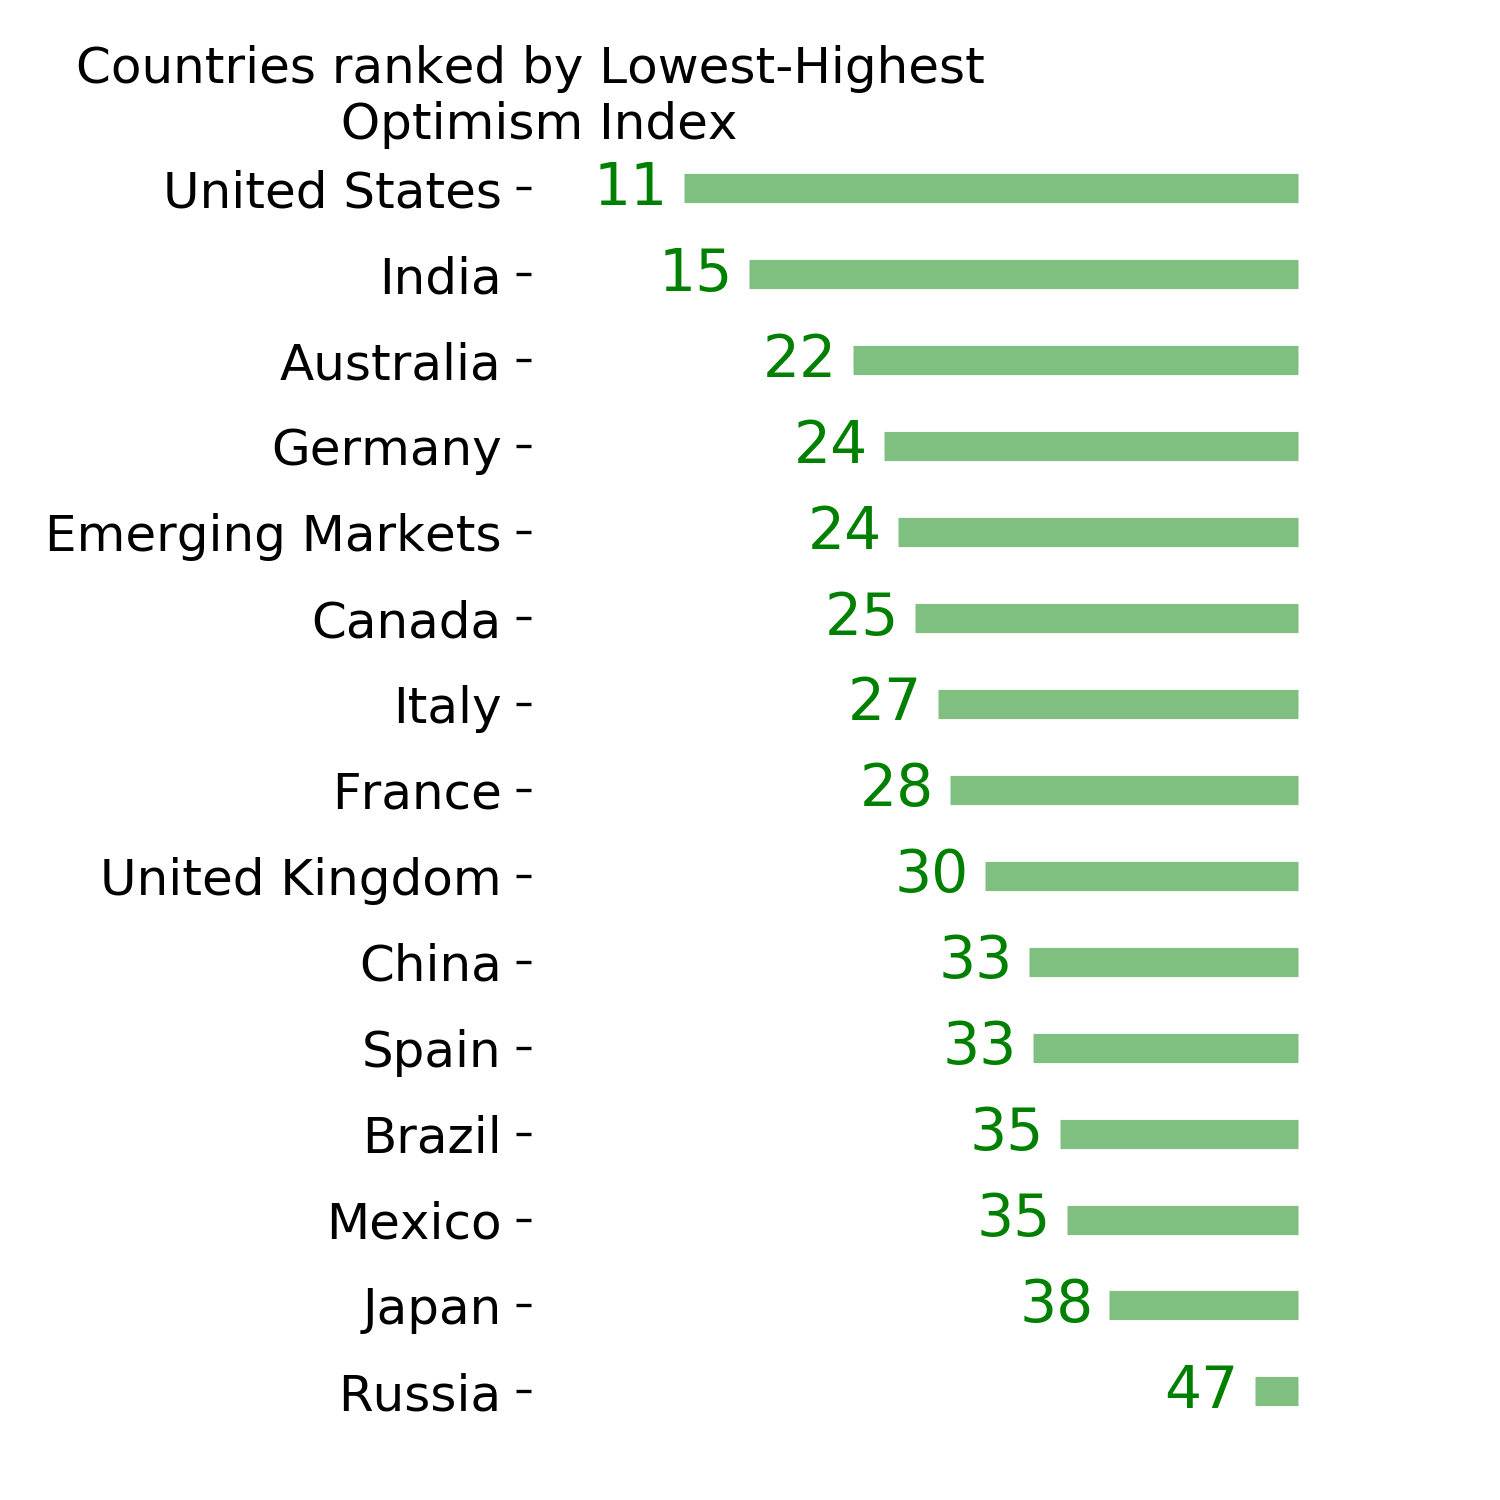
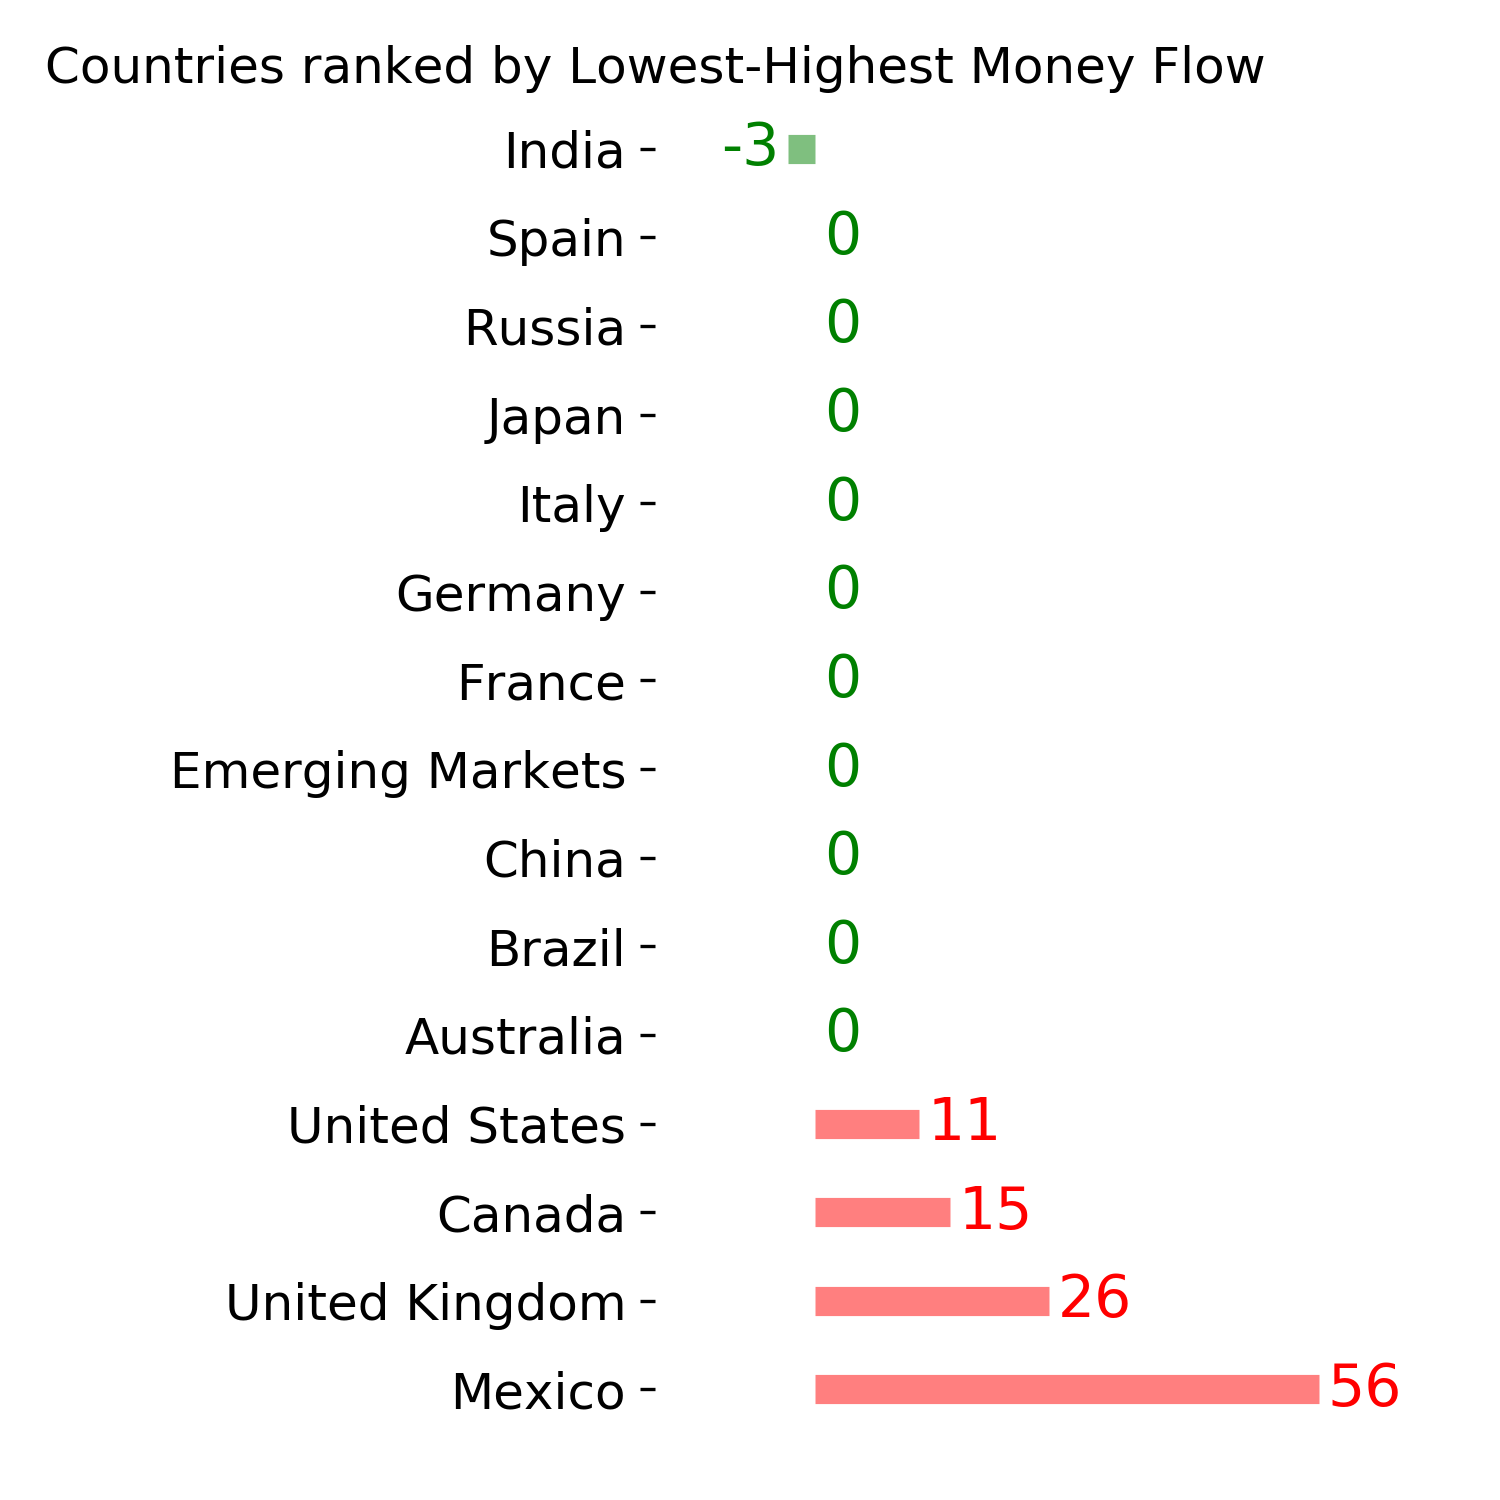
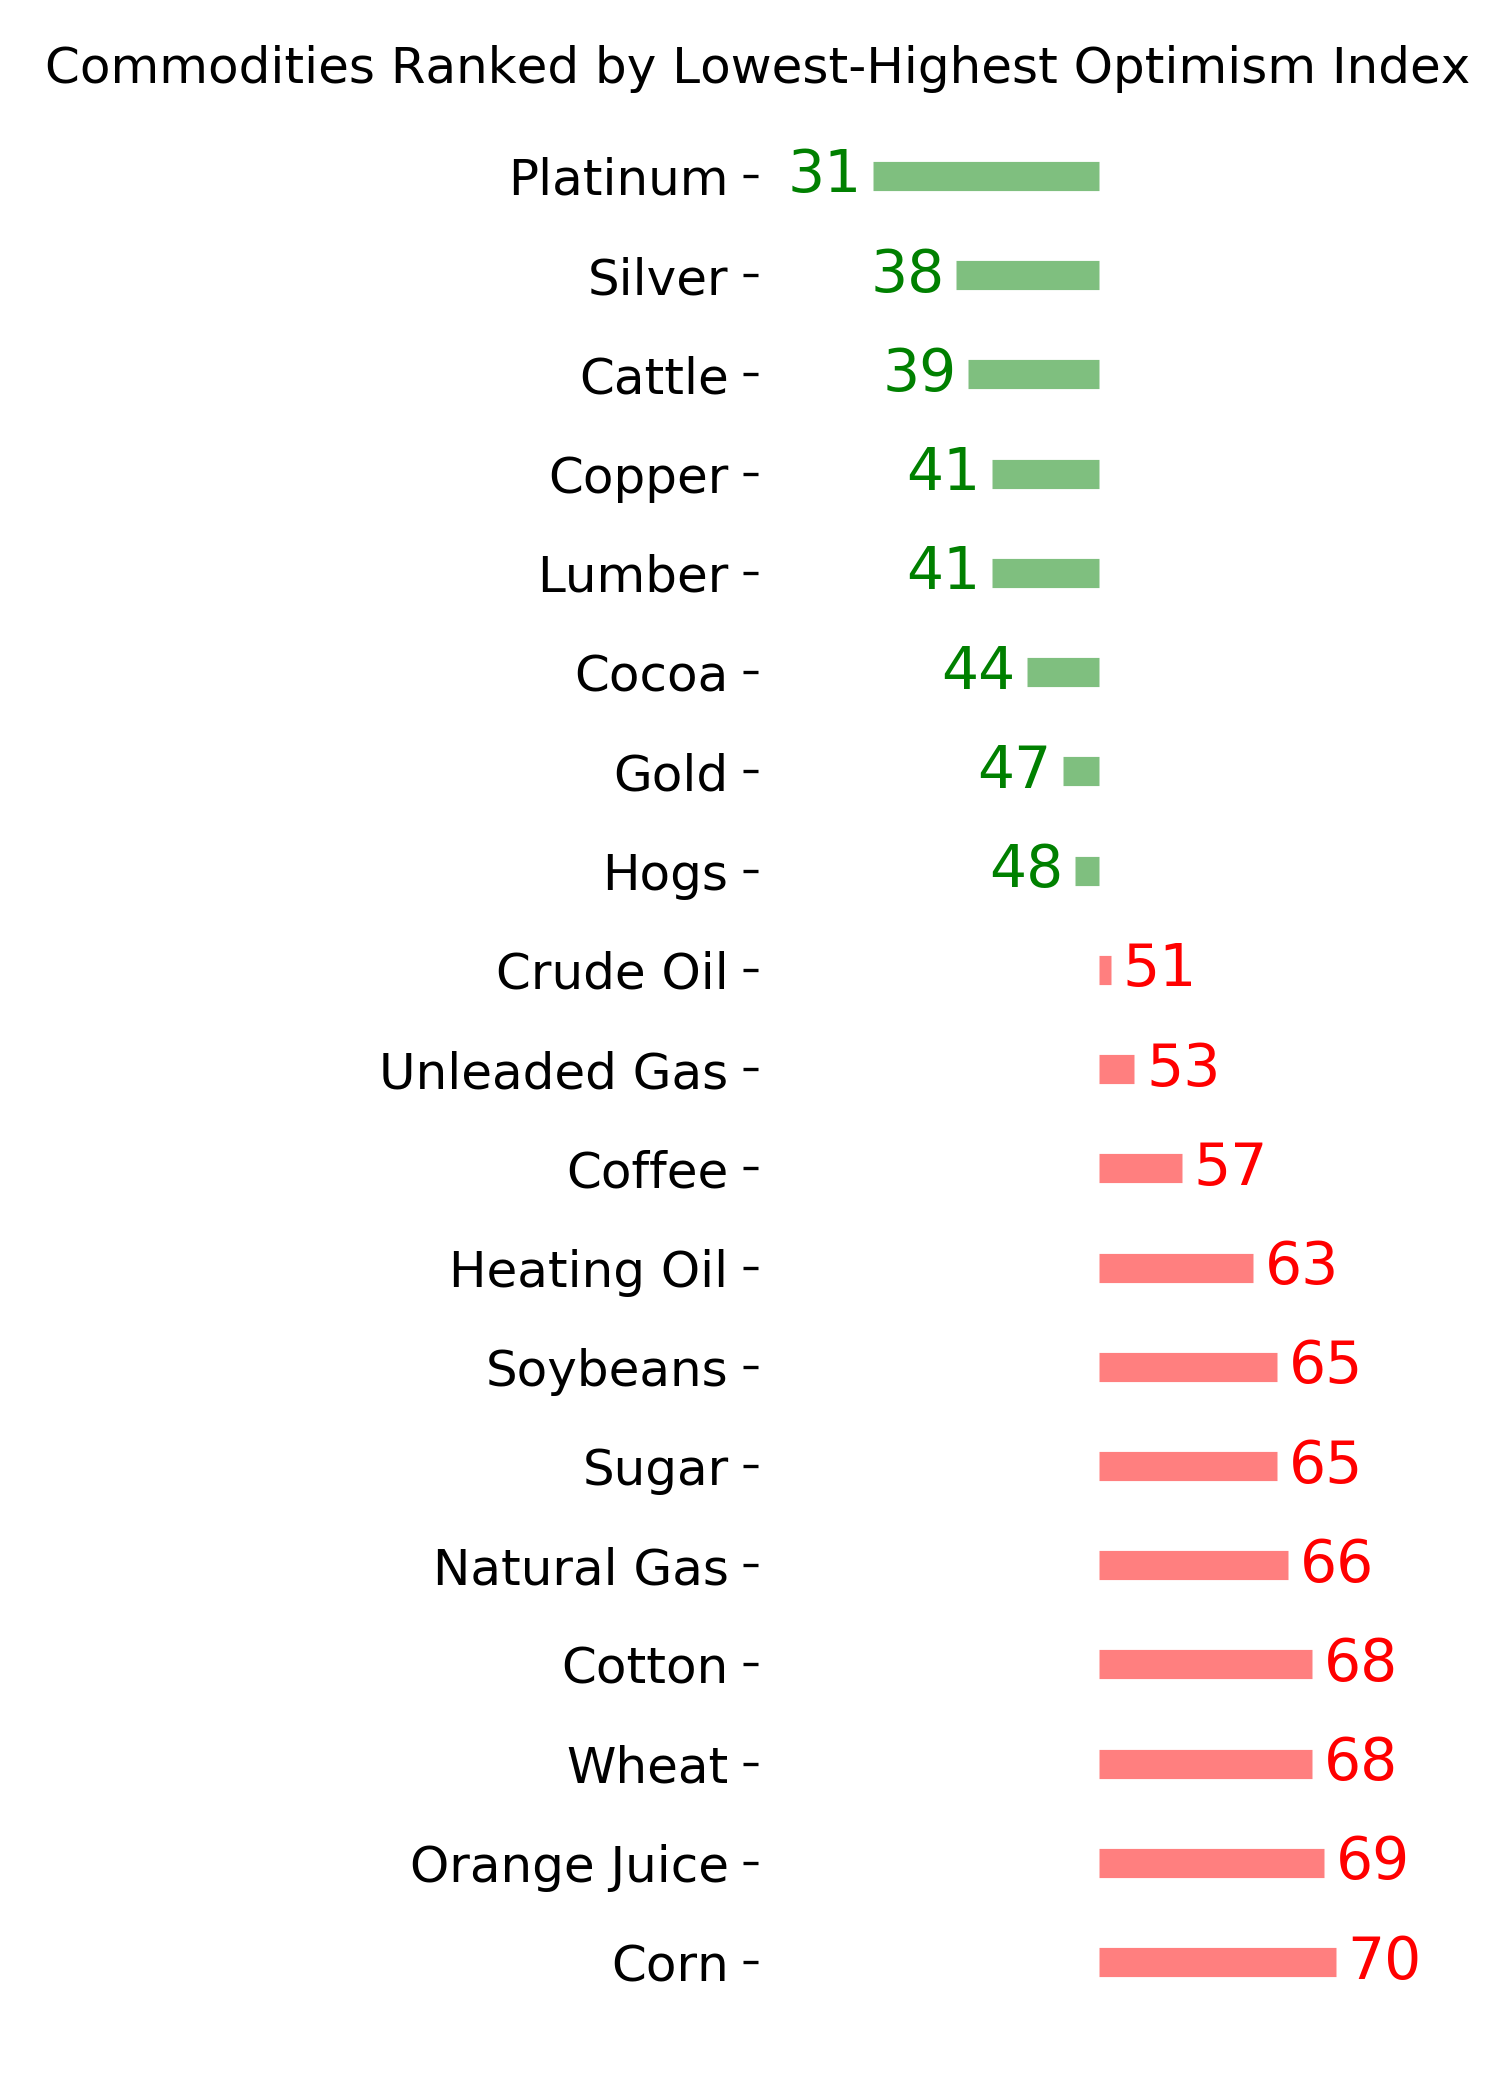
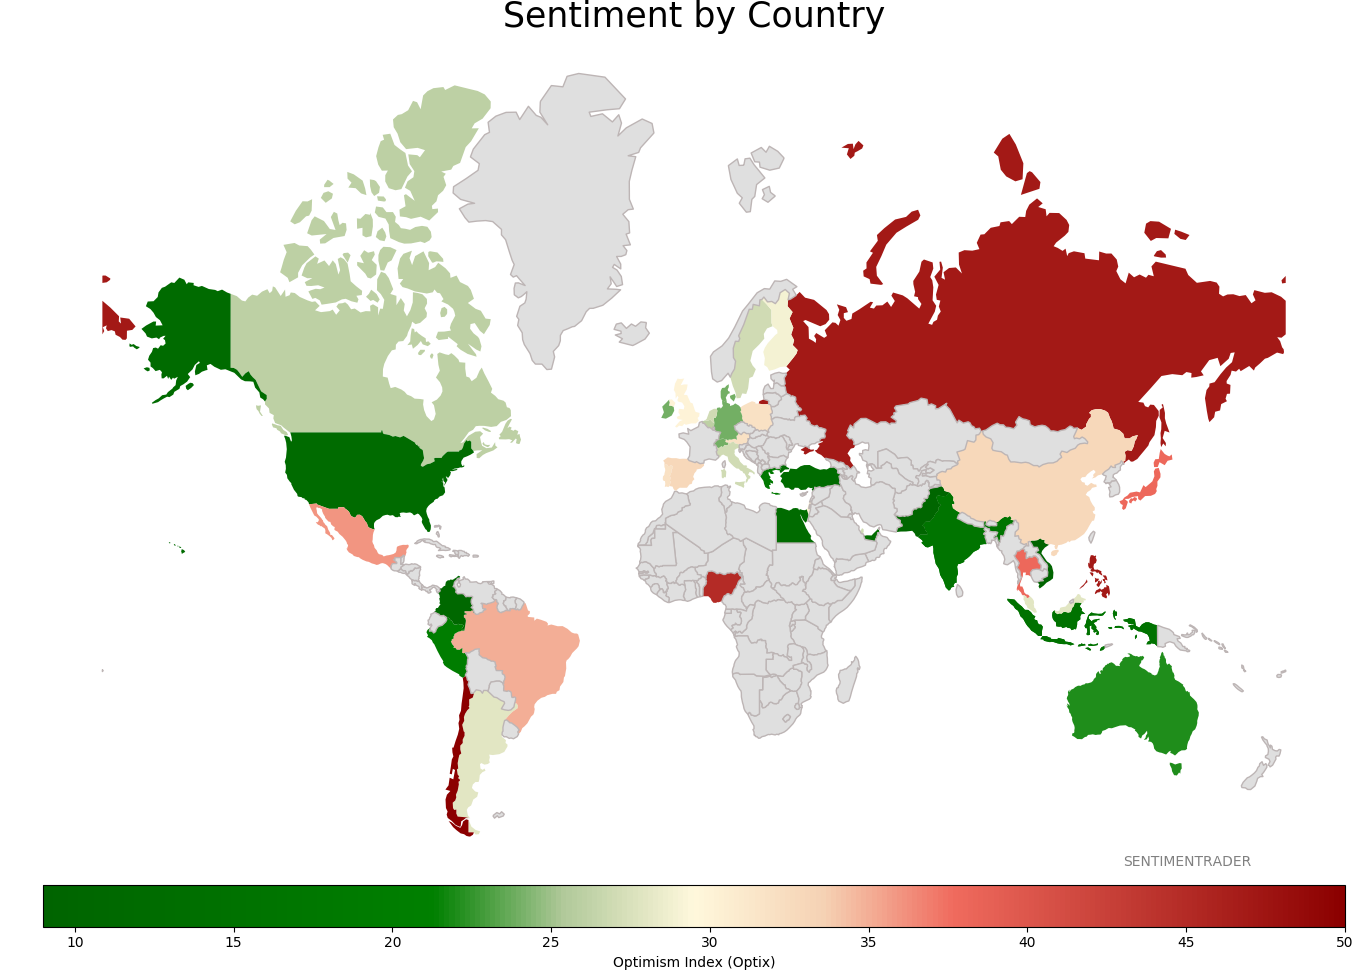
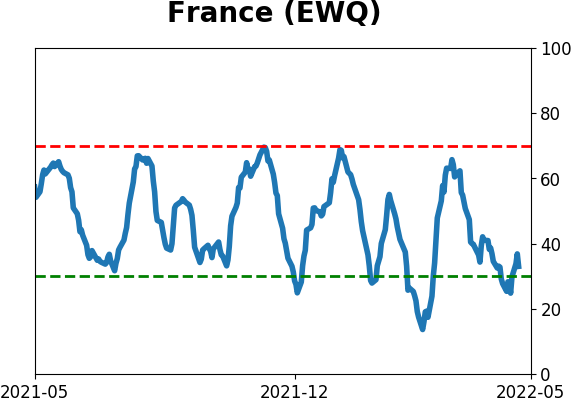
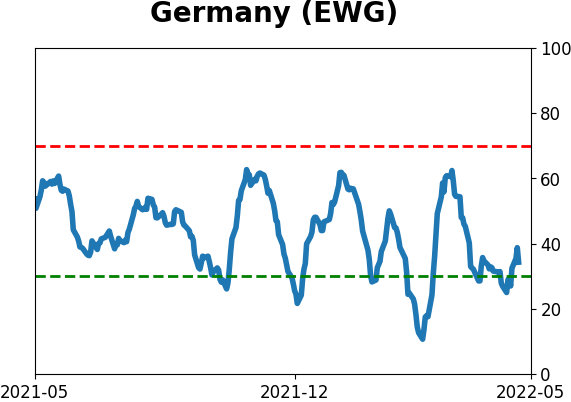
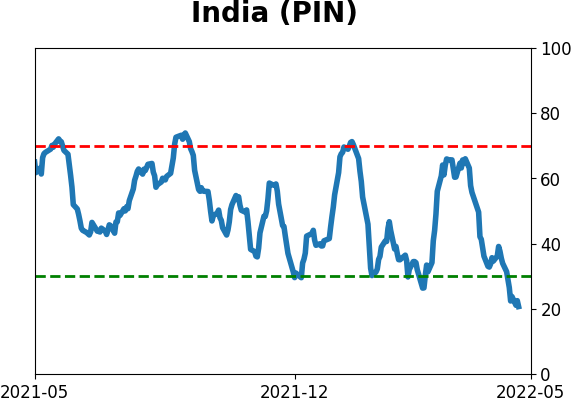
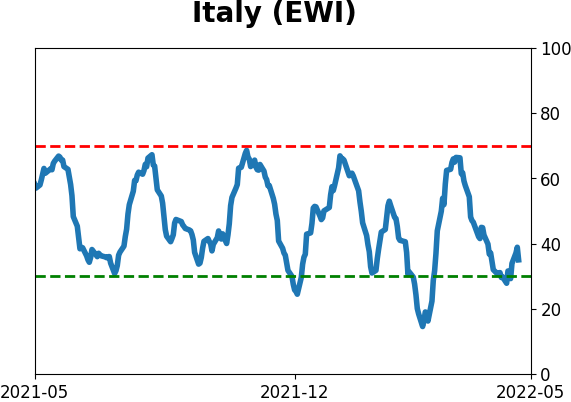
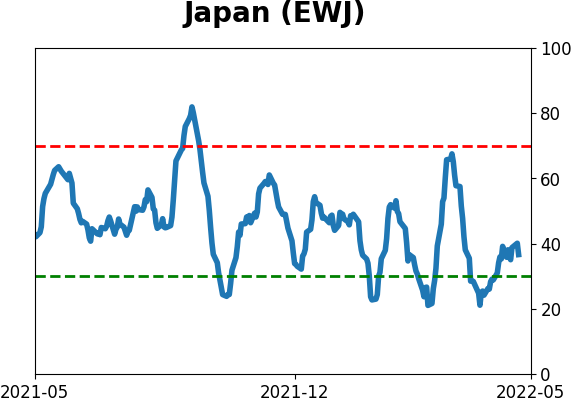
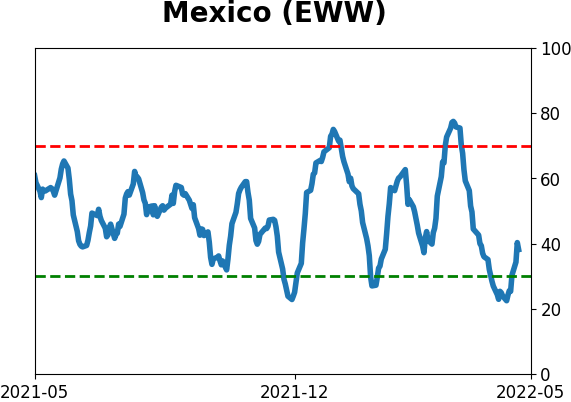
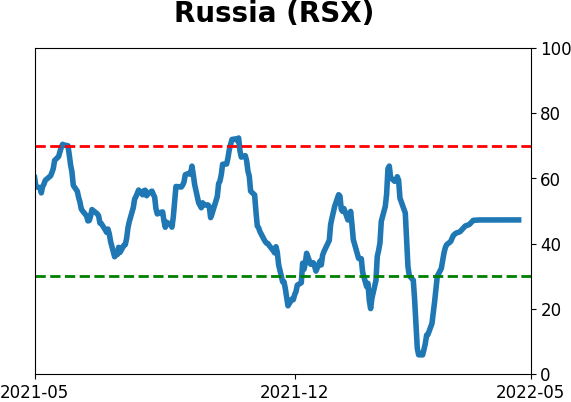
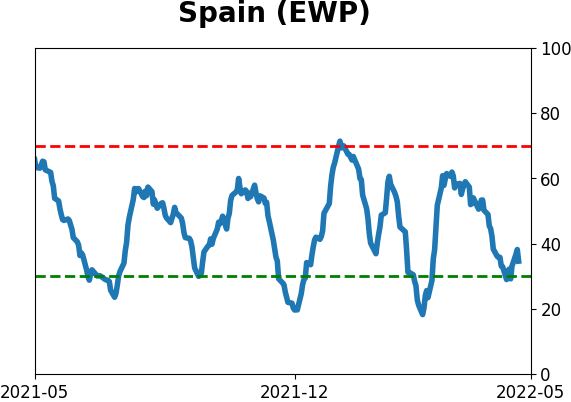
Sentiment Around The World
Optimism Index Thumbnails
|
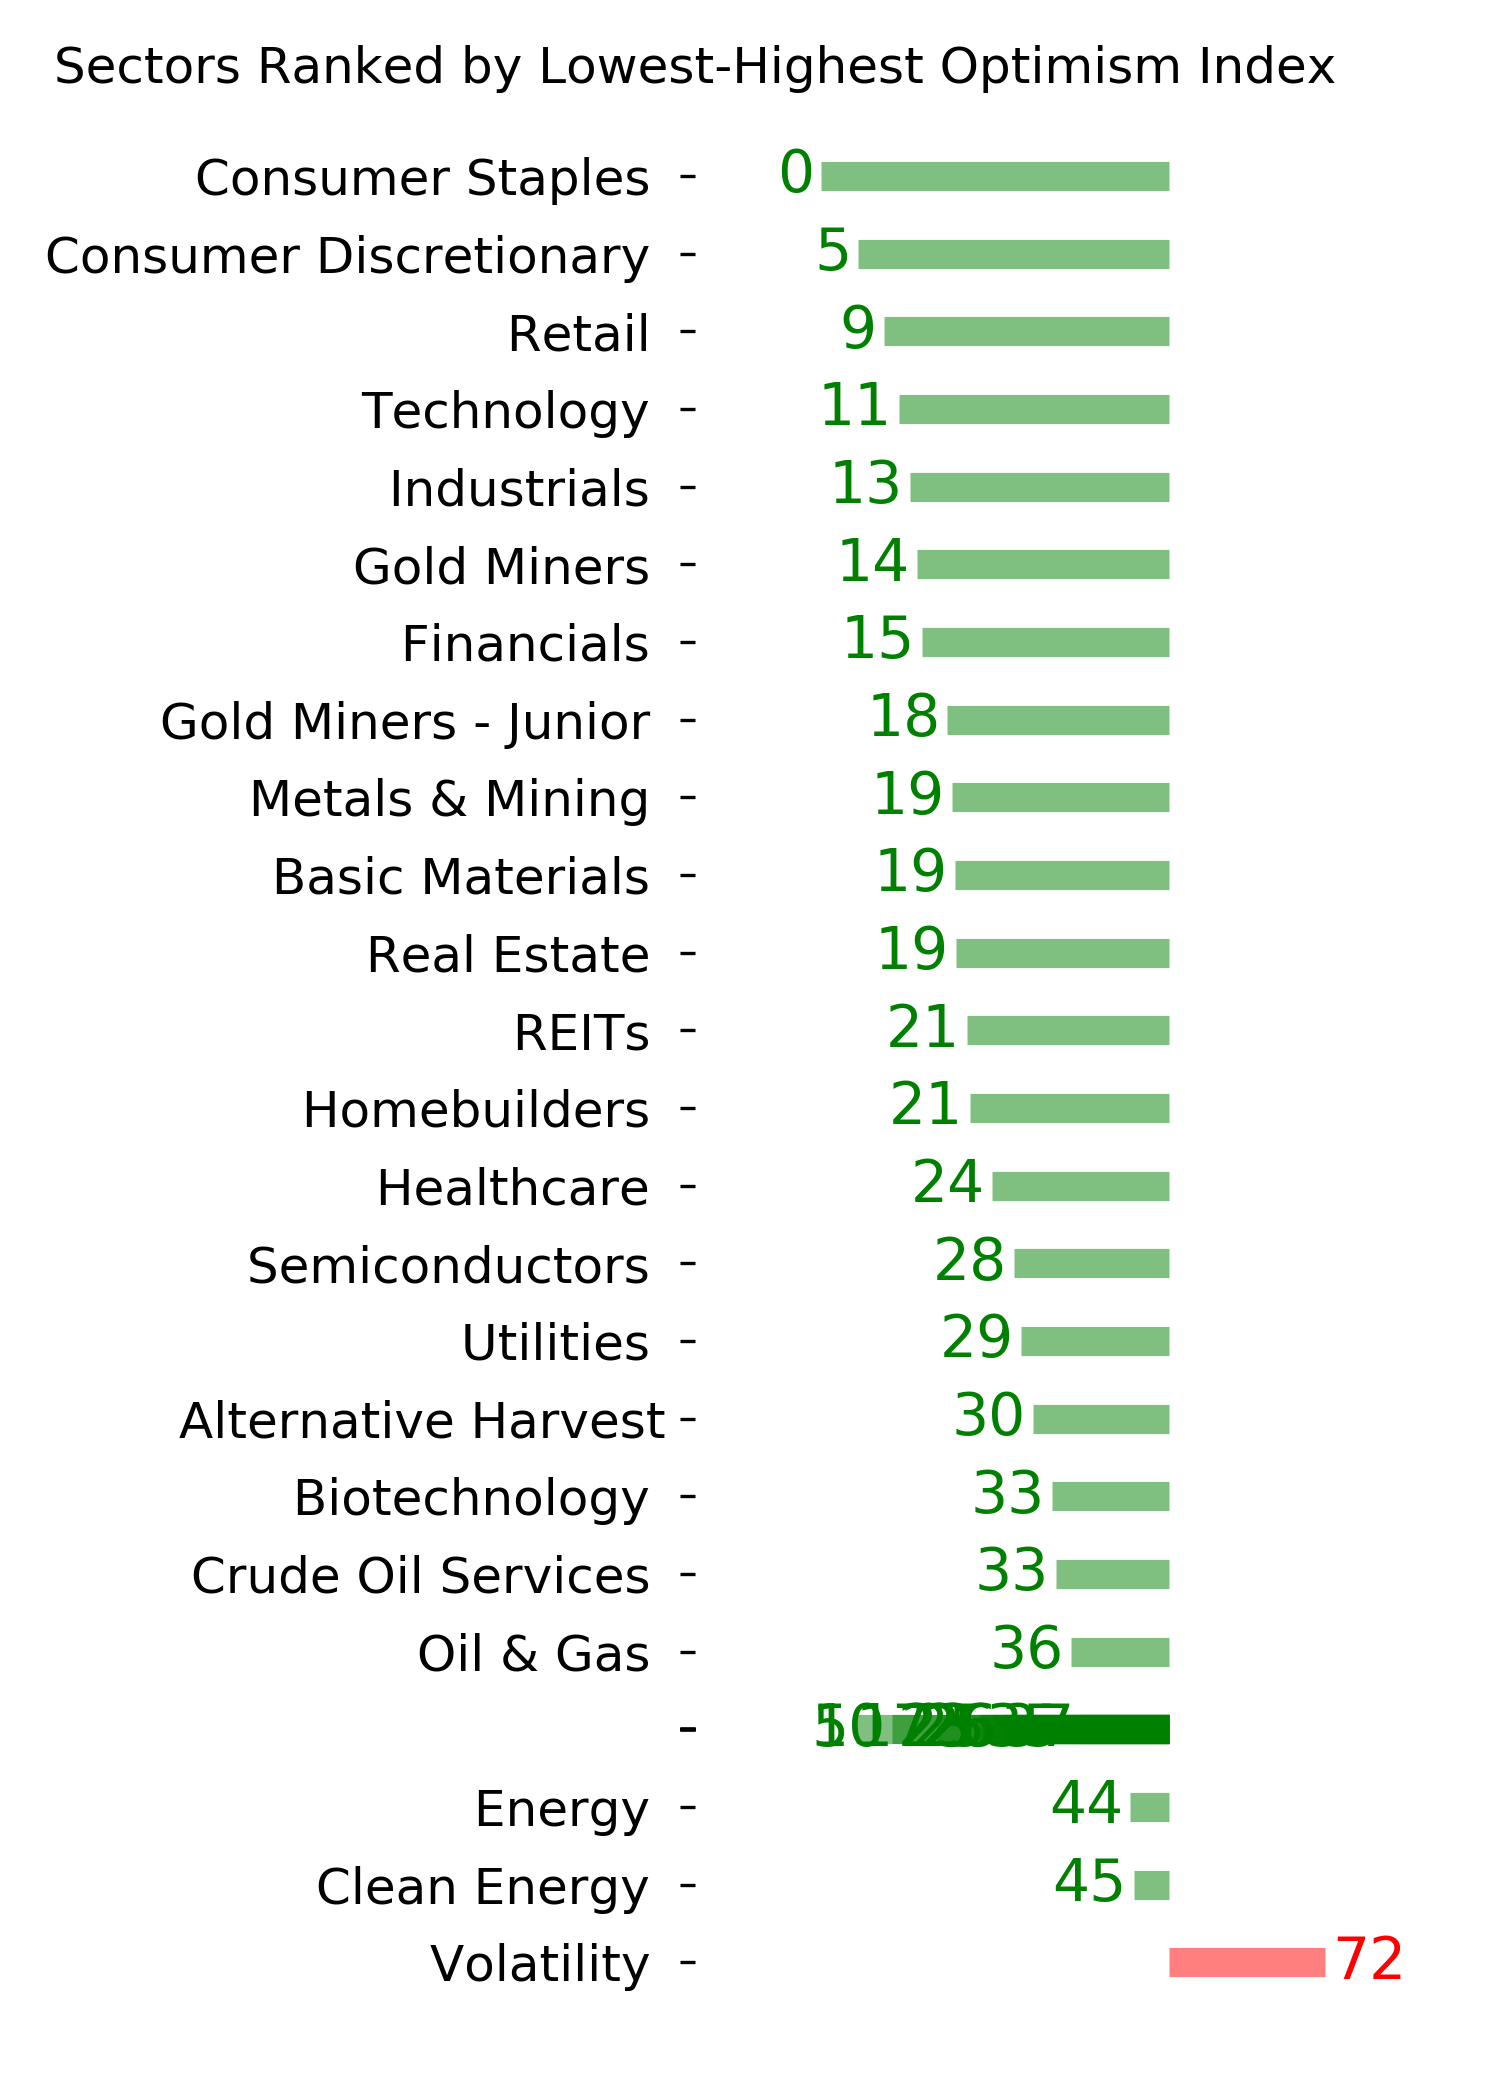
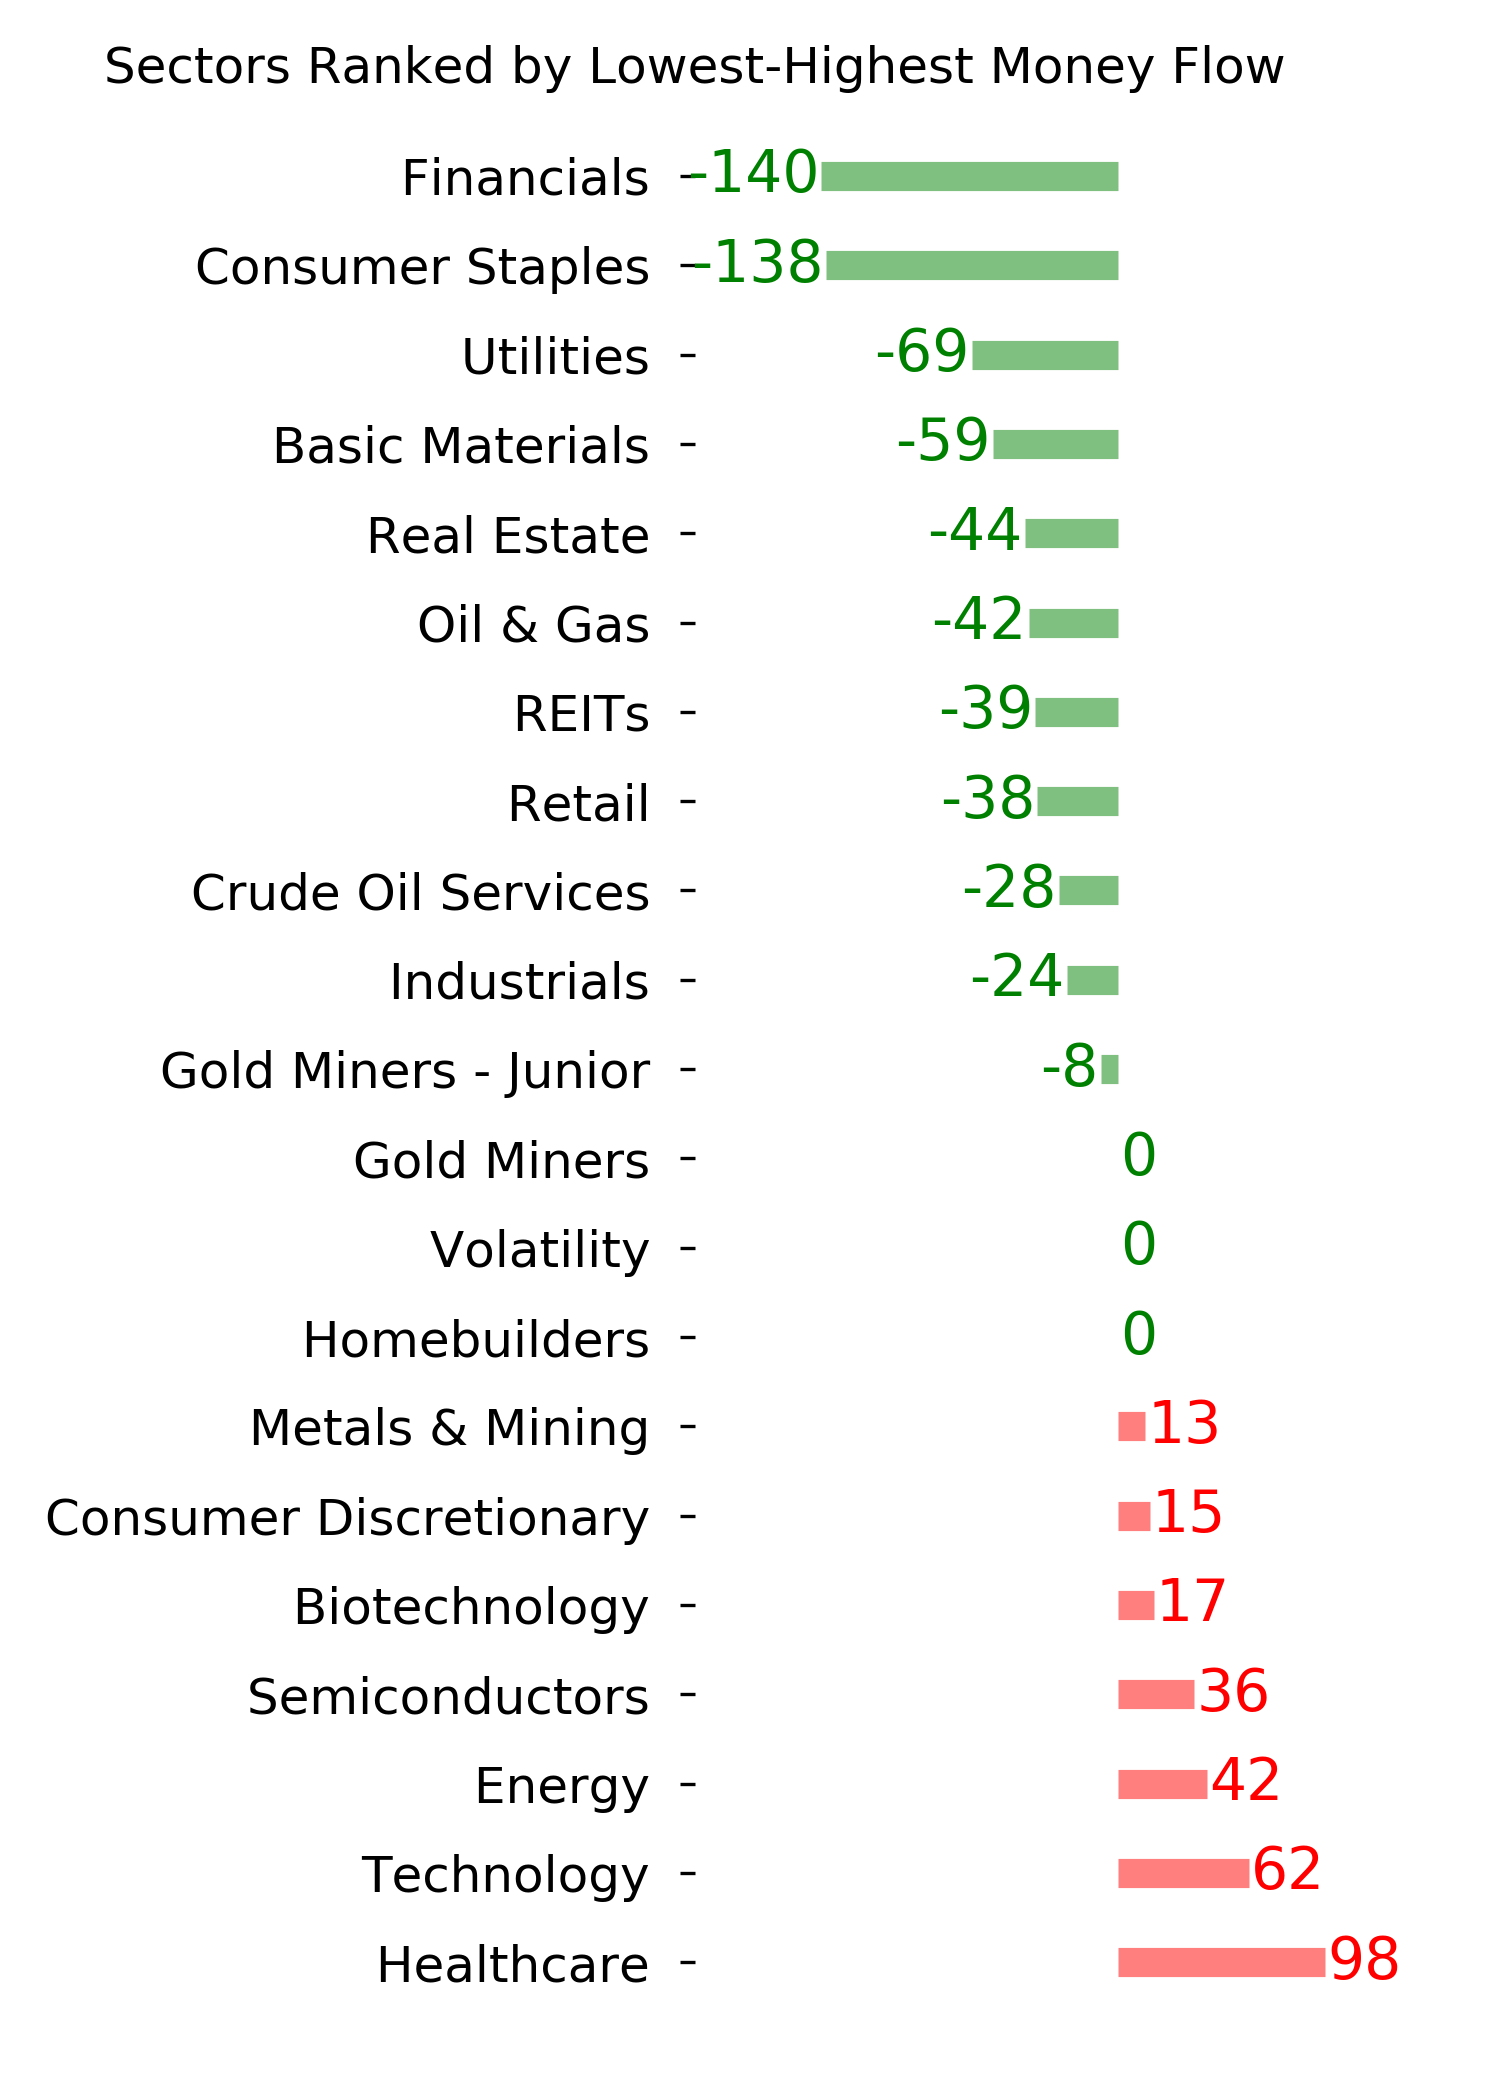
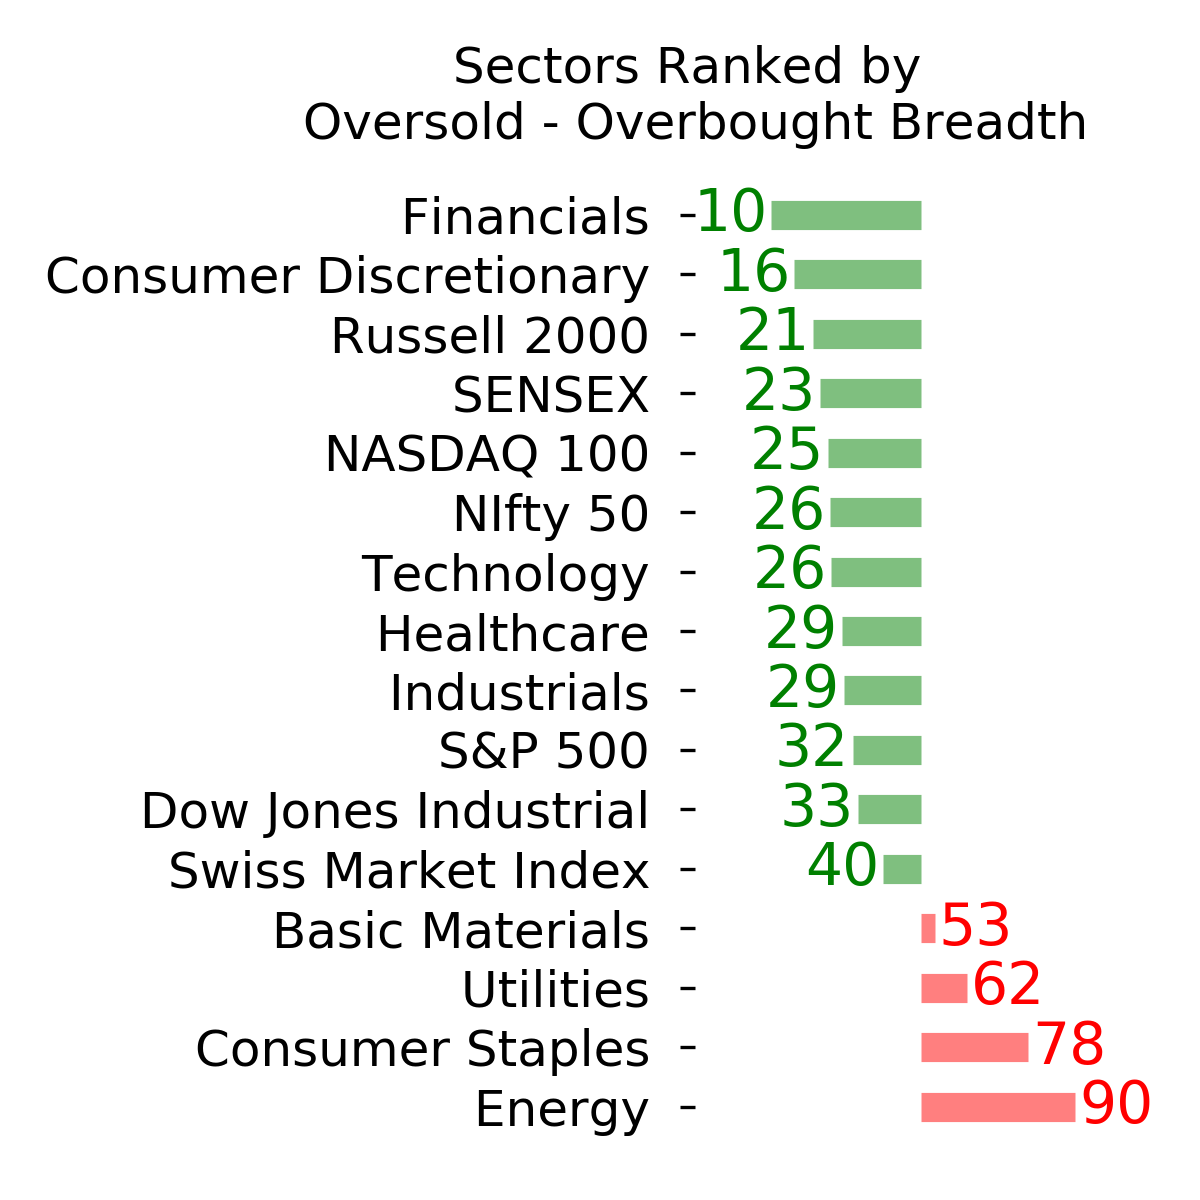
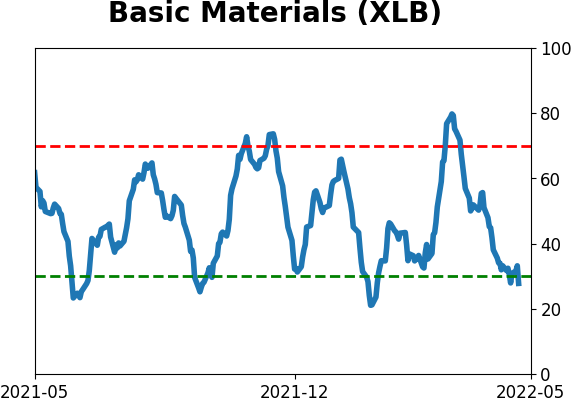
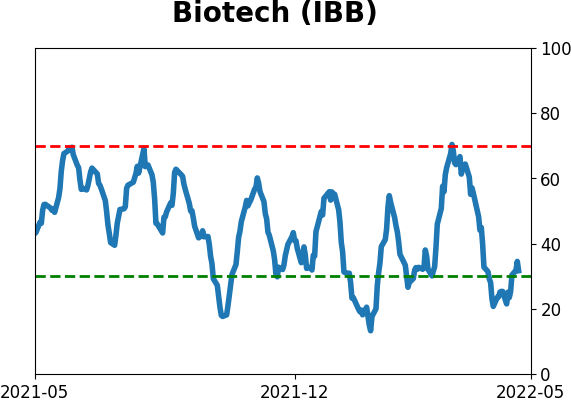
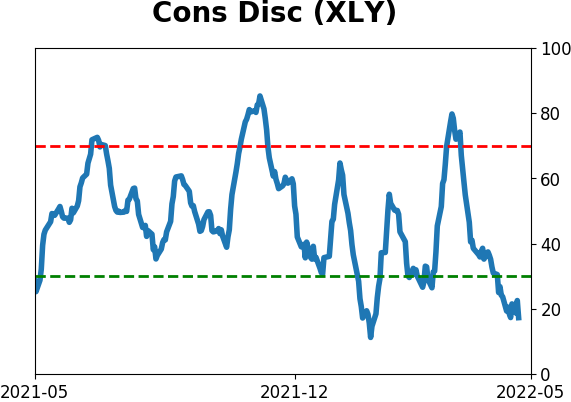
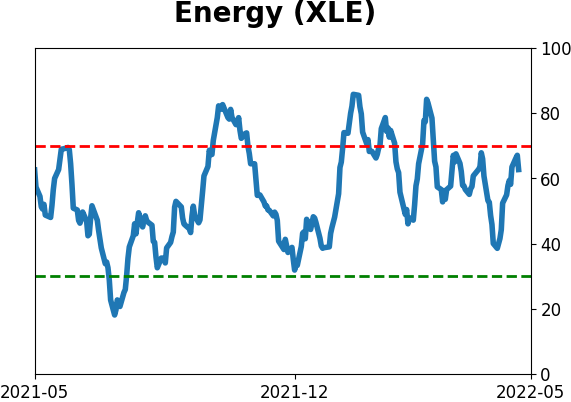
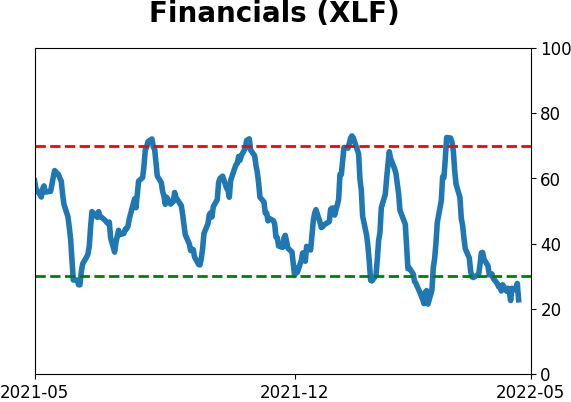
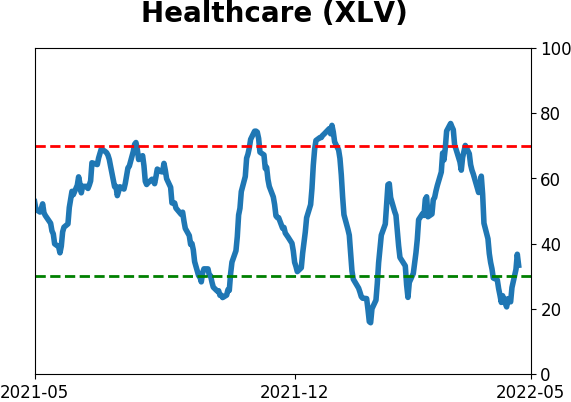
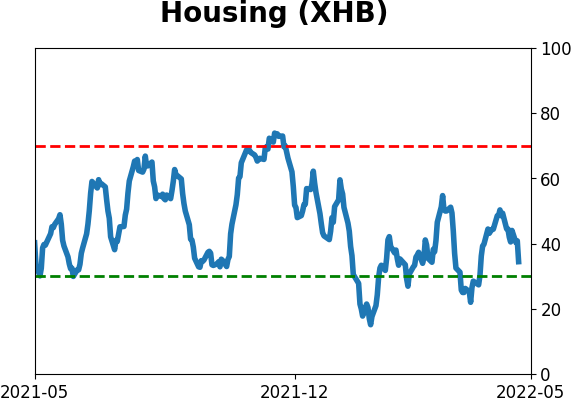
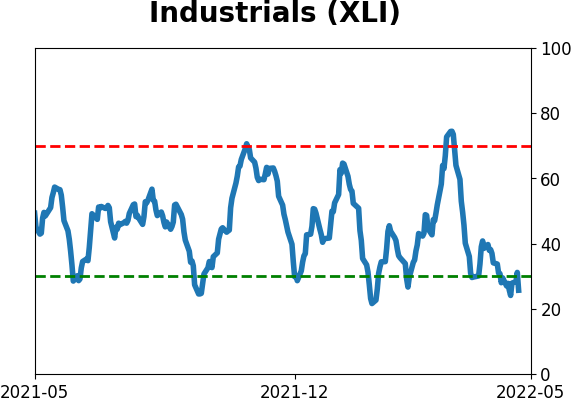
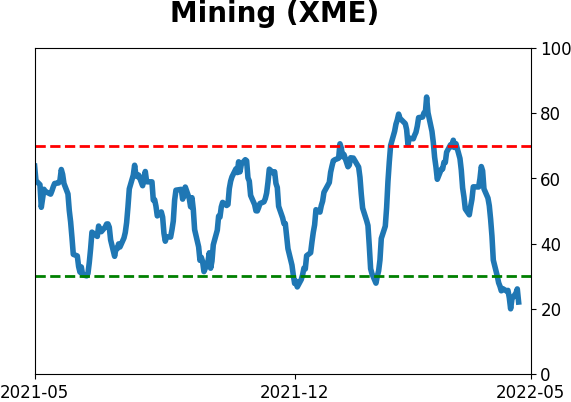
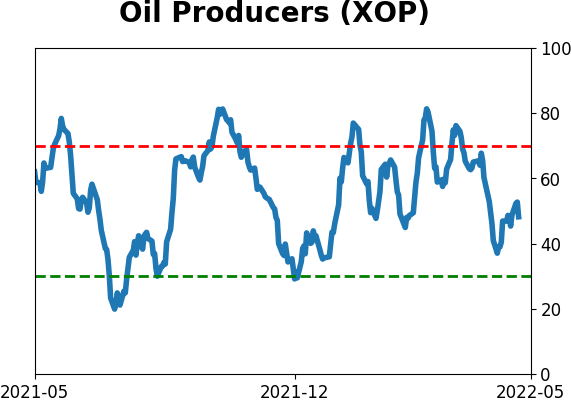
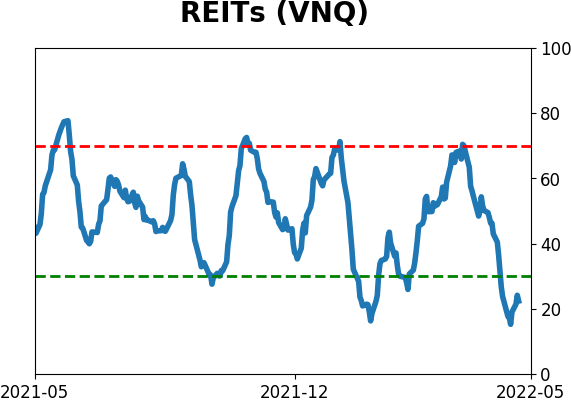
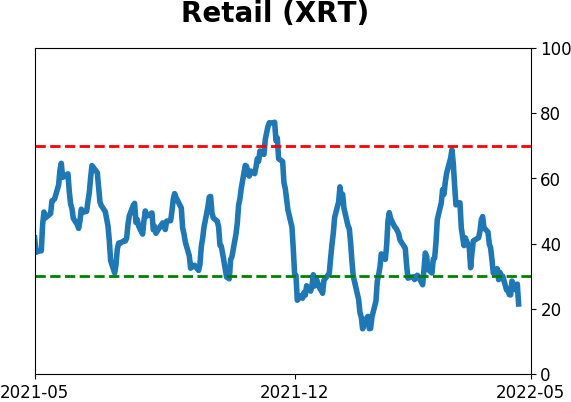
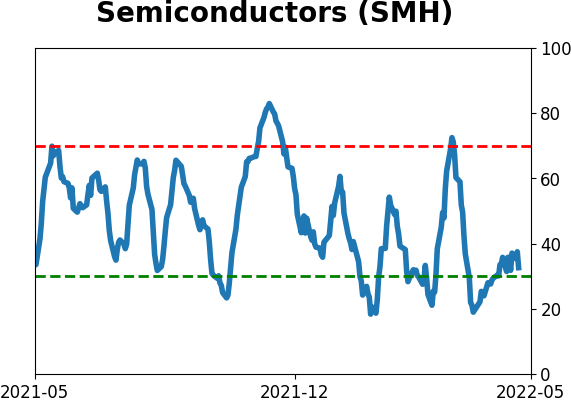
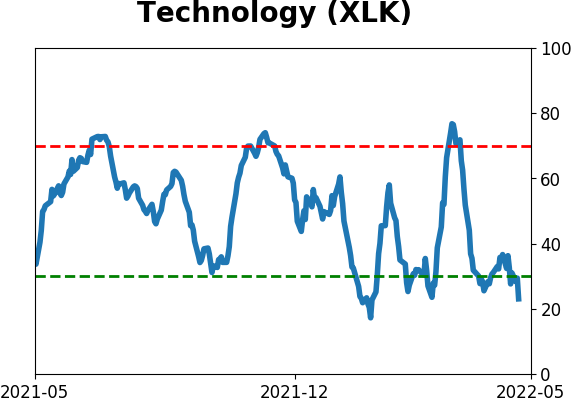
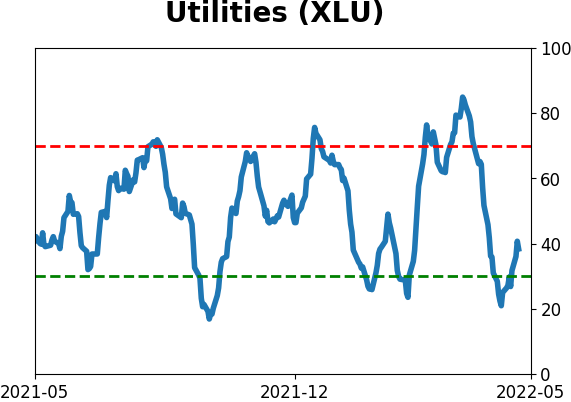
Sector ETF's - 10-Day Moving Average
|
|
|
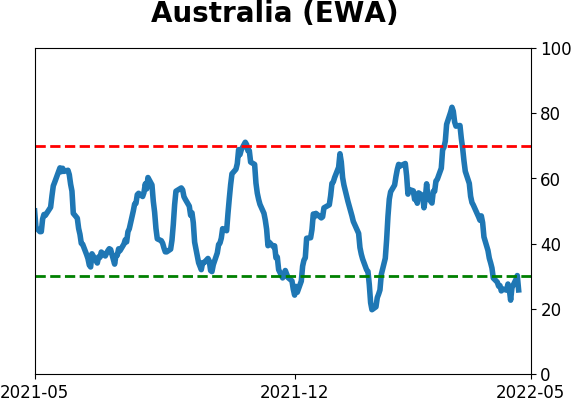
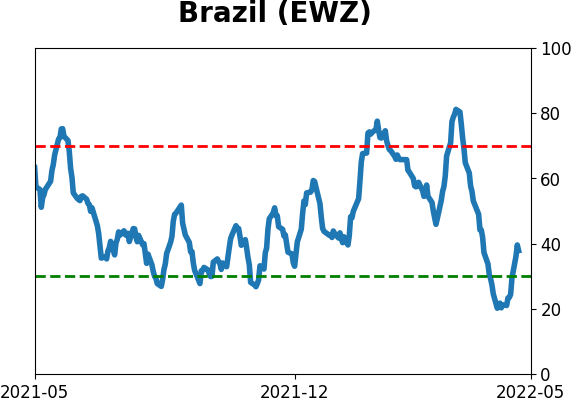
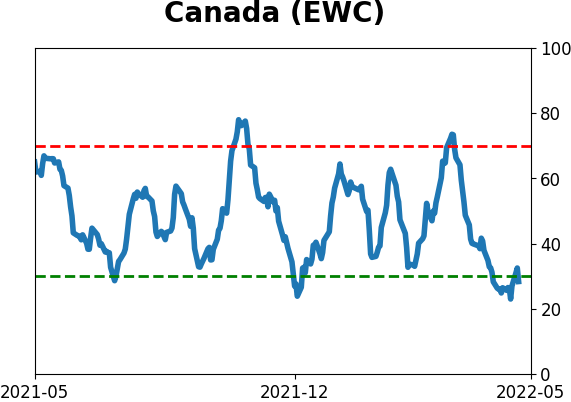
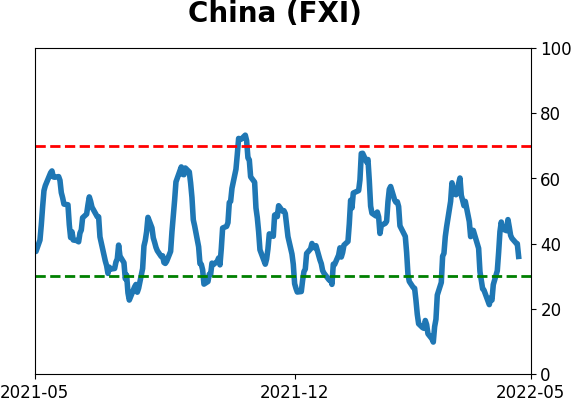
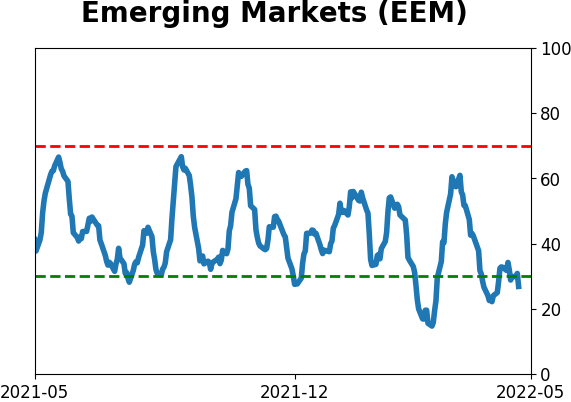
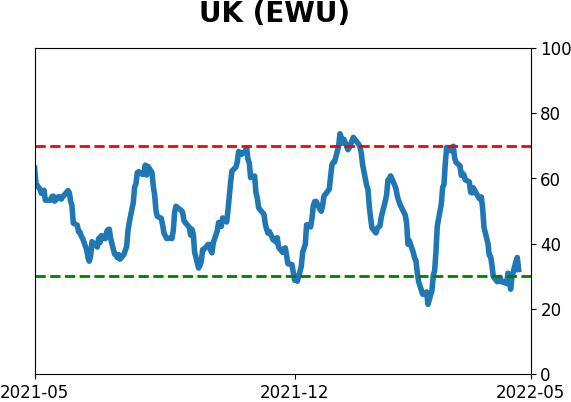
Country ETF's - 10-Day Moving Average
|
|
|
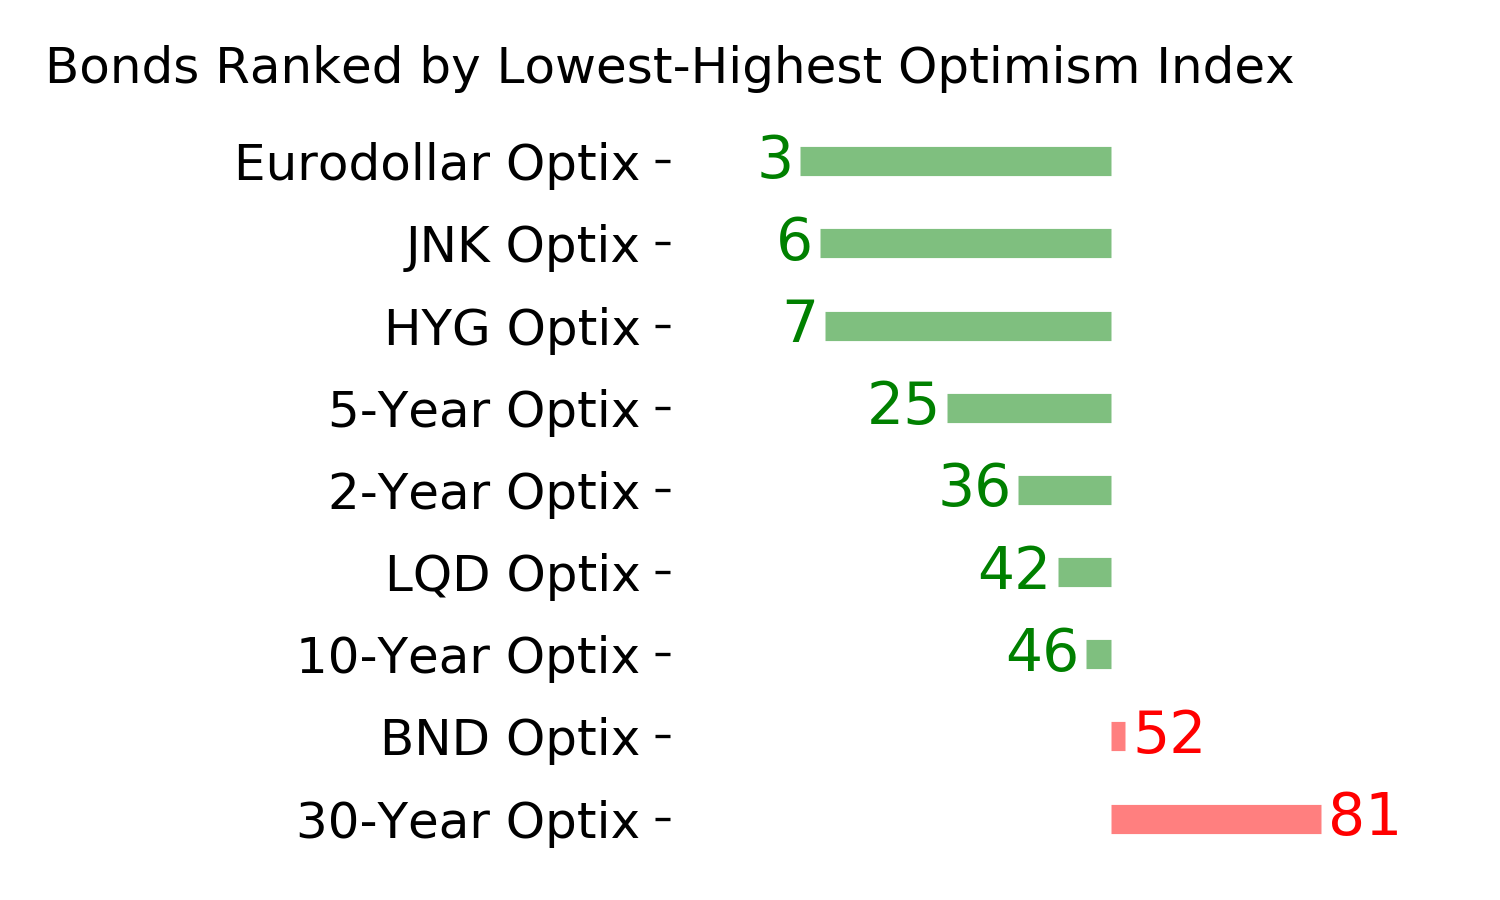
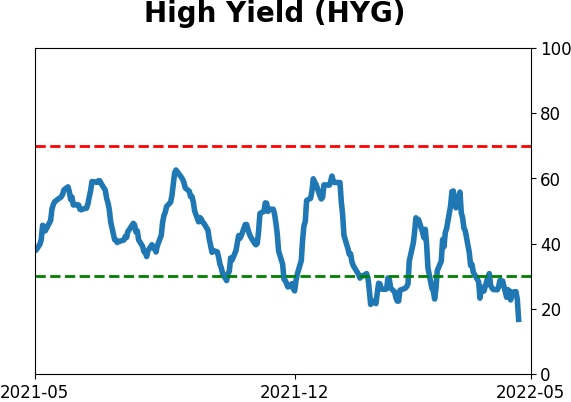
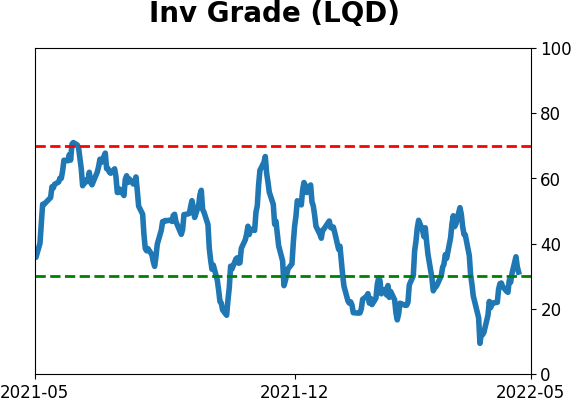
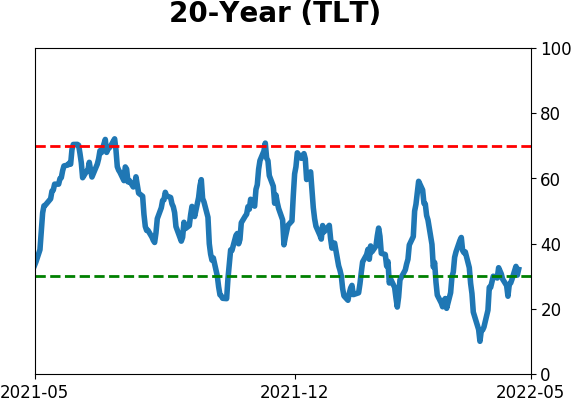
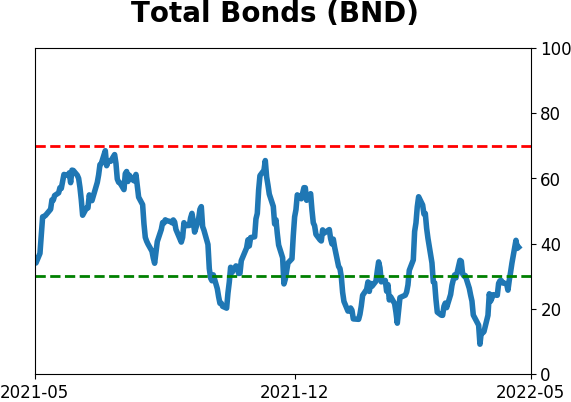
Bond ETF's - 10-Day Moving Average
|
|
|
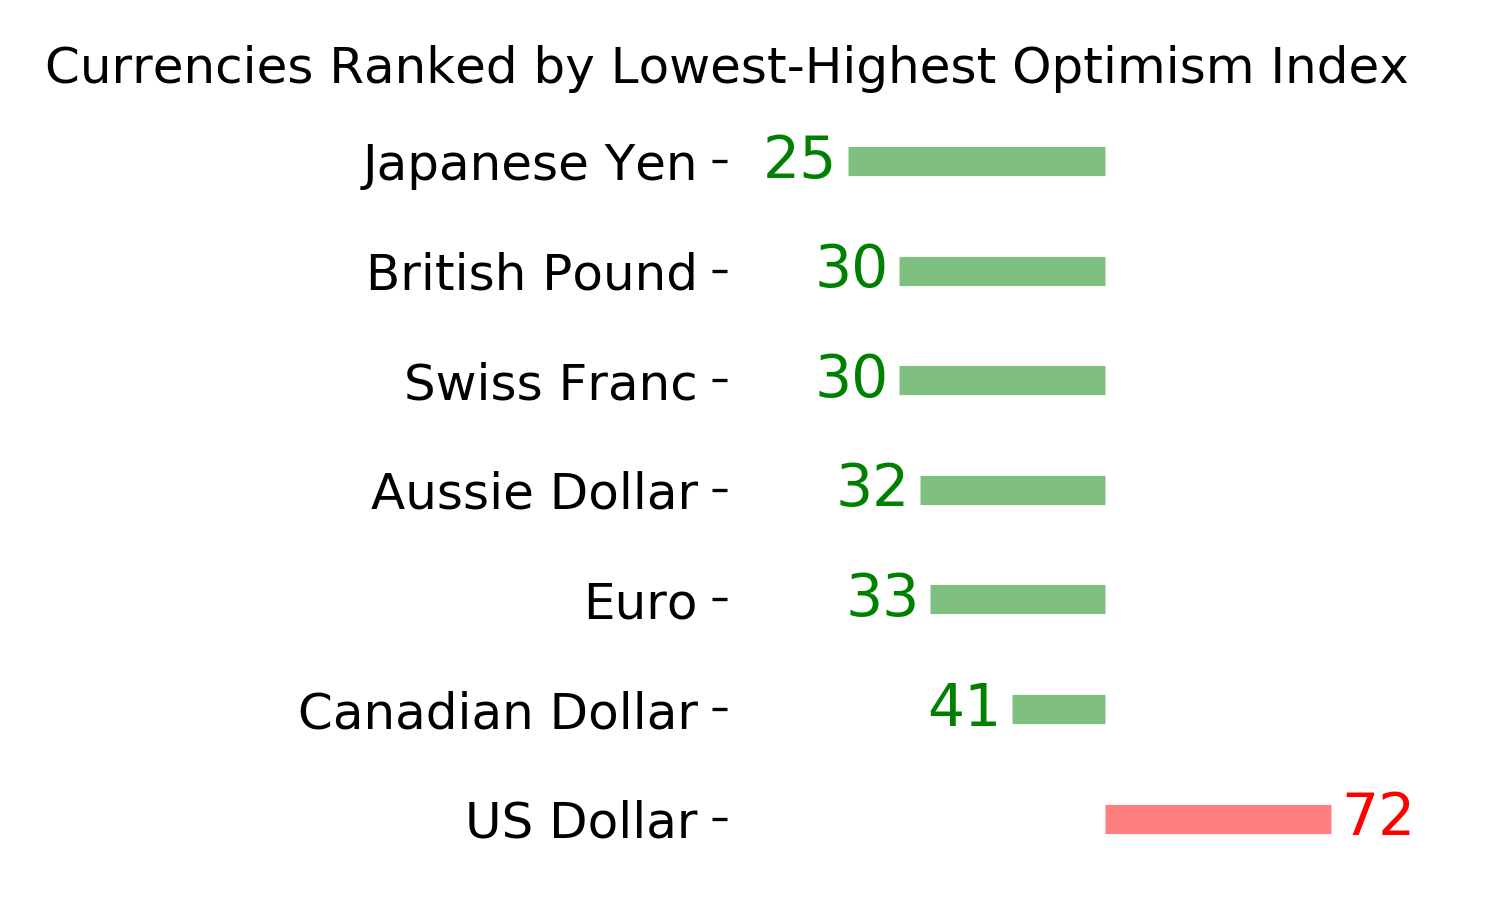
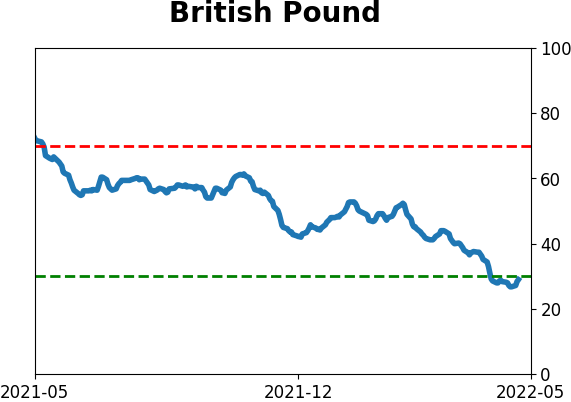
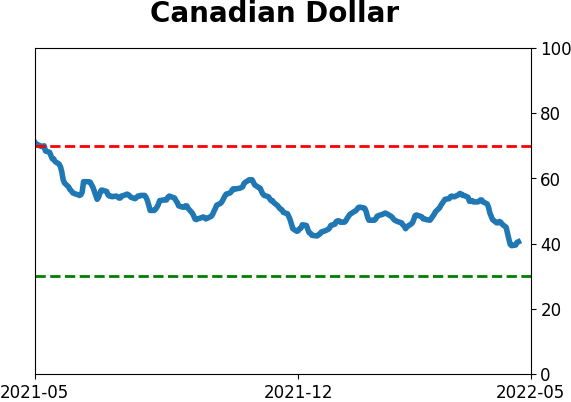
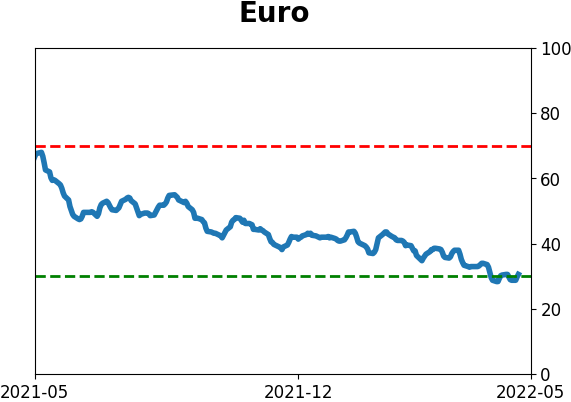
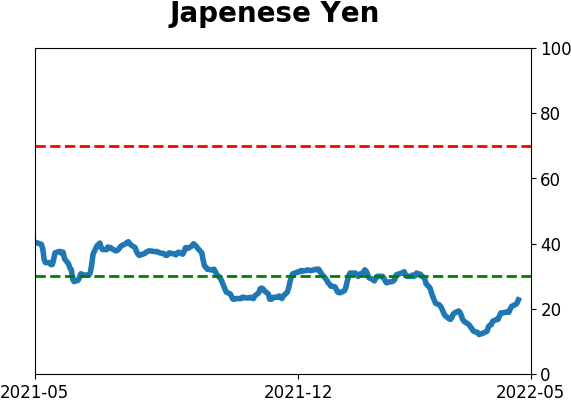
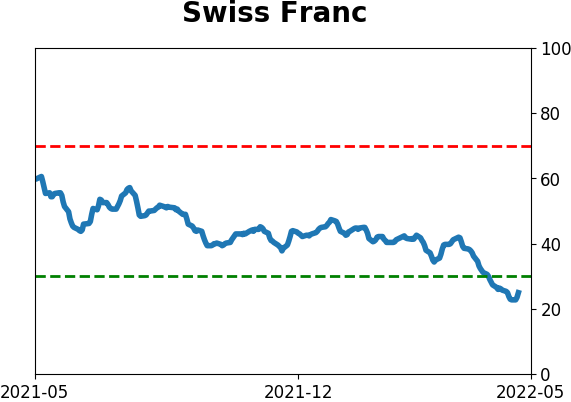
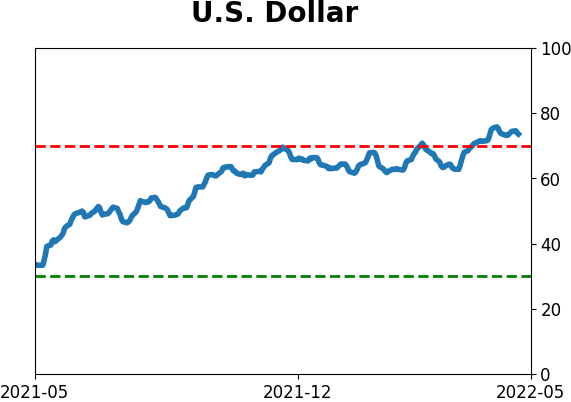
Currency ETF's - 5-Day Moving Average
|
|
|
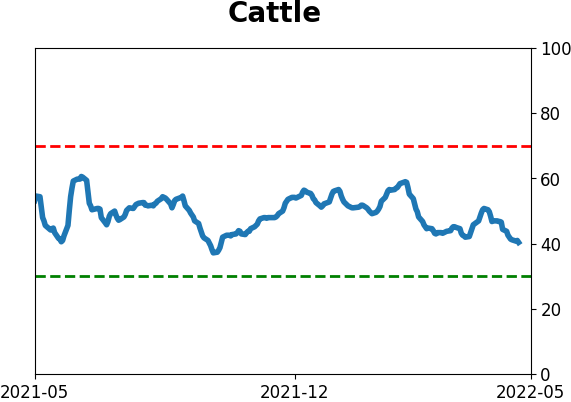
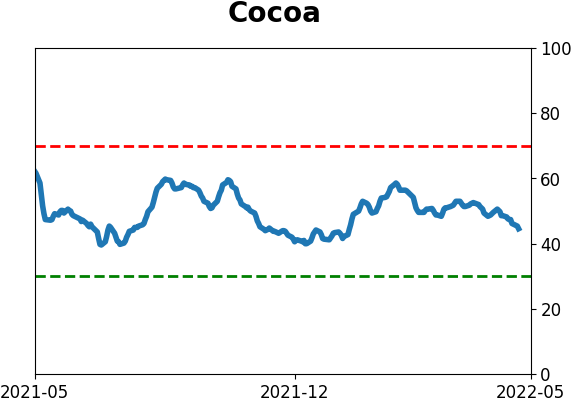
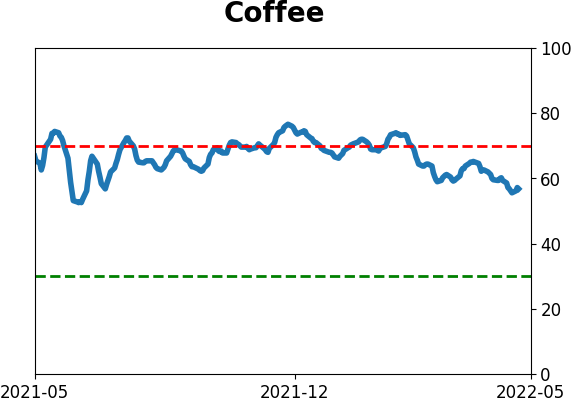
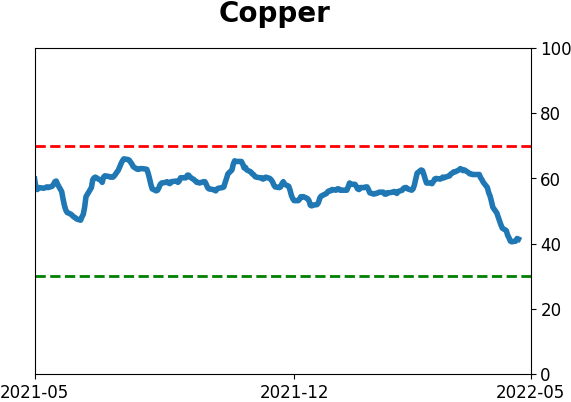
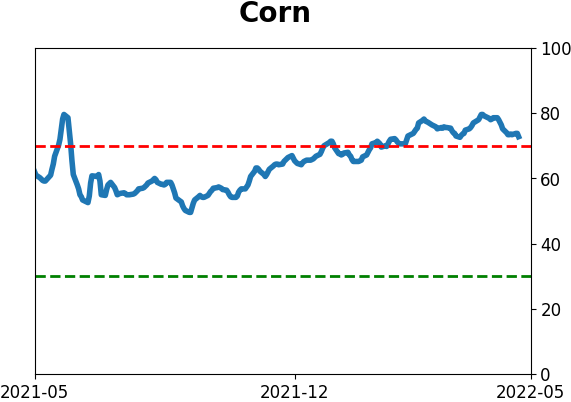
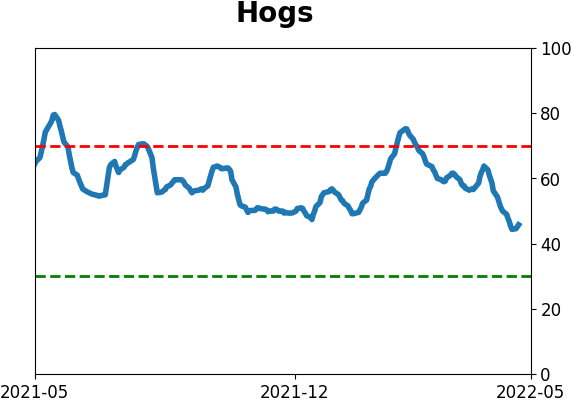
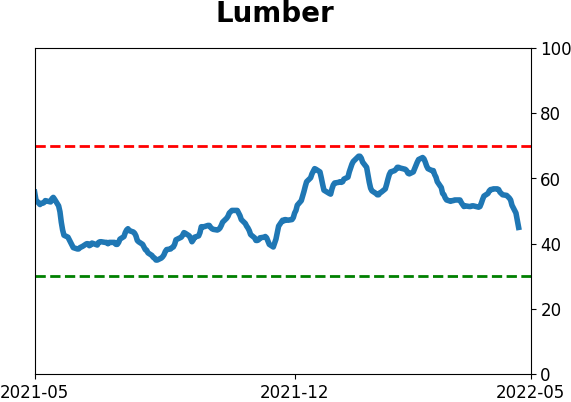
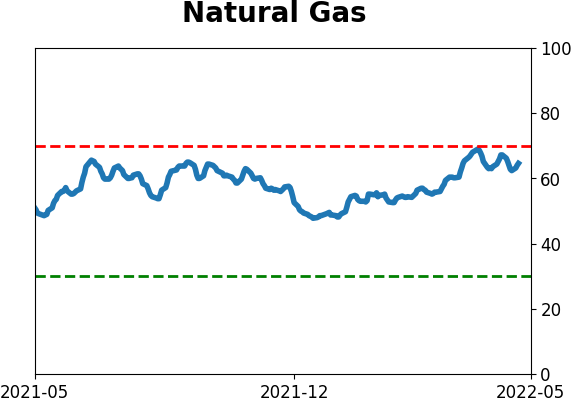
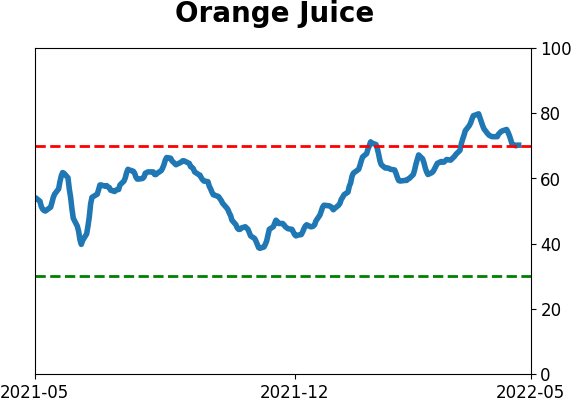
Commodity ETF's - 5-Day Moving Average
|
|