Daily Report : TradingEdge Weekly for May 17 - Major momentum, risk-on mode, defensive leaders

| View/Print a PDF version of this Report |
Headlines
|
TradingEdge Weekly for May 17 - Major momentum, risk-on mode, defensive leaders: This week, we saw that the Dow Industrials carved out a historic win streak, and that helped push investors firmly back into risk-on mode. Tech stock participation has been excellent, but it was staples and utilities that led all other sectors to new highs. Utilities are seeing some signs of being overbought, as are gold miners. |
Smart / Dumb Money Confidence
|
|
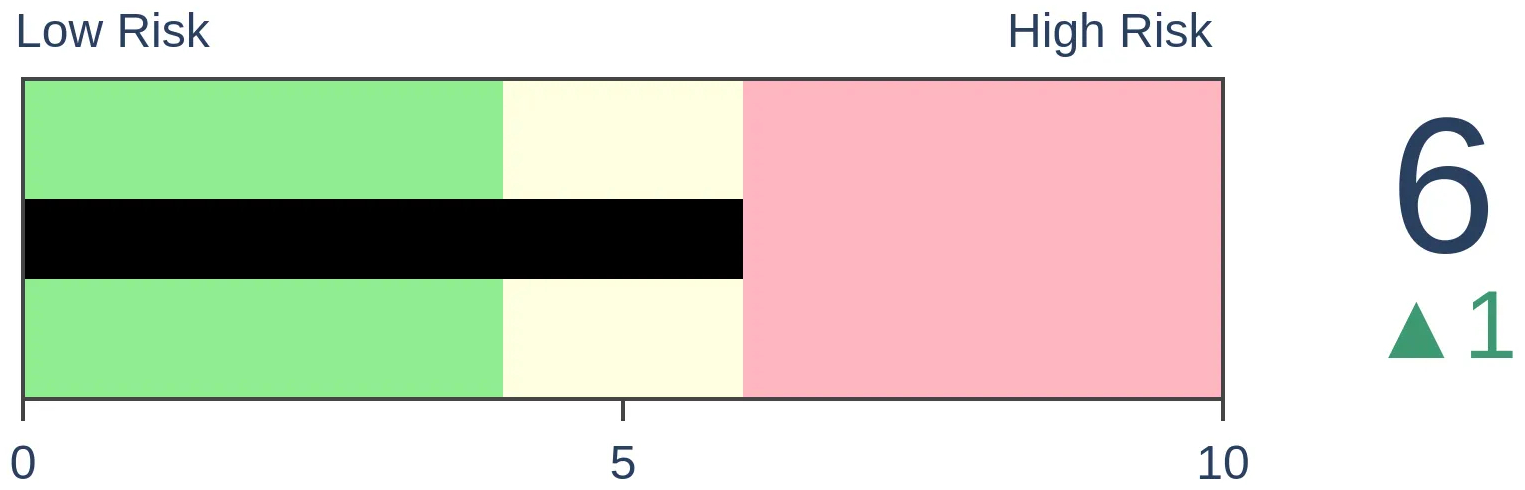
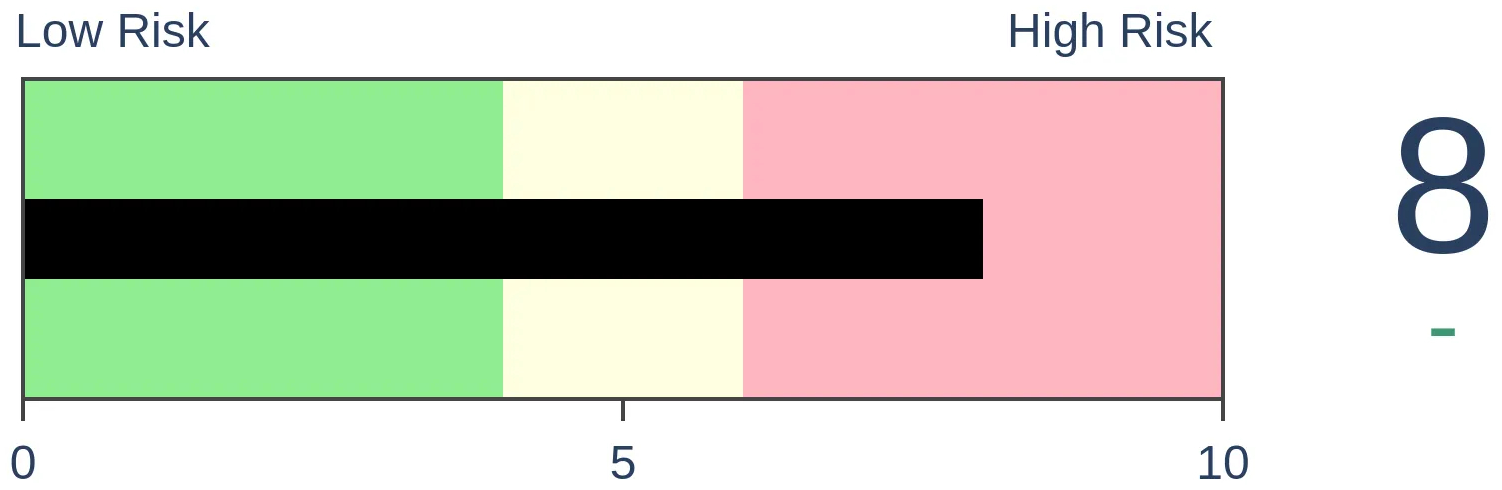
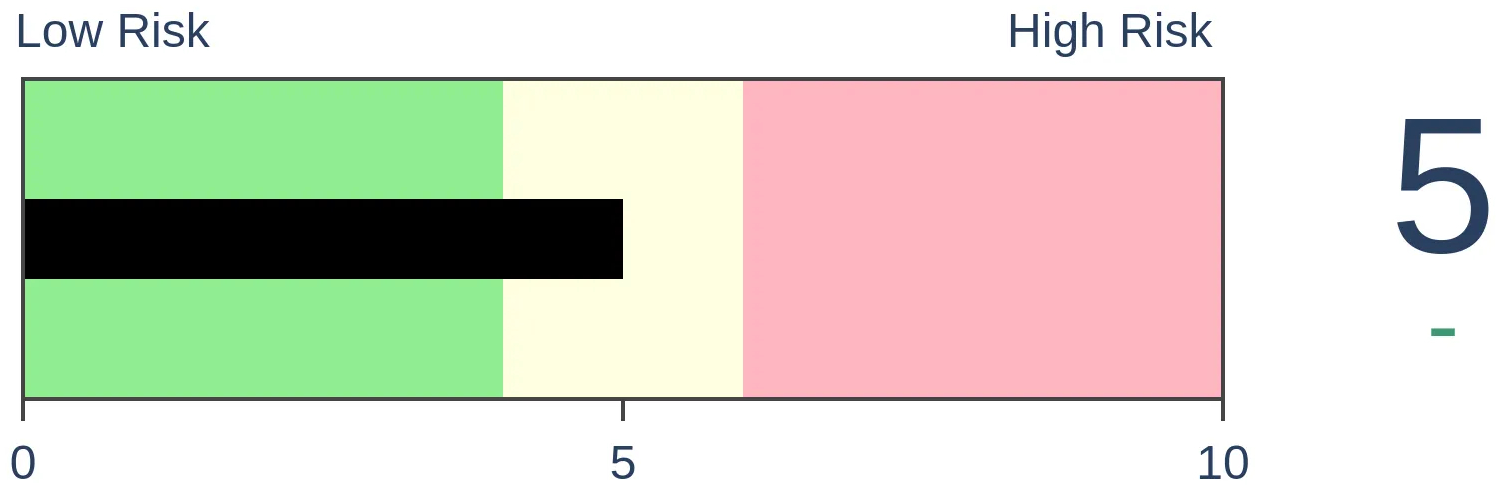
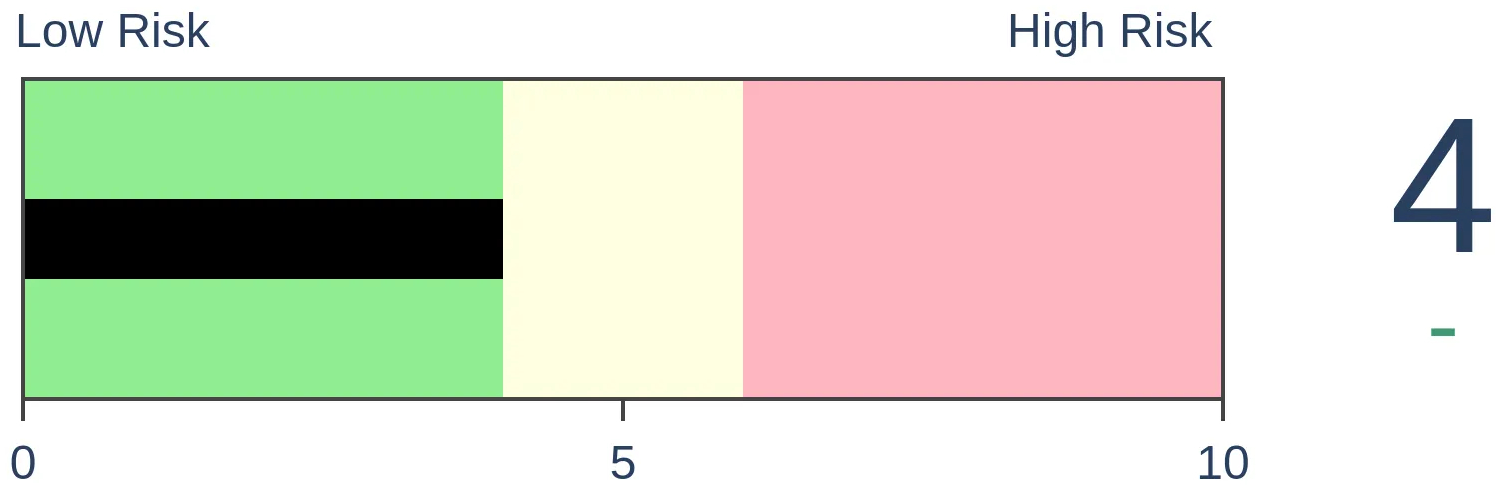
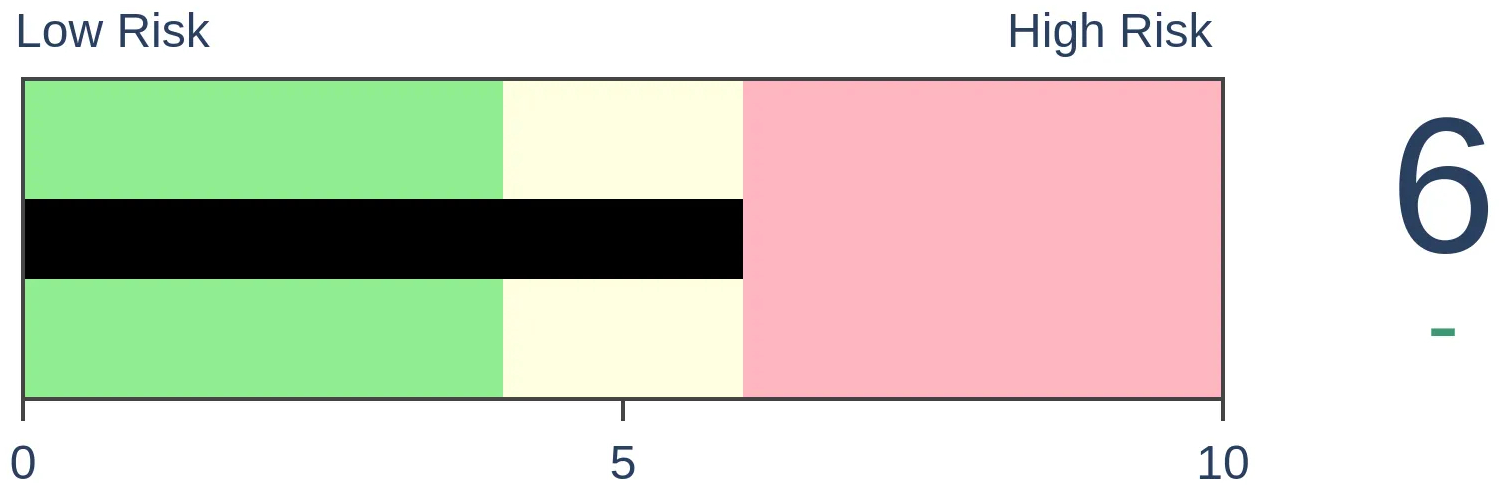
Risk Levels
|
|
|

Research
TradingEdge Weekly for May 17 - Major momentum, risk-on mode, defensive leadersBy Jason GoepfertBOTTOM LINEThis week, we saw that the Dow Industrials carved out a historic win streak, and that helped push investors firmly back into risk-on mode. Tech stock participation has been excellent, but it was staples and utilities that led all other sectors to new highs. Utilities are seeing some signs of being overbought, as are gold miners. FORECAST / TIMEFRAME |
Key points:
- The Dow has managed to carve out a historic win streak
- The S&P 500 and Nasdaq 100 have carved out an RSI reversal
- It's no surprise, then, that investors are back in risk-on mode
- Earnings growth has been impressive
- Participation among tech stocks is excellent
- Staples and utilities have led all sectors on the recent run to 52-week highs
- There are mixed signals in utilities between insiders and hot-money traders
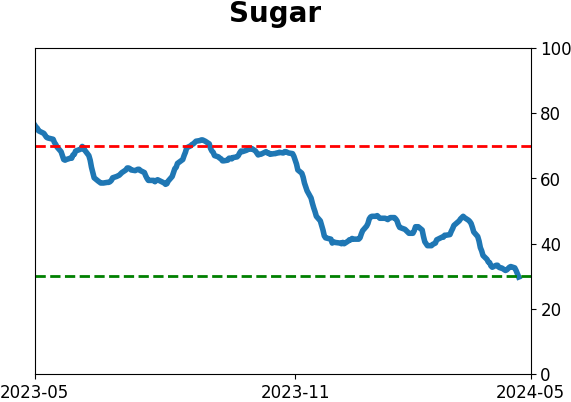
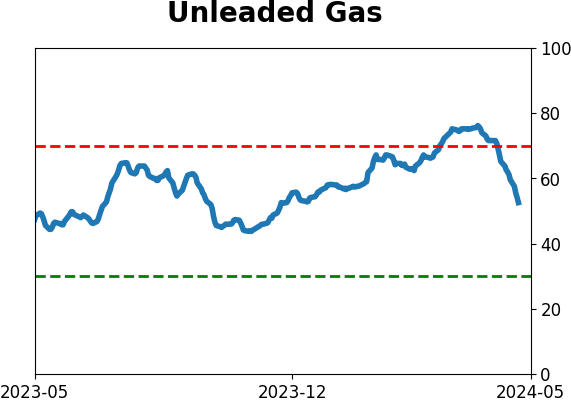
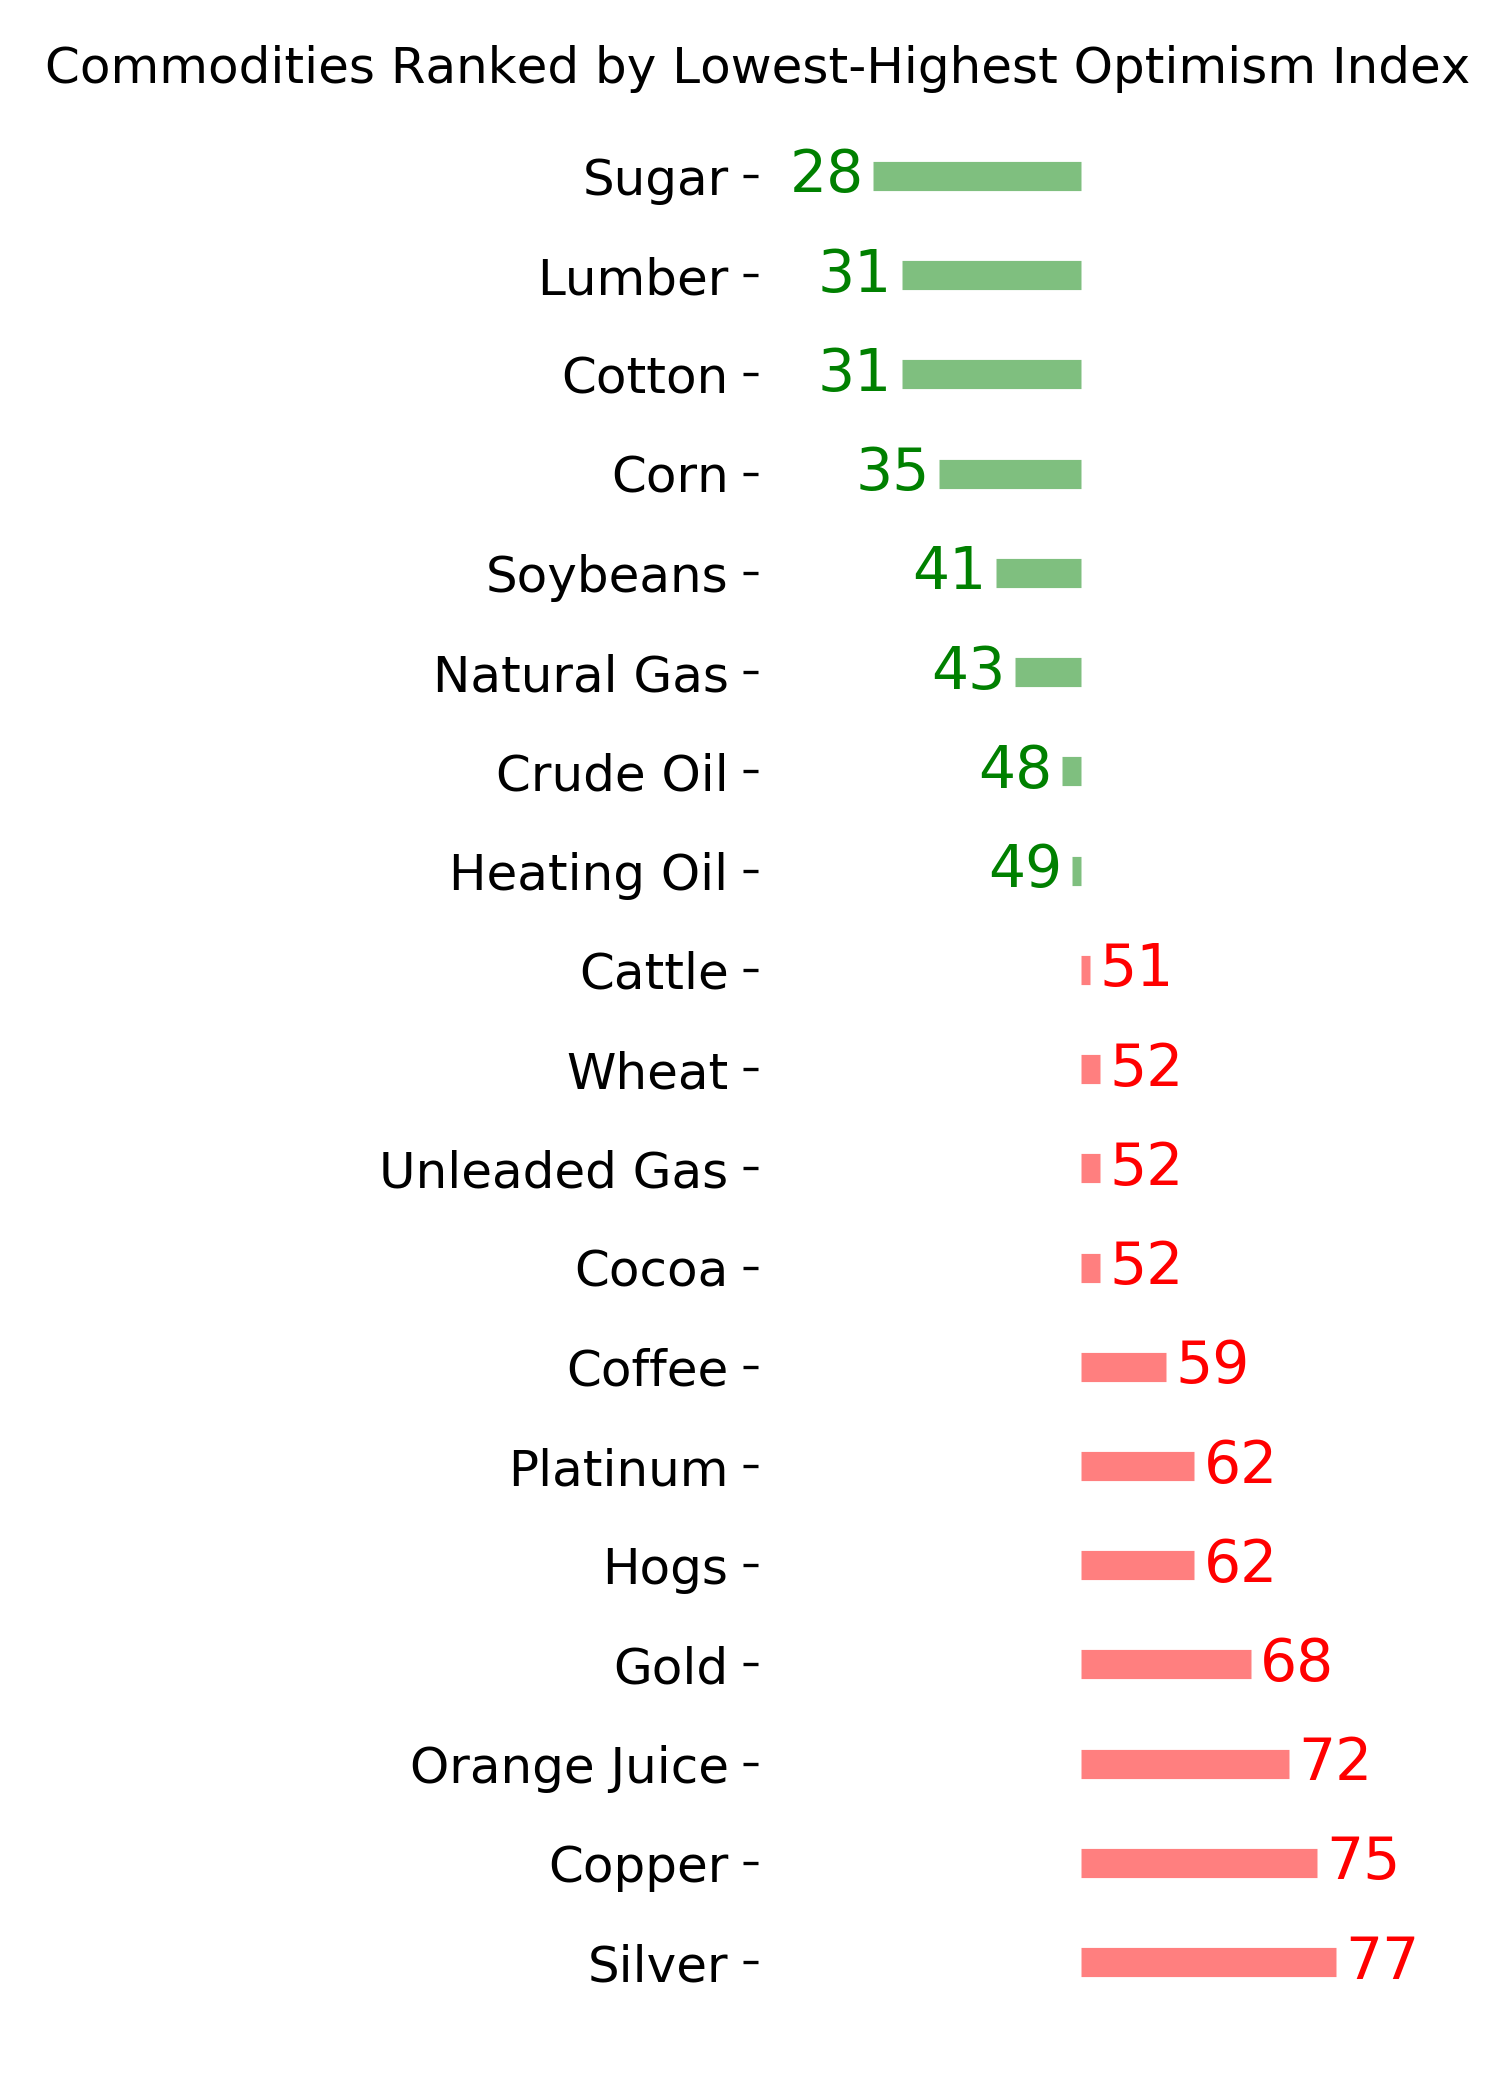
- Gold miners and natural gas are showing high optimism
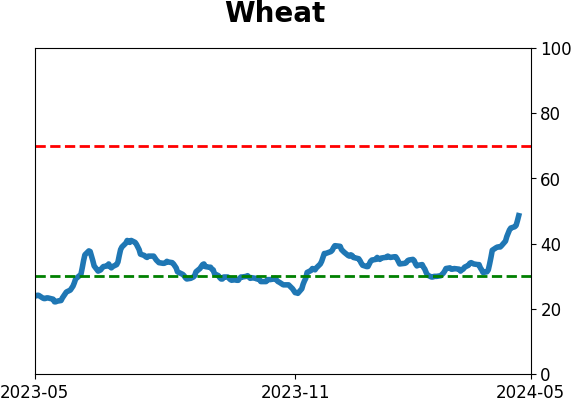
- Wheat is heading into a weak window
- Commodities, in general, are similarly heading into a weak seasonal window
The unstoppable Dow
In media terms, the most venerable equity index in the world has been "unstoppable." The Dow Jones Industrial Average logged its 8th consecutive positive day on Friday and just missed closing at a record high while it was at it.
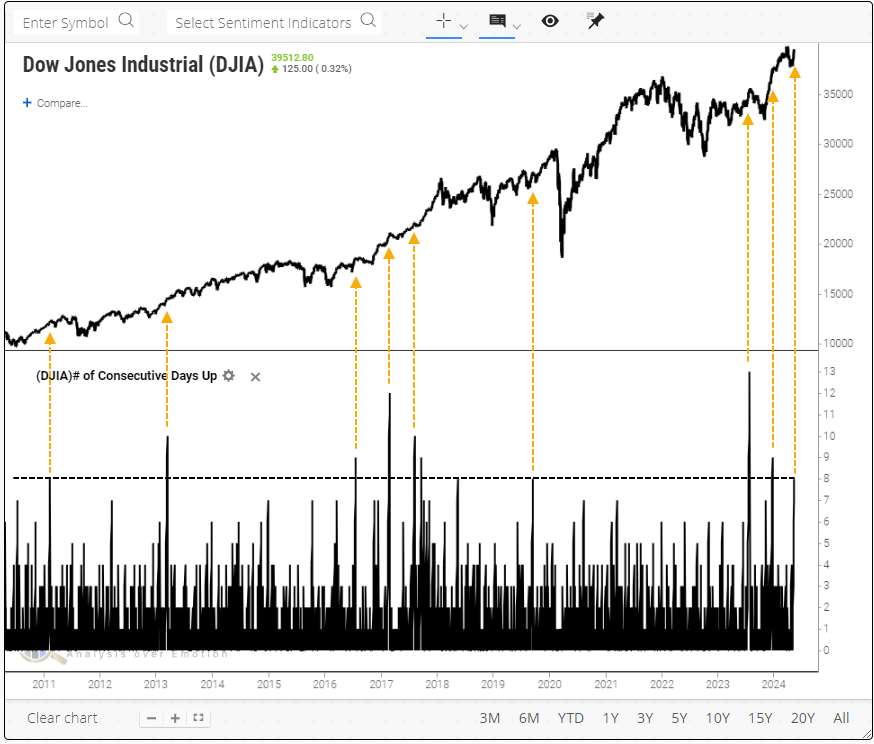
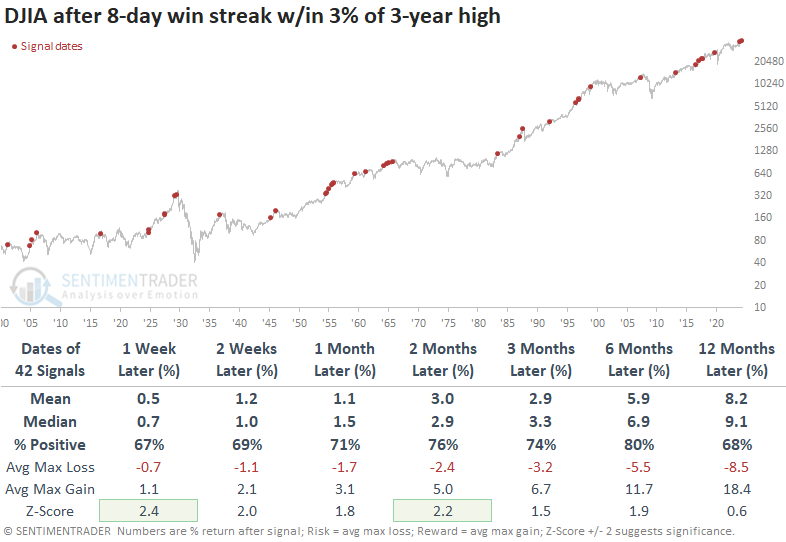
This isn't an infrequent phenomenon for an index with more than 120 years of history. Since 1900, it has enjoyed 42 streaks of 8 straight up days within 3% of a 3-year high. Most saw the Dow continuing to gain, with an 80% win rate over the next six months.
When it comes to win rates, industrials took the top spot among sector over the next six months since 1928. Over the next six months, industrials gained 91% of the time (29 out of 32 signals).
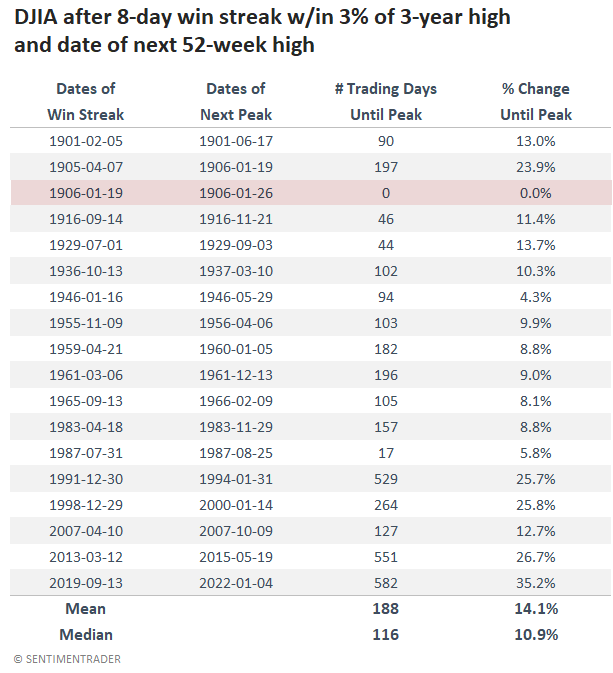
Contrarians always get nervous after a move like this. The worry is always about a blow-off top. But this has been exceedingly rare for the Dow. Out of all the signals, only one affirmed the bears' concerns. In January 1906, the 8-day win streak marked the Dow's peak for the next 52 weeks. The next worst signal was in July 1987, which preceded the peak by only 17 days and about 6%, then plunged into Black Monday that October.
On average, it took about six months before the Dow peaked after witnessing these bouts of momentum. And the index gained an average of about 11% before peaking.
Back toward overbought
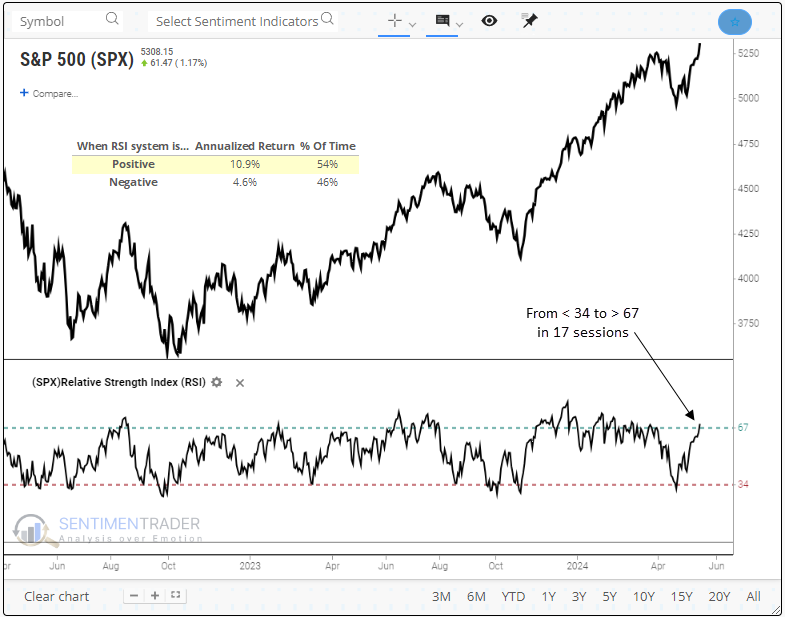
Thanks to those winning streaks in many stocks over the past couple of weeks, the Relative Strength Index for the S&P 500 cycled from less than 34 to greater than 67. Dean showed that following similar price momentum reversals, the S&P 500 and Nasdaq 100 displayed a consistent upward bias.
In researching a strategy for the RSI, Dean found that optimal results occurred by initiating a position when the indicator crossed above 67 and holding it until it fell below 34. This positive RSI trend produced an annualized return of 10.9% for the S&P 500 since 1928. Conversely, when the RSI dropped below 34 and stayed under 67, a negative trend, the S&P 500 displayed an annualized return of 4.6%.
On Wednesday, the S&P 500's RSI exceeded 67, triggering a favorable trend profile. Since 1928, there have been 149 instances of a shift from below 34 to above 67.
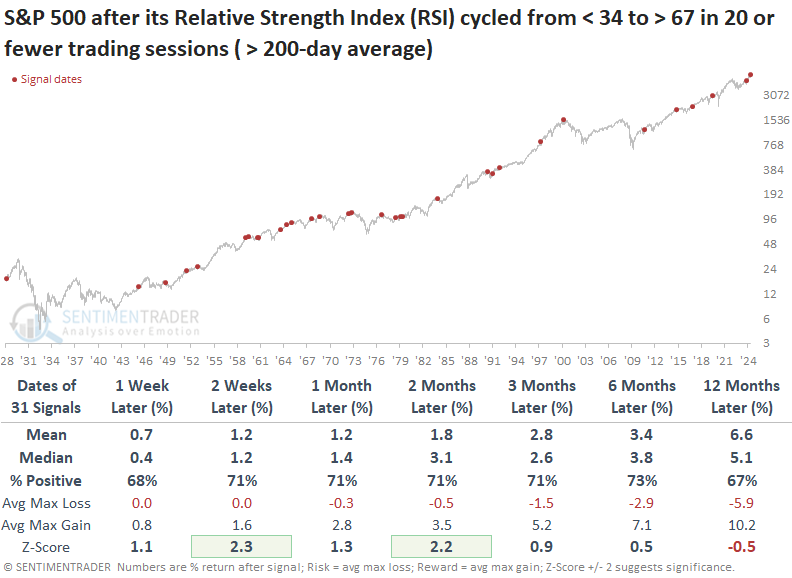
Following instances when the S&P 500's RSI reversed from below 34 to above 67 in 20 trading sessions or fewer, the world's most benchmarked index displayed a consistent upward bias over time.
When the RSI reversal occurs with the S&P 500 above its 200-day average, context similar to now, returns are slightly less favorable. However, win rates stay consistently high, and the two- and eight-week time frames continue to show significance relative to random returns.
The Nasdaq 100 also triggered a swift RSI reversal. While rare, precedents suggest the favorable price momentum will likely continue in the short term. Over the following week, the technology-oriented index was higher 92% of the time. The one-year time frame showed only one loss.
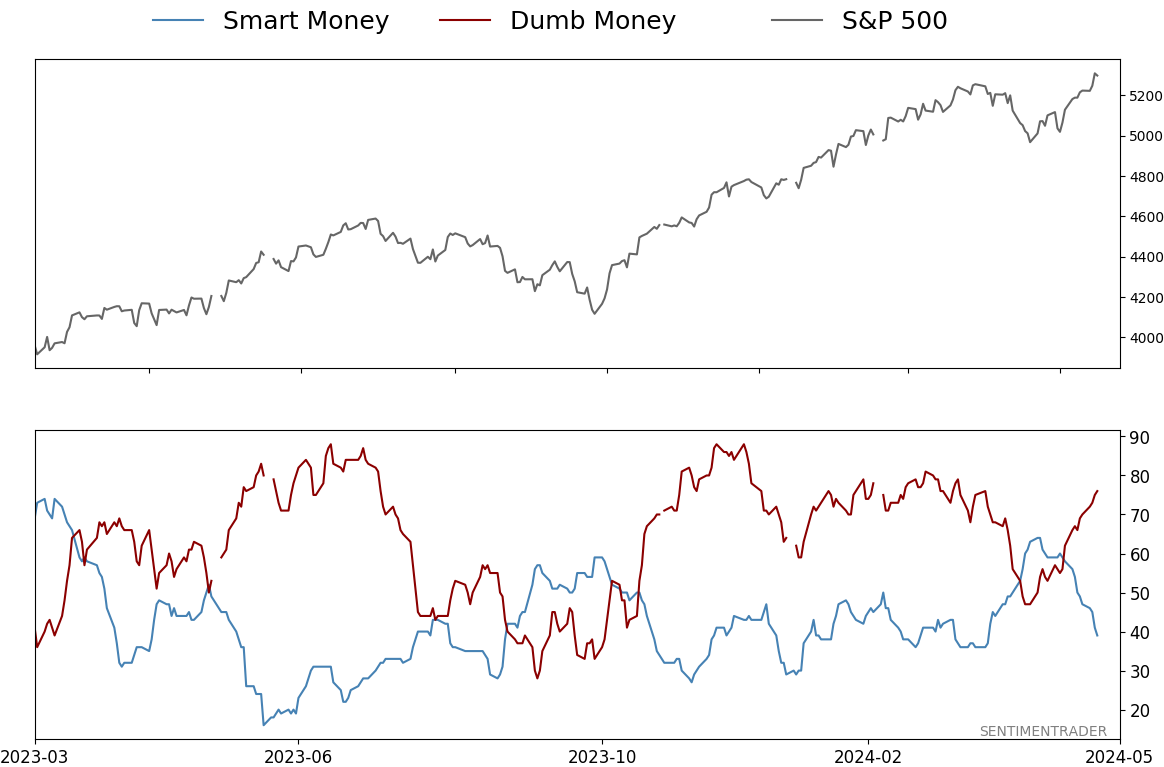
Risk is back on
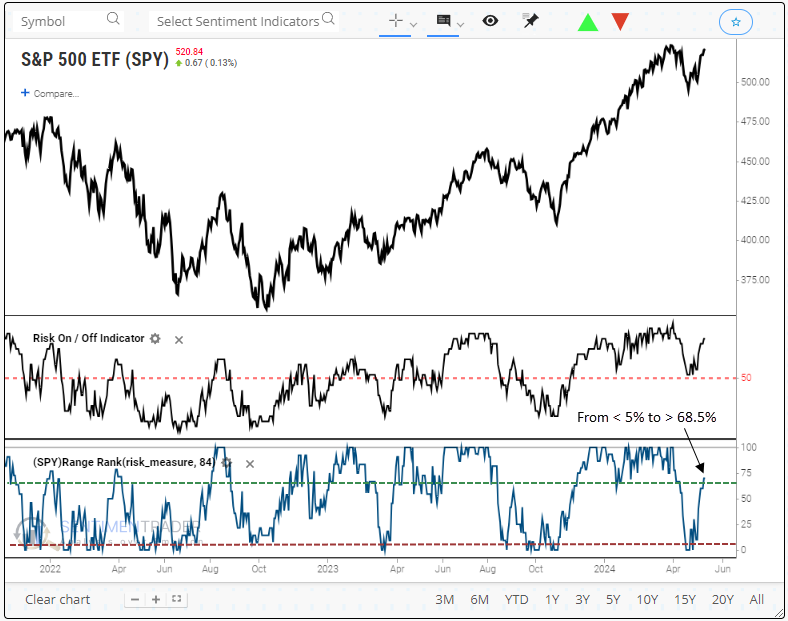
The Risk On/Off indicator surged higher relative to its recent range, prompting a new buy signal. Dean showed that similar precedents displayed outstanding returns, win rates, and significance relative to random returns.
The Risk On/Off indicator, a composite encompassing 21 diverse sentiment and breadth-based measures, offers versatility in its application. One could employ a swing trading system by applying a range rank to the indicator. In this approach, traders would establish a long position in the S&P 500 when the rank transitions from less than 5% to greater than 68.5%.
This final methodology, the swing trading approach, just triggered a new buy signal.
Following range rank reversals for the Risk On/Off indicator, the S&P 500 ETF (SPY) displayed outstanding returns and win rates across all time frames. Additionally, the swing trading methodology demonstrated statistical significance in every time horizon when contrasting signal returns against random returns over the study period.
Remarkably, between 2011 and 2017, the system demonstrated its prowess by achieving 15 consecutive winning trades over a one-month interval.
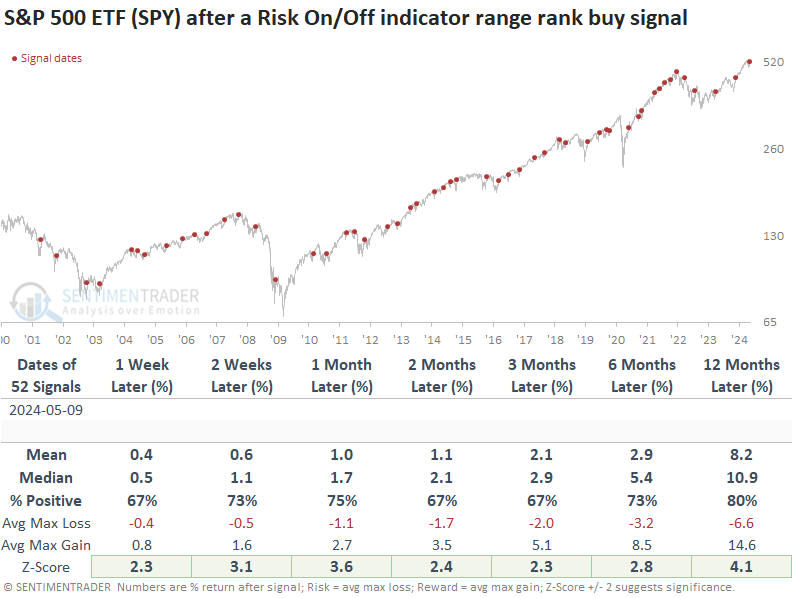
The most recent alert occurred with the S&P 500 more than 10% above its 200-day average. Despite what might appear to be an overbought condition, precedents under this context maintained excellent results. Over the subsequent month, the S&P 500 ETF (SPY) was higher every time.
Subscribers can run this (and similar) test for themselves using the new version of the backtest engine.
Earnings are growing, and that's...good?
The earnings reporting season for S&P 500 companies is about 87% complete, and the picture looks pretty healthy. According to S&P, reported earnings are on track to grow just over 10% from this quarter last year. That builds on 11% growth last quarter, the first back-to-back quarterly increases in a couple of years.
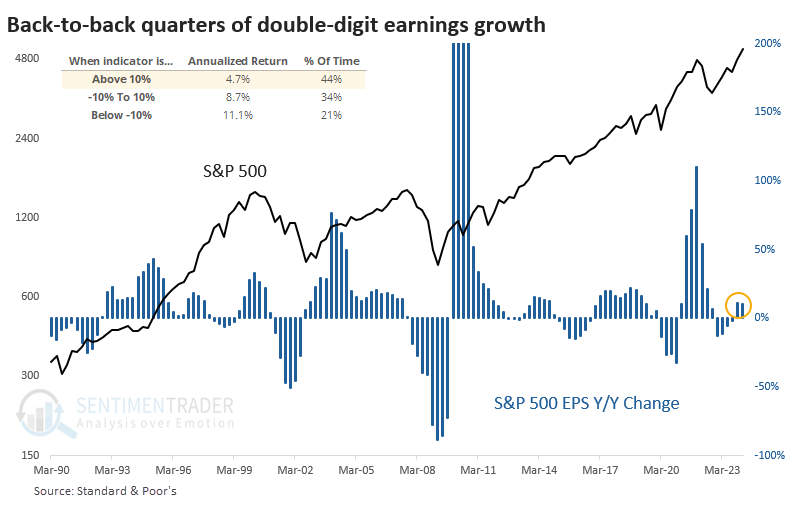
One of the cruel ironies of markets is that what's obvious is often not helpful. It should be obvious that earnings growth is good for stock prices. And double-digit growth should be even better.
That hasn't been the case, however. Since 1901, the S&P's annualized return when year-over-year quarterly earnings growth was +10% or better was only +4.7%. That was significantly below the return following average earnings growth and less than half when earnings were contracting sharply.
The table below shows how the S&P 500 performed after two consecutive quarters of earnings growth following at least two quarters of contraction. Because earnings are reported with a delay, we shifted the dates forward by 40 days from the end of the quarter to better reflect information that investors would have in real time.
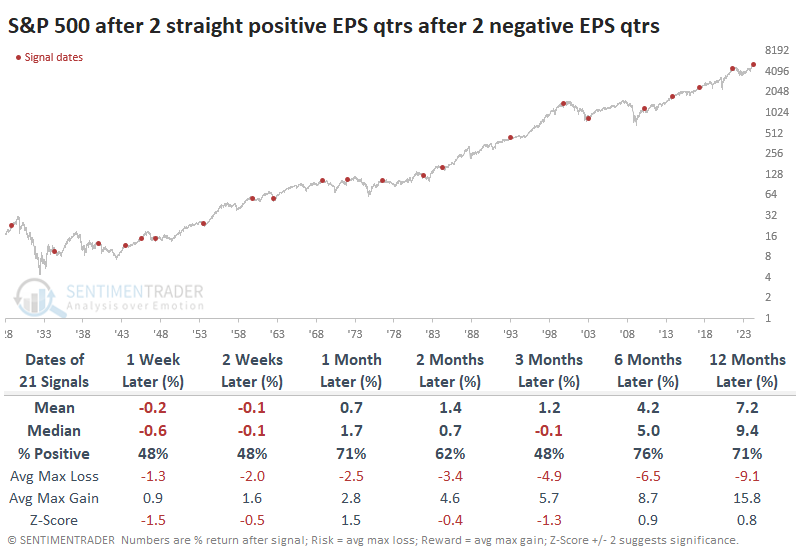
These weren't great signals for the S&P, but they were not terrible, either.
The current case is a bit more extreme than usual. Companies in the S&P 500 had suffered at least four quarters of contracting earnings and then enjoyed two quarters of double-digit growth. These was even worse for forward returns. Either two or three months later, the S&P sported a negative return each time.
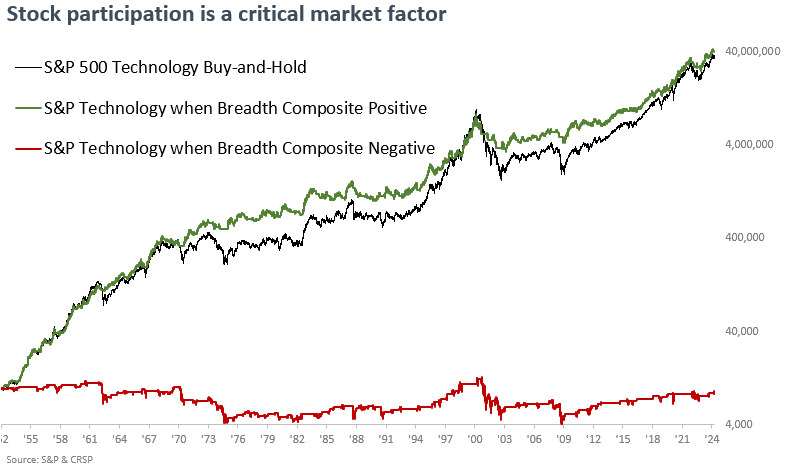
Tech participation has been excellent
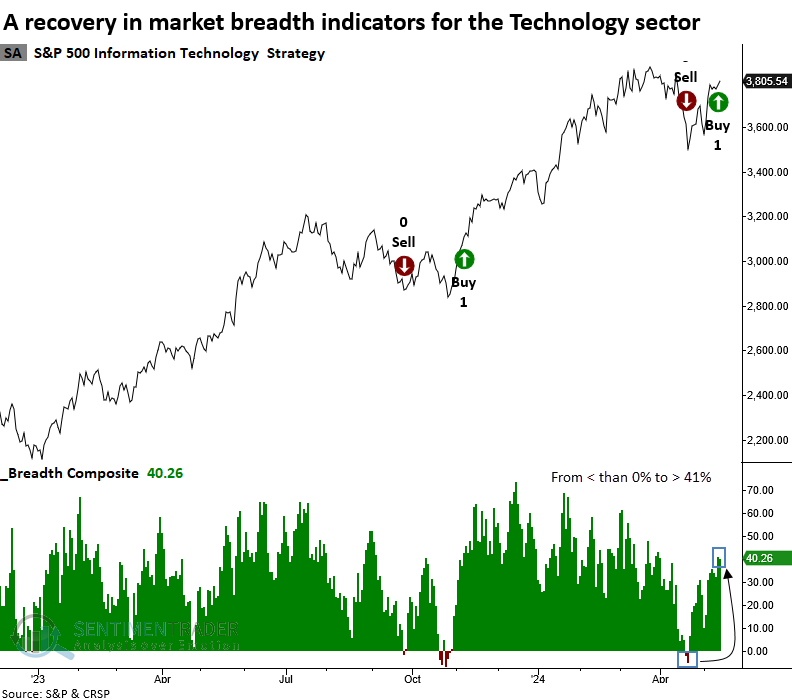
Dean noted that a breadth composite for the S&P 500 Technology sector triggered a buy signal. Comparable breadth-based alerts preceded a favorable backdrop for the sector.
At the end of last week, a breadth composite for the S&P 500 Technology sector increased above 41%, triggering a buy signal for the group. The previous trading alert occurred in November 2023, leading to an 18.7% gain over the following three months.
Following a breadth composite surge that exceeds 41%, the S&P 500 Technology sector displayed an upward bias over the following year, with several horizons showing significance relative to random returns.
Precedents that occurred with the Technology sector 5% or more above its 200-day average, context similar to now, displayed higher win rates but slightly lower returns compared to signals at any random time.
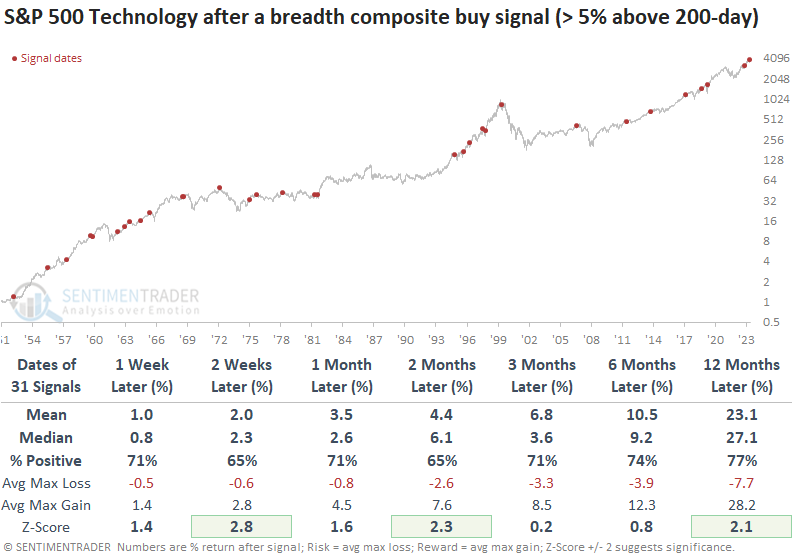
When the breadth composite strategy for the S&P 500 Technology sector maintains a positive trend, a $10,000 initial investment grows to $40,319,735, surpassing the buy-and-hold gain of $36,946,990 and significantly outperforming the periods with negative breadth, which actually result in a slight loss from the initial capital.
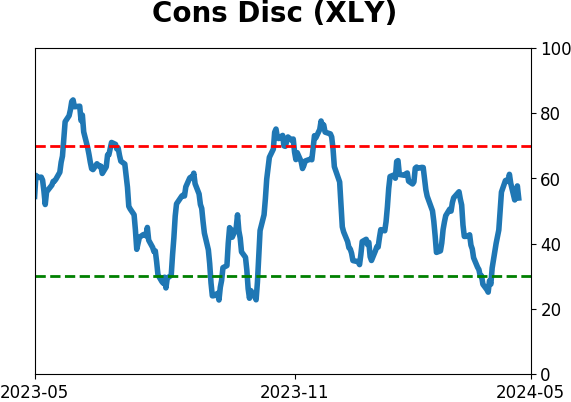
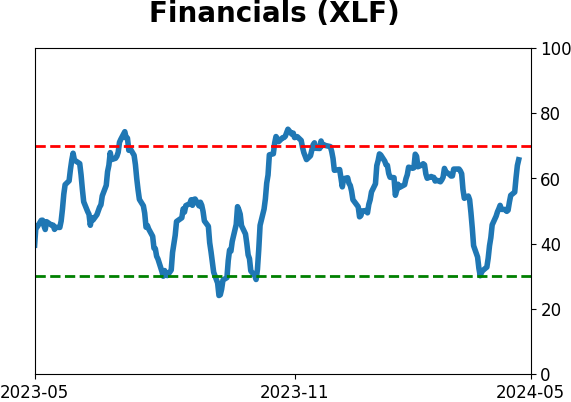
Dean monitors breadth composite signals and strategies for several indexes and sectors. Unlike Technology, the S&P 500, Financials, Industrials, and Consumer Discretionary have maintained long positions since alerts were triggered last fall. Additionally, the Nasdaq 100 remains on a sell signal from 2024-04-12.
Staples and utilities are leading the breakouts
Stocks have been recovering since the April pullback, but most indexes are still off their highs from earlier in the year. Most sectors are, too, except for two - the most defensive ones.
Both staples and utilities have recovered any losses and are the only two sectors in the past few weeks to reach at least 52-week highs.
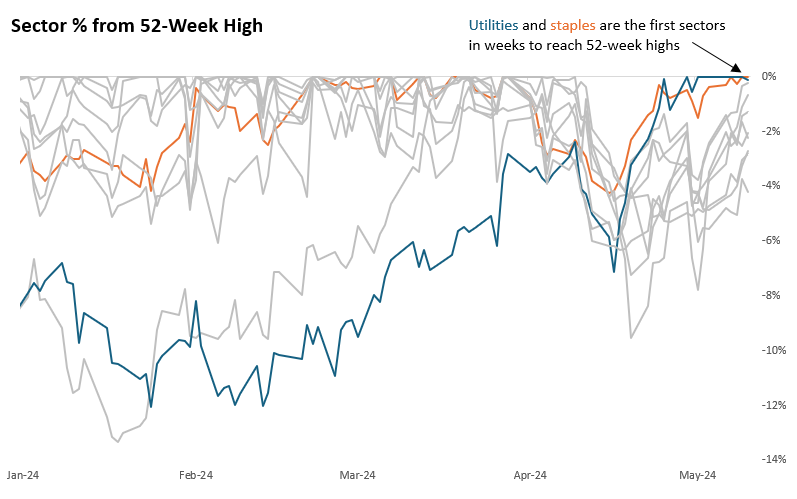
This is a worry for bulls. If the two most staid sectors lead the charge higher, this rally is not to be trusted. That's the narrative. Now, let's look at the facts.
The table below shows each time no sector reached a 52-week high for at least three weeks, then staples and utilities were the only ones that did - they were leading the charge higher. The narrative didn't have much teeth, as the S&P 500 did just fine going forward. Over the next 6-12 months, there were only two losses out of the twelve signals.
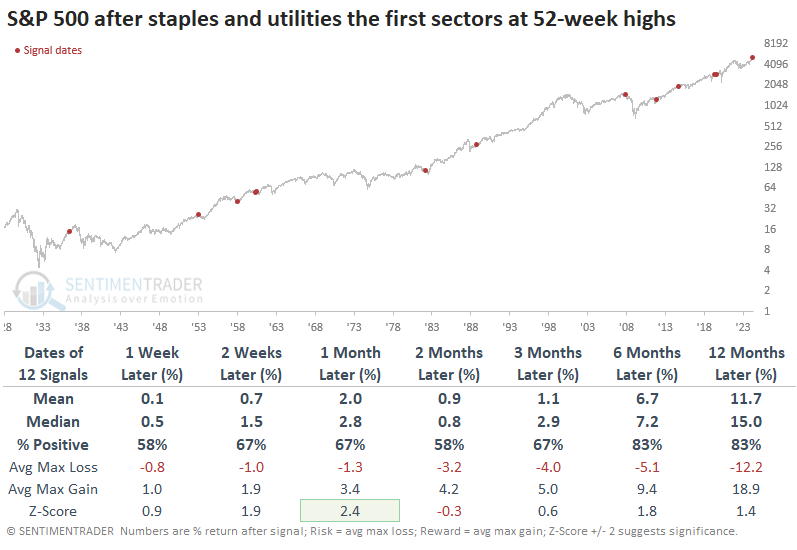
This was a pretty good sign for the sectors themselves, especially staples. That sector enjoyed gains almost every time across most time frames, with the biggest bugaboo being the global financial crisis. Even then, staples lost only -1.4% over the next six months.
Utilities also did quite well in the months ahead, but not as well as staples. There were only a couple of losses over longer time frames, though the risk/reward wasn't all that compelling. This sector has probably the worst record at holding upside momentum. There's always the chance that power demands from AI computations will change the equation for this sector, so utility bulls have to believe this time is different.
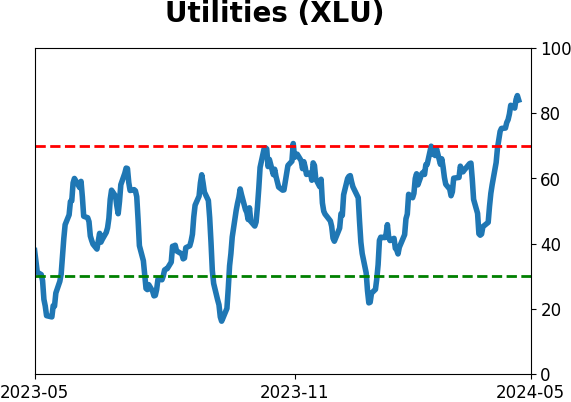
Mixed signals in utilities
Jay noted that utility stocks have enjoyed a sharp advance and strong insider buying, but an unfavorable sentiment warning sign has now flashed.
Does this rally have legs? It could. Several favorable signs began to flash last fall before the final decline to the October 2023 low. Likewise, utility industry corporate insiders went on a significant buying spree earlier this year. This type of activity tends to portend favorable industry action for one to three years.
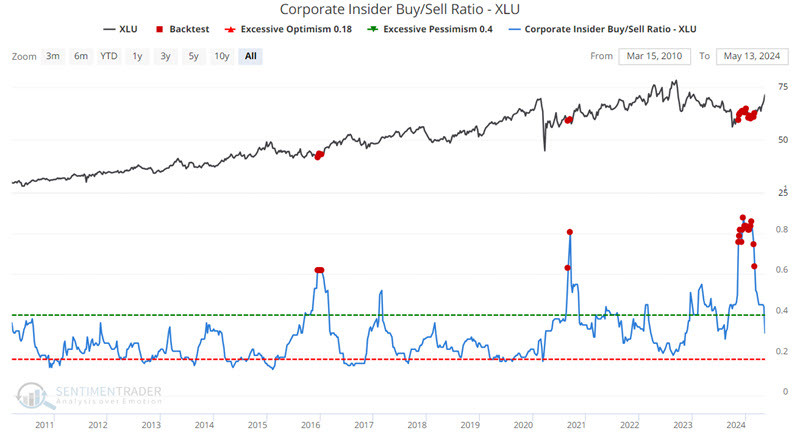
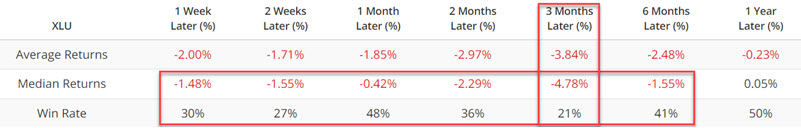
But nothing is ever easy in the markets. The chart below highlights with a red dot all dates when our XLU Optix indicator crossed above 96. This suggests rampant bullishness among investors towards the utility sector.
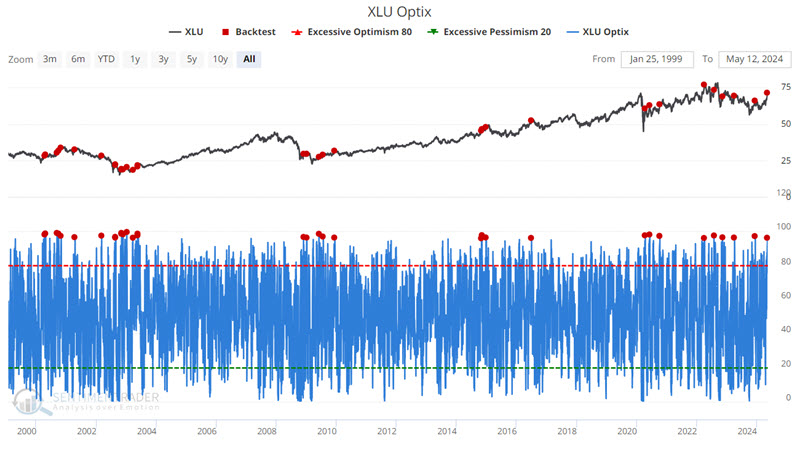

Win Rates are lower across the board, Median Returns are negative through six months, and the 3-month Win Rate is just 21%. These results suggest that current utility investors prepare for some choppiness in the months ahead and that a better buying opportunity may await those looking to enter the utility sector.
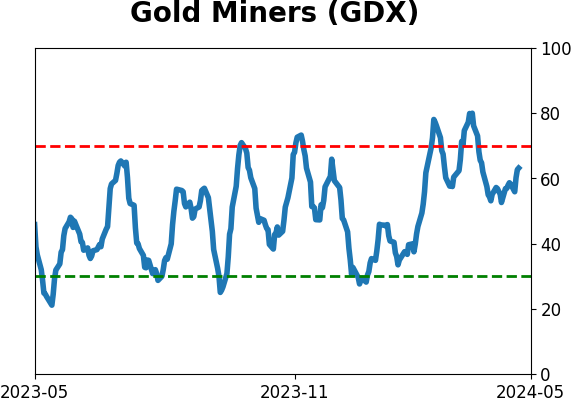
Major move in miners
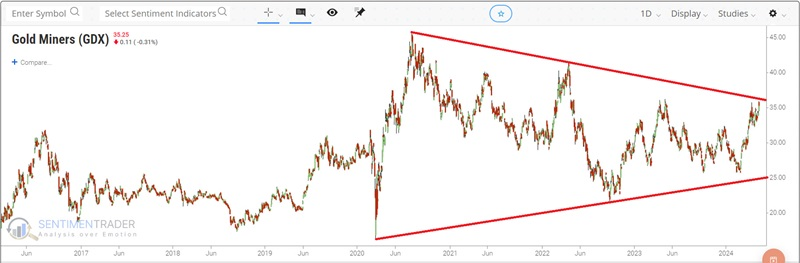
Gold miners and natural gas have enjoyed a sharp advance recently. Jay noted that a sentiment warning sign has flashed for now.
The chart below shows that the VanEck Gold Miners ETF (GDX) has also spent many years in a trading range. Recently, it has attempted to follow Gold's lead and stage a rally. Theoretically, a breakout above the upper red line in the chart below would confirm a new uptrend in gold mining stocks.
In the meantime, the recent rally has finally drawn out the gold stock bulls. The chart below highlights with a red dot all dates when the 50-day average of our GDX Optix indicator was above 60 while GDX was above its 150-day moving average.
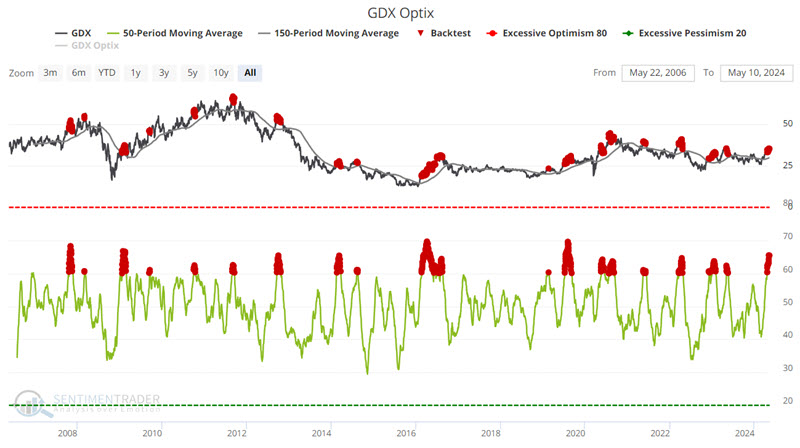
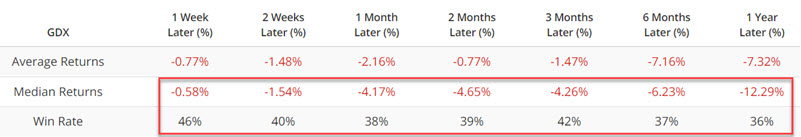
Win Rates and Median Returns are lower across the board. The latest cluster of red dots may not be a reason to panic. However, it does suggest that investors prepare for some choppiness in the months ahead and that a better buying opportunity may await those looking to enter the gold miners sector.
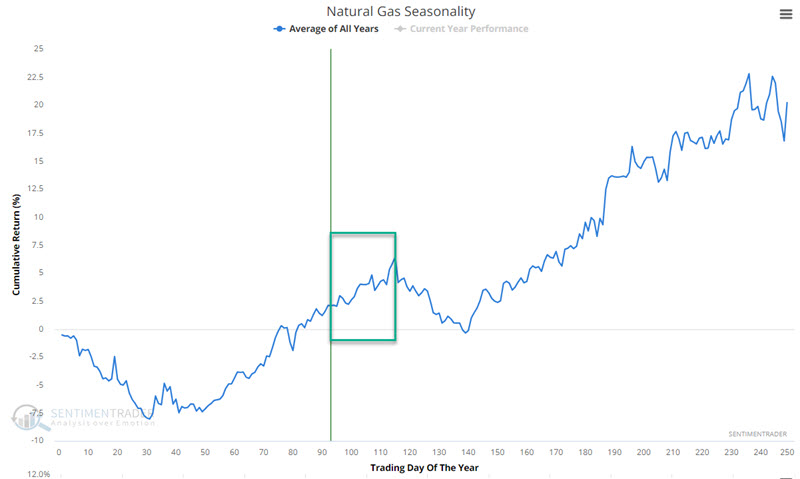
Mixed gas
Natural gas futures have attempted to put in a multiple bottom in recent months and have enjoyed a sharp rally in the last week and a half. In the annual seasonal chart below, we see that natural gas still has some time left during a favorable seasonal period, which extends through 2024-06-12.
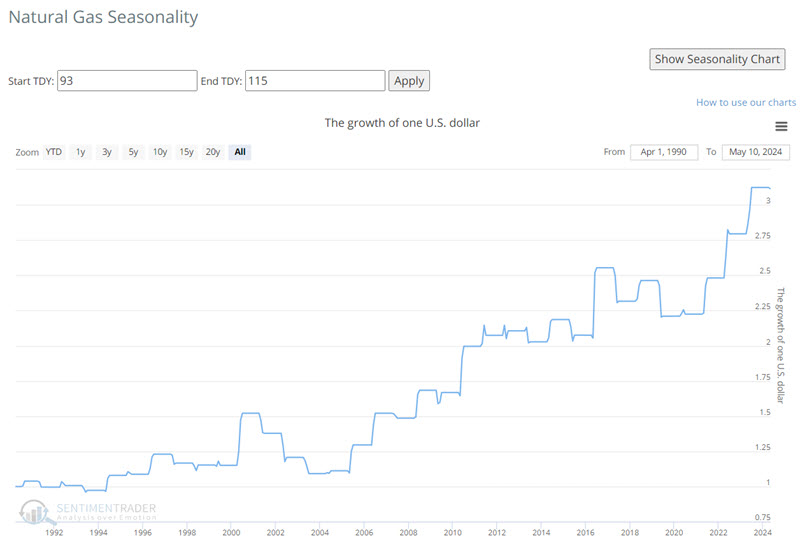
The chart below displays the hypothetical growth of $1 in natural gas (based on percentage price changes, not actual futures contract values) if held long from Trading Day of Year (TDY) #93 through TDY #115 every year. While results can vary widely from year to year, the long-term rising trend is unmistakable.
So, does the latest short natural gas rally have legs? Possibly, yes. But there is a reason to be wary. The chart below uses natural gas futures and highlights with a red dot those dates when our UNG Optix indicator (The United States Natural Gas LP ETF is ticker UNG) has crossed above 95.

Note the significantly negative Median Returns and unfavorable Win Rates across the board - particularly over three months and one year.
Very recent price action and seasonality suggest that natural gas could continue to trend higher in the interim. But the results directly above suggest that traders be nimble, use tight trailing stops on any long positions, and look for opportunities to play the short side.
Weak wheat window
Wheat has enjoyed a sharp runup in recent months, but Jay noted seasonality suggests being cautious.
After a long decline, wheat bottomed out in March and rallied roughly $8,000 in contract value into mid-May. Combined with being technically overbought, wheat is about to enter one of its weakest seasonal periods of the year. Given the highly cyclical nature of the agricultural markets, it may be wise not to ignore this.
The chart below displays the annual seasonal trend for wheat futures, with the price action for 2024 so far represented by the red line.
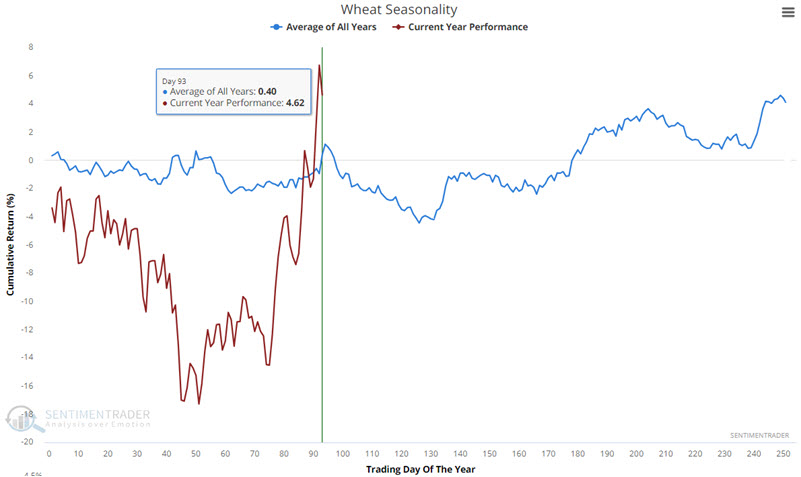
Note the period about to unfold, which extends from the close of Trading Day of the Year (TDY) #94 and extends through TDY #126. For 2024, this period extends from the close on 2024-05-15 through 2024-07-02.
The chart below displays the hypothetical cumulative $ gain or loss from holding a long position in wheat futures only during these seasonal windows every year starting in 1937.
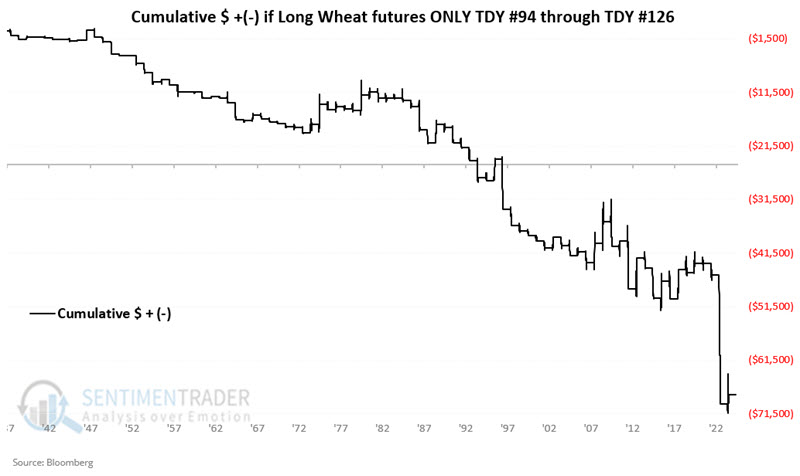
Wheat rallied during these windows only 28% of the time. While its average gain was actually larger than its average loss, it tended to suffer periodic very large losses.
The weak window for commodities in general
Jay further noted that there is no reason to fight the current uptrend in commodities. However, given the strongly cyclical nature of commodities, seasonality suggests being cautious in the near term.
Commodities are trying to establish a new uptrend
As he noted in previous research, it is reasonable to expect commodities as an asset class to be a top performer in the years ahead. The trend must be considered favorable as long as broad commodity indexes hold above their 200-day moving averages.
But there are reasons to be wary in the near term. The chart below displays the annual seasonal trend for the Bloomberg Commodity Index, with the brown line representing the price action for 2024 so far.
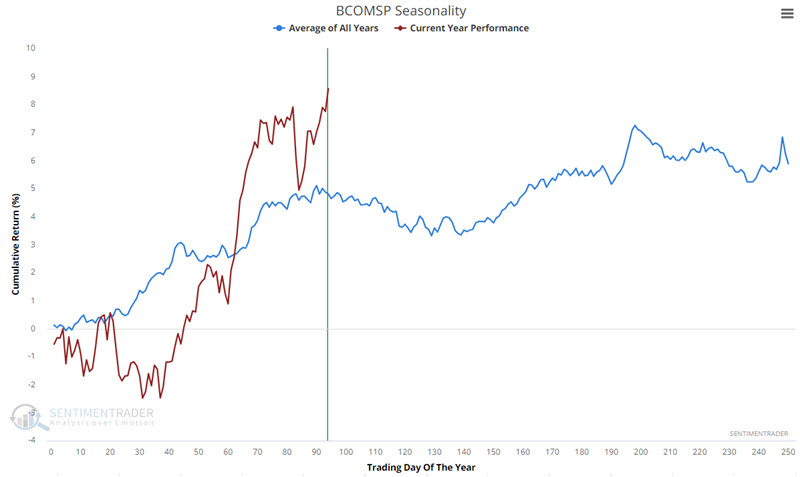
There is a looming period of weakness, which extends from the close of Trading Day of the Year (TDY) #90 through TDY #122. For 2024, this period extends from the close on 2024-05-09 through 2024-06-26. The chart below displays the hypothetical growth of $ 1 holding a long position in the Bloomberg Commodity Index only during these windows every year starting in 1960.
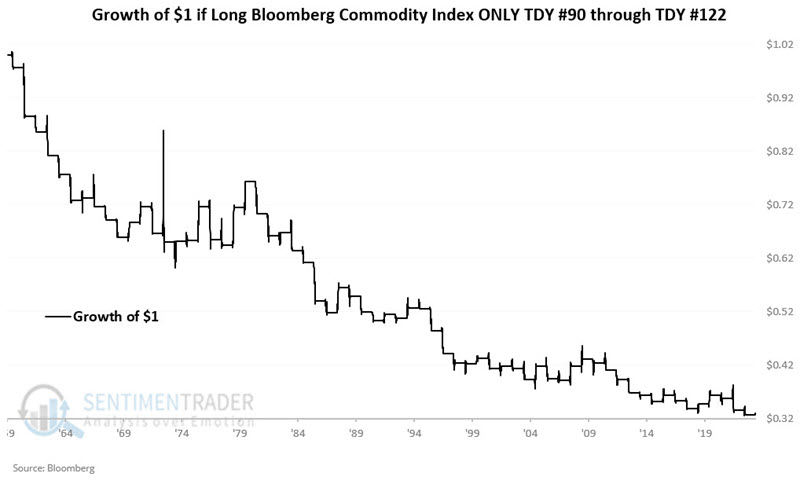
The commodity index showed a gain only 31% of the time during these windows, and suffered a -10% or greater loss twice as often as a +10% gain.
About TradingEdge Weekly...
The goal of TradingEdge Weekly is to summarize some of the research published to SentimenTrader over the past week. Sometimes there is a lot to digest, and this summary highlights the highest conviction or most compelling ideas we discussed. This is NOT the published research; rather, it pulls out some of the most relevant parts. It includes links to the published research for convenience, and if you don't subscribe to those products, it will present the options for access.
Indicators at Extremes
|
|
|
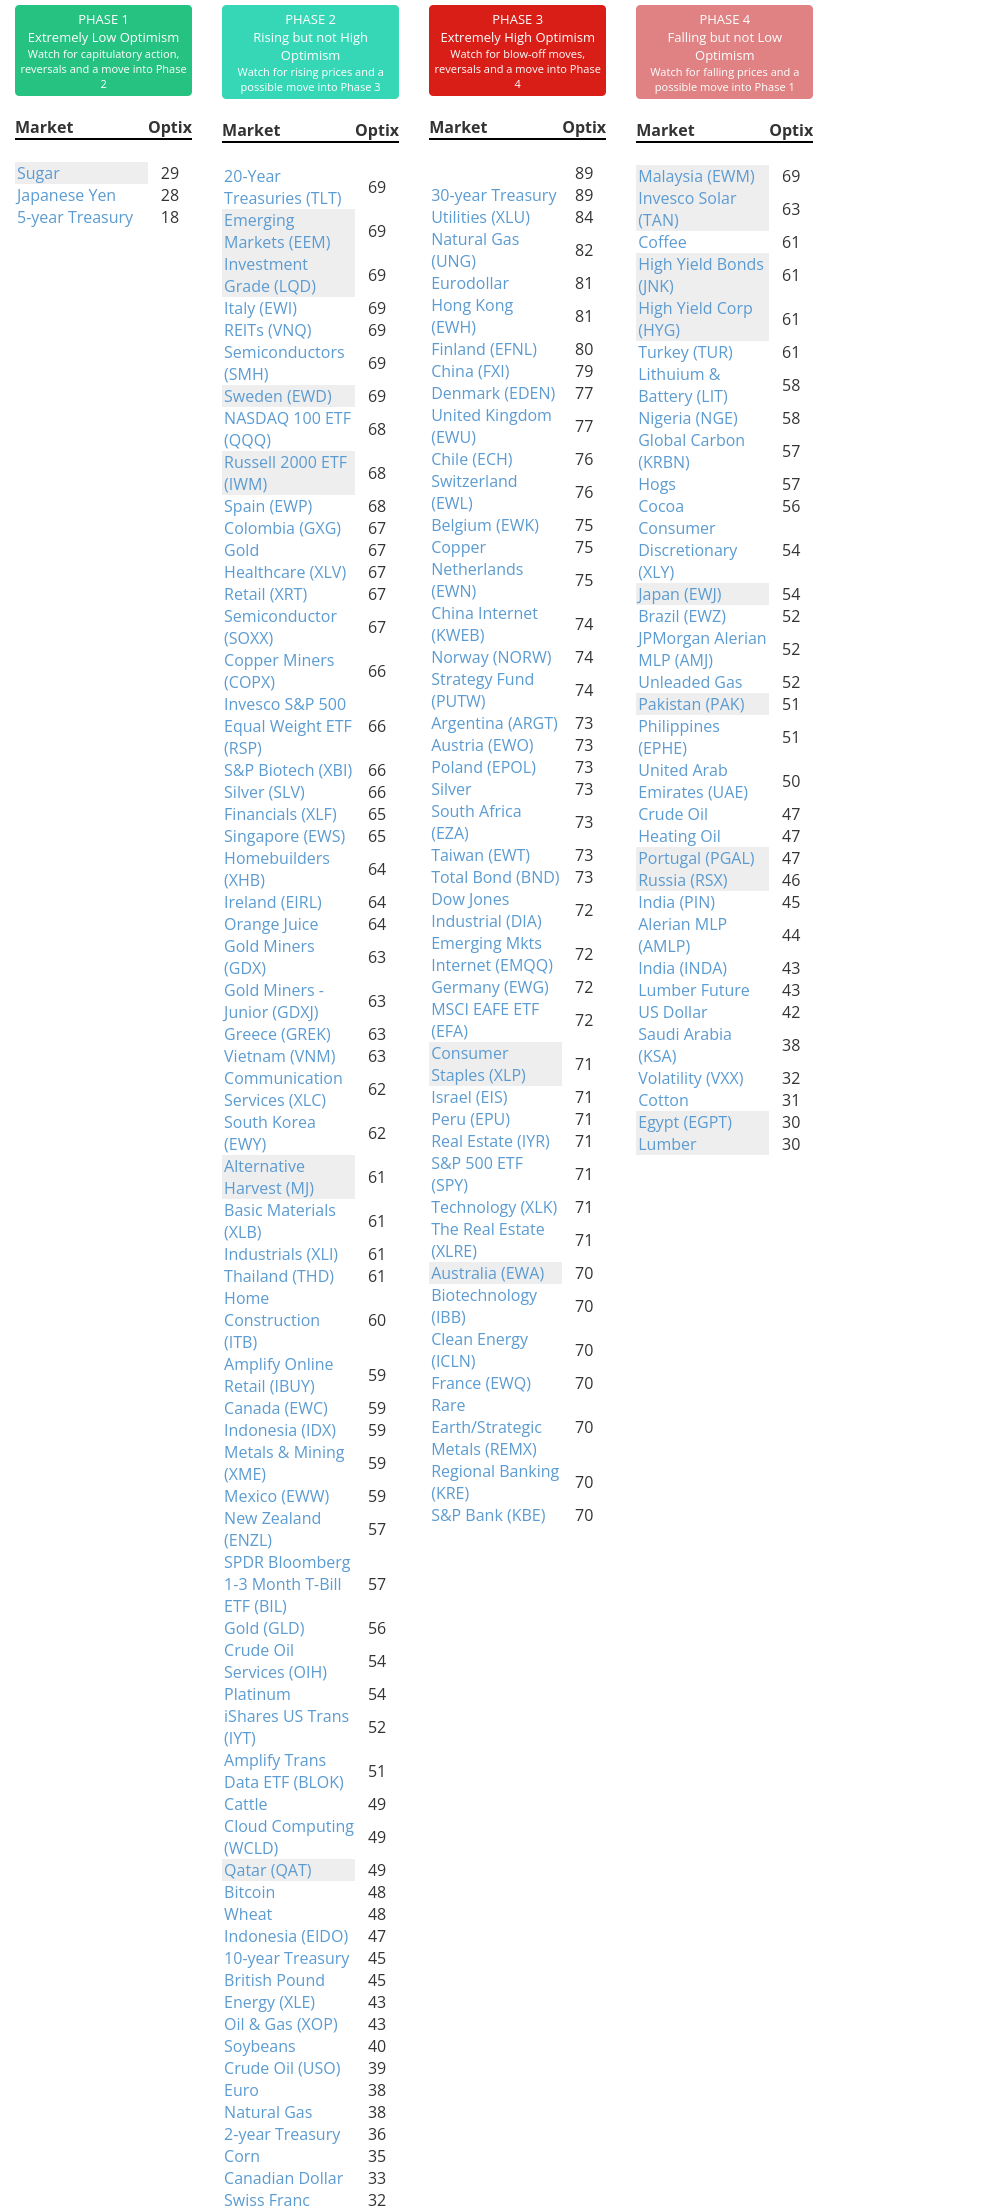
Phase Table
|
|
|
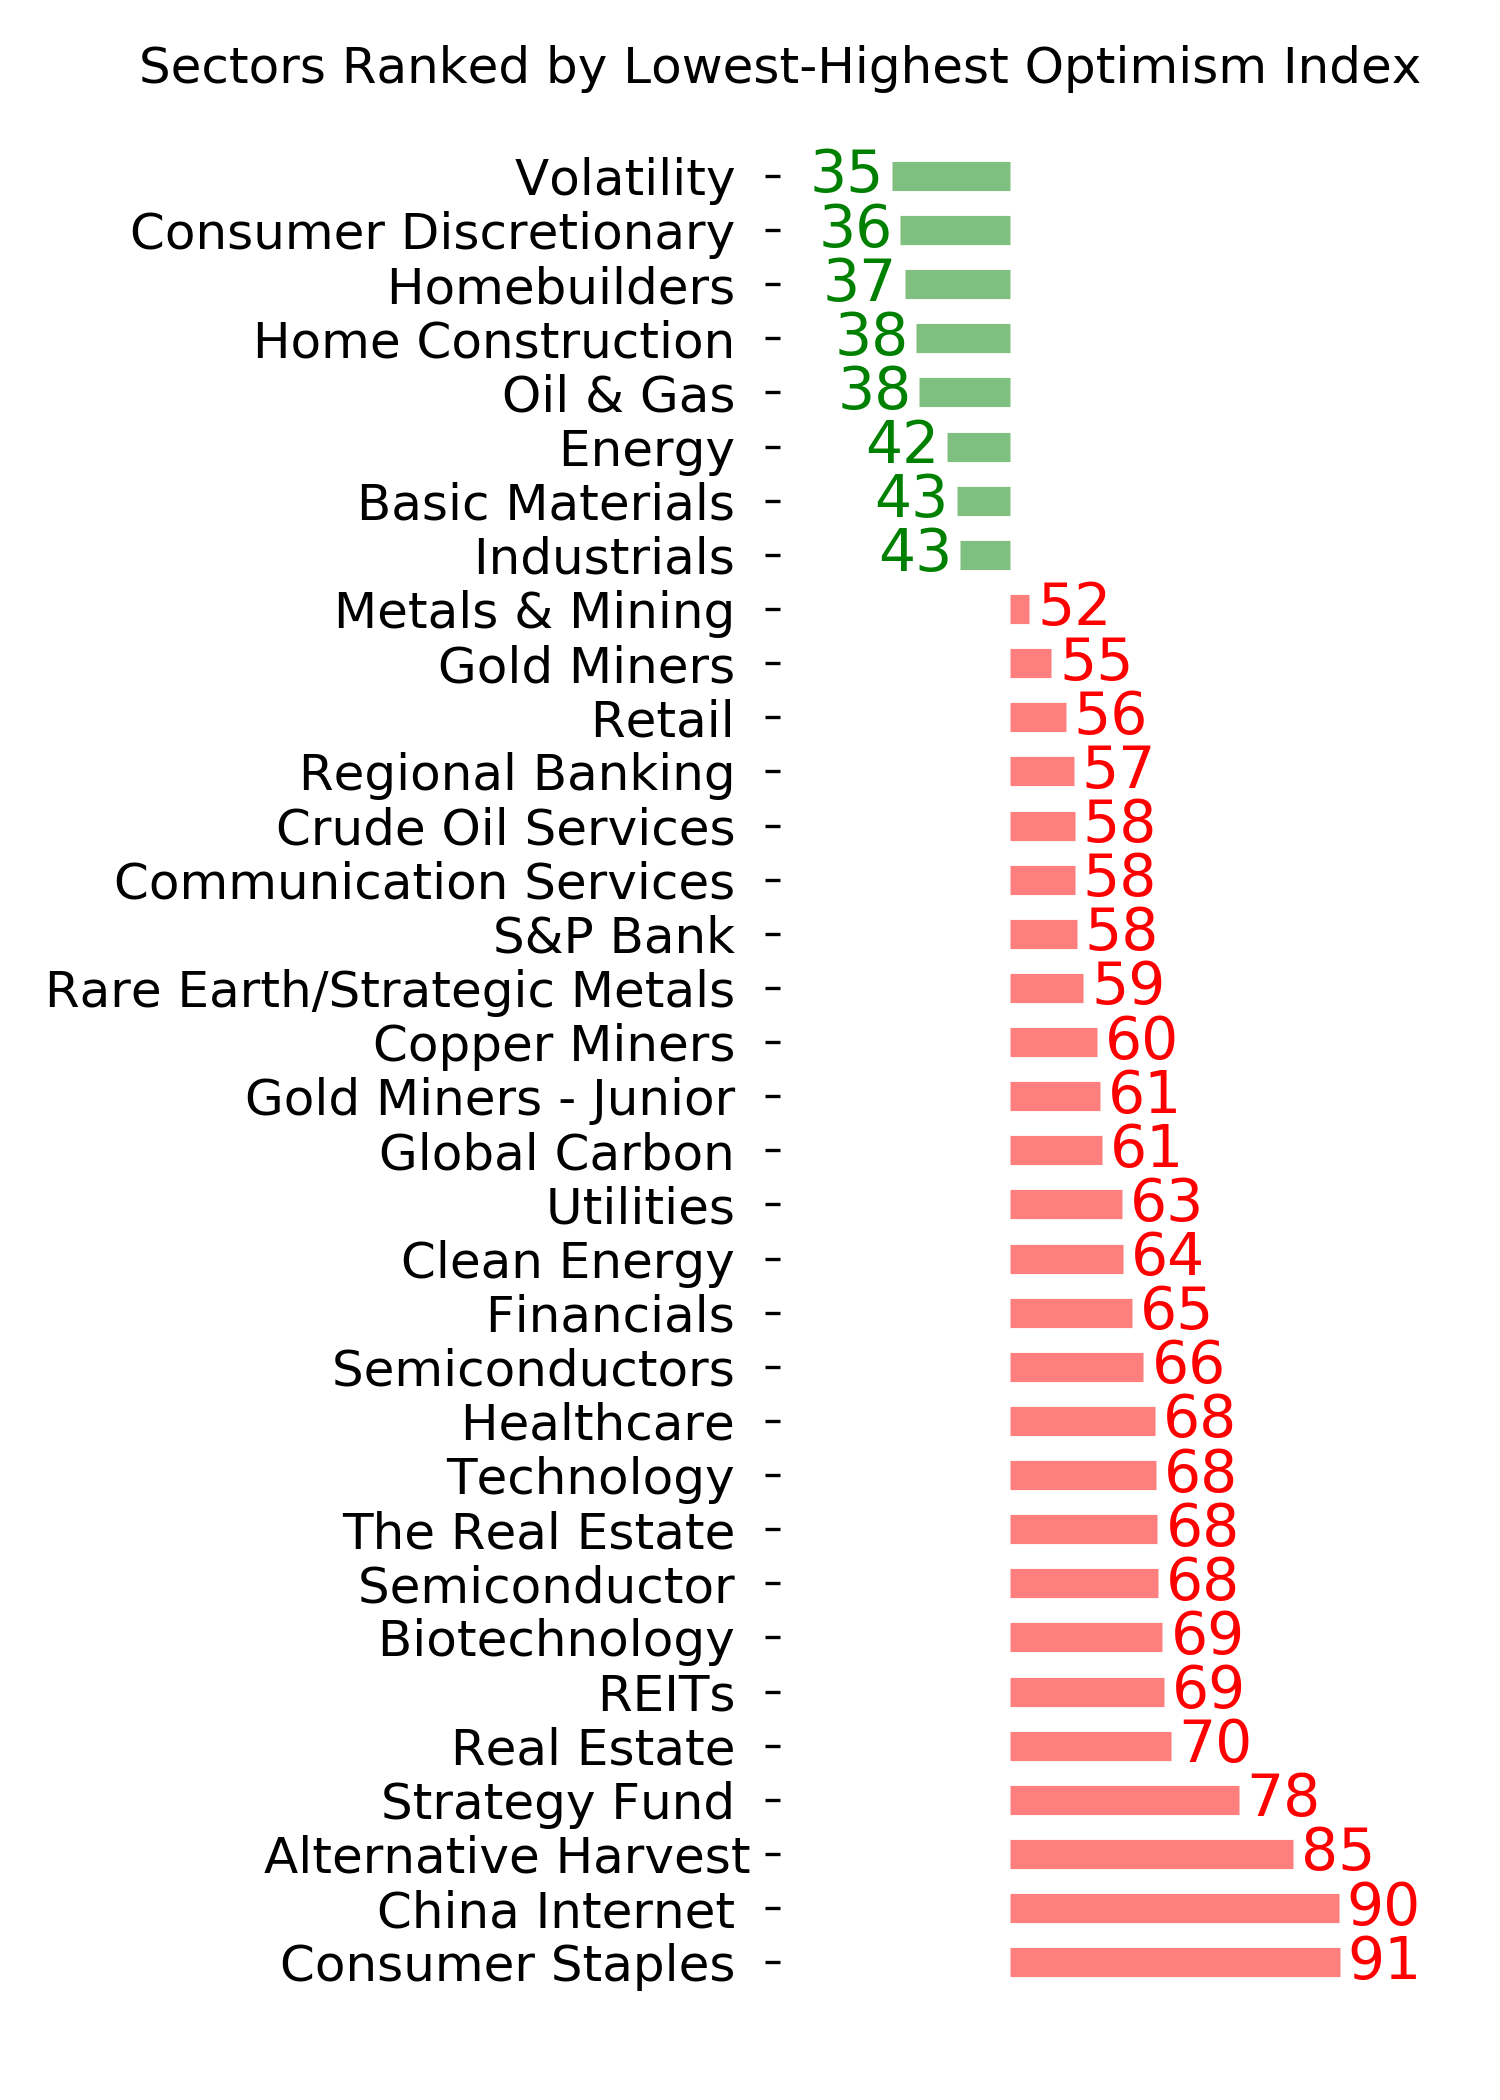
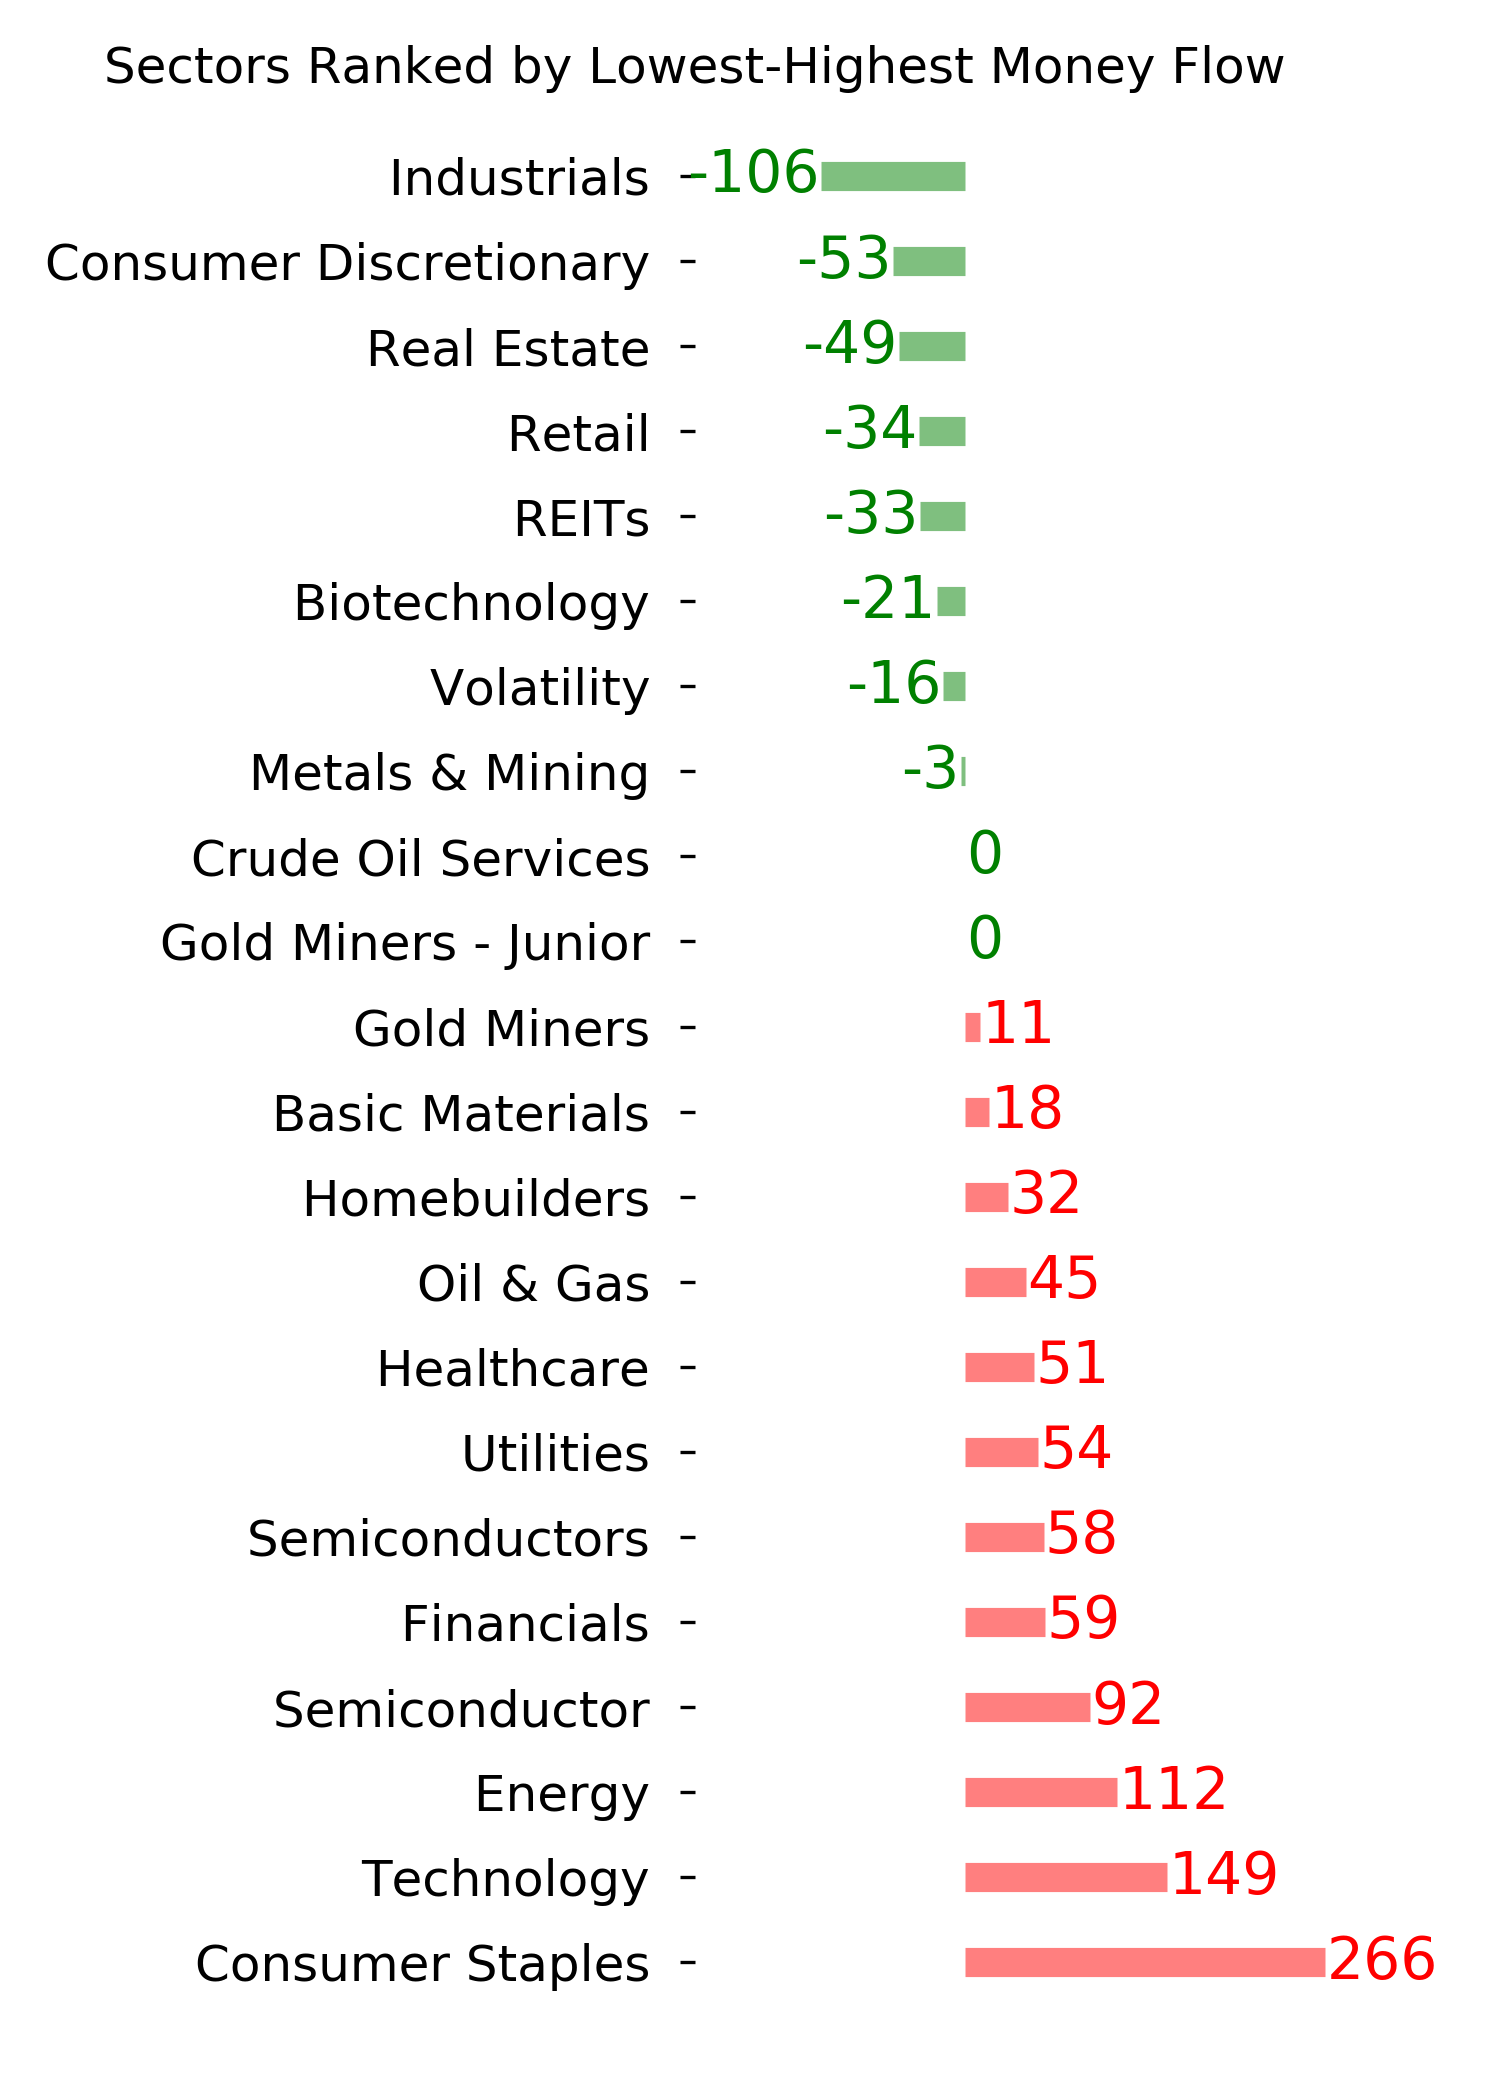
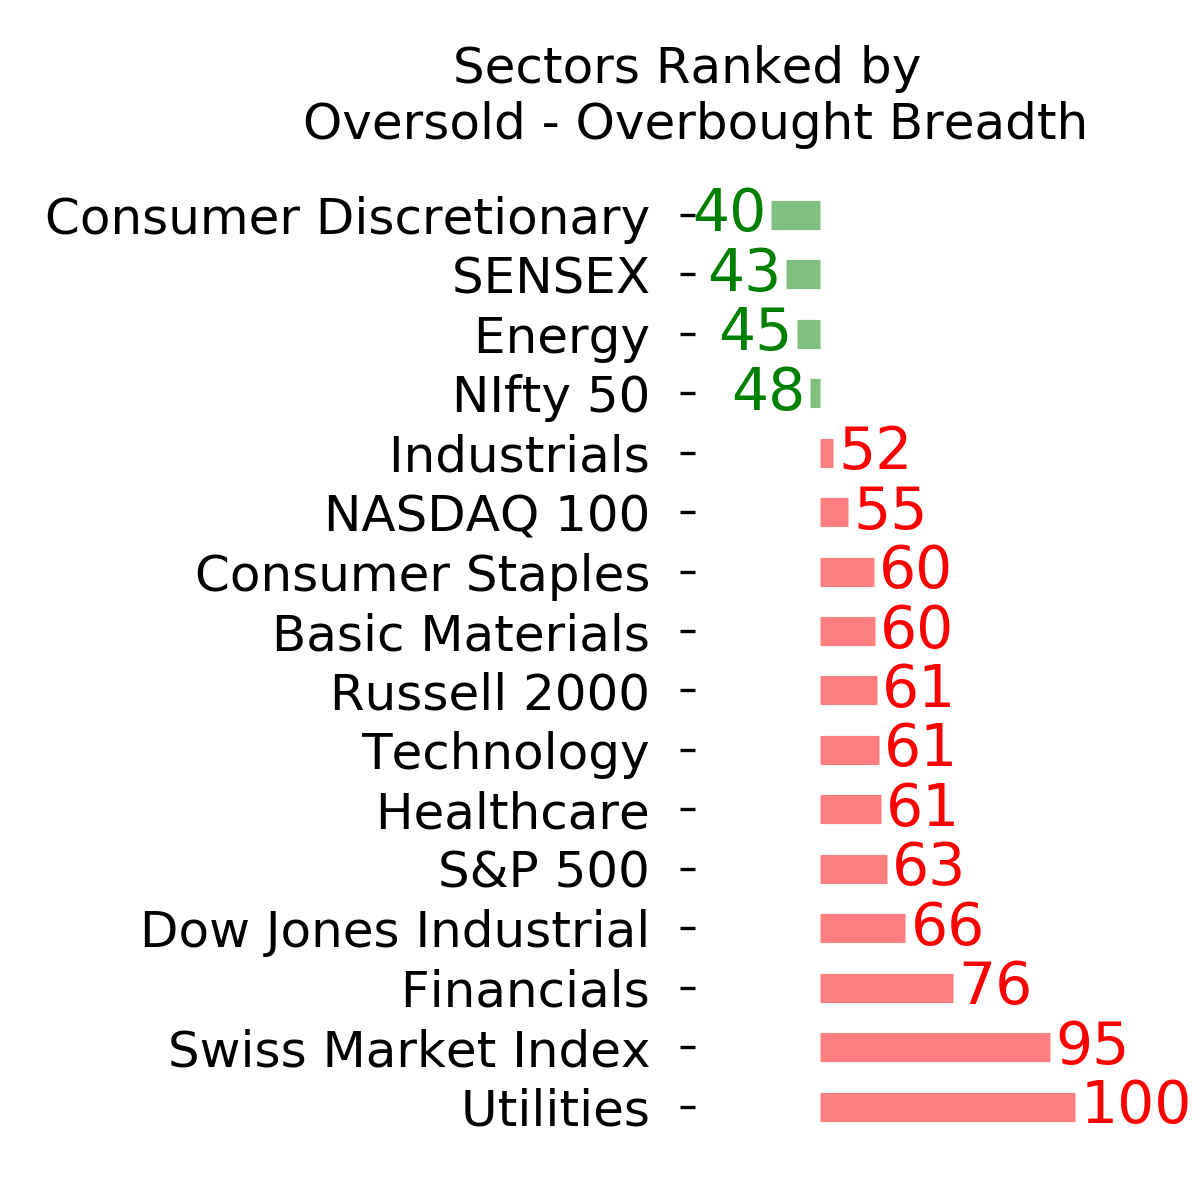
Ranks
|
|
|
|
|
|
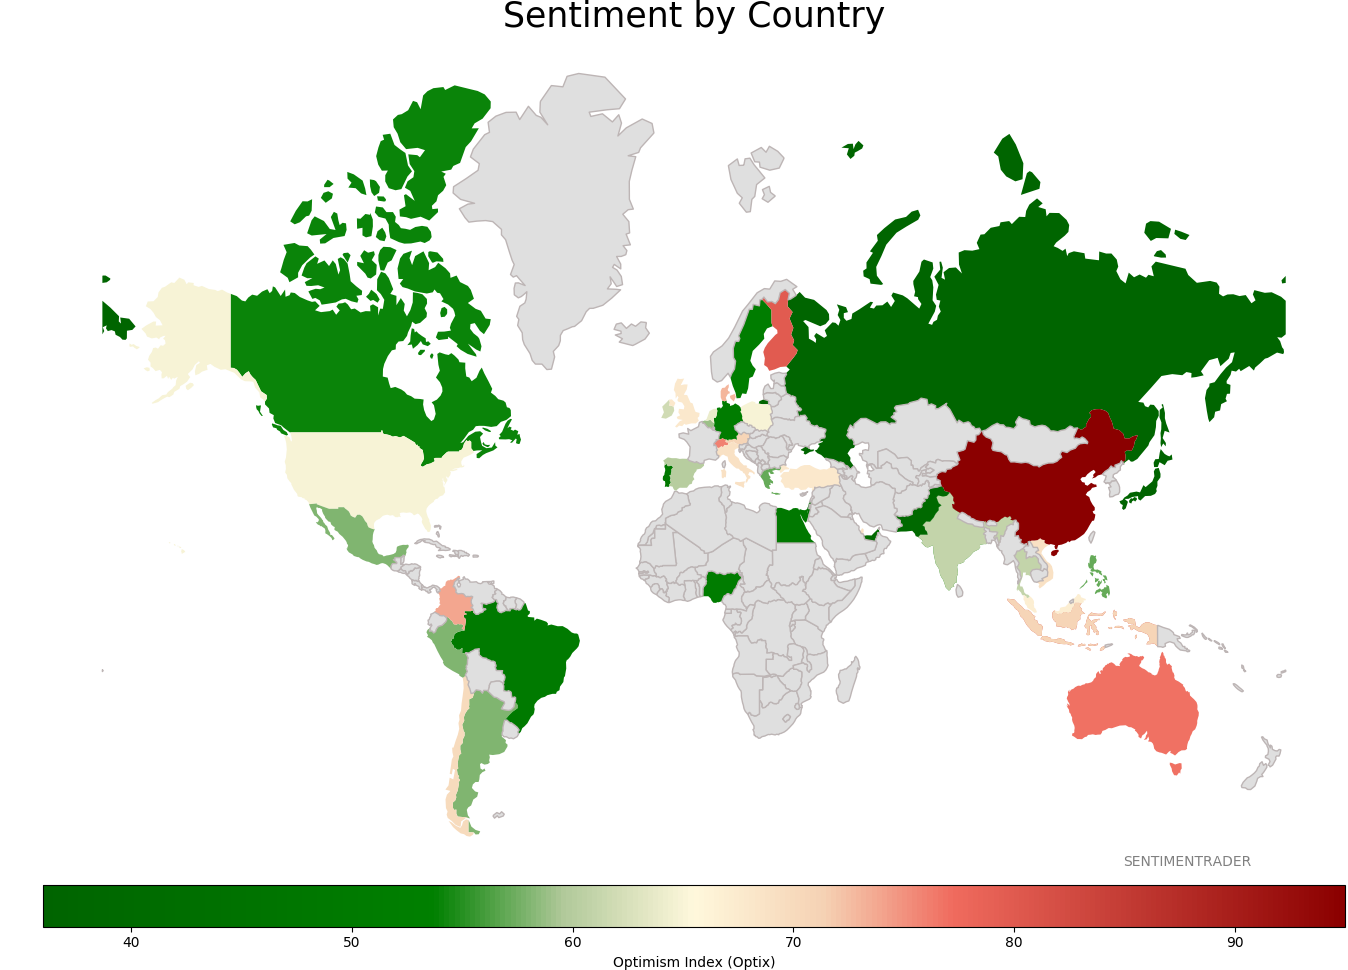
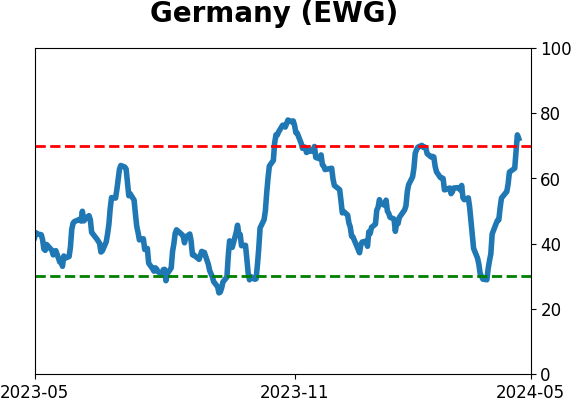
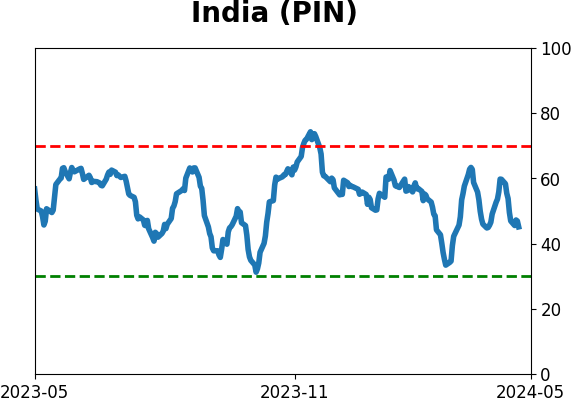
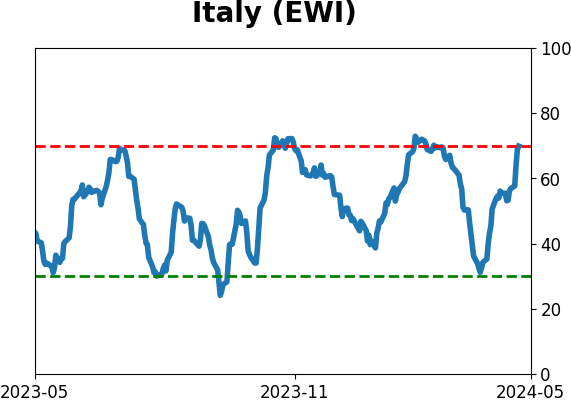
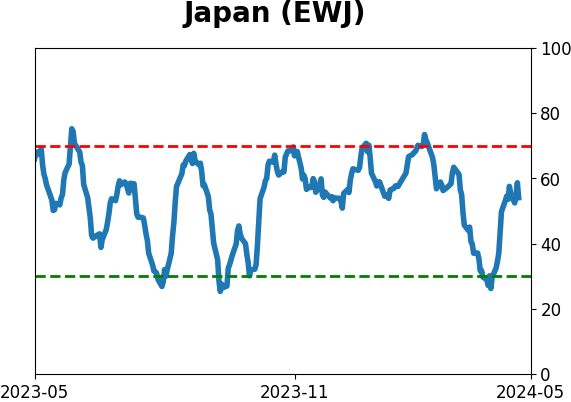
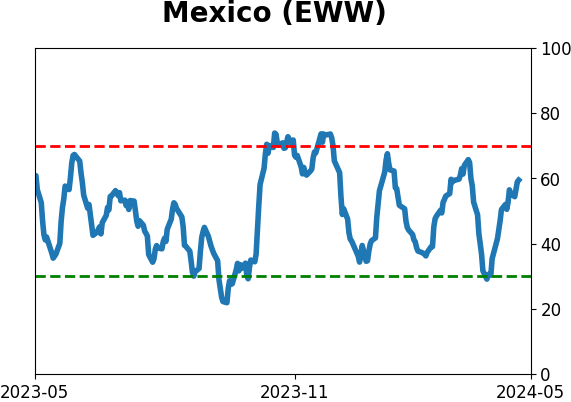
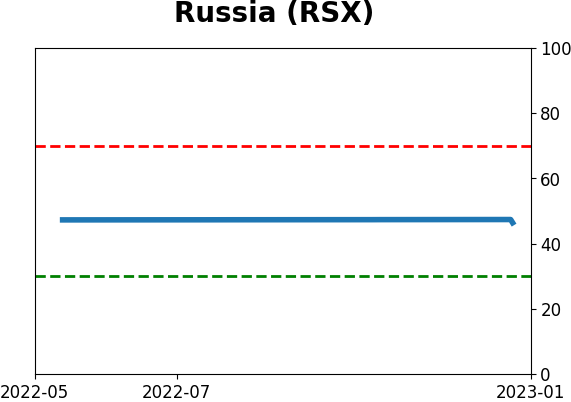
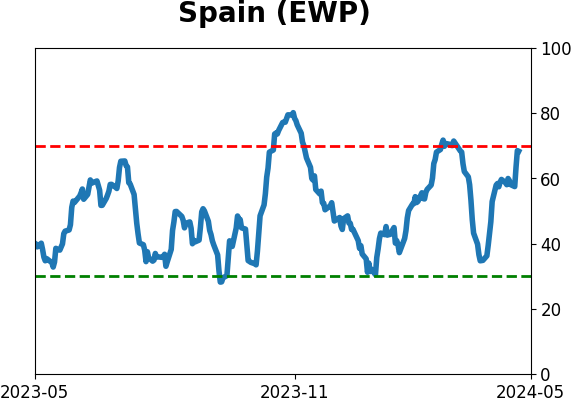
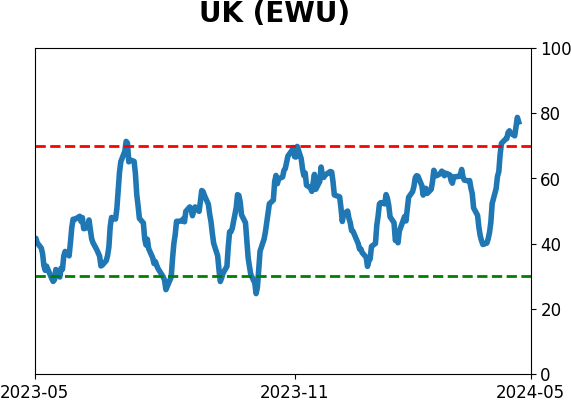
Sentiment Around The World
|
|
|
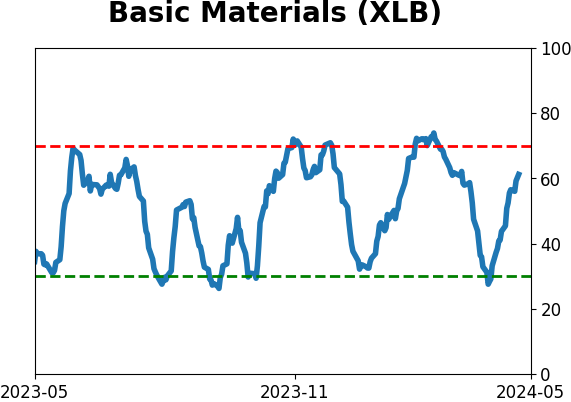
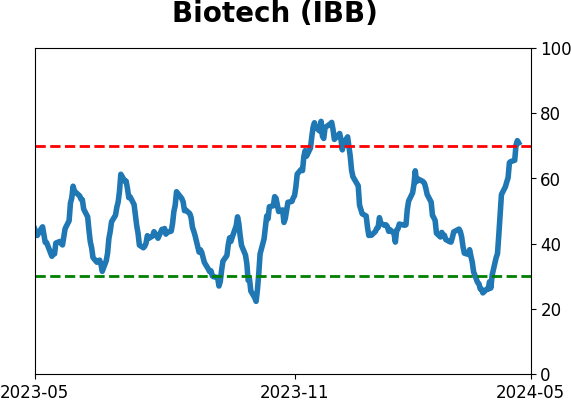
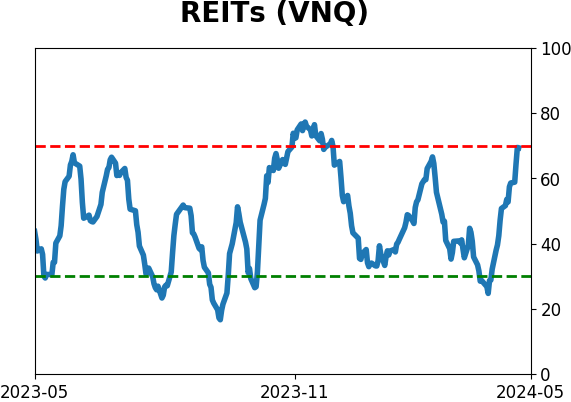
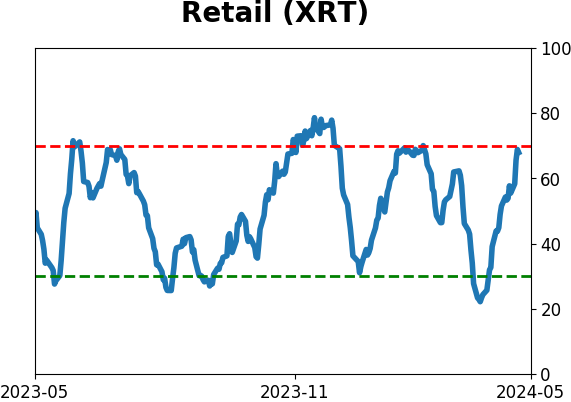
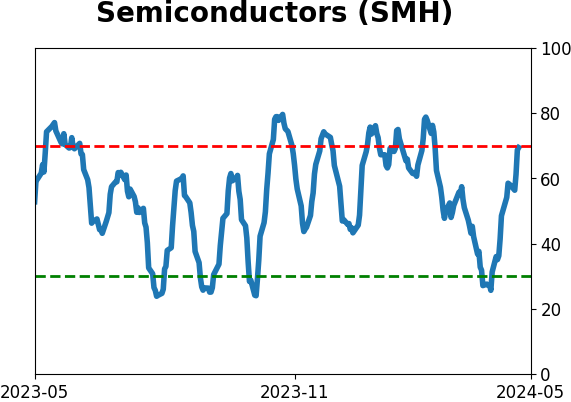
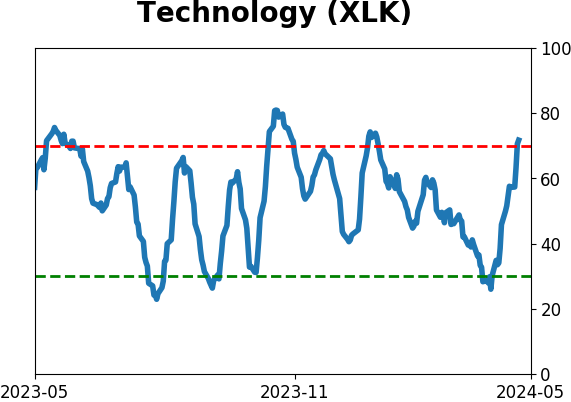
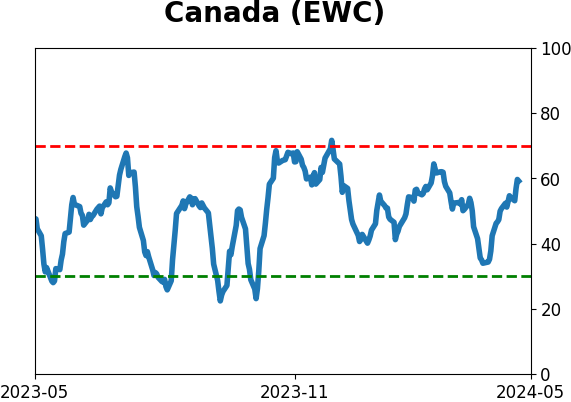
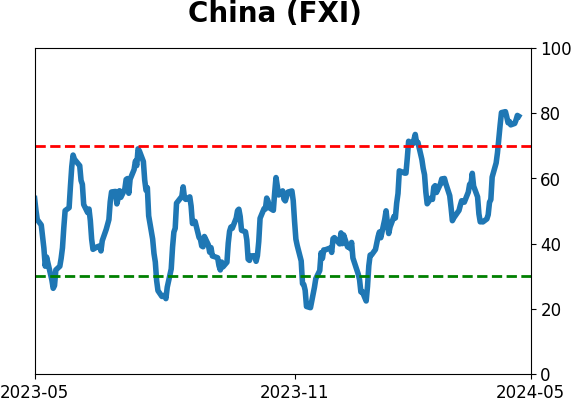
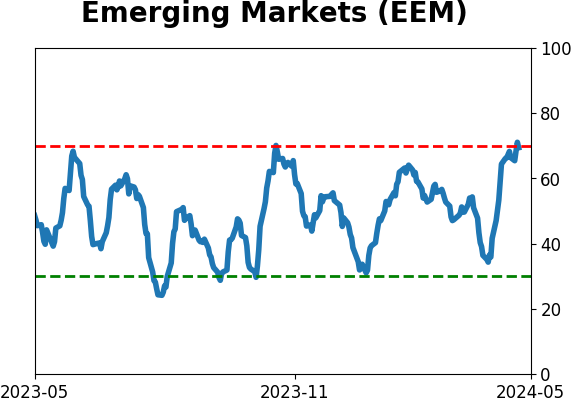
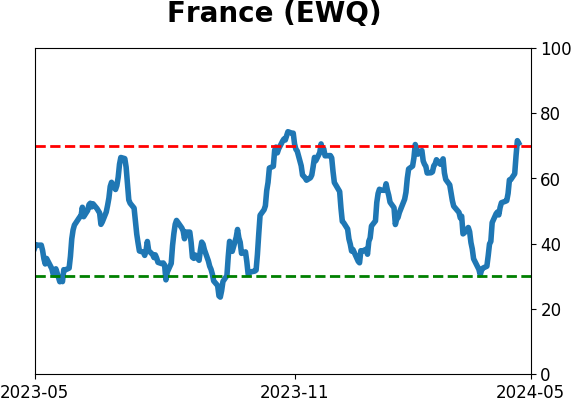
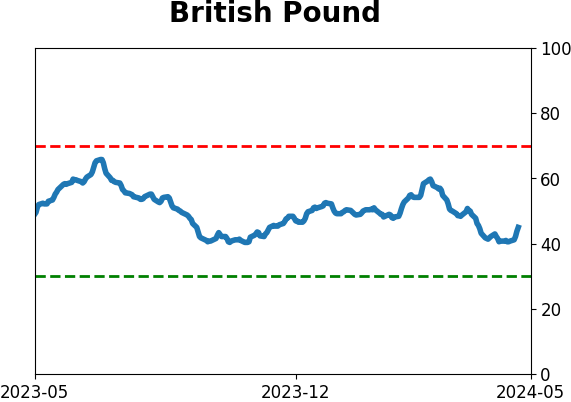
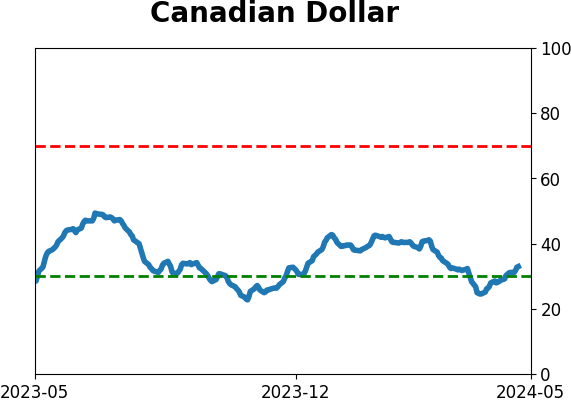
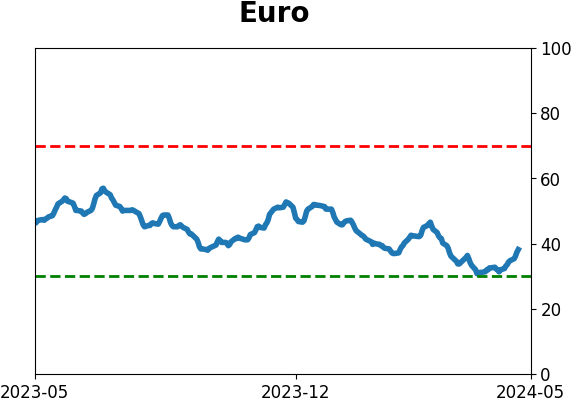
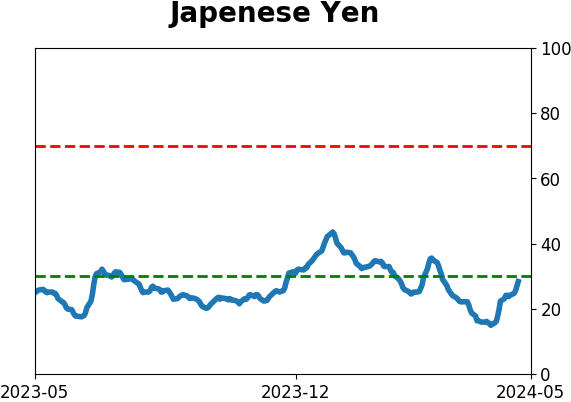
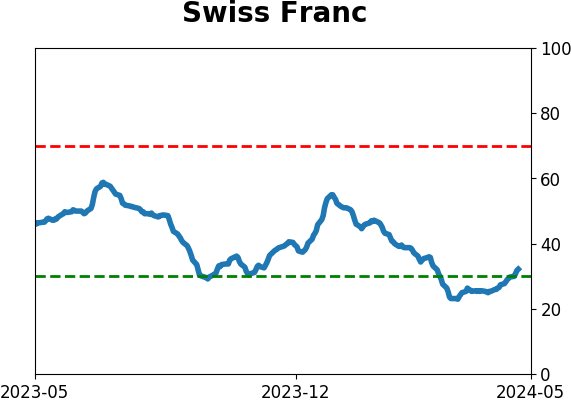
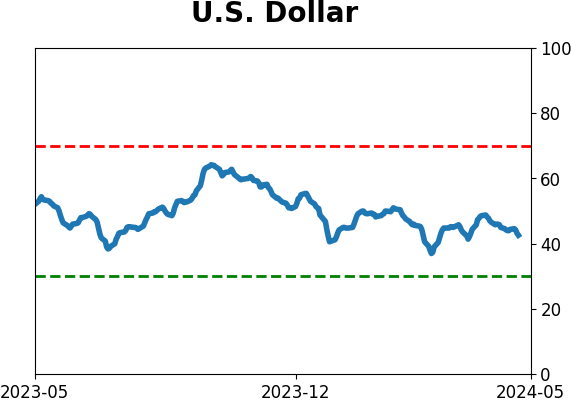
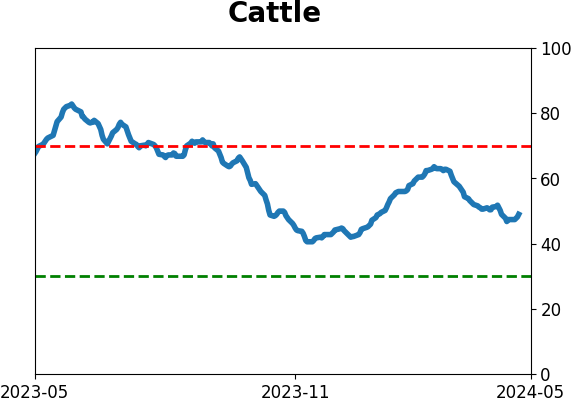
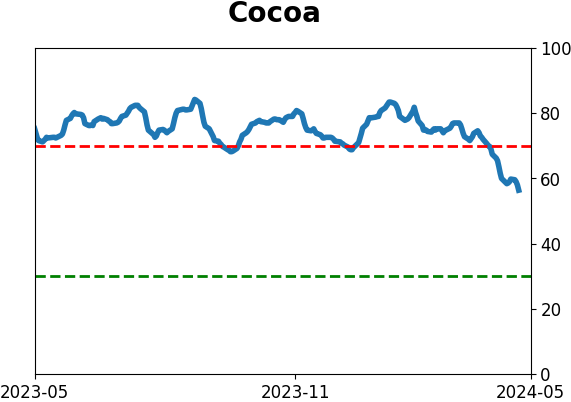
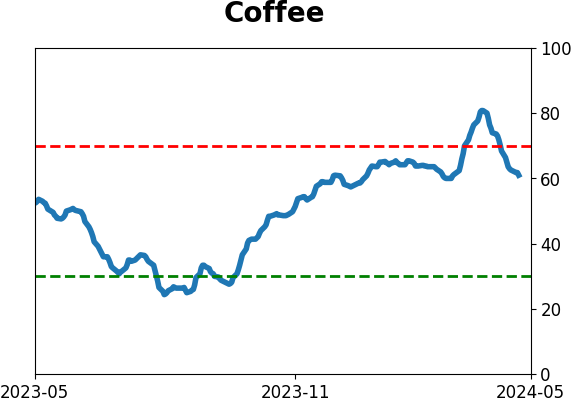
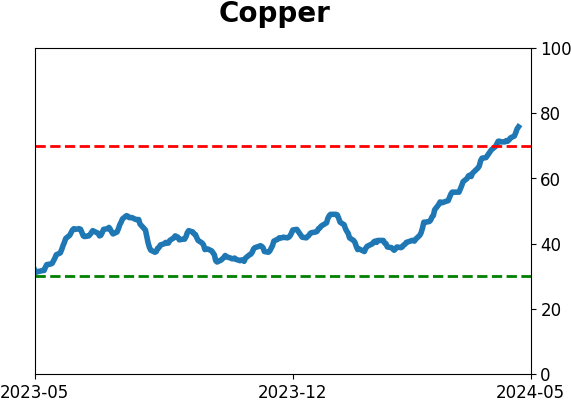
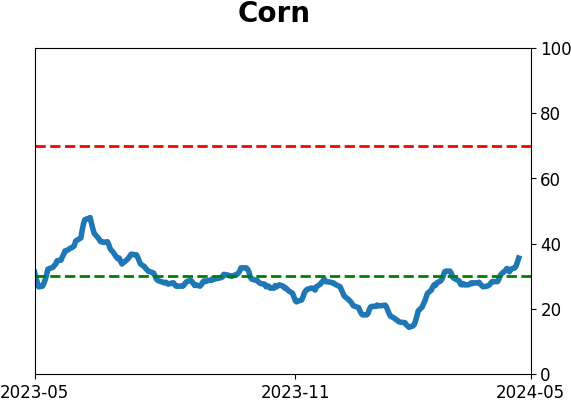
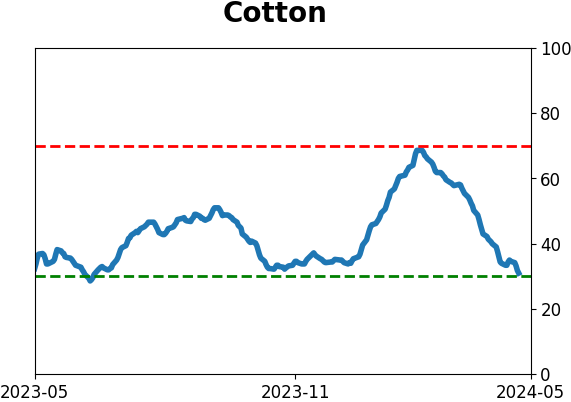
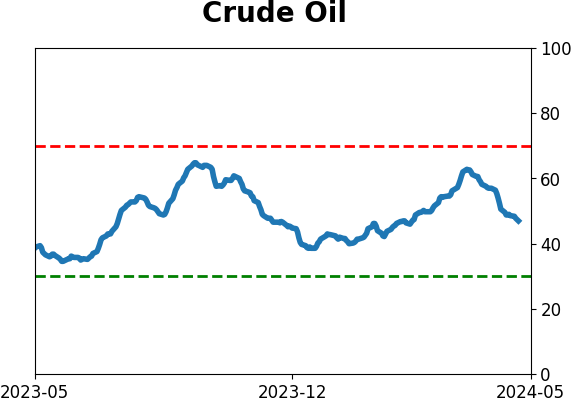
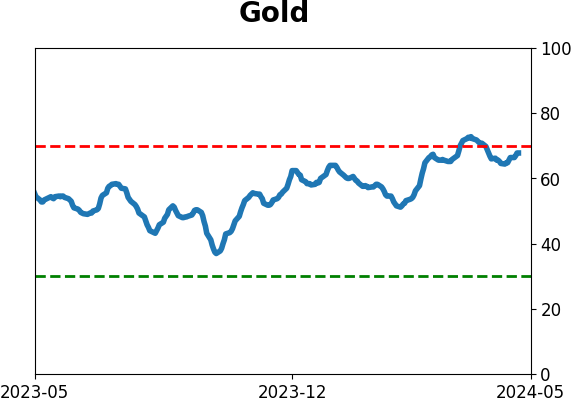
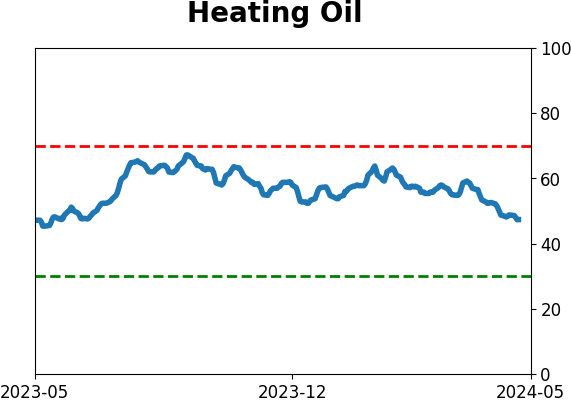
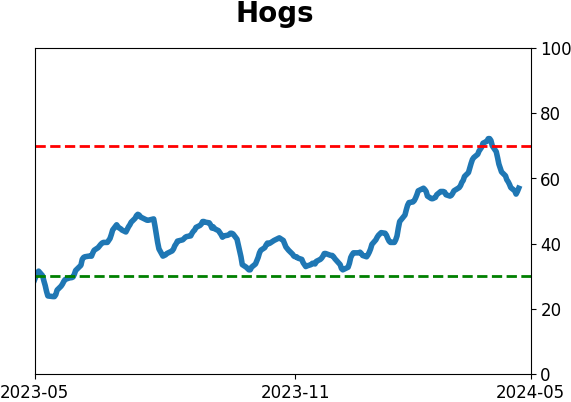
Optimism Index Thumbnails
|
|
|
|
|
|
|
|
|
|
|
|
|
|
|
|
|
|
|
|
|