Headlines
|
|
A swift reversal in the S&P 500's Relative Strength Index:
For only the 43rd time since 1928, the S&P 500's Relative Strength Index cycled from below 34 to above 67 in 20 sessions or fewer. Similar precedents suggest the bullish price momentum in the S&P 500 persists. Not to be outdone, a similar signal occurred for the Nasdaq 100, with an even more bullish outlook.
|
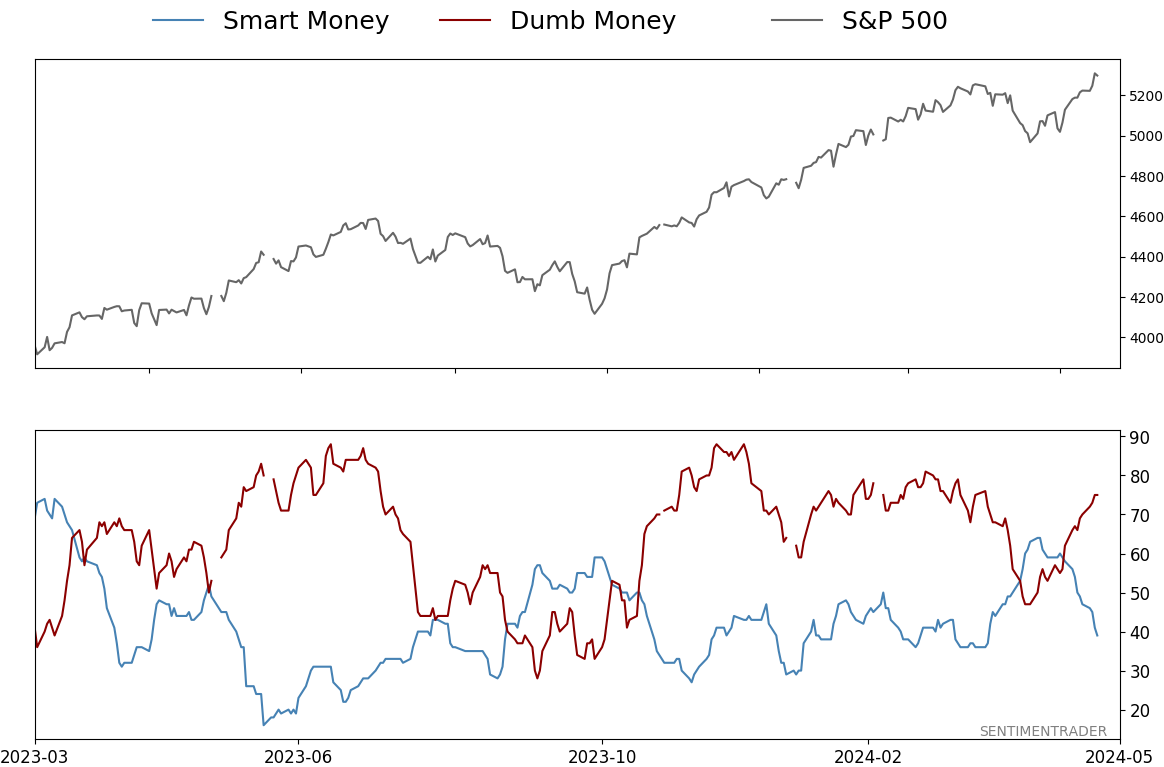
Smart / Dumb Money Confidence
|
Smart Money Confidence: 39%
Dumb Money Confidence: 75%
|
|
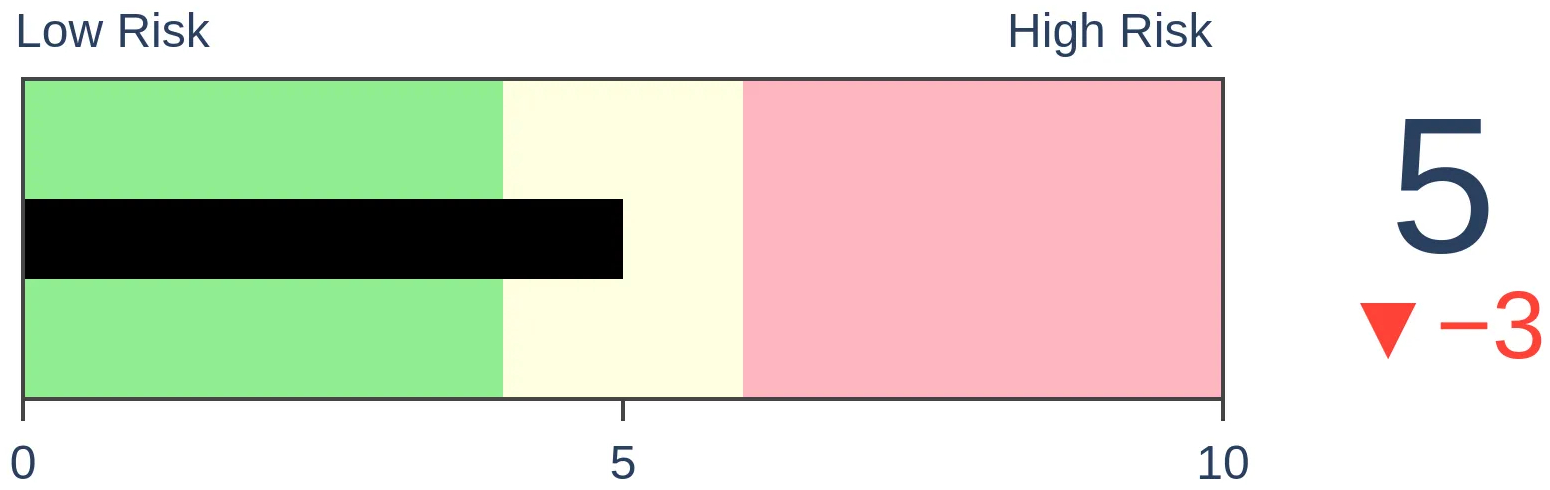
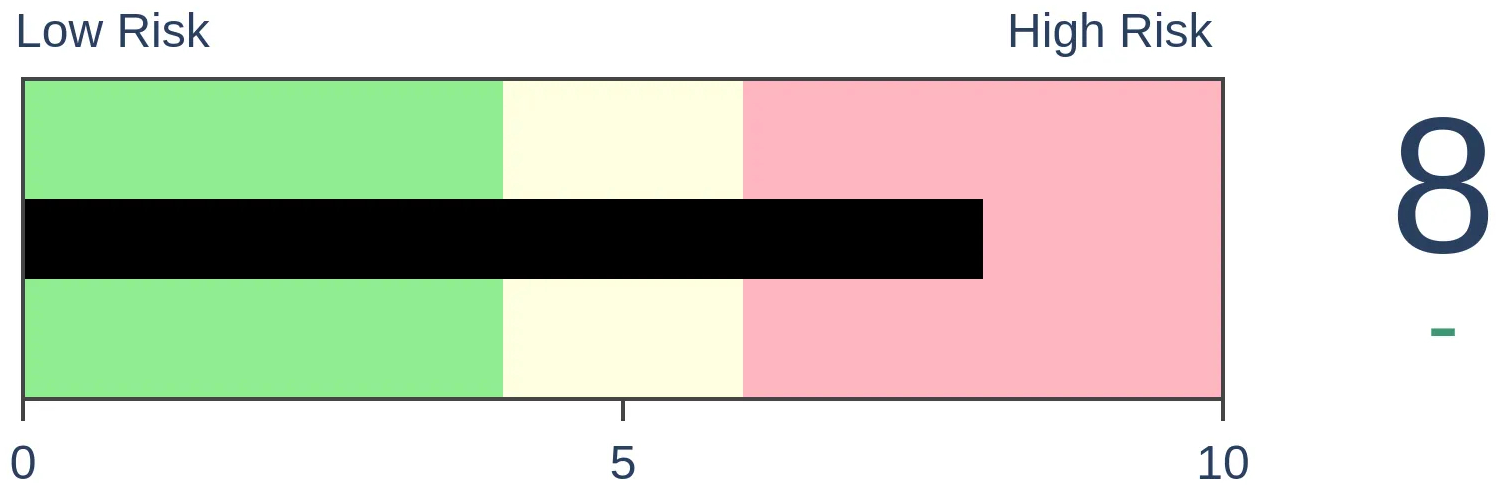
Risk Levels
Stocks Short-Term
|
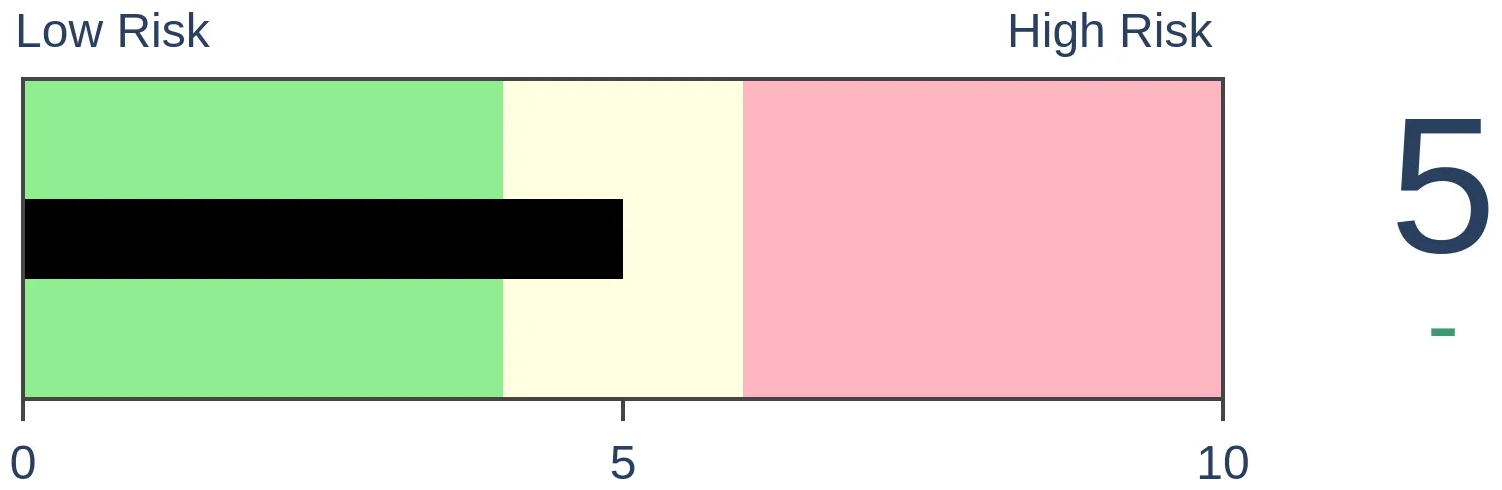
Stocks Medium-Term
|
|
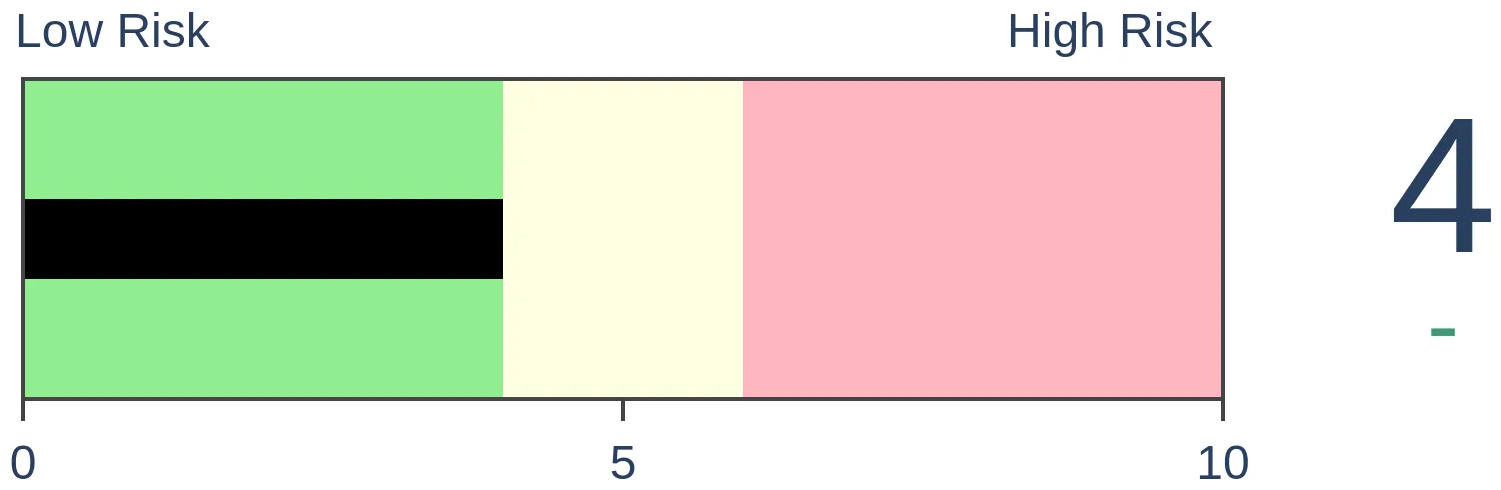
Bonds
|
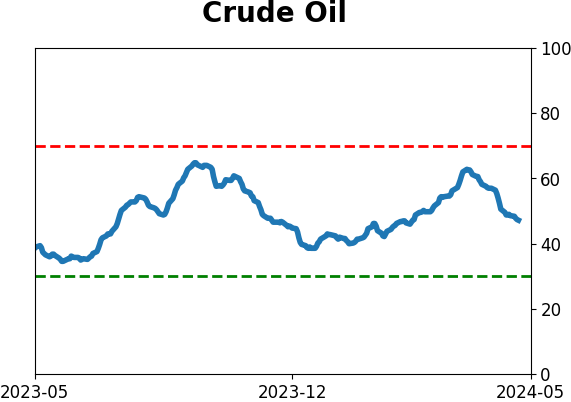
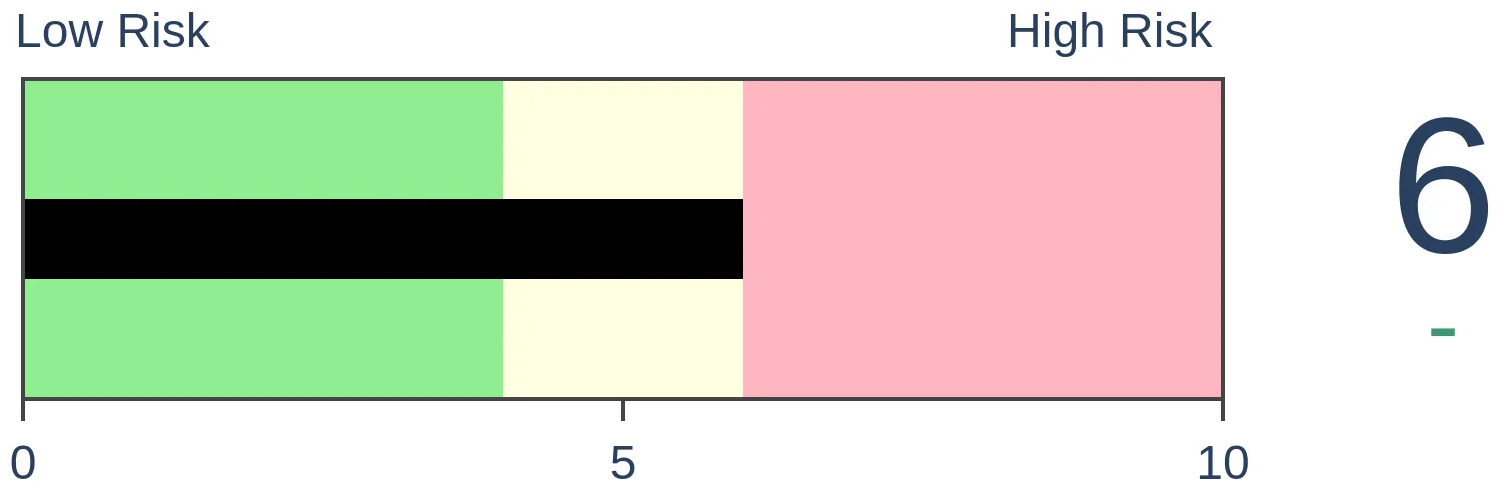
Crude Oil
|
|
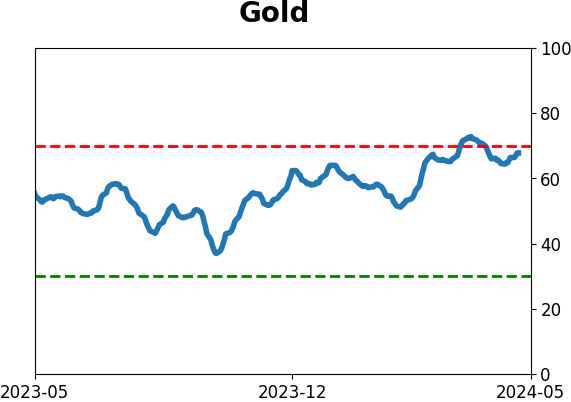
Gold
|
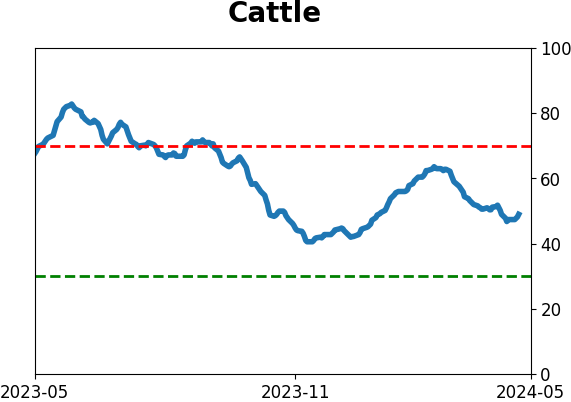
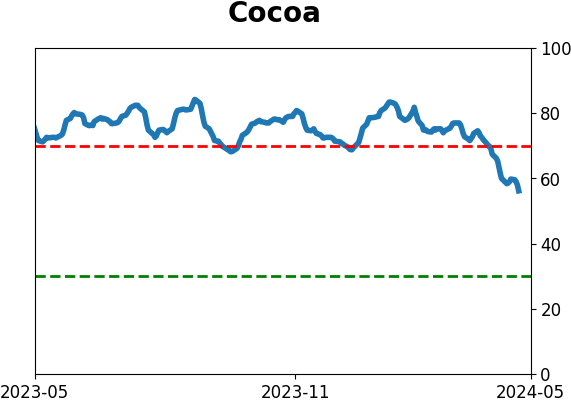
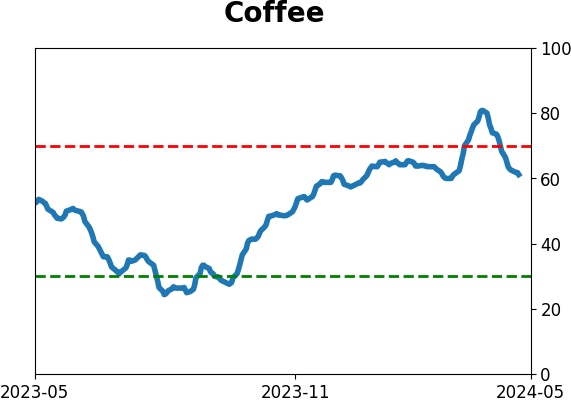
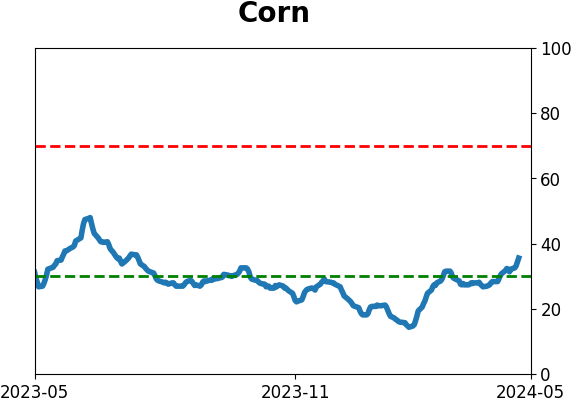
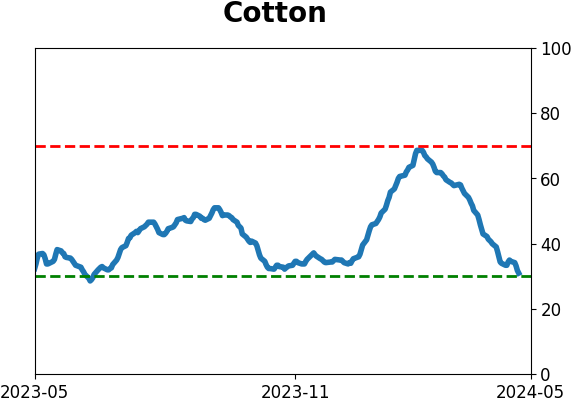
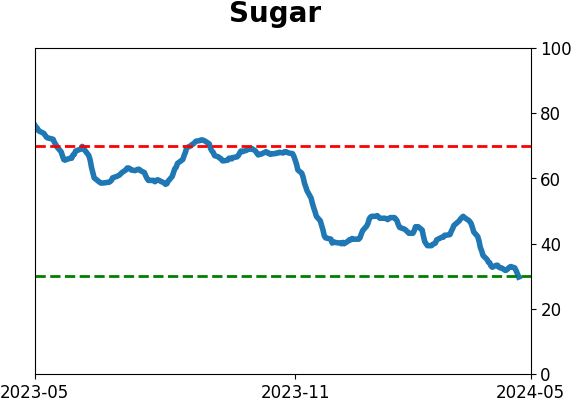
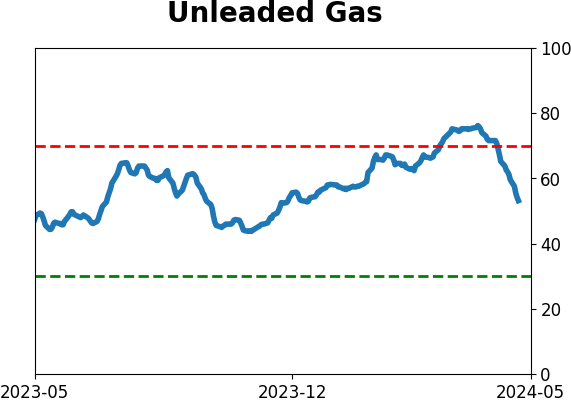
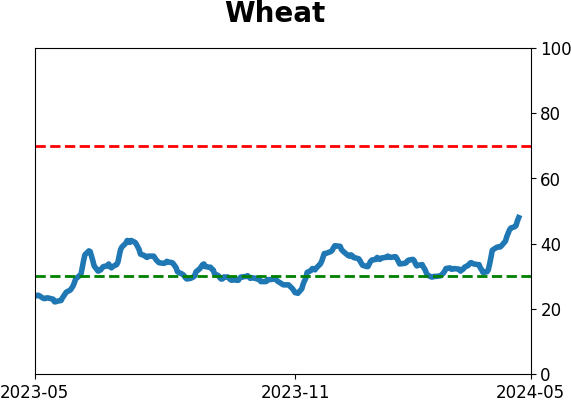
Agriculture

|
|
Research
By Dean Christians
BOTTOM LINE
For only the 43rd time since 1928, the S&P 500's Relative Strength Index cycled from below 34 to above 67 in 20 sessions or fewer. Similar precedents suggest the bullish price momentum in the S&P 500 persists. Not to be outdone, a similar signal occurred for the Nasdaq 100, with an even more bullish outlook.
FORECAST / TIMEFRAME
None
|
Key points:
- The Relative Strength Index for the S&P 500 cycled from less than 34 to greater than 67
- Following similar price momentum reversals, the S&P 500 displayed a consistent upward bias
- After a Nasdaq 100 signal, the technology-oriented index was higher 92% of the time over the next week
A quick roundtrip for a widely followed price momentum indicator
In my research notes this week, I've shared how traders can employ the Risk On/Off indicator and a breadth composite as standalone trading signals, strategies, or overlays for other systems. The Relative Strength Index (RSI), a price momentum indicator, also exemplifies this type of flexibility.
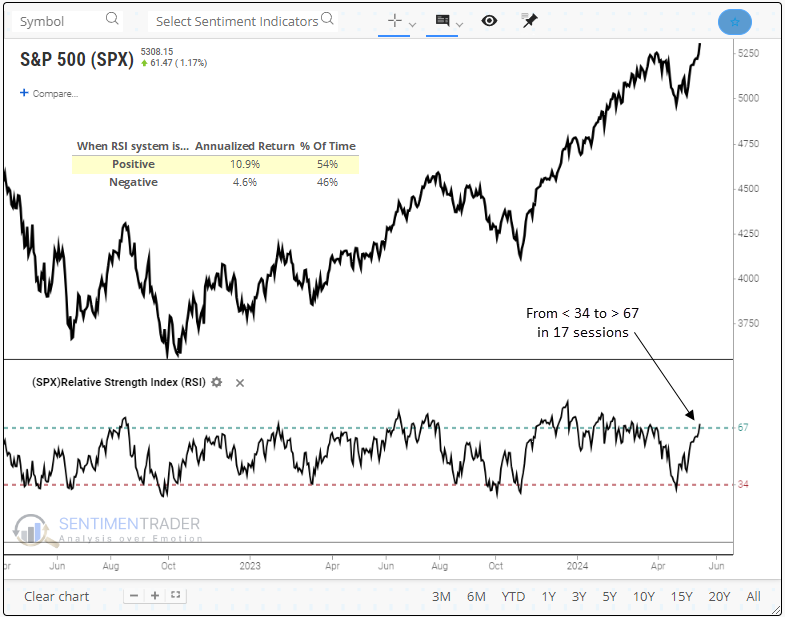
In researching a strategy for the RSI, I found that optimal results occurred by initiating a position when the indicator crossed above 67 and holding it until it fell below 34. This positive RSI trend produced an annualized return of 10.9% for the S&P 500 since 1928. Conversely, when the RSI dropped below 34 and stayed under 67, a negative trend, the S&P 500 displayed an annualized return of 4.6%.
On Wednesday, the S&P 500's RSI exceeded 67, triggering a favorable trend profile. Since 1928, there have been 149 instances of a shift from below 34 to above 67. However, this most recent signal intrigued me because it occurred in a span of only 17 sessions, a more uncommon event.
The previous RSI reversal occurred in November 2023, producing a 12% gain for the S&P 500 over three months.
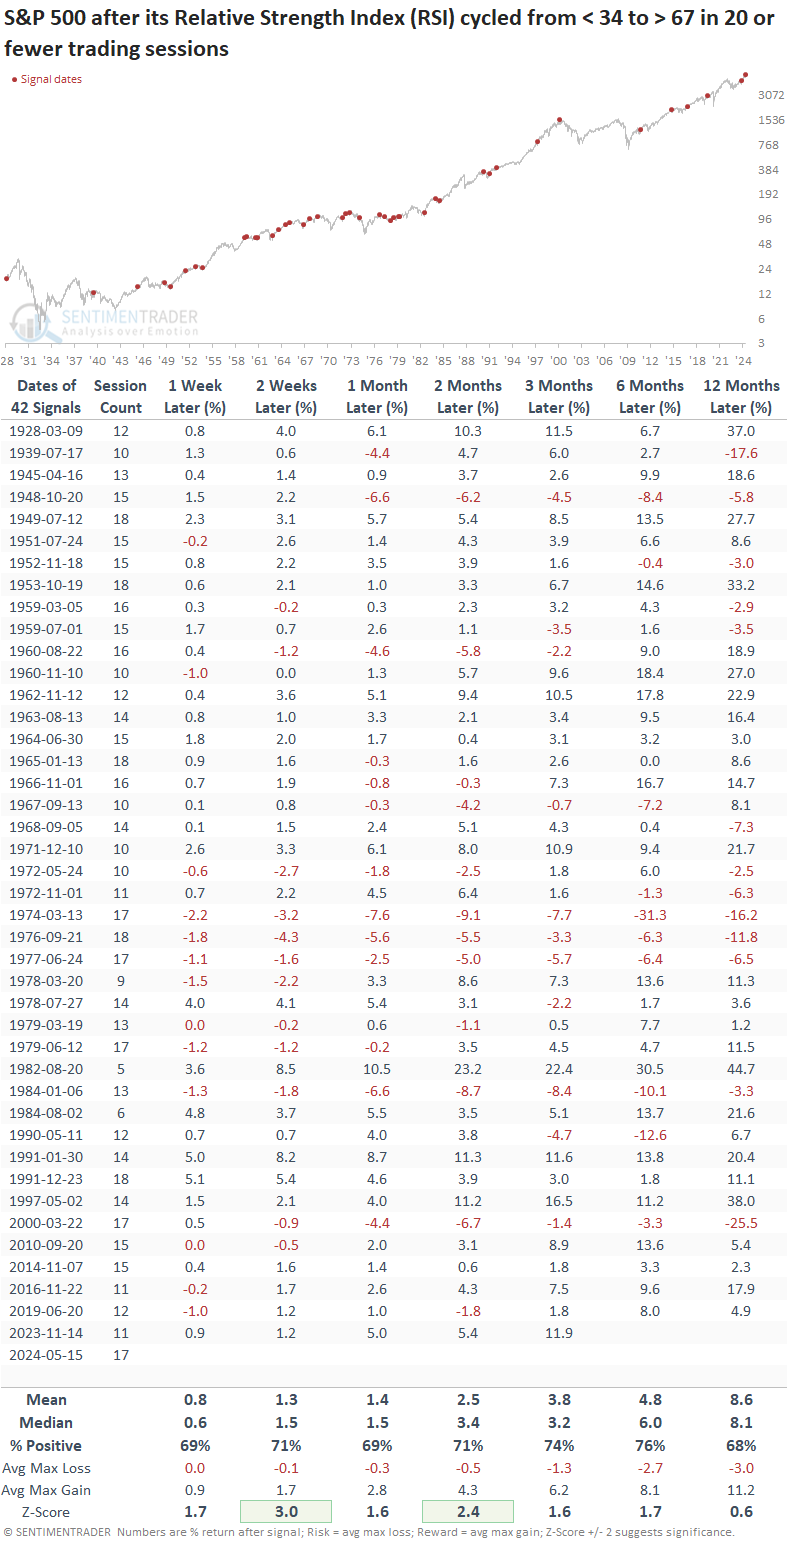
Similar price momentum reversals preceded positive returns
Following instances when the S&P 500's RSI reversed from below 34 to above 67 in 20 trading sessions or fewer, the world's most benchmarked index displayed a consistent upward bias over time.
Results over the following two weeks were impressive, with the index showcasing a solid return, high win rate, and significance versus random returns. For perspective, the 71% win rate during this period is considerably higher than the 58% win rate observed since 1928.
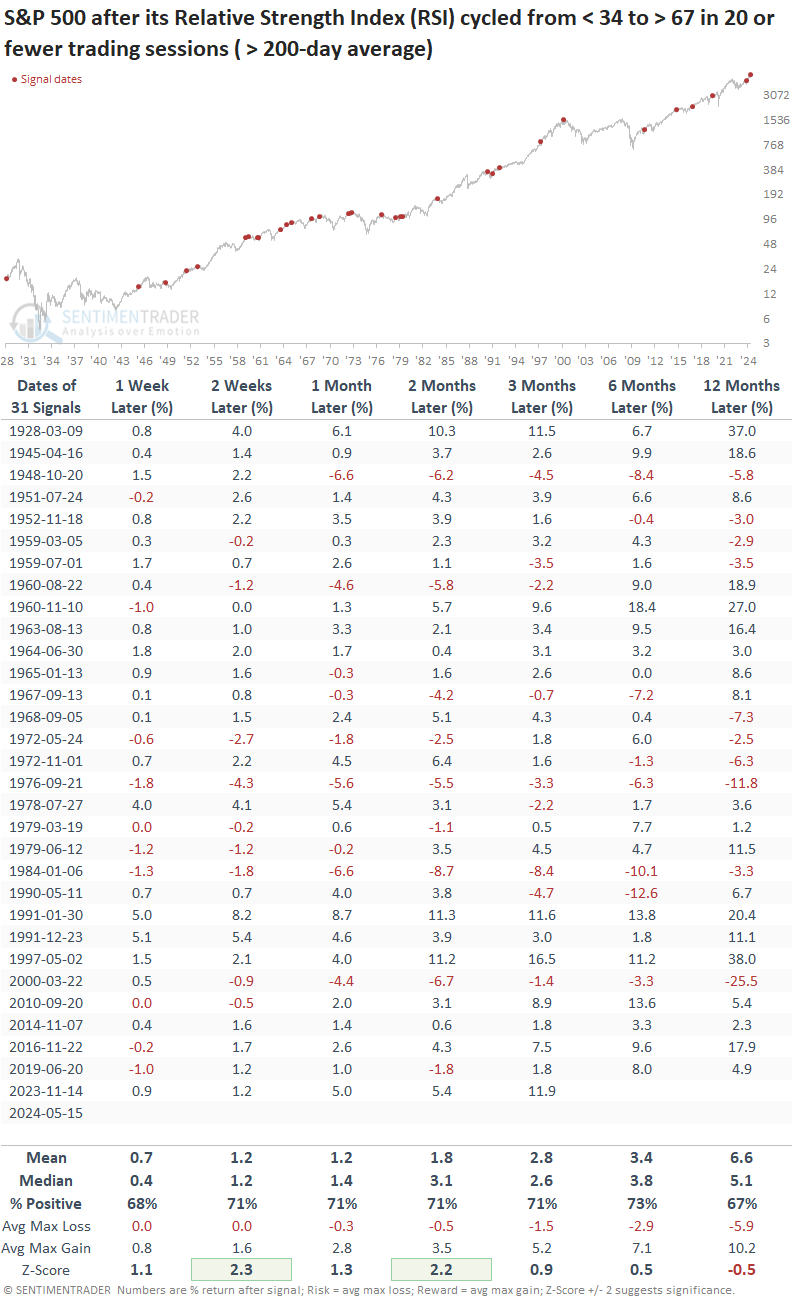
When the RSI reversal occurs with the S&P 500 above its 200-day average, context similar to now, returns are slightly less favorable. However, win rates stay consistently high, and the two- and eight-week time frames continue to show significance relative to random returns.
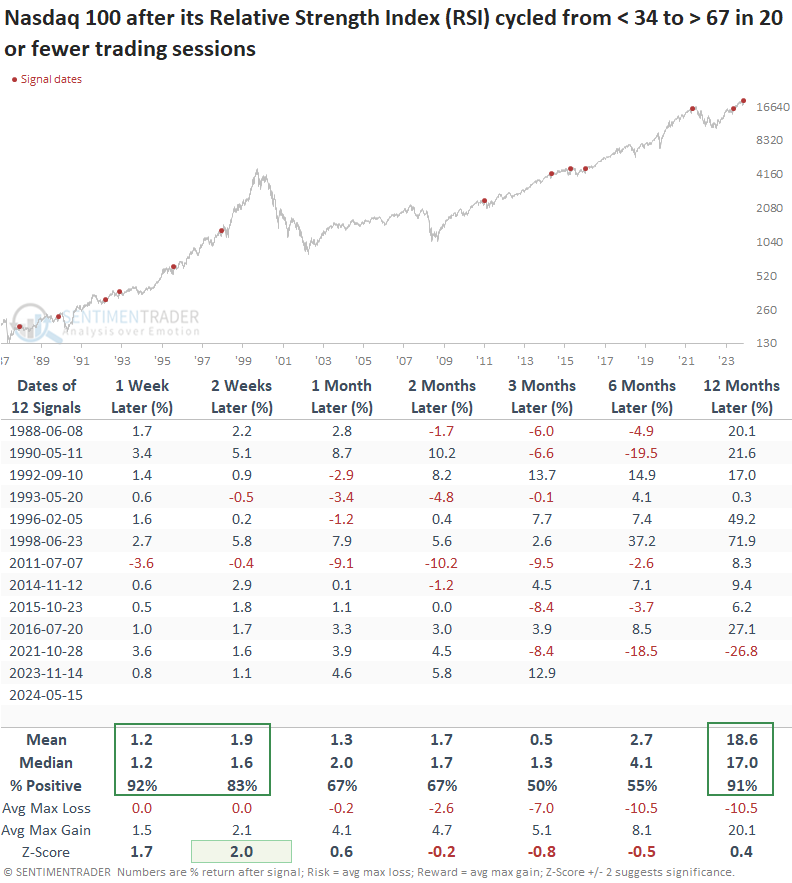
Other indexes
The Nasdaq 100 also triggered a swift RSI reversal. While rare, precedents suggest the favorable price momentum will likely continue in the short term. Over the following week, the technology-oriented index was higher 92% of the time.
Although there was a lull from three to six months later, the one-year time frame showed only one loss.
What the research tells us...
Following the April correction, sentiment and breadth-based indicators reversed, producing a bullish outlook for various indexes and sectors. These measures, which typically react first after a corrective phase, are now being validated by price action at the index level. The S&P 500's Relative Strength Index (RSI) cycled from below 34 to above 67 in less than 20 trading sessions, signaling strong price momentum. Historically, similar RSI reversals have led to positive returns for the index, particularly in the short term. The Nasdaq 100 exhibited a similar rapid RSI shift. After comparable precedents, the short-term outlook is notably bullish, with a 92% probability of gains in the following week.
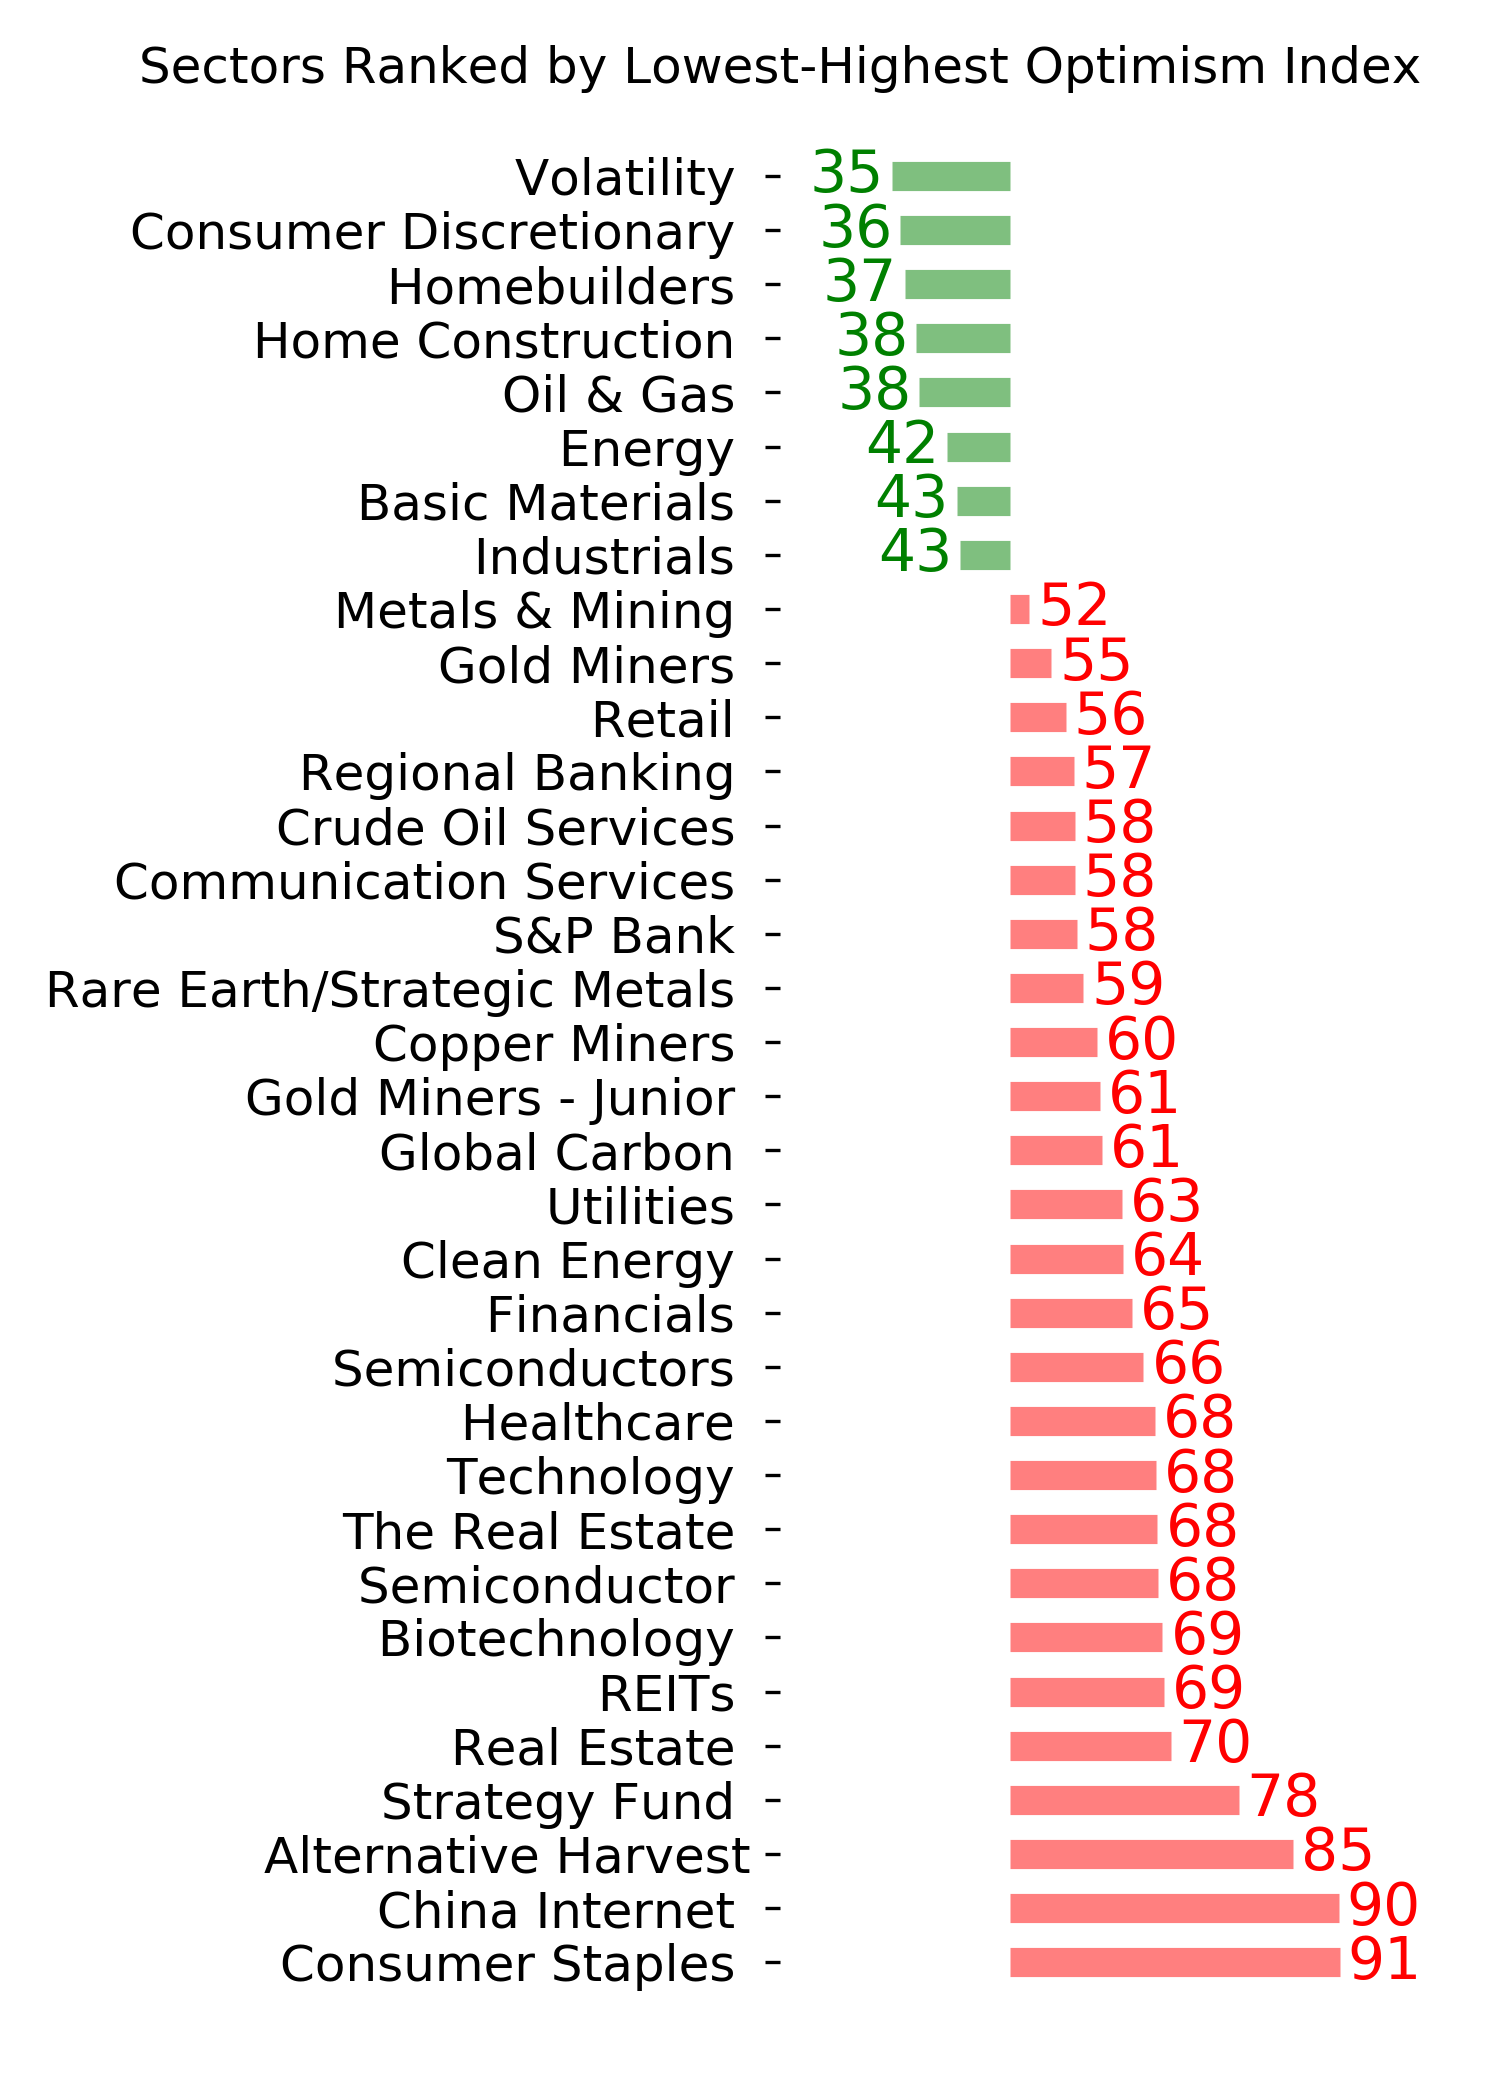
Indicators at Extremes
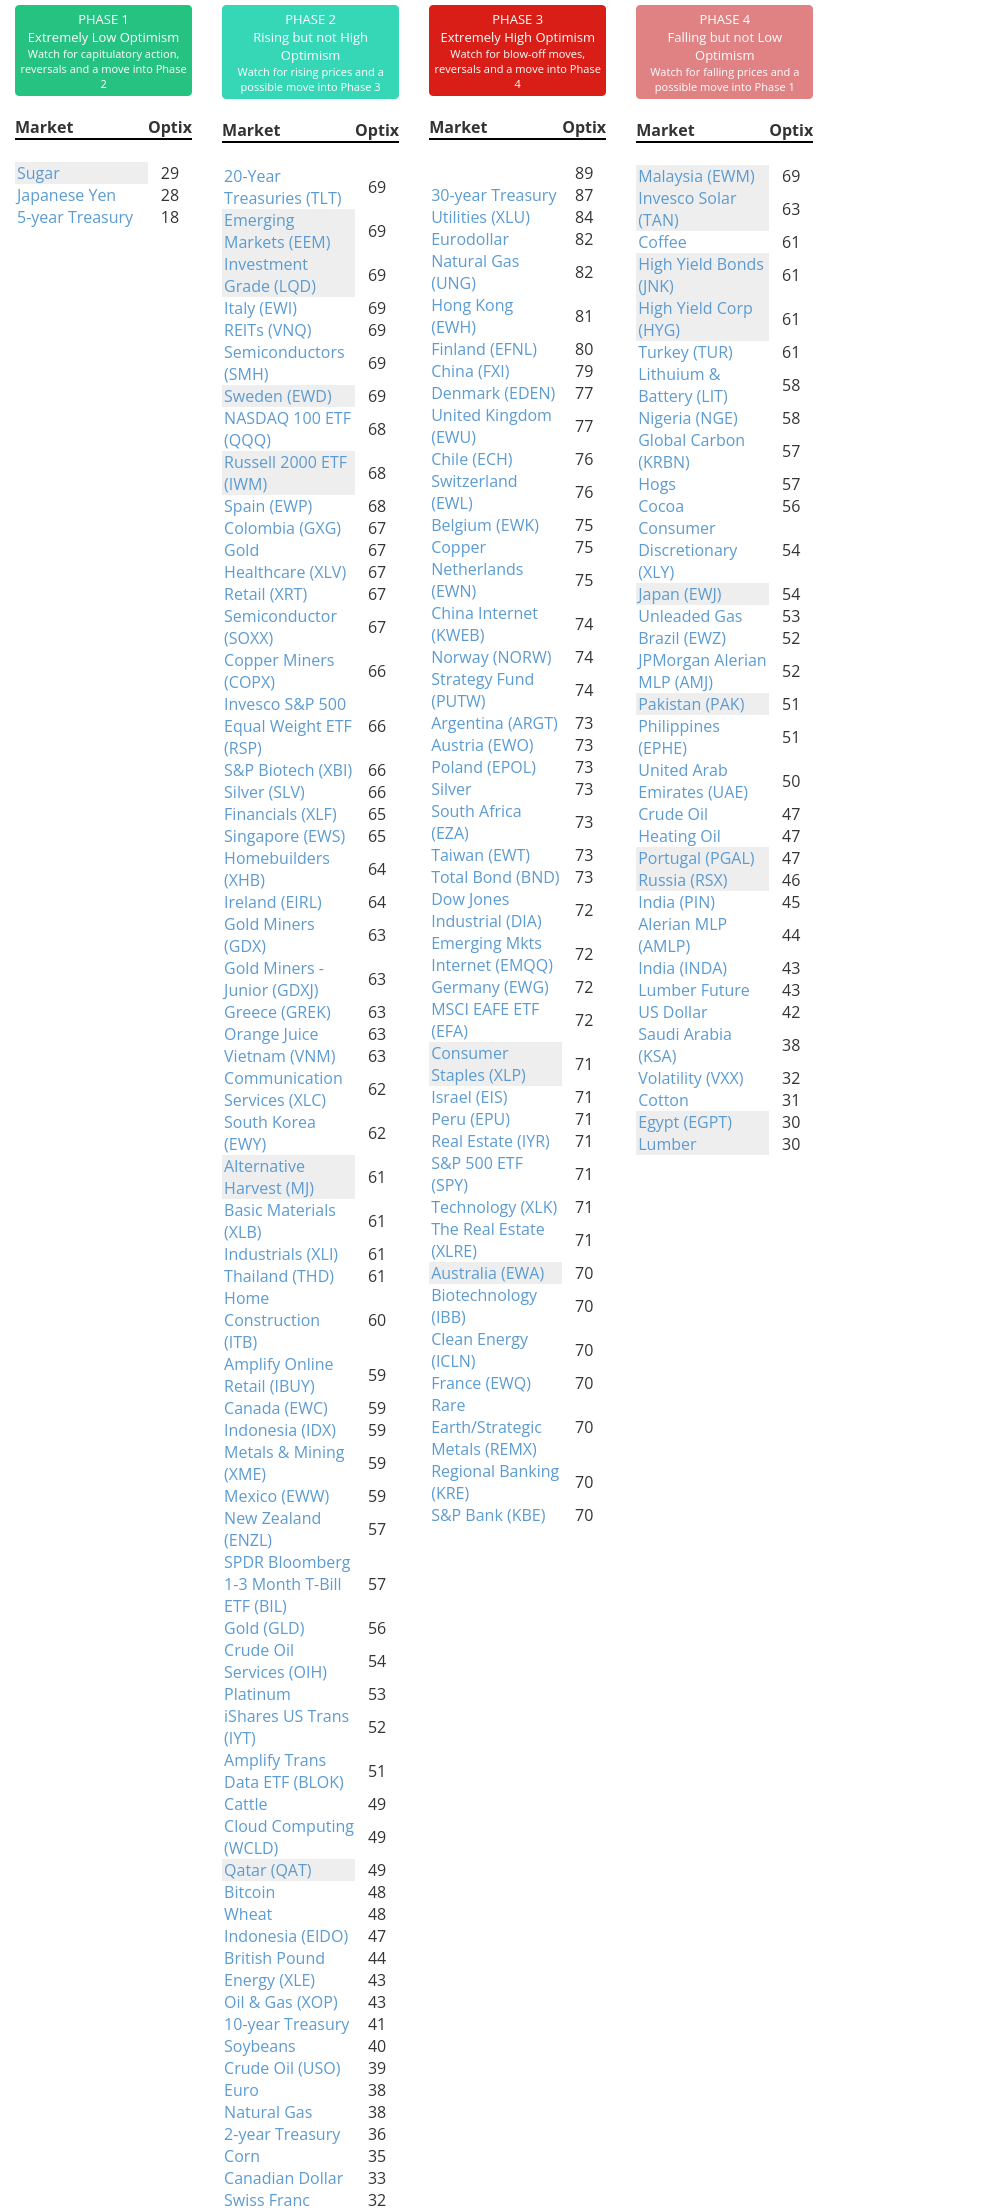
Phase Table
Ranks
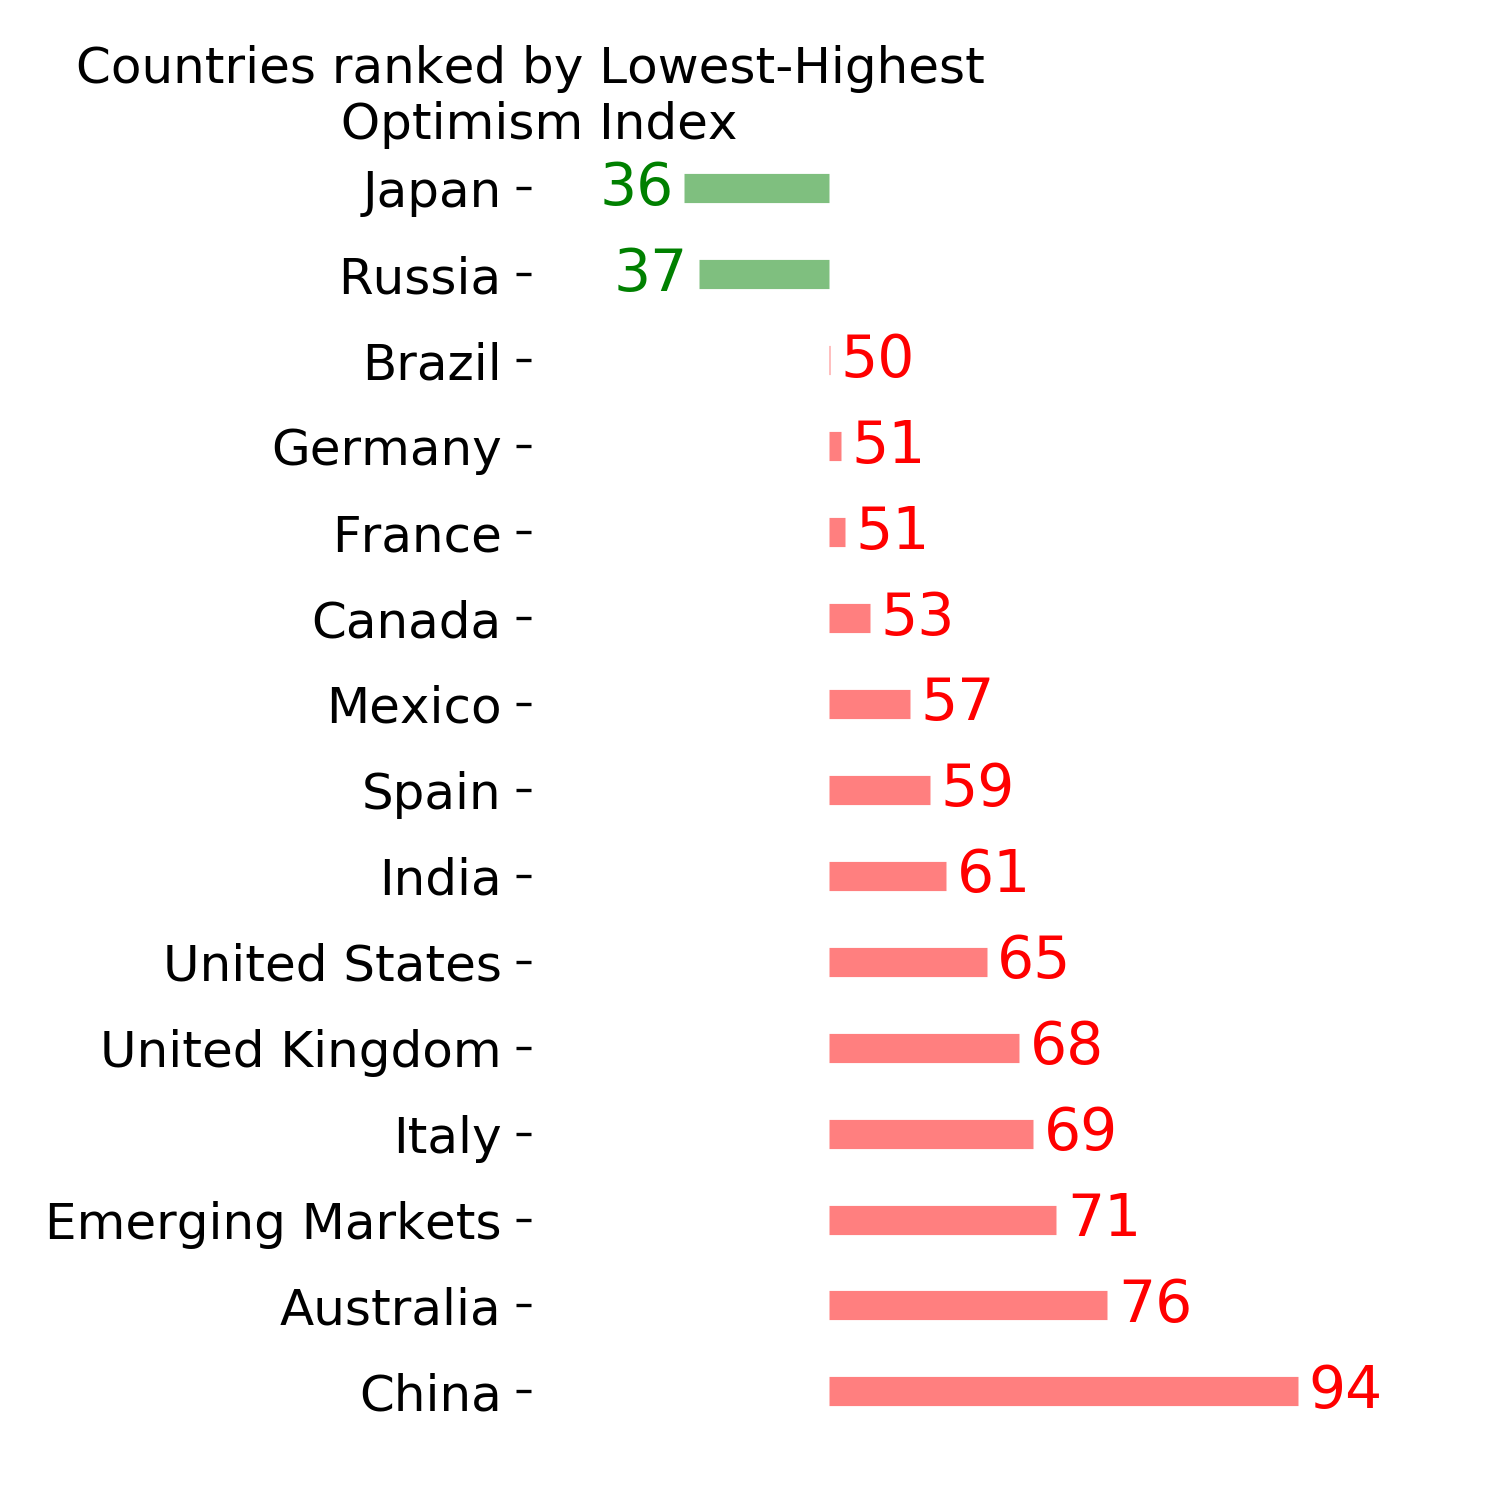
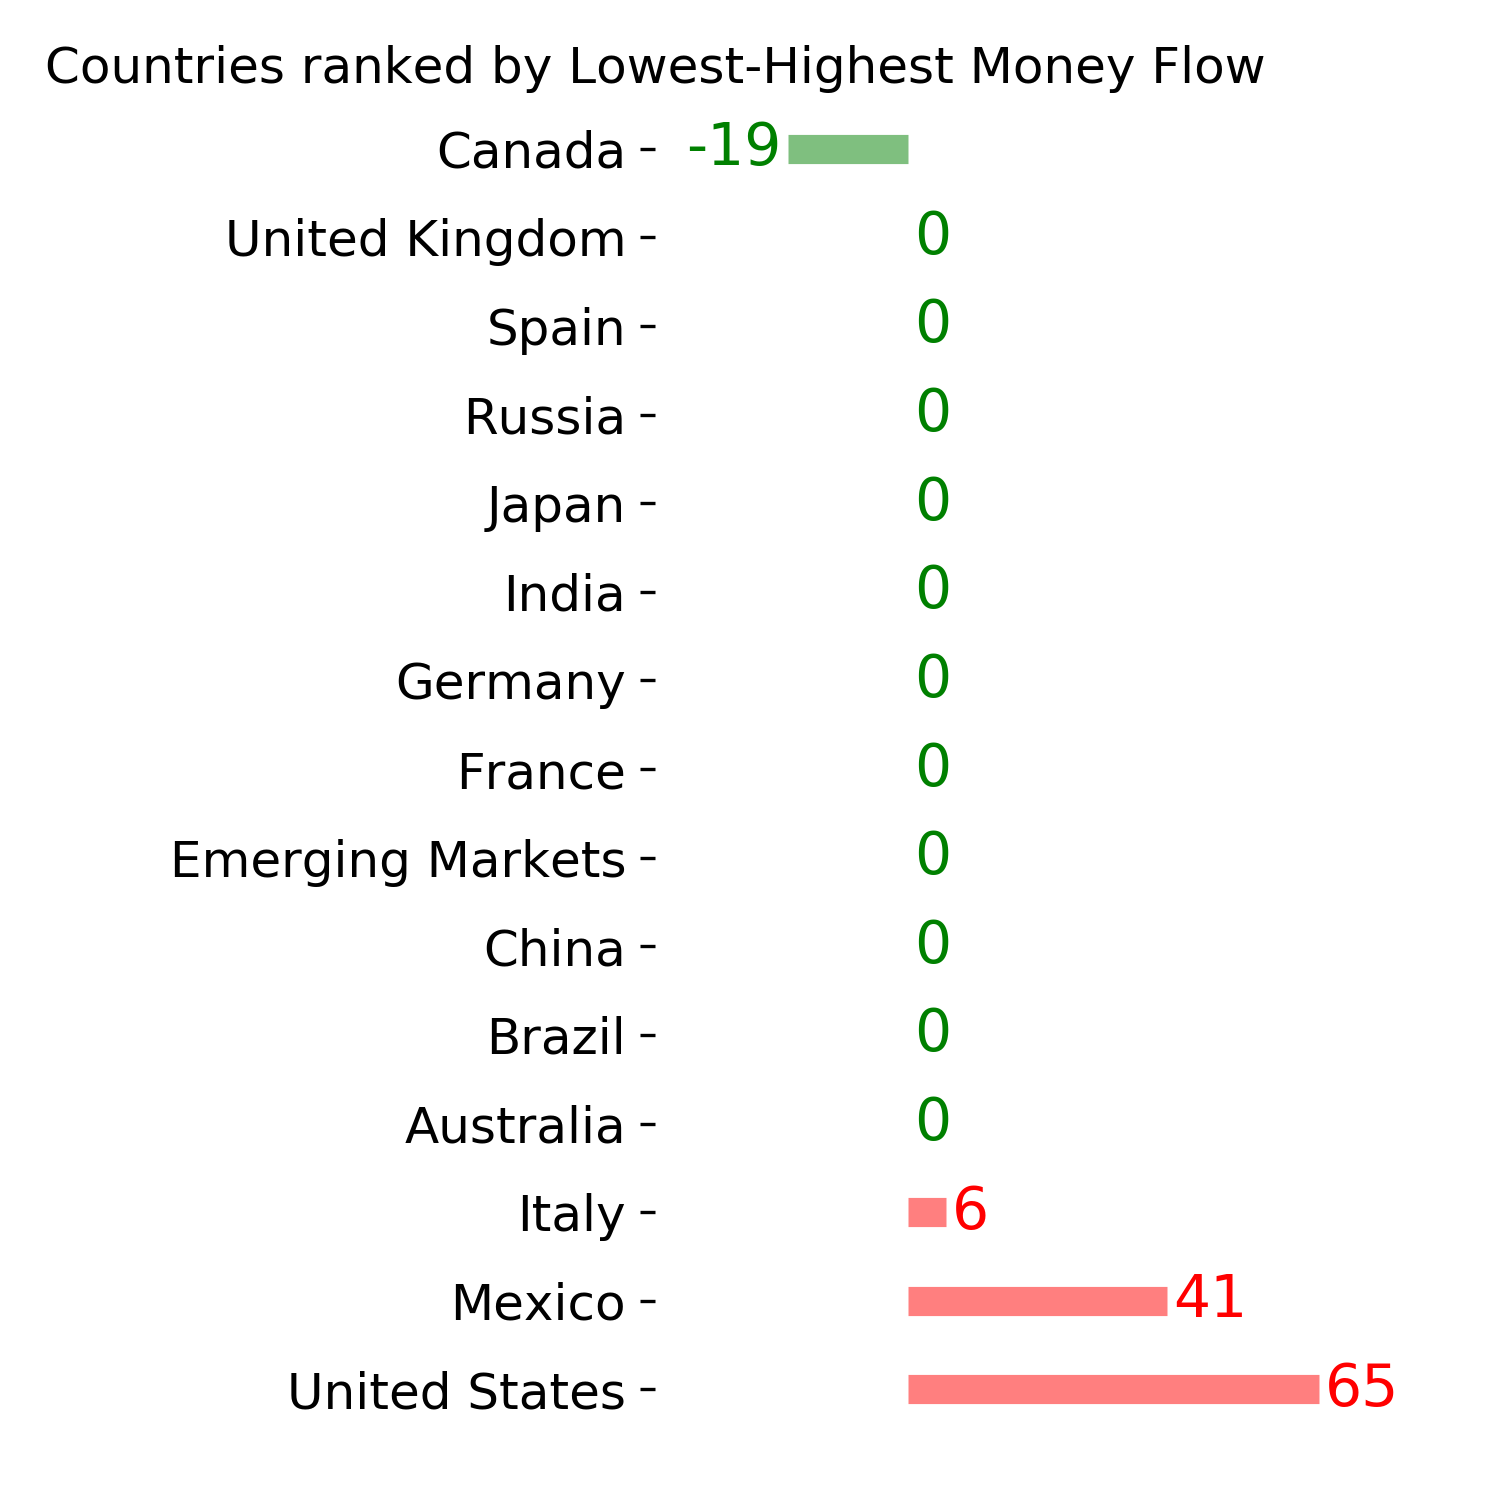
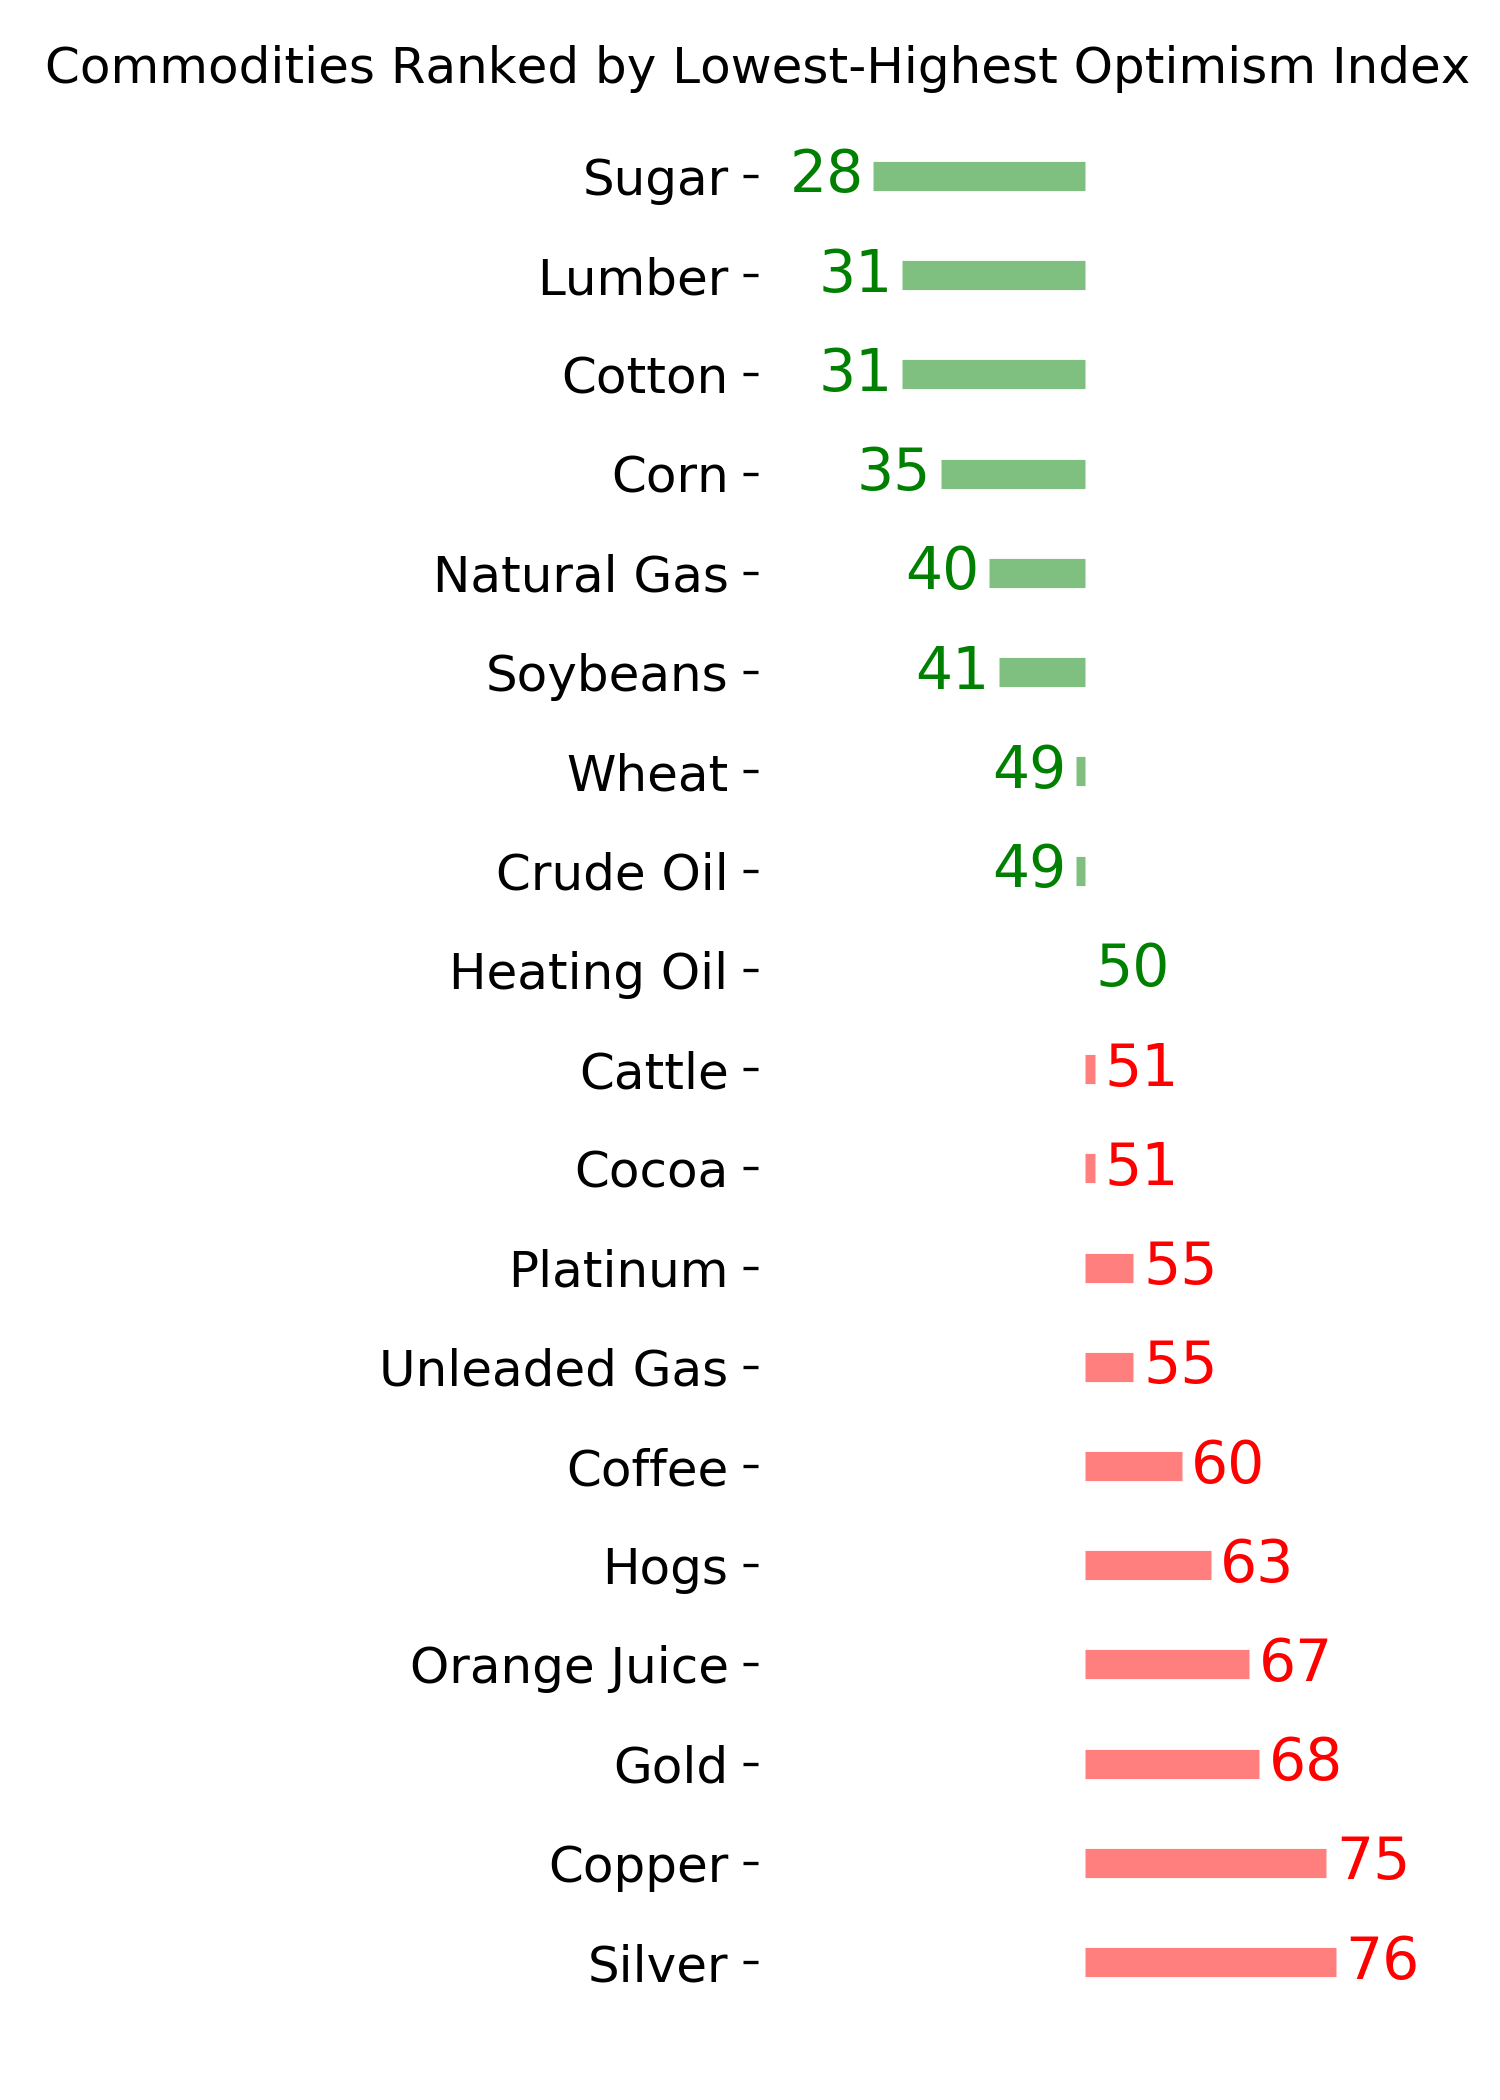
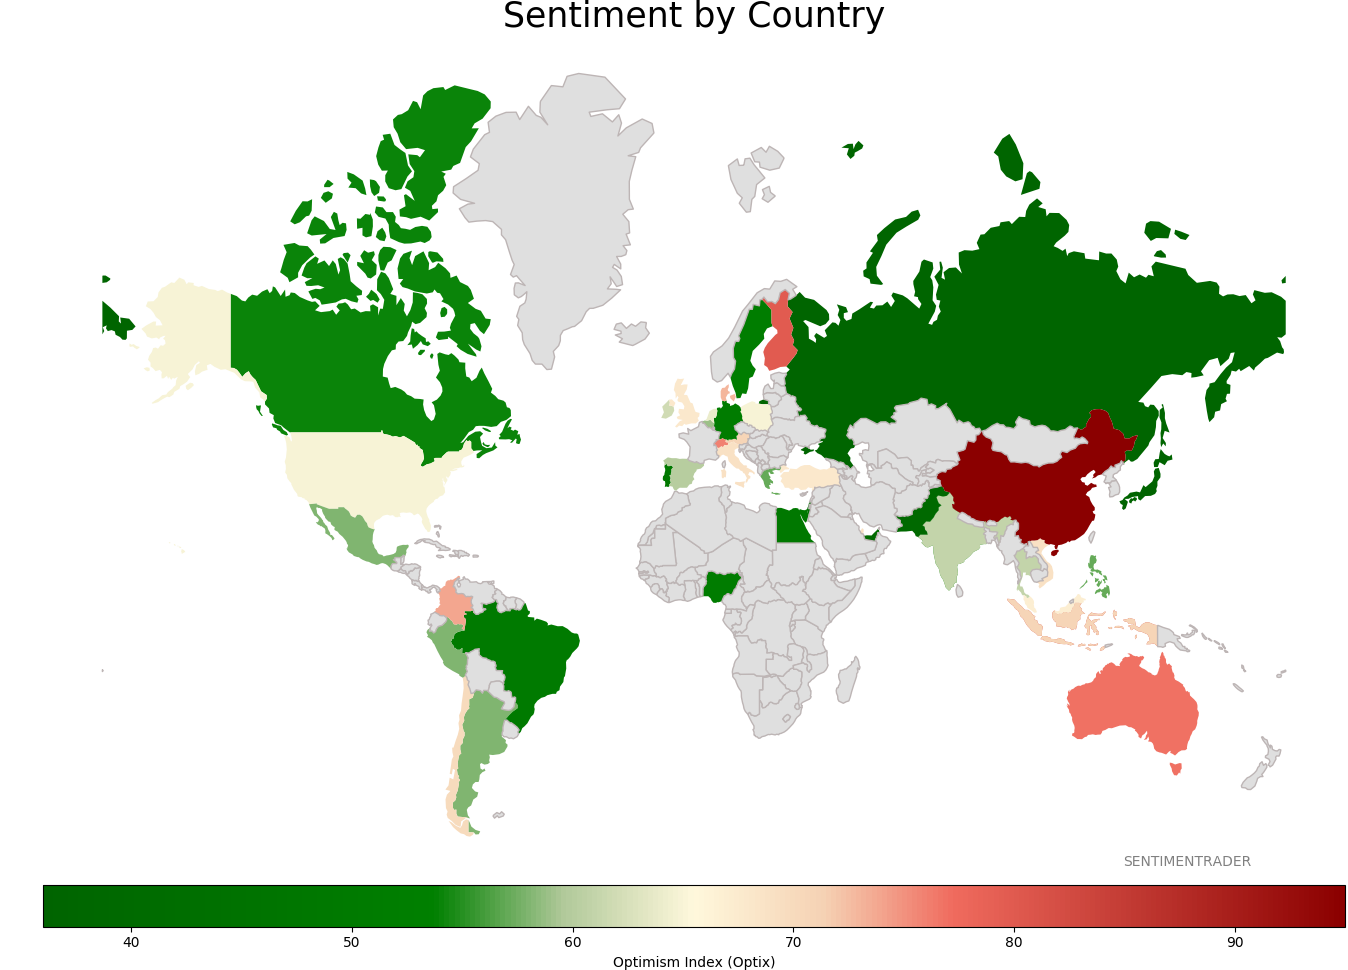
Sentiment Around The World
Optimism Index Thumbnails
|
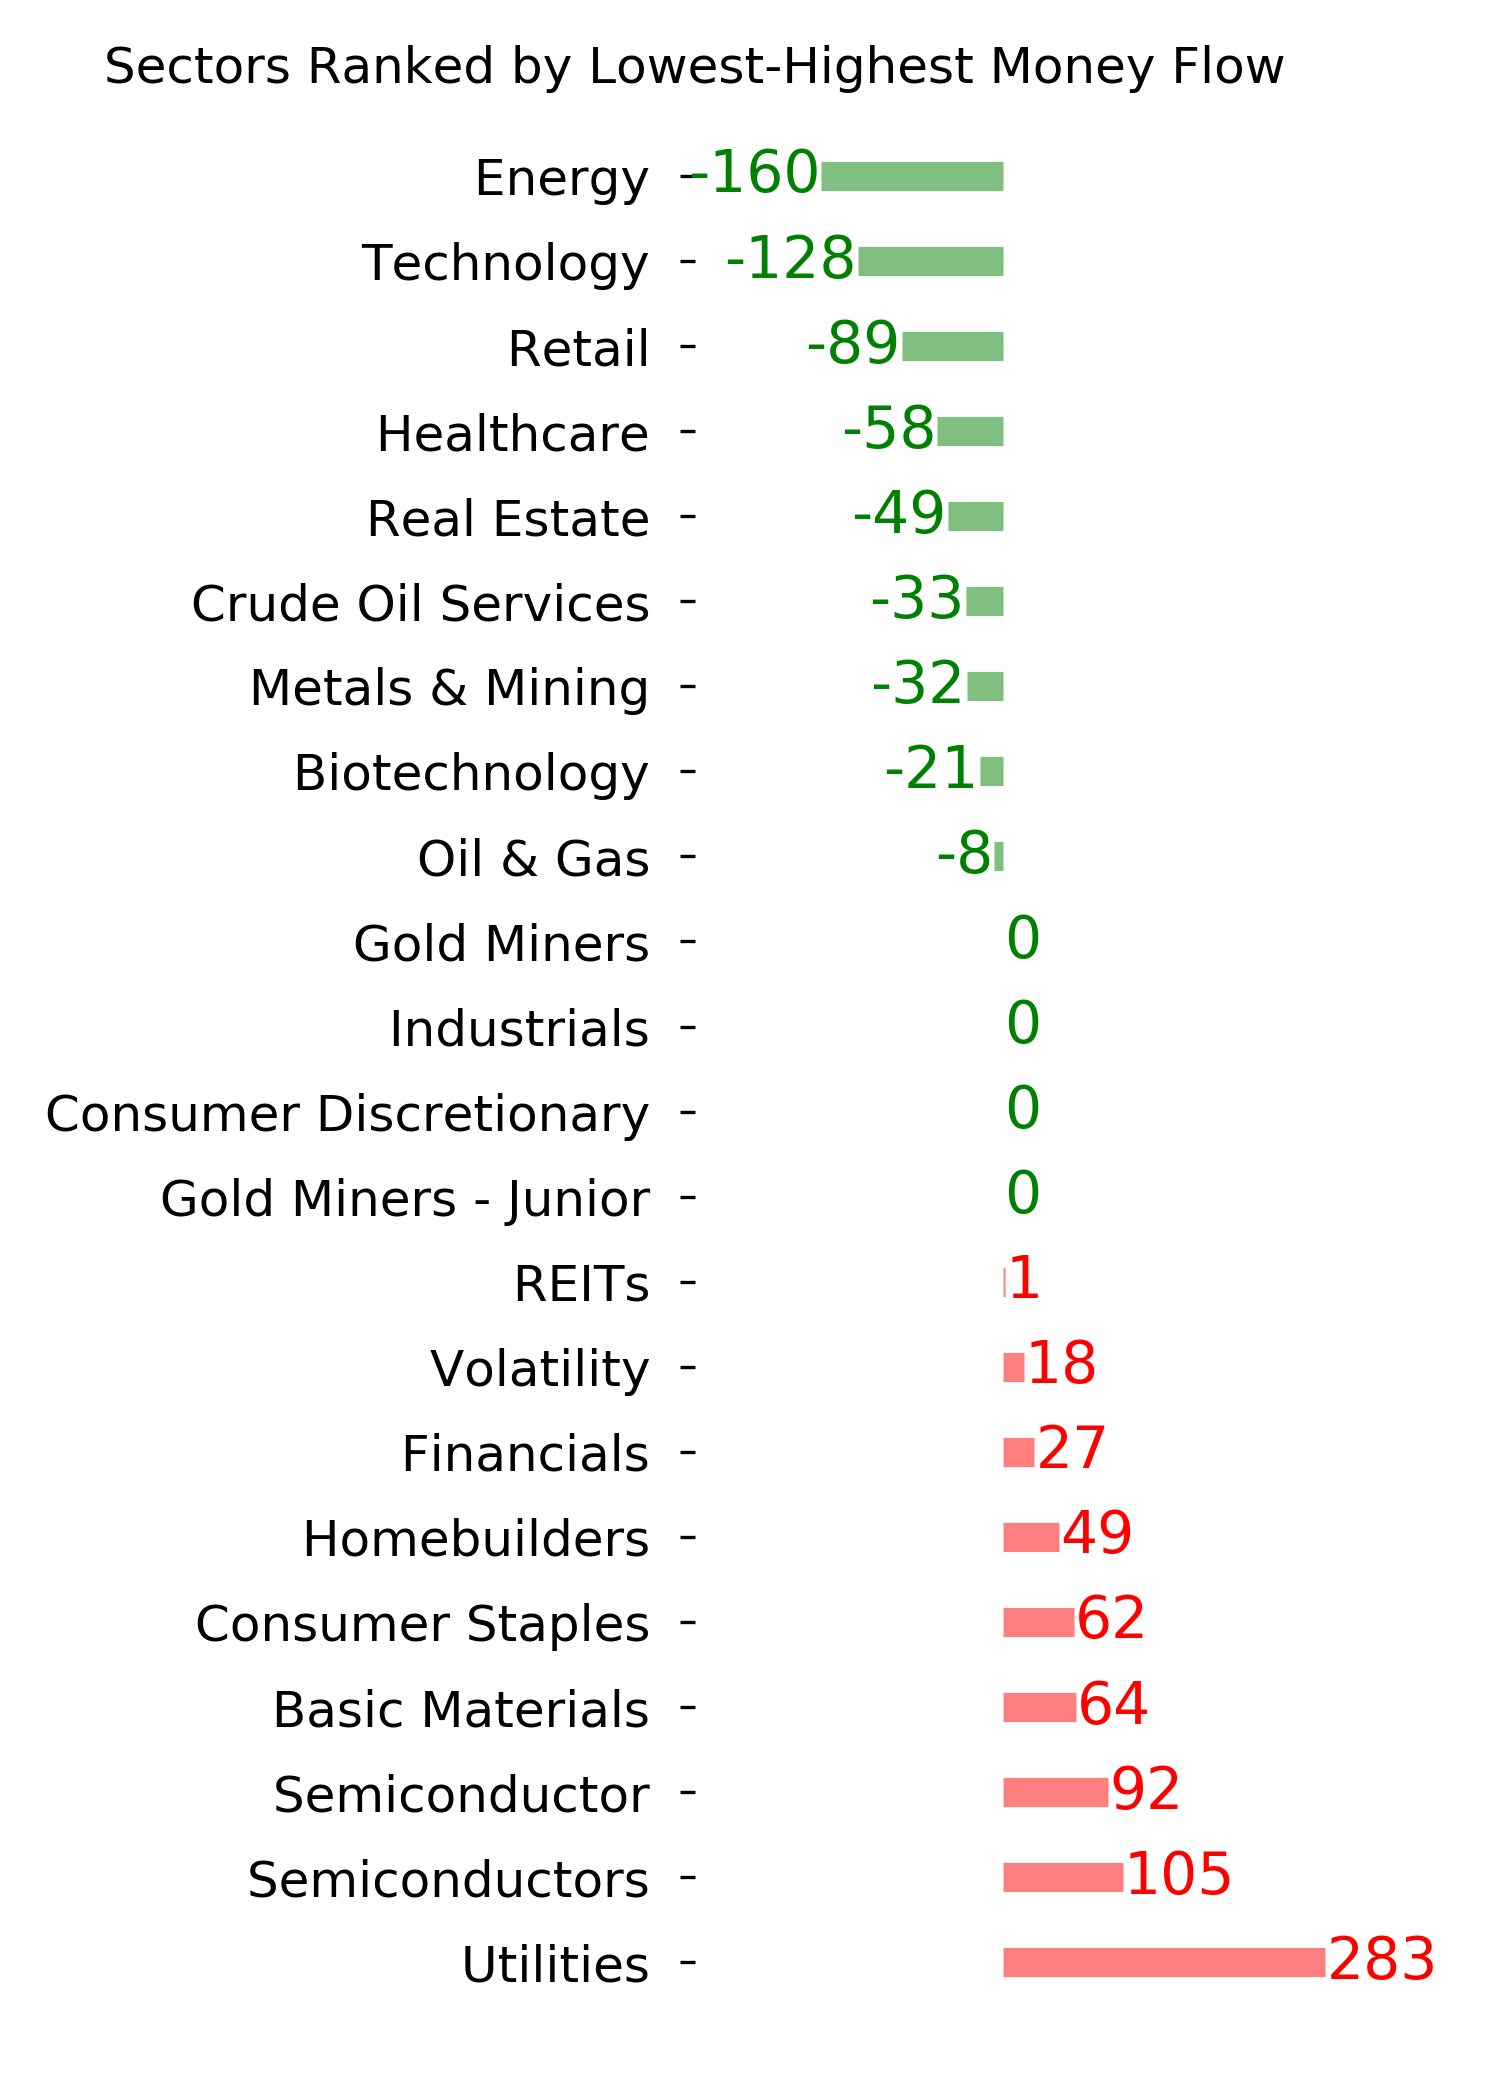
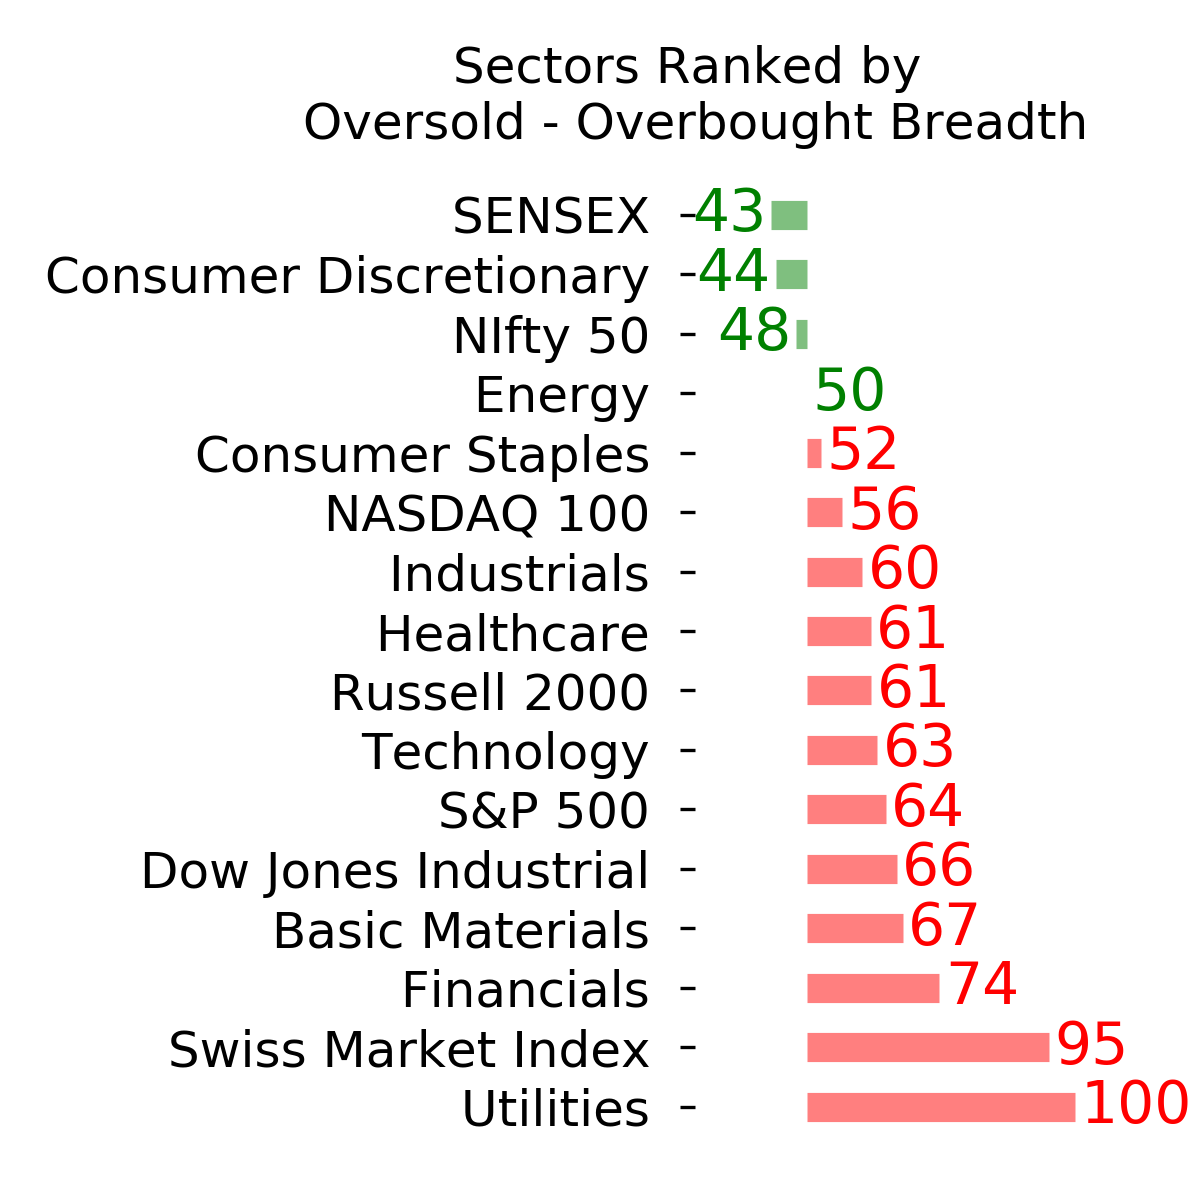
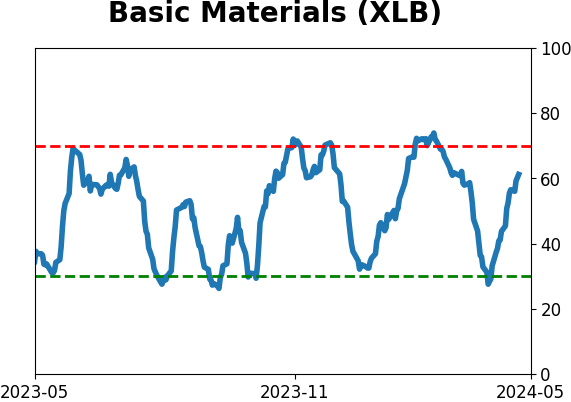
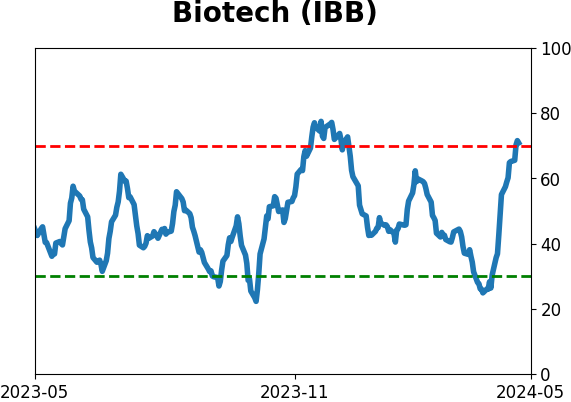
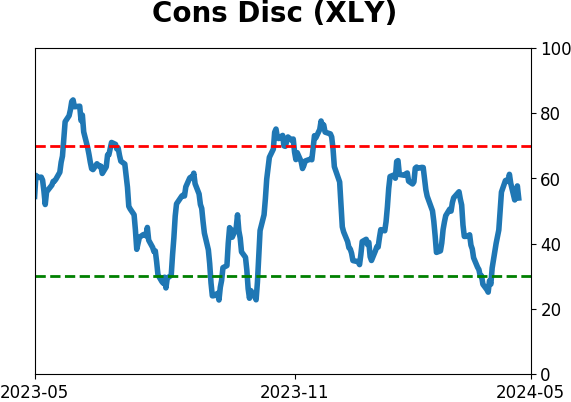
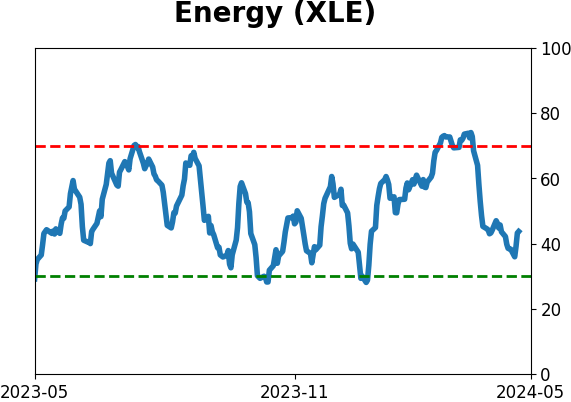
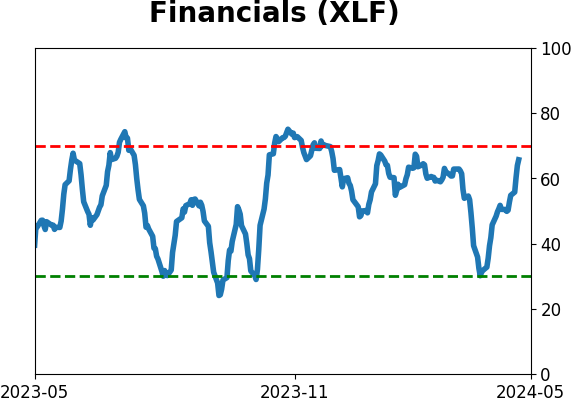
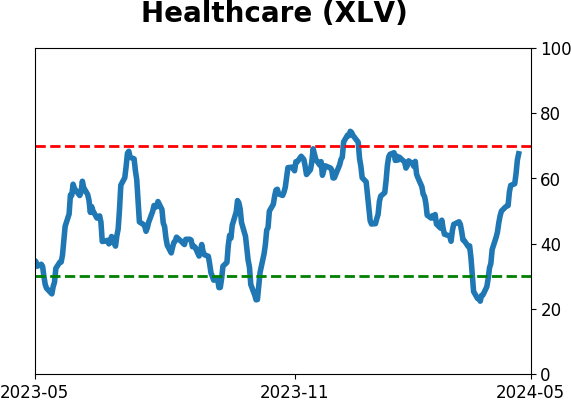
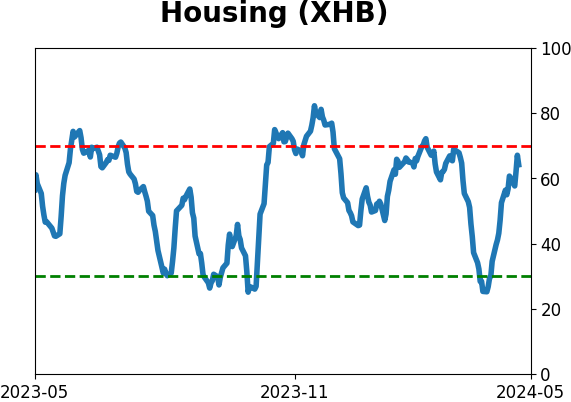
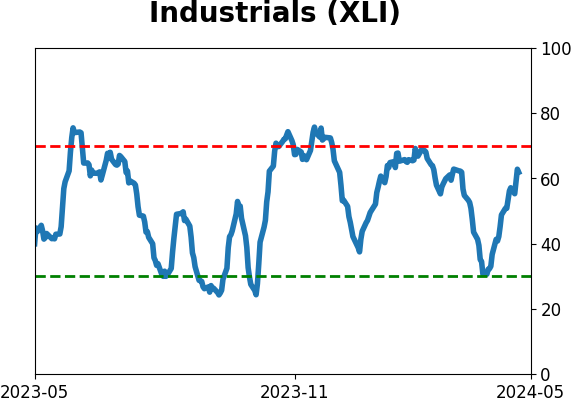
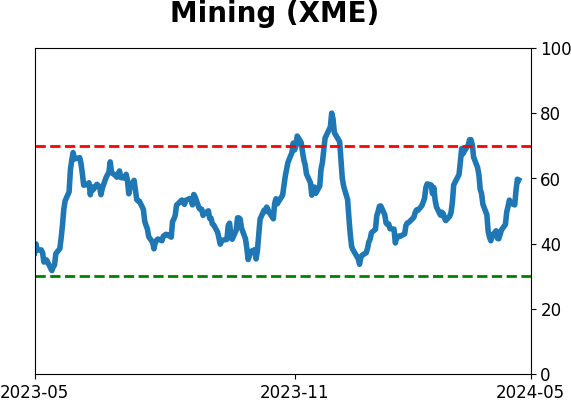
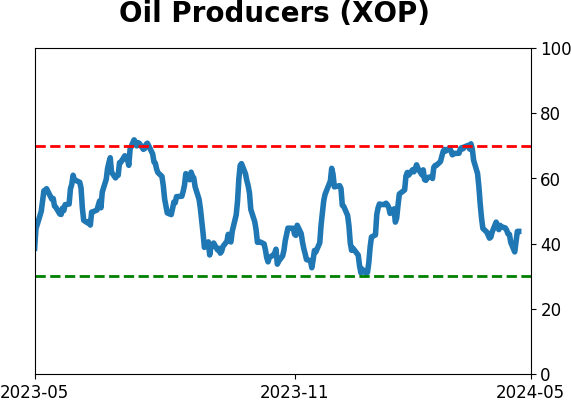
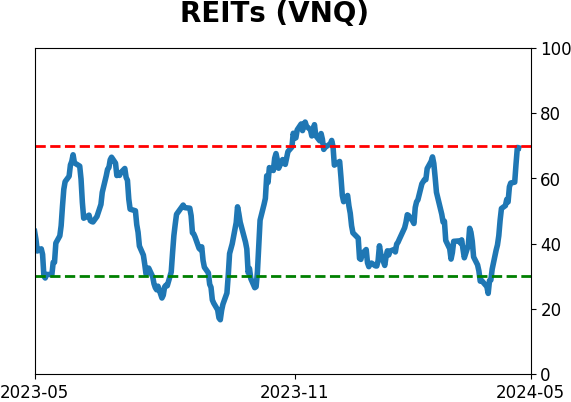
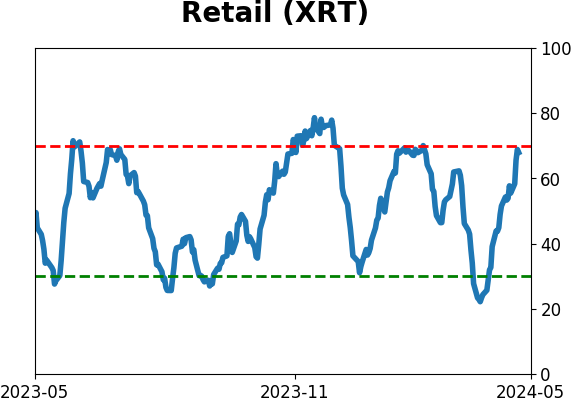
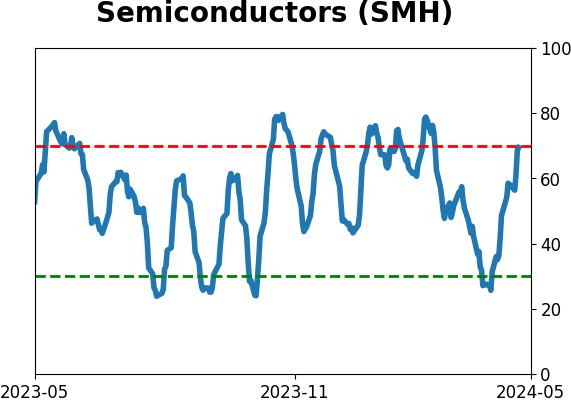
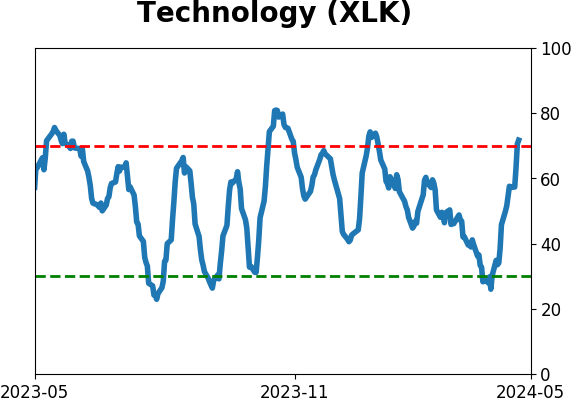
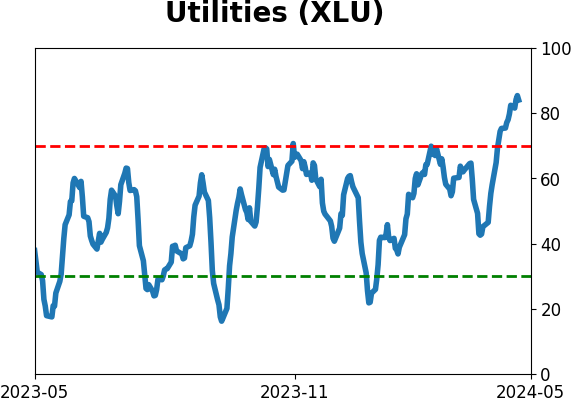
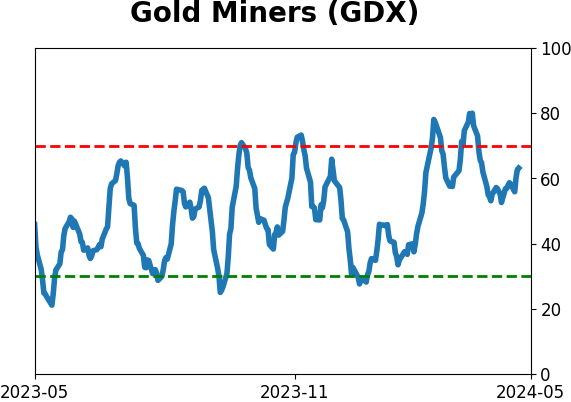
Sector ETF's - 10-Day Moving Average
|
|
|
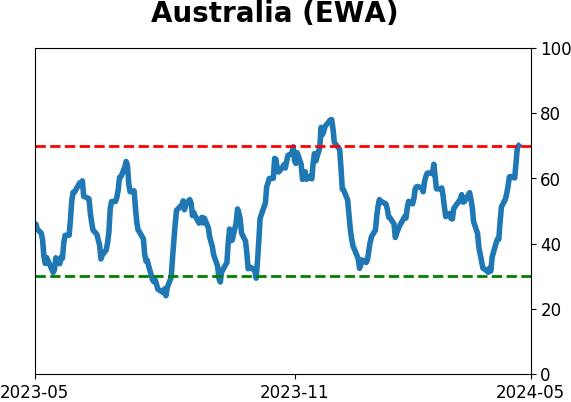
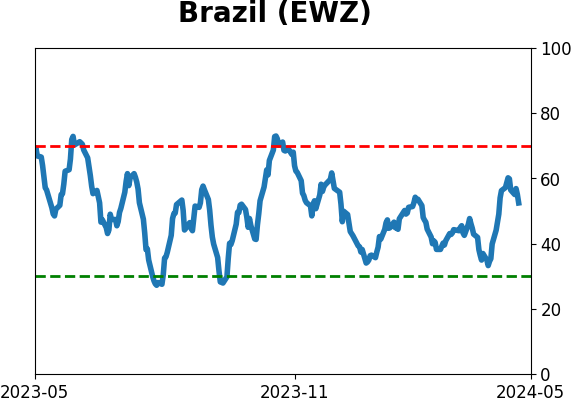
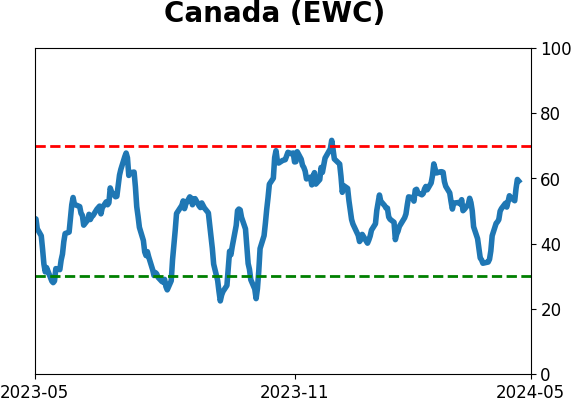
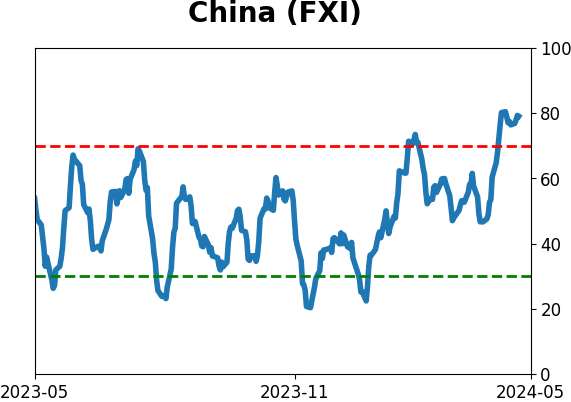
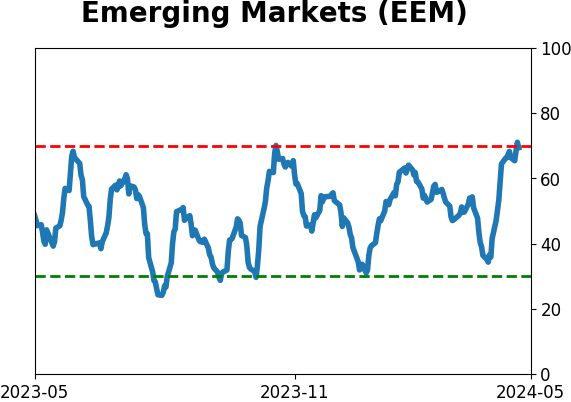
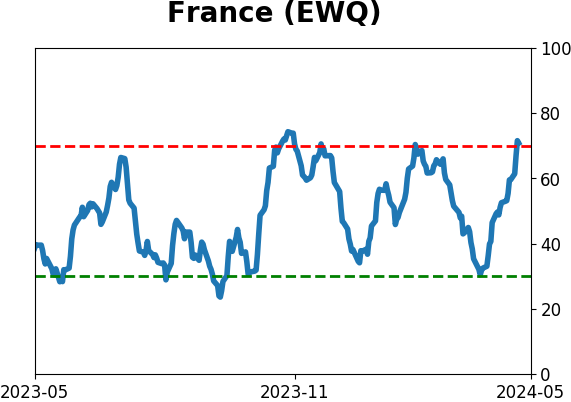
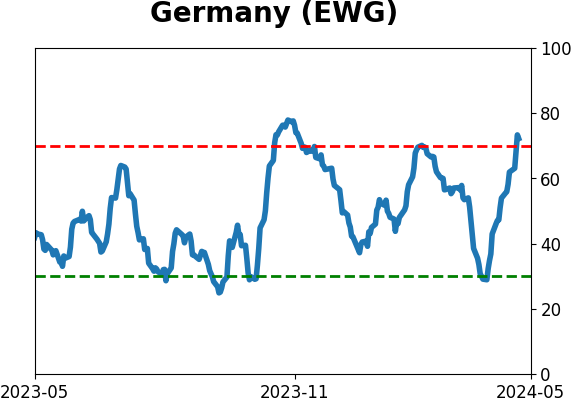
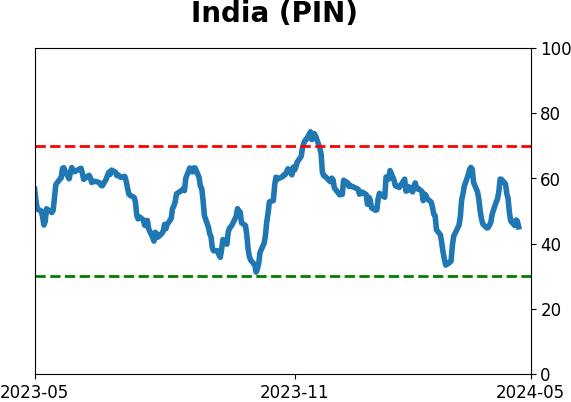
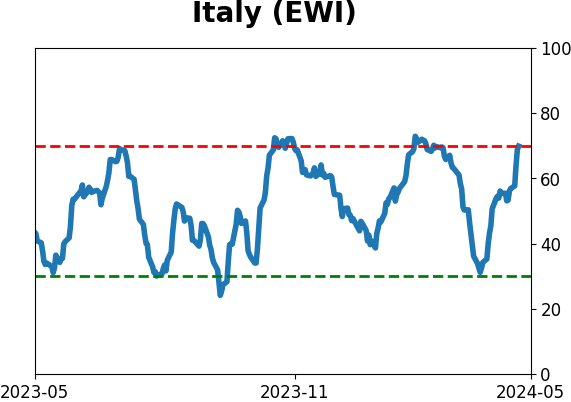
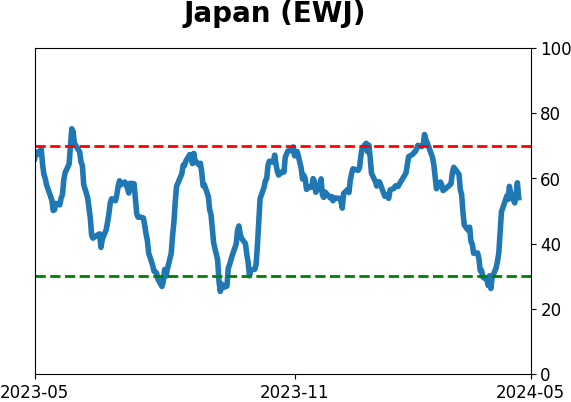
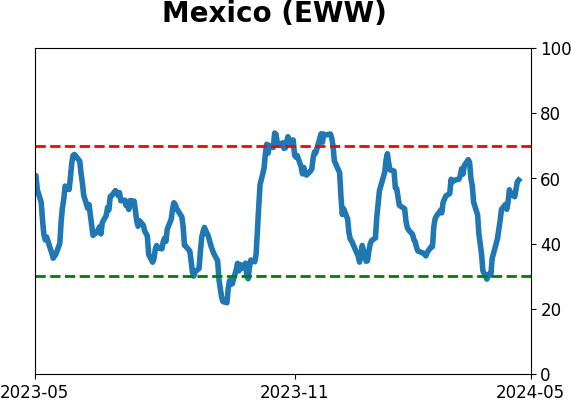
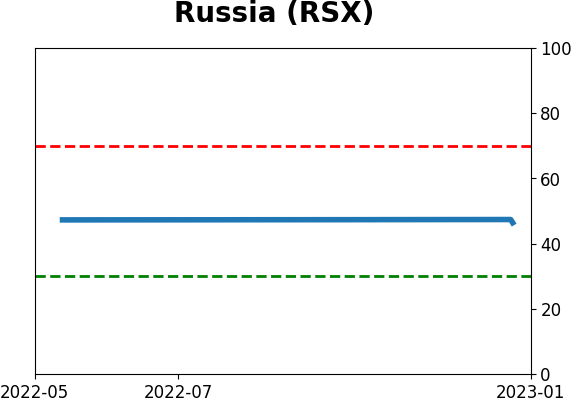
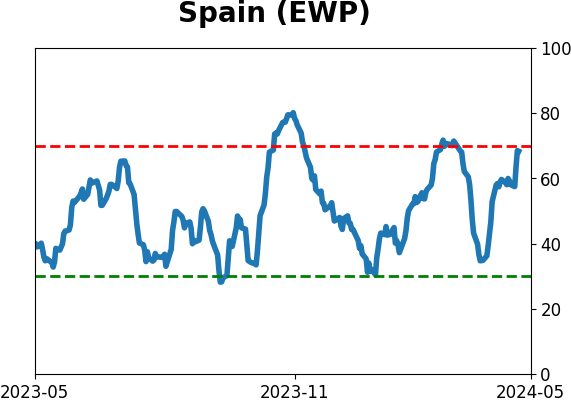
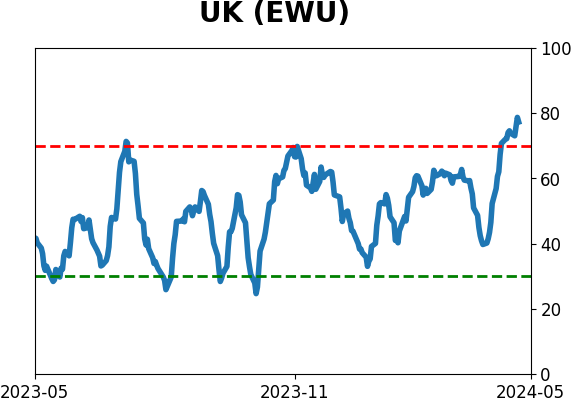
Country ETF's - 10-Day Moving Average
|
|
|
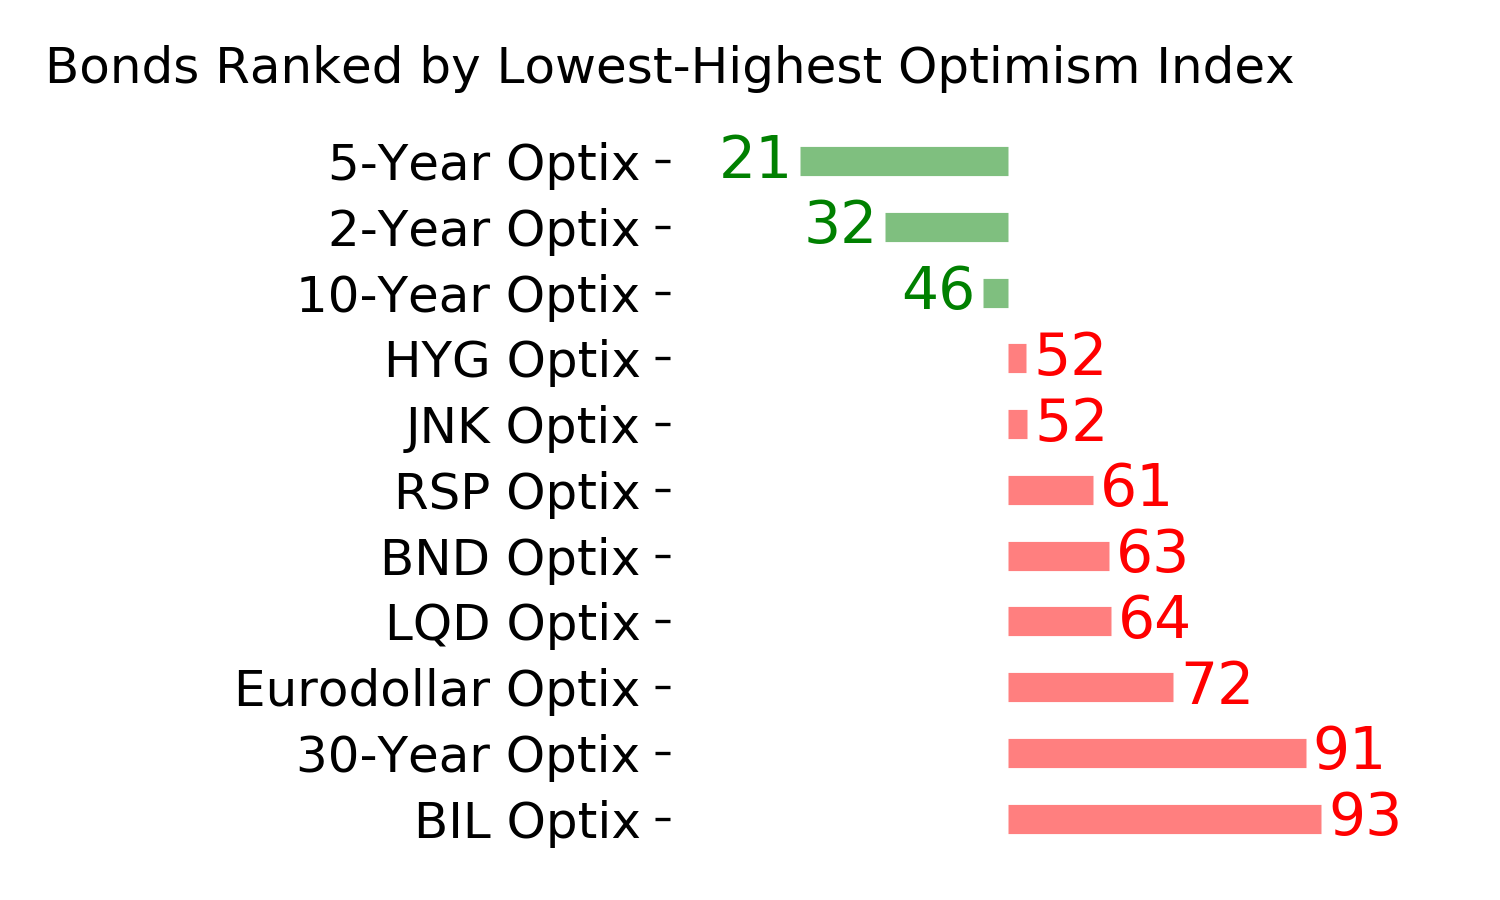
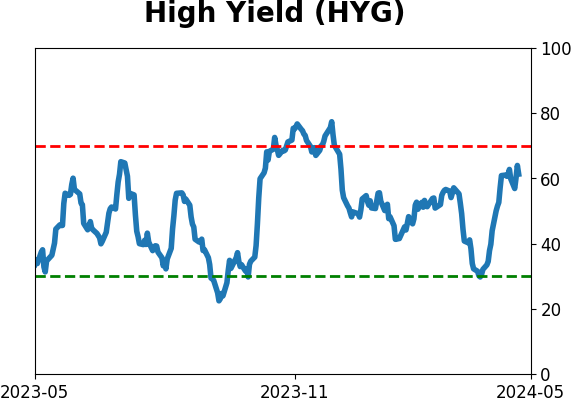
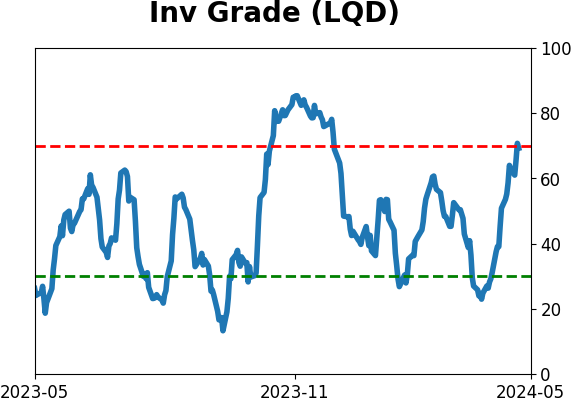
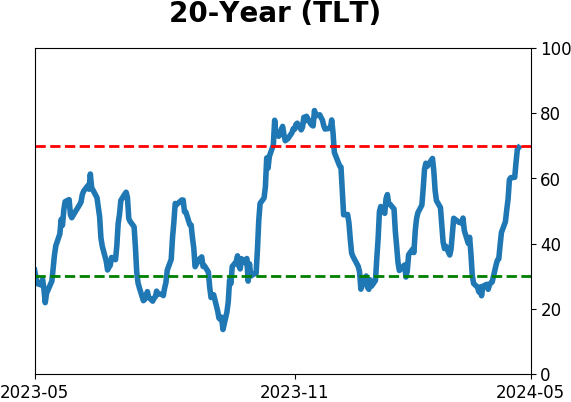
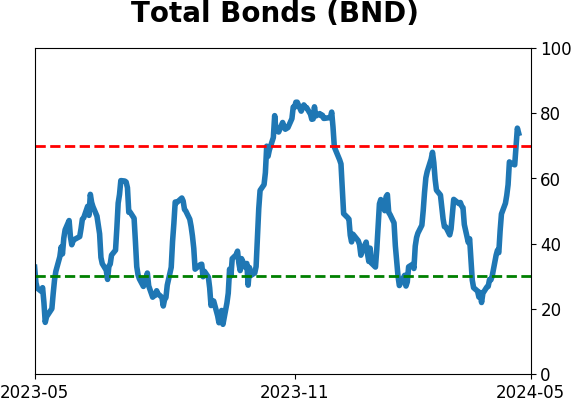
Bond ETF's - 10-Day Moving Average
|
|
|
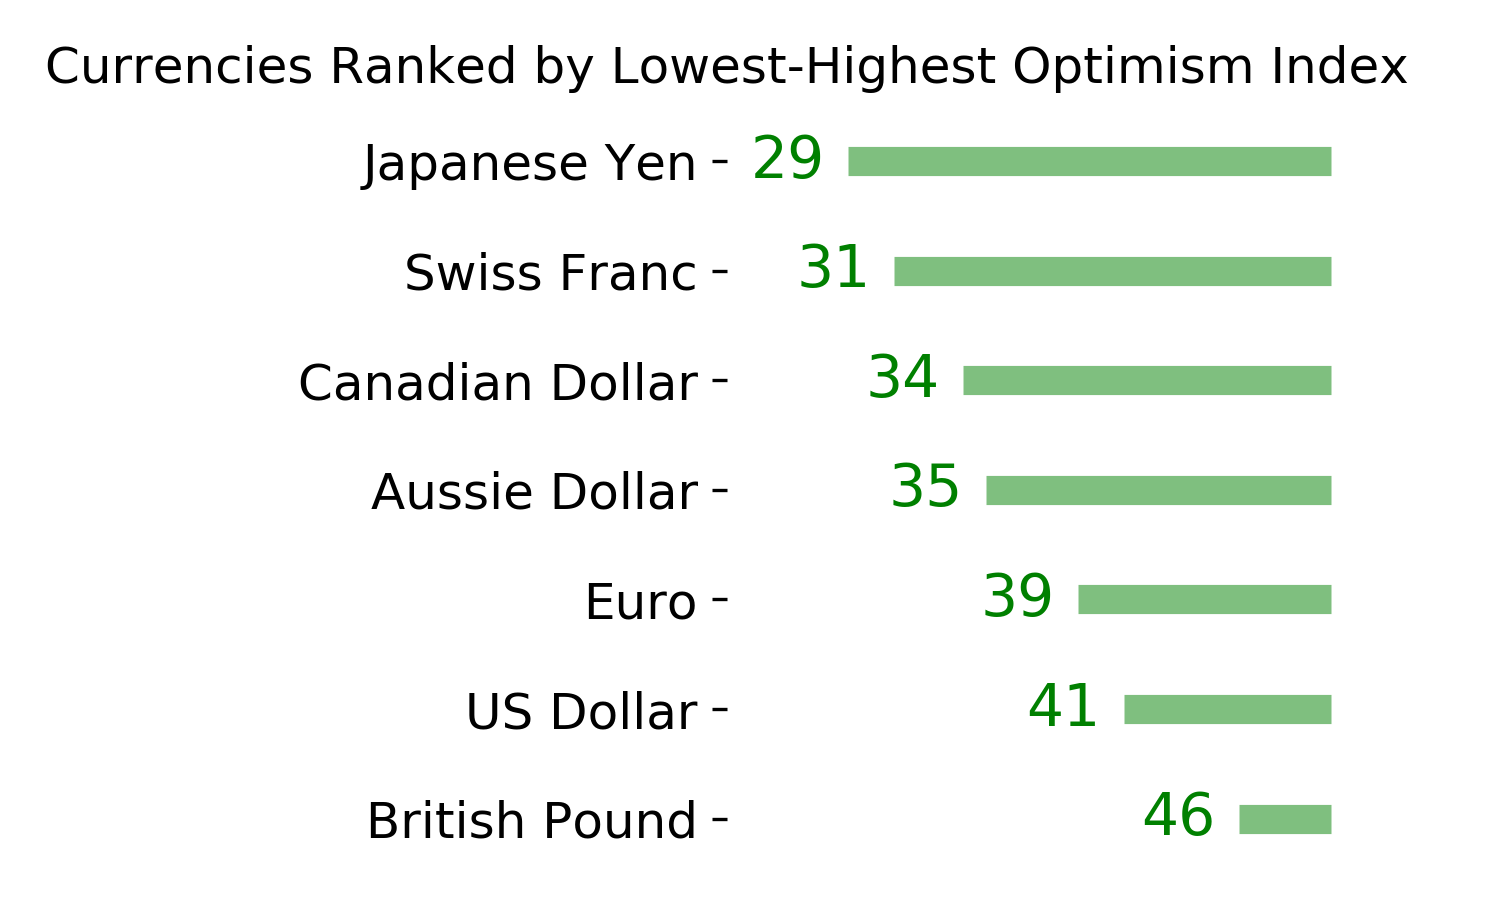
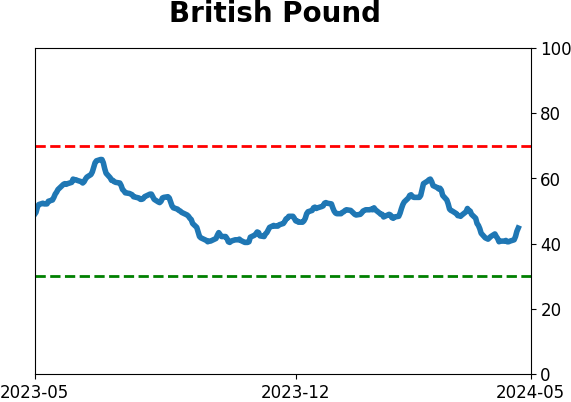
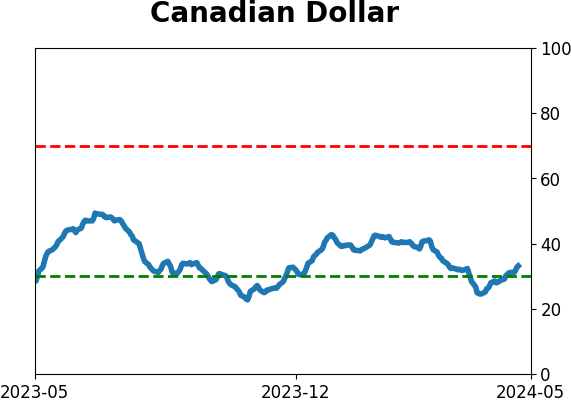
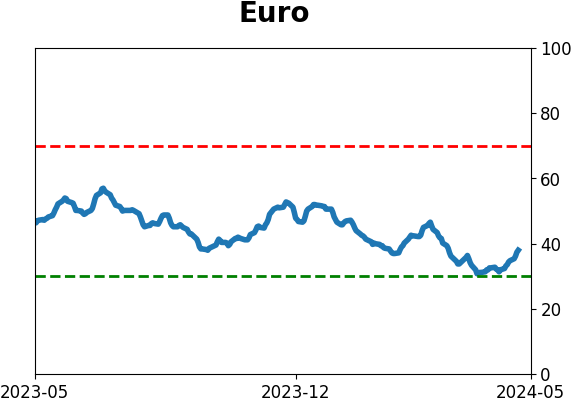
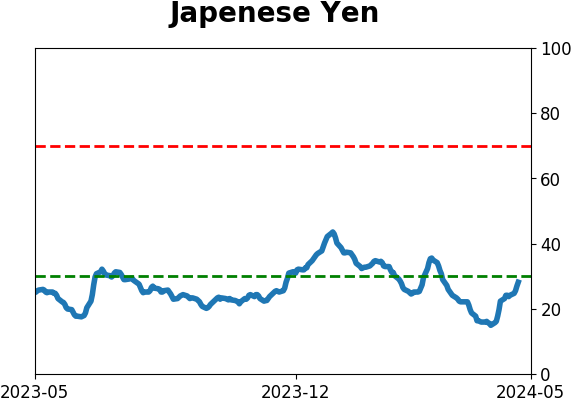
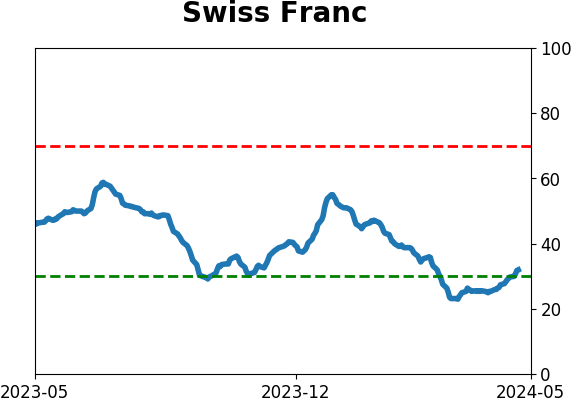
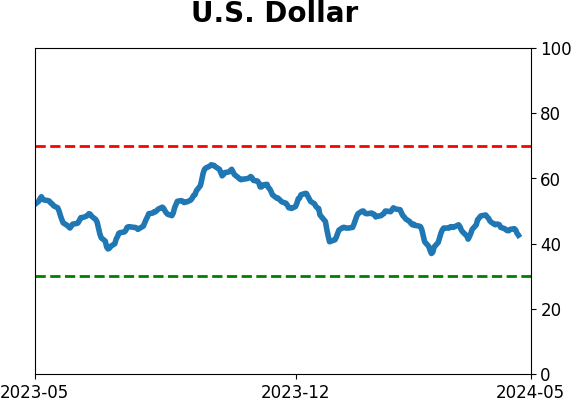
Currency ETF's - 5-Day Moving Average
|
|
|
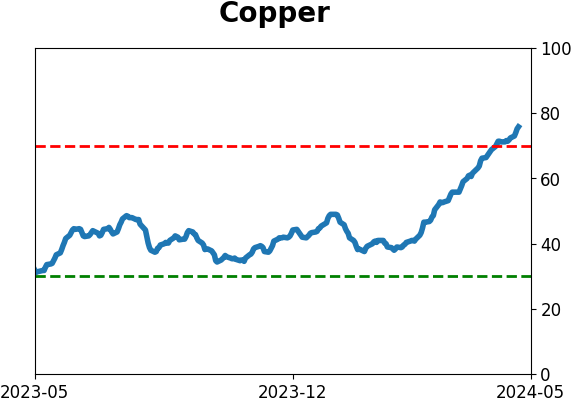
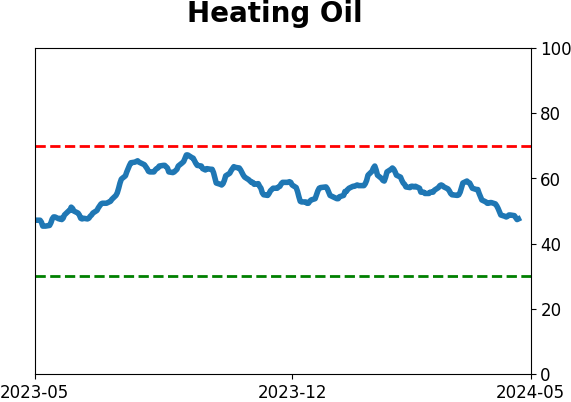
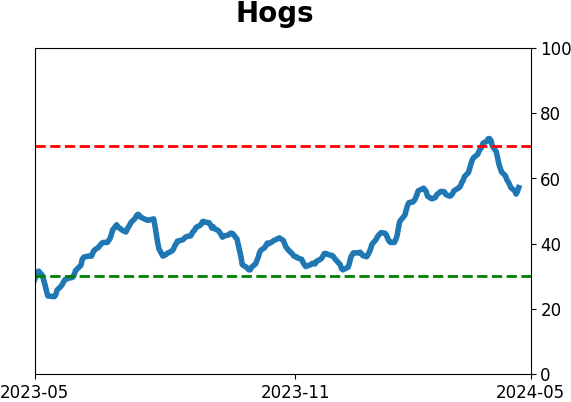
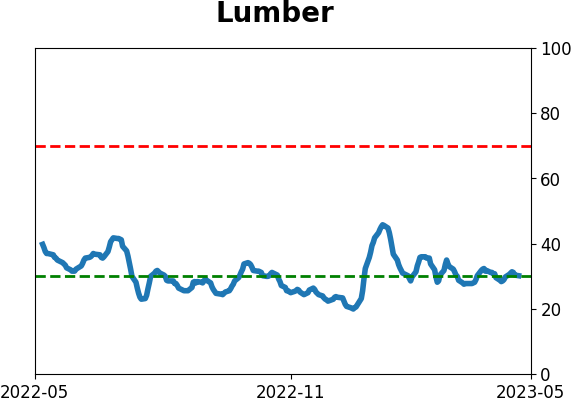
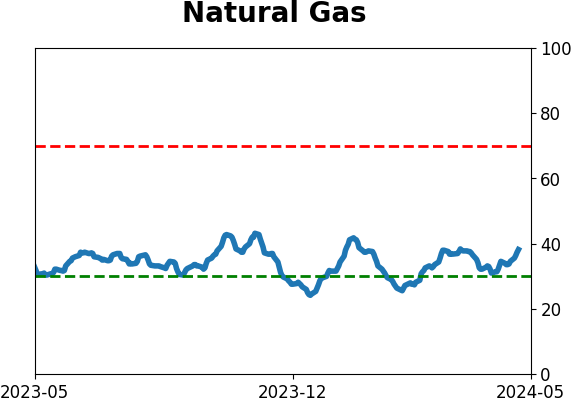
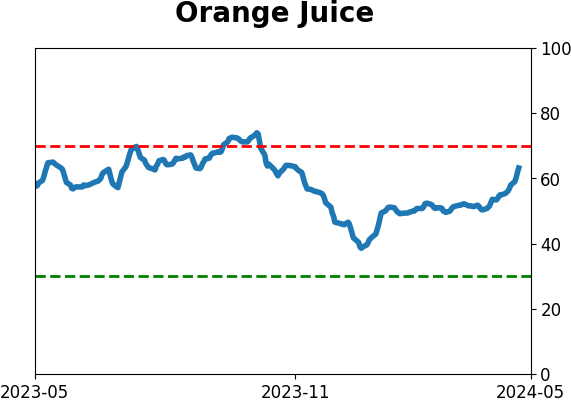
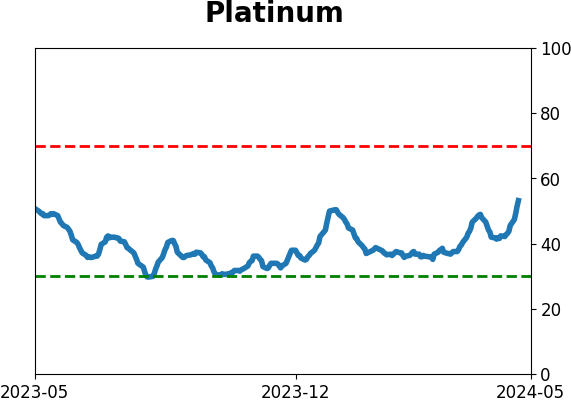
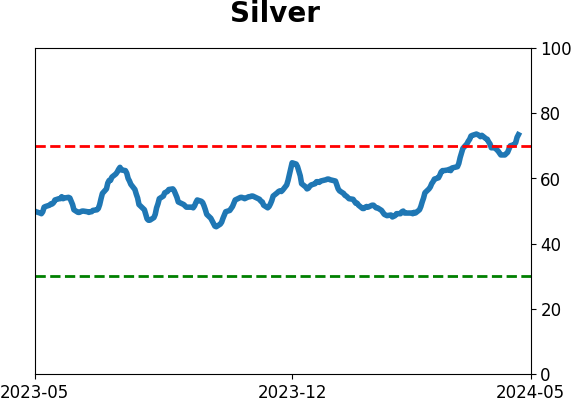
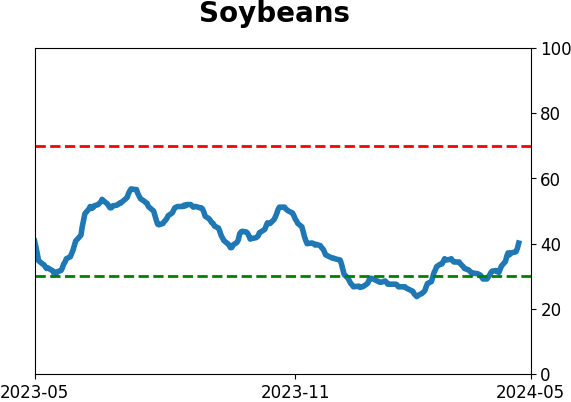
Commodity ETF's - 5-Day Moving Average
|
|