Headlines
|
|
Gamma Exposure and corrections:
Small options traders spent more money on put protection than they did on speculative calls, for one of the few times in 22 years. Gamma exposure among dealers is extreme, which normally means buying pressure will increase. After so many stocks fell into corrections and bear markets, Friday's thrust may have changed their mindset.
|
Smart / Dumb Money Confidence
|
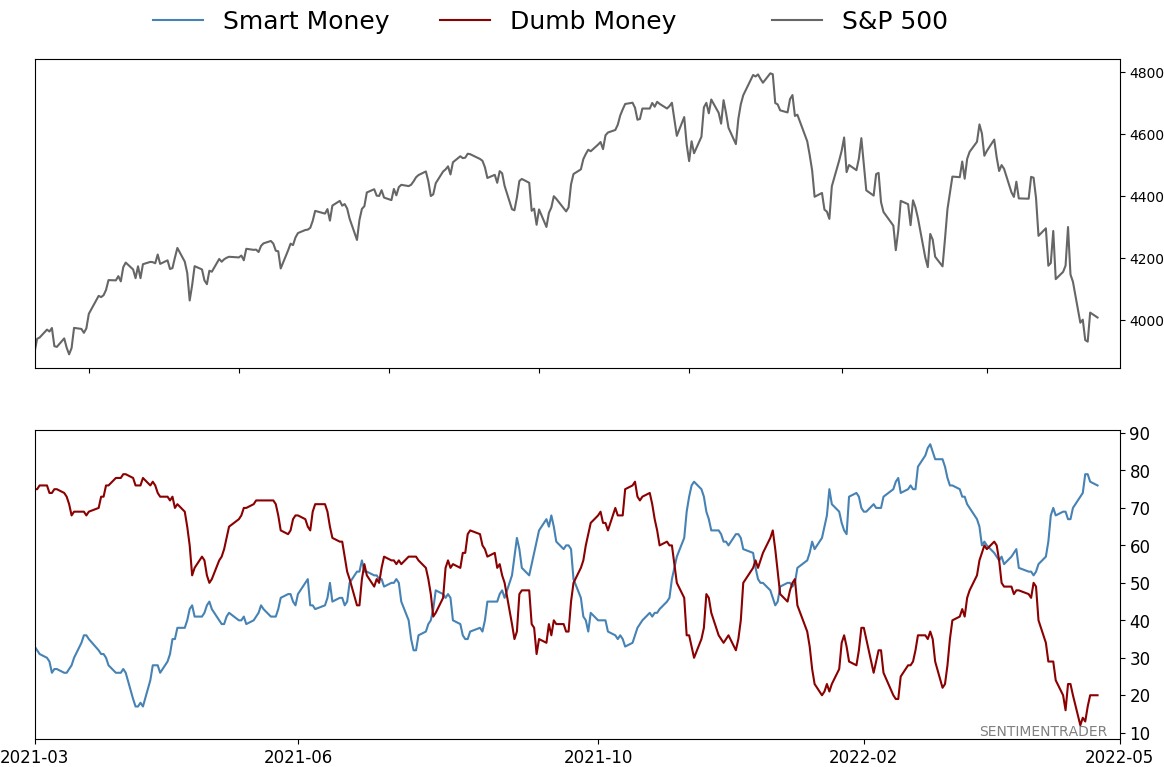
Smart Money Confidence: 76%
Dumb Money Confidence: 20%
|
|
Risk Levels
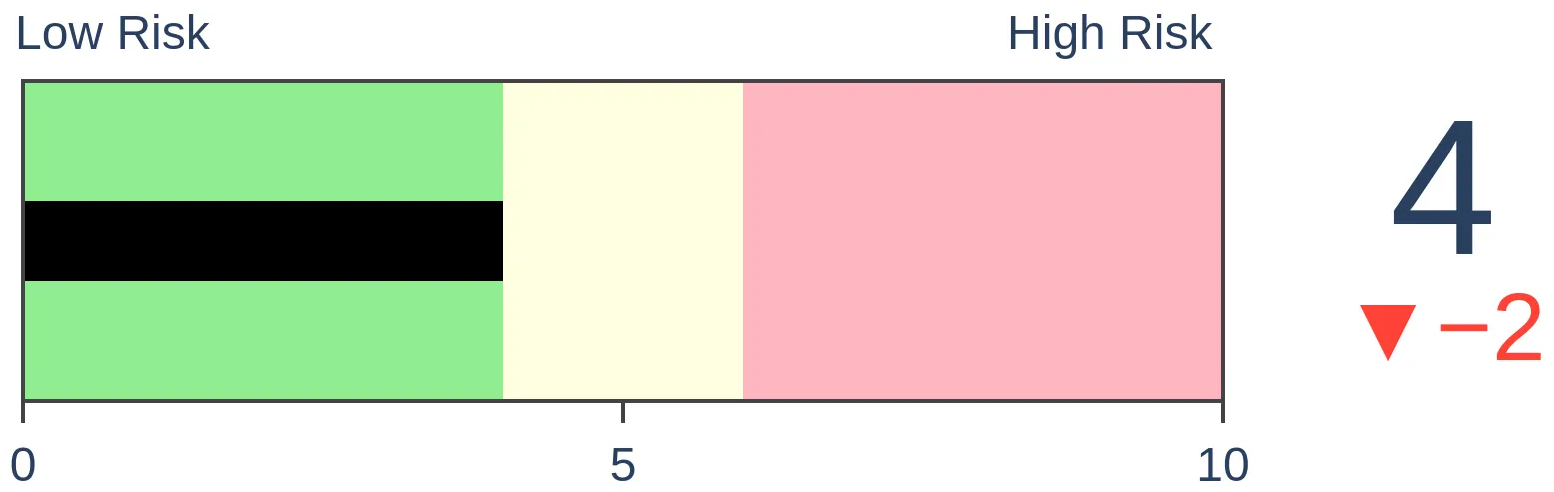
Stocks Short-Term
|
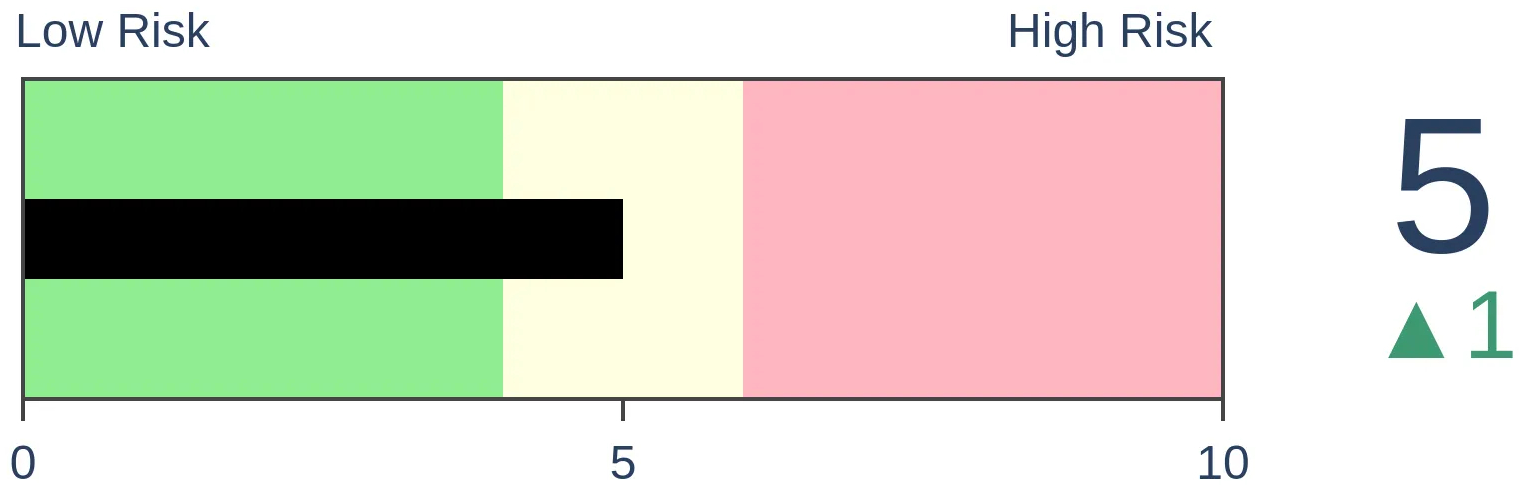
Stocks Medium-Term
|
|
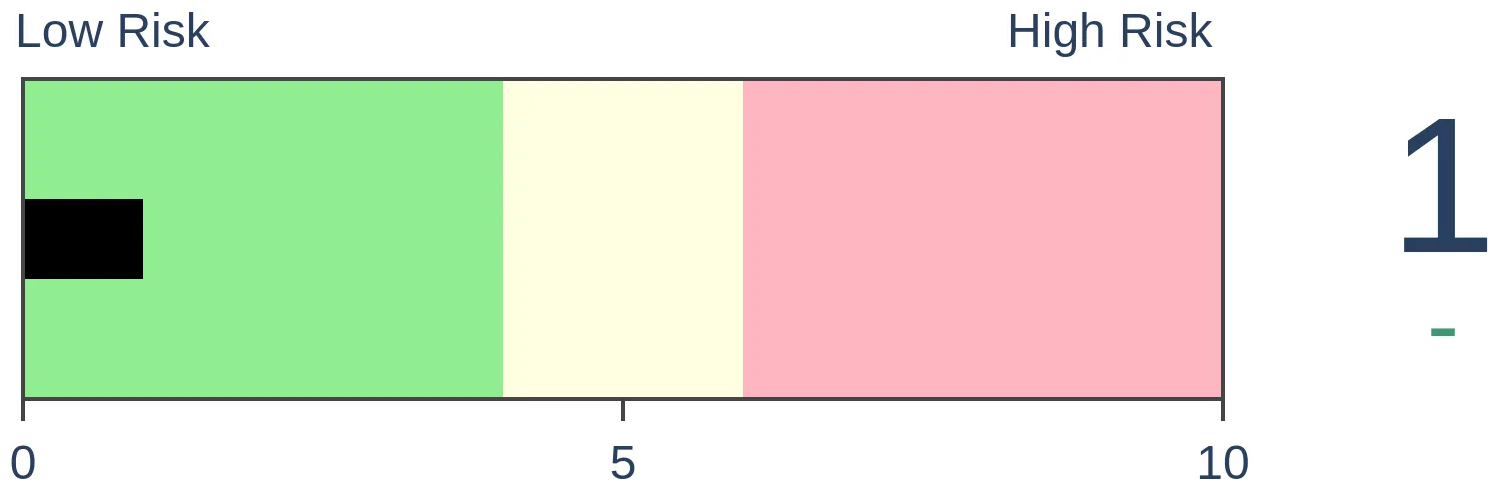
Bonds
|
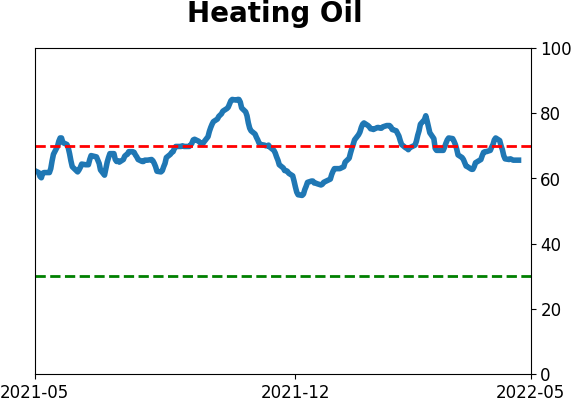
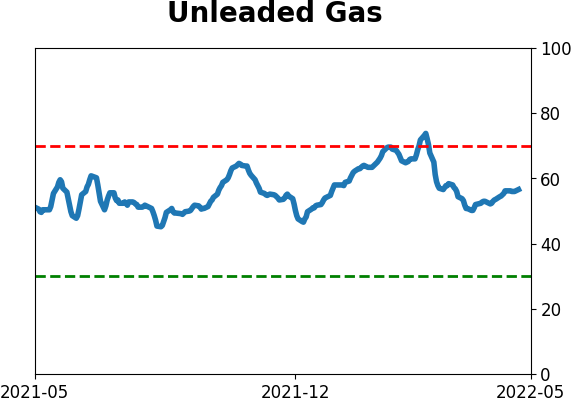
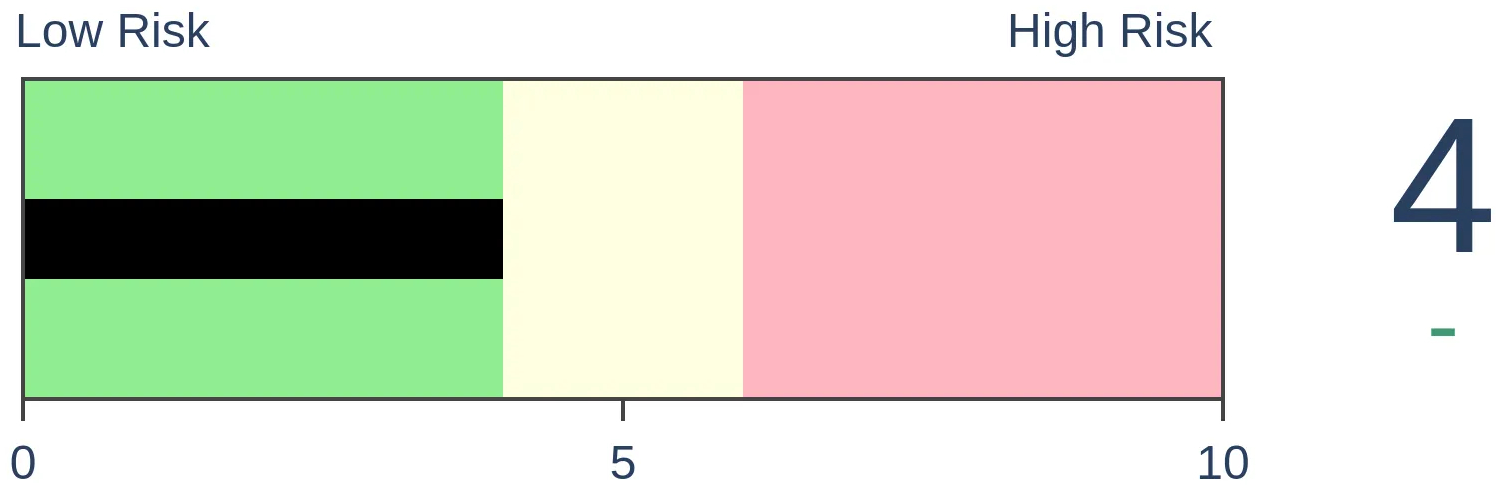
Crude Oil
|
|
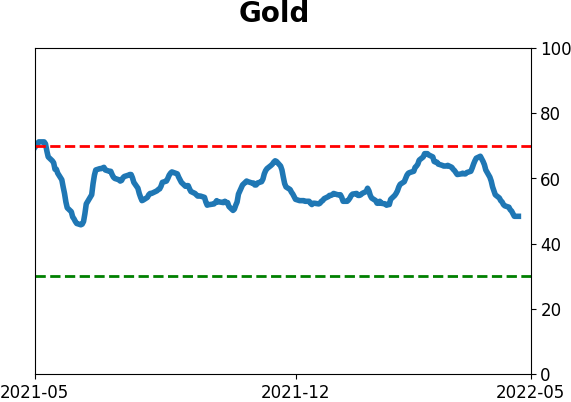
Gold
|
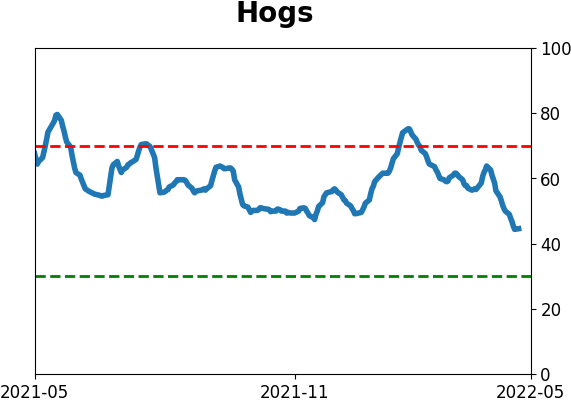
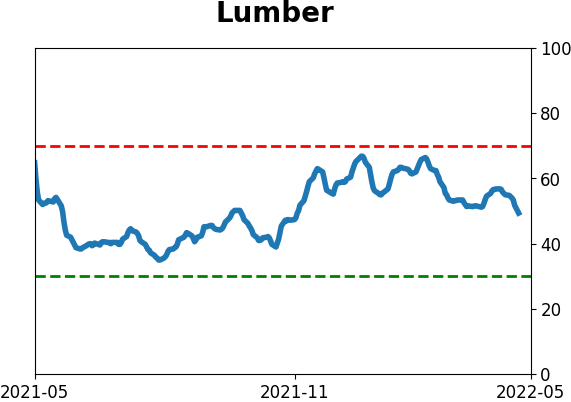
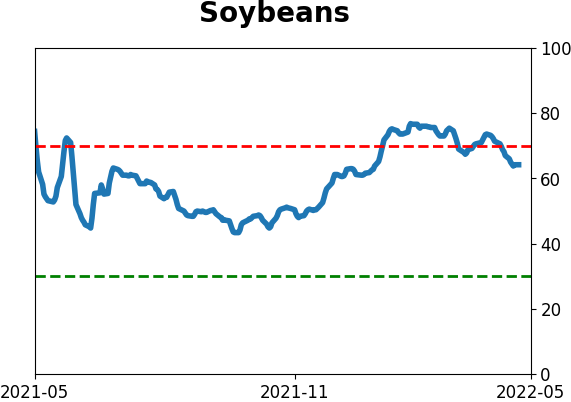
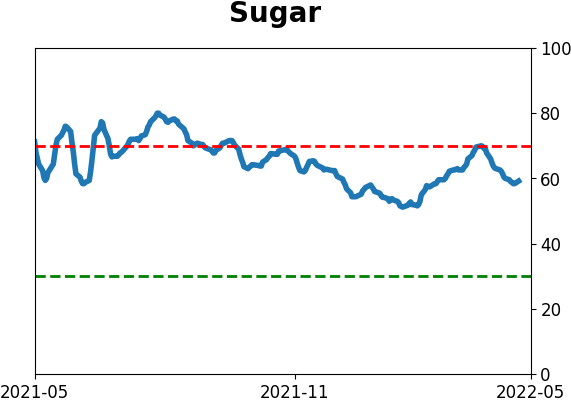
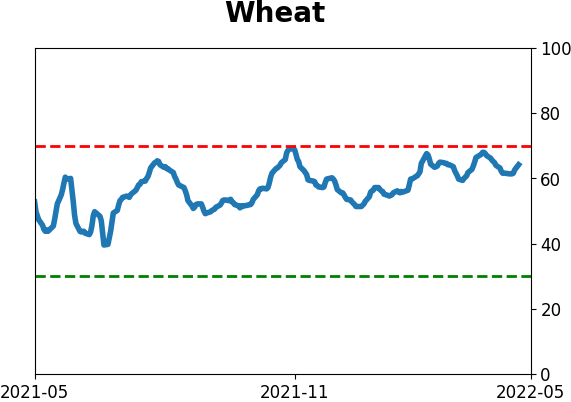
Agriculture

|
|
Research
By Jason Goepfert
BOTTOM LINE
Small options traders spent more money on put protection than they did on speculative calls, for one of the few times in 22 years. Gamma exposure among dealers is extreme, which normally means buying pressure will increase. After so many stocks fell into corrections and bear markets, Friday's thrust may have changed their mindset.
FORECAST / TIMEFRAME
SPY -- Up, Medium-Term
|
Key points:
- Small traders are spending heavily on a crash, as dealers take the other side
- Most stocks are in bear markets, with an overwhelming number in corrections
- Friday's buying thrust may serve as a brake against further pressure
Near-record options bets against a rally
Small traders are getting awfully nervous. And now they're willing to pay up for the right to protect against a crash.
For only the 7th time in 22 years, last week, the smallest options traders spent 30% or more of their volume buying put options to open. Between that spike in put buying and an increase in implied volatility, the premiums that small traders paid for protection were more than 10% higher than the premiums they paid for call options.
It's extremely rare for retail traders to pay more in premiums for put protection than for speculating on rallies. The Backtest Engine shows that the S&P 500 rallied over the next year after every time they did so, averaging a healthy return of 21%. The only precedents are all-out market crashes, so there was a lot of volatility in the short term.
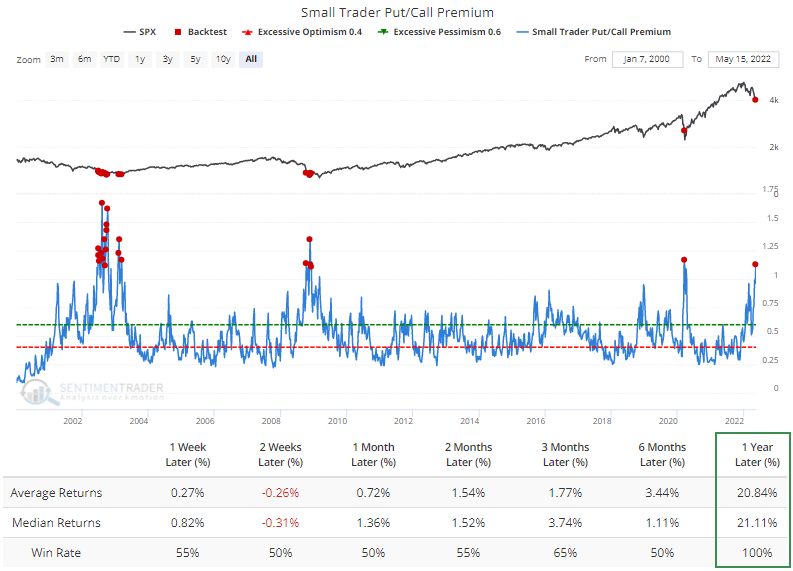
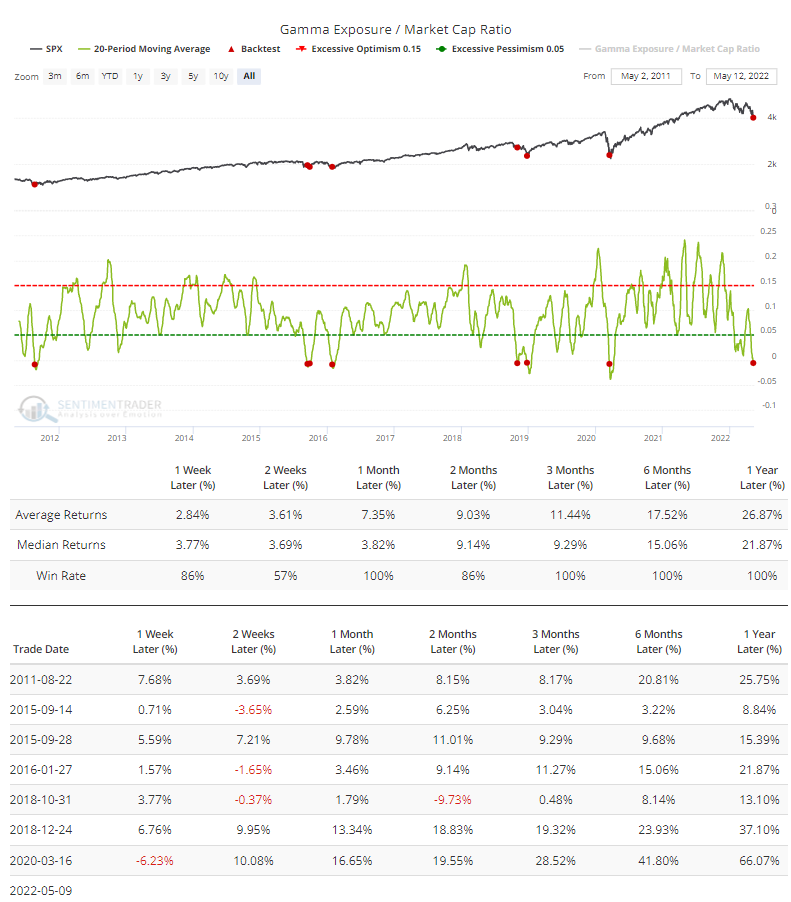
Their bearish bets have been building for weeks, and somebody has to take the other side of those trades. That often means dealers on Wall Street, who then have to hedge their exposure by buying or selling underlying stocks.
Because of that effect, the 20-day average of Gamma Exposure has dropped below -1% of the market value of U.S. stocks. I'll be the first to admit to not having a sophisticated understanding of the potential dynamics this might trigger, so I'm not going to snowball you by spouting a bunch of fancy terminology.
All I know is what the Backtest Engine shows - every time this happened before, the S&P rallied in the months ahead. We only have data from 2011, so there is no telling what this might have meant in 2002 or 2008.
A bevy of corrections...
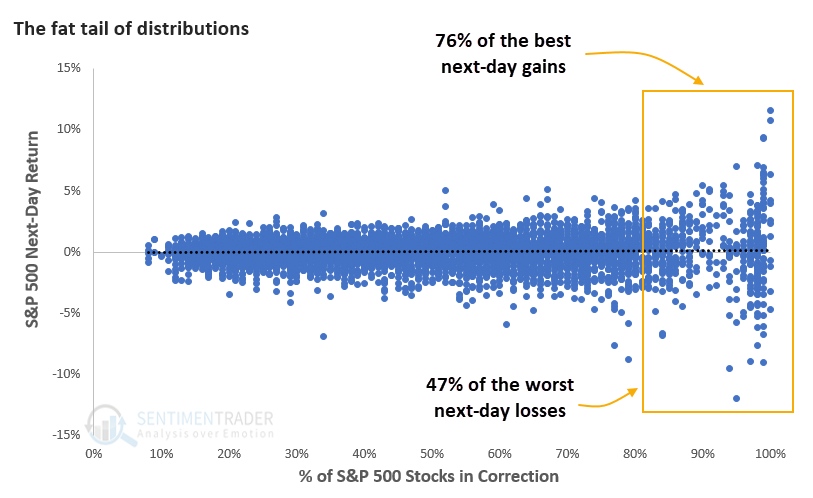
All of this betting against stocks by retail investors comes as more than 80% of stocks in the S&P 500 fell into correction territory (more than 10% off their 52-week high).
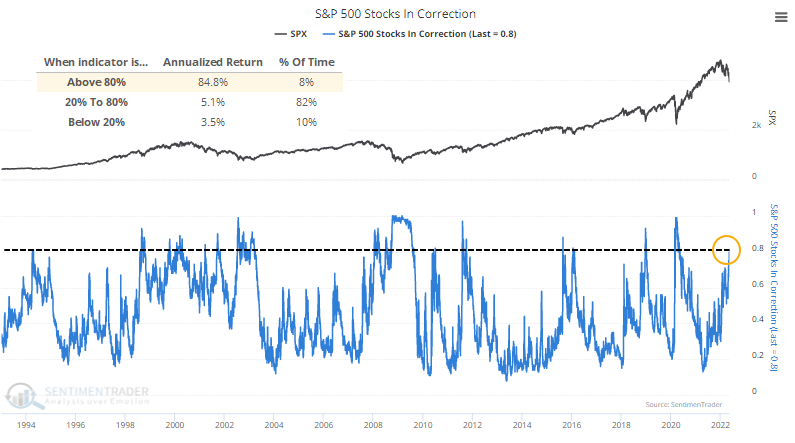
We only have this data back 30 years, dominated by a rising market, so it's natural to expect higher-than-average returns when markets dip. Even so, it's notable that when more than 80% of stocks were in a correction, next-day returns in the S&P 500 widened considerably. Almost all the "fat tails" occurred here.
If we got out of stocks when more than 80% of S&P members were in a correction, we would have avoided the 6 worst losses since 1992. But we also would have missed the 16 best gains.
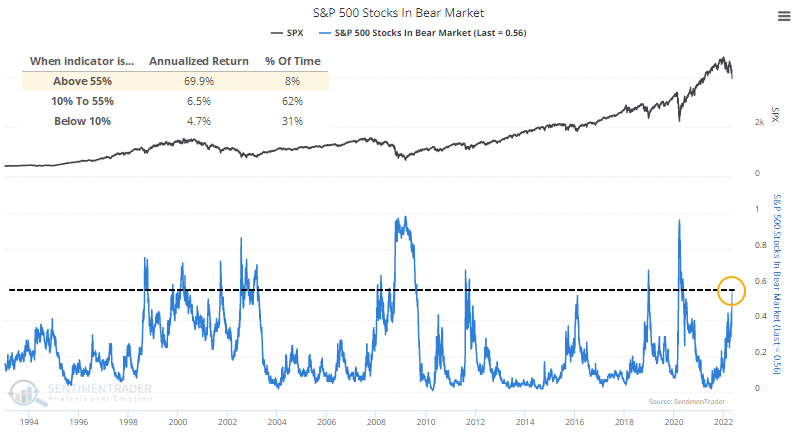
For stocks that are losing, more and more are losing badly. As of late last week, more than 55% into bear markets (off more than 20% from their highs).
The table below shows S&P 500 returns whenever more than 80% of S&P 500 stocks were in a correction, and more than 55% were in a bear market. While this occurred about midway through the 2000-02 bear market and early on in the 2008 bear, the S&P 500's returns during the next three months were positive every time due to relief rallies.
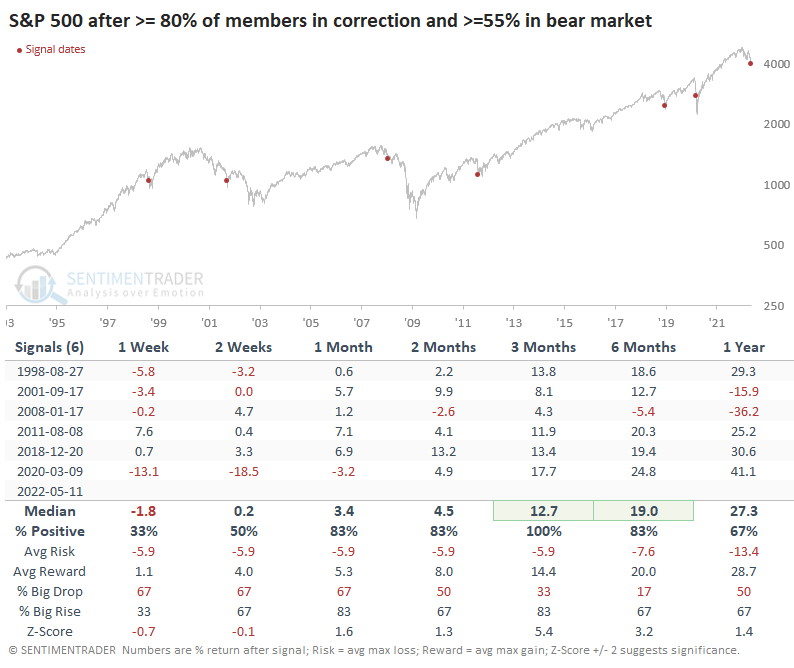
Dean showed in a report last week that once more than half of stocks fall into a bear market, bulls do not want to see that extend beyond 63% within the next two months. It occurred during some of the roughest long-term slogs for stocks when it did. So far, we're still below that threshold.
...then a stampede of buying
Breadth thrusts have become the "cool kid" among technicians, with seemingly everyone looking for them now that data and backtesting software have become more accessible. Because of that, it will be interesting to see if thrusts lose some effectiveness over time. There is already some very early evidence of that, but we'll have to see if it continues.
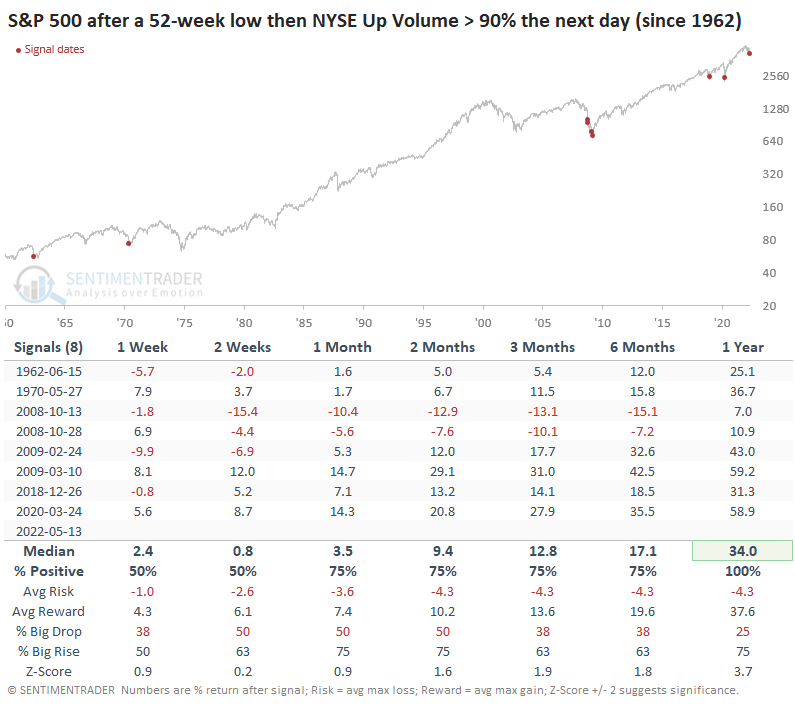
For what it's worth, stocks did see overwhelming buying interest on Friday, with the most volume flowing into advancing stocks since June 2020.
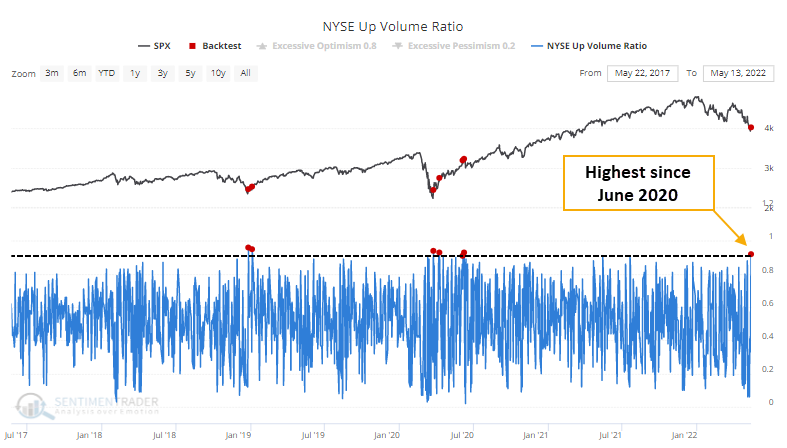
When investors changed their mentality whole-hog following a 52-week low, it has never not preceded a higher return a year later, though the path to get there was nail-biting in 2008.
What the research tells us...
There are few places to hide among financial assets. When accounting for inflation, there are almost none. About the only investment that does and has a measure of safety, i-bonds, has strict limits on contributions and withdrawals. No wonder investors are despondent.
Last week, we saw that sentiment is washed-out. Even during protracted bear markets, that usually means a multi-week to multi-month relief rally. The buying thrust on Friday is developing evidence we may be on the cusp of that, and the panic among small options traders should serve to add more fuel to a potential rally. It makes sense to be skeptical of its likely lasting power, however.
Indicators at Extremes
Phase Table
Ranks
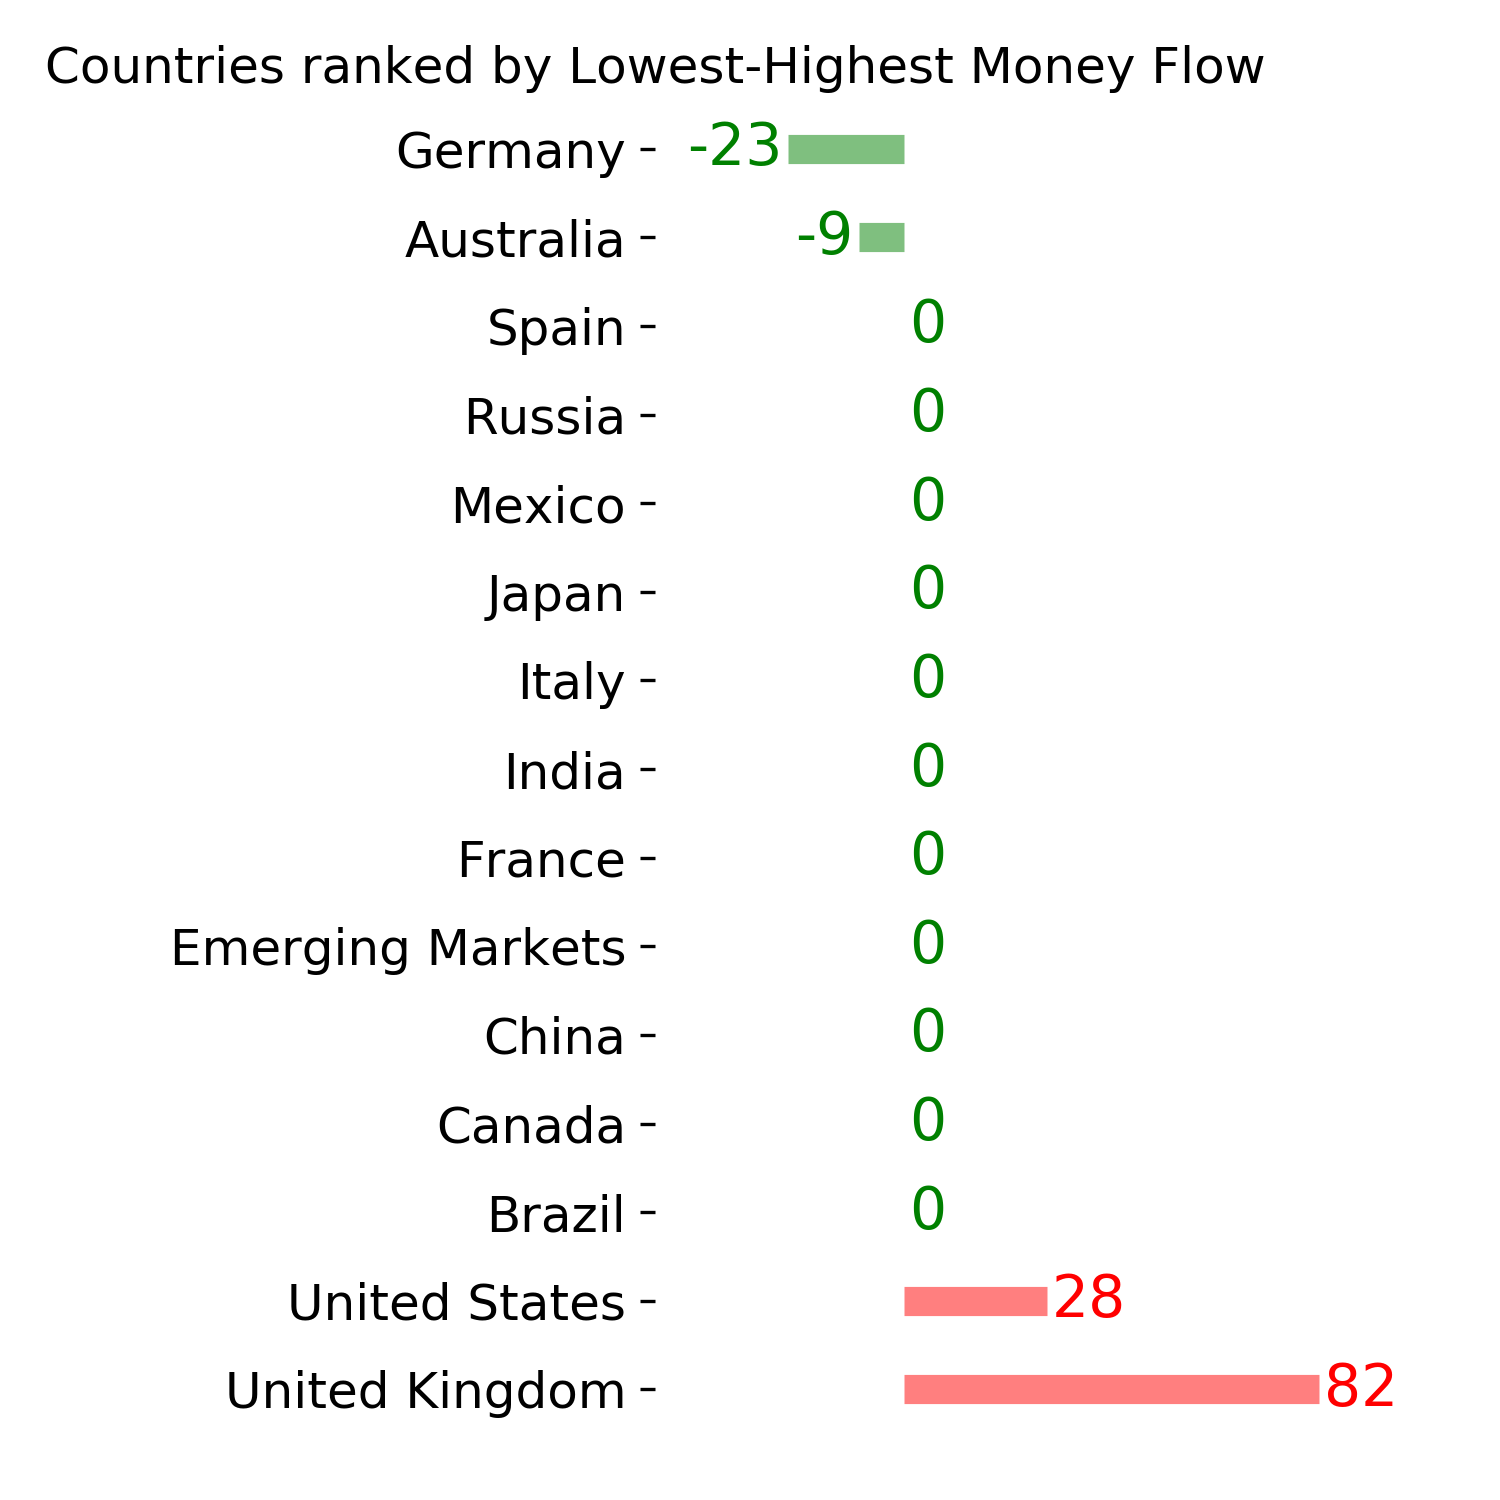
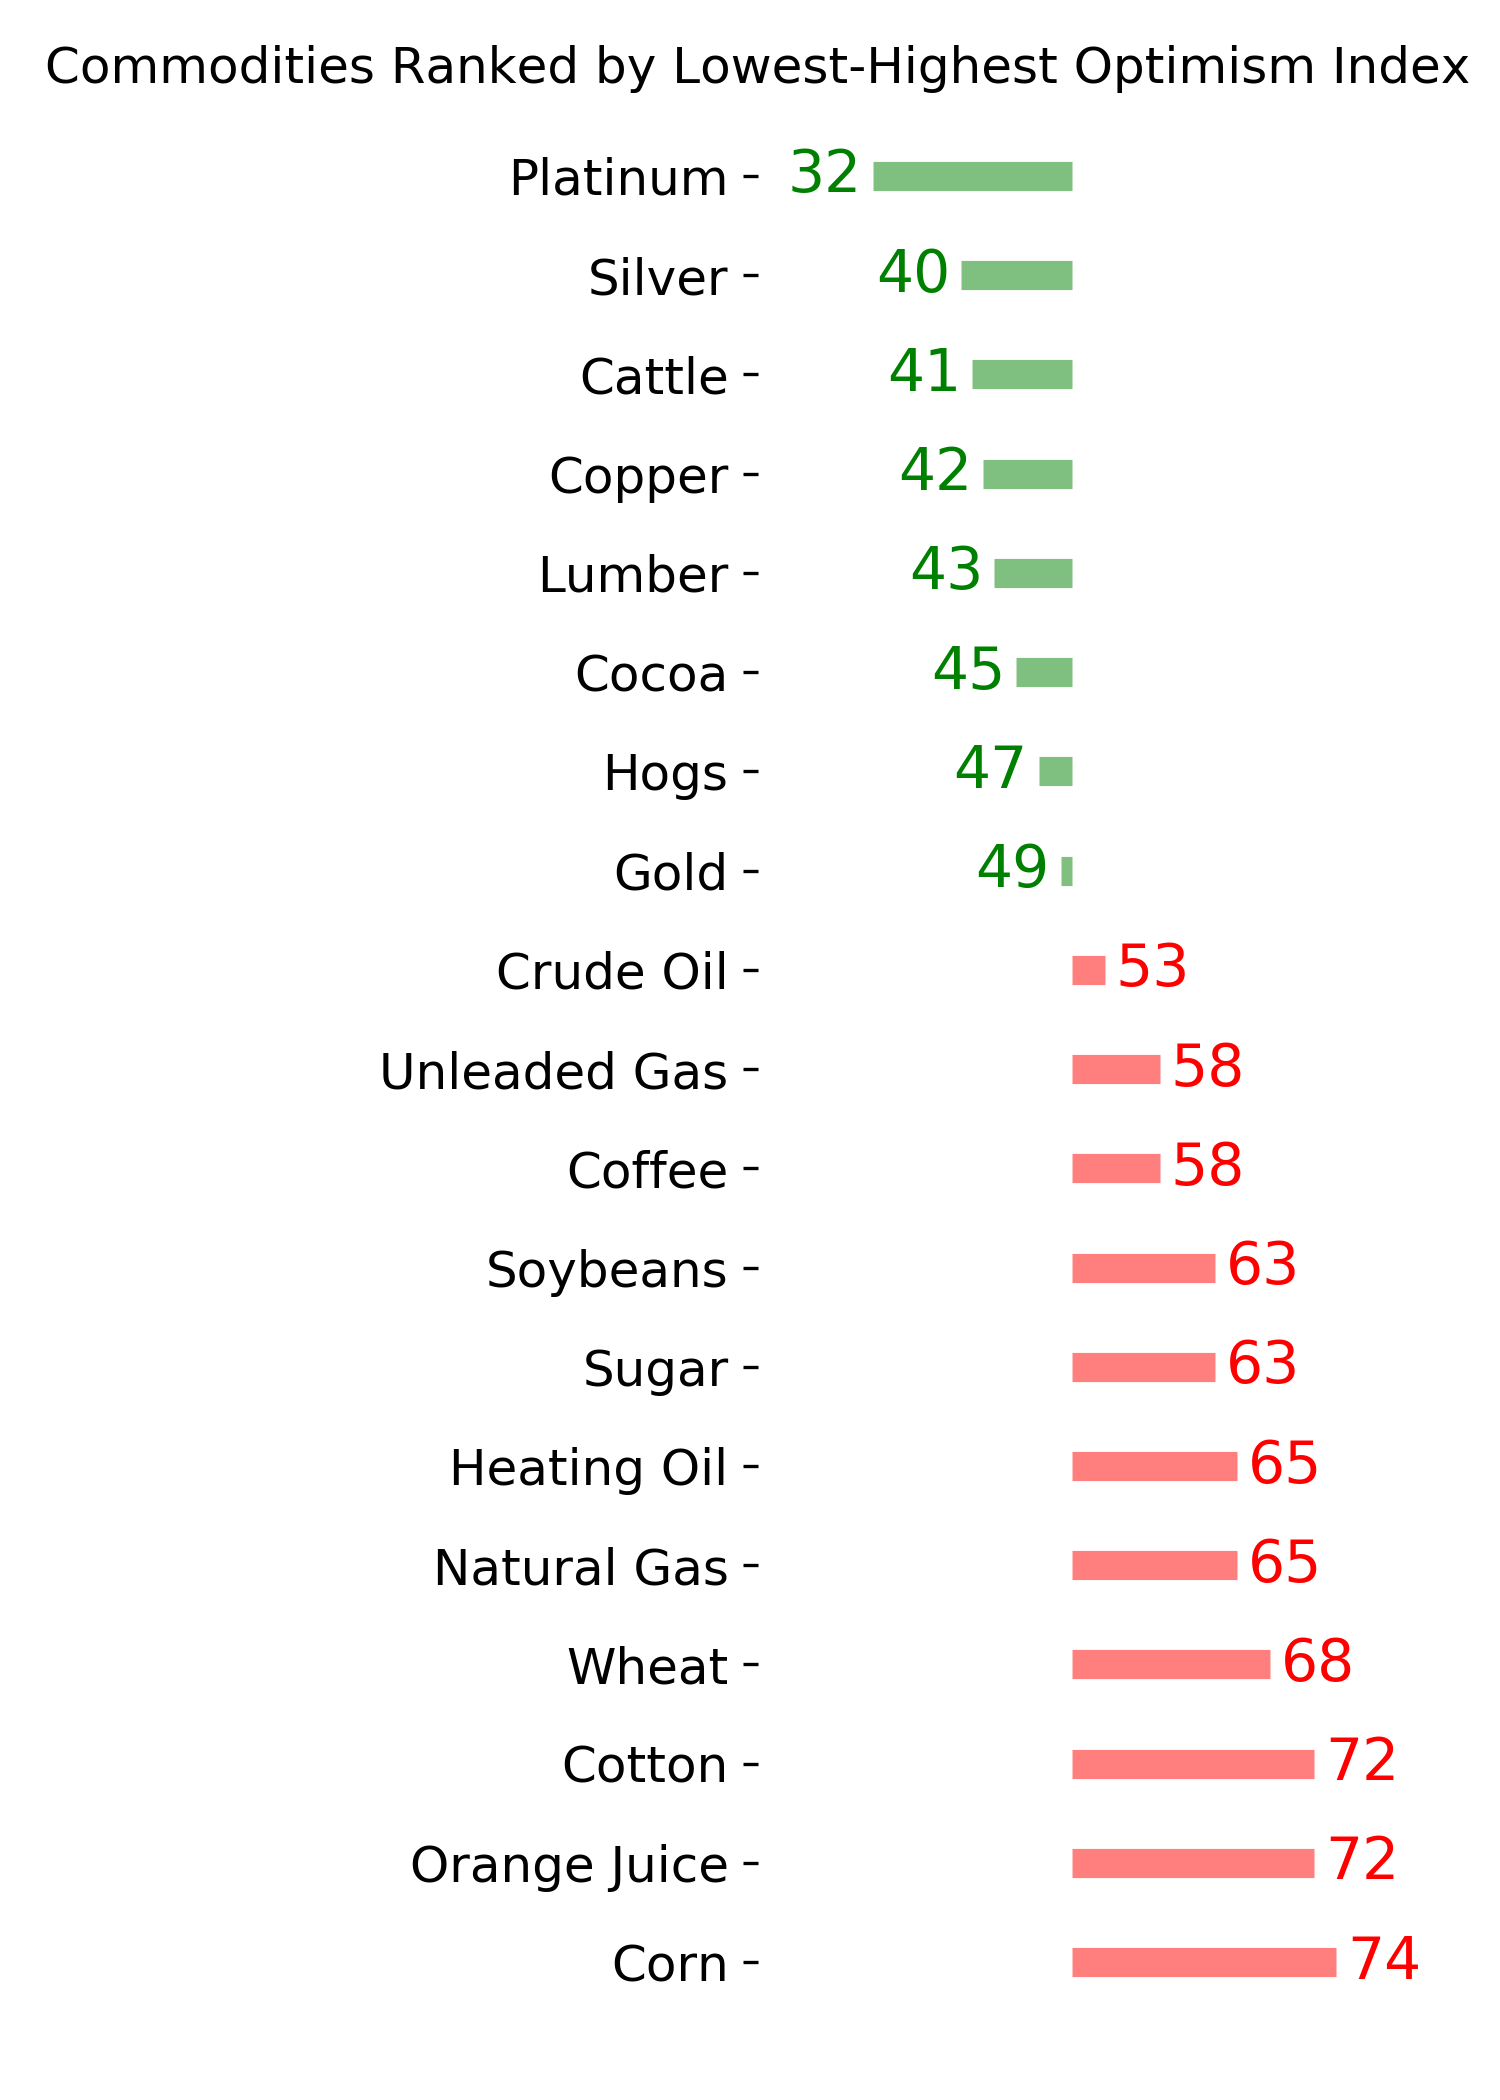
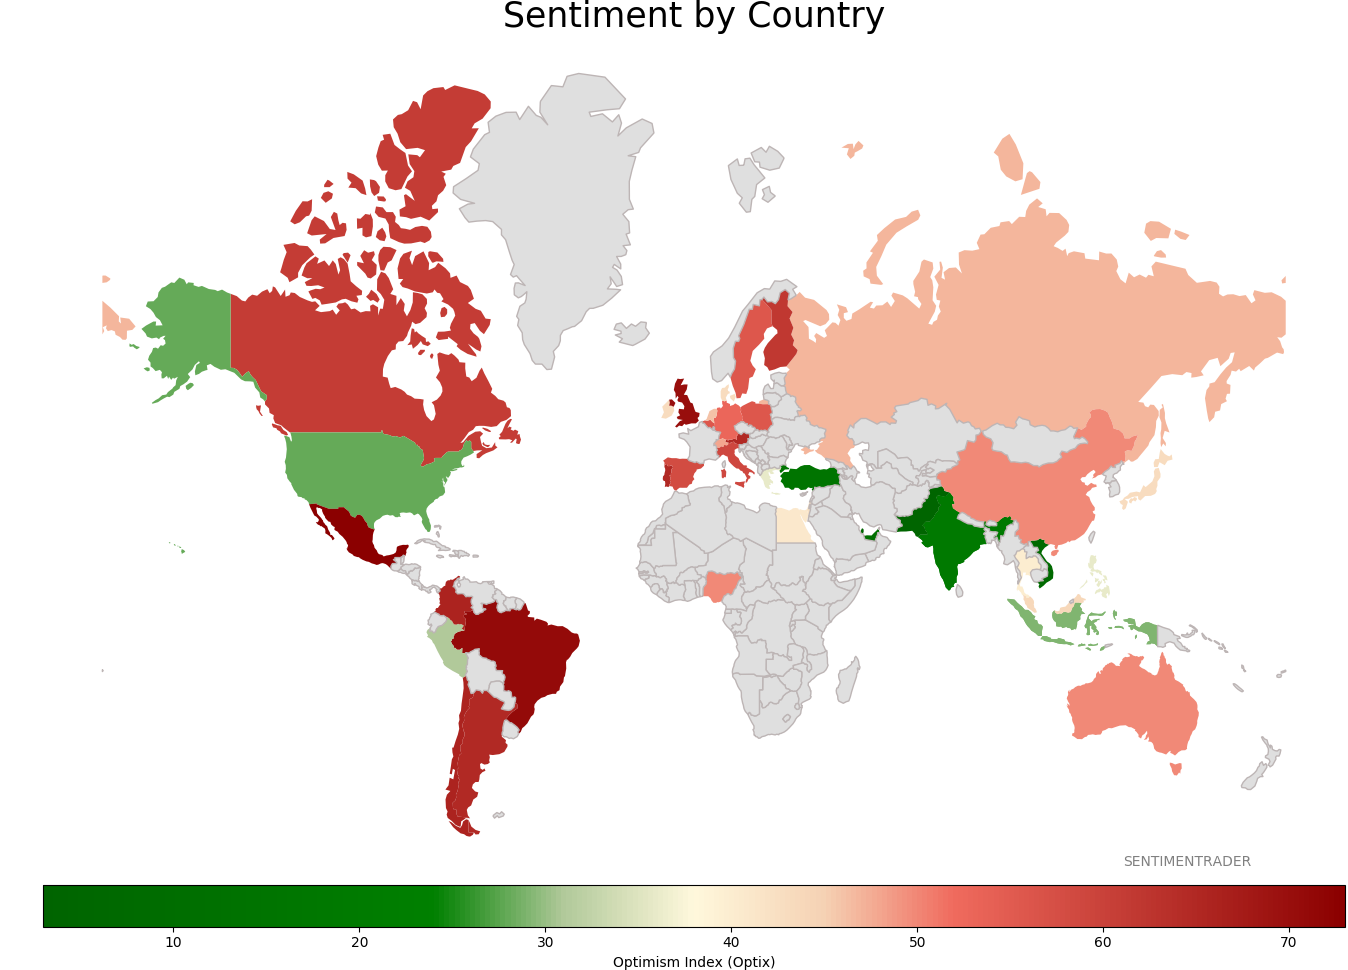
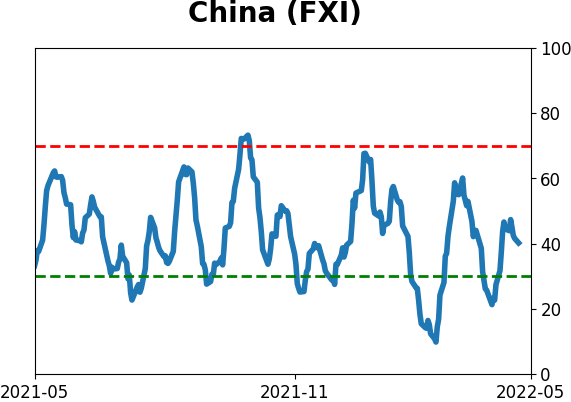
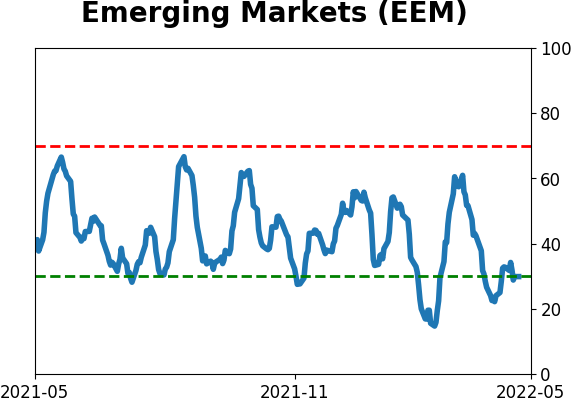
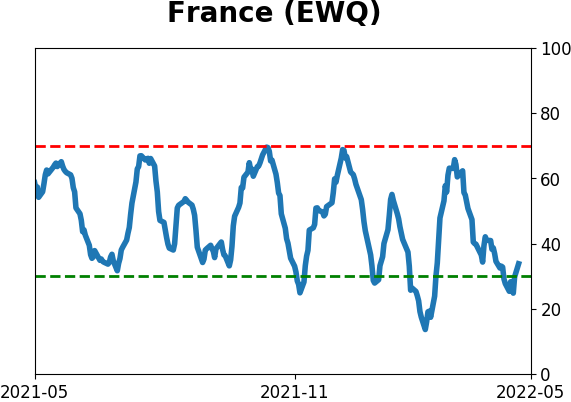
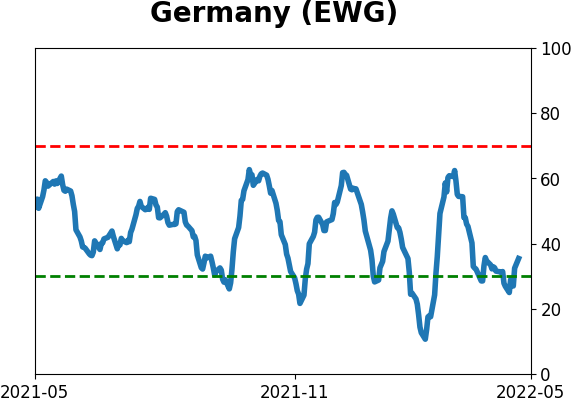
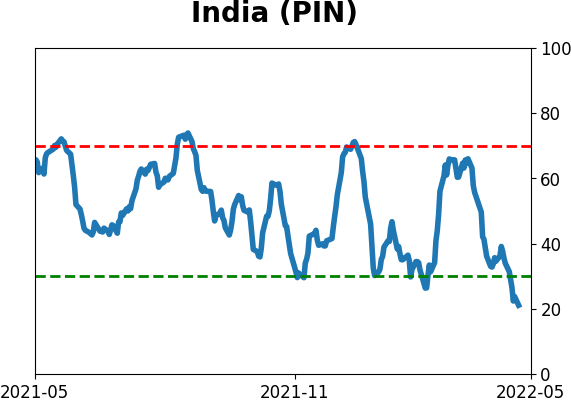
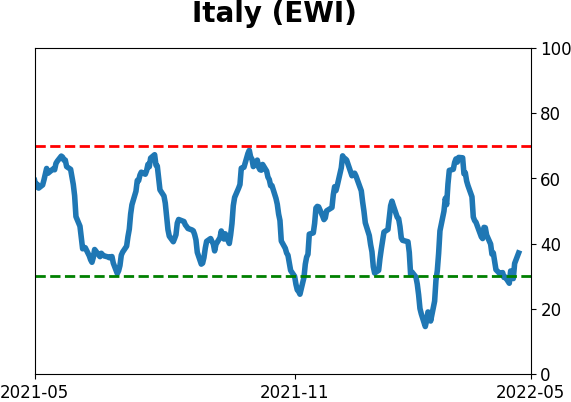
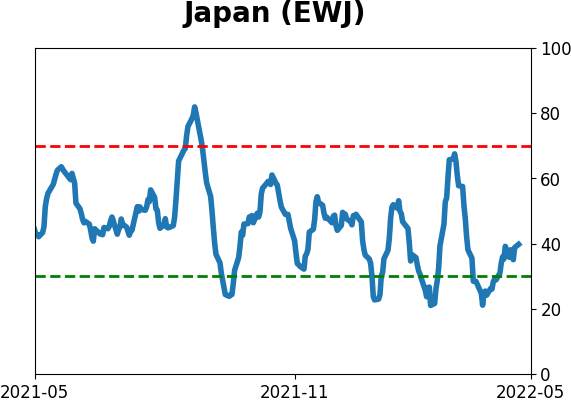
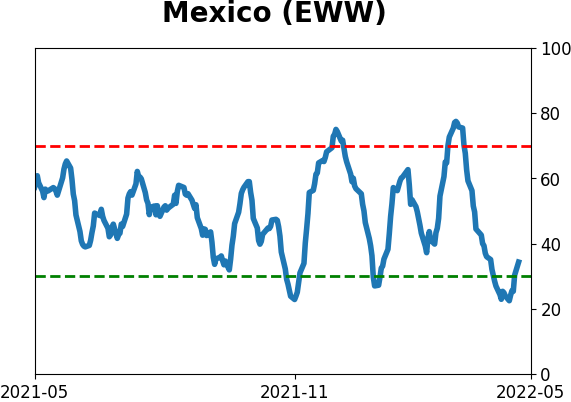
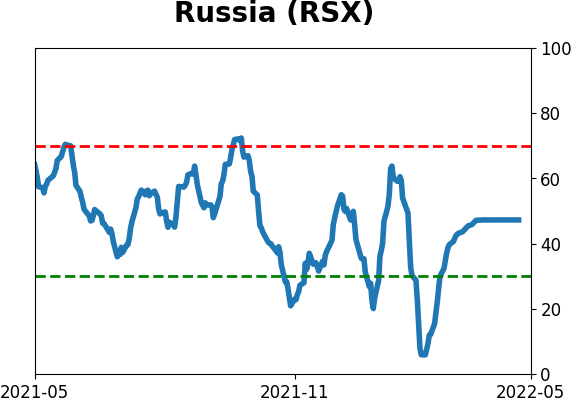
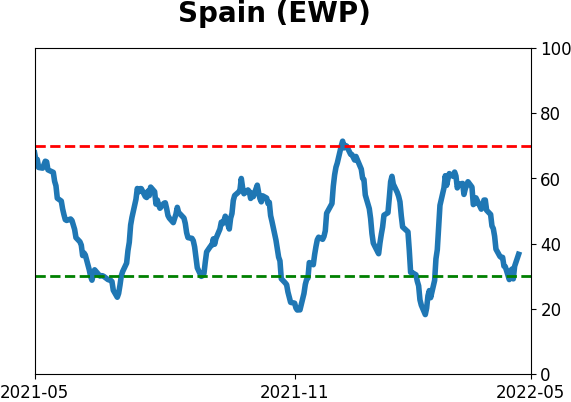
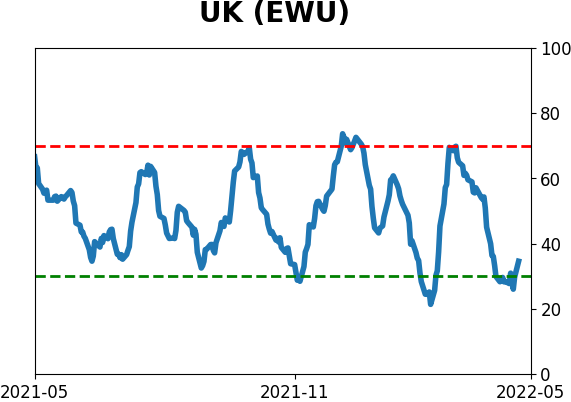
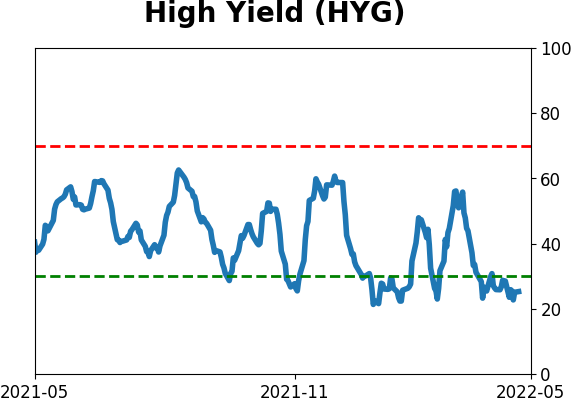
Sentiment Around The World
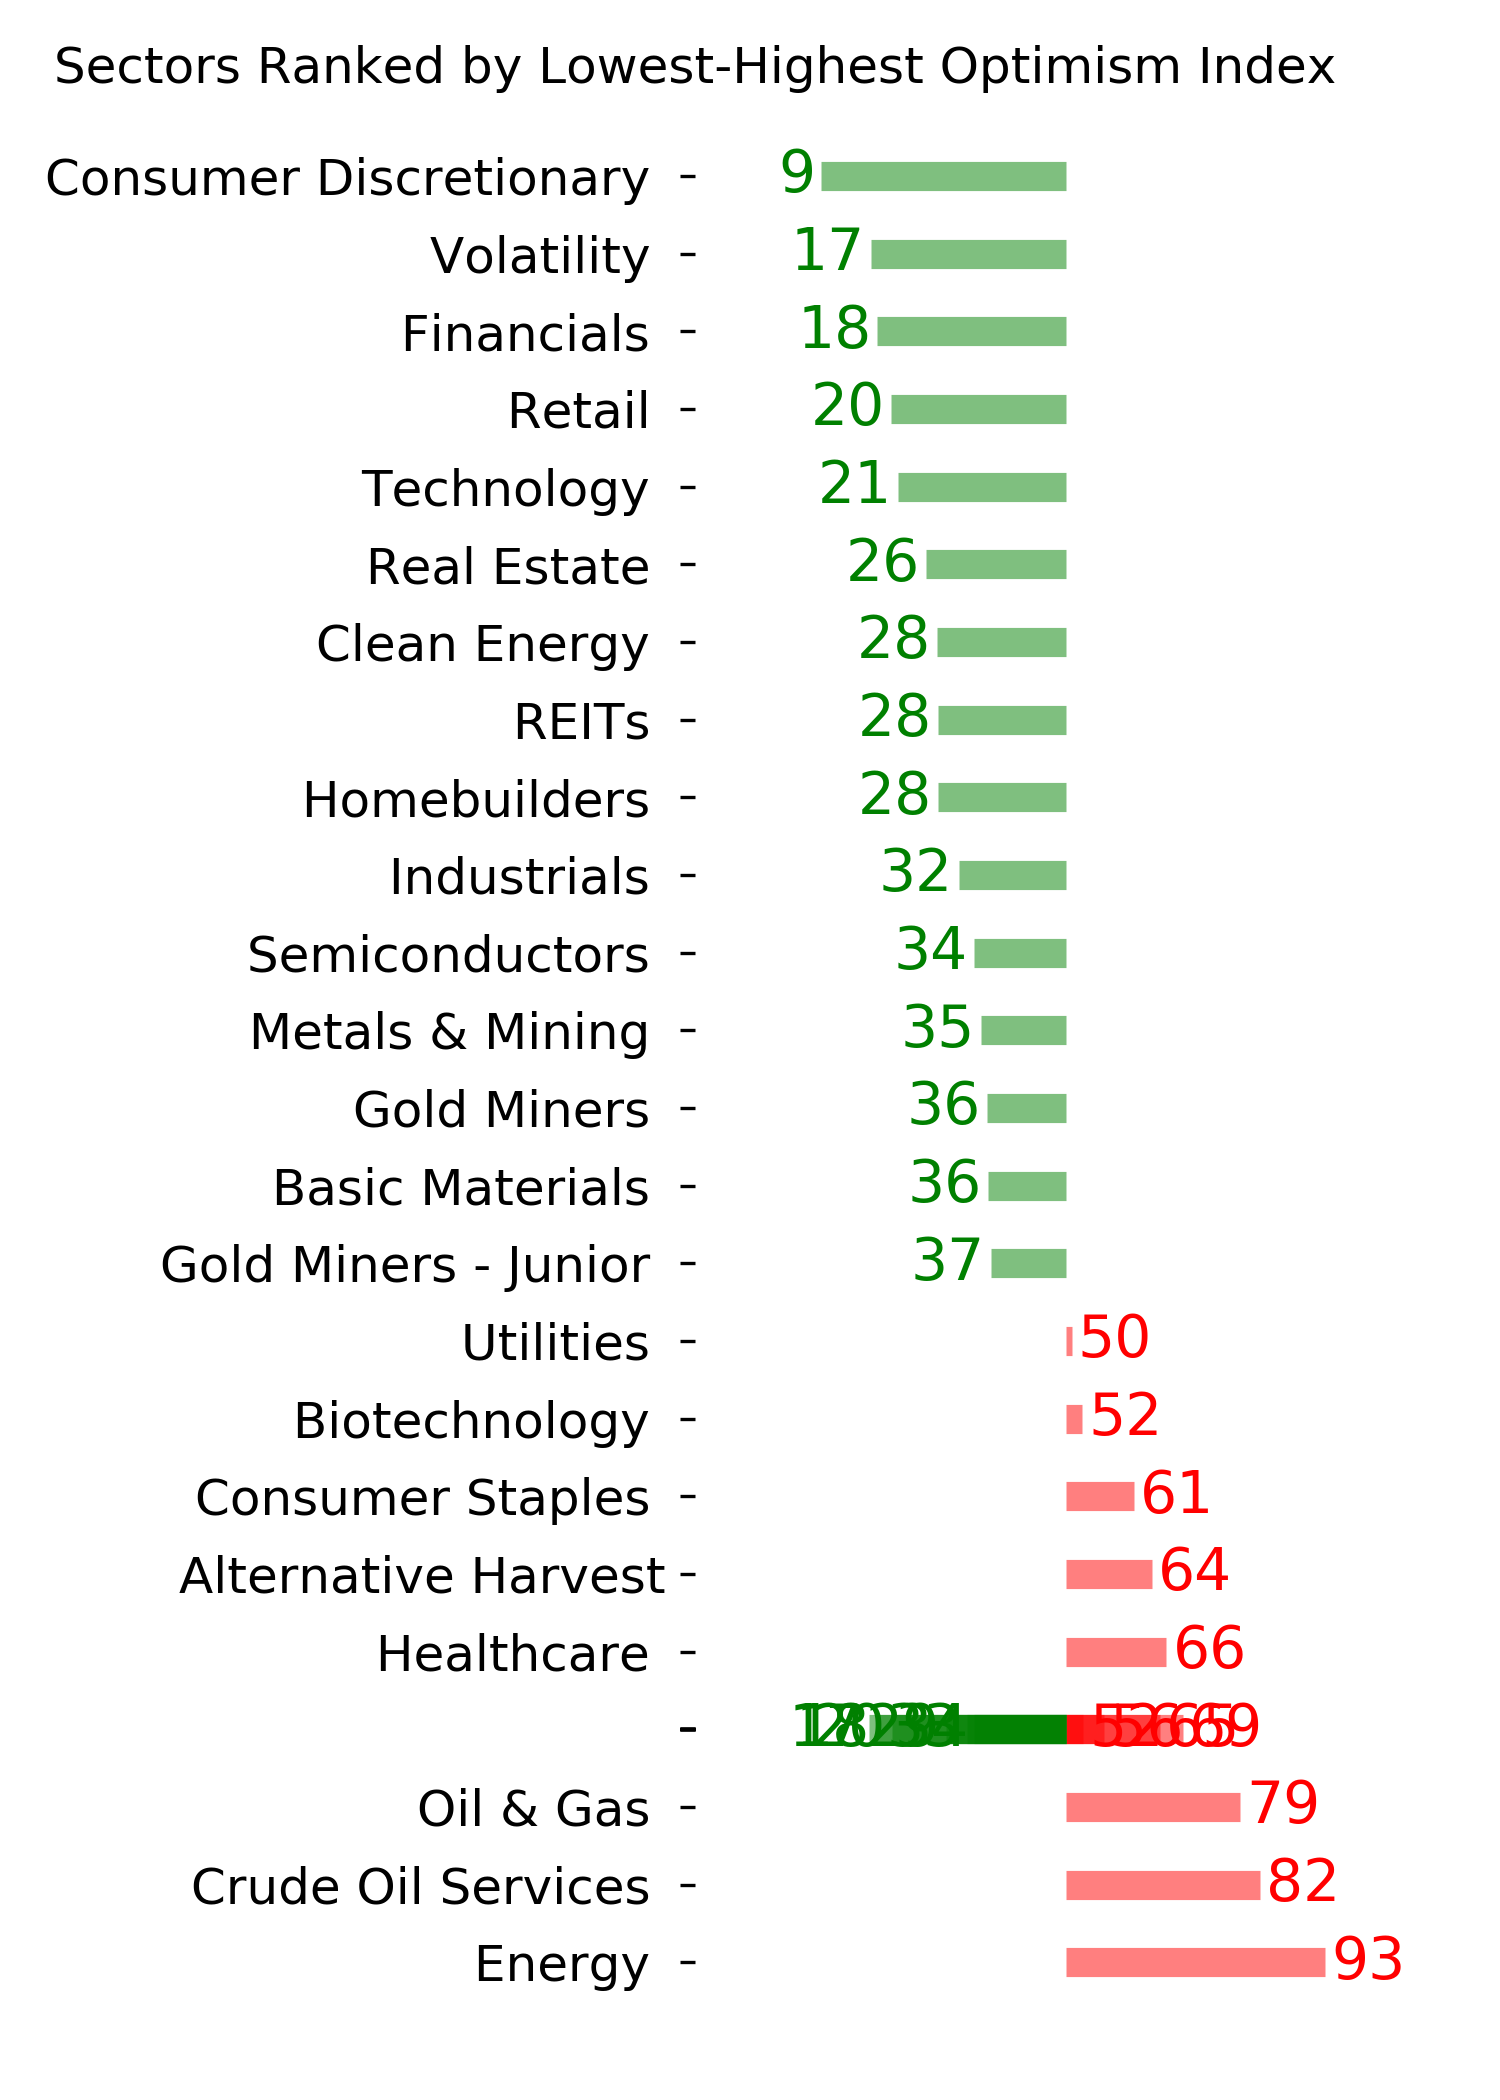
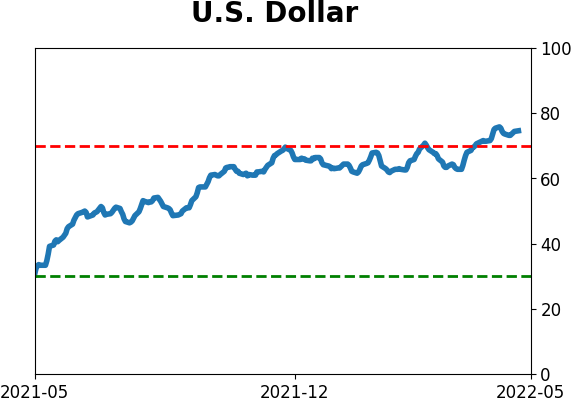
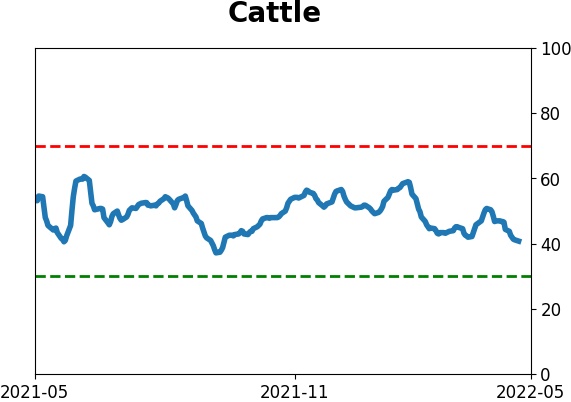
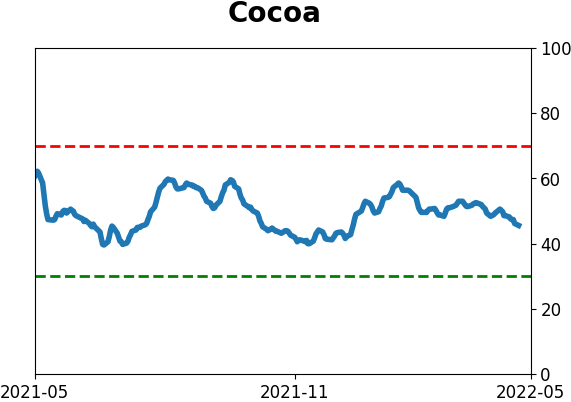
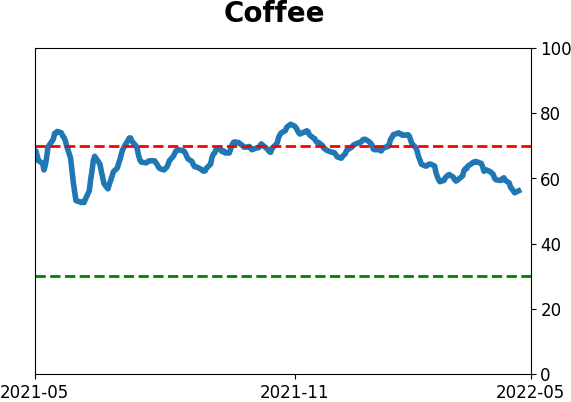
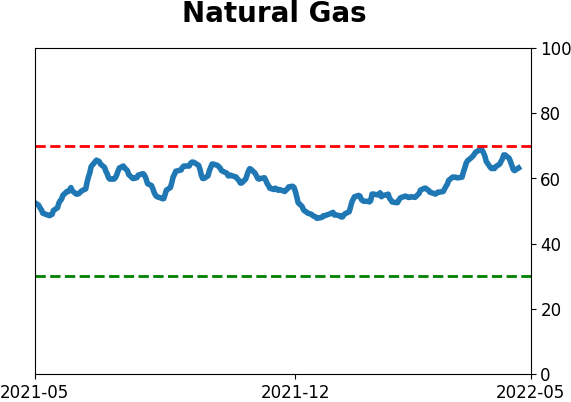
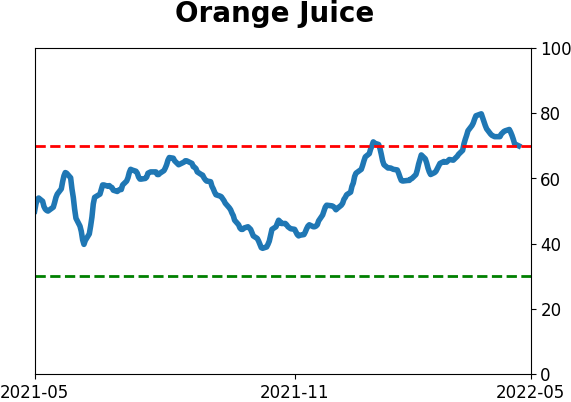
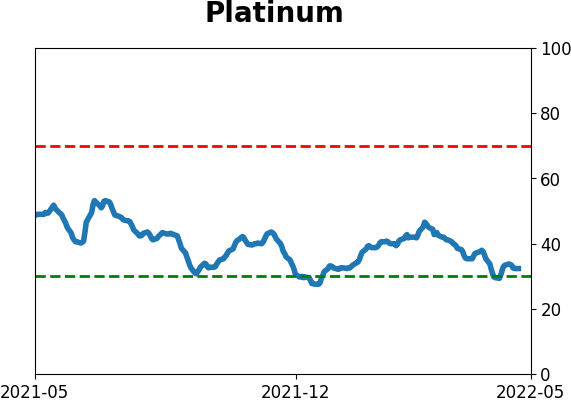
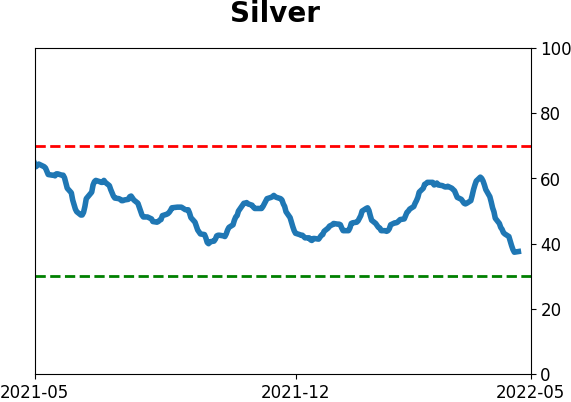
Optimism Index Thumbnails
|
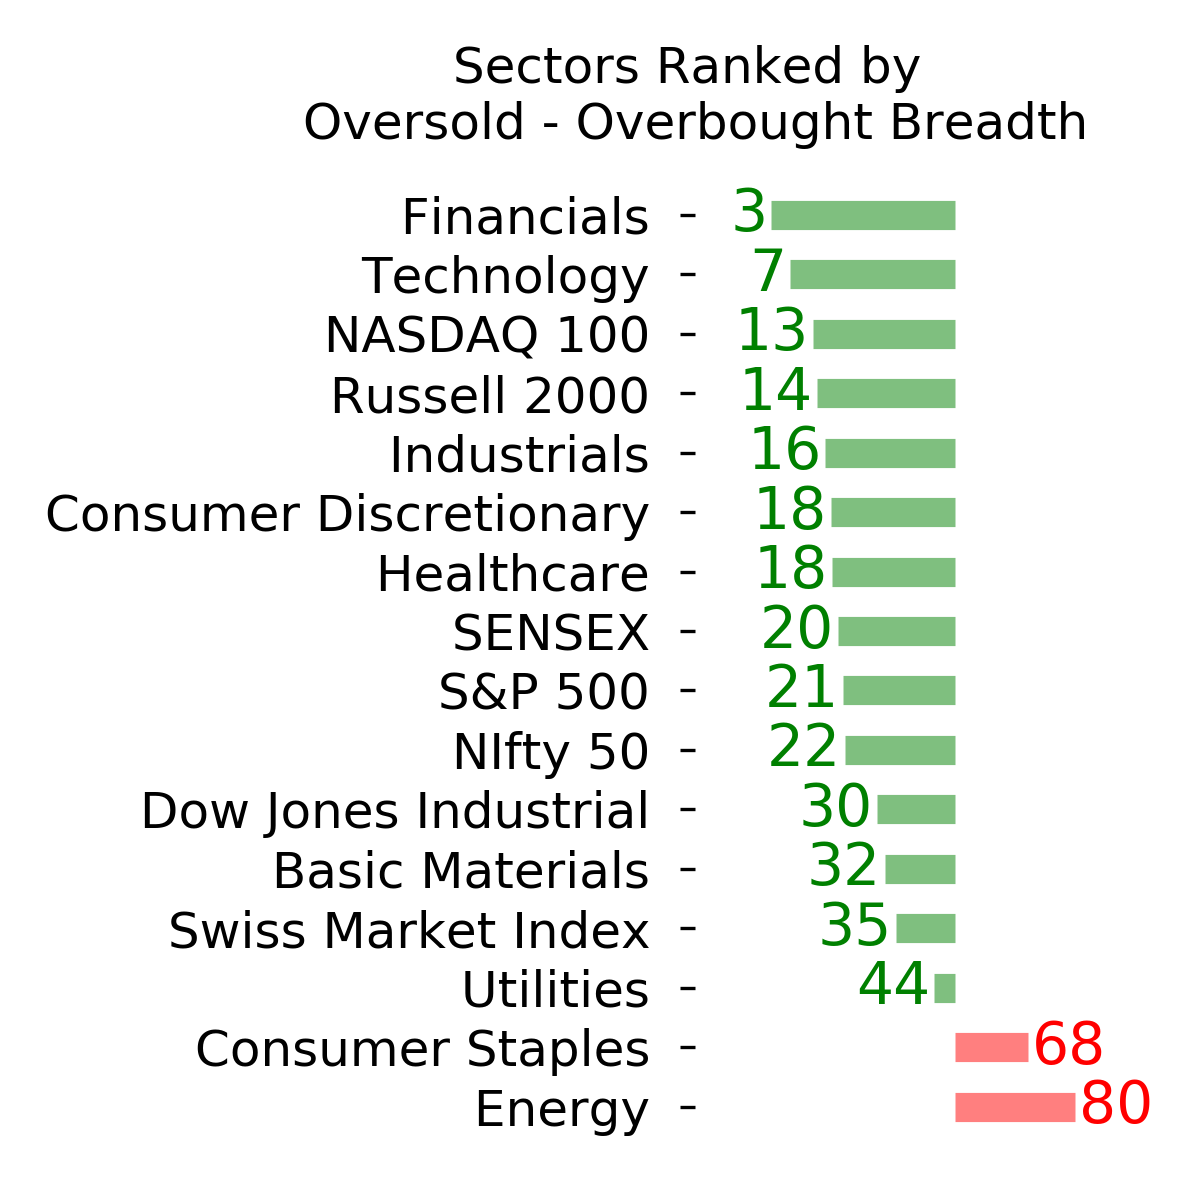
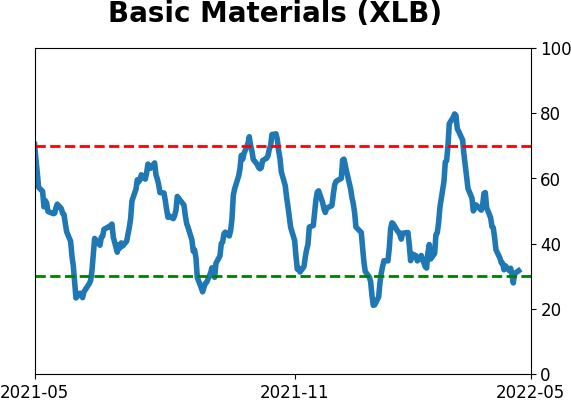
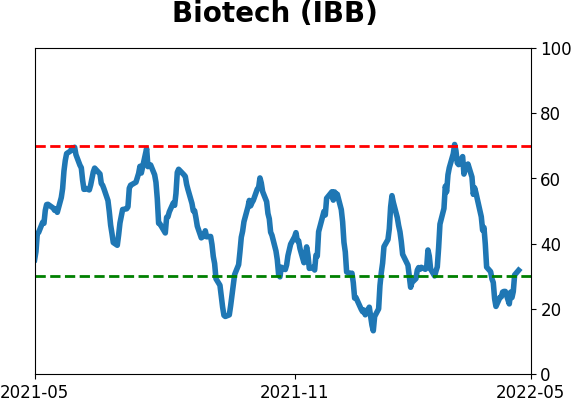
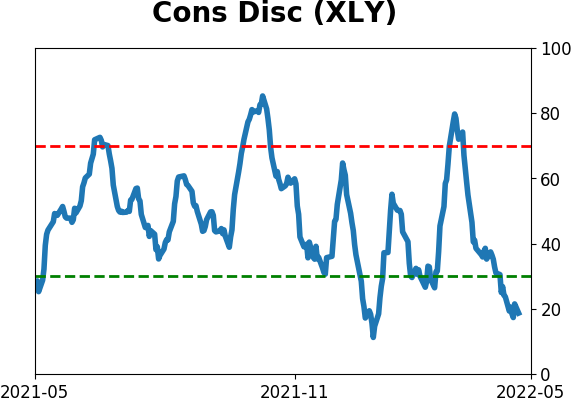
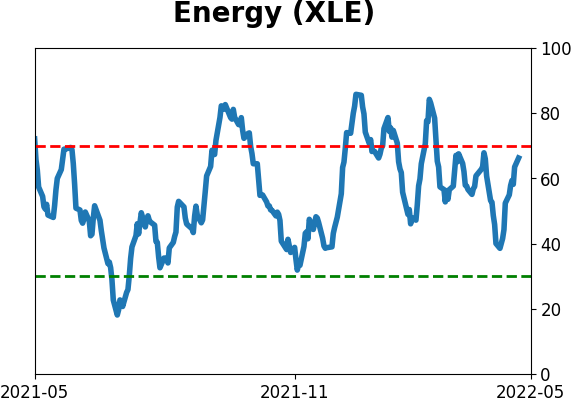
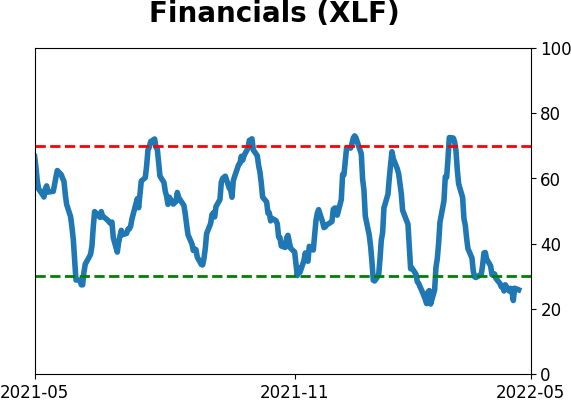
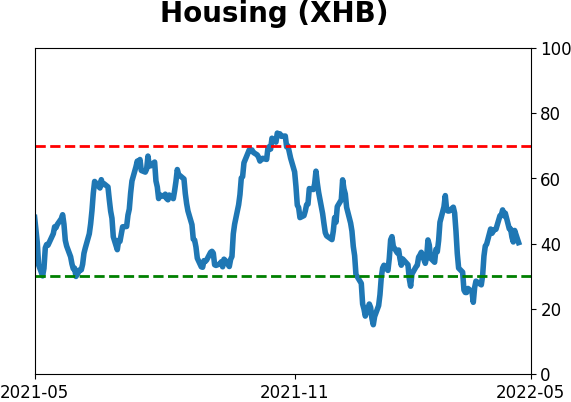
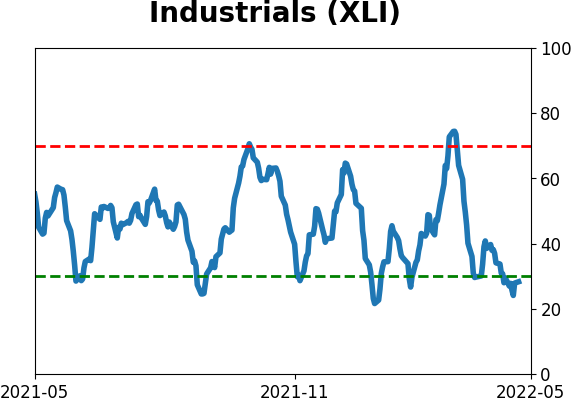
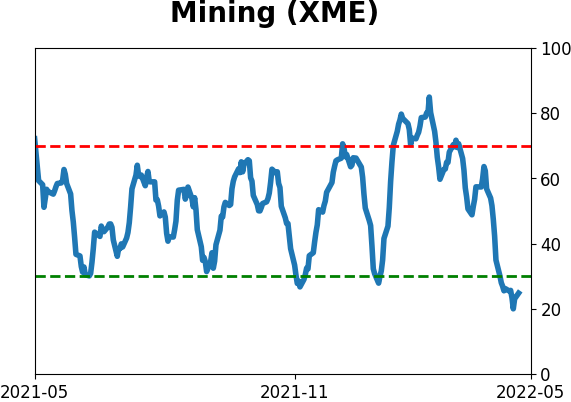
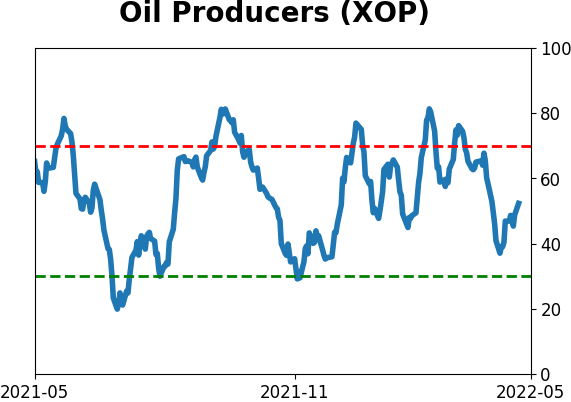
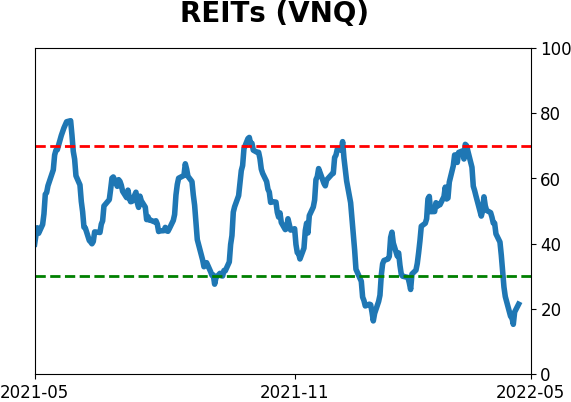
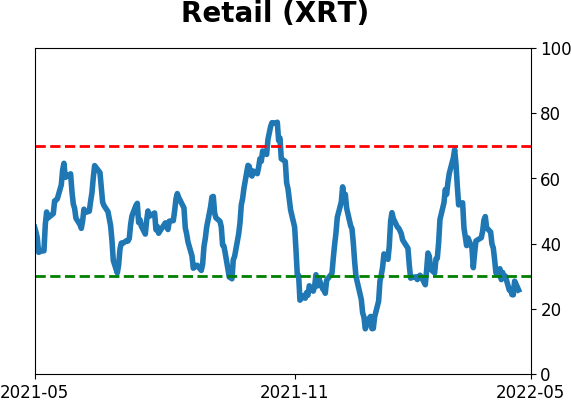
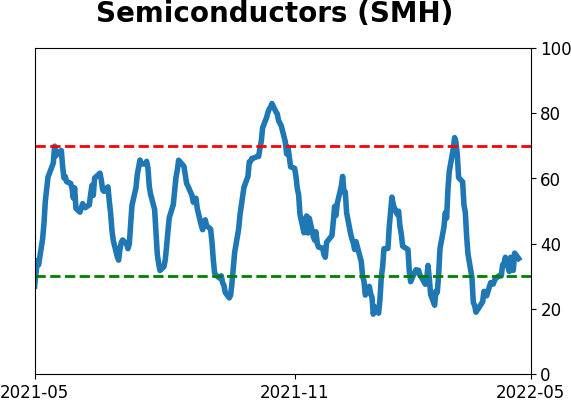
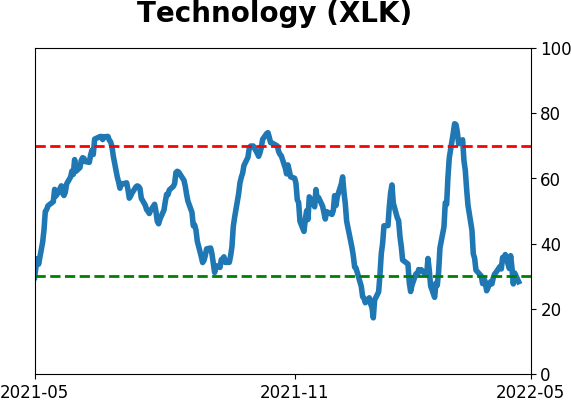
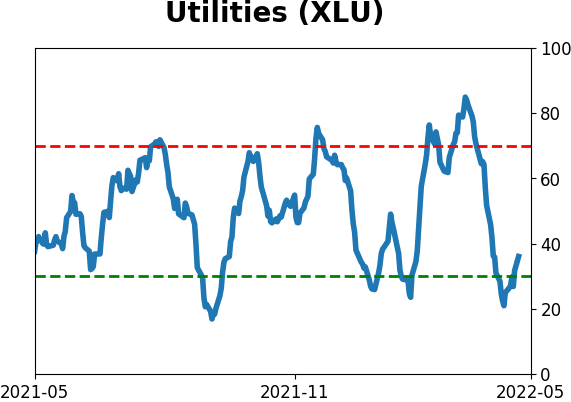
Sector ETF's - 10-Day Moving Average
|
|
|
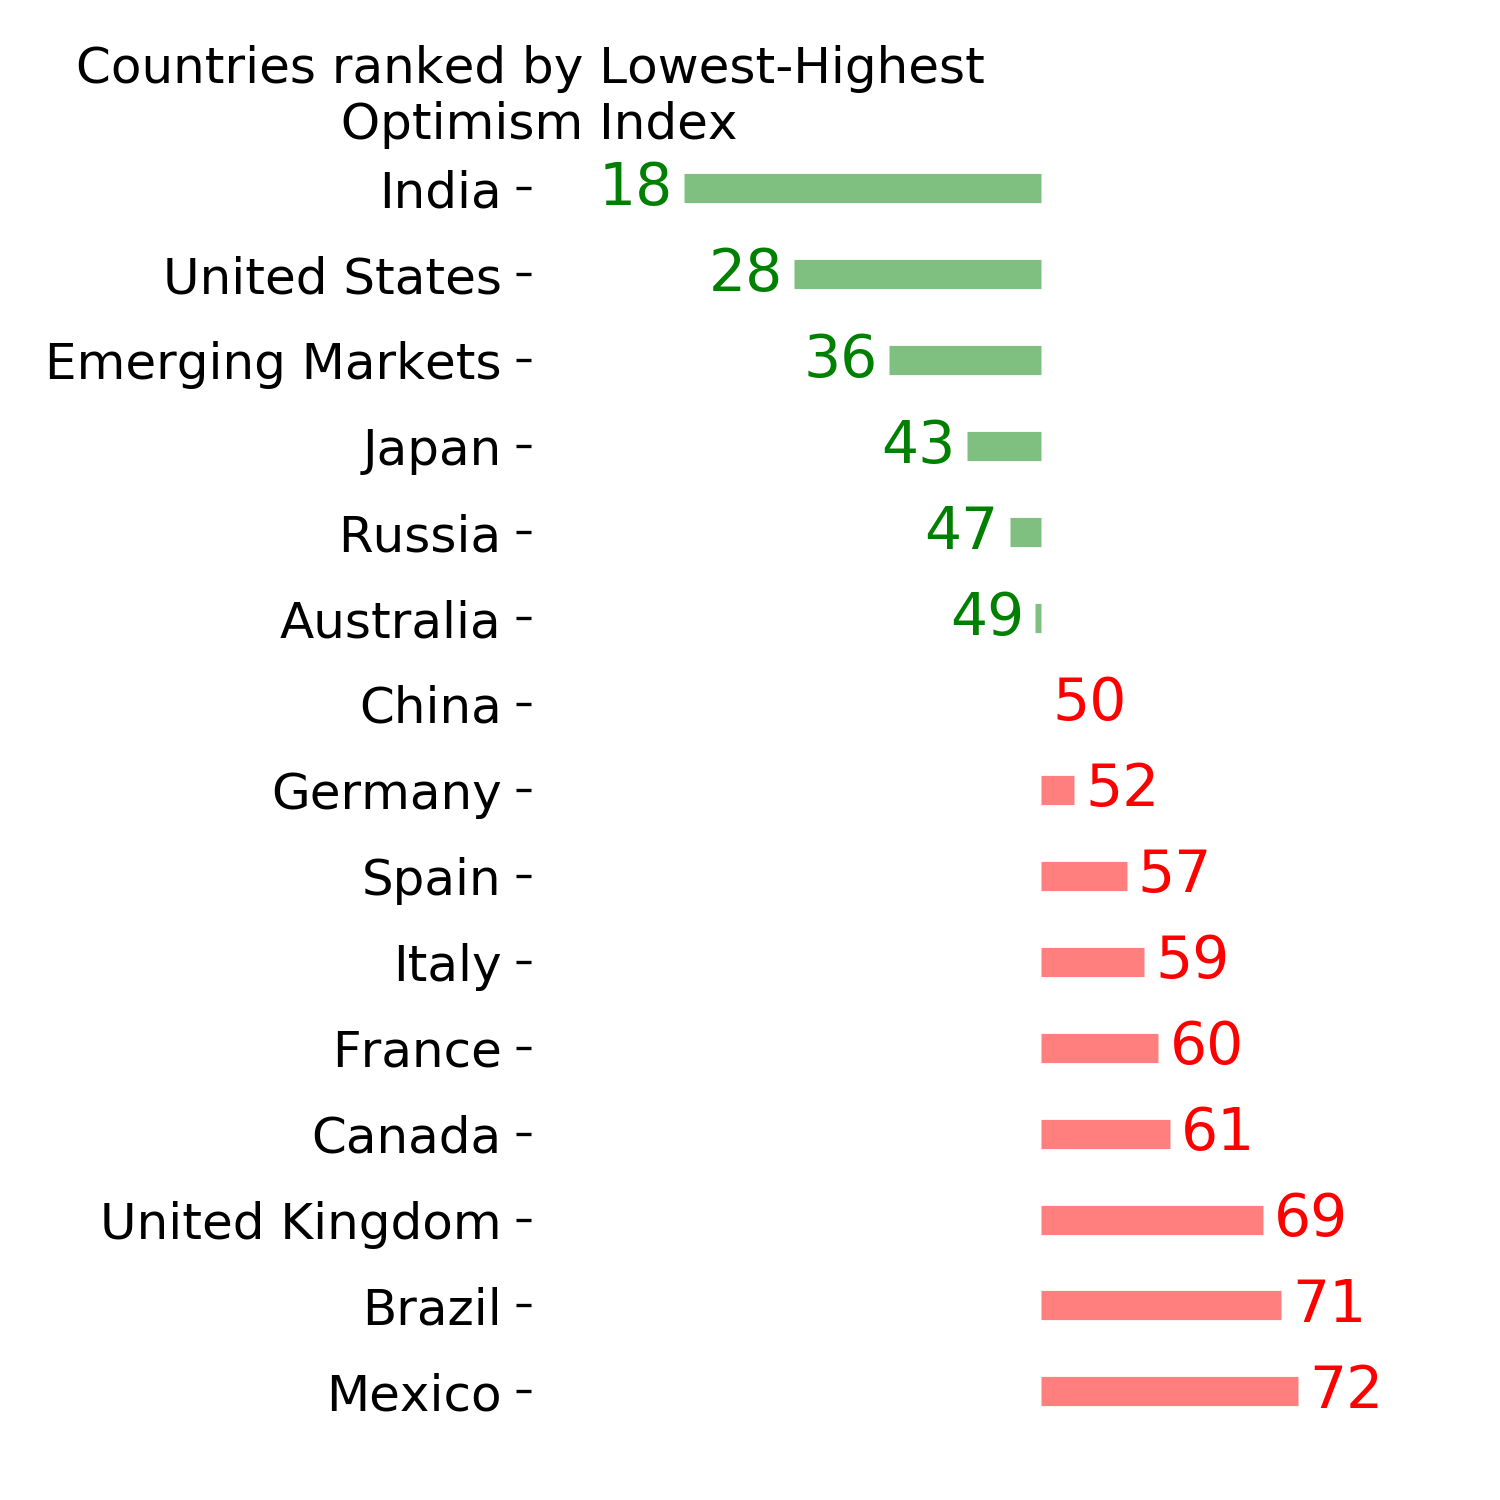
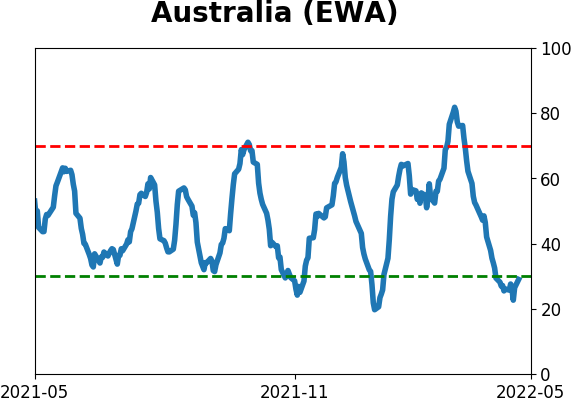
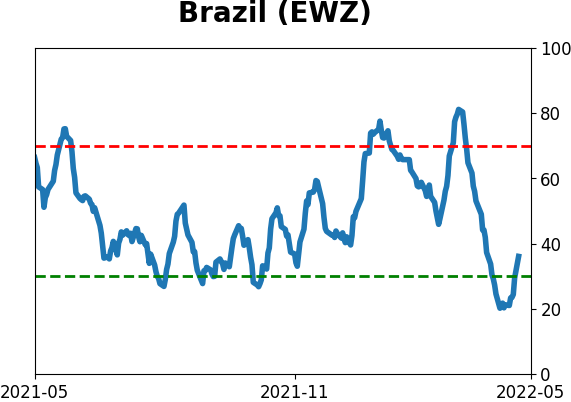
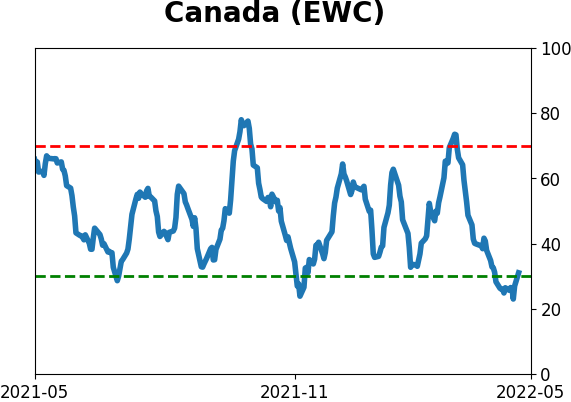
Country ETF's - 10-Day Moving Average
|
|
|
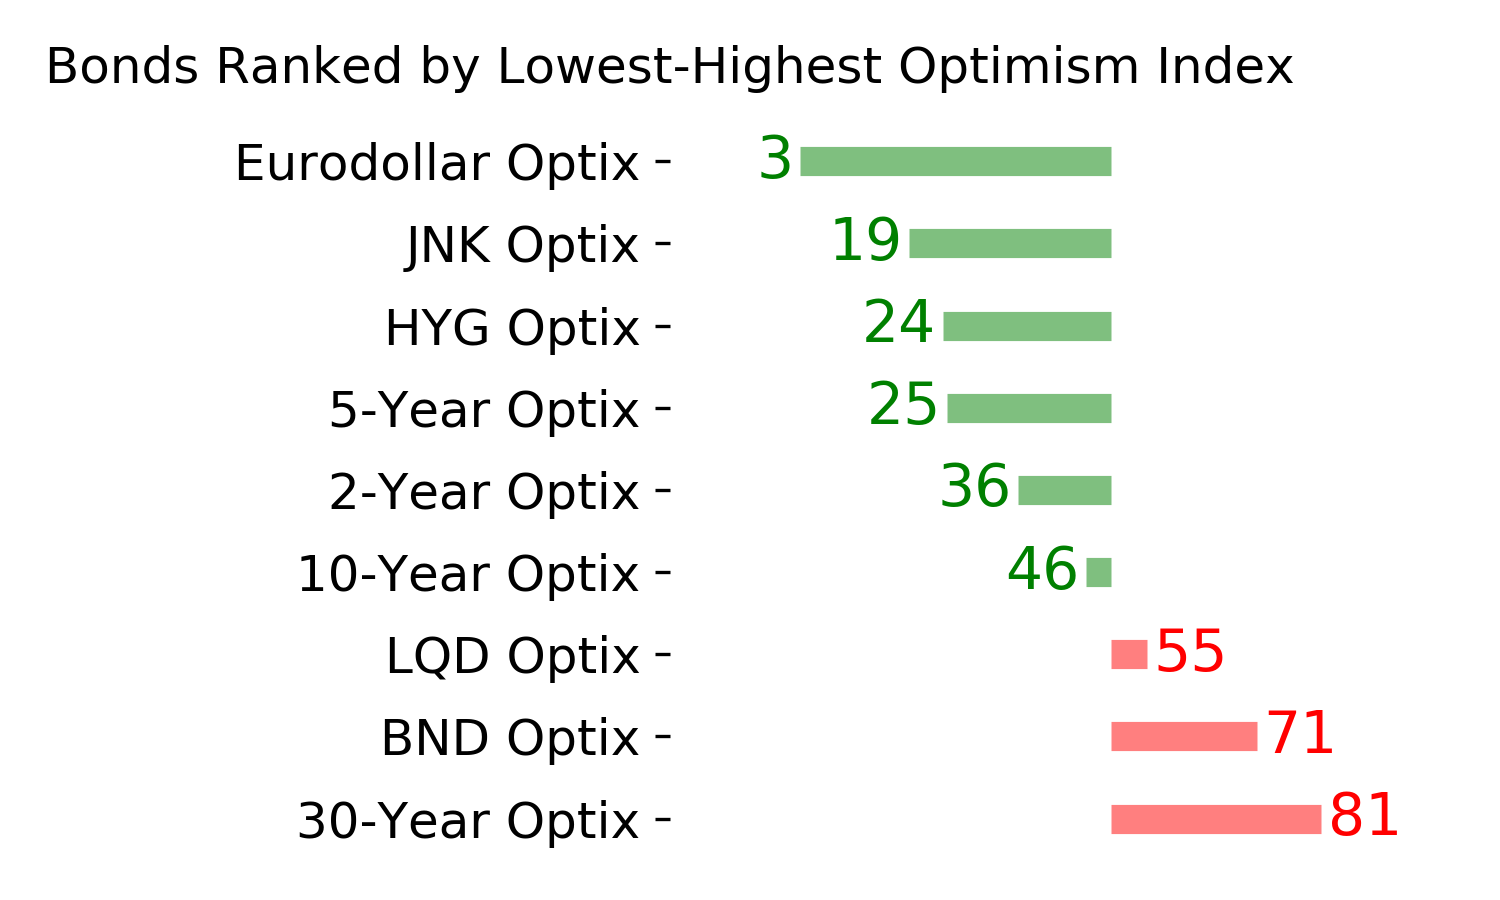
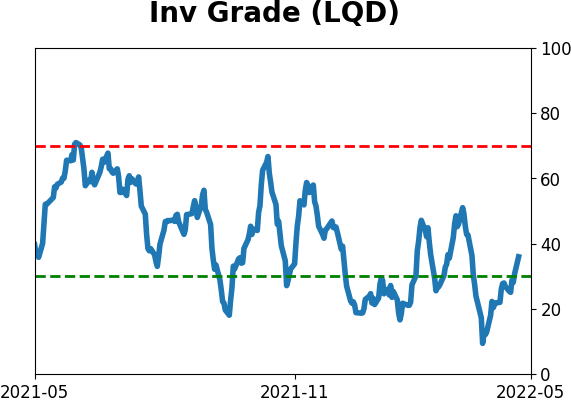
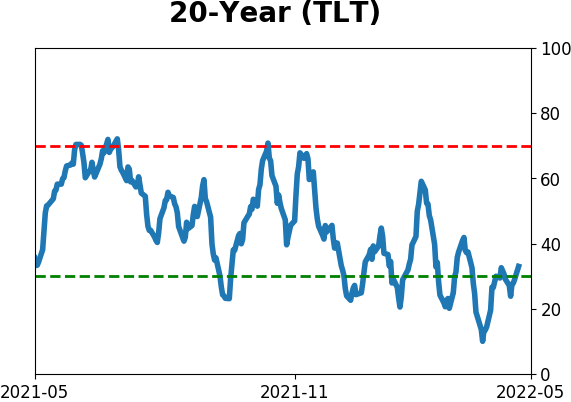
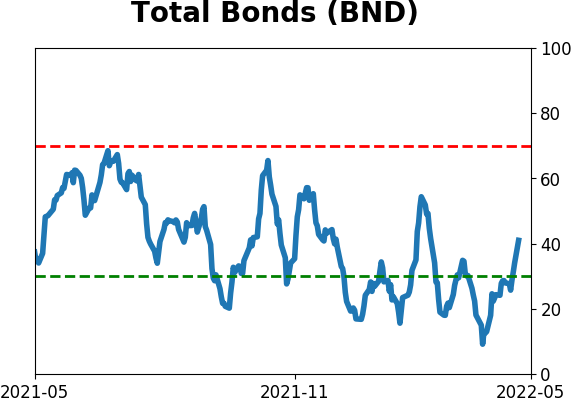
Bond ETF's - 10-Day Moving Average
|
|
|
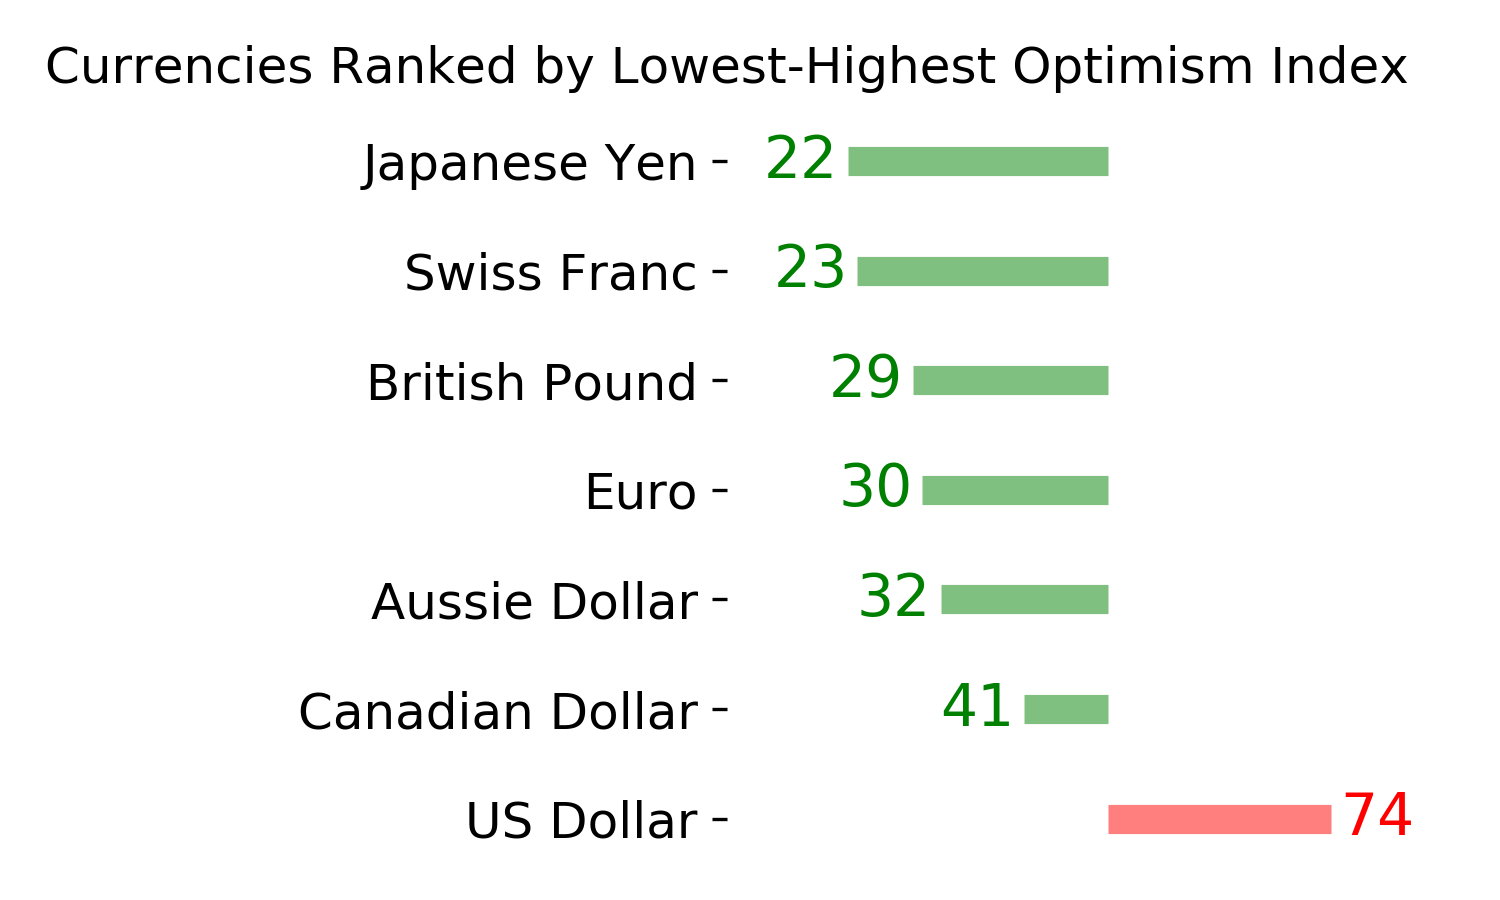
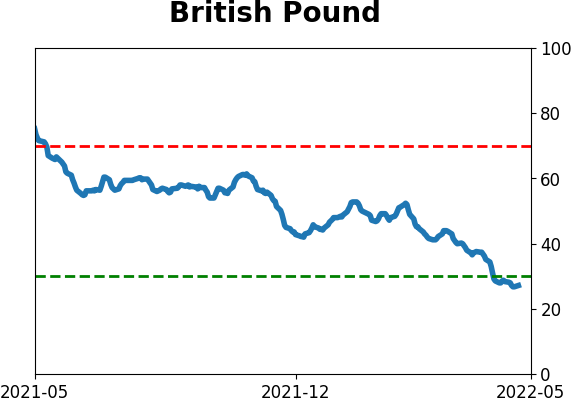
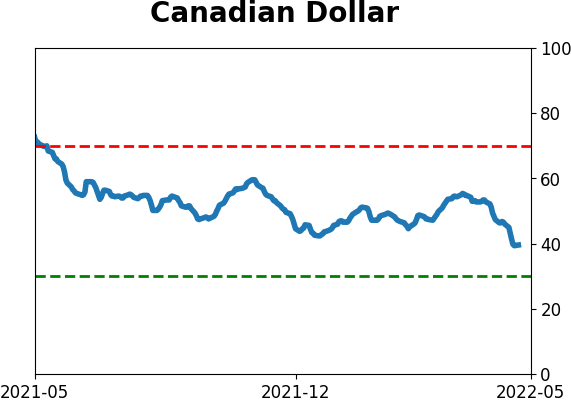
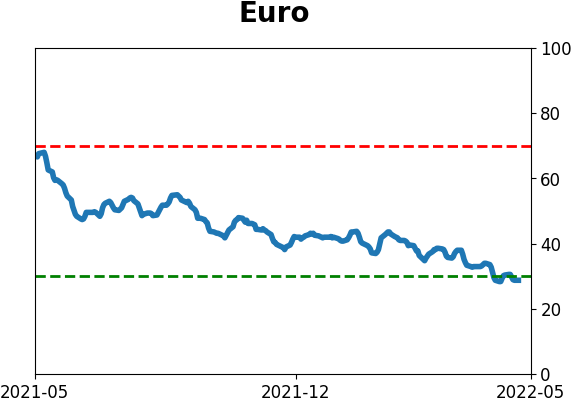
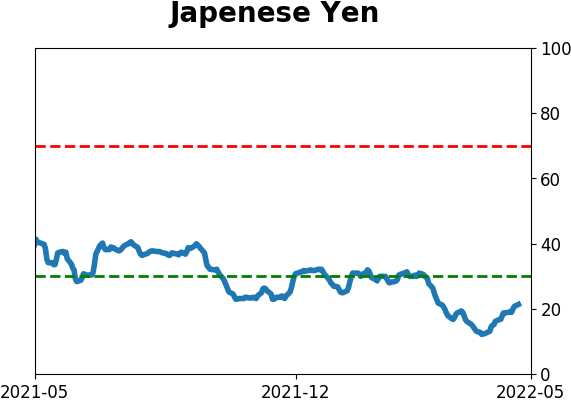
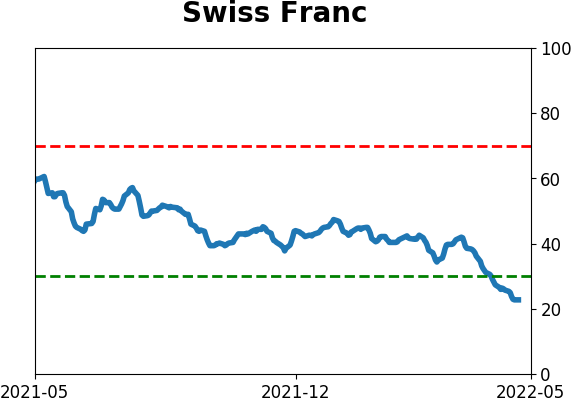
Currency ETF's - 5-Day Moving Average
|
|
|
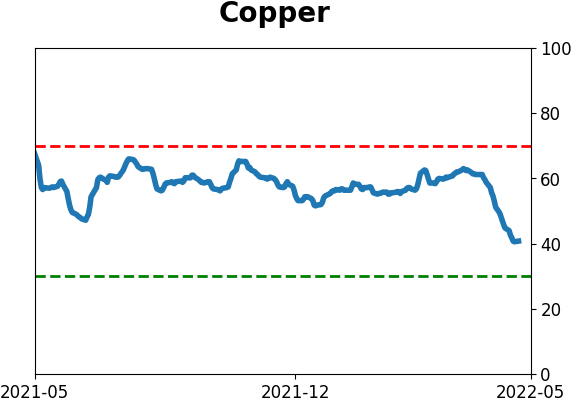
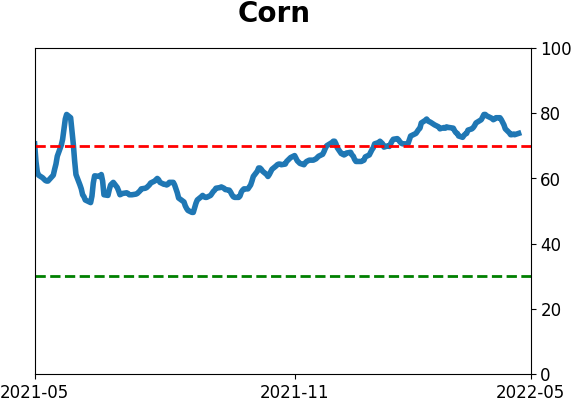
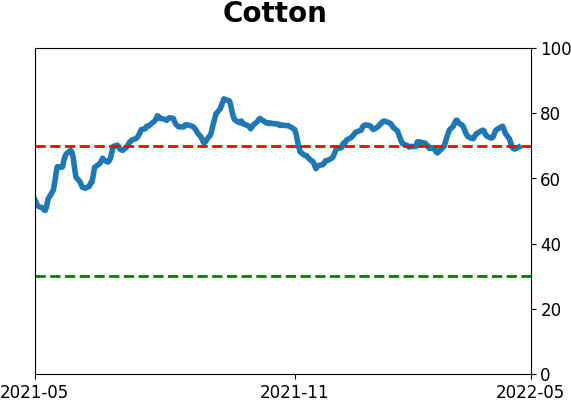
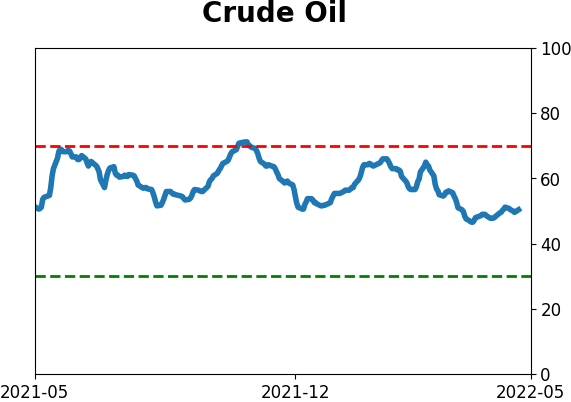
Commodity ETF's - 5-Day Moving Average
|
|