Headlines
|
|
Earnings are growing, and that's...good?:
Most investors are being comforted by relatively strong earnings reports, with S&P 500 companies in aggregate on track to report double-digit year-over-year growth. But markets don't operate logically, and strong earnings growth has tended to lead to below-average returns. That's especially the case when coming out of a protracted contraction in earnings.
|
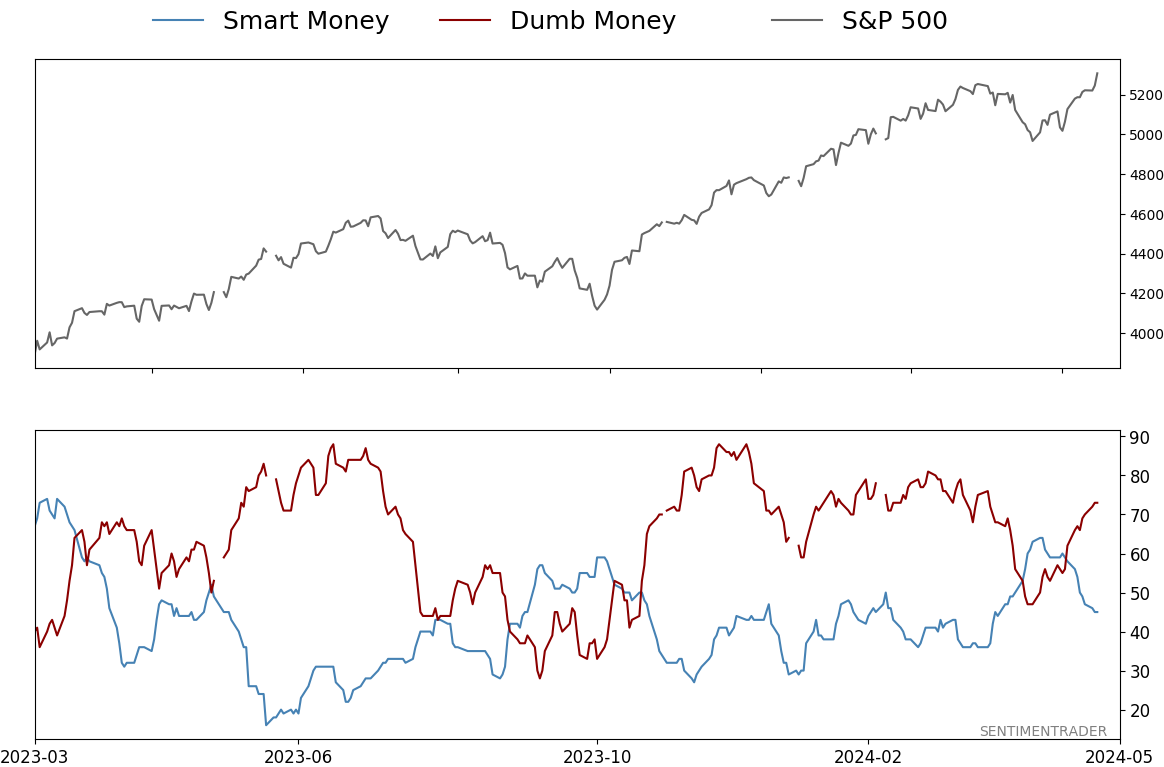
Smart / Dumb Money Confidence
|
Smart Money Confidence: 45%
Dumb Money Confidence: 73%
|
|
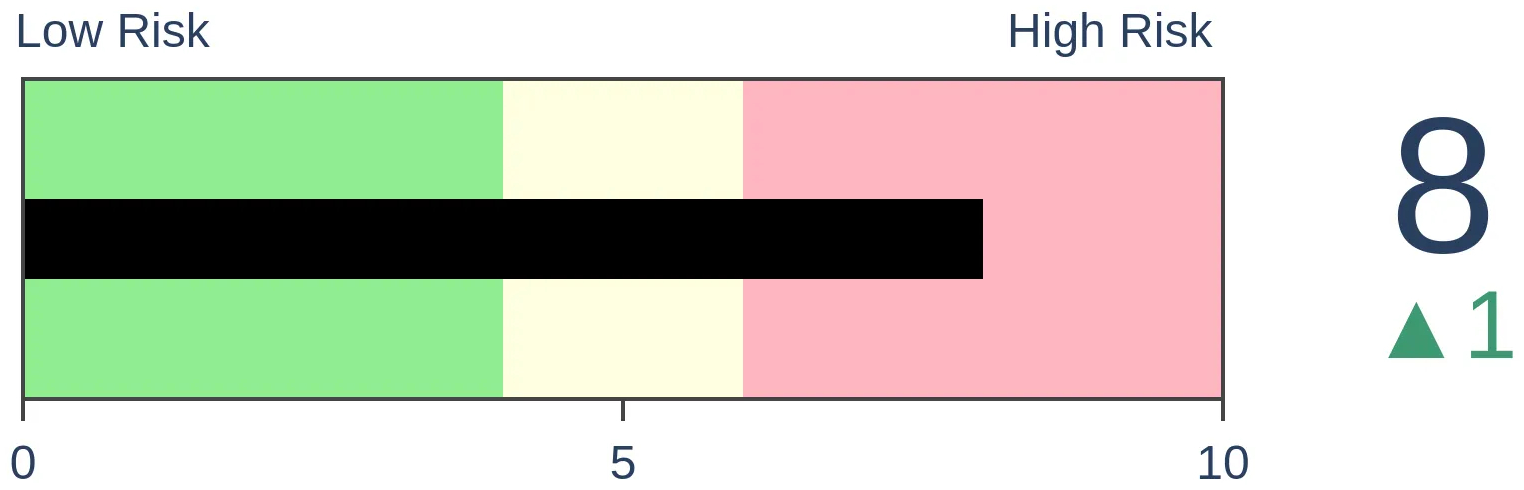
Risk Levels
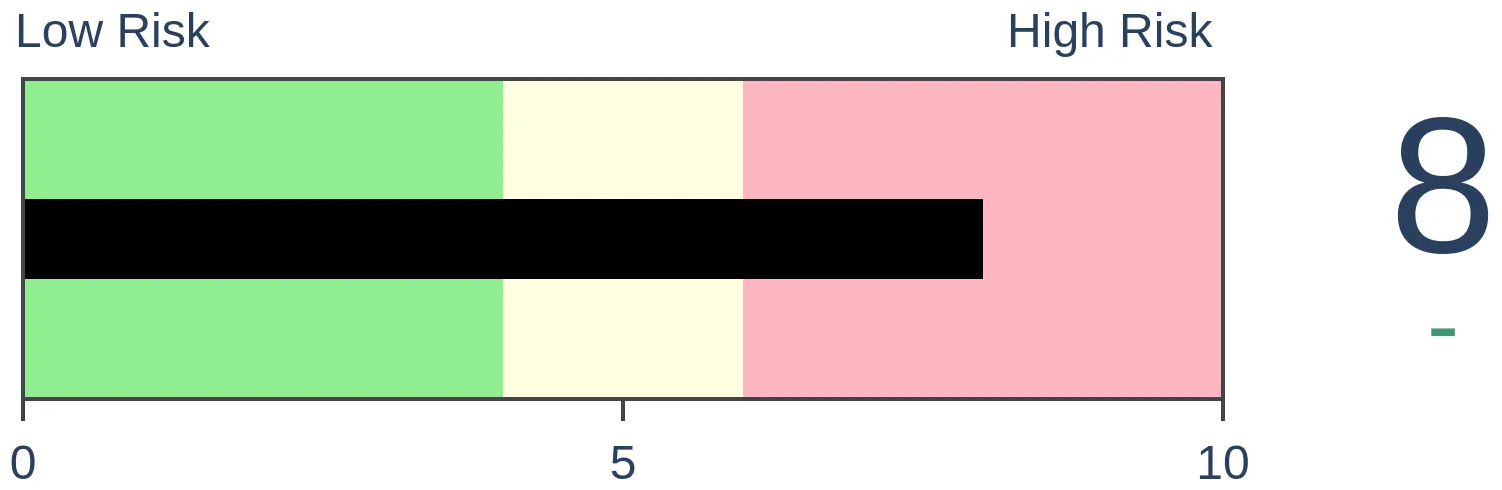
Stocks Short-Term
|
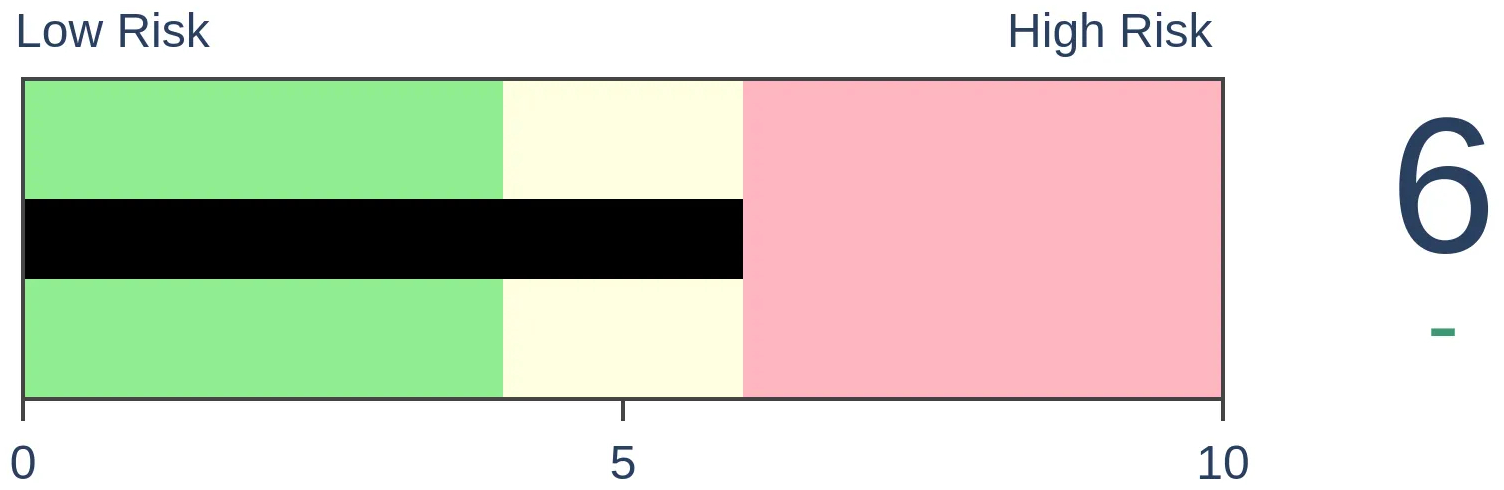
Stocks Medium-Term
|
|
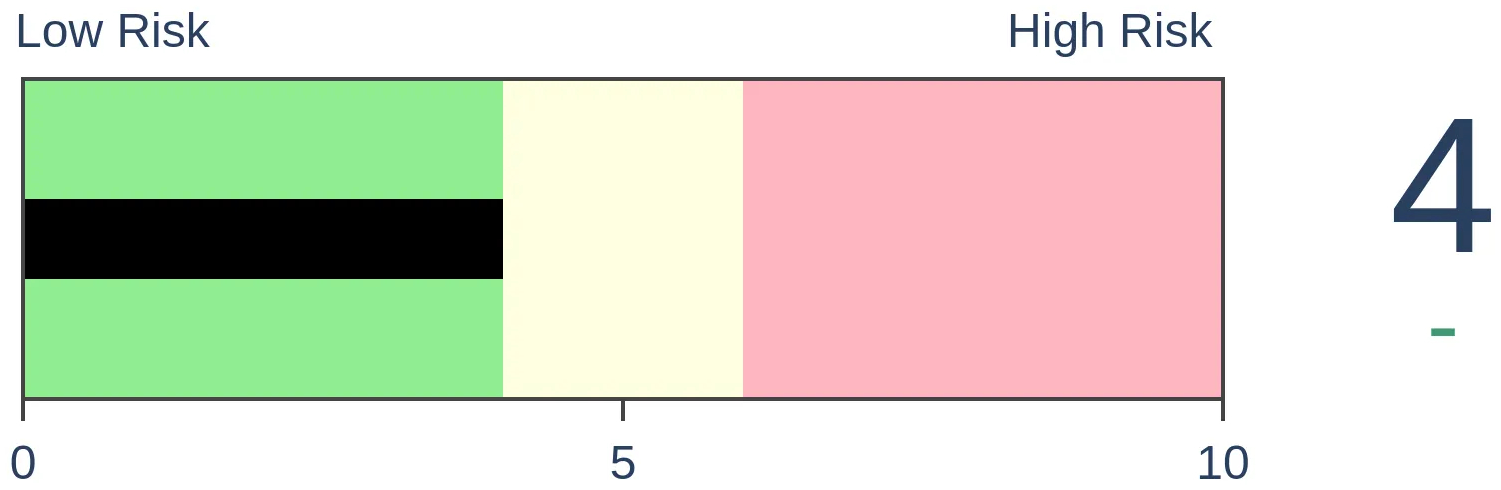
Bonds

|
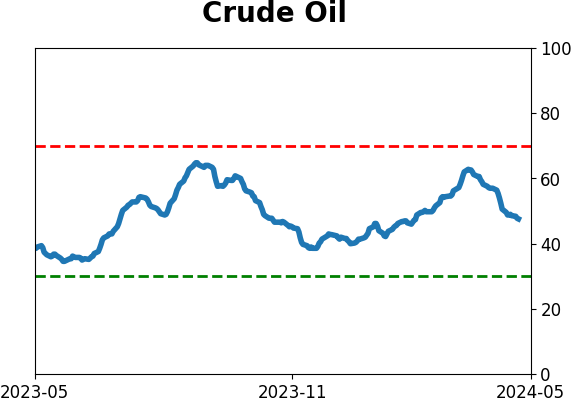
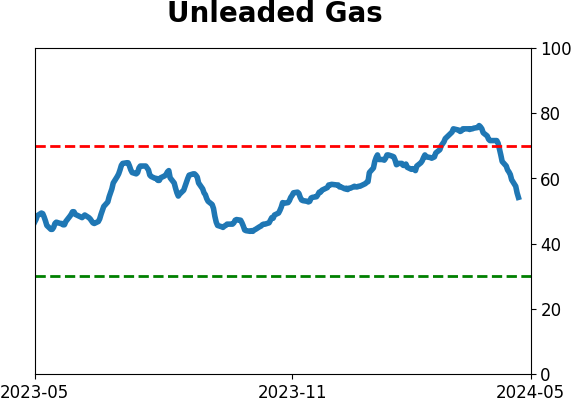
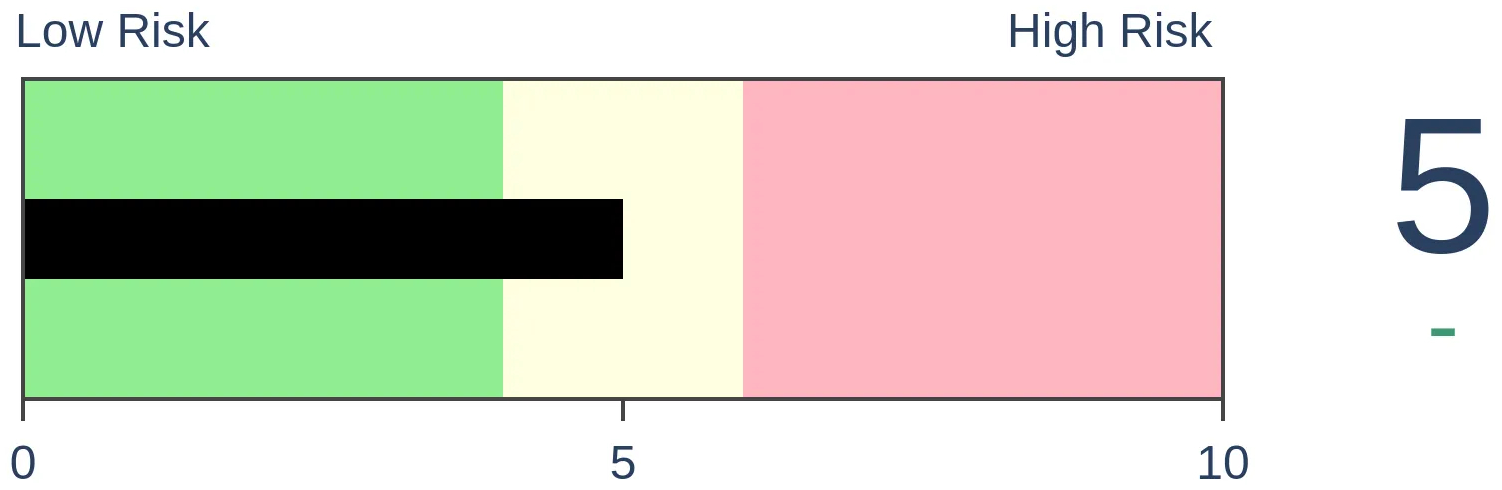
Crude Oil
|
|
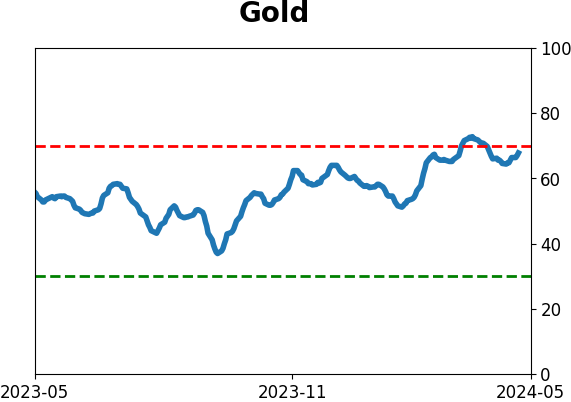
Gold
|
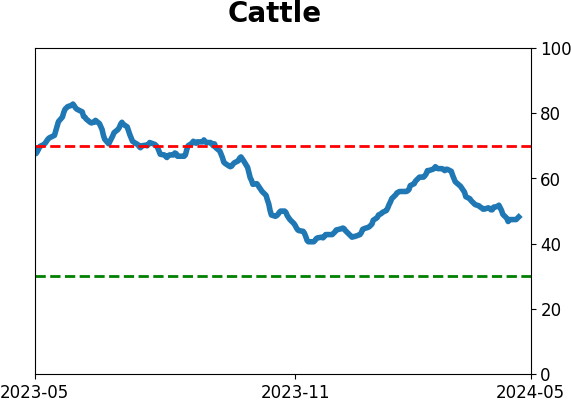
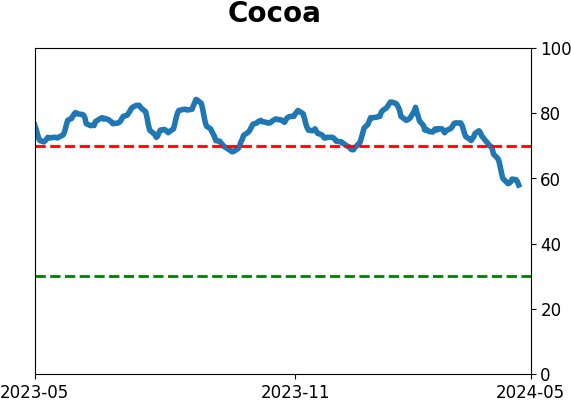
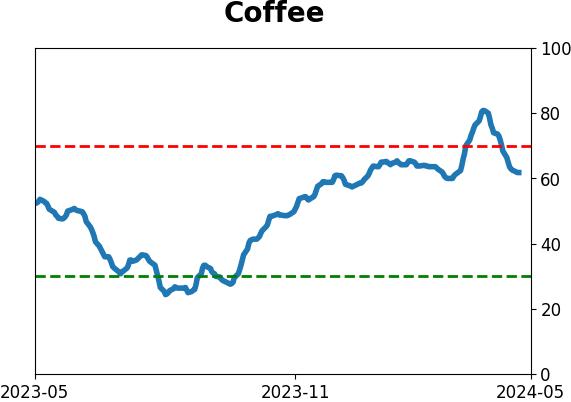
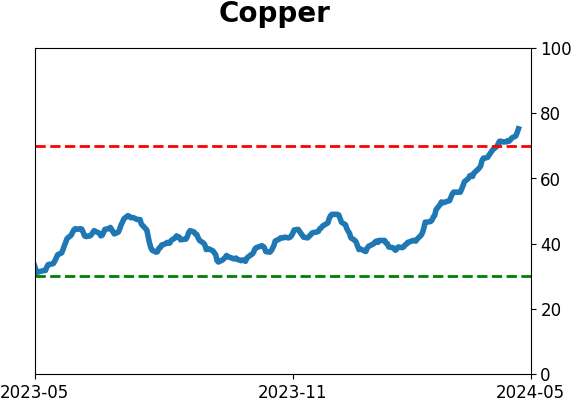
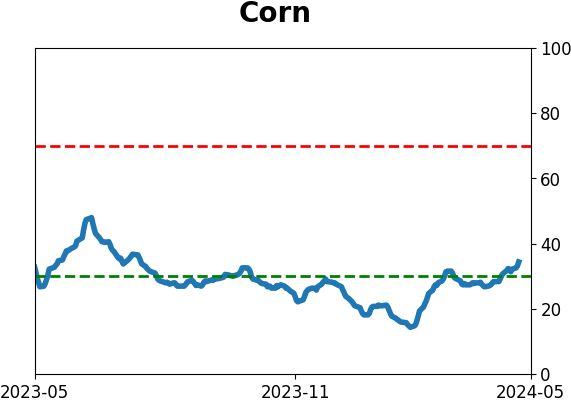
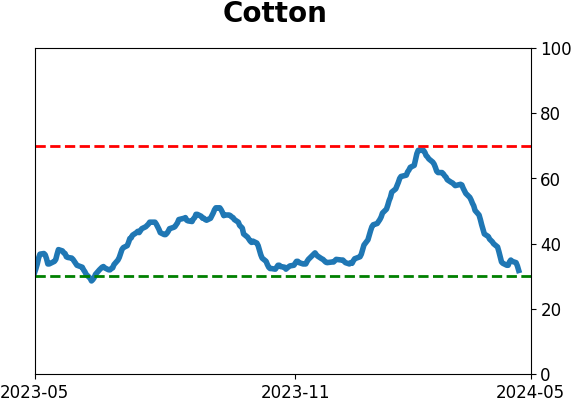
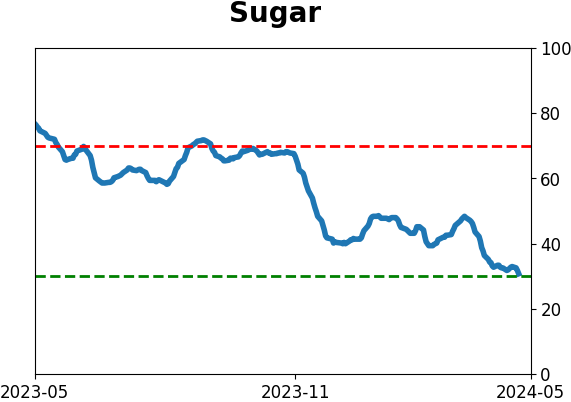
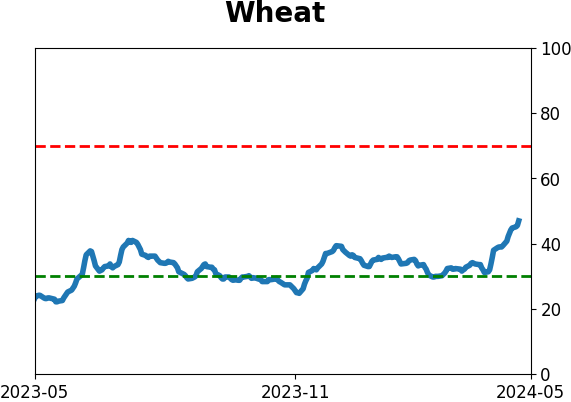
Agriculture
|
|
Research
By Jason Goepfert
BOTTOM LINE
Most investors are being comforted by relatively strong earnings reports, with S&P 500 companies in aggregate on track to report double-digit year-over-year growth. But markets don't operate logically, and strong earnings growth has tended to lead to below-average returns. That's especially the case when coming out of a protracted contraction in earnings.
FORECAST / TIMEFRAME
None
|
Key points:
- Earnings among S&P 500 companies are on track to grow more than 10% from Q1 2023
- This would be the 2nd consecutive double-digit earnings growth
- Ironically, strong earnings growth has not been helpful to forward returns, especially after a period of contraction
Double-digit earnings growth
The earnings reporting season for S&P 500 companies is about 87% complete, and the picture looks pretty healthy.
According to Standard & Poors, reported earnings are on track to grow just over 10% from the first quarter last year. That builds on 11% growth last quarter, the first back-to-back quarterly increases in a couple of years.
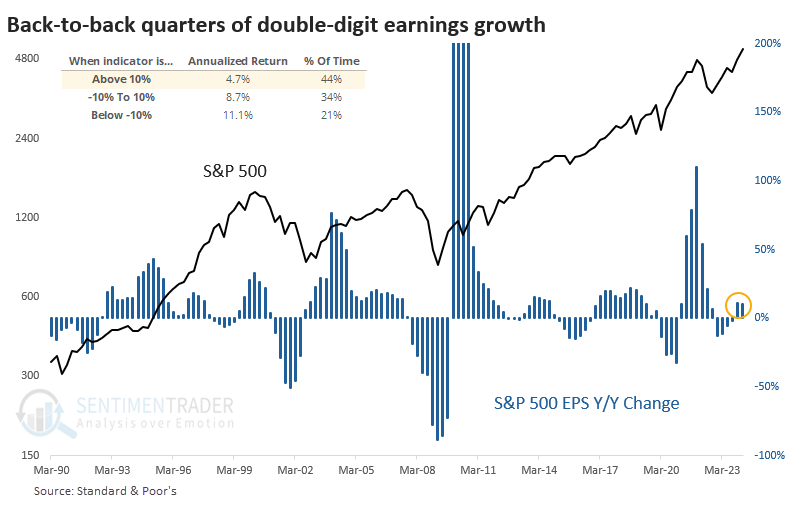
One of the cruel ironies of markets is that what's obvious is often not helpful. It should be obvious that earnings growth is good for stock prices. And double-digit growth should be even better.
That hasn't been the case, however. Since 1901 (using reconstructed prices for the index), the S&P's annualized return when year-over-year quarterly earnings growth was +10% or better was only +4.7%. That was significantly below the return following average earnings growth and less than half when earnings were contracting sharply.
From contraction to growth
Maybe context will give us some further information. The table below shows how the S&P 500 performed after two consecutive quarters of earnings growth following at least two quarters of contraction. Because earnings are reported with a delay, we shifted the dates forward by 40 days from the end of the quarter to better reflect information that investors would have in real time.
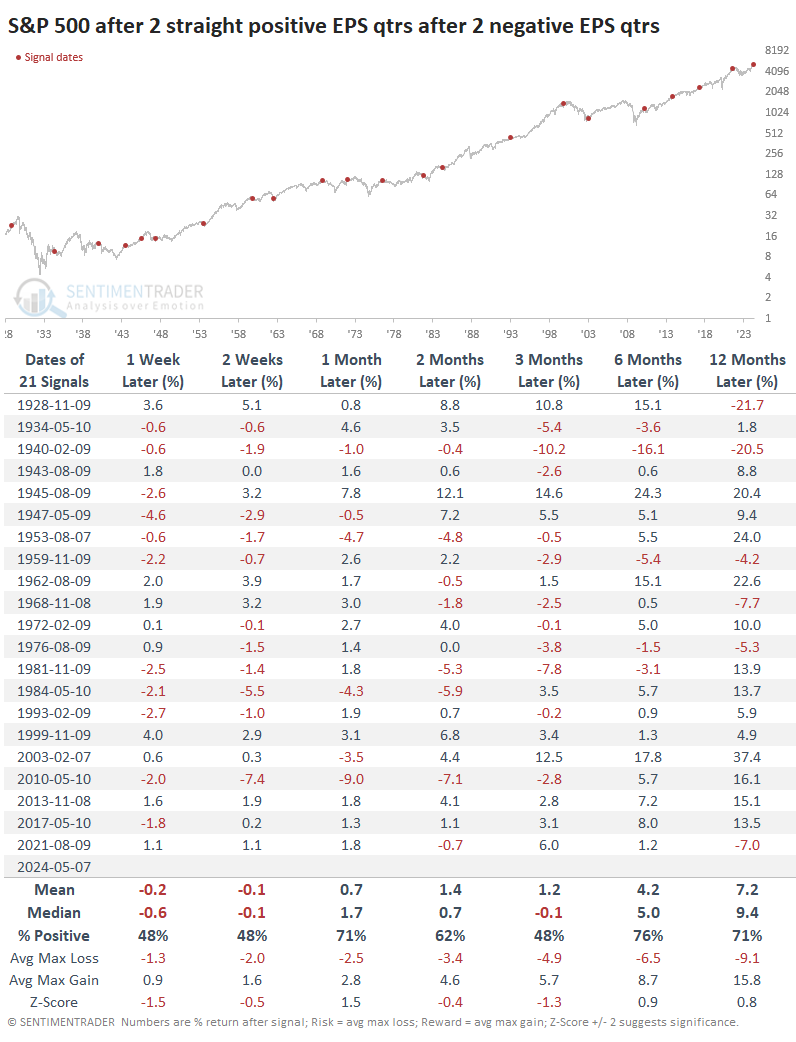
These weren't great signals for the S&P, but they were not terrible, either. The index gyrated between gains and losses across time frames, and its returns were mostly in line with random. The risk/reward was mostly positive, if unimpressive.
The current case is a bit more extreme than usual. Companies in the S&P 500 had suffered at least four quarters of contracting earnings and then enjoyed two quarters of double-digit growth. The table below shows all similar scenarios.
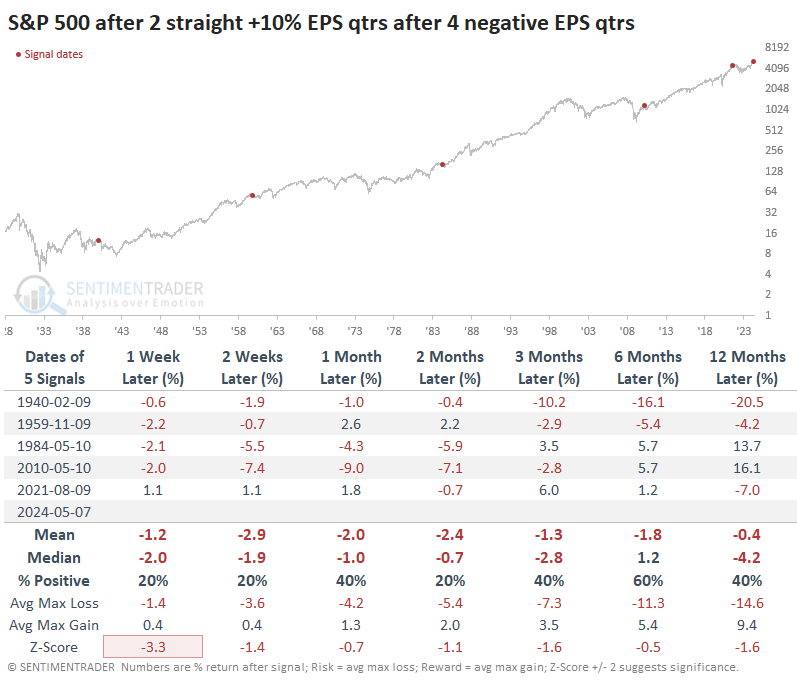
Well, this was even worse for forward returns. Either two or three months later, the S&P sported a negative return each time. The risk was more than twice as large as the reward, and only two of the signals managed to turn around and show meaningful gains over the next 6-12 months.
What the research tells us...
For contrarian investors, who tend to see value as opposed to risk when prices decline, earnings growth isn't necessarily comforting. When that growth is double-digit, they get even more worried as others get more comfortable. There is some basis in their worry, as forward returns after significant earnings growth tend to be below average. After double-digit growth following a prolonged contraction, returns were even worse, even though the sample size was painfully small. There haven't been many studies with negative conclusions for the past year and a half, but we'd have to rate this as one...or, at the very least, not super supportive of the tailwinds from breadth and price momentum.
Indicators at Extremes
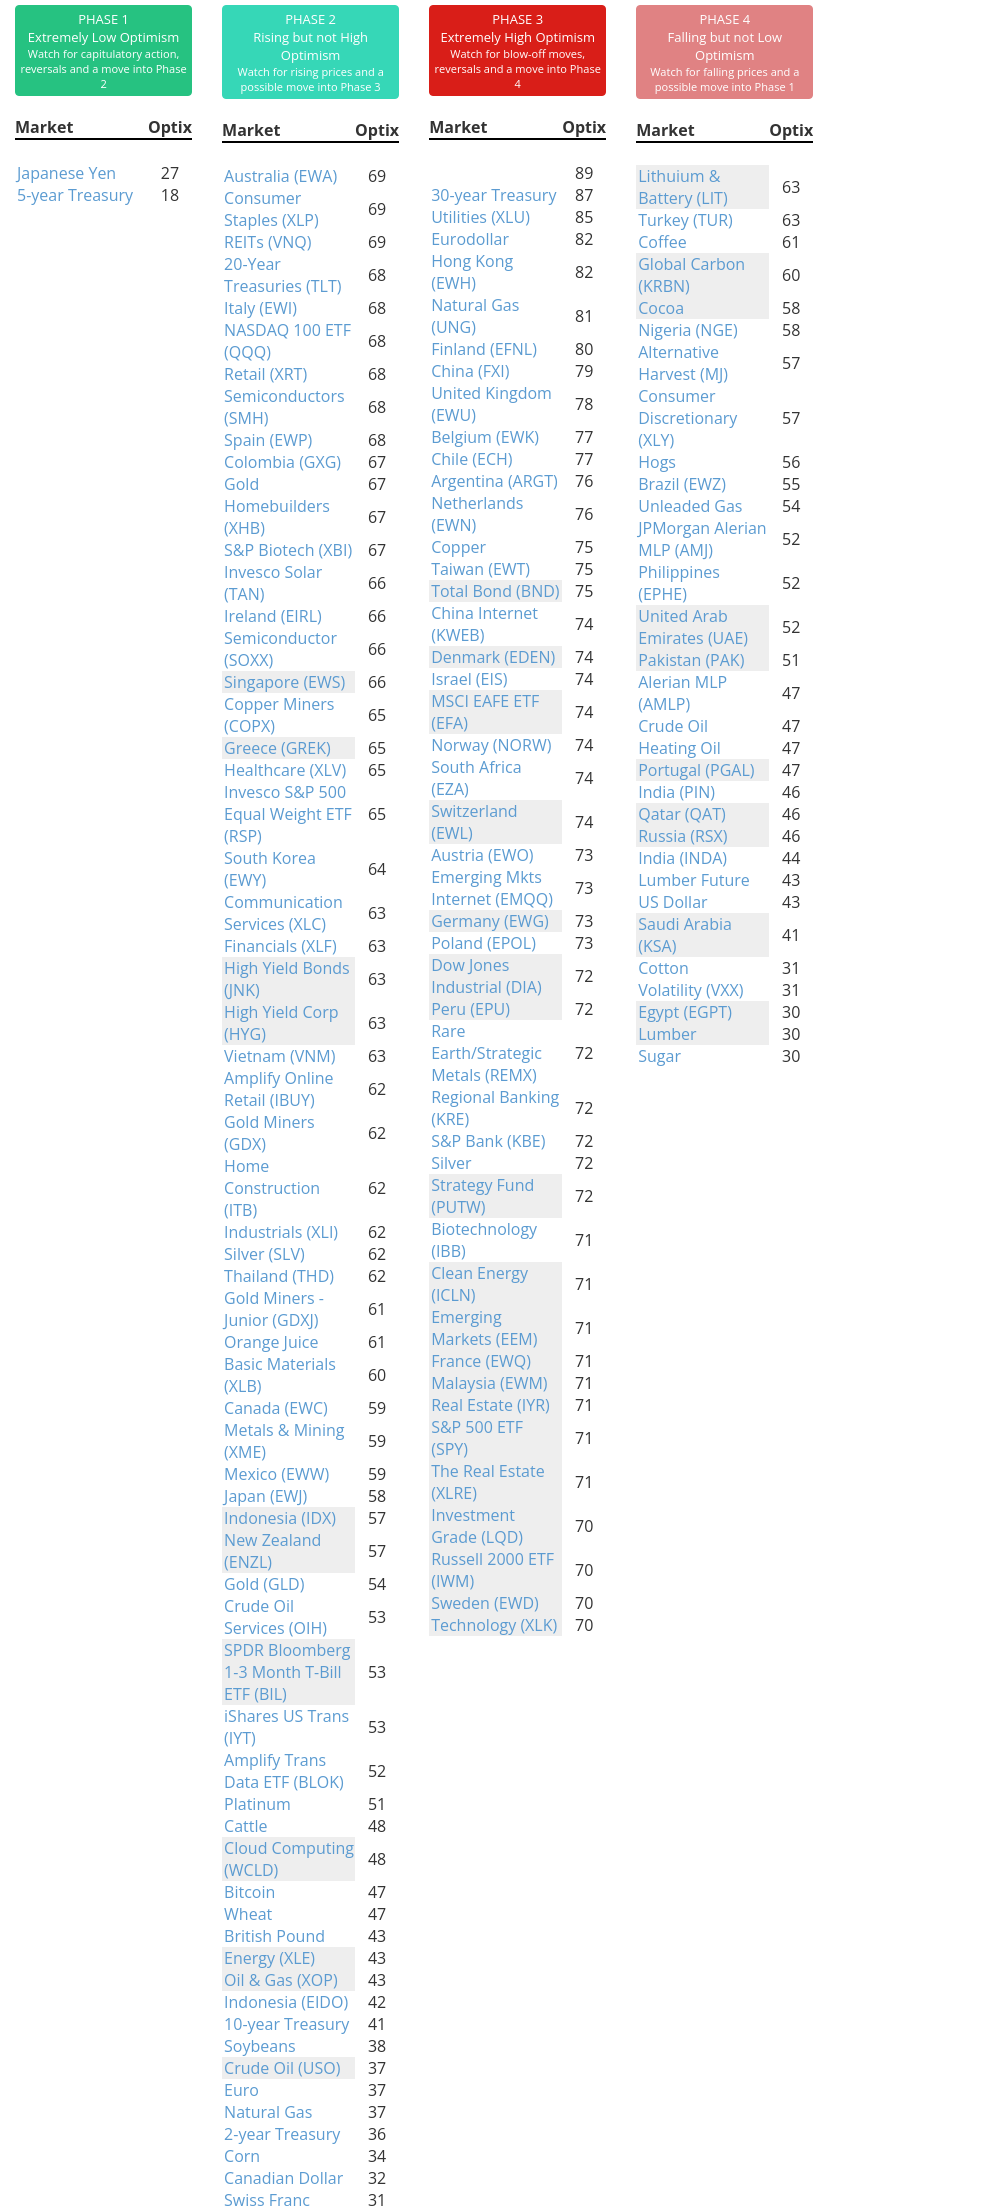
Phase Table
Ranks
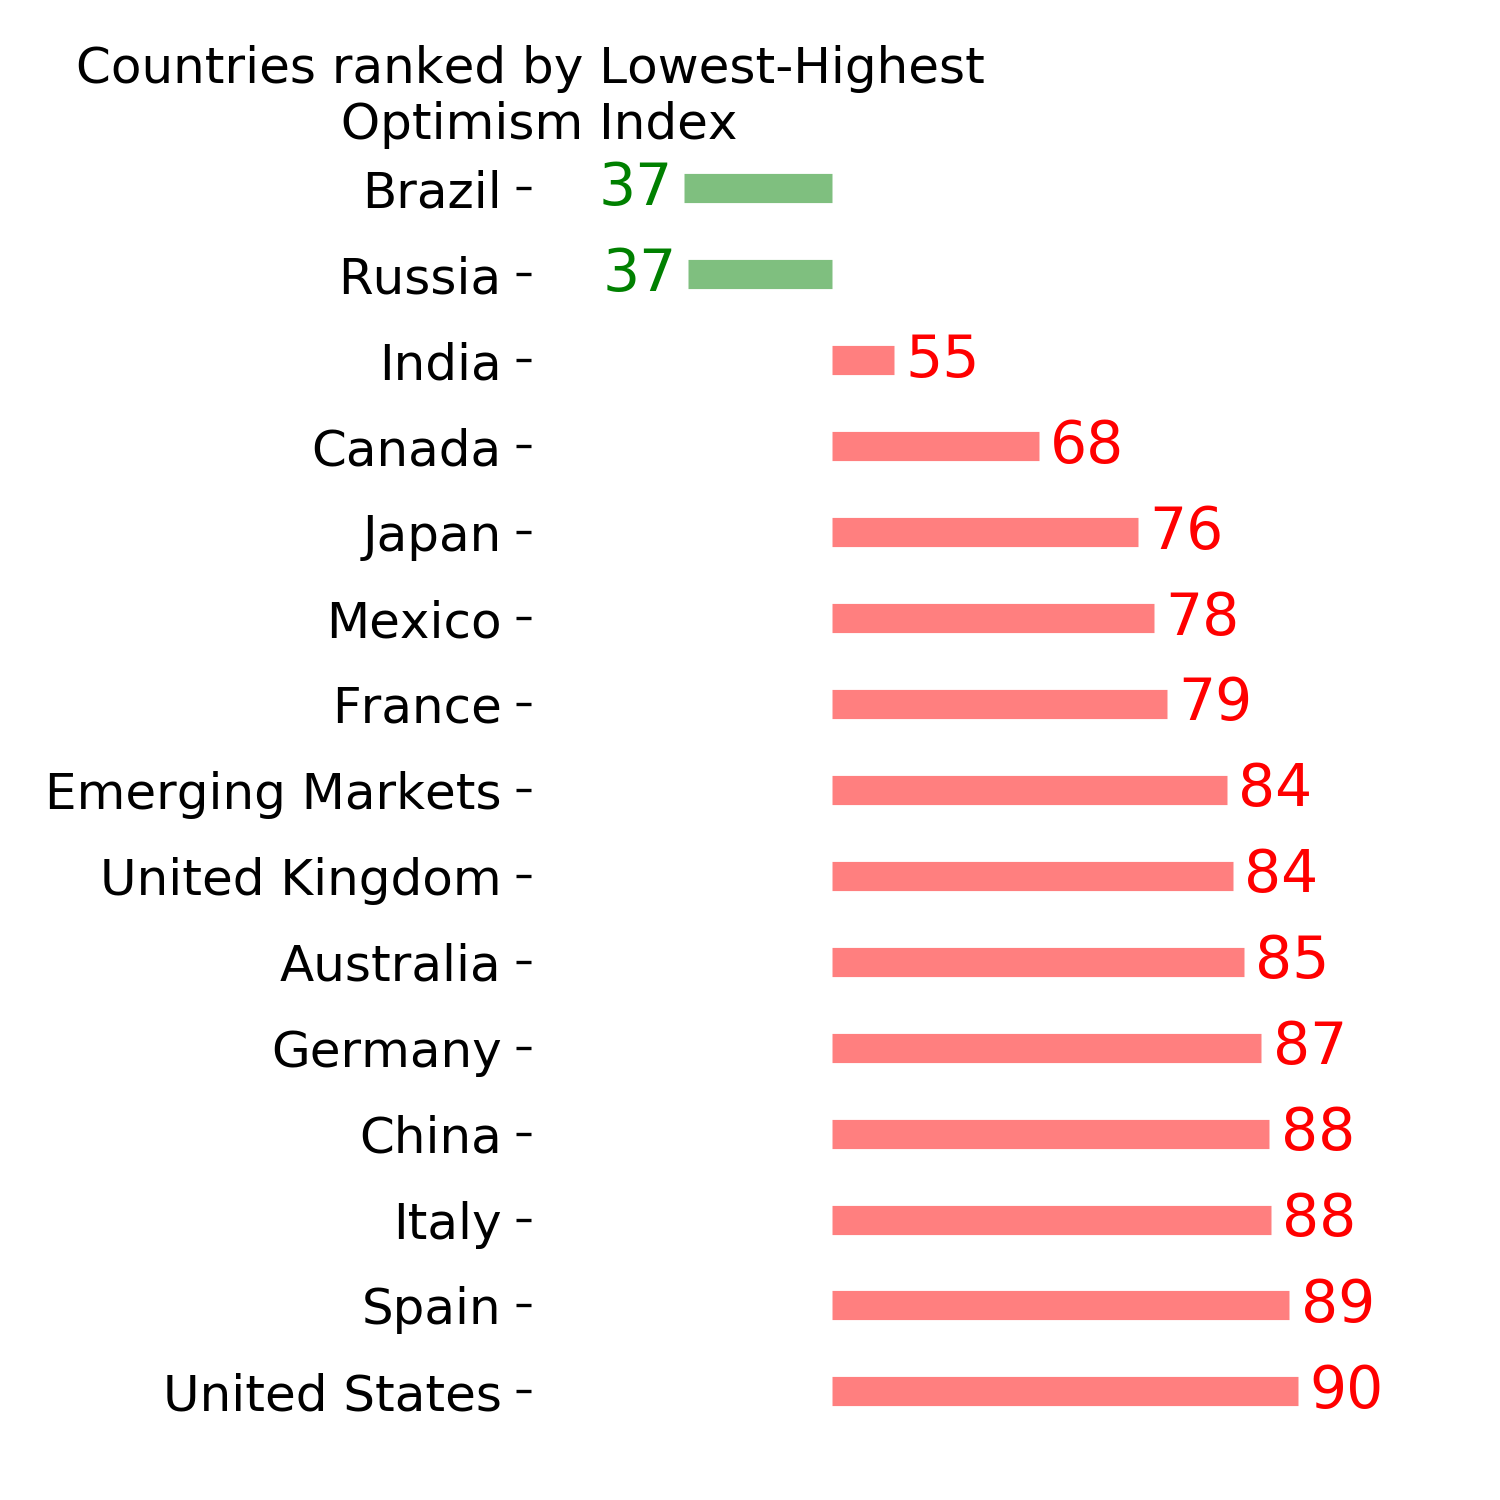
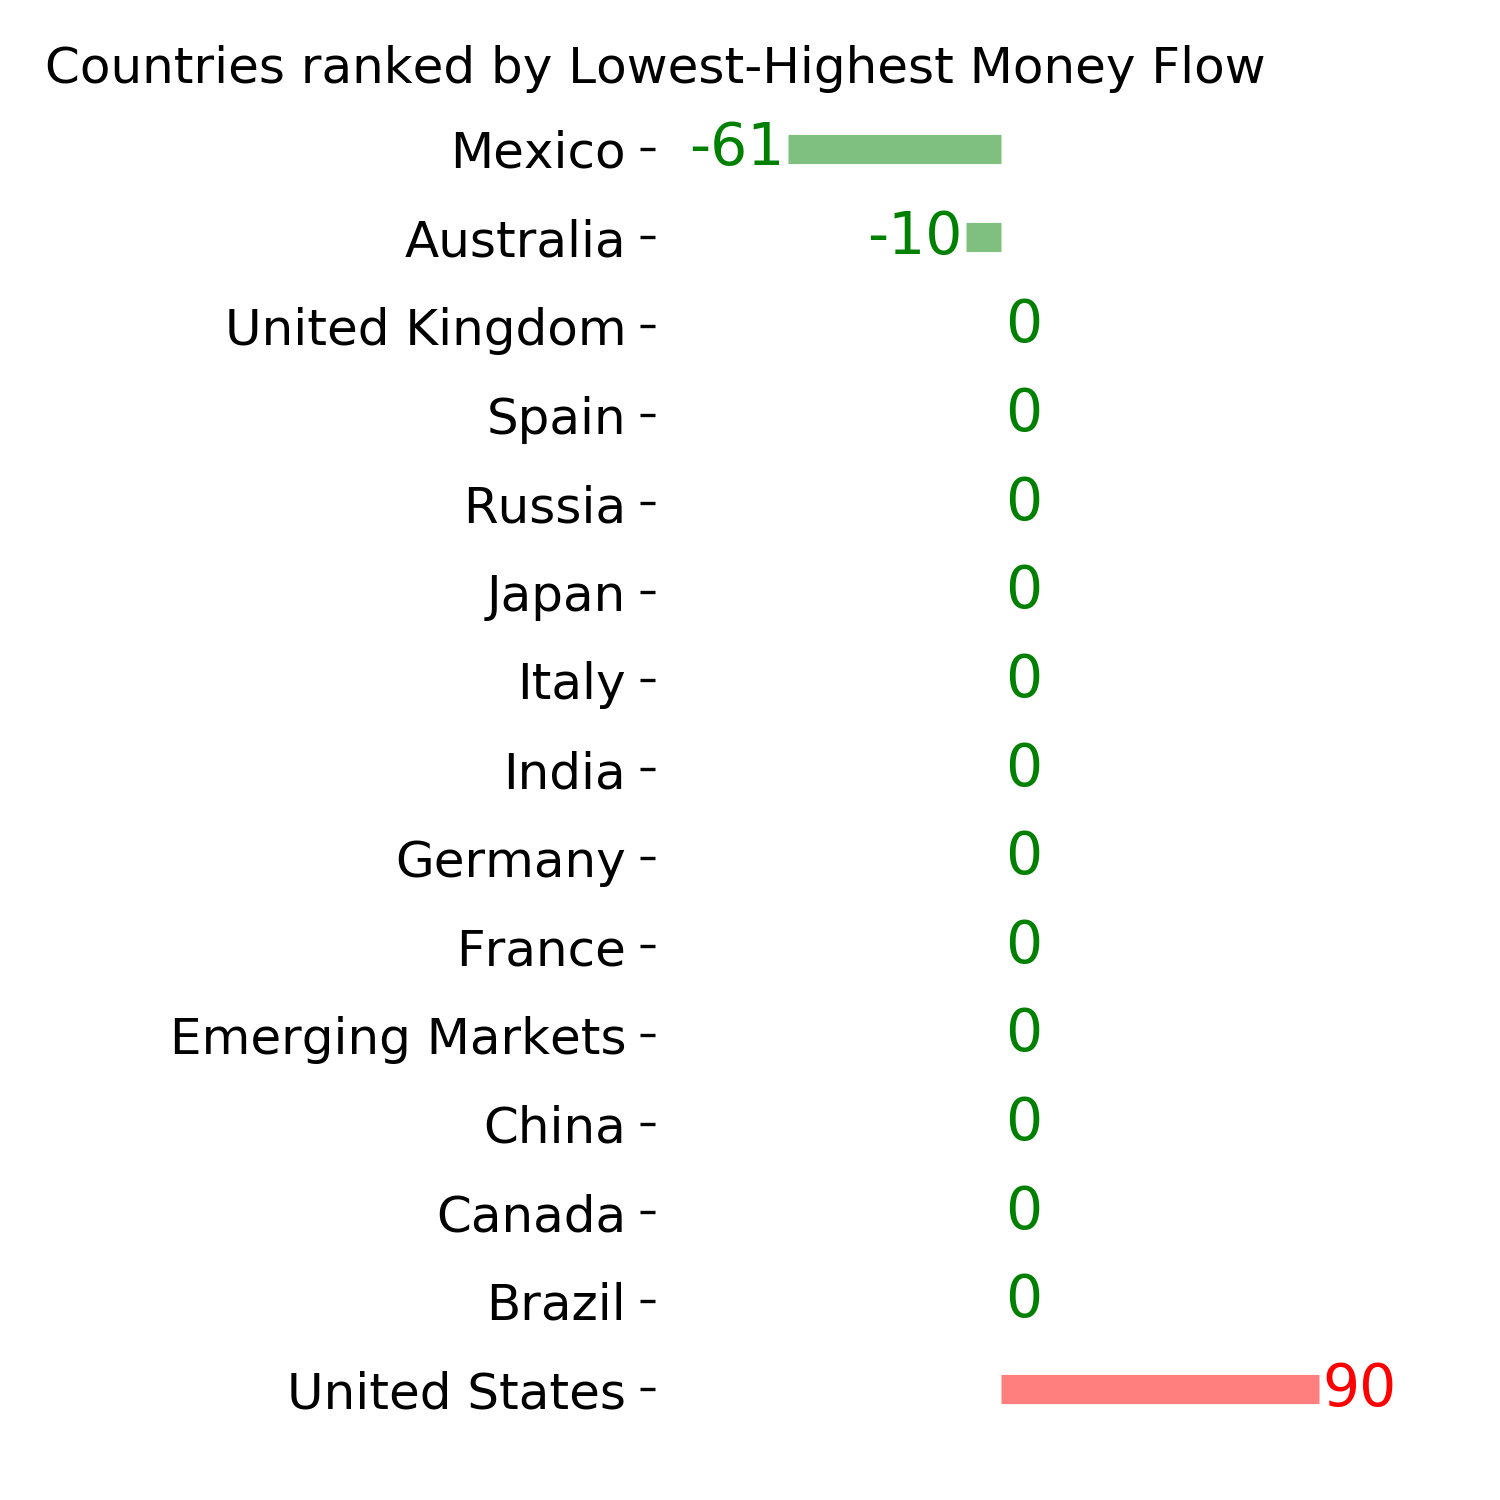
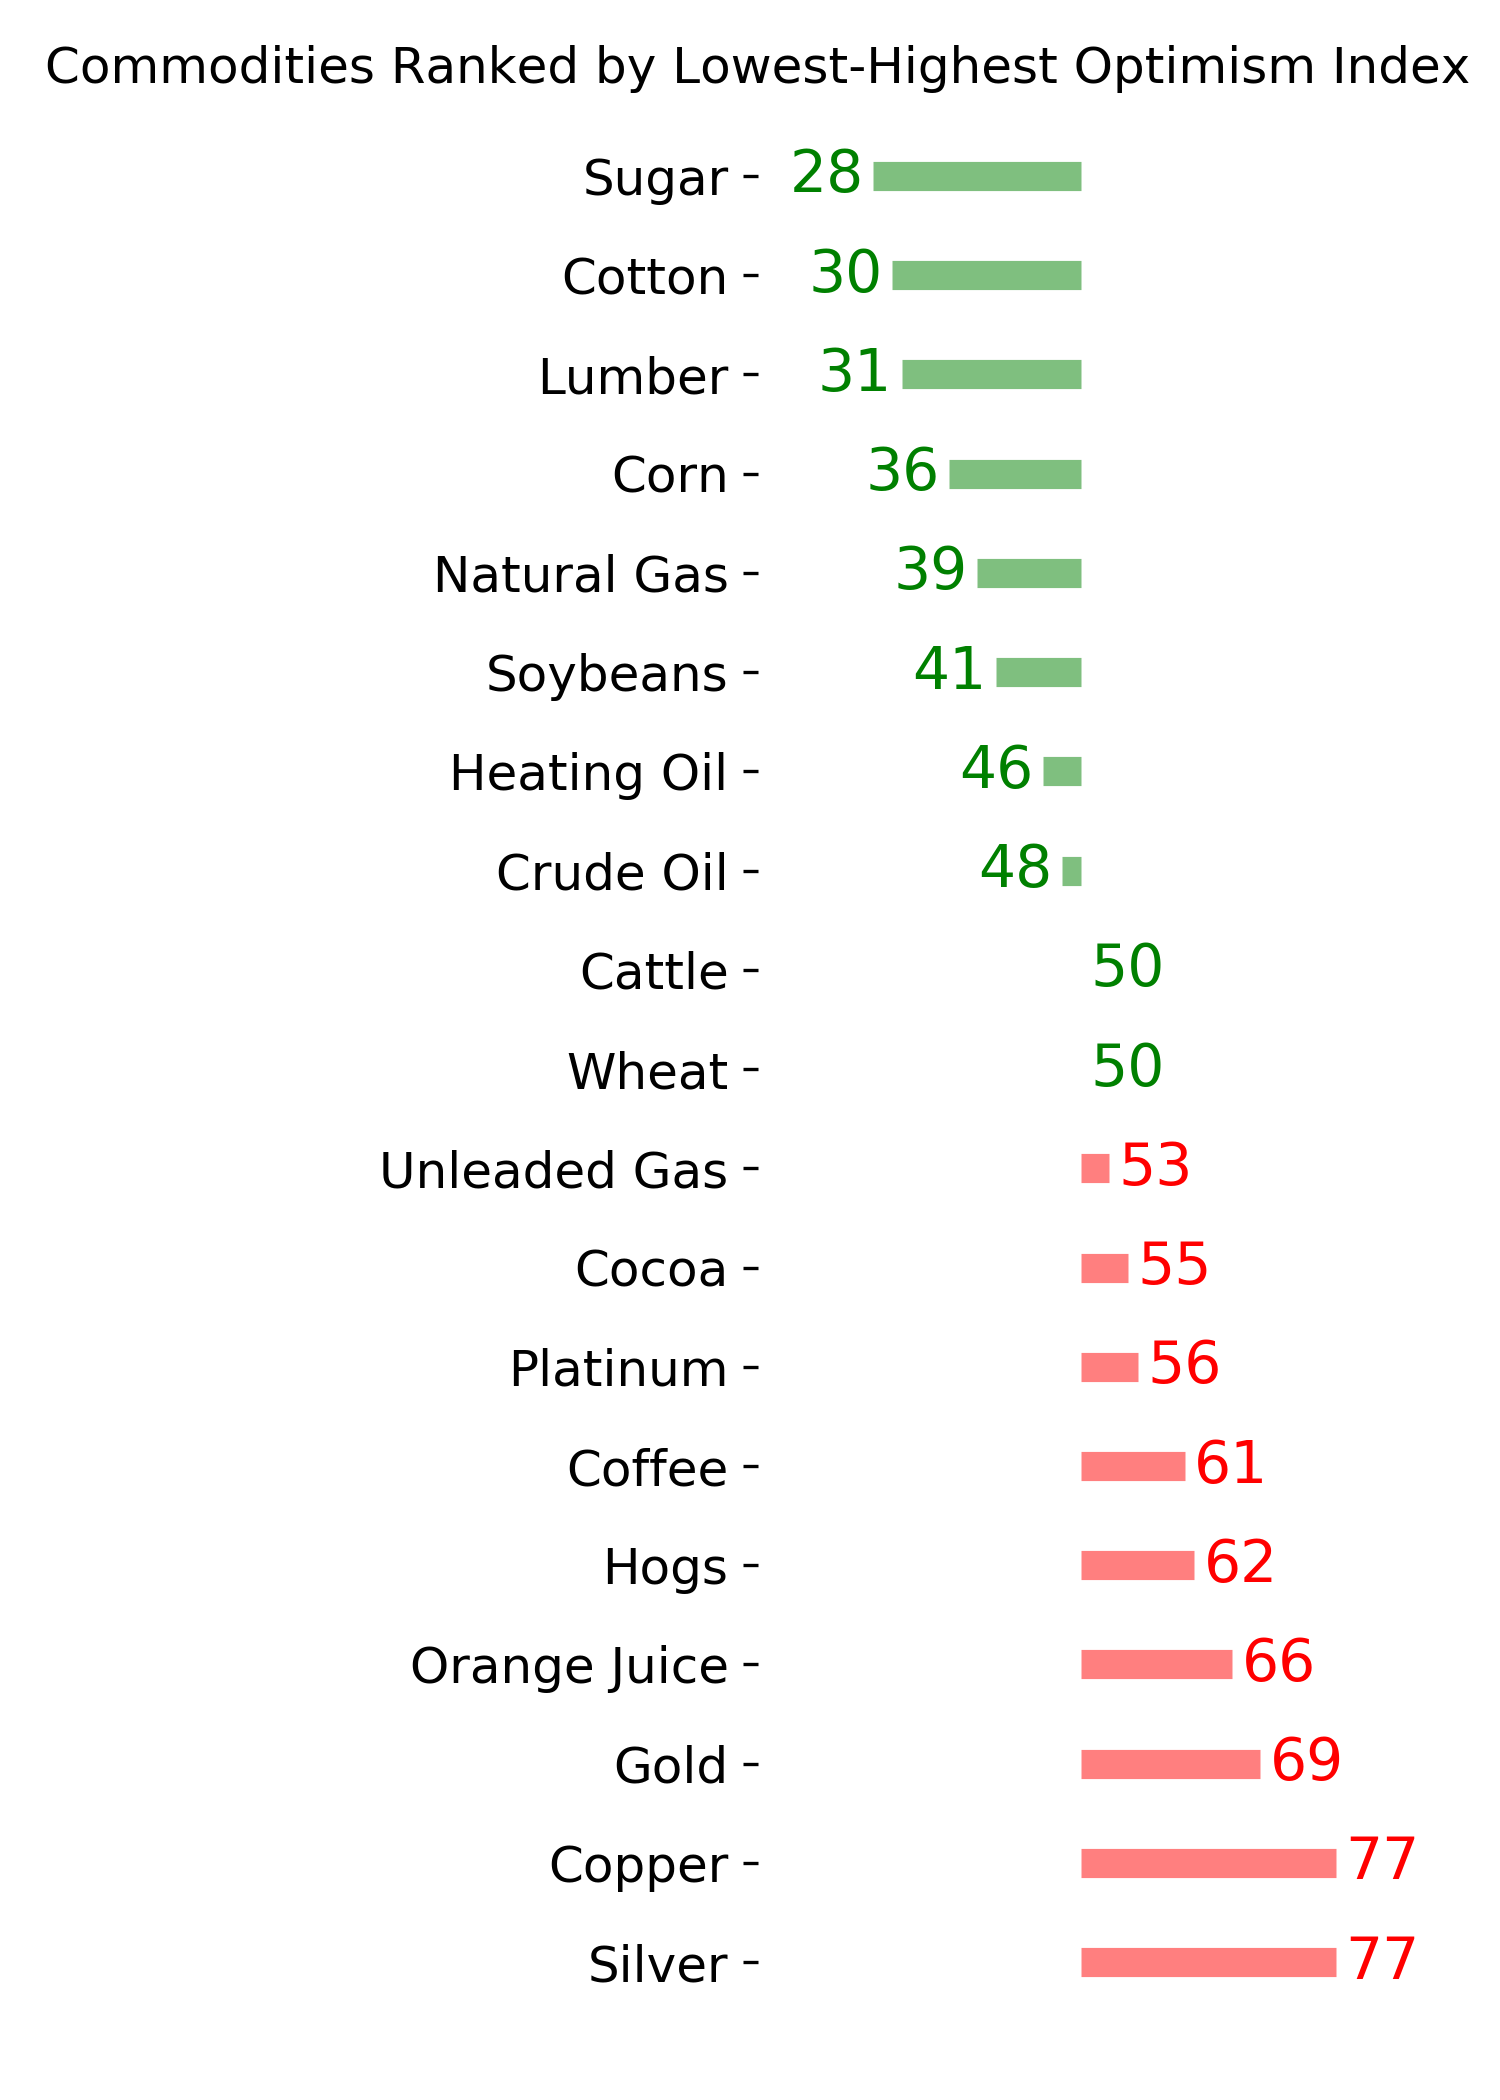
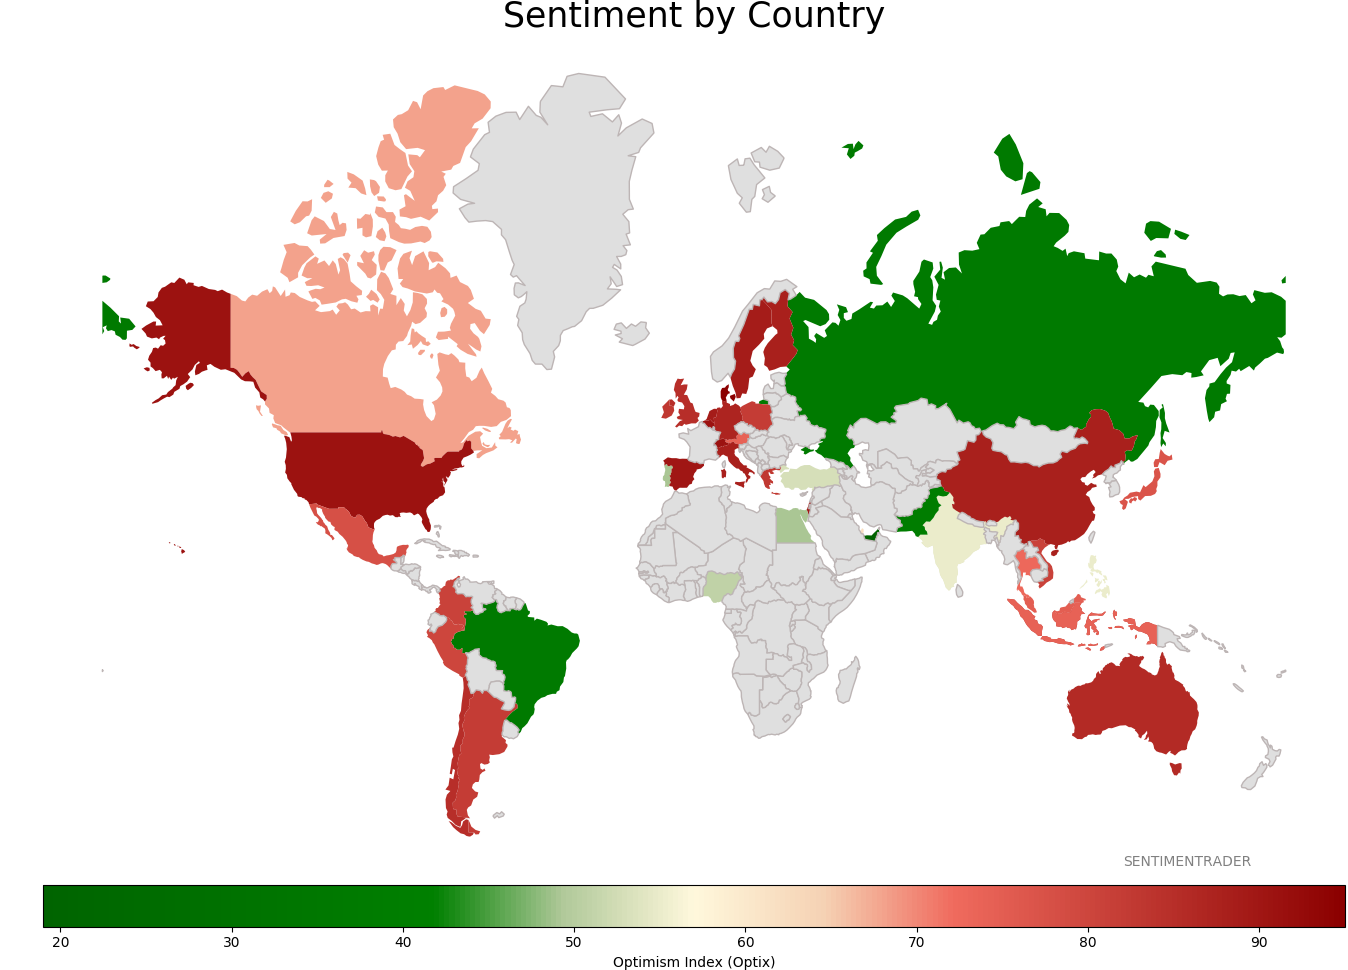
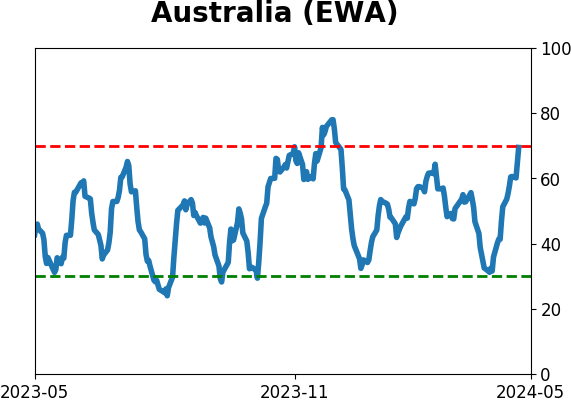
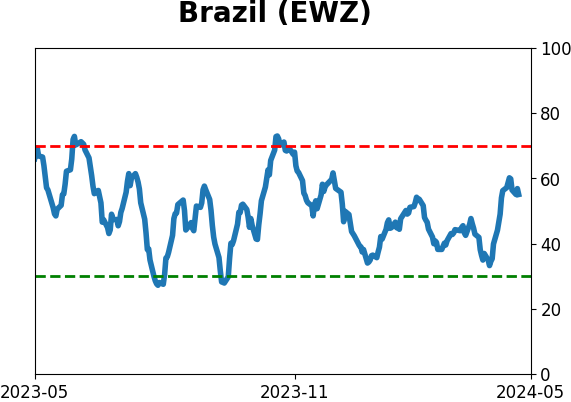
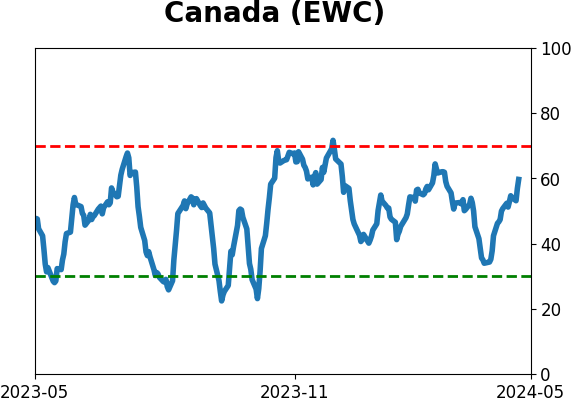
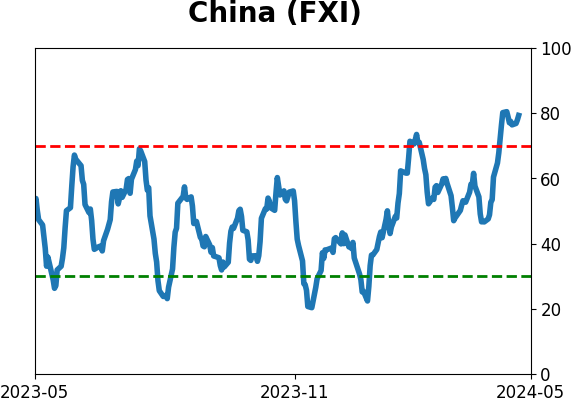
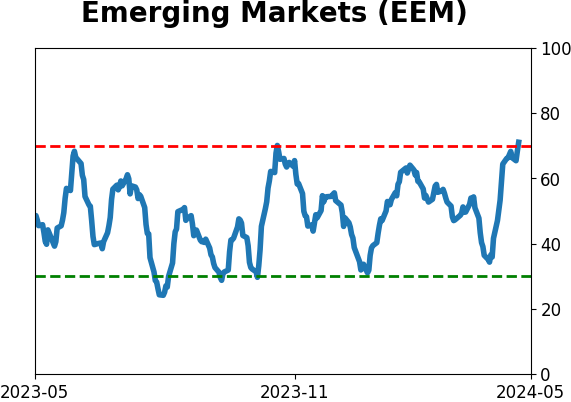
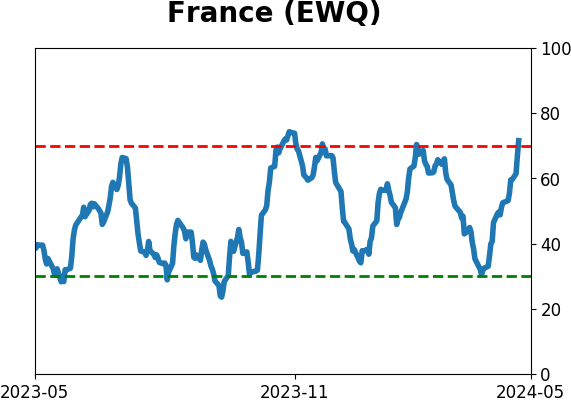
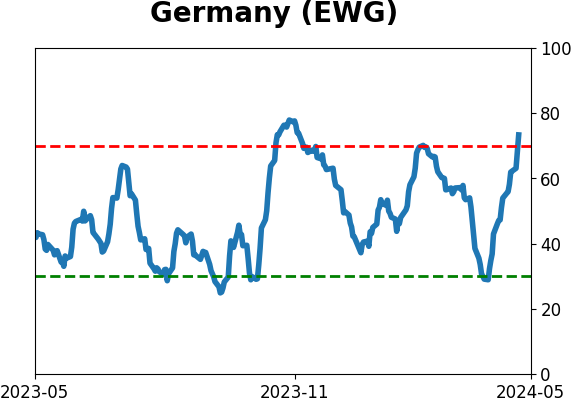
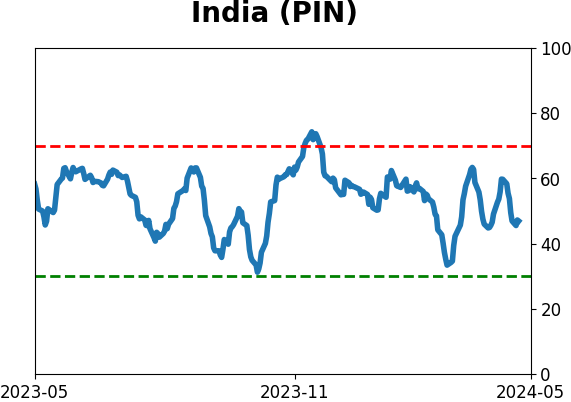
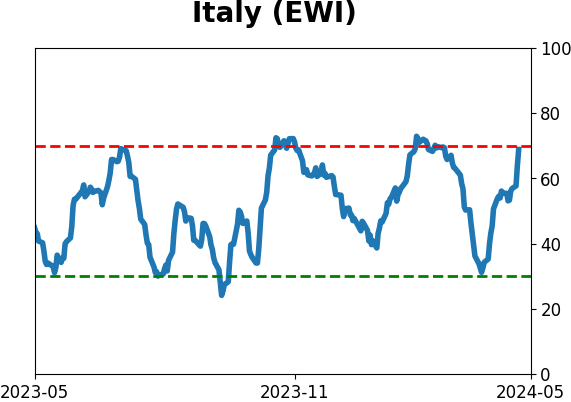
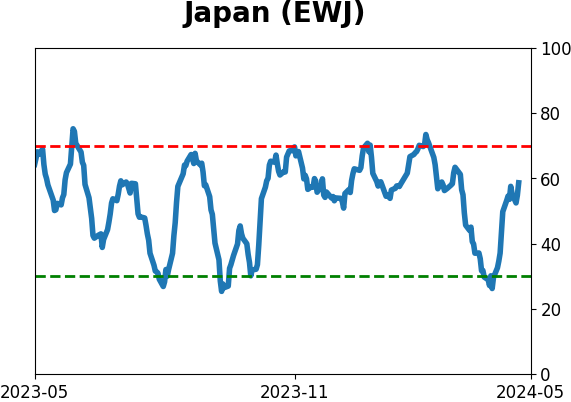
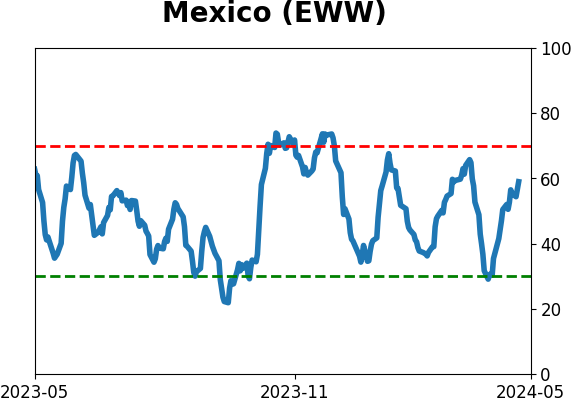
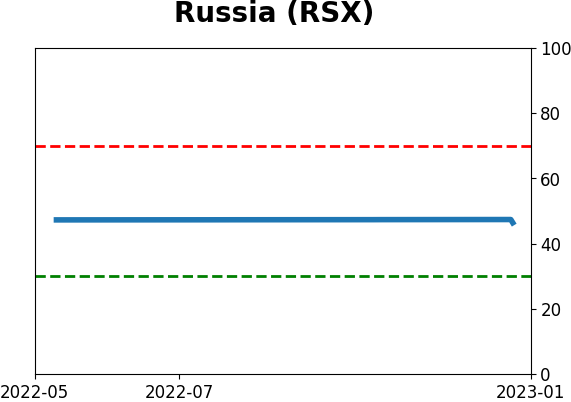
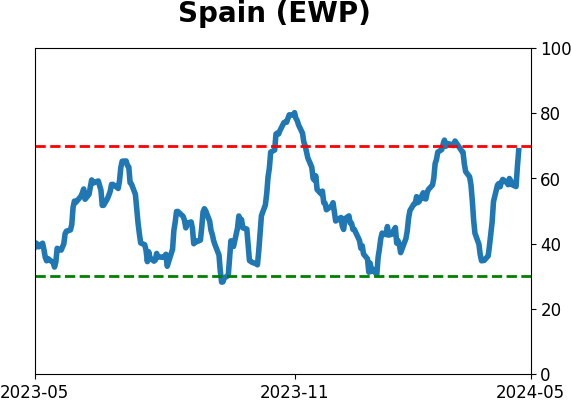
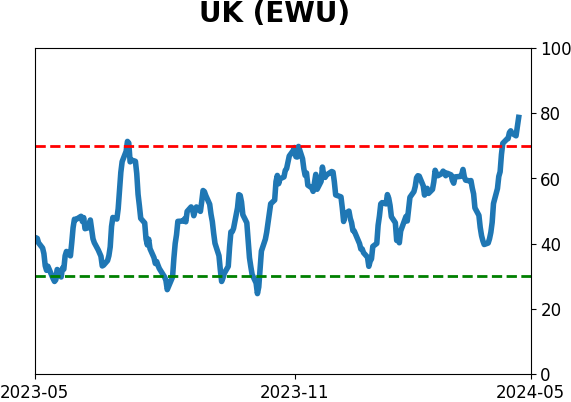
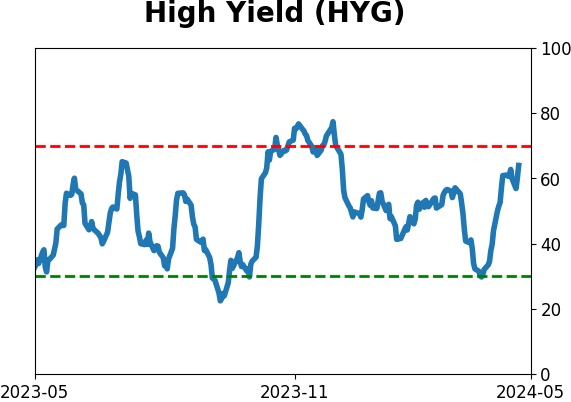
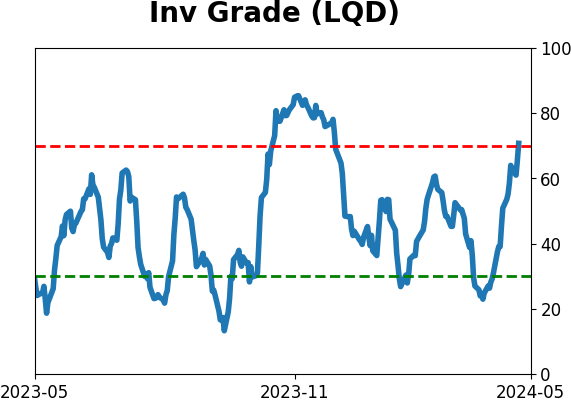
Sentiment Around The World
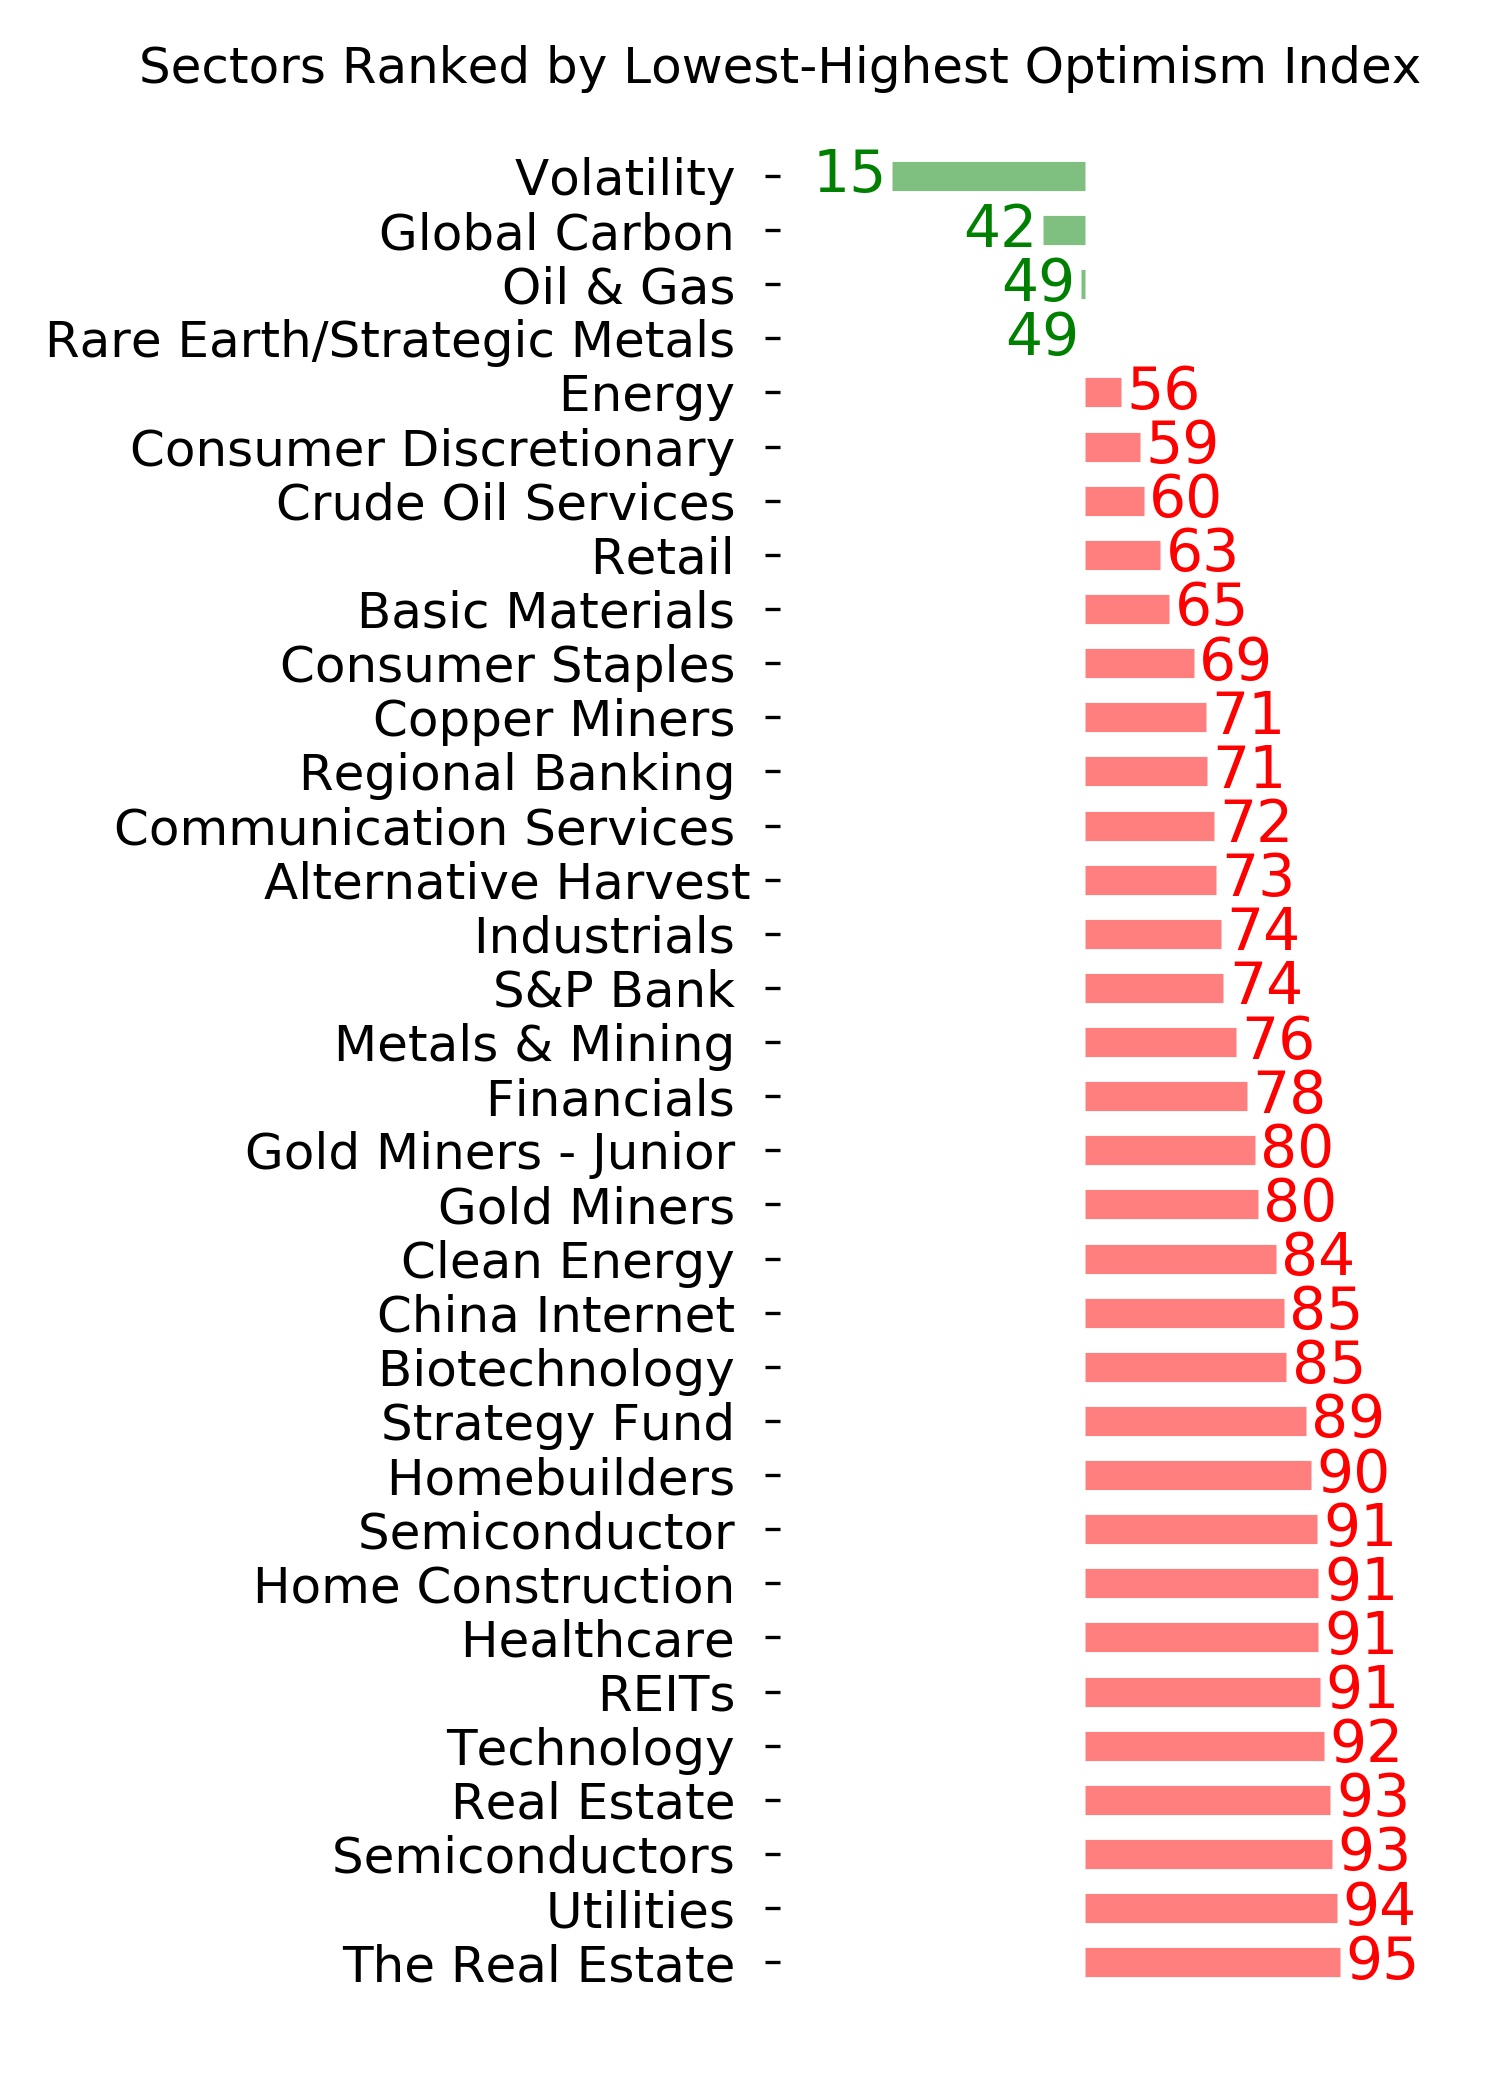
Optimism Index Thumbnails
|
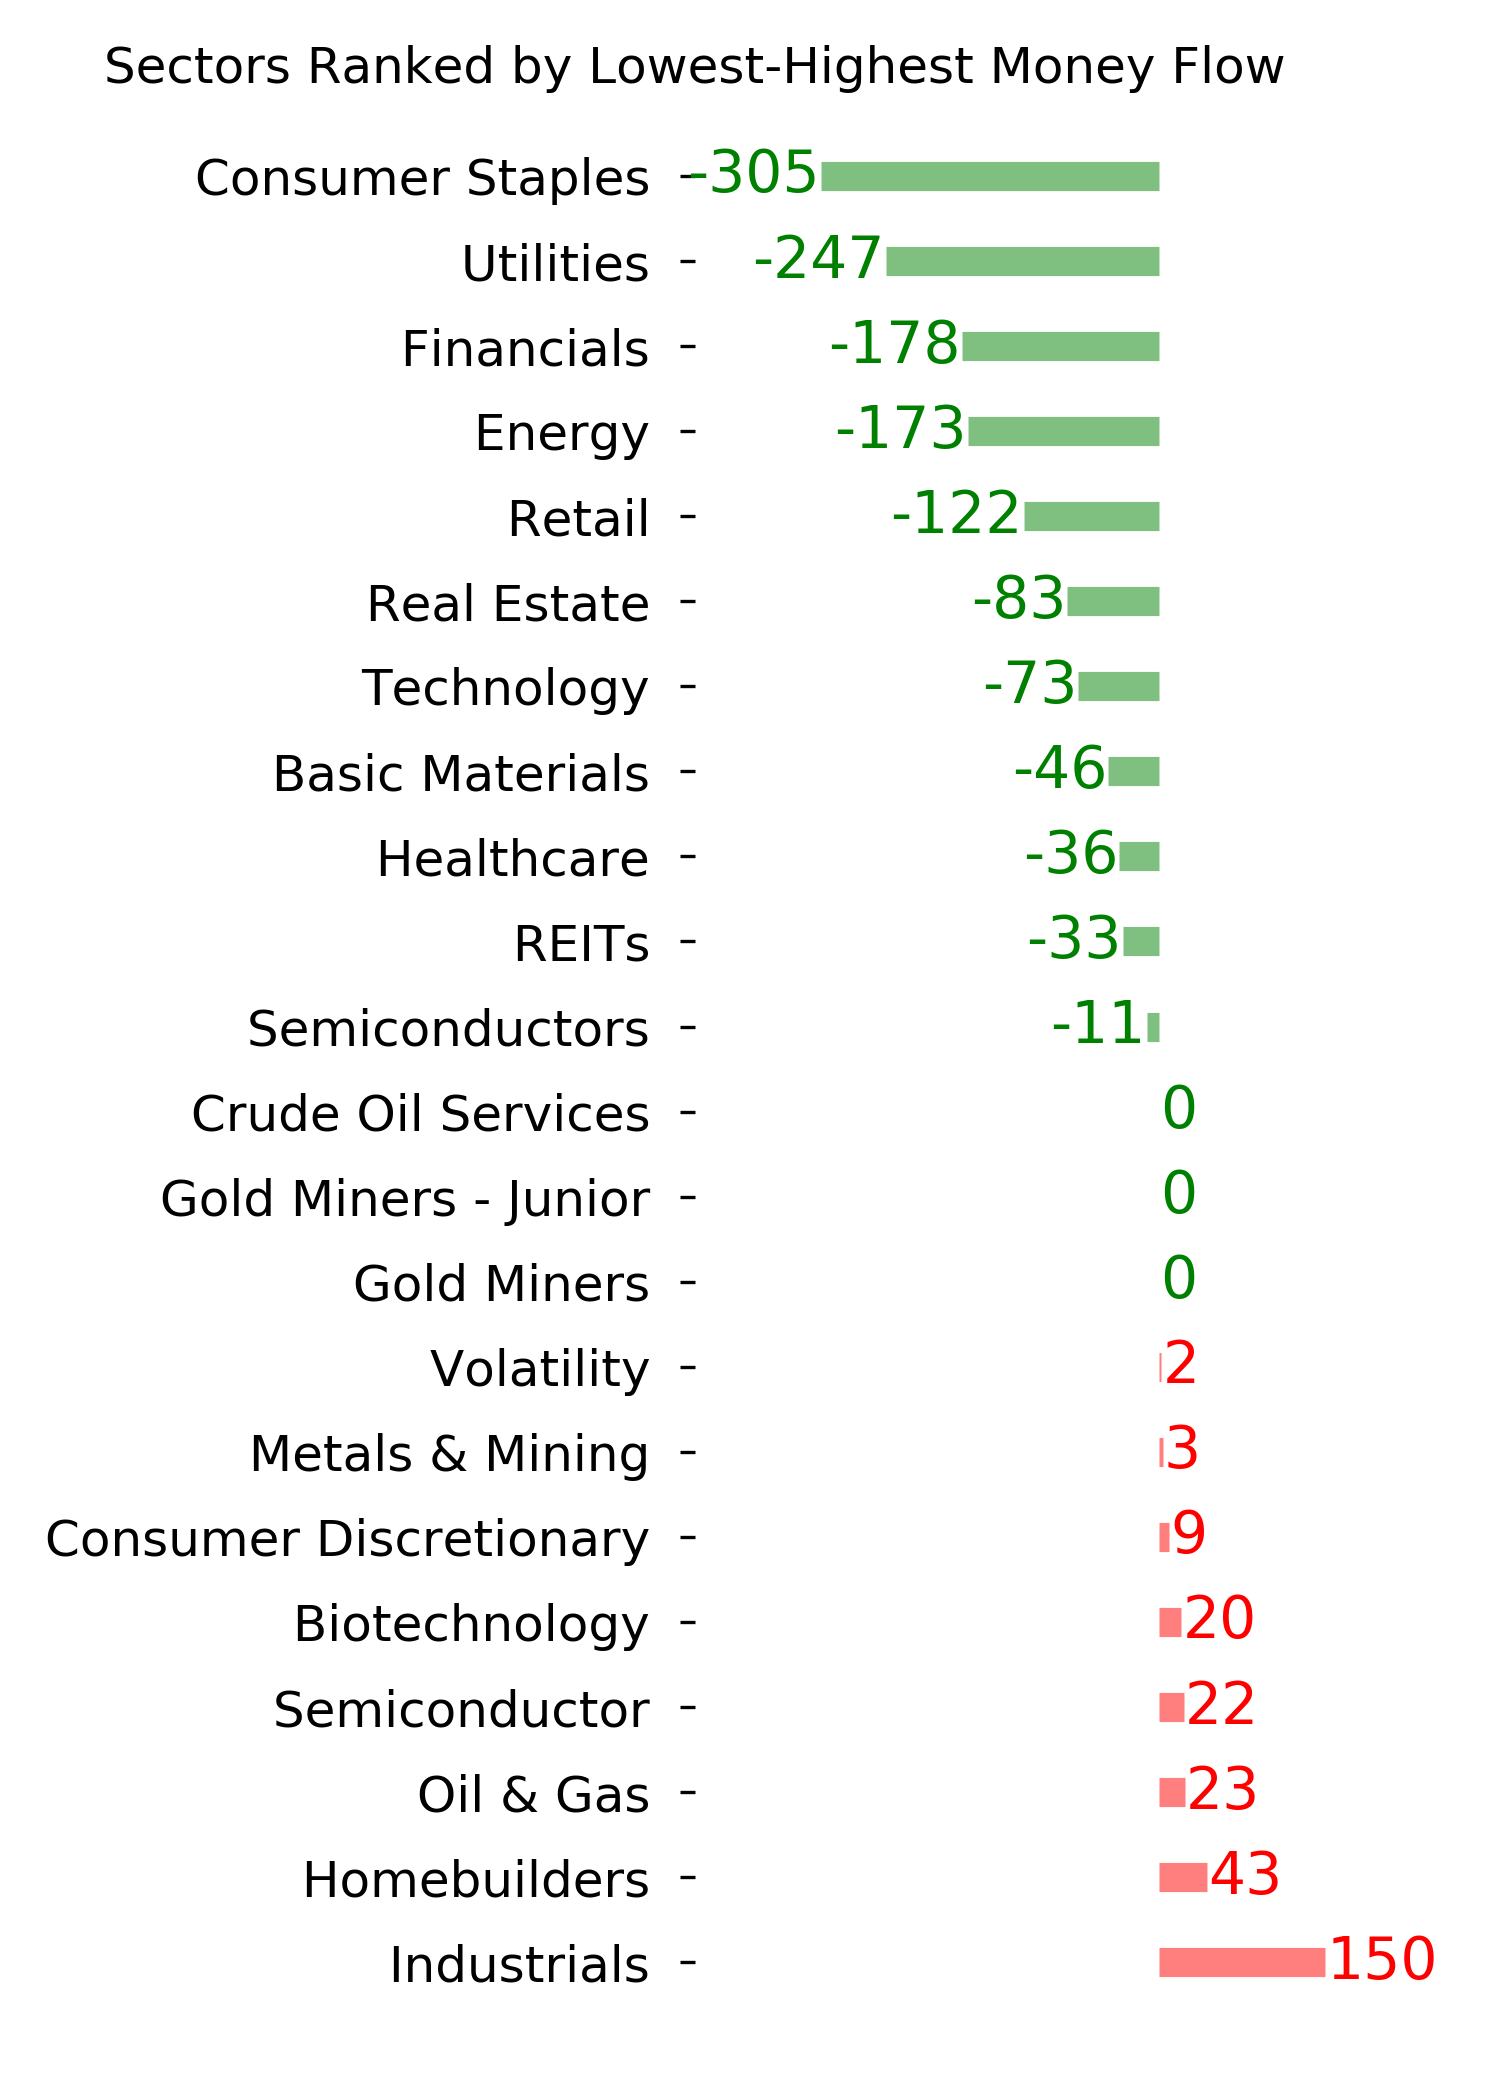
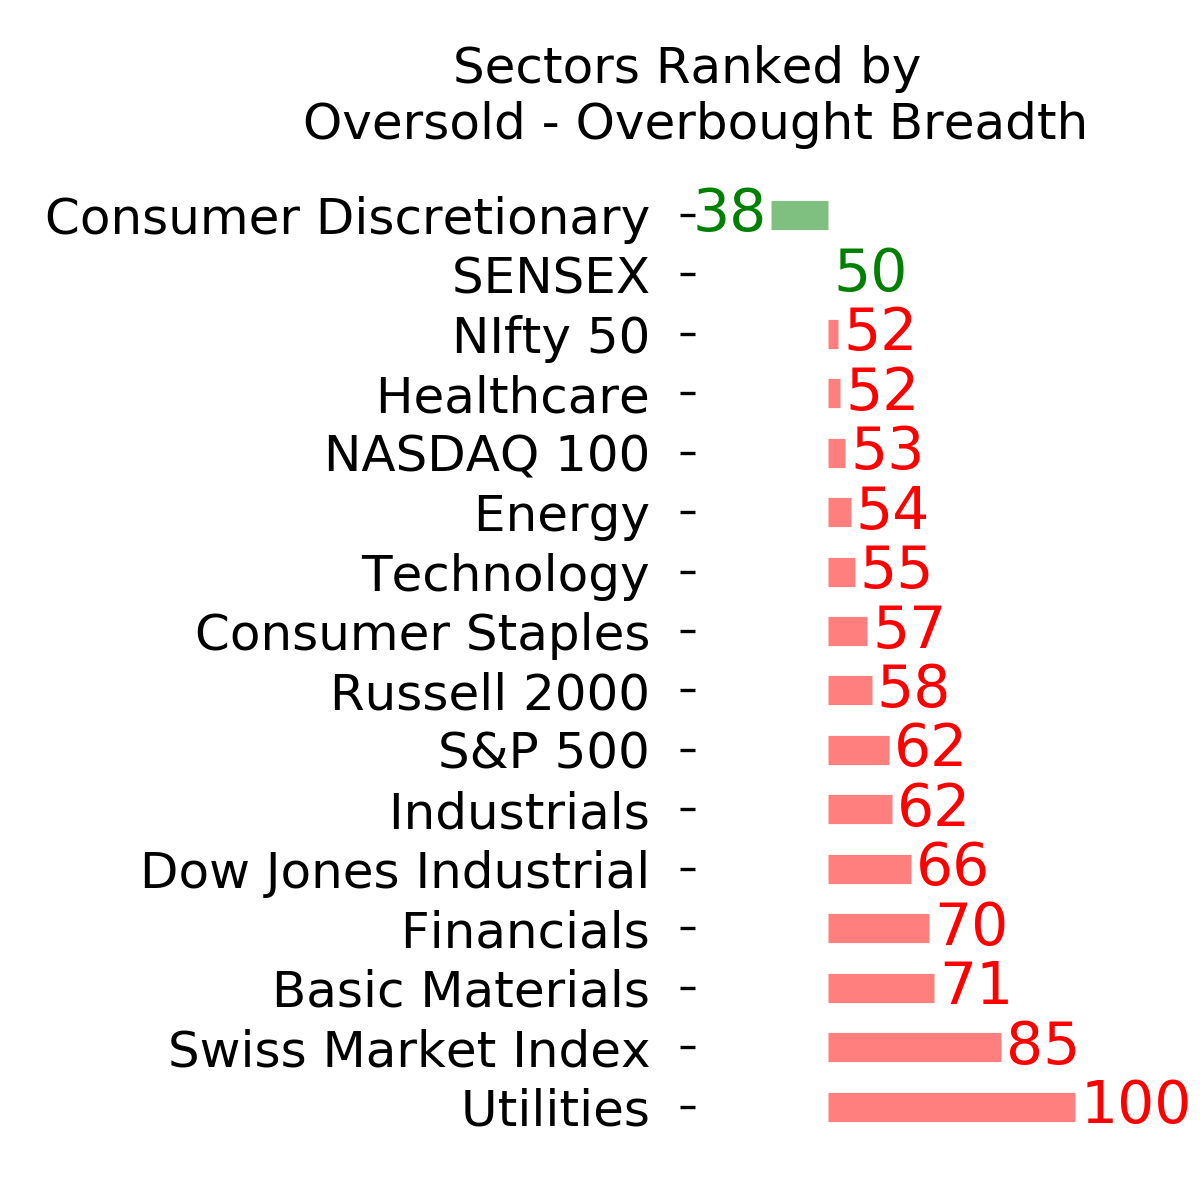
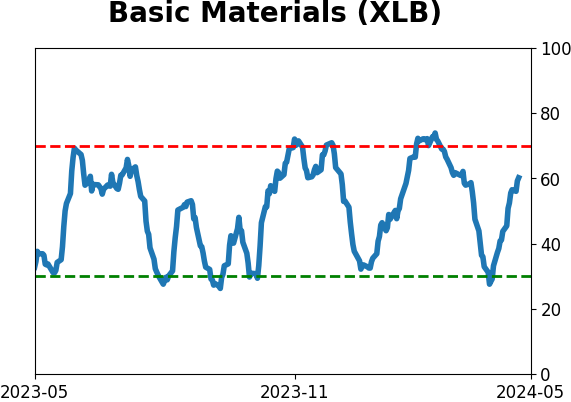
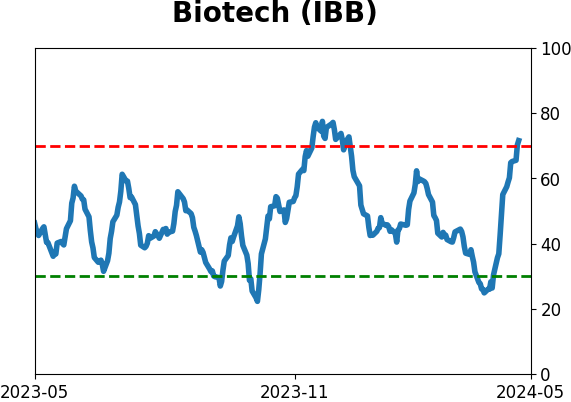
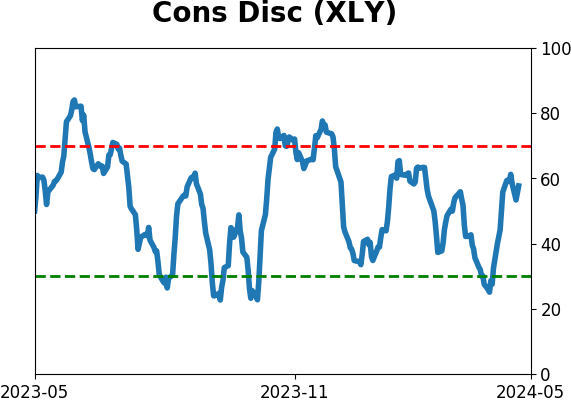
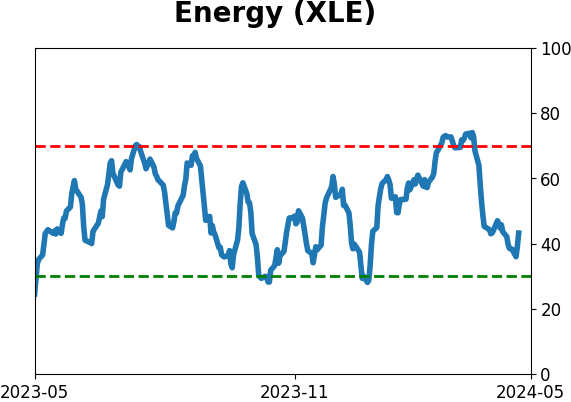
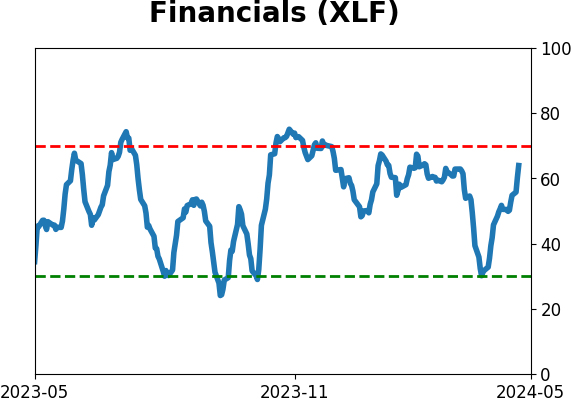
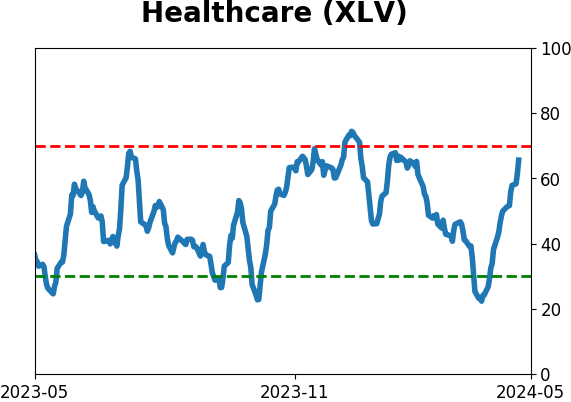
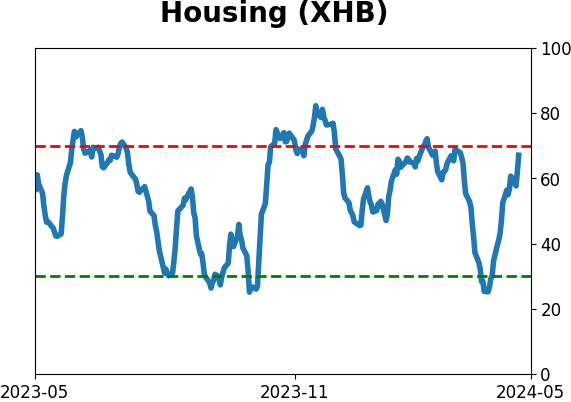
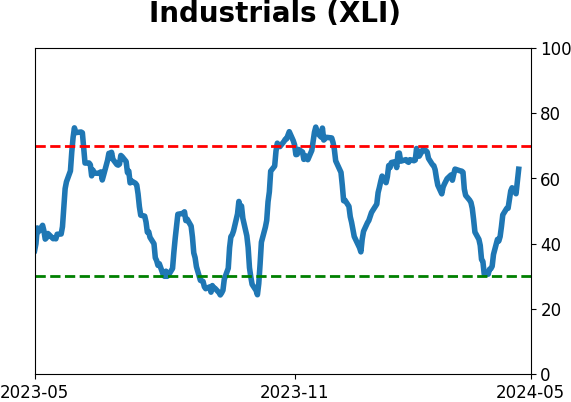
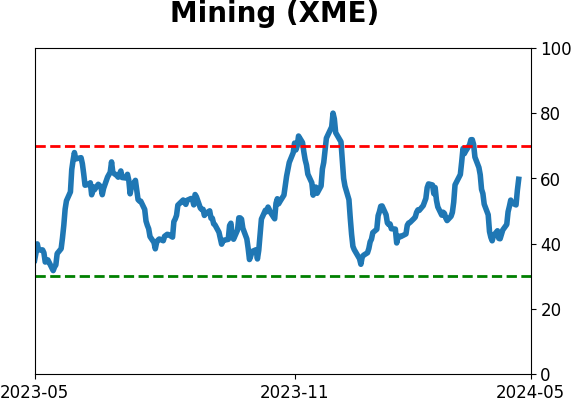
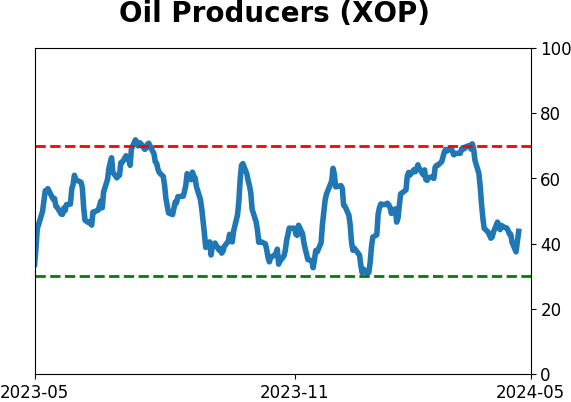
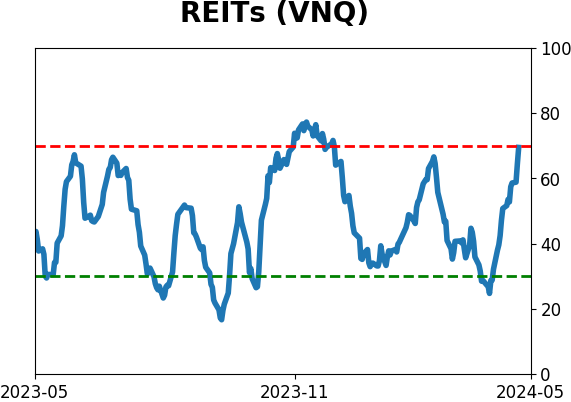
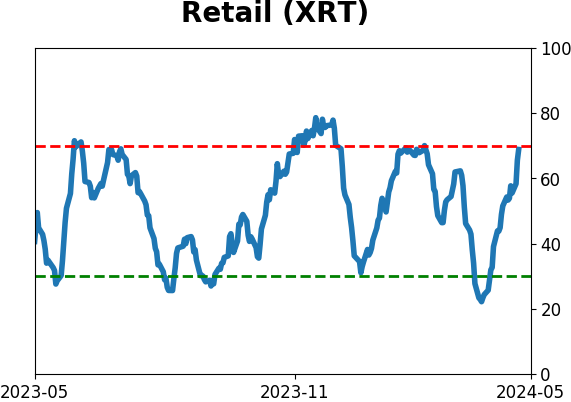
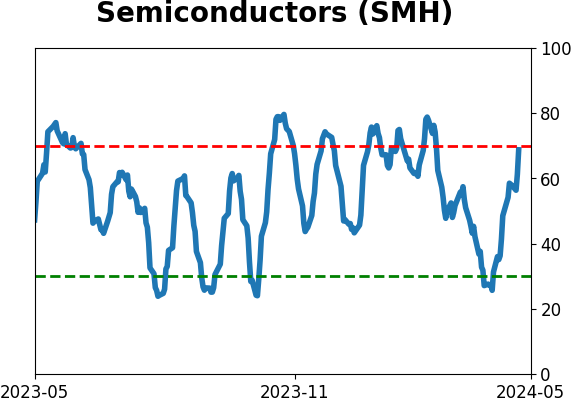
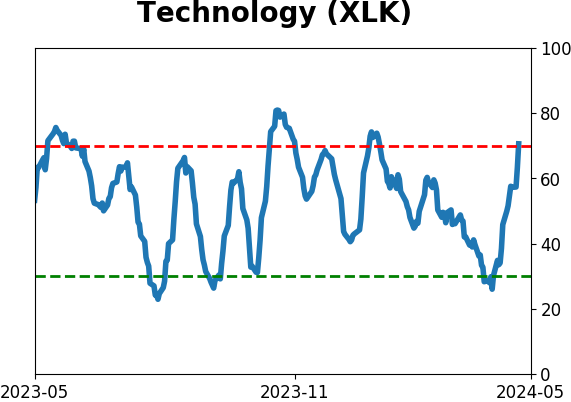
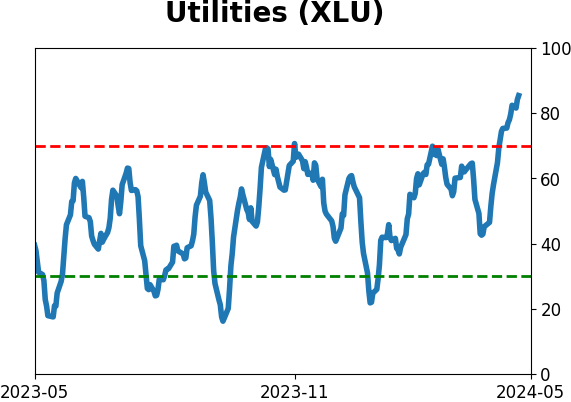
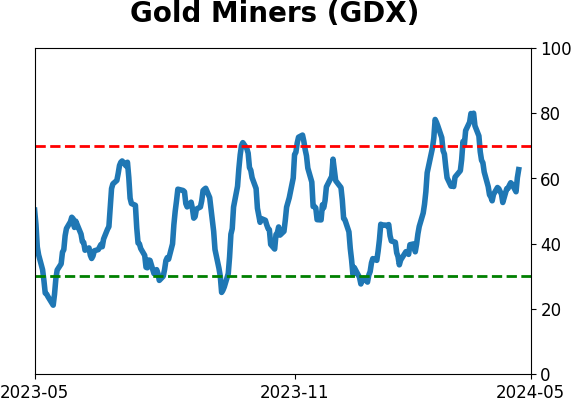
Sector ETF's - 10-Day Moving Average
|
|
|
Country ETF's - 10-Day Moving Average
|
|
|
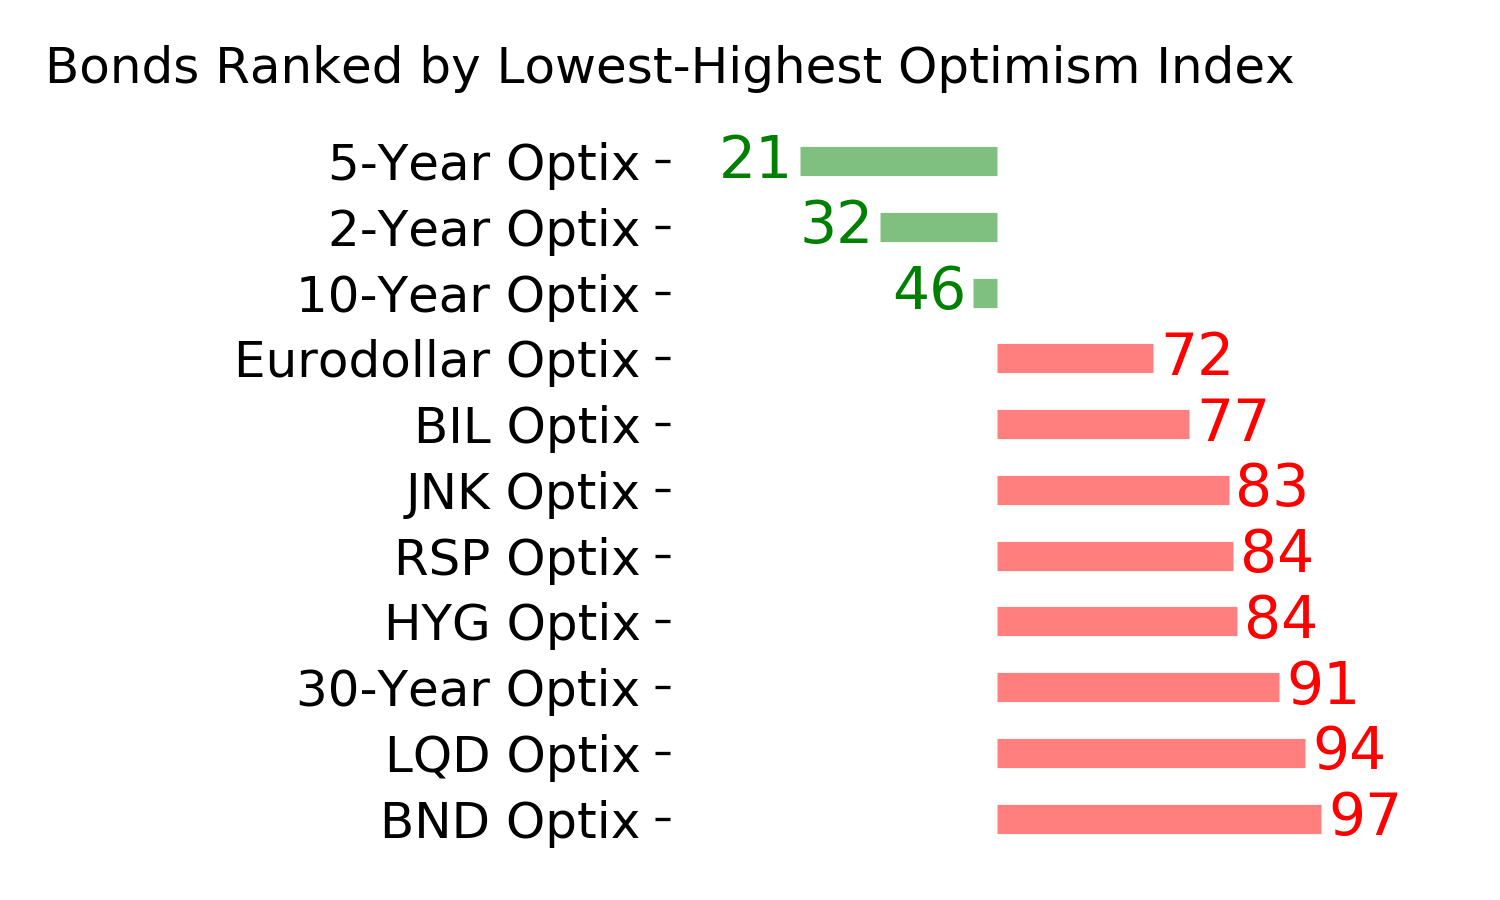
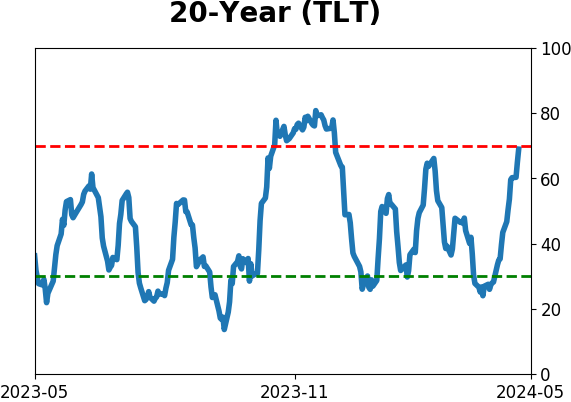
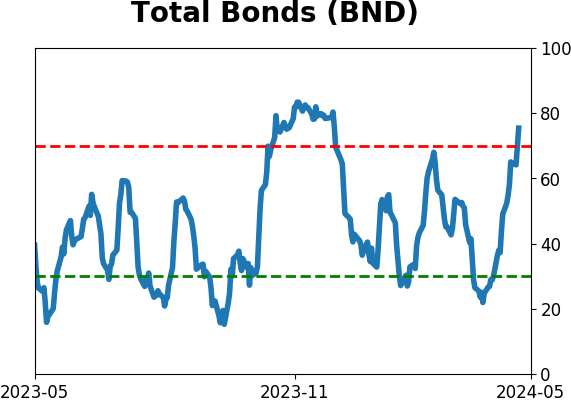
Bond ETF's - 10-Day Moving Average
|
|
|
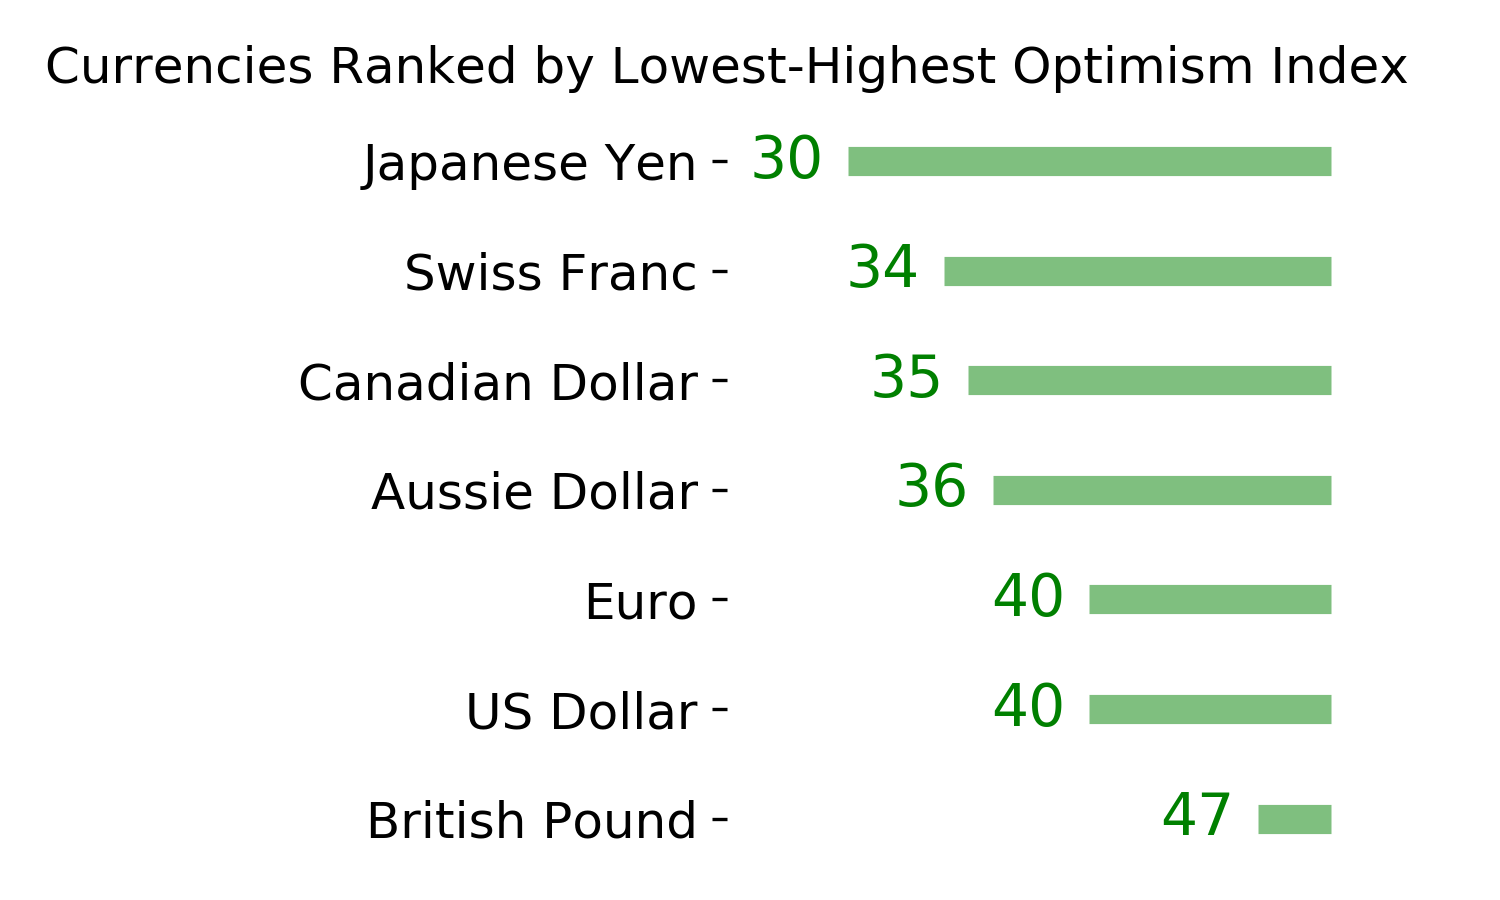
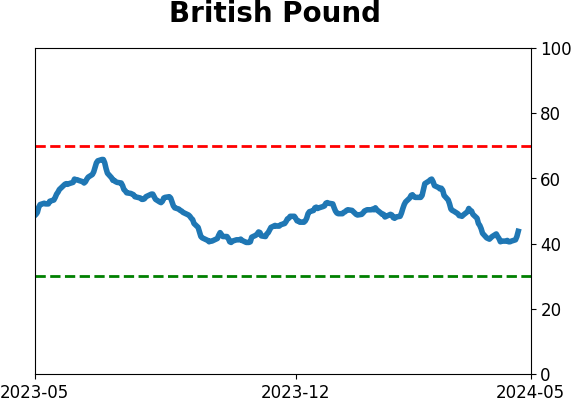
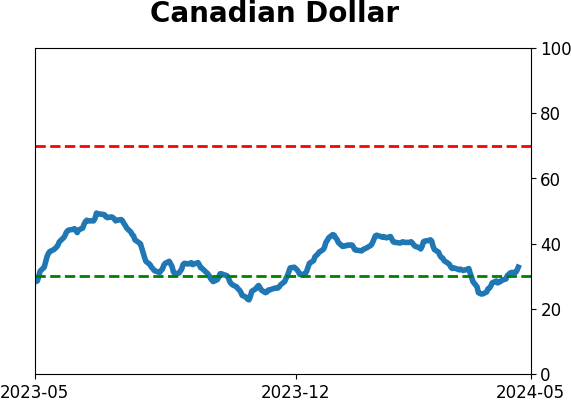
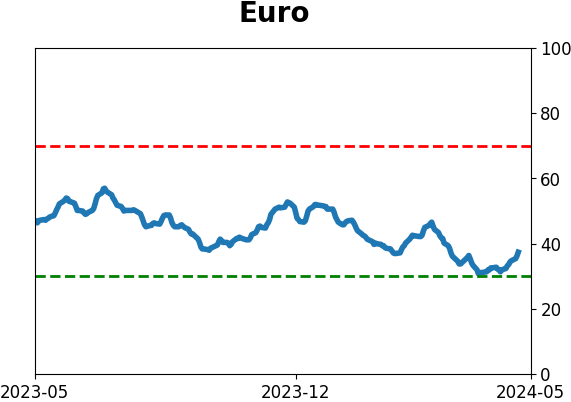
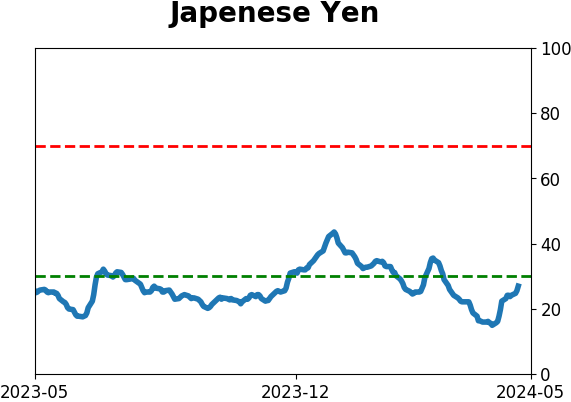
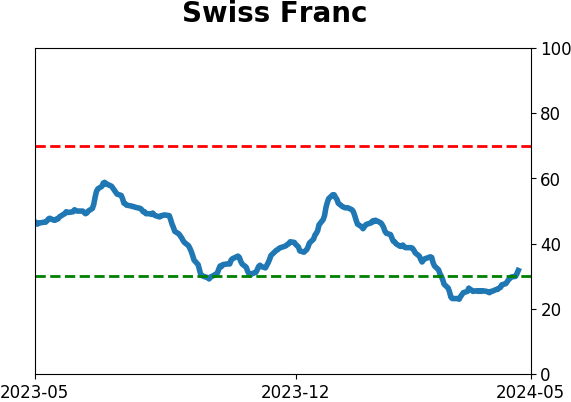
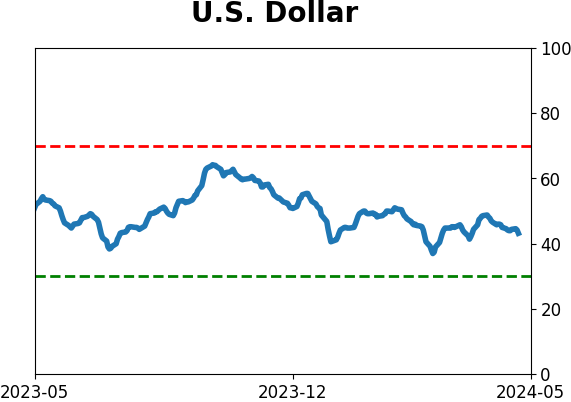
Currency ETF's - 5-Day Moving Average
|
|
|
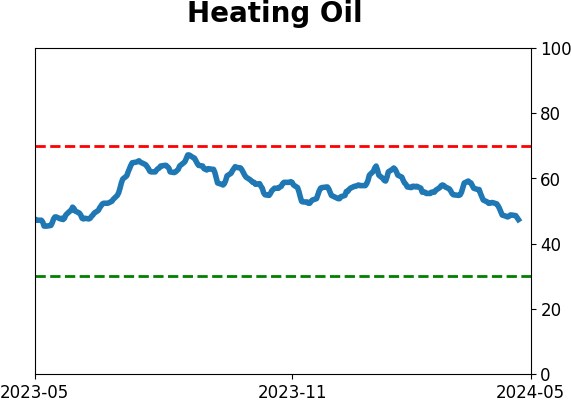
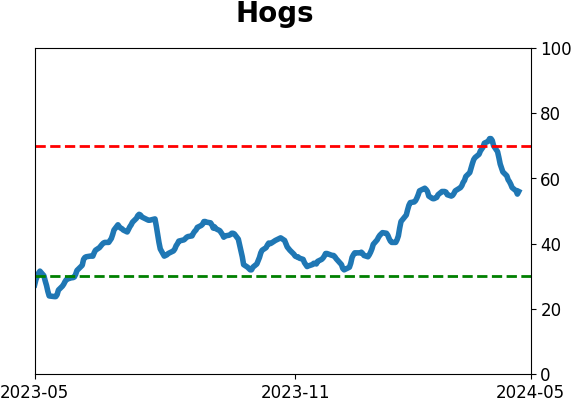
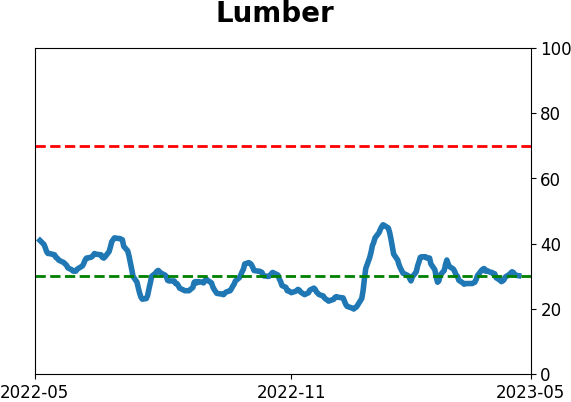
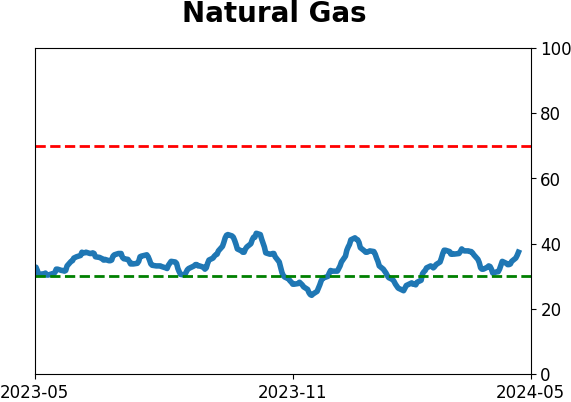
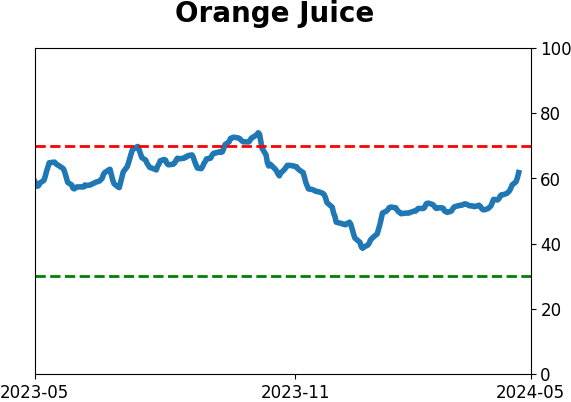
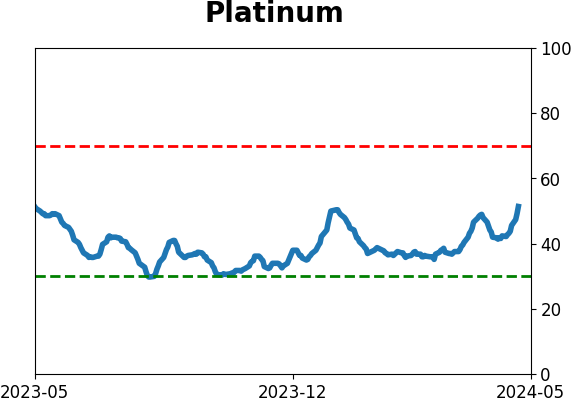
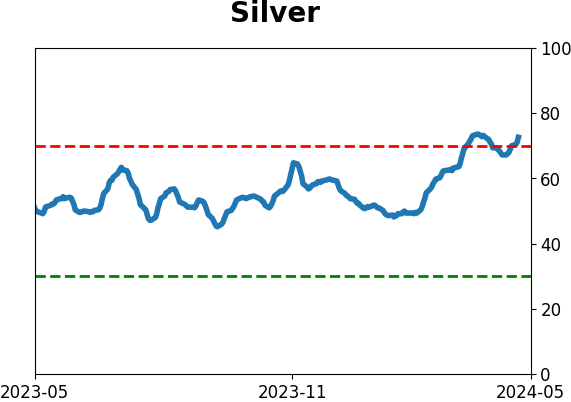
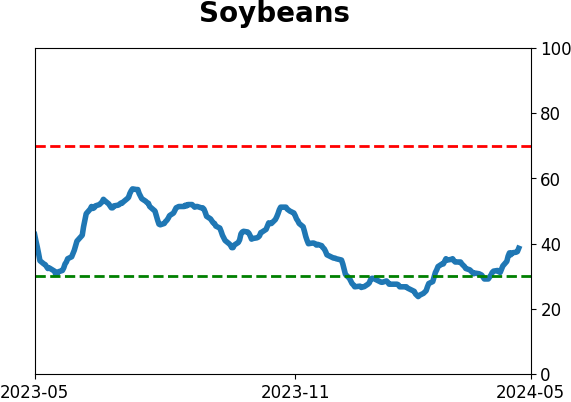
Commodity ETF's - 5-Day Moving Average
|
|