Headlines
|
|
The two most defensive sectors are leading the charge:
After the April pullback, stocks have roared back, especially defensive ones in the consumer staples and utilities sectors. Bears argue that this is a bad sign for the market, but historically it has not been. When those two sectors have led all others to new highs, S&P 500 returns were above average.
|
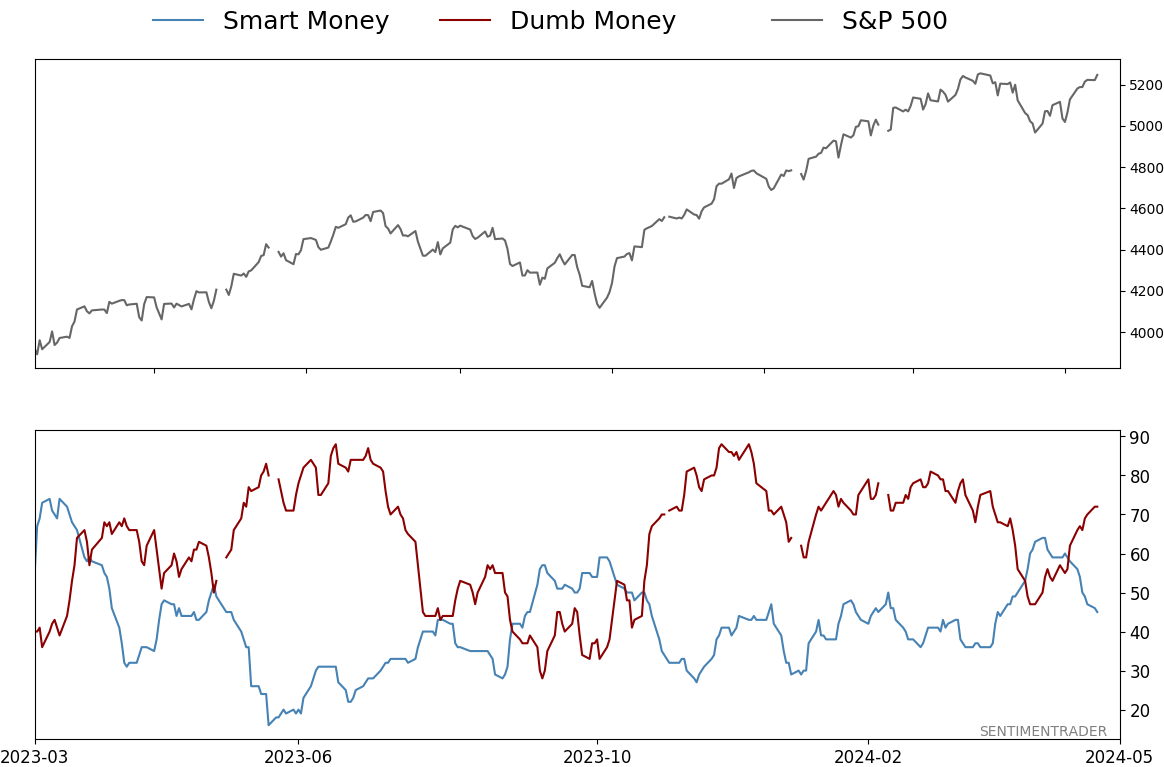
Smart / Dumb Money Confidence
|
Smart Money Confidence: 45%
Dumb Money Confidence: 72%
|
|
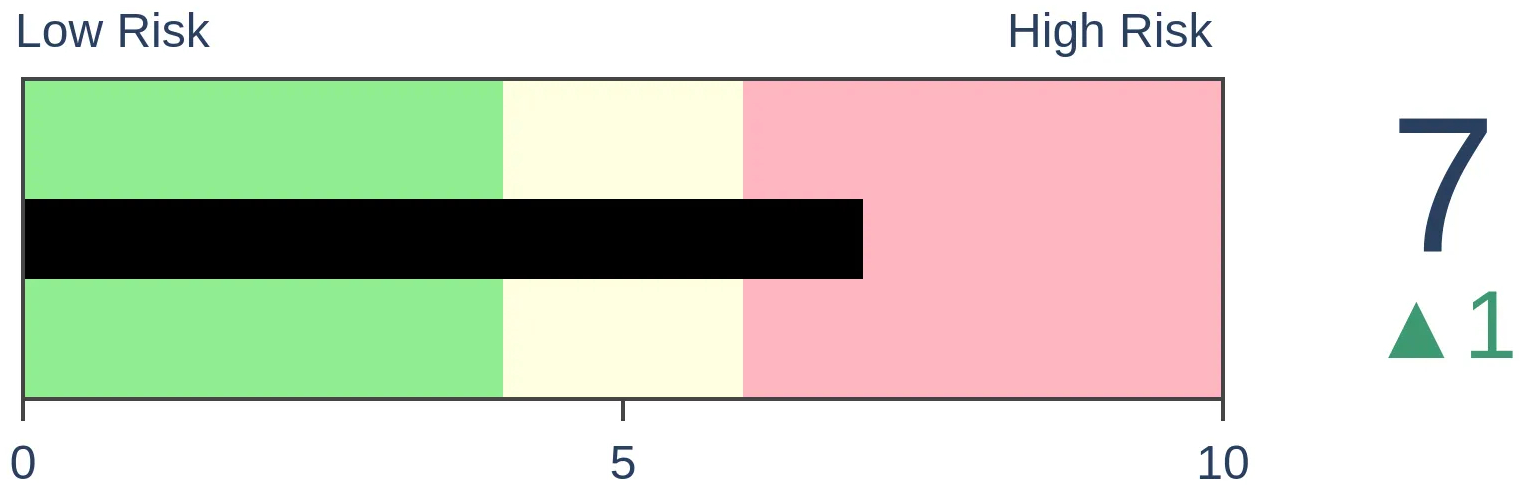
Risk Levels
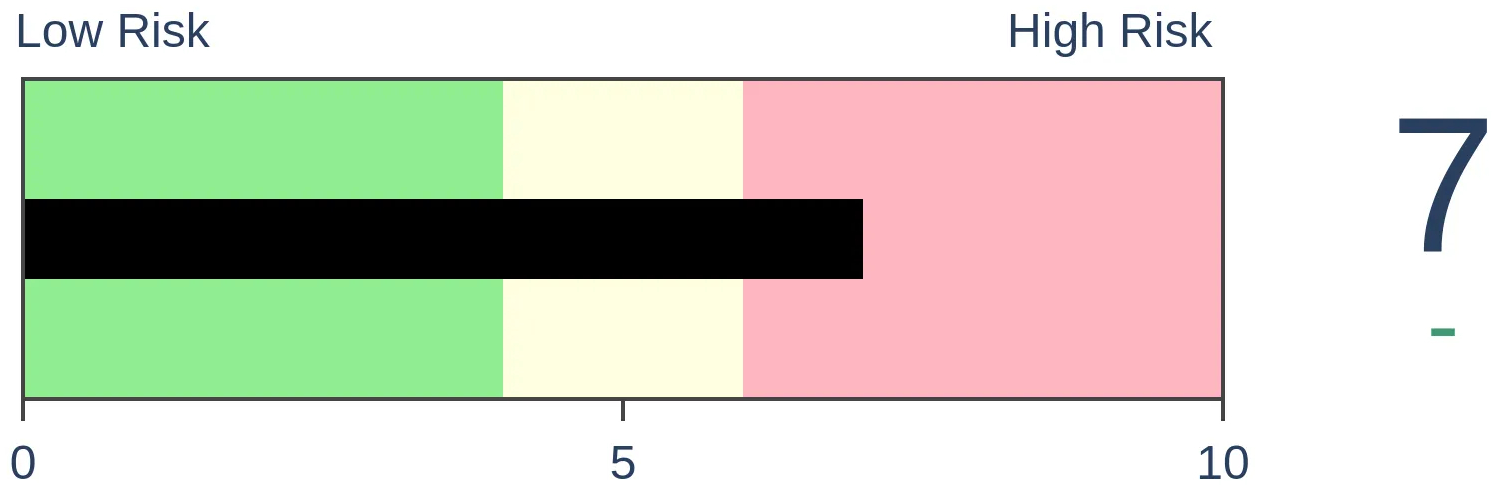
Stocks Short-Term
|
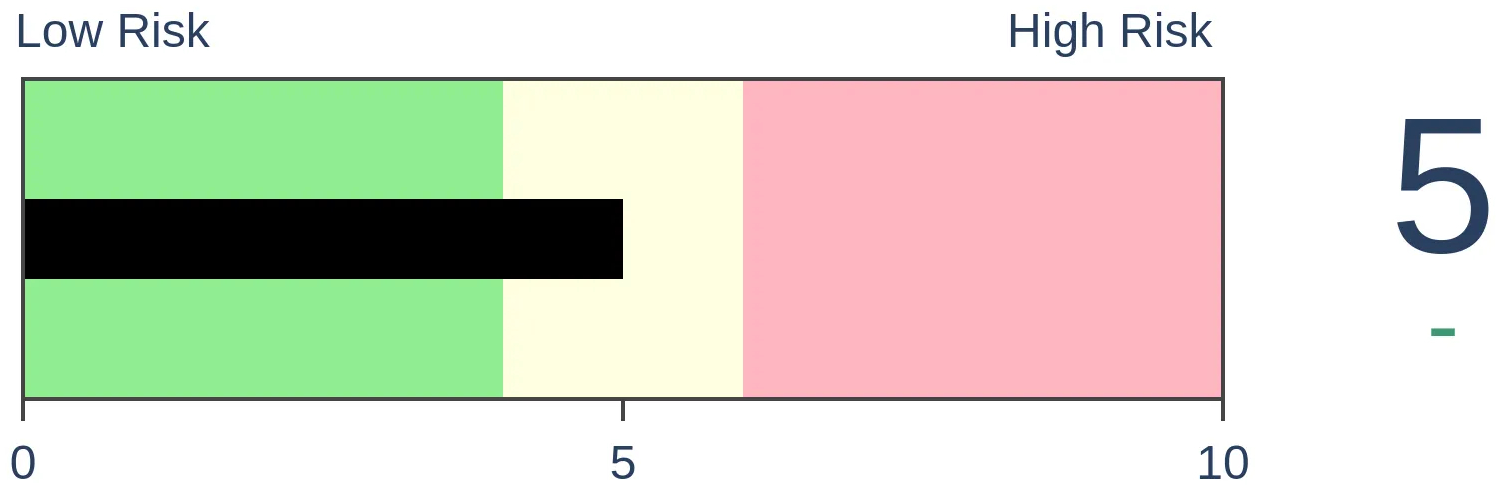
Stocks Medium-Term
|
|
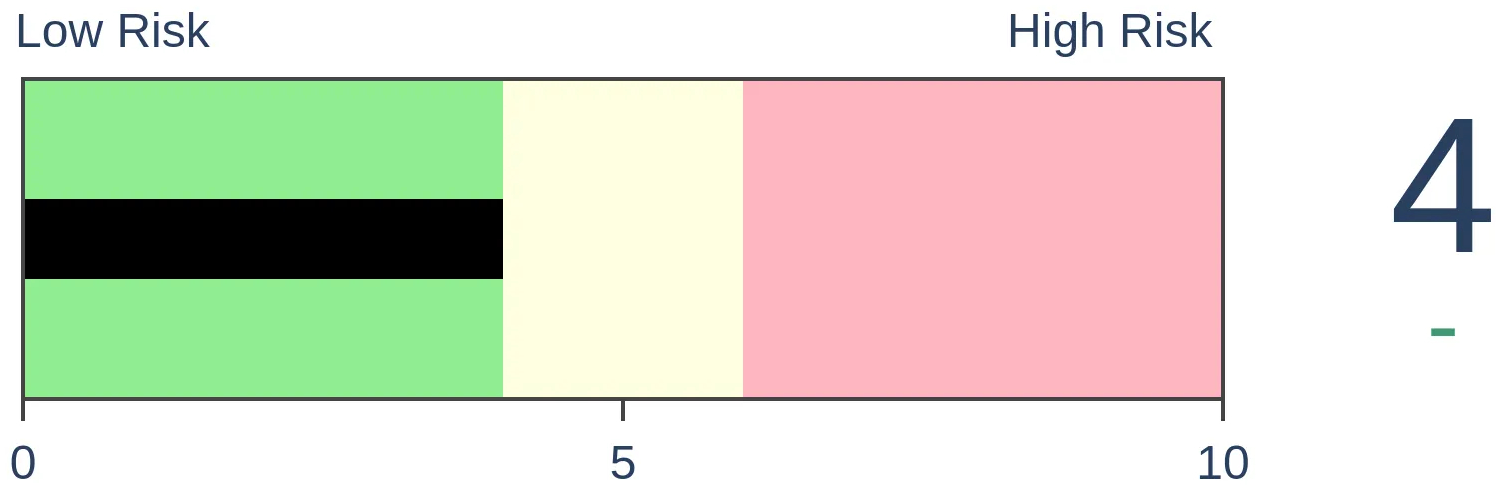
Bonds
|
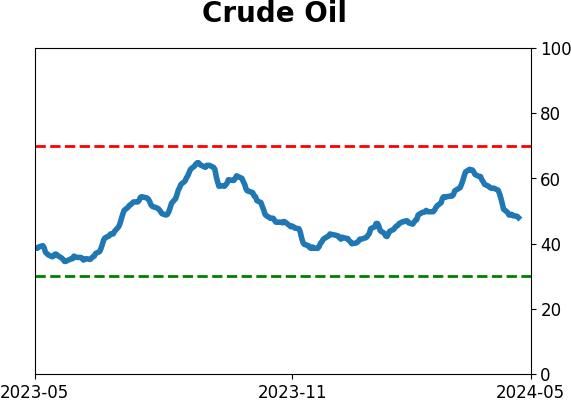
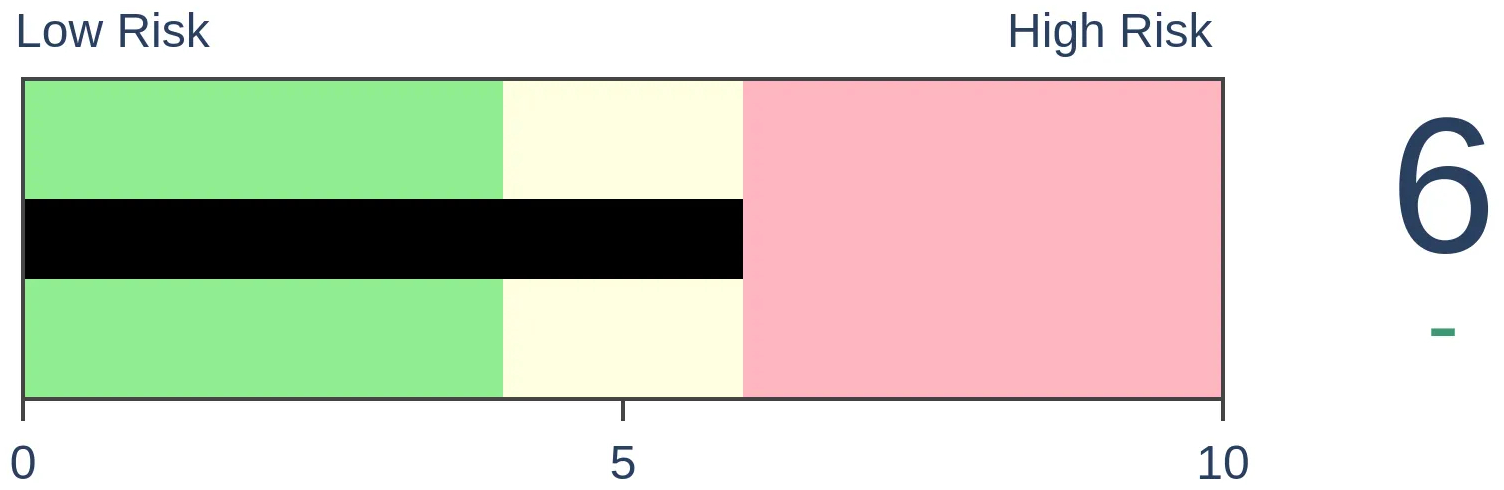
Crude Oil
|
|
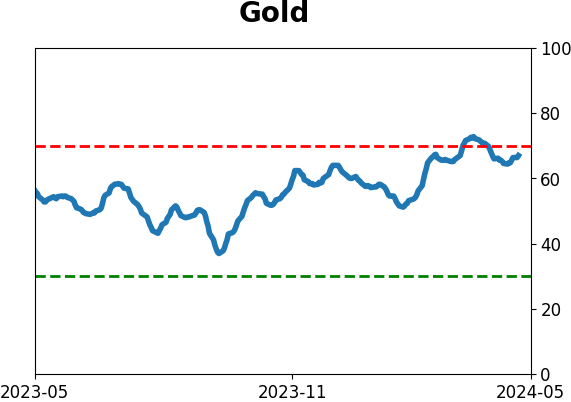
Gold
|
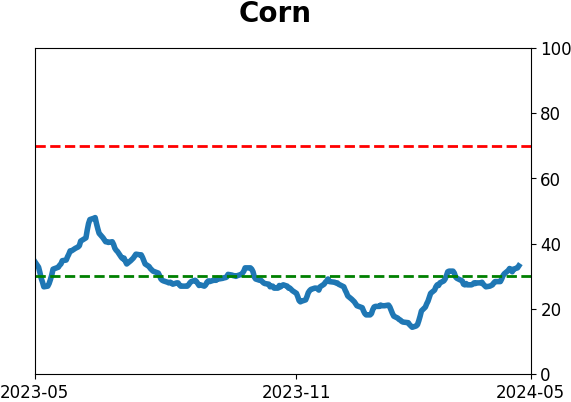
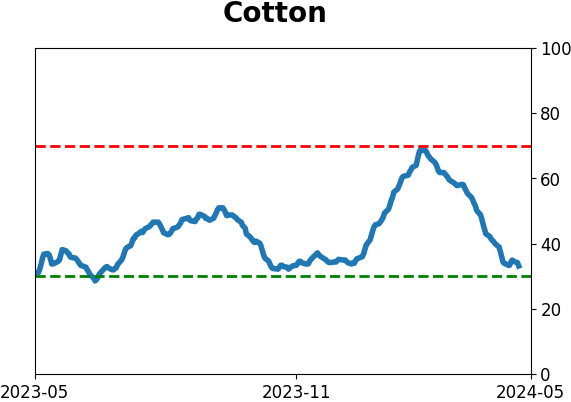
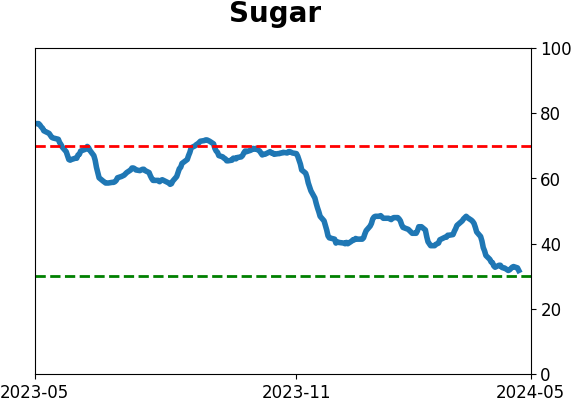
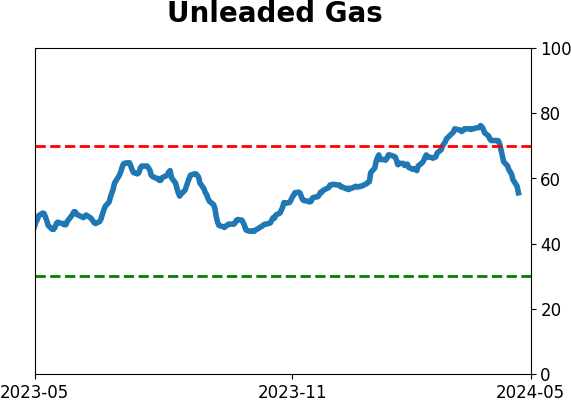
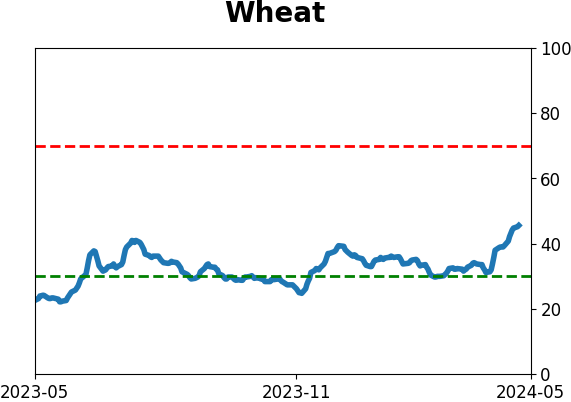
Agriculture

|
|
Research
By Jason Goepfert
BOTTOM LINE
After the April pullback, stocks have roared back, especially defensive ones in the consumer staples and utilities sectors. Bears argue that this is a bad sign for the market, but historically it has not been. When those two sectors have led all others to new highs, S&P 500 returns were above average.
FORECAST / TIMEFRAME
None
|
Key points:
- Consumer staples and utilities are the first two sectors to hit 52-week highs
- Bears suggest that this is a sign of underlying risk aversion and is likely to lead to a rally failure
- That argument hasn't held much water - it preceded the 2008 financial crisis, but that's about it
The two most defensive sectors are leading
Stocks have been recovering since the April pullback, but most indexes are still off their highs from earlier in the year. Most sectors are, too, except for two - the most defensive ones.
Both staples and utilities have recovered any losses and are the only two sectors in the past few weeks to reach at least 52-week highs.
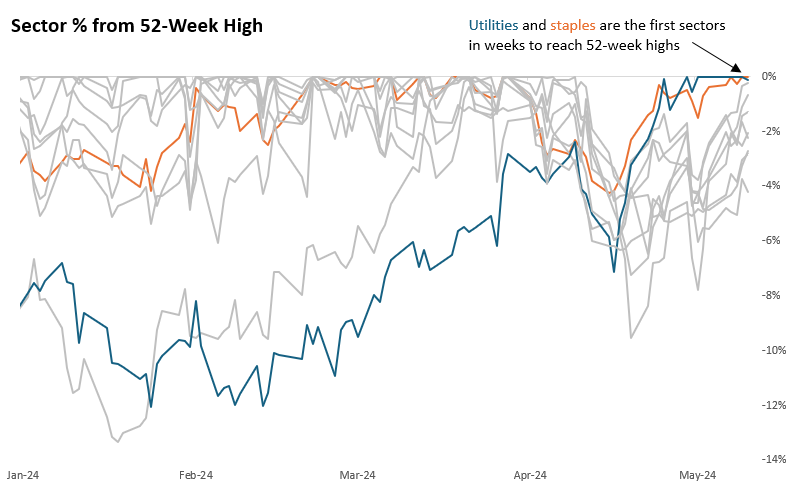
This is a worry for bulls, of course. If the two most staid sectors lead the charge higher, this rally is not to be trusted. For bulls to be confident, they'd want to see technology stocks, or financials, or really anything but staples and utilities leading the charge.
That's the narrative. Now, let's look at the facts.
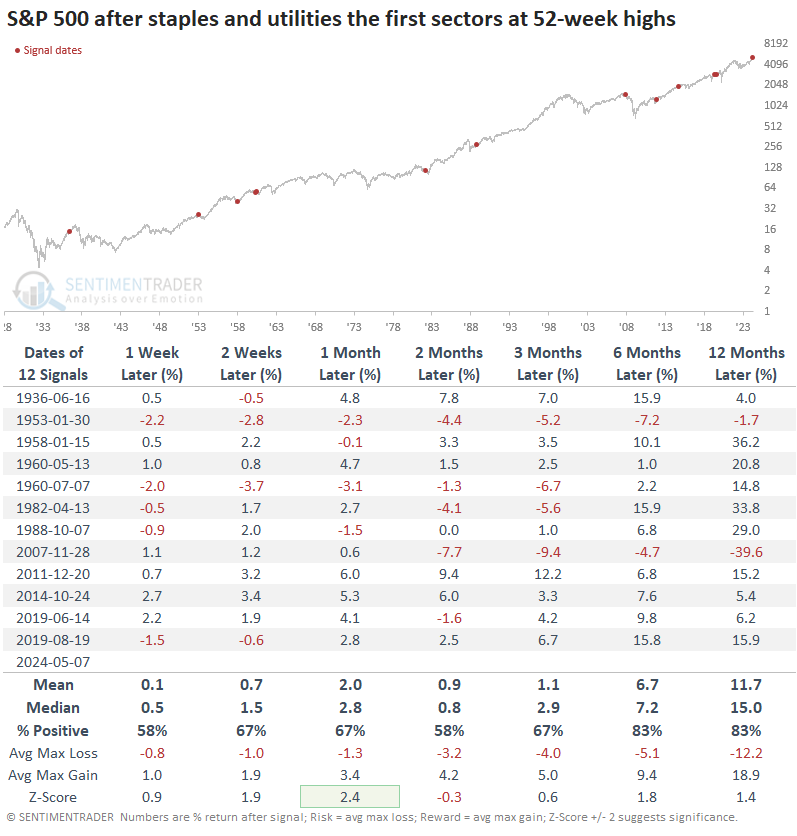
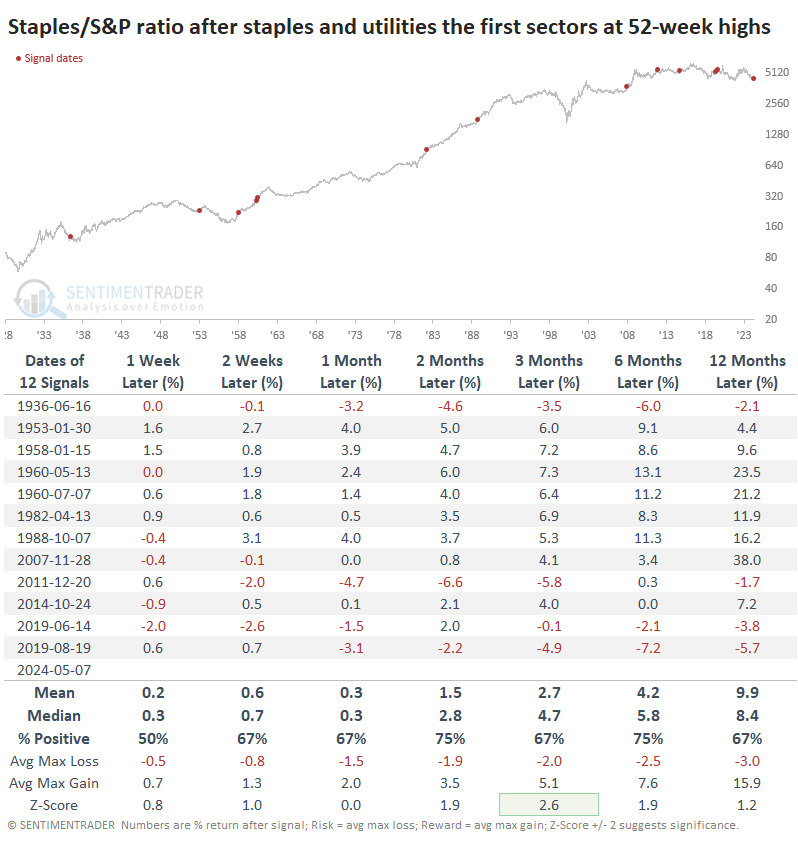
The table below shows each time no sector reached a 52-week high for at least three weeks, then staples and utilities were the only ones that did - they were leading the charge higher. The narrative didn't have much teeth, as the S&P 500 did just fine going forward. Over the next 6-12 months, there were only two losses out of the twelve signals. One of those was just ahead of the 2008 financial crisis, so bears could latch onto that exception.
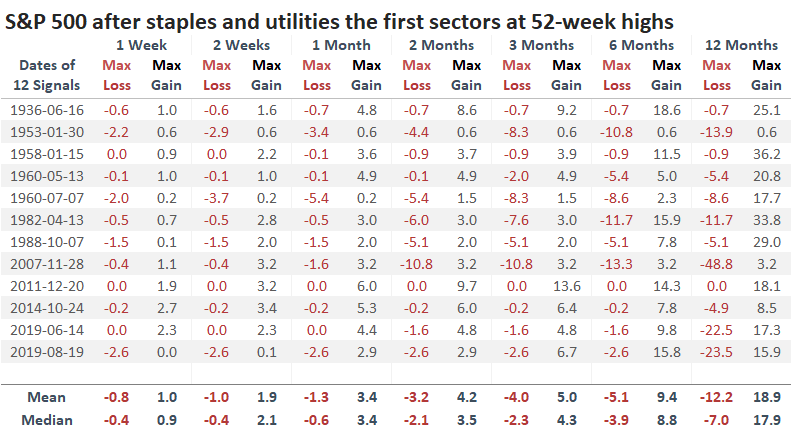
A table of maximum gains and losses across time frames shows that within the next six months, three signals preceded drawdowns of -10% or more, while five signals enjoyed gains of +10% or more. That's not especially compelling for bulls - we've seen much better risk/reward setups in other studies - but again, it doesn't do much to further the idea that this is a negative for the broader market.
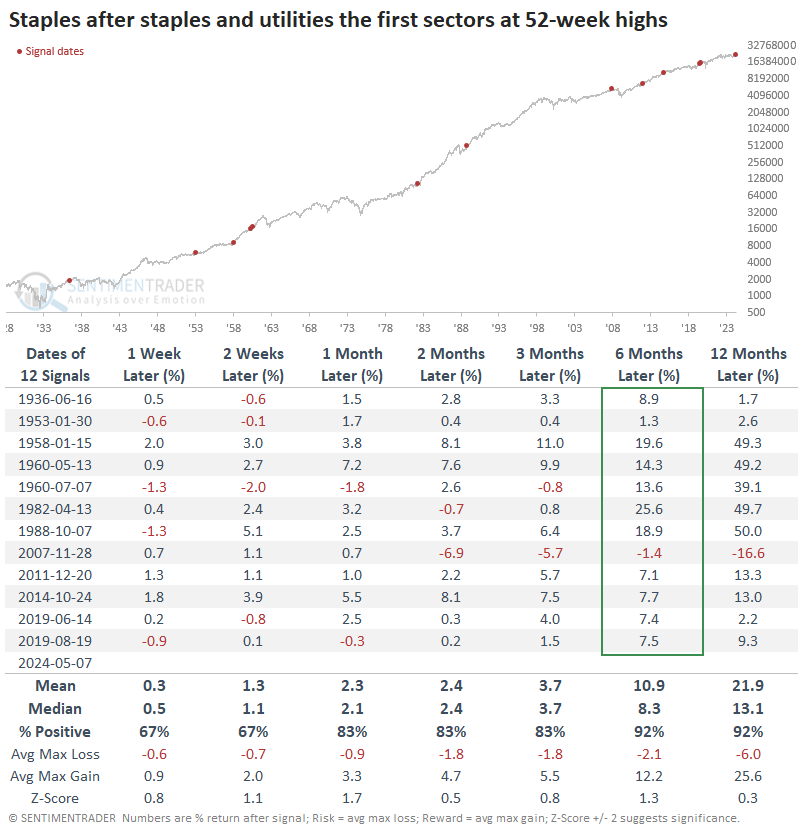
A promising sign for staples
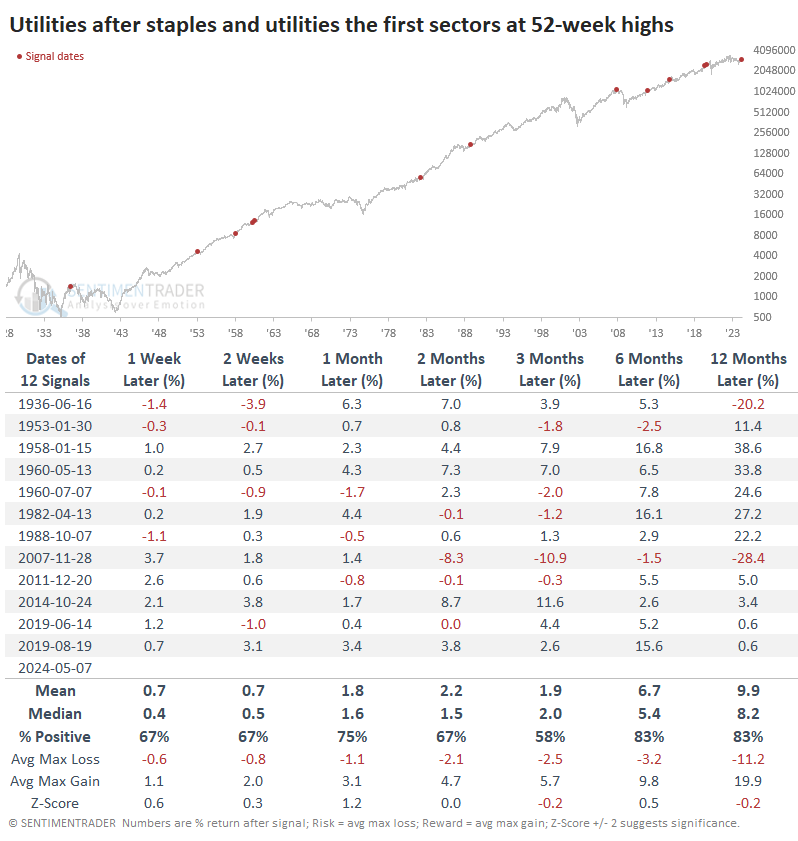
This was a pretty good sign for the sectors themselves, especially staples. That sector enjoyed gains almost every time across most time frames, with the biggest bugaboo being the global financial crisis. Even then, staples lost only -1.4% over the next six months.
Relative to the S&P 500, staples mostly outperformed across all time frames. The last ones in 2019 didn't work out so much, but before that, staples mostly showed relative strength against the broader market.
Utilities also did quite well in the months ahead, but not as well as staples. There were only a couple of losses over longer time frames, though the risk/reward wasn't all that compelling. This sector has probably the worst record at holding upside momentum. There's always the chance that power demands from AI computations will change the equation for this sector, so utility bulls have to believe this time is different.
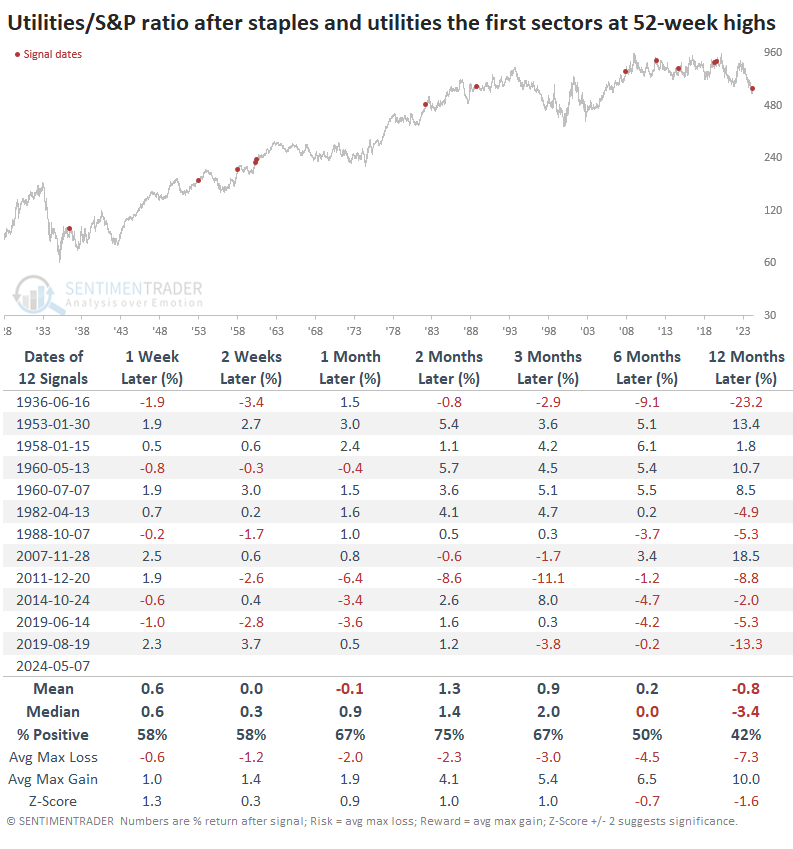
Relative to the S&P 500, utility stocks did not do as well as staples after these signals, especially over the longer term. Again, this speaks to the sector's poor record of adding to positive momentum.
What the research tells us...
The common perception is that bearish arguments are more erudite than bullish ones. Stocks in the U.S. and most other markets have a general upward trajectory over time, so bullish arguments simply go with the long-term trend and don't carry as much heft. There is some truth to this, which is one reason we show a z-score on the tables: to show whether sample returns are over and above a random return given their standard deviations and sample sizes.
The fact that defensive sectors like consumer staples and utilities have led all other sectors to new highs is, on the surface, a bearish data point. But looking at similar behavior over the decades, it's hard to support that argument. Yes, it preceded the global financial crisis in 2008. And...that's it. Pretty much every other time those two led the others to new highs, it preceded okay-to-good returns in those sectors (especially staples) and the broader market.
Indicators at Extremes
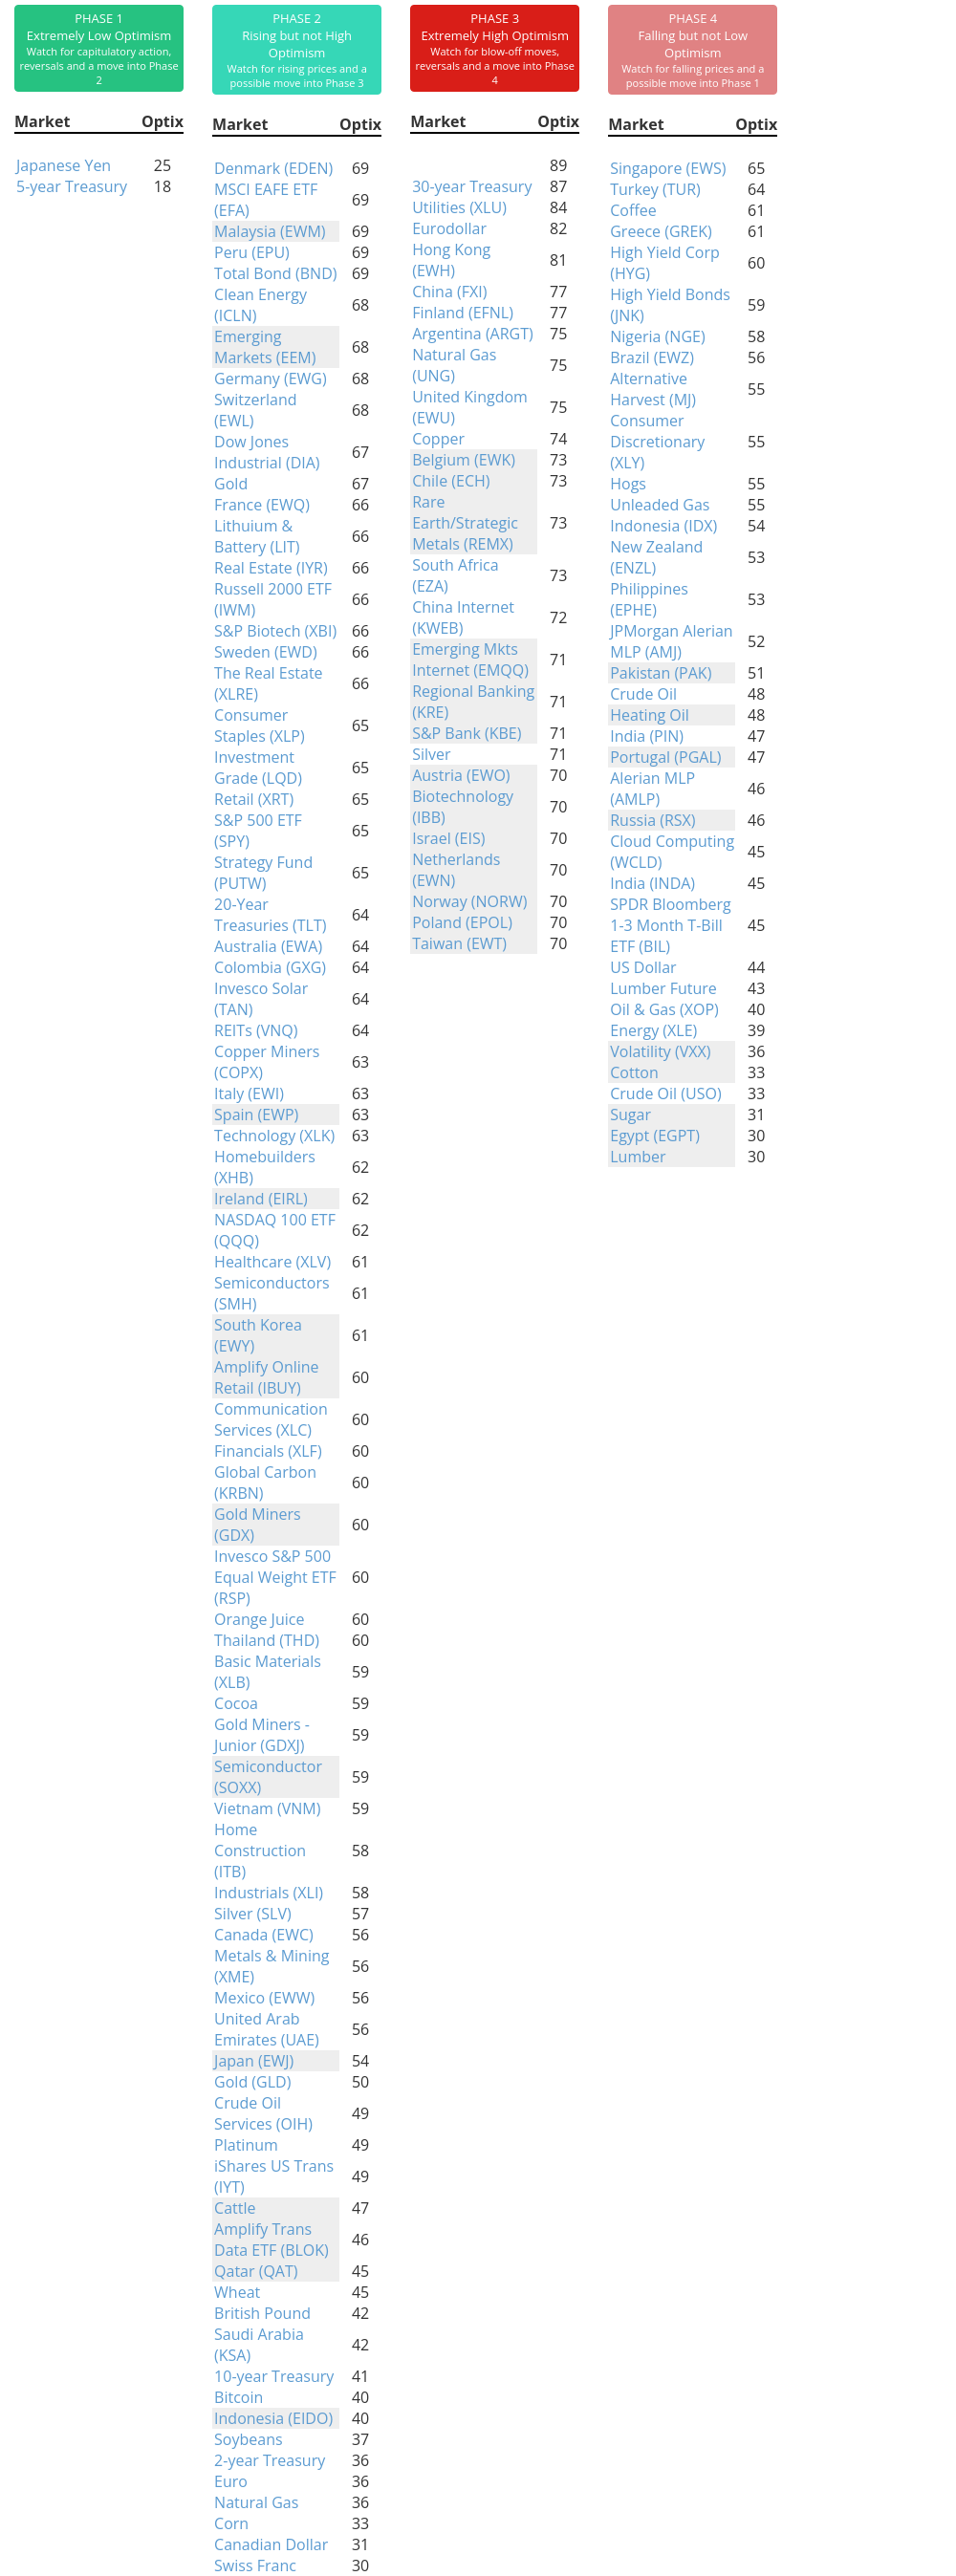
Phase Table
Ranks
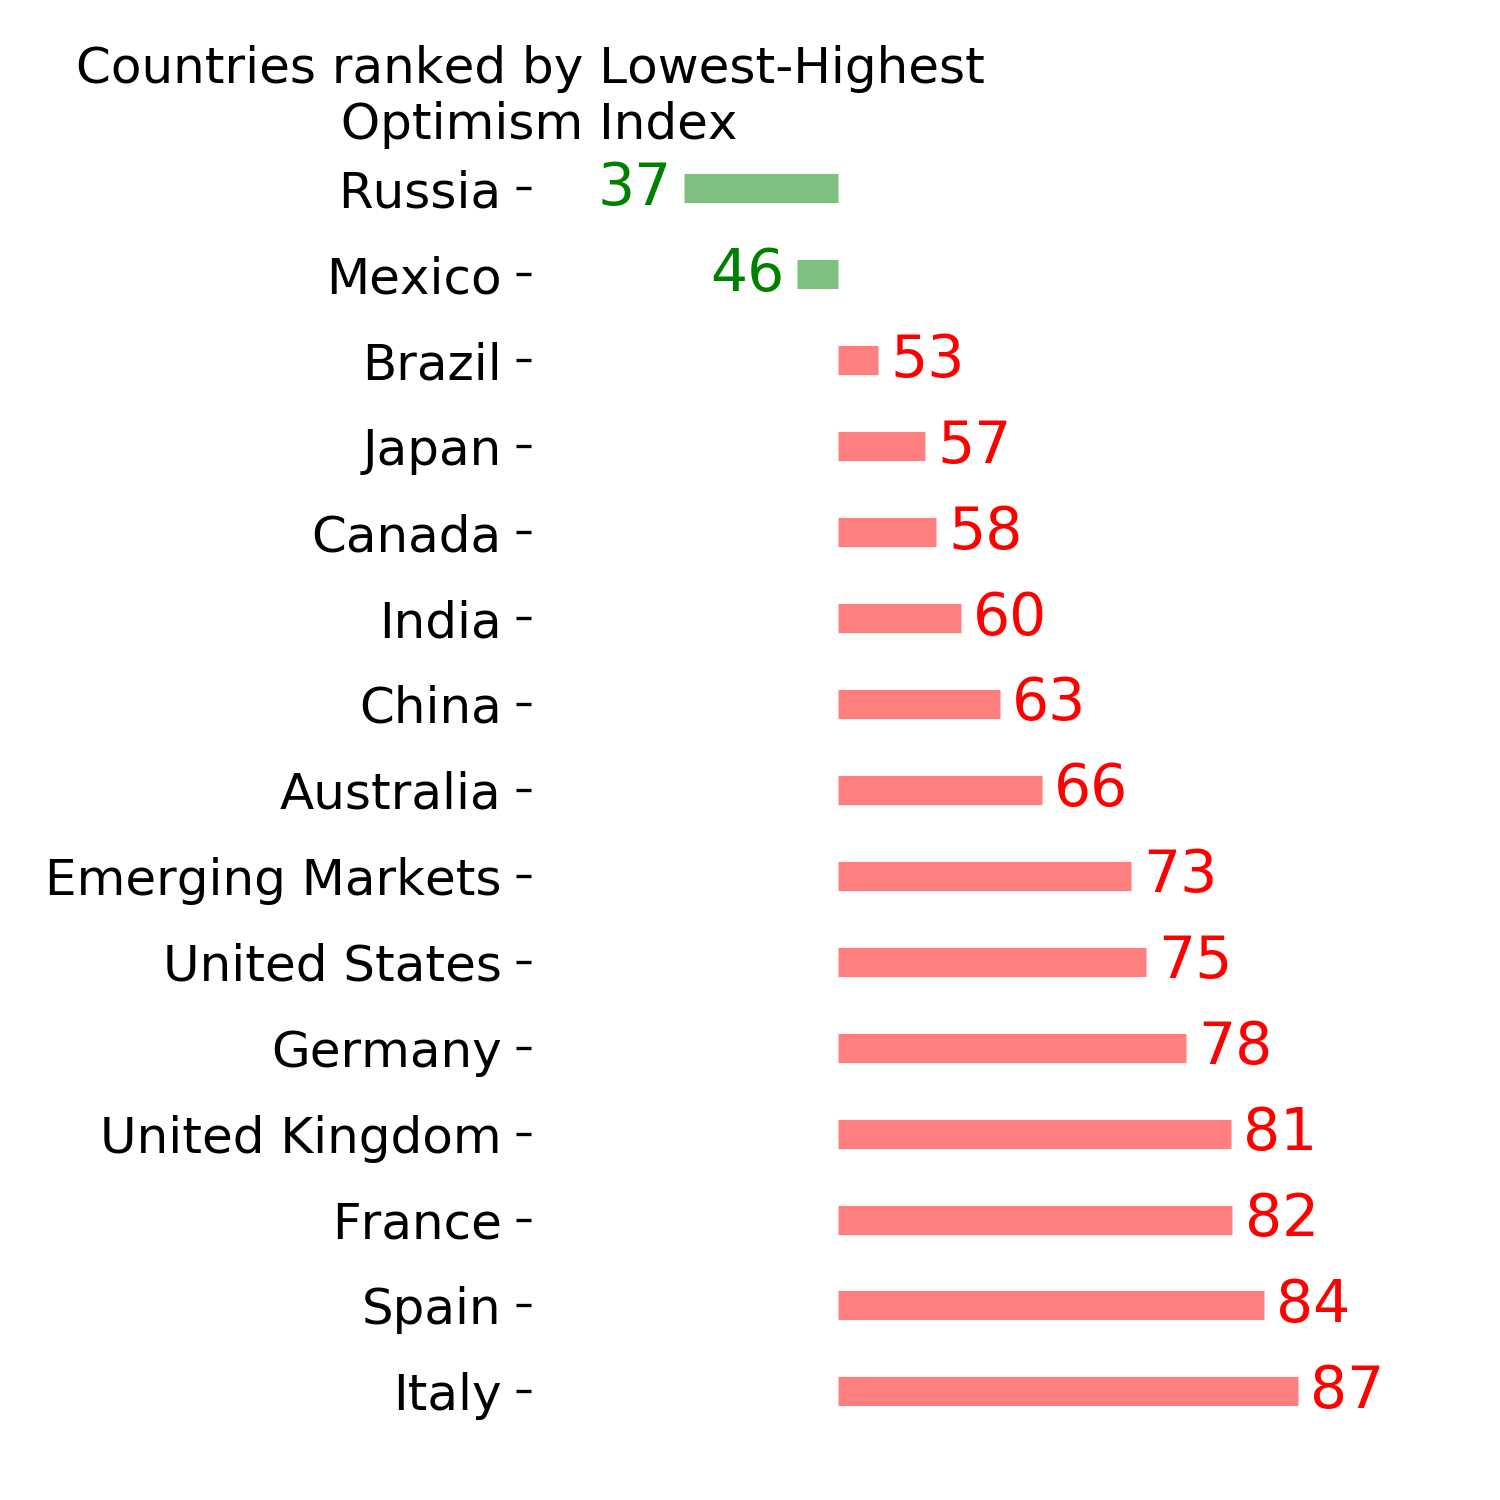
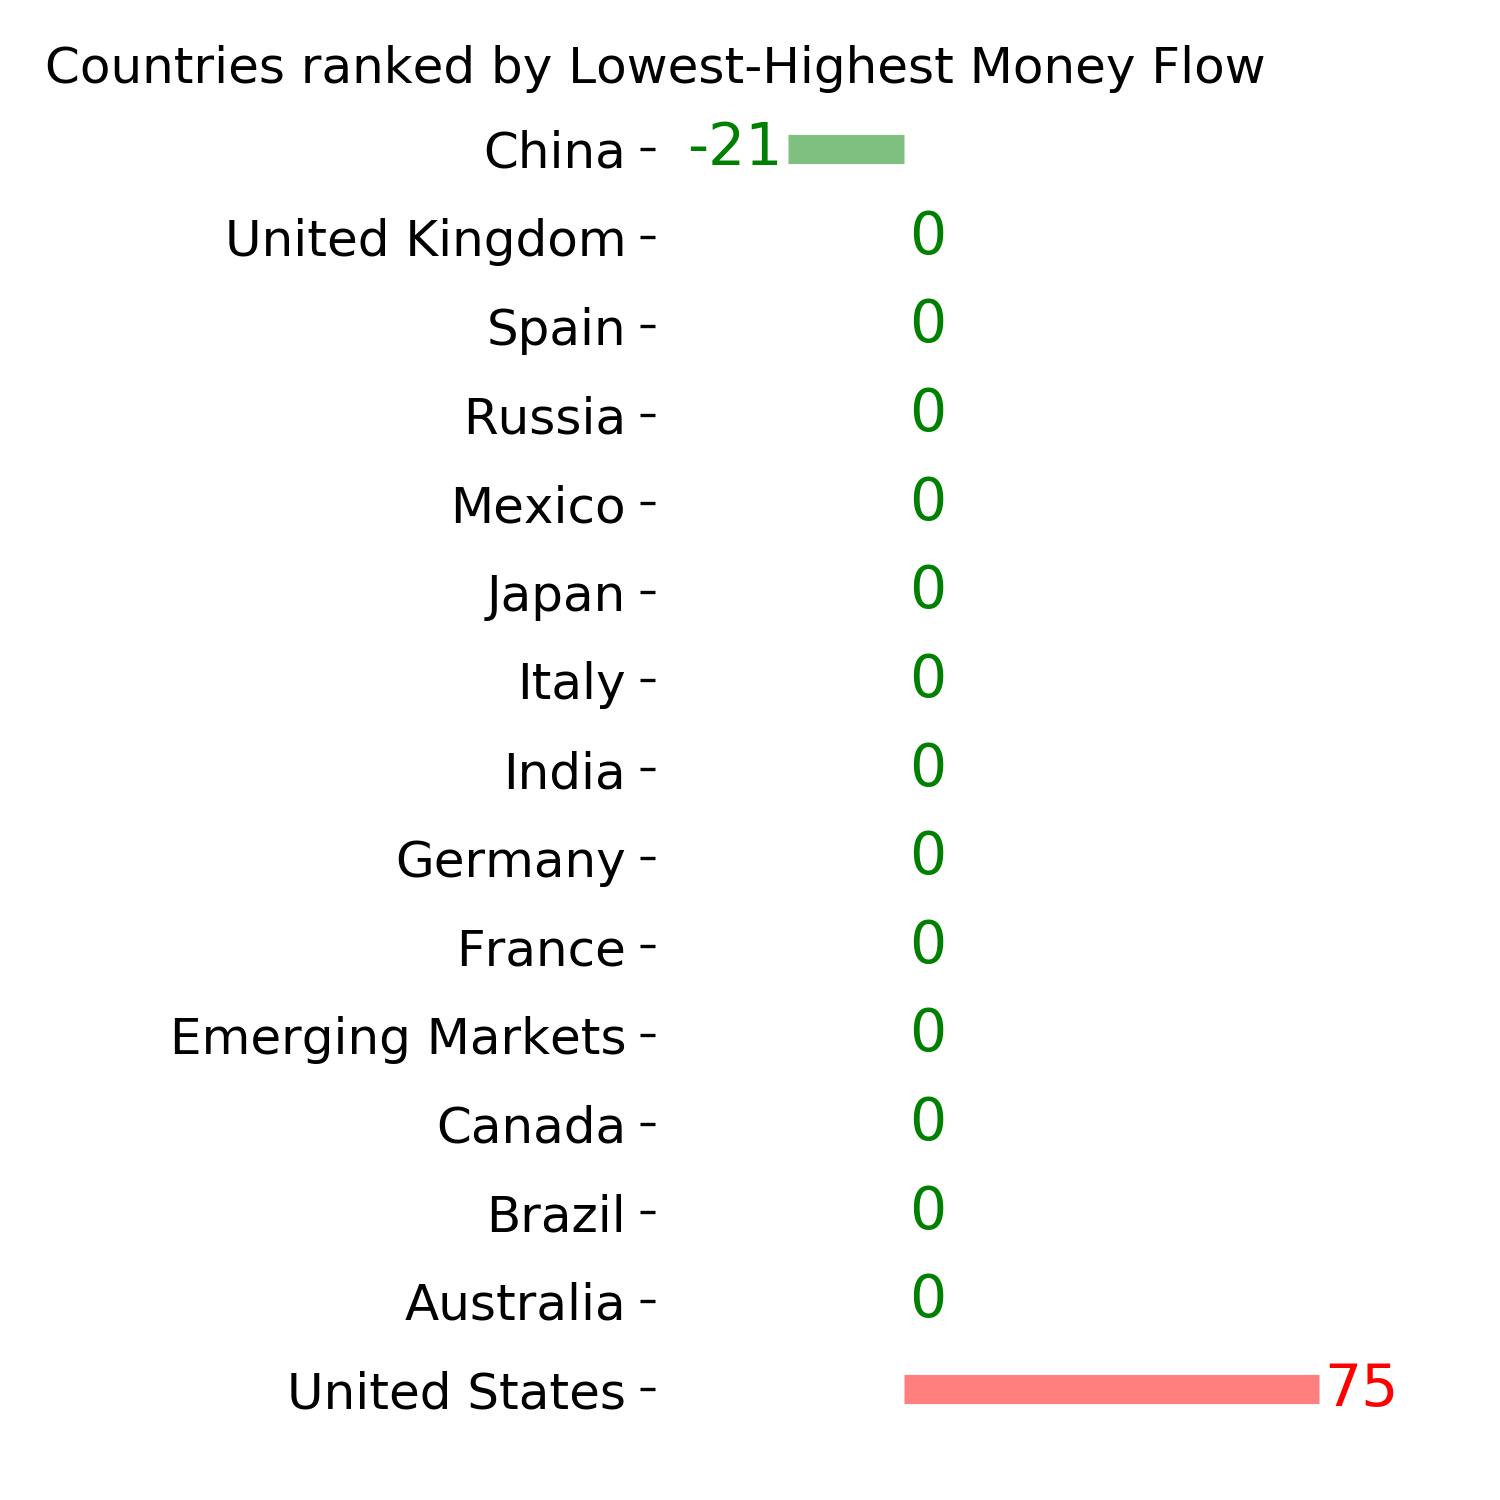
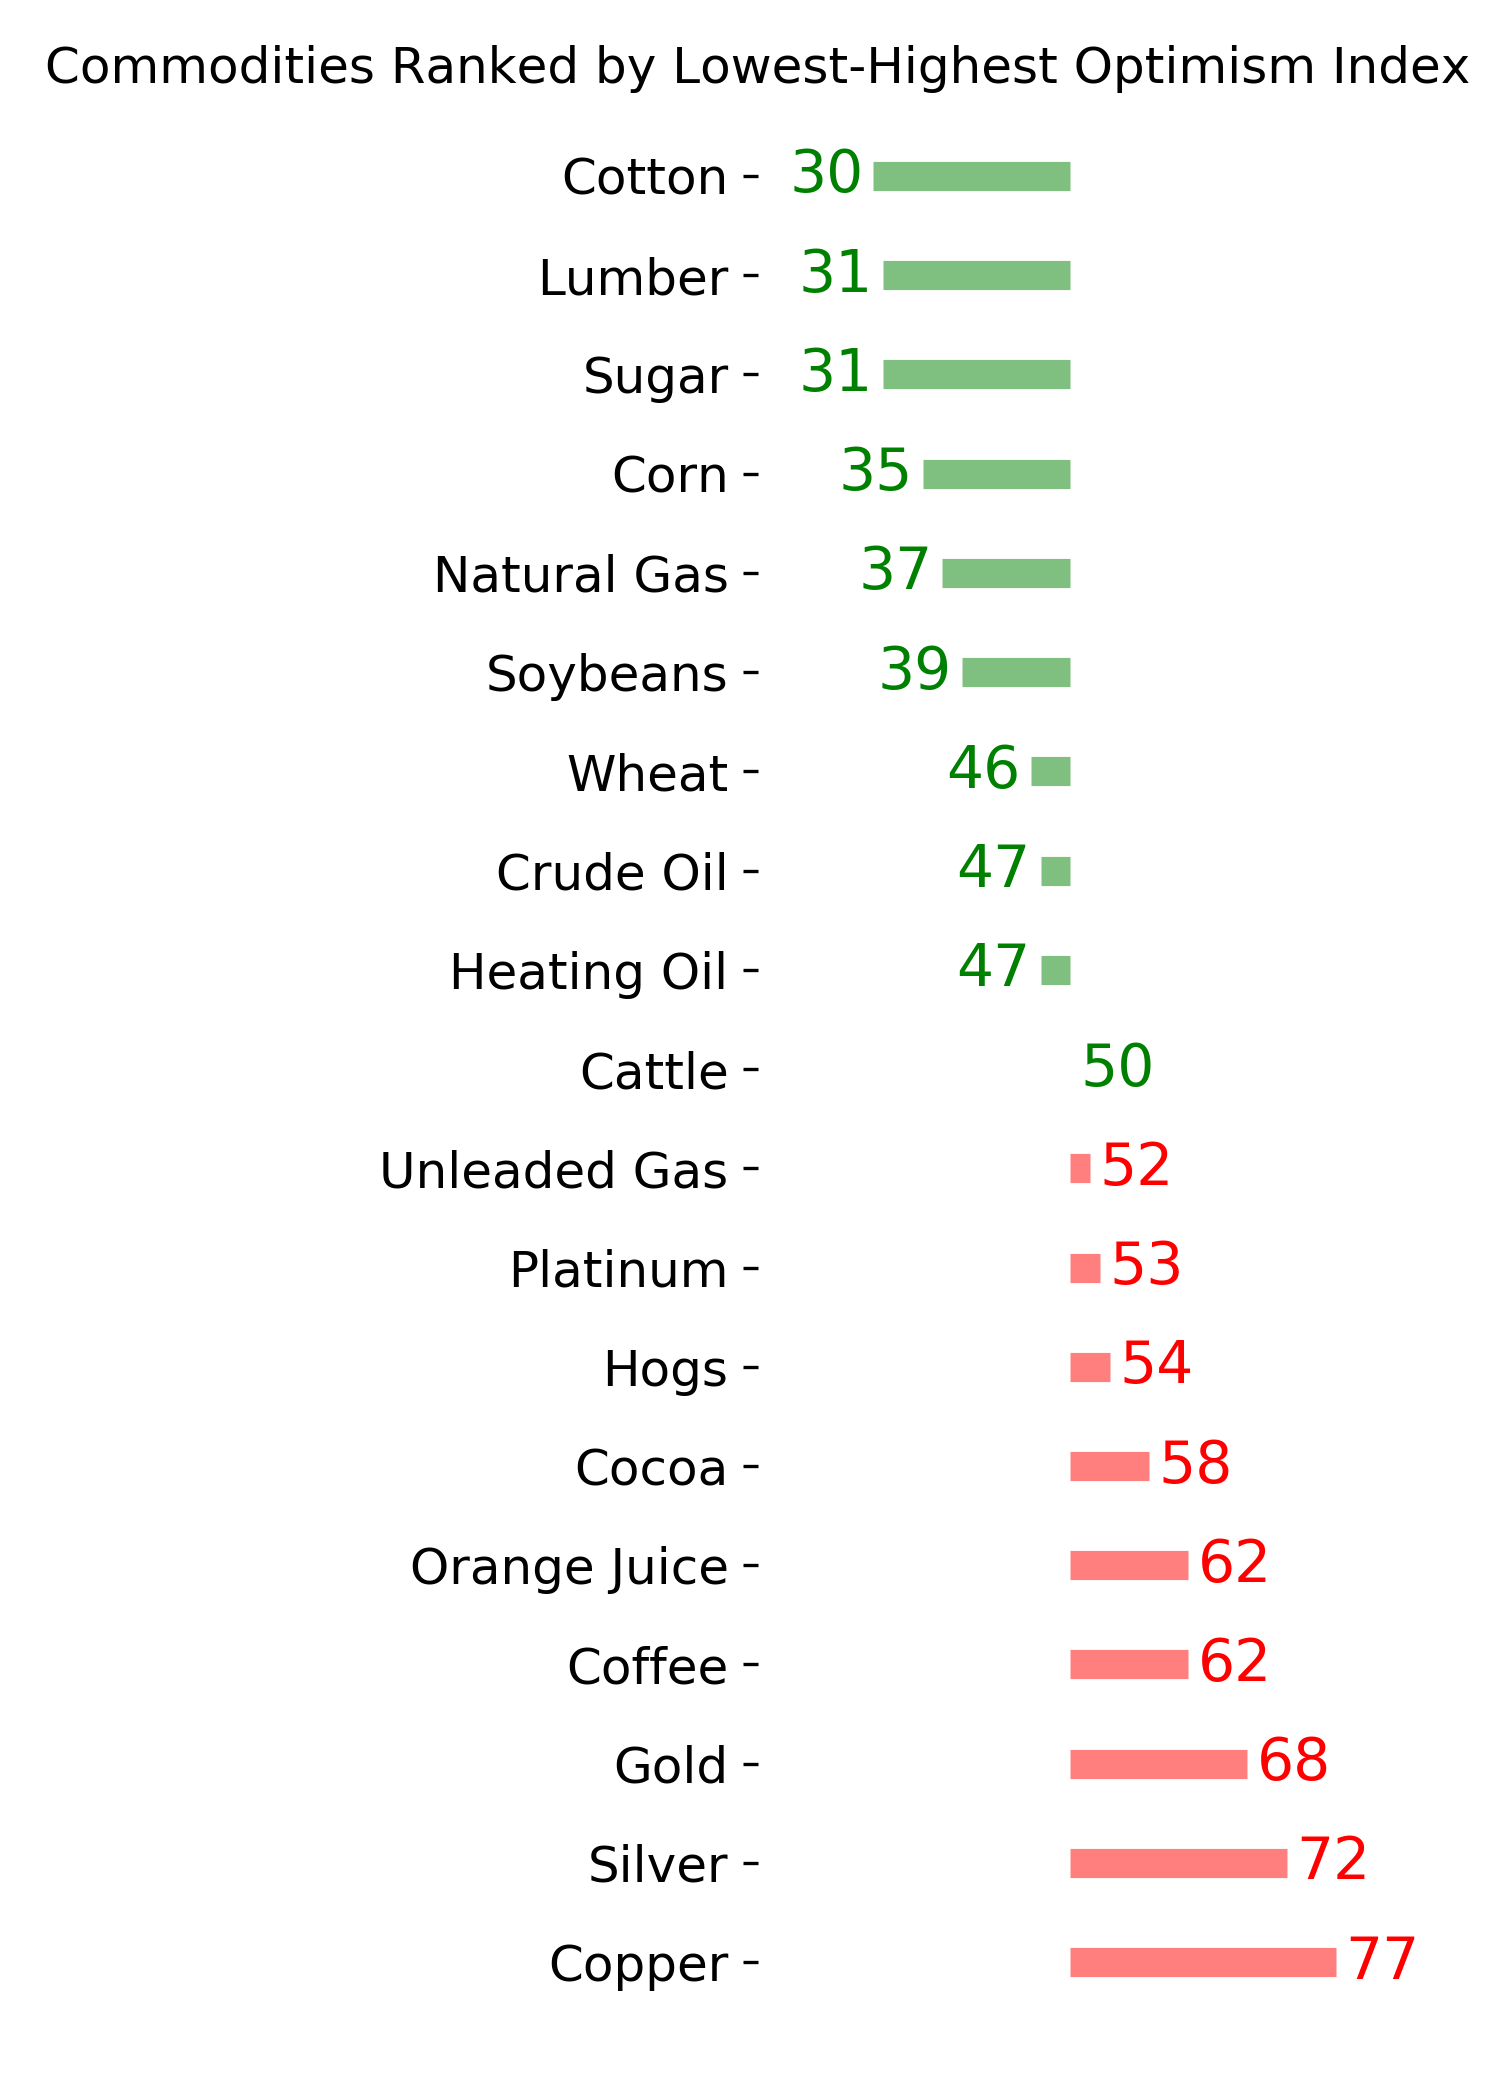
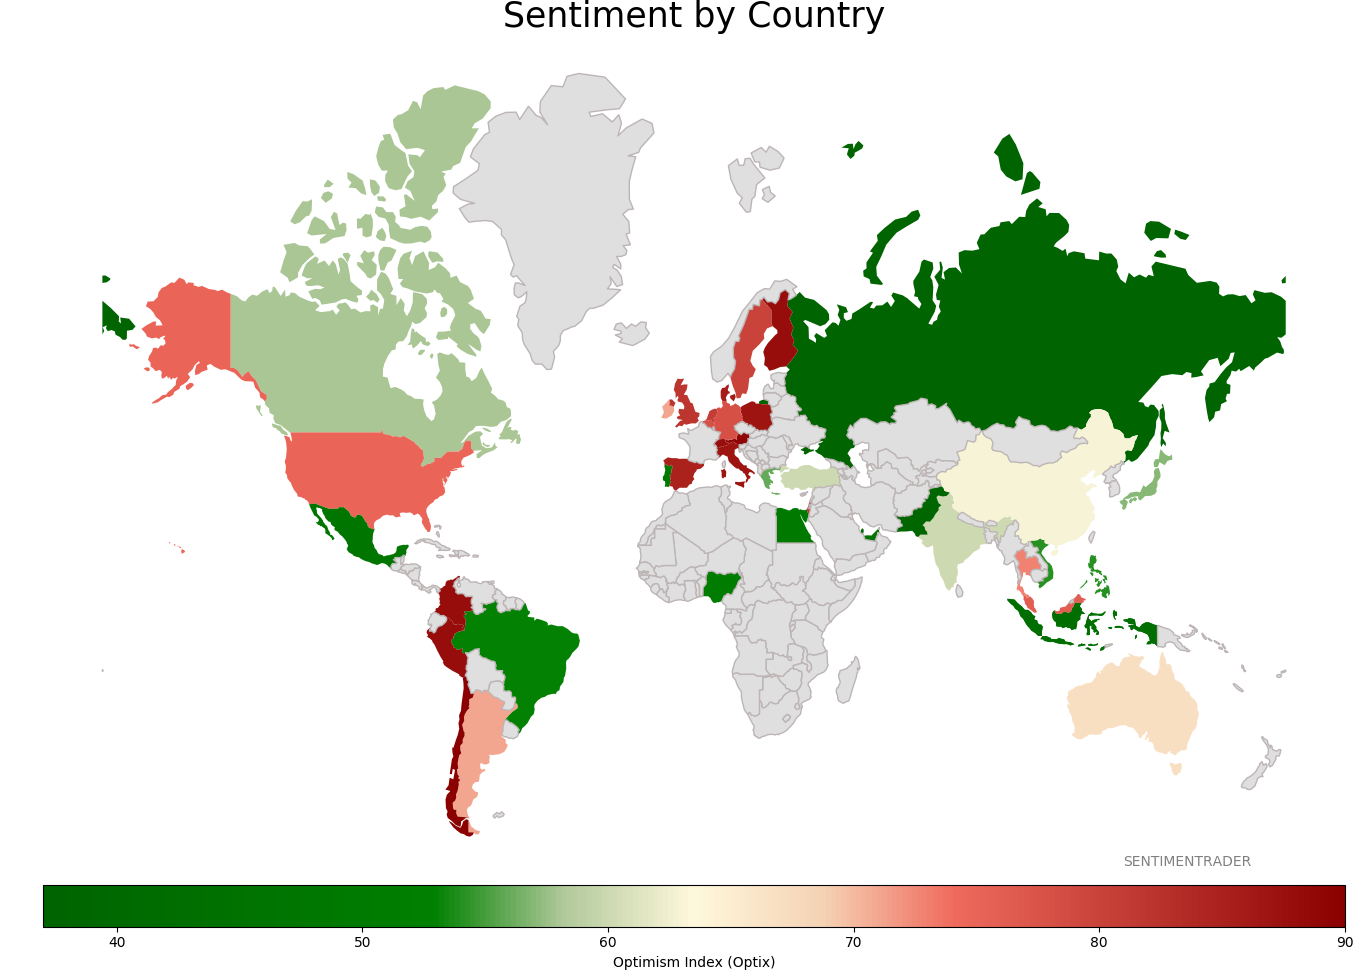
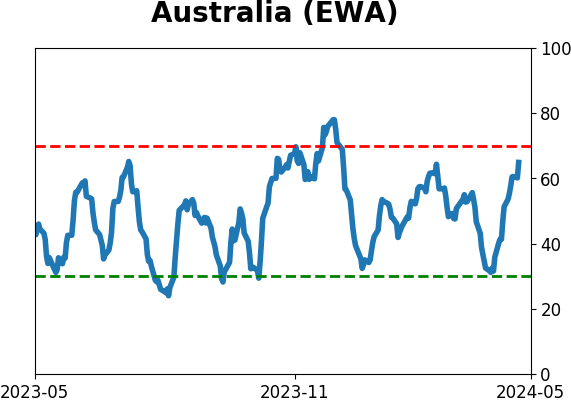
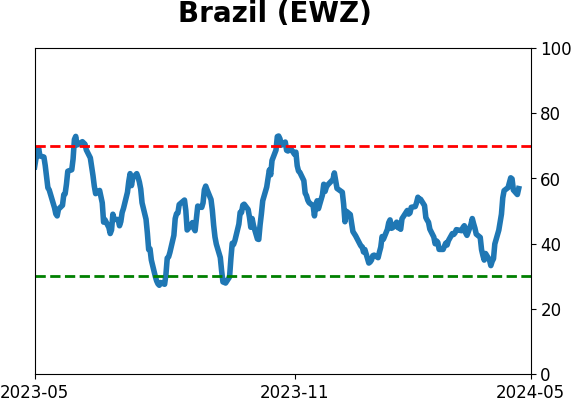
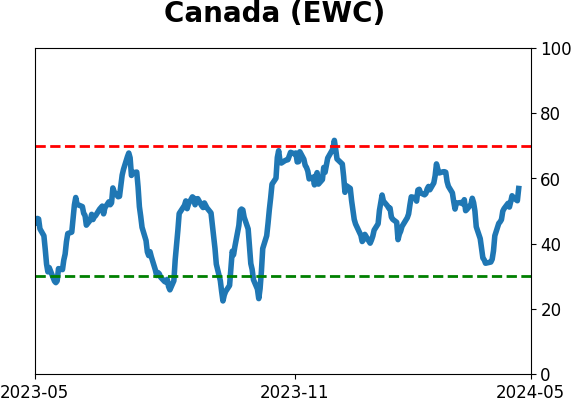
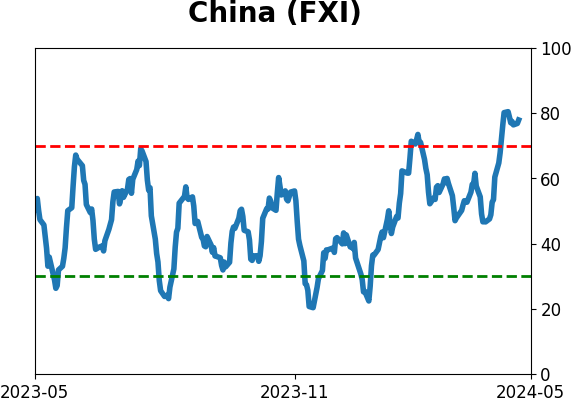
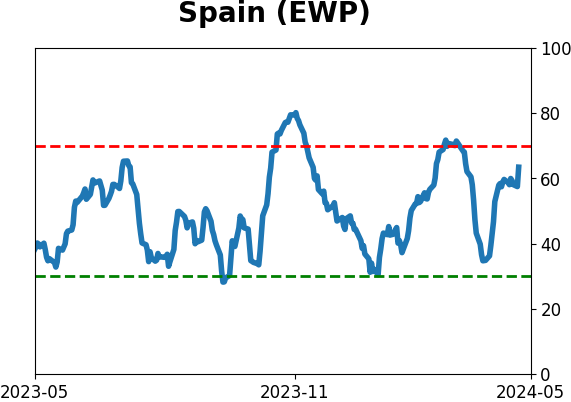
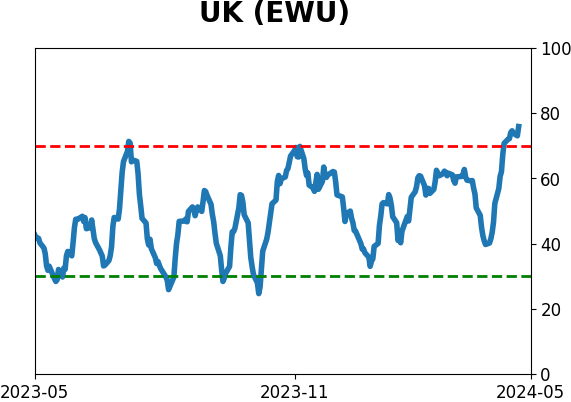
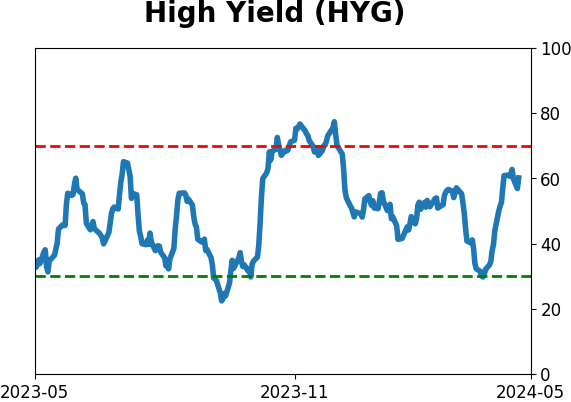
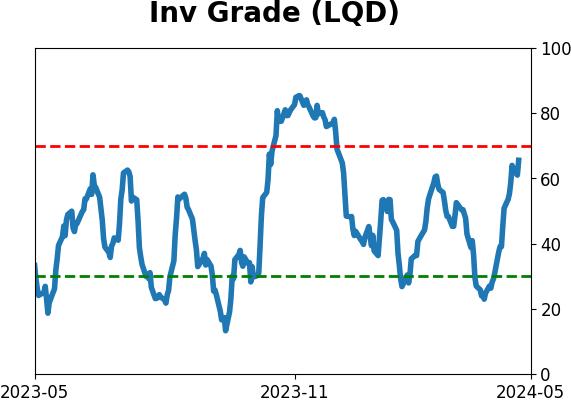
Sentiment Around The World
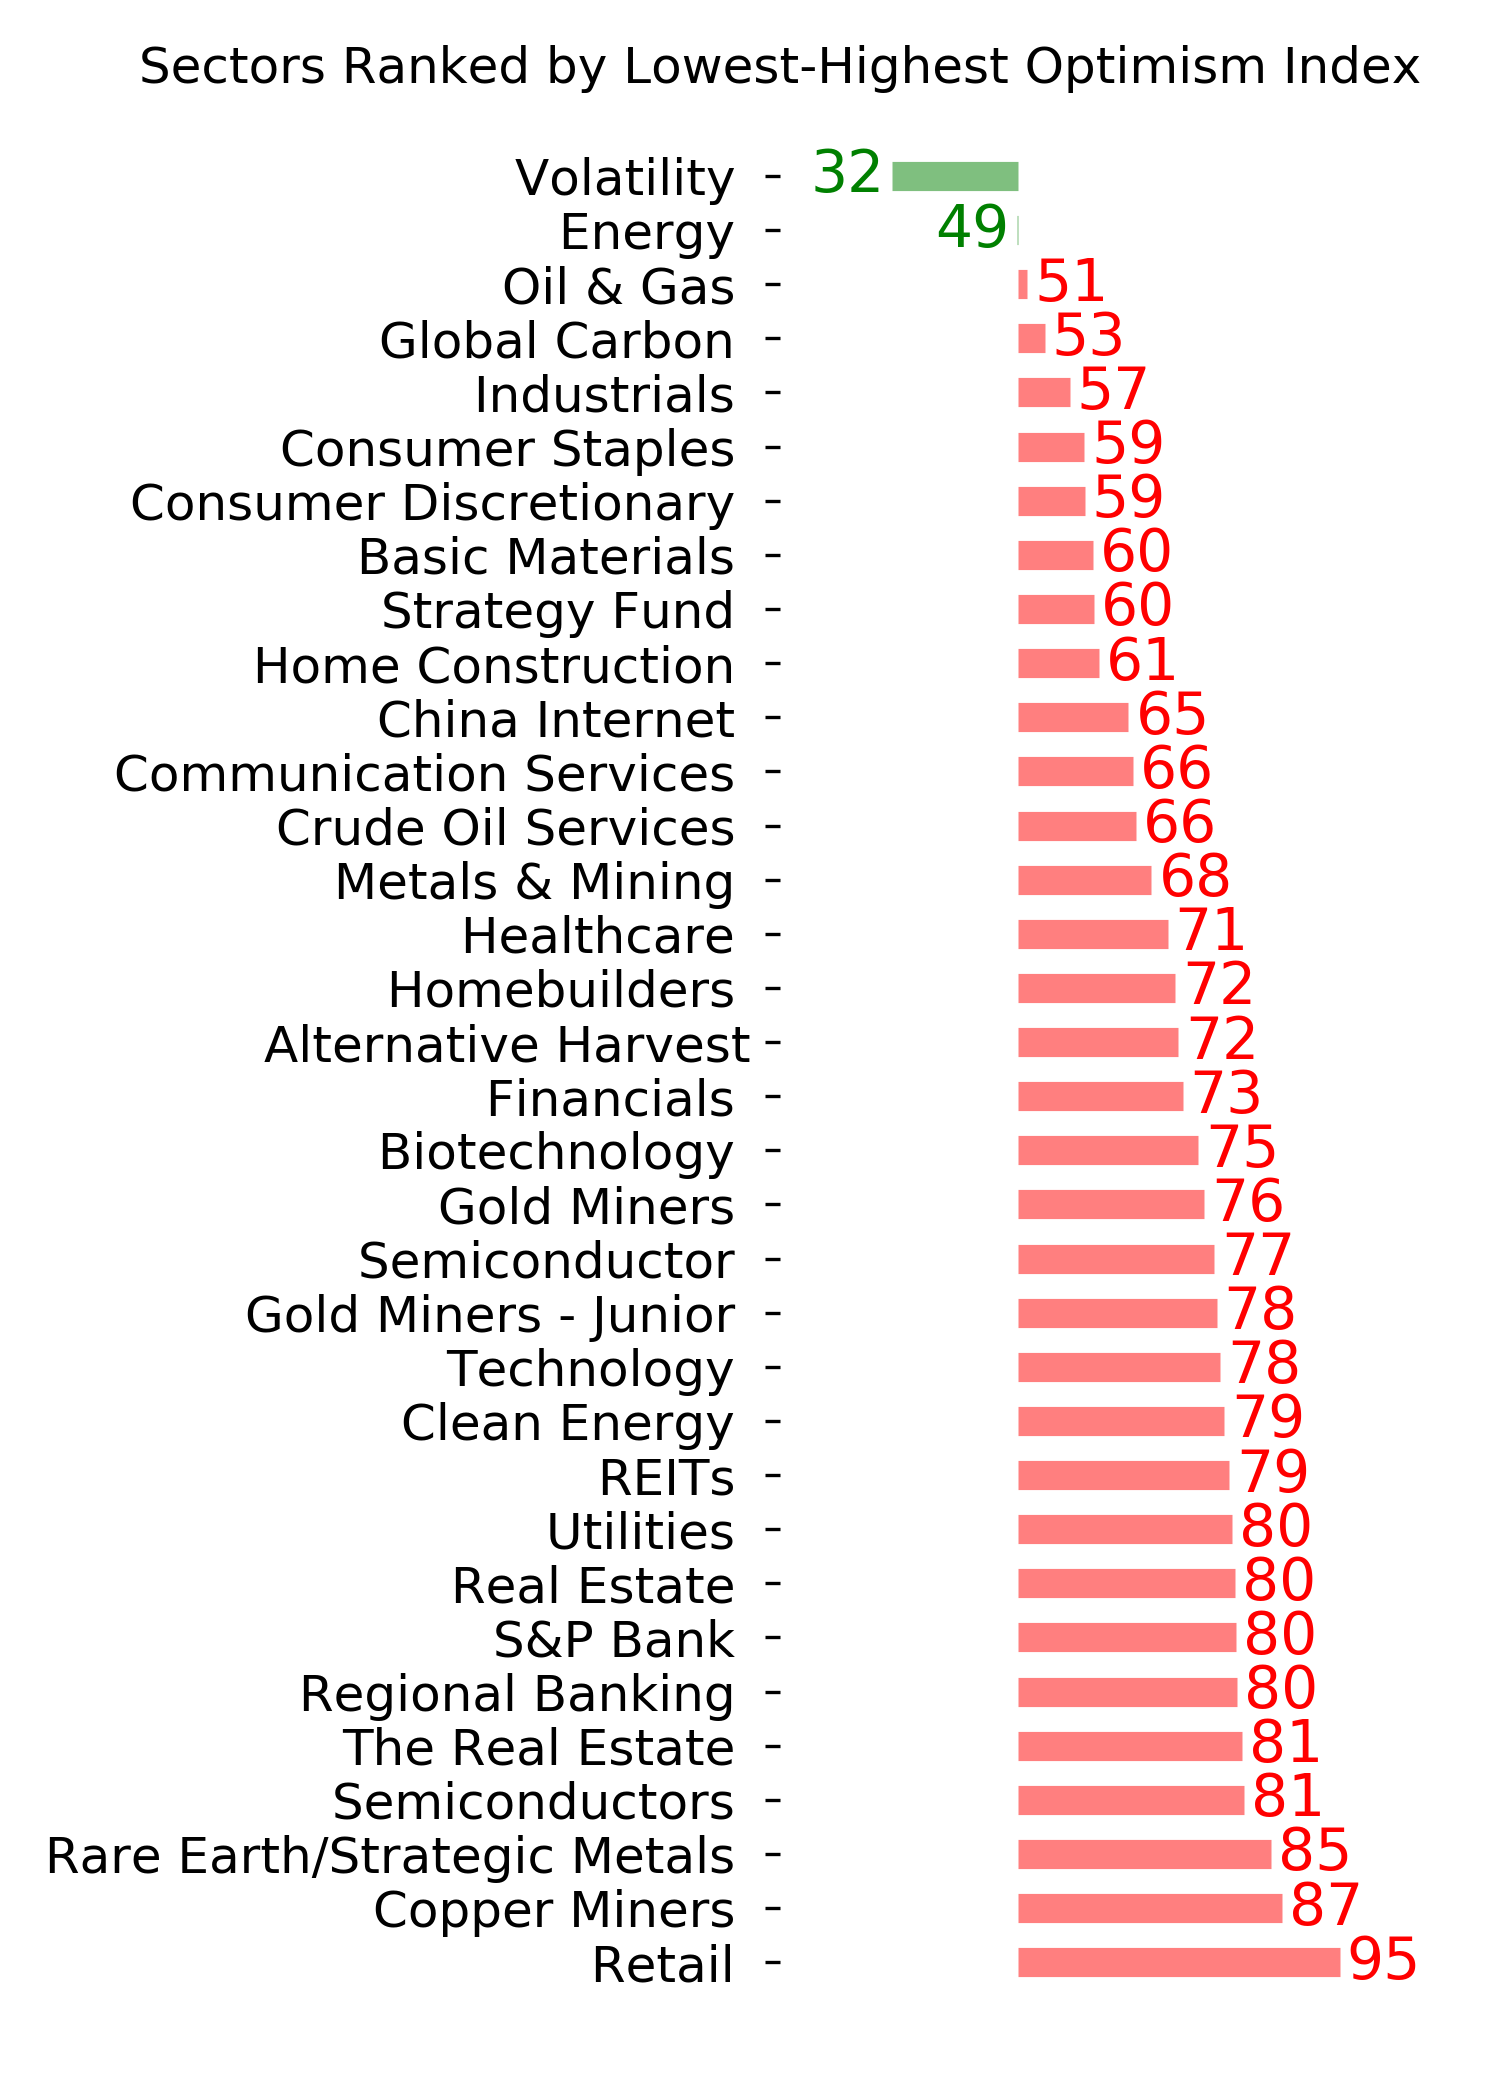
Optimism Index Thumbnails
|
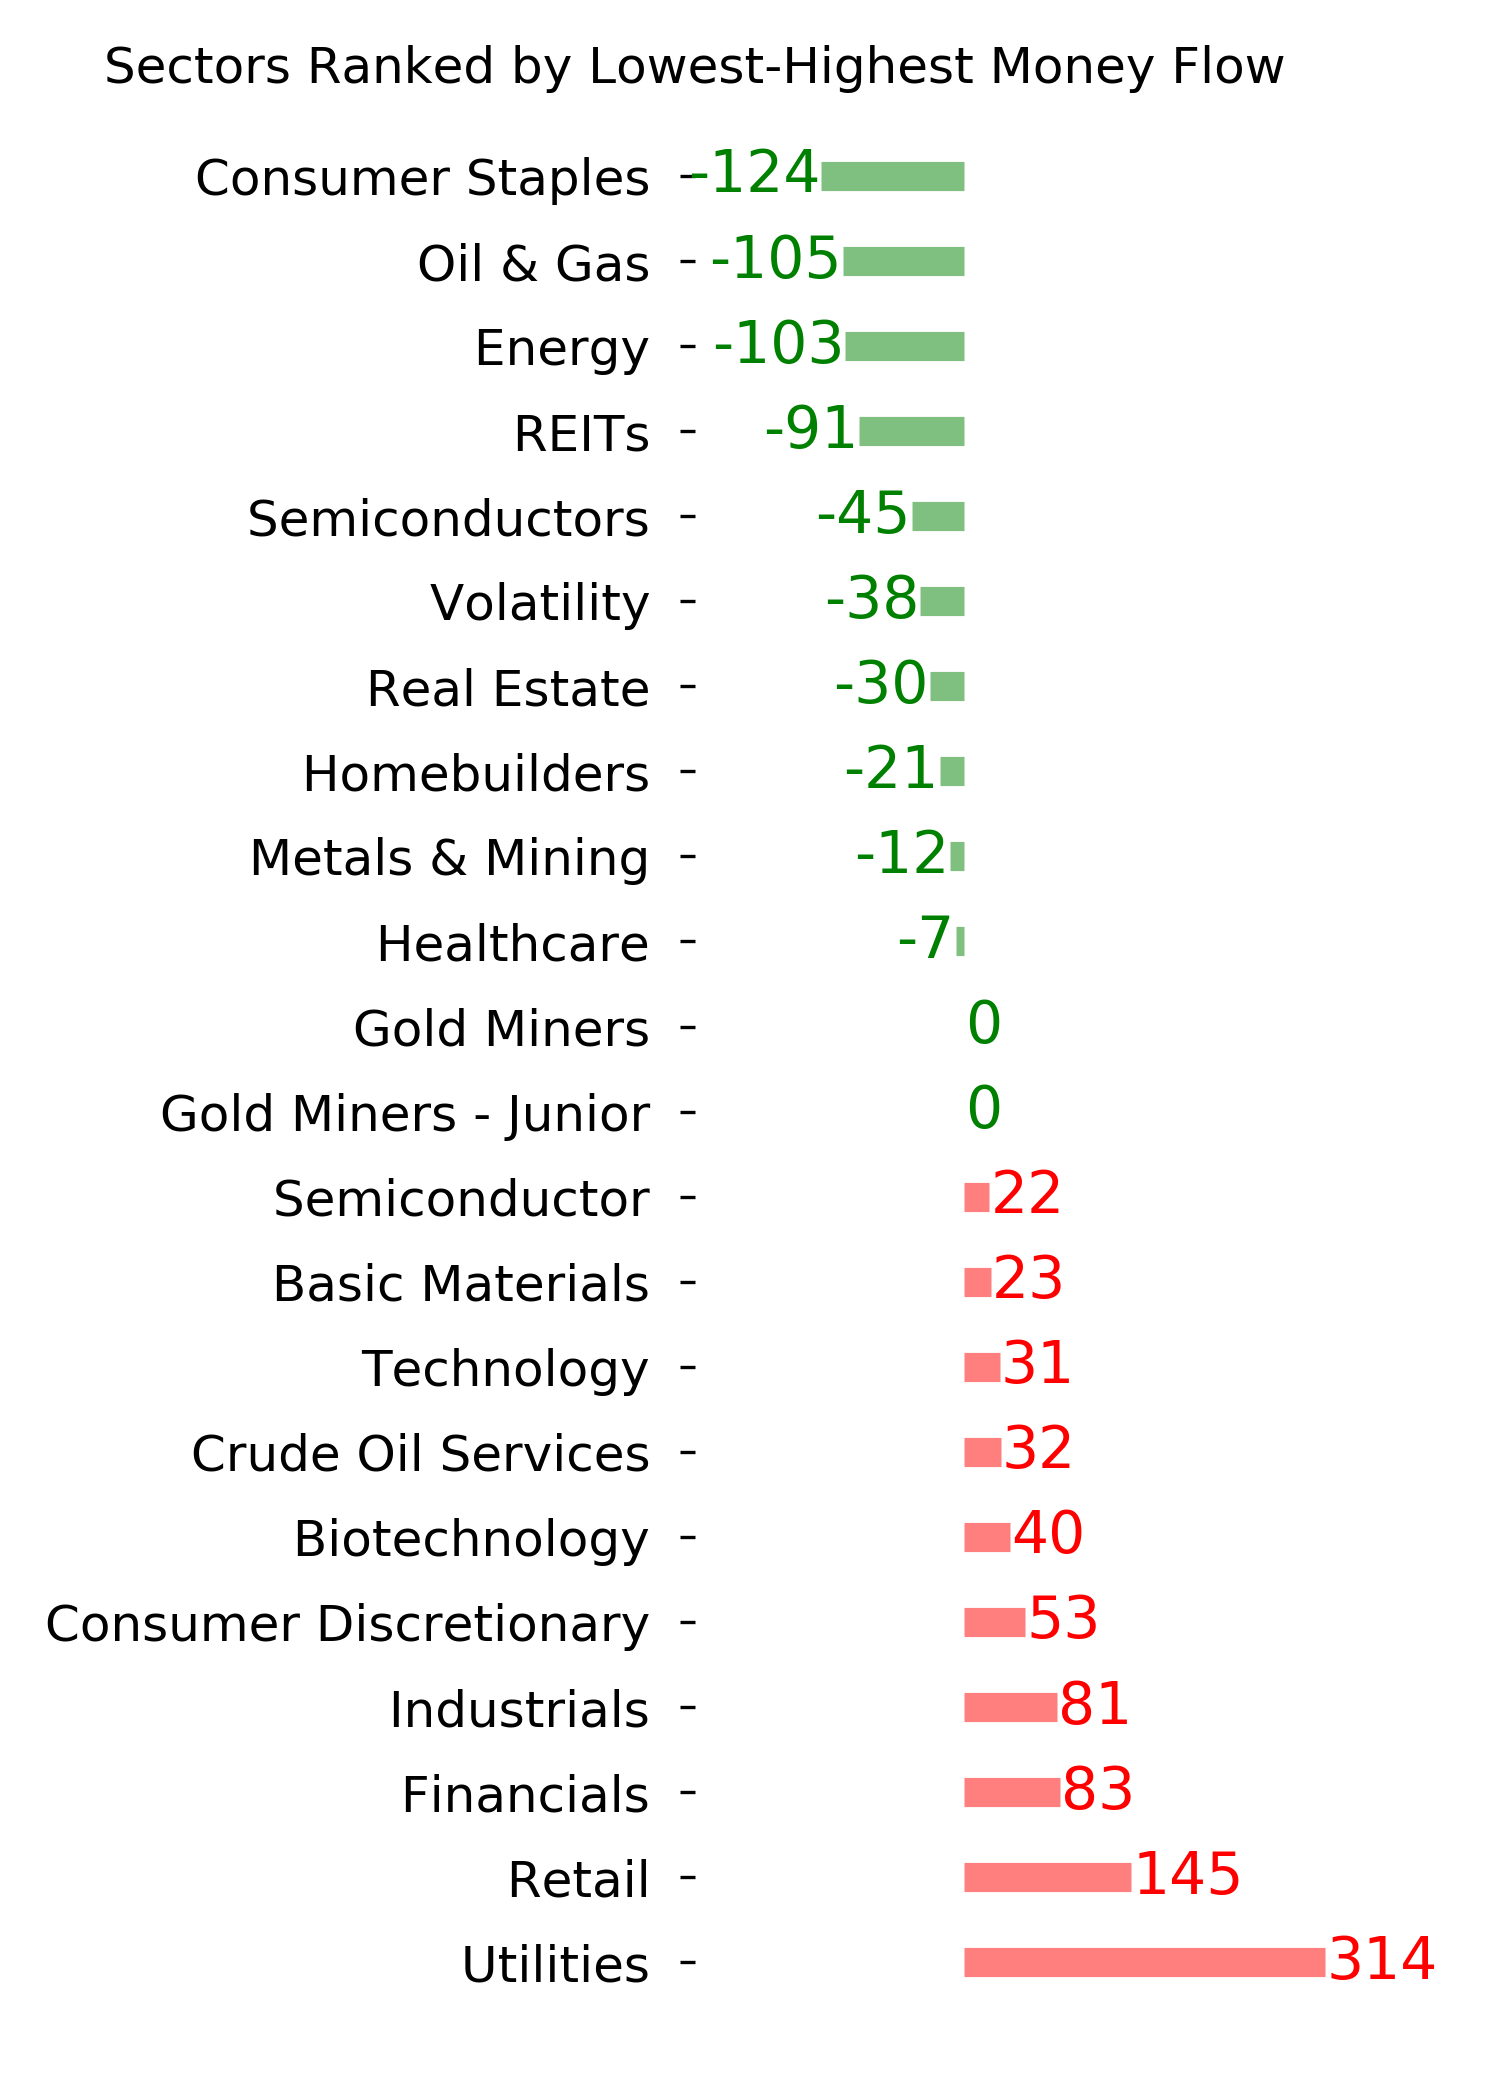
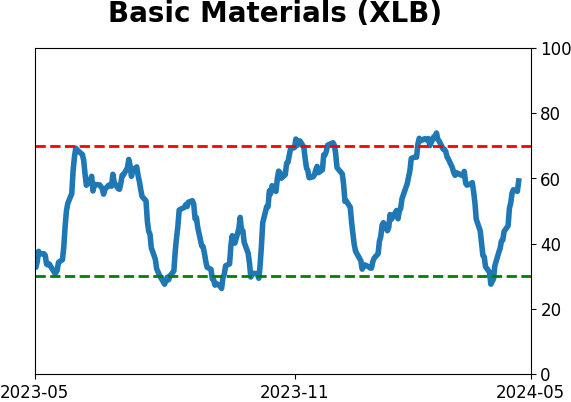
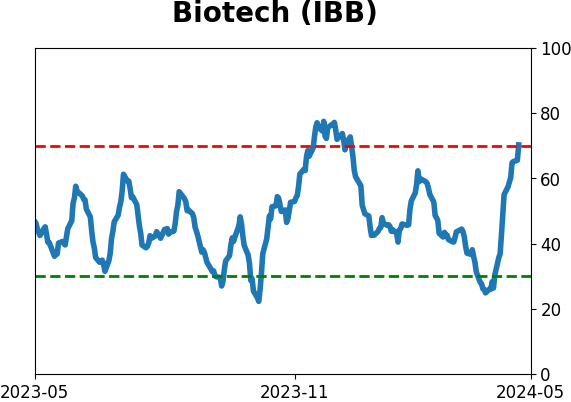
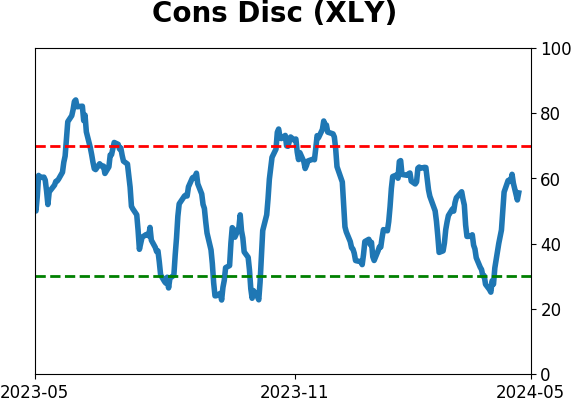
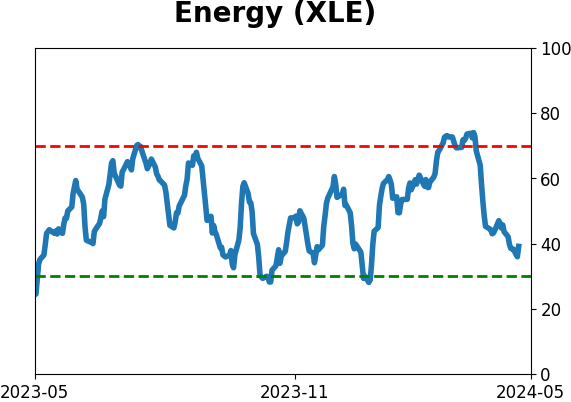
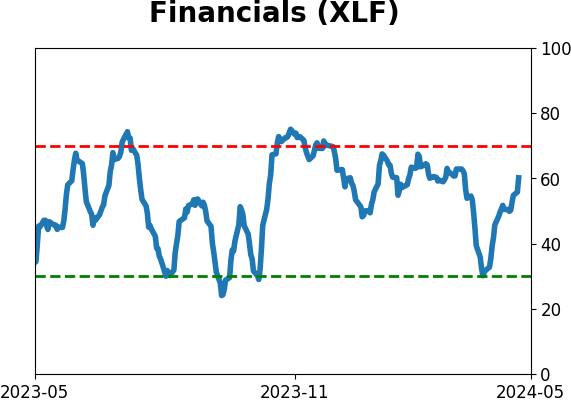
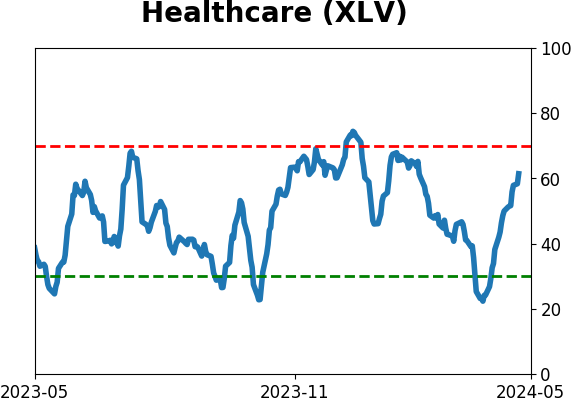
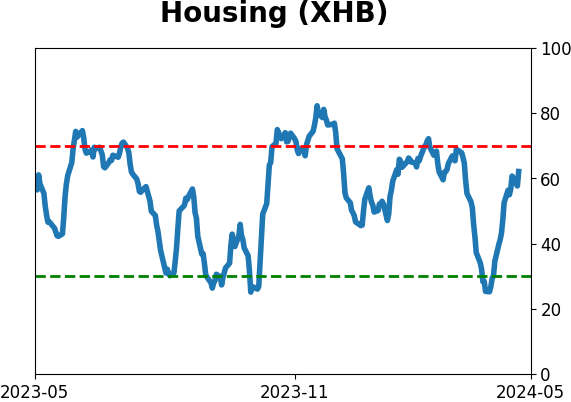
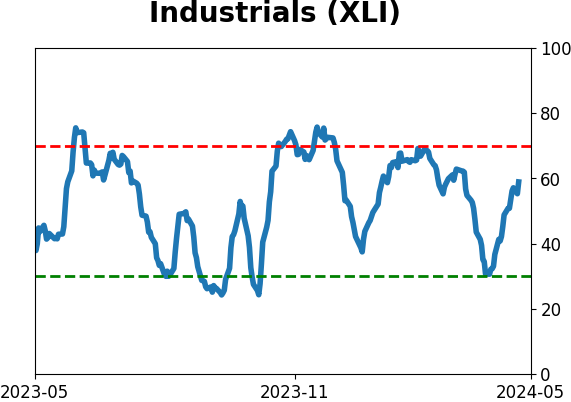
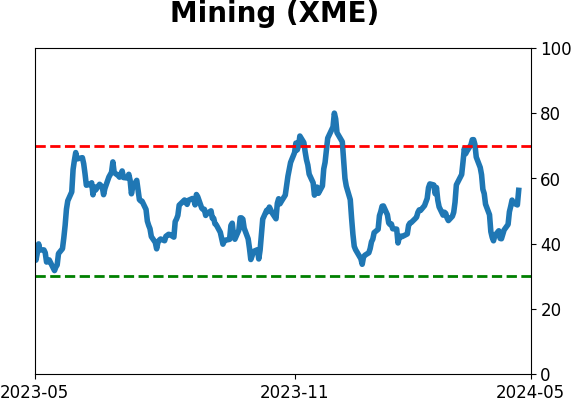
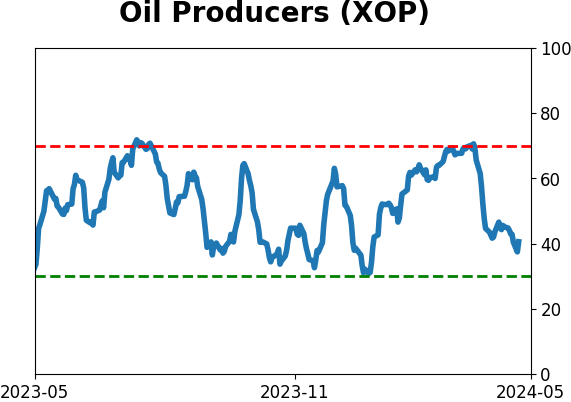
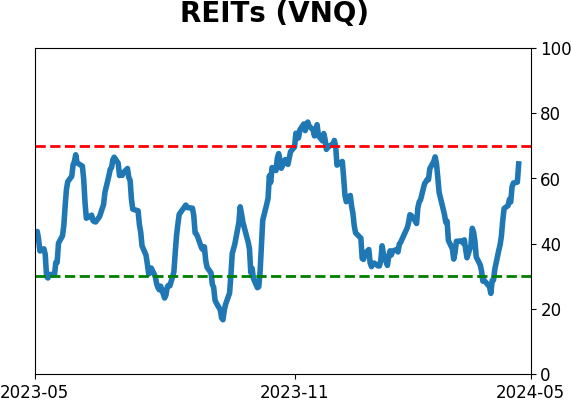
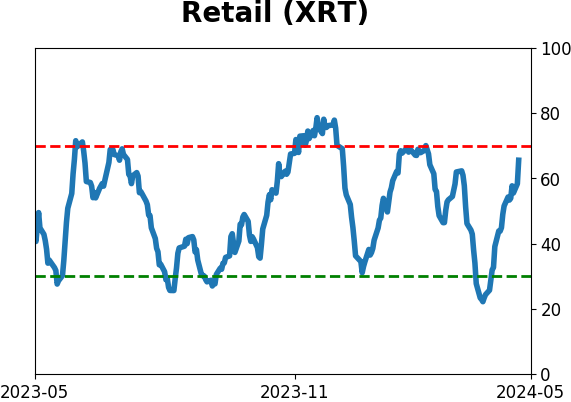
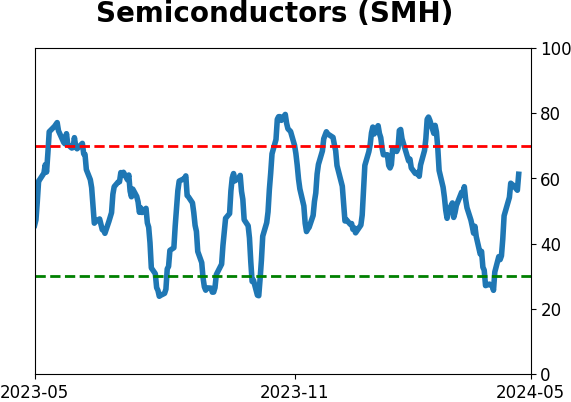
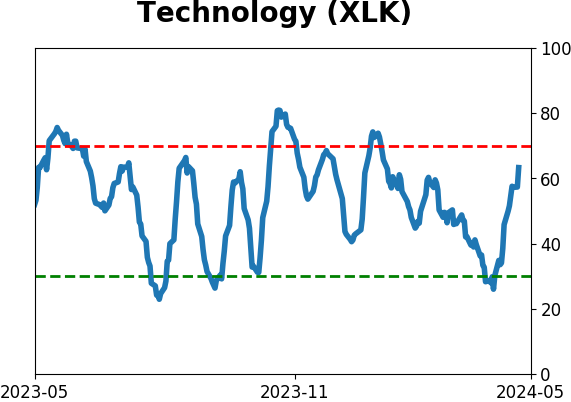
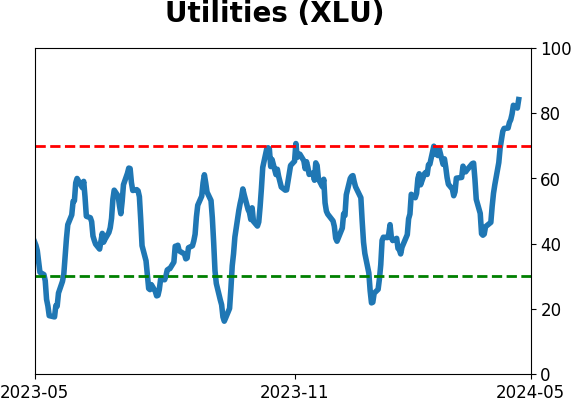
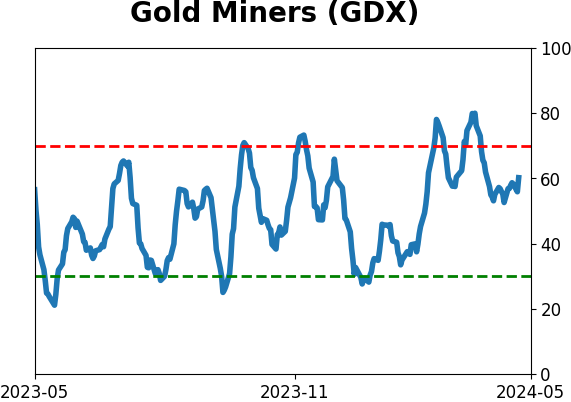
Sector ETF's - 10-Day Moving Average
|
|
|
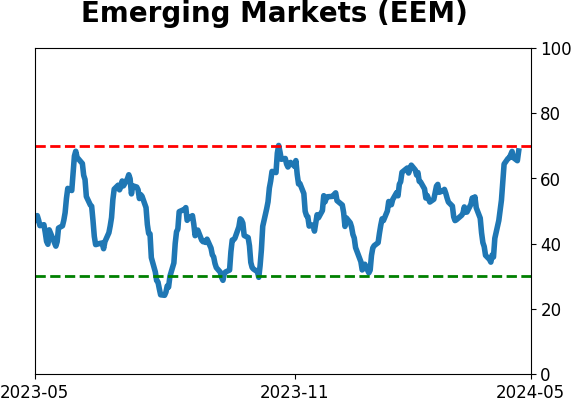
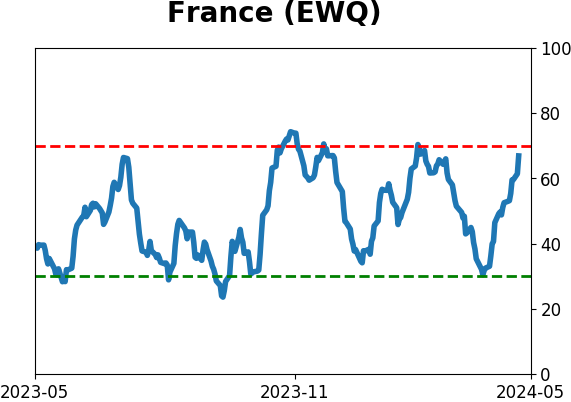
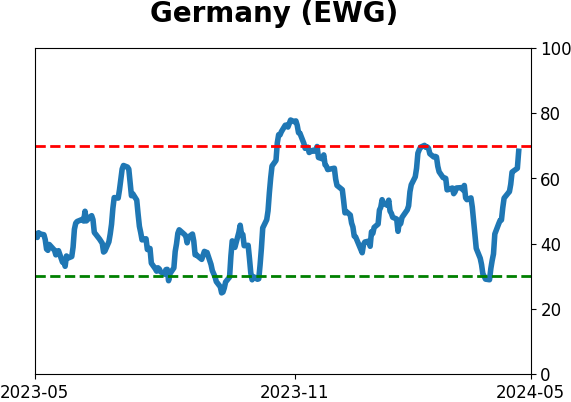
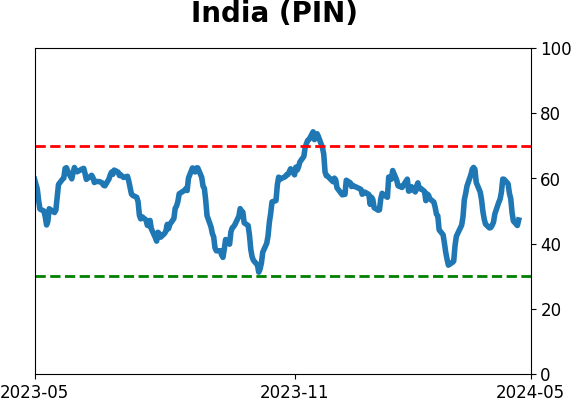
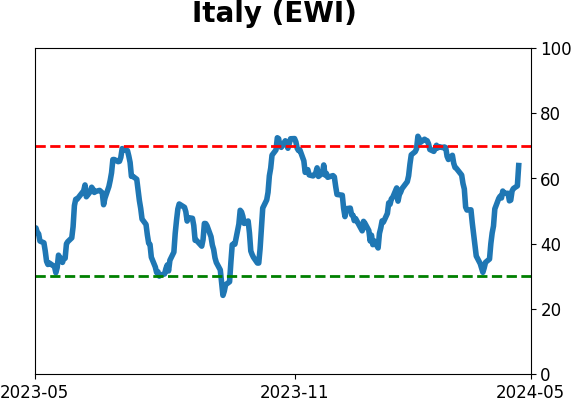
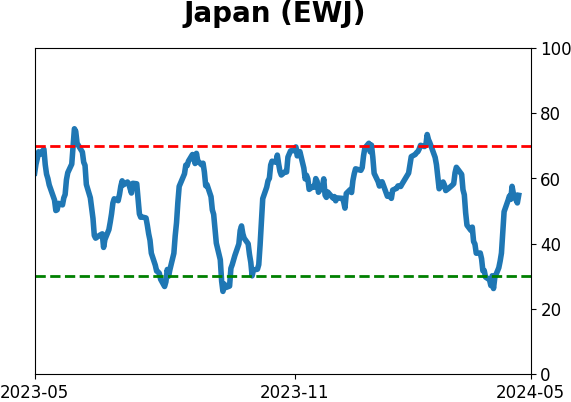
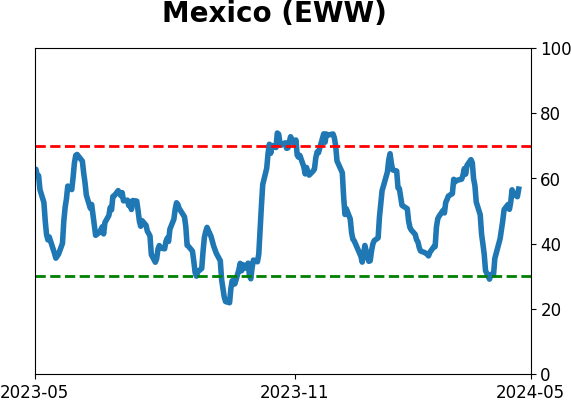
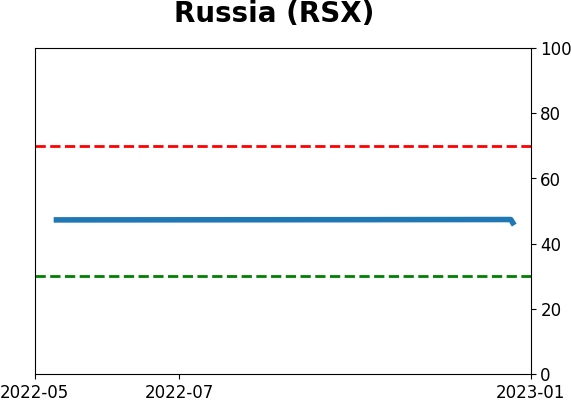
Country ETF's - 10-Day Moving Average
|
|
|
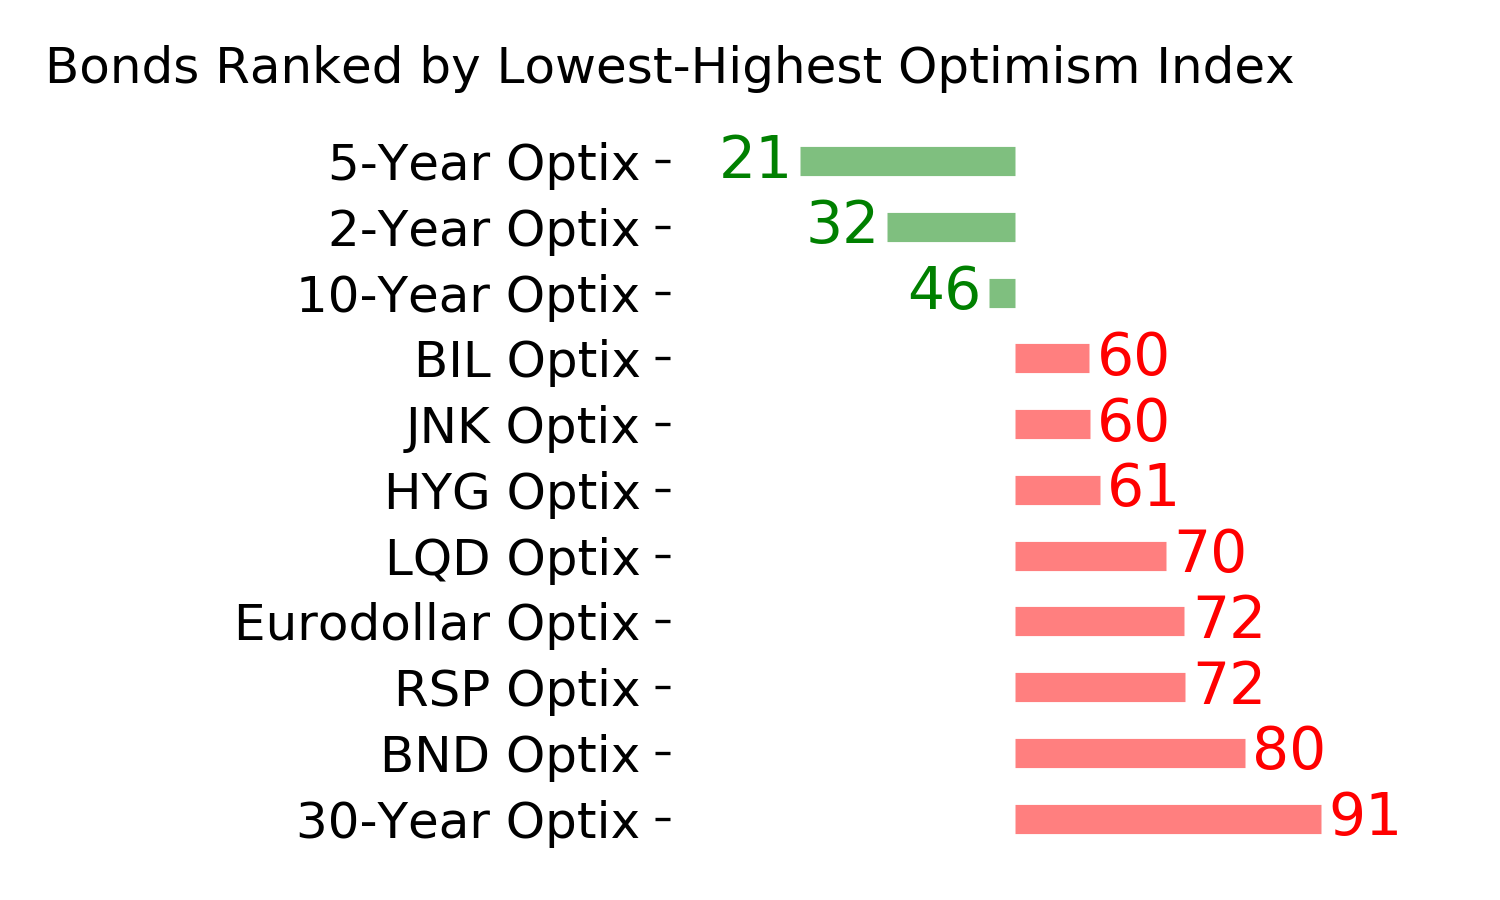
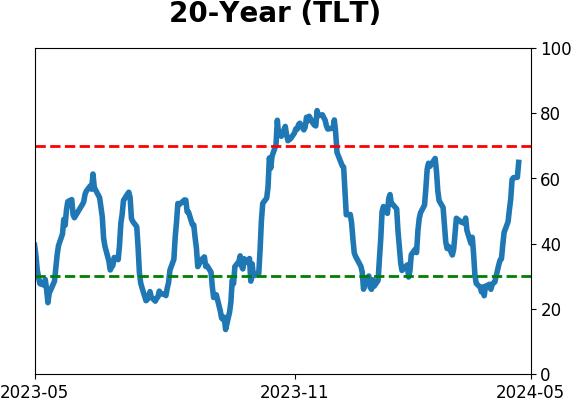
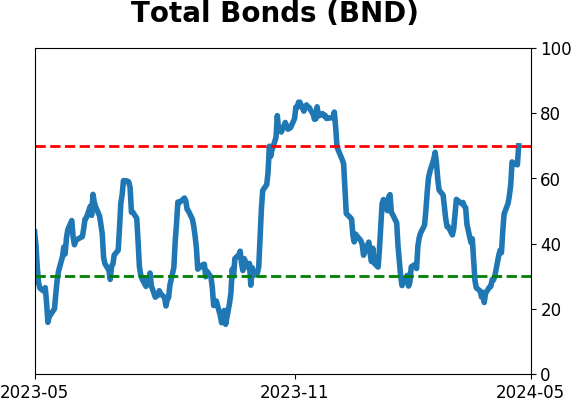
Bond ETF's - 10-Day Moving Average
|
|
|
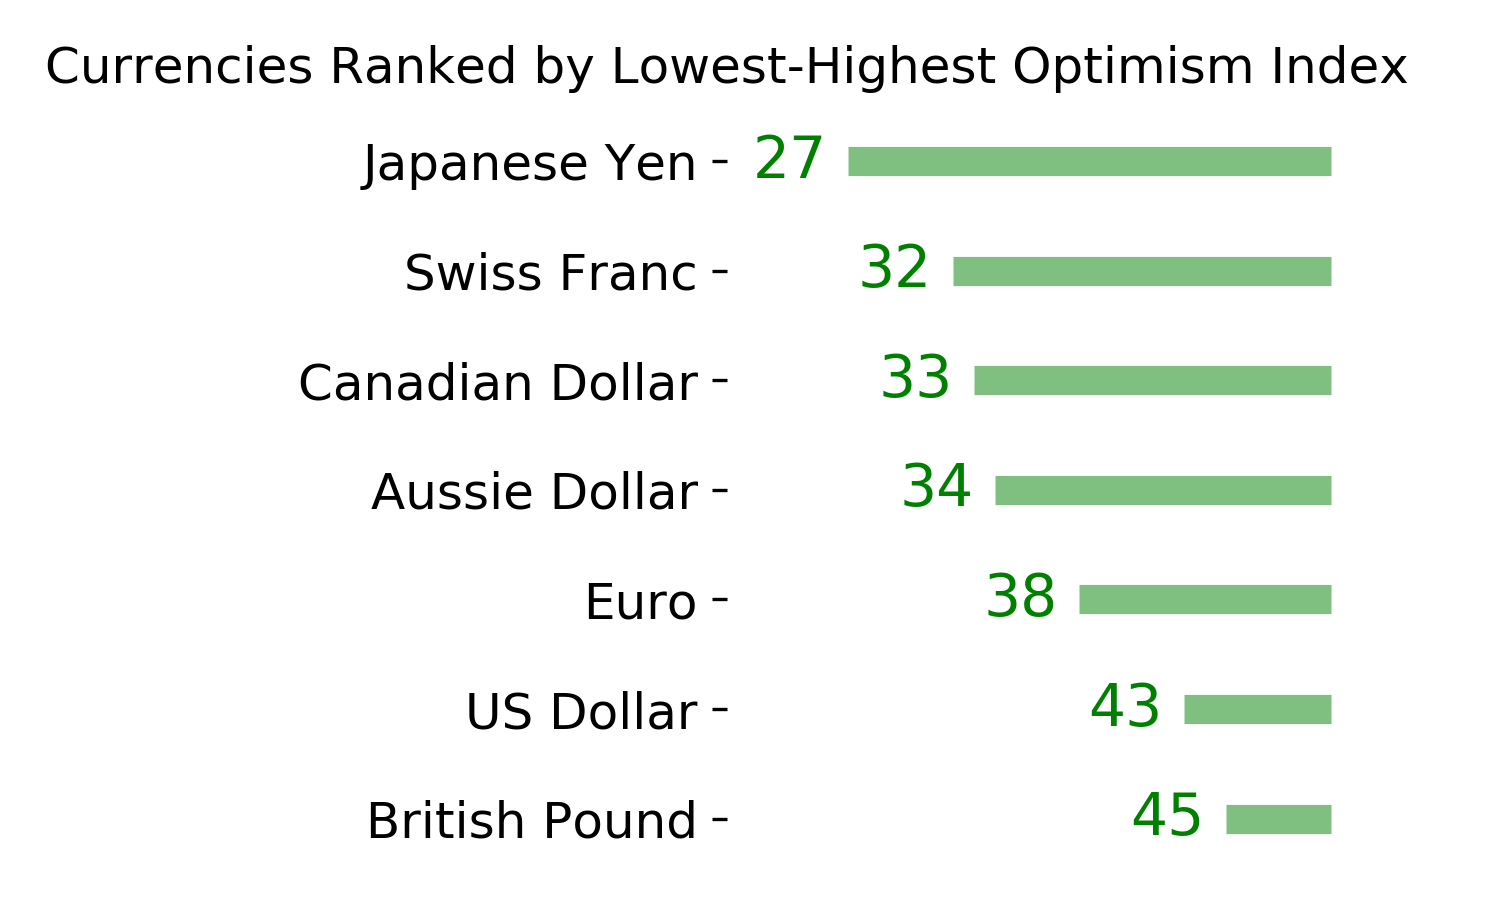
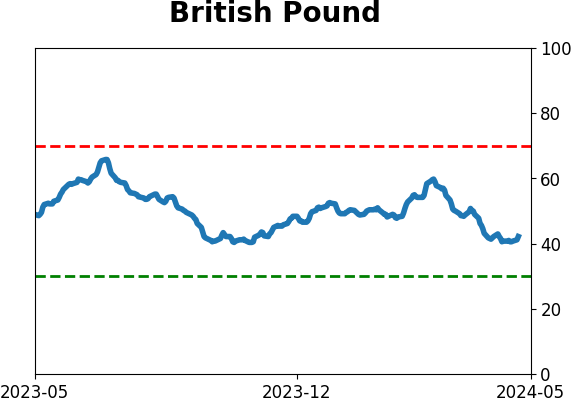
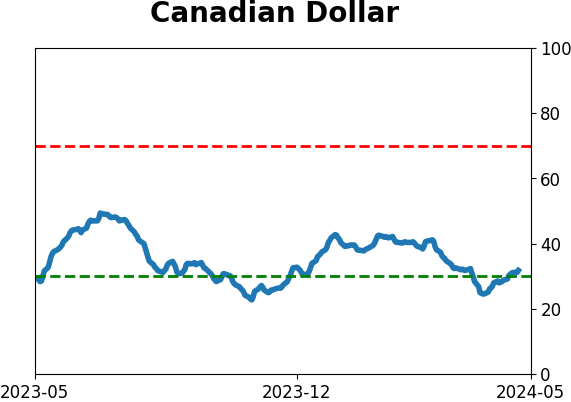
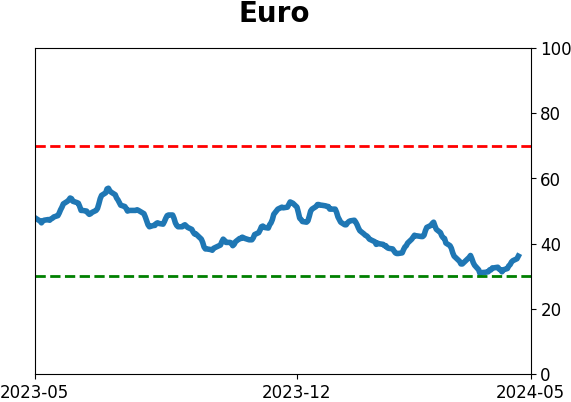
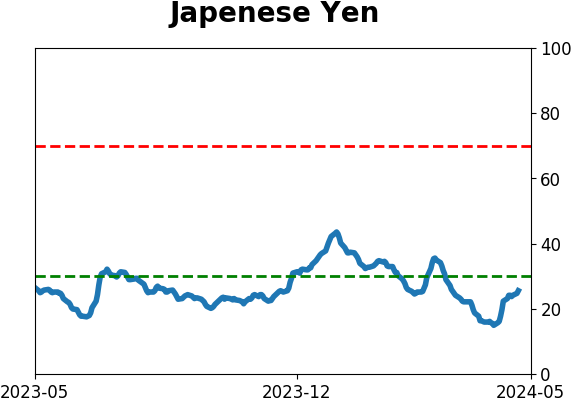
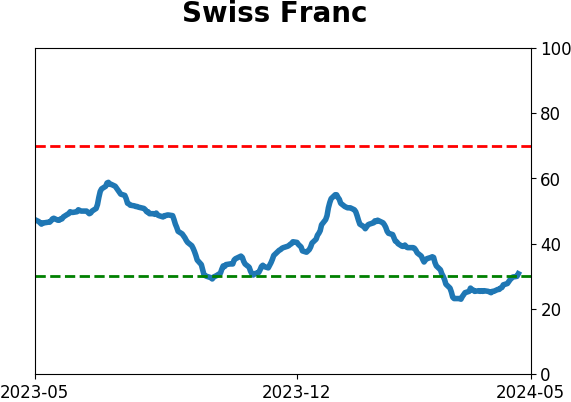
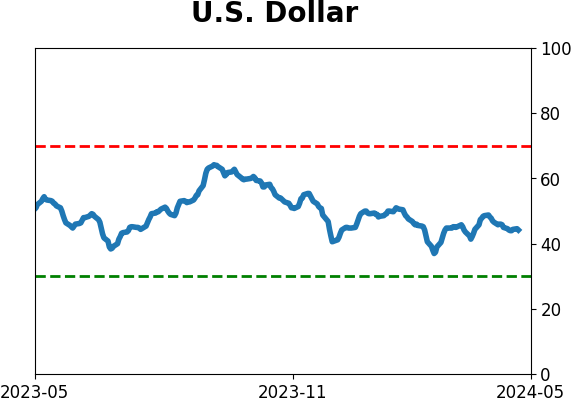
Currency ETF's - 5-Day Moving Average
|
|
|
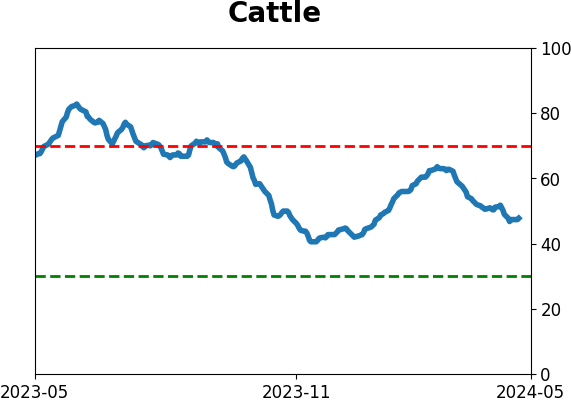
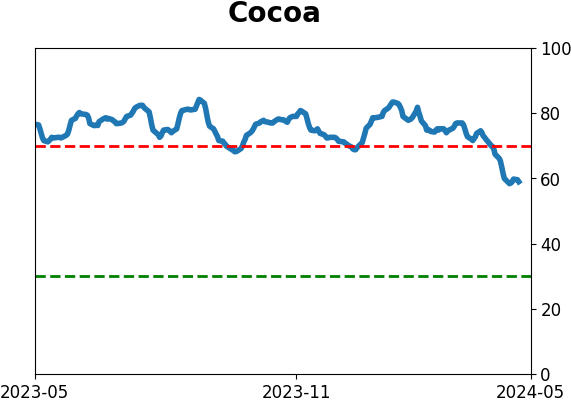
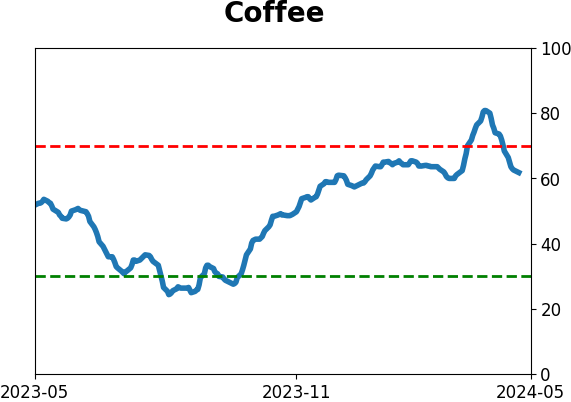
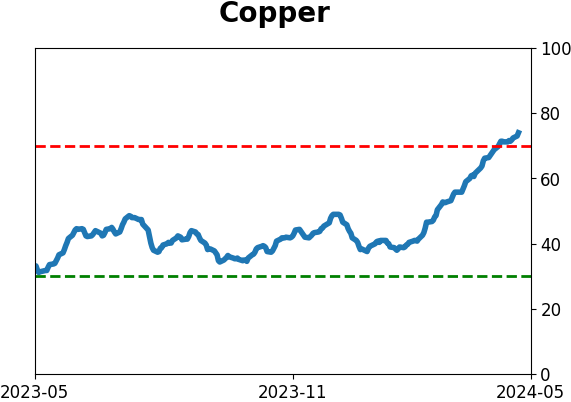
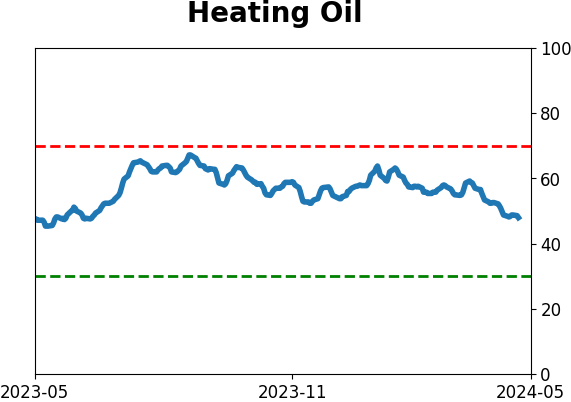
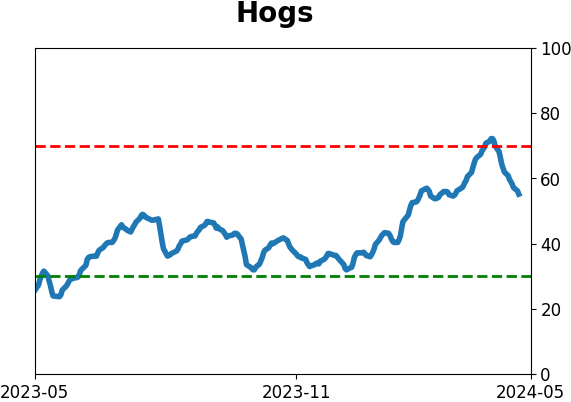
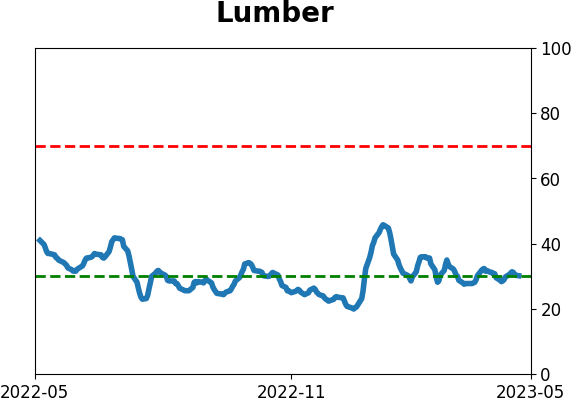
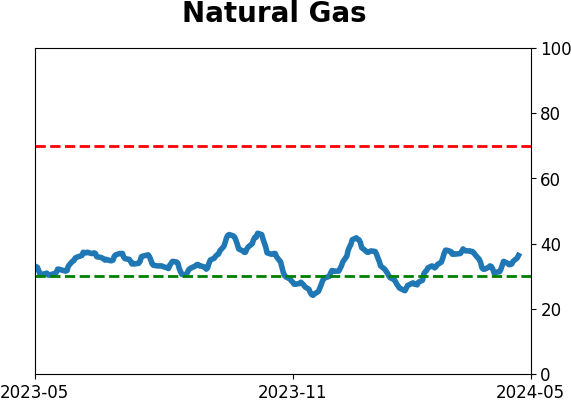
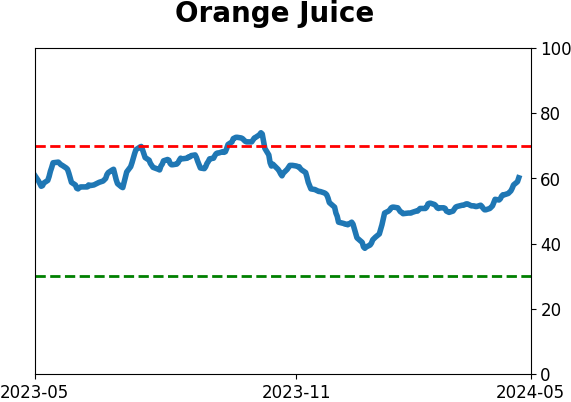
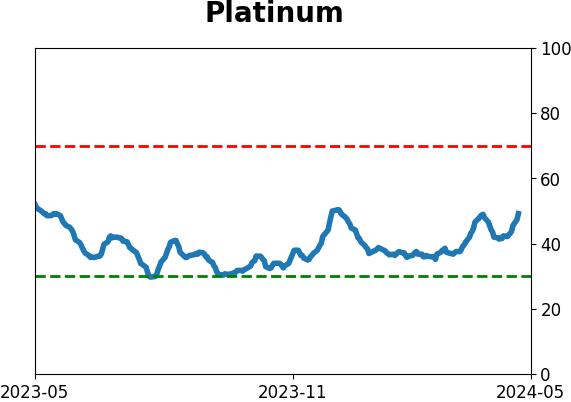
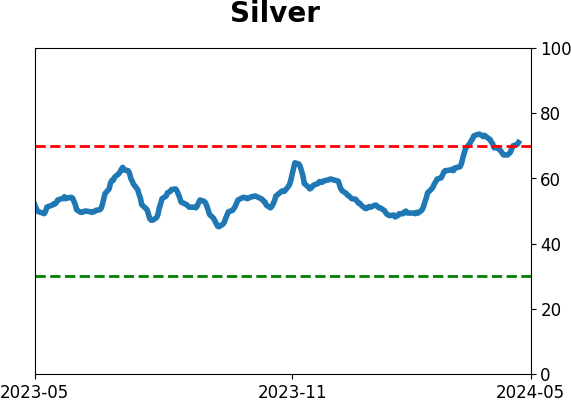
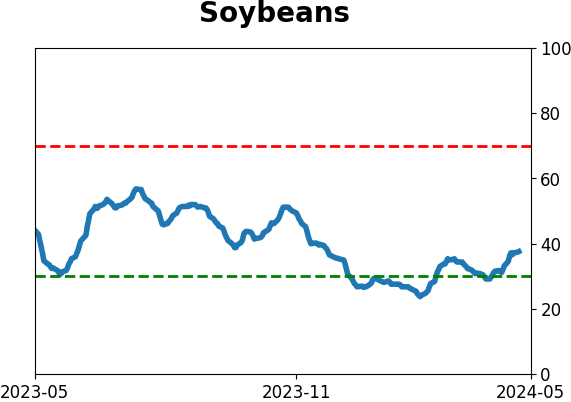
Commodity ETF's - 5-Day Moving Average
|
|