Headlines
|
|
The unstoppable Dow:
The Dow Jones Industrial Average enjoyed its 8th straight day of gains to end the week, pushing it close to a record high. This type of momentum tended to keep going, and it took the index an average of about six months before forming a major peak.
|
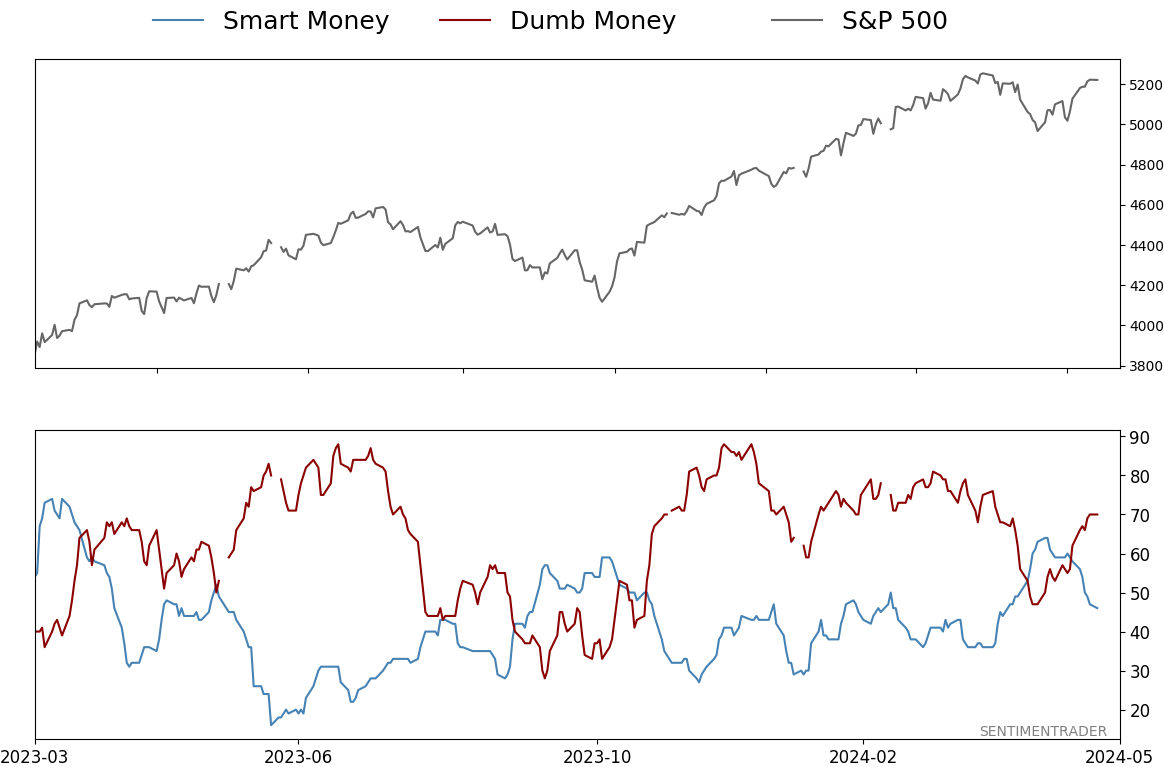
Smart / Dumb Money Confidence
|
Smart Money Confidence: 46%
Dumb Money Confidence: 70%
|
|
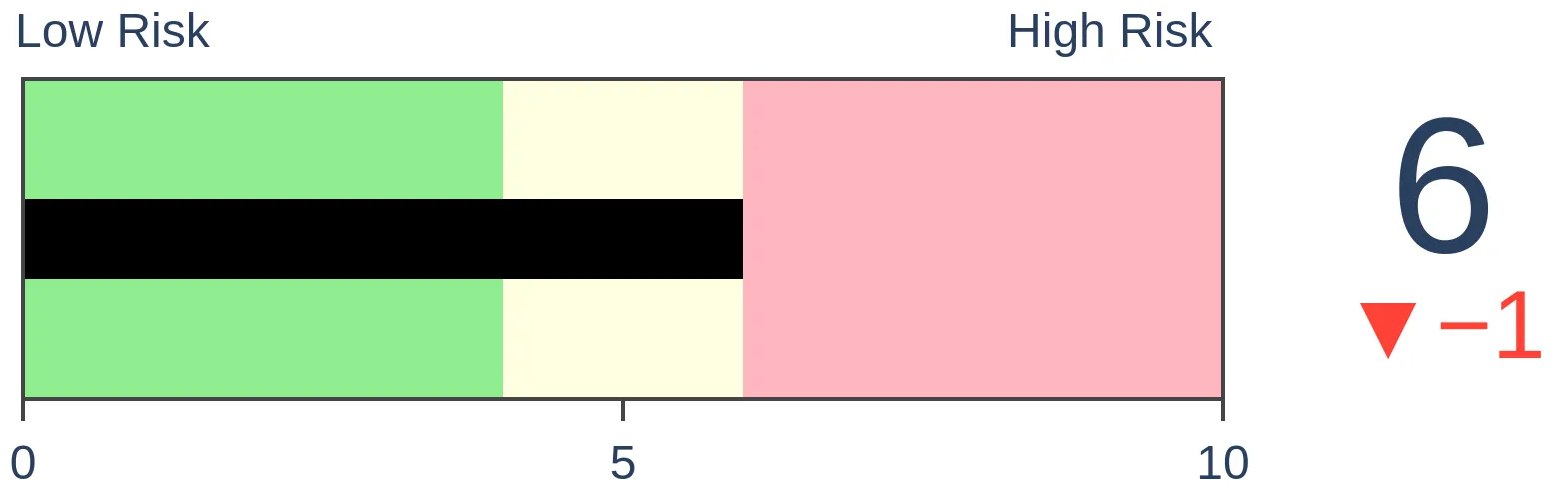
Risk Levels
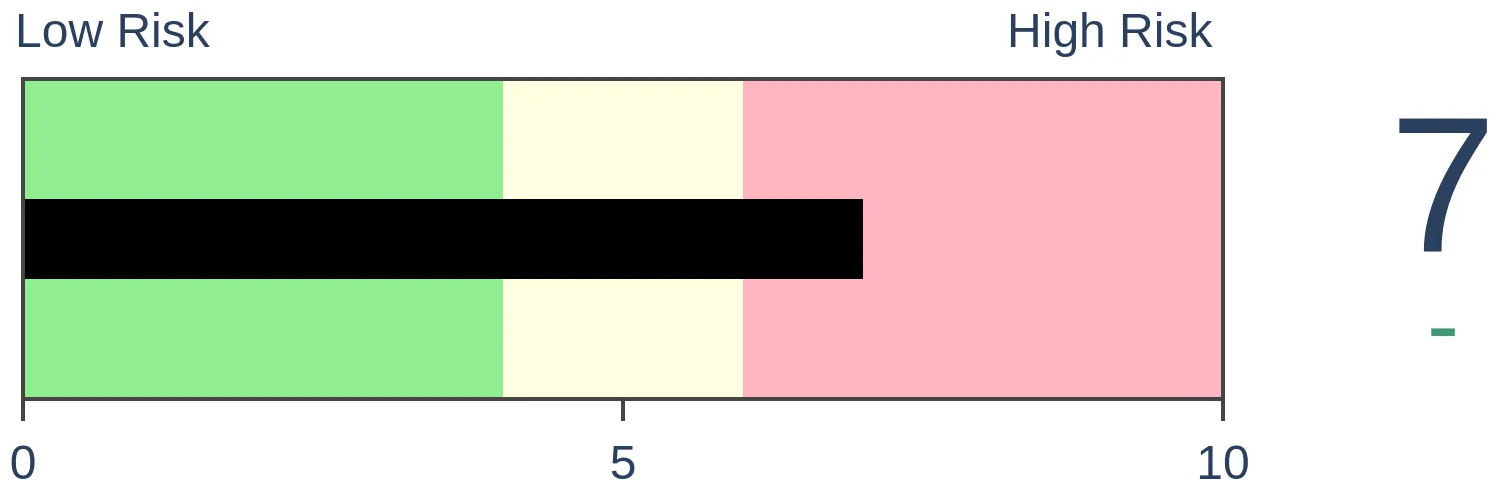
Stocks Short-Term
|
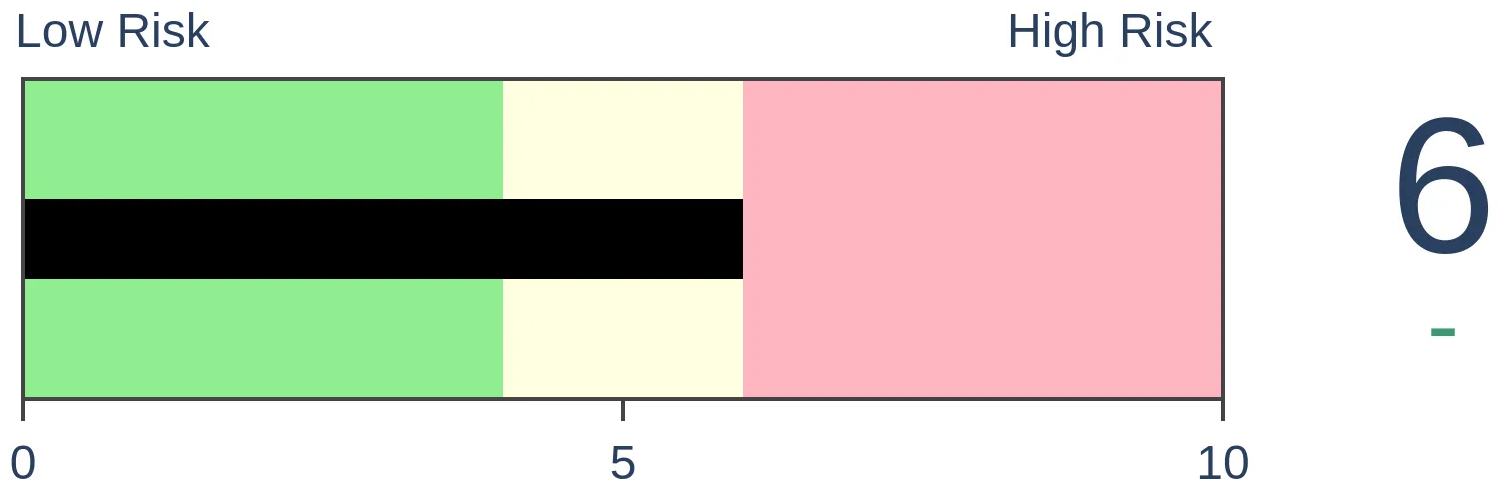
Stocks Medium-Term
|
|
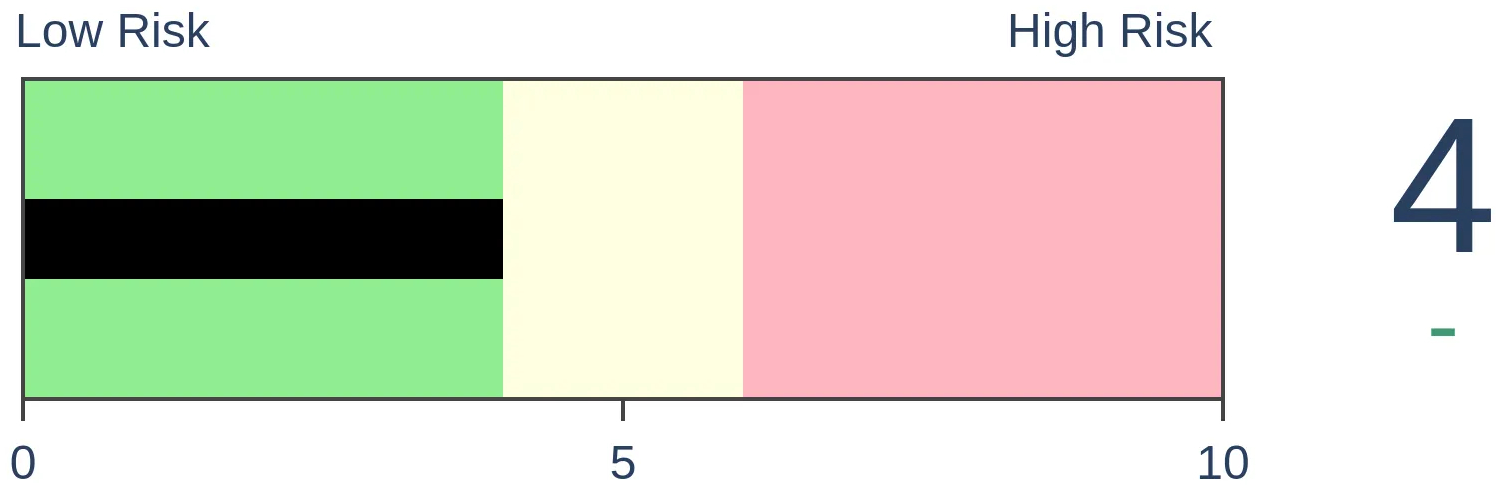
Bonds

|
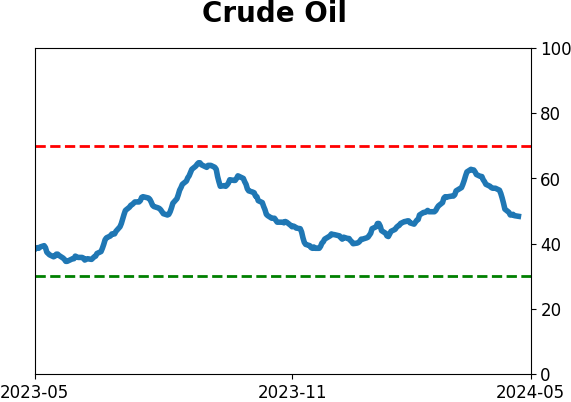
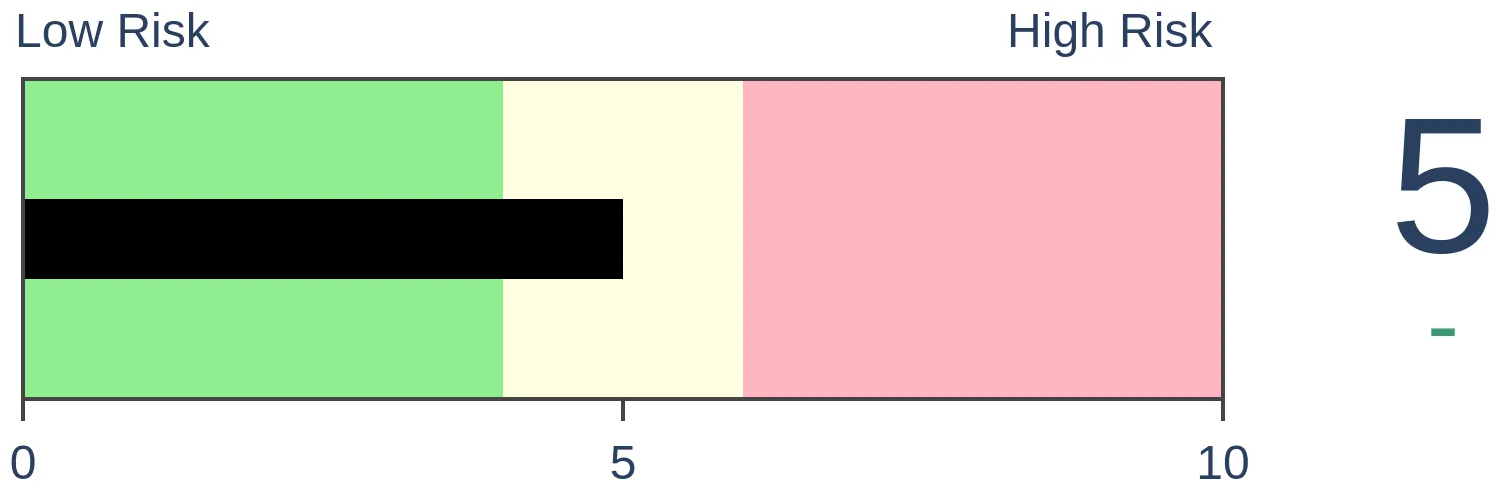
Crude Oil
|
|
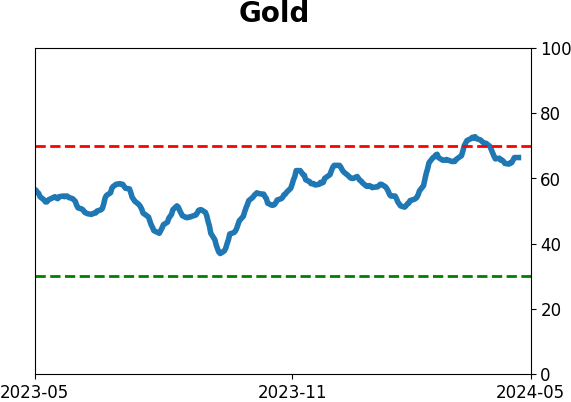
Gold
|
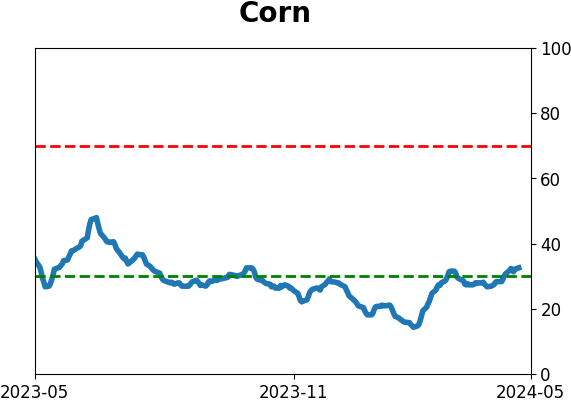
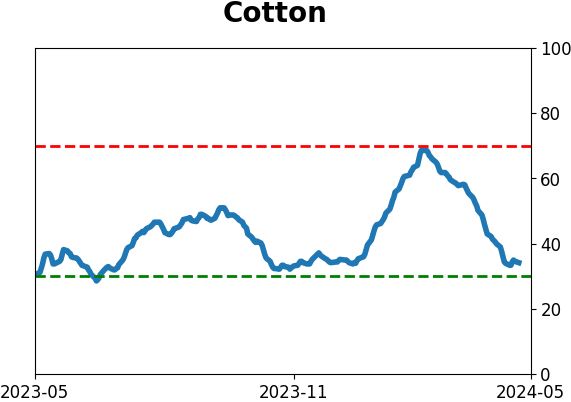
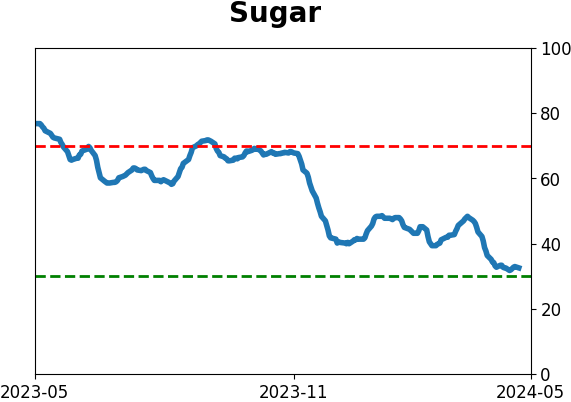
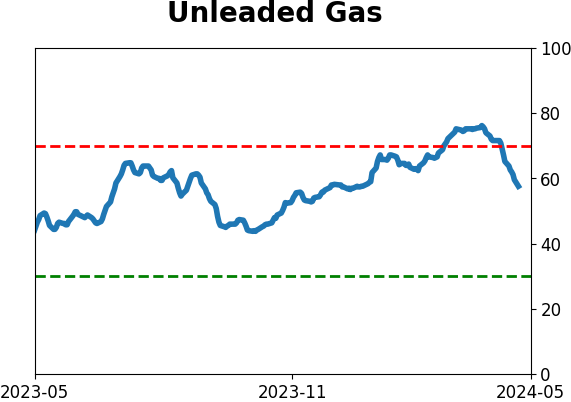
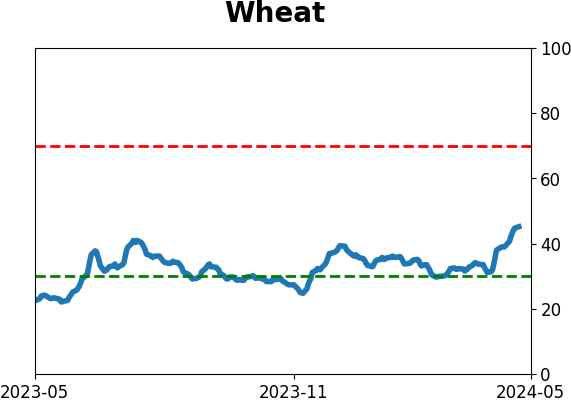
Agriculture
|
|
Research
By Jason Goepfert
BOTTOM LINE
The Dow Jones Industrial Average enjoyed its 8th straight day of gains to end the week, pushing it close to a record high. This type of momentum tended to keep going, and it took the index an average of about six months before forming a major peak.
FORECAST / TIMEFRAME
None
|
Key points:
- The Dow Industrials index has risen for 8 straight days and is within spitting distance of a record high
- Similar streaks tended to precede even more gains, especially over the next 6 months
- On average, it took about 6 months for the index to form a significant peak
Eight days of gains
In media terms, the most venerable equity index in the world has been "unstoppable." The Dow Jones Industrial Average logged its 8th consecutive positive day on Friday and just missed closing at a record high while it was at it.
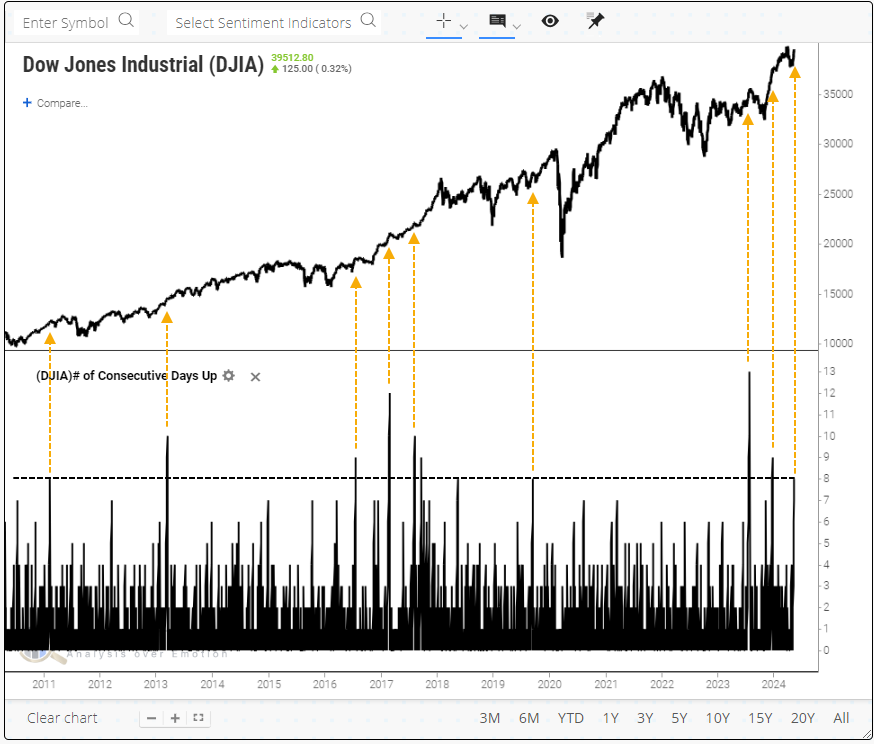
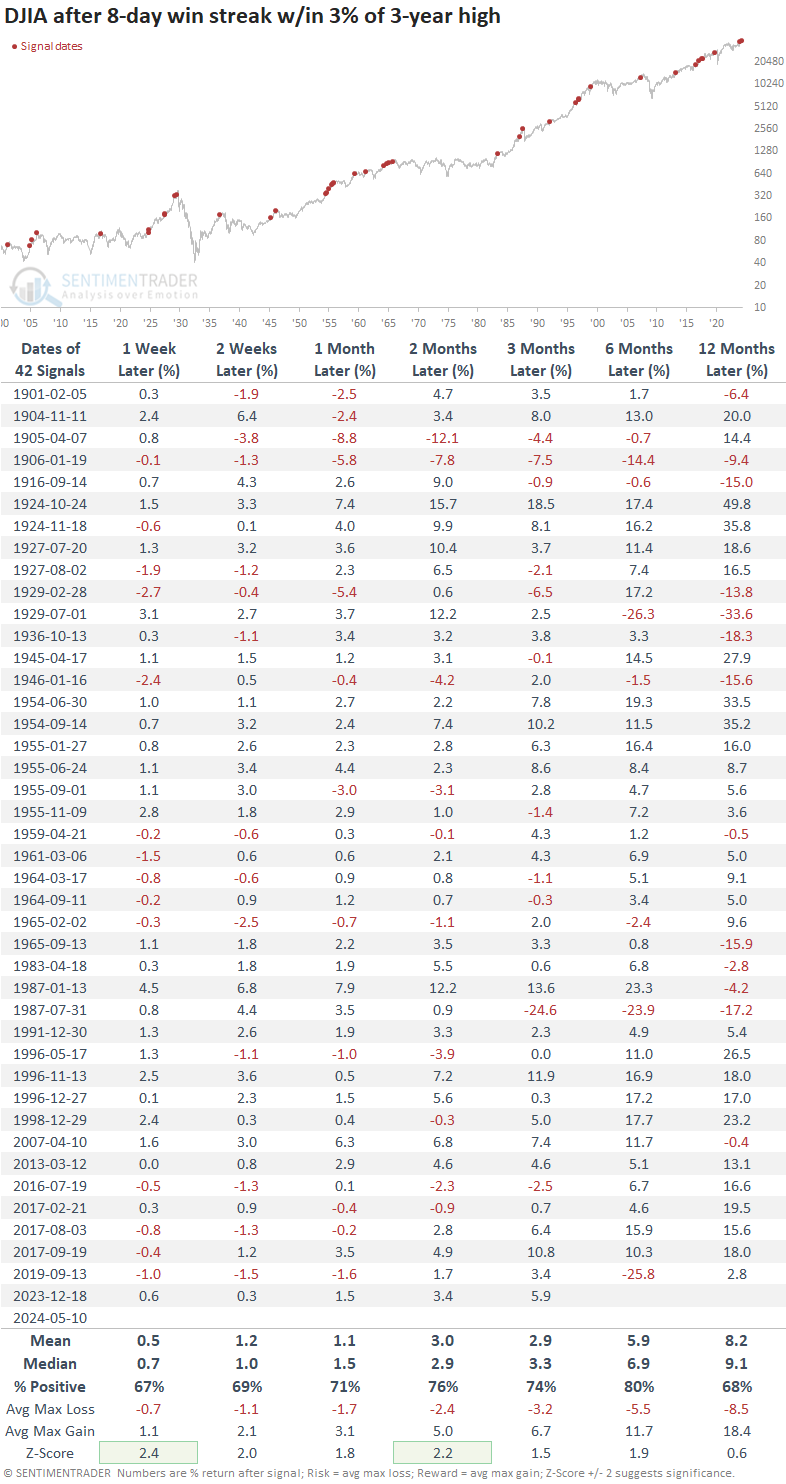
This isn't an infrequent phenomenon for an index with more than 120 years of history. Since 1900, it has enjoyed 42 streaks of 8 straight up days within 3% of a 3-year high. Most saw the Dow continuing to gain, with an 80% win rate over the next six months.
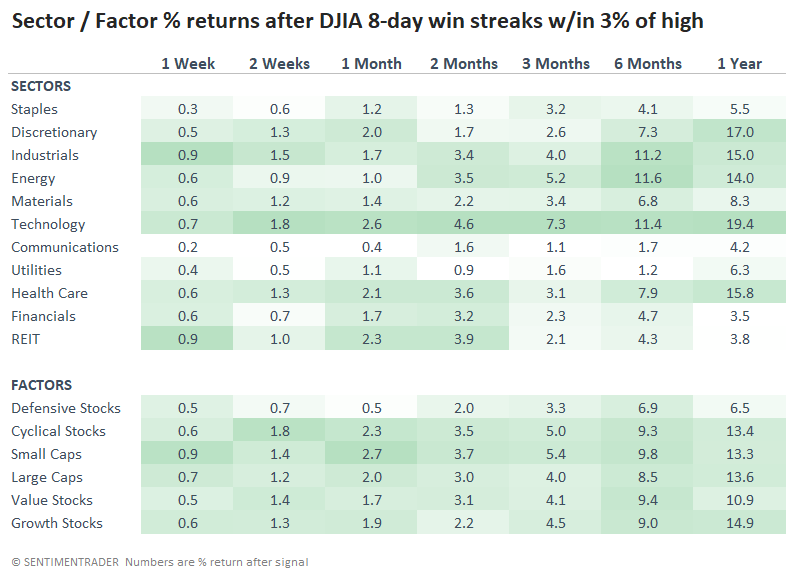
The Dow is supposed to reflect a broad cross-section of the U.S. economy, so looking at sector returns after these Dow streaks might be instructive. Surprisingly, technology stocks showed the strongest returns, but industrials were in the mix.
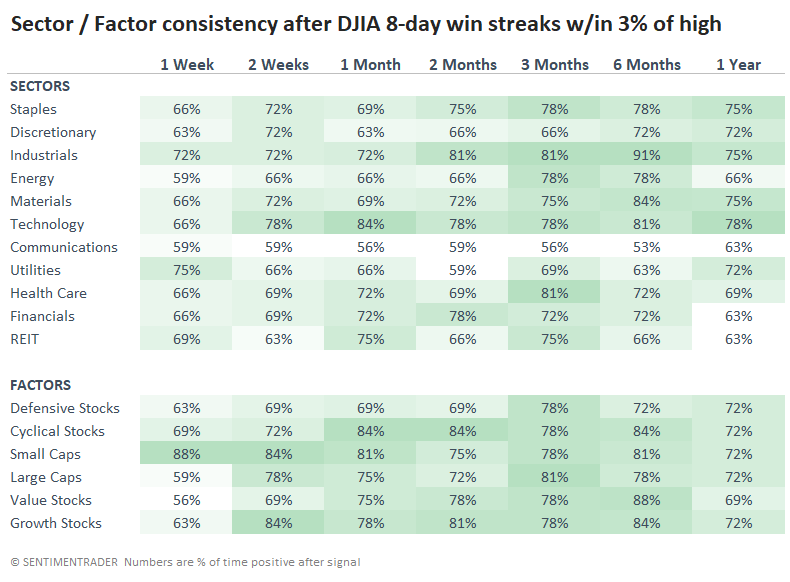
When it comes to win rates, industrials took the top spot over the next six months (these are from 1928 onward). Over the next six months, industrials gained 91% of the time (29 out of 32 signals).
Peak worries
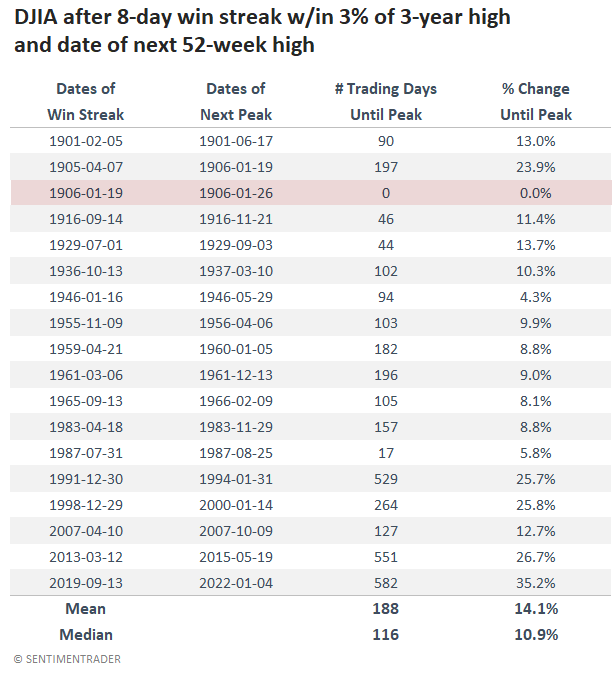
Contrarians always get nervous after a move like this. The worry is always about a blow-off top. But this has been exceedingly rare for the Dow. The table below shows the last 8-day win streak signal before the next 52-week high in the index.
Out of all the signals, only one affirmed the bears' concerns. In January 1906, the 8-day win streak marked the Dow's peak for the next 52 weeks. The next worst signal was in July 1987, which preceded the peak by only 17 days and about 6%, then plunged into Black Monday that October.
But on average, it took about six months before the Dow peaked after witnessing these bouts of momentum. And the index gained an average of about 11% before peaking.
What the research tells us...
Time and again since October 2022, we've looked at studies showing the importance of price and breadth momentum, particularly when coming out of a period of protracted selling pressure. Those tend to be the most consistently positive signals and the ones with the highest average return for the months ahead. Behind those are signals that occur at or near multi-year highs. When stocks haven't been especially oversold or near enough highs to attract momentum traders, this mushy middle tends to suffer the worst returns.
It's safe to say that industrial stocks have enjoyed a historically compelling bout of momentum in recent weeks, and it's been enough to push many of them to or near record highs. The combination of solid momentum, good participation, and little overhead resistance tends to lead to more gains ahead. We rarely, if ever, see this kind of combination at or even near major peaks in price.
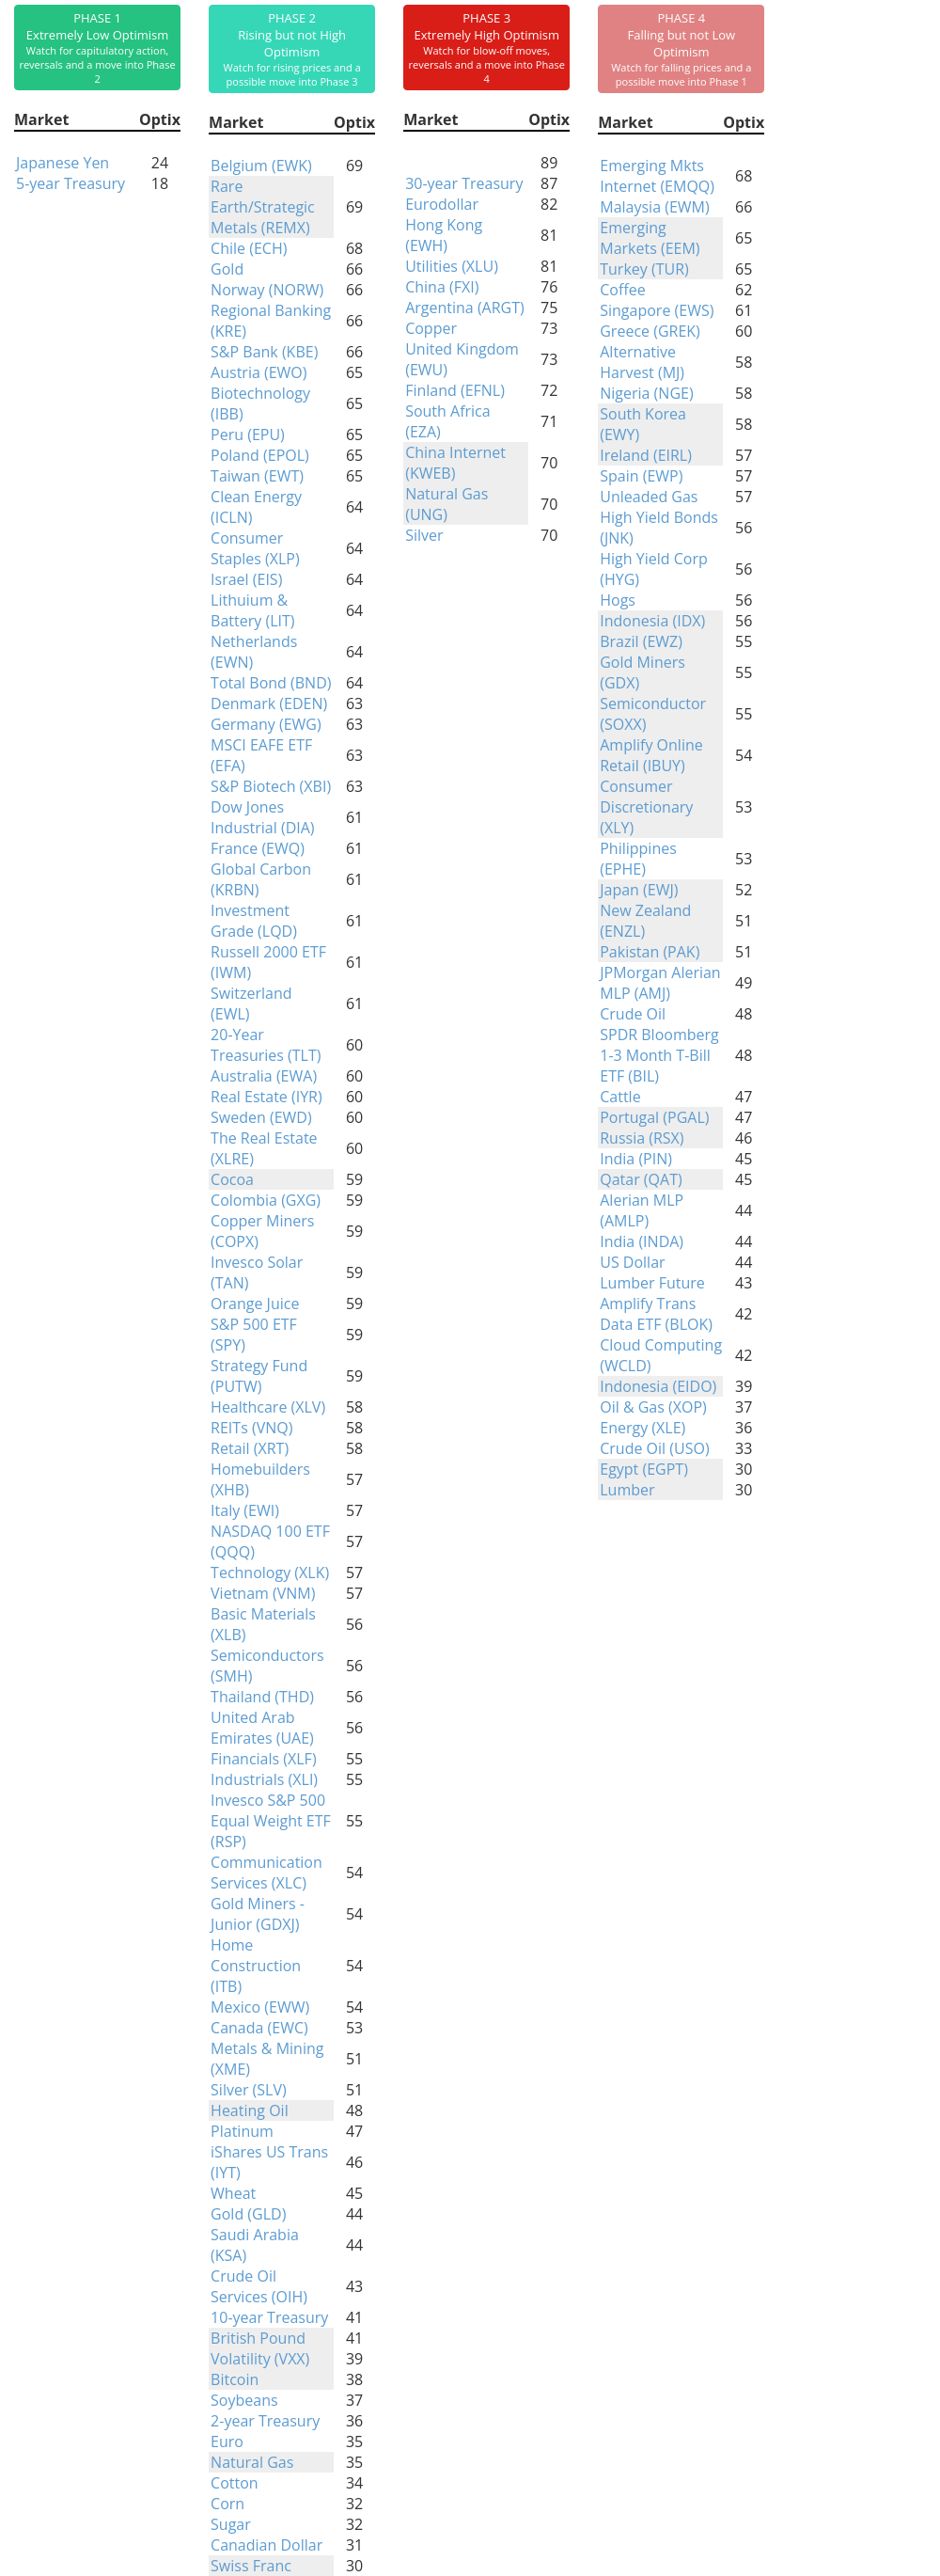
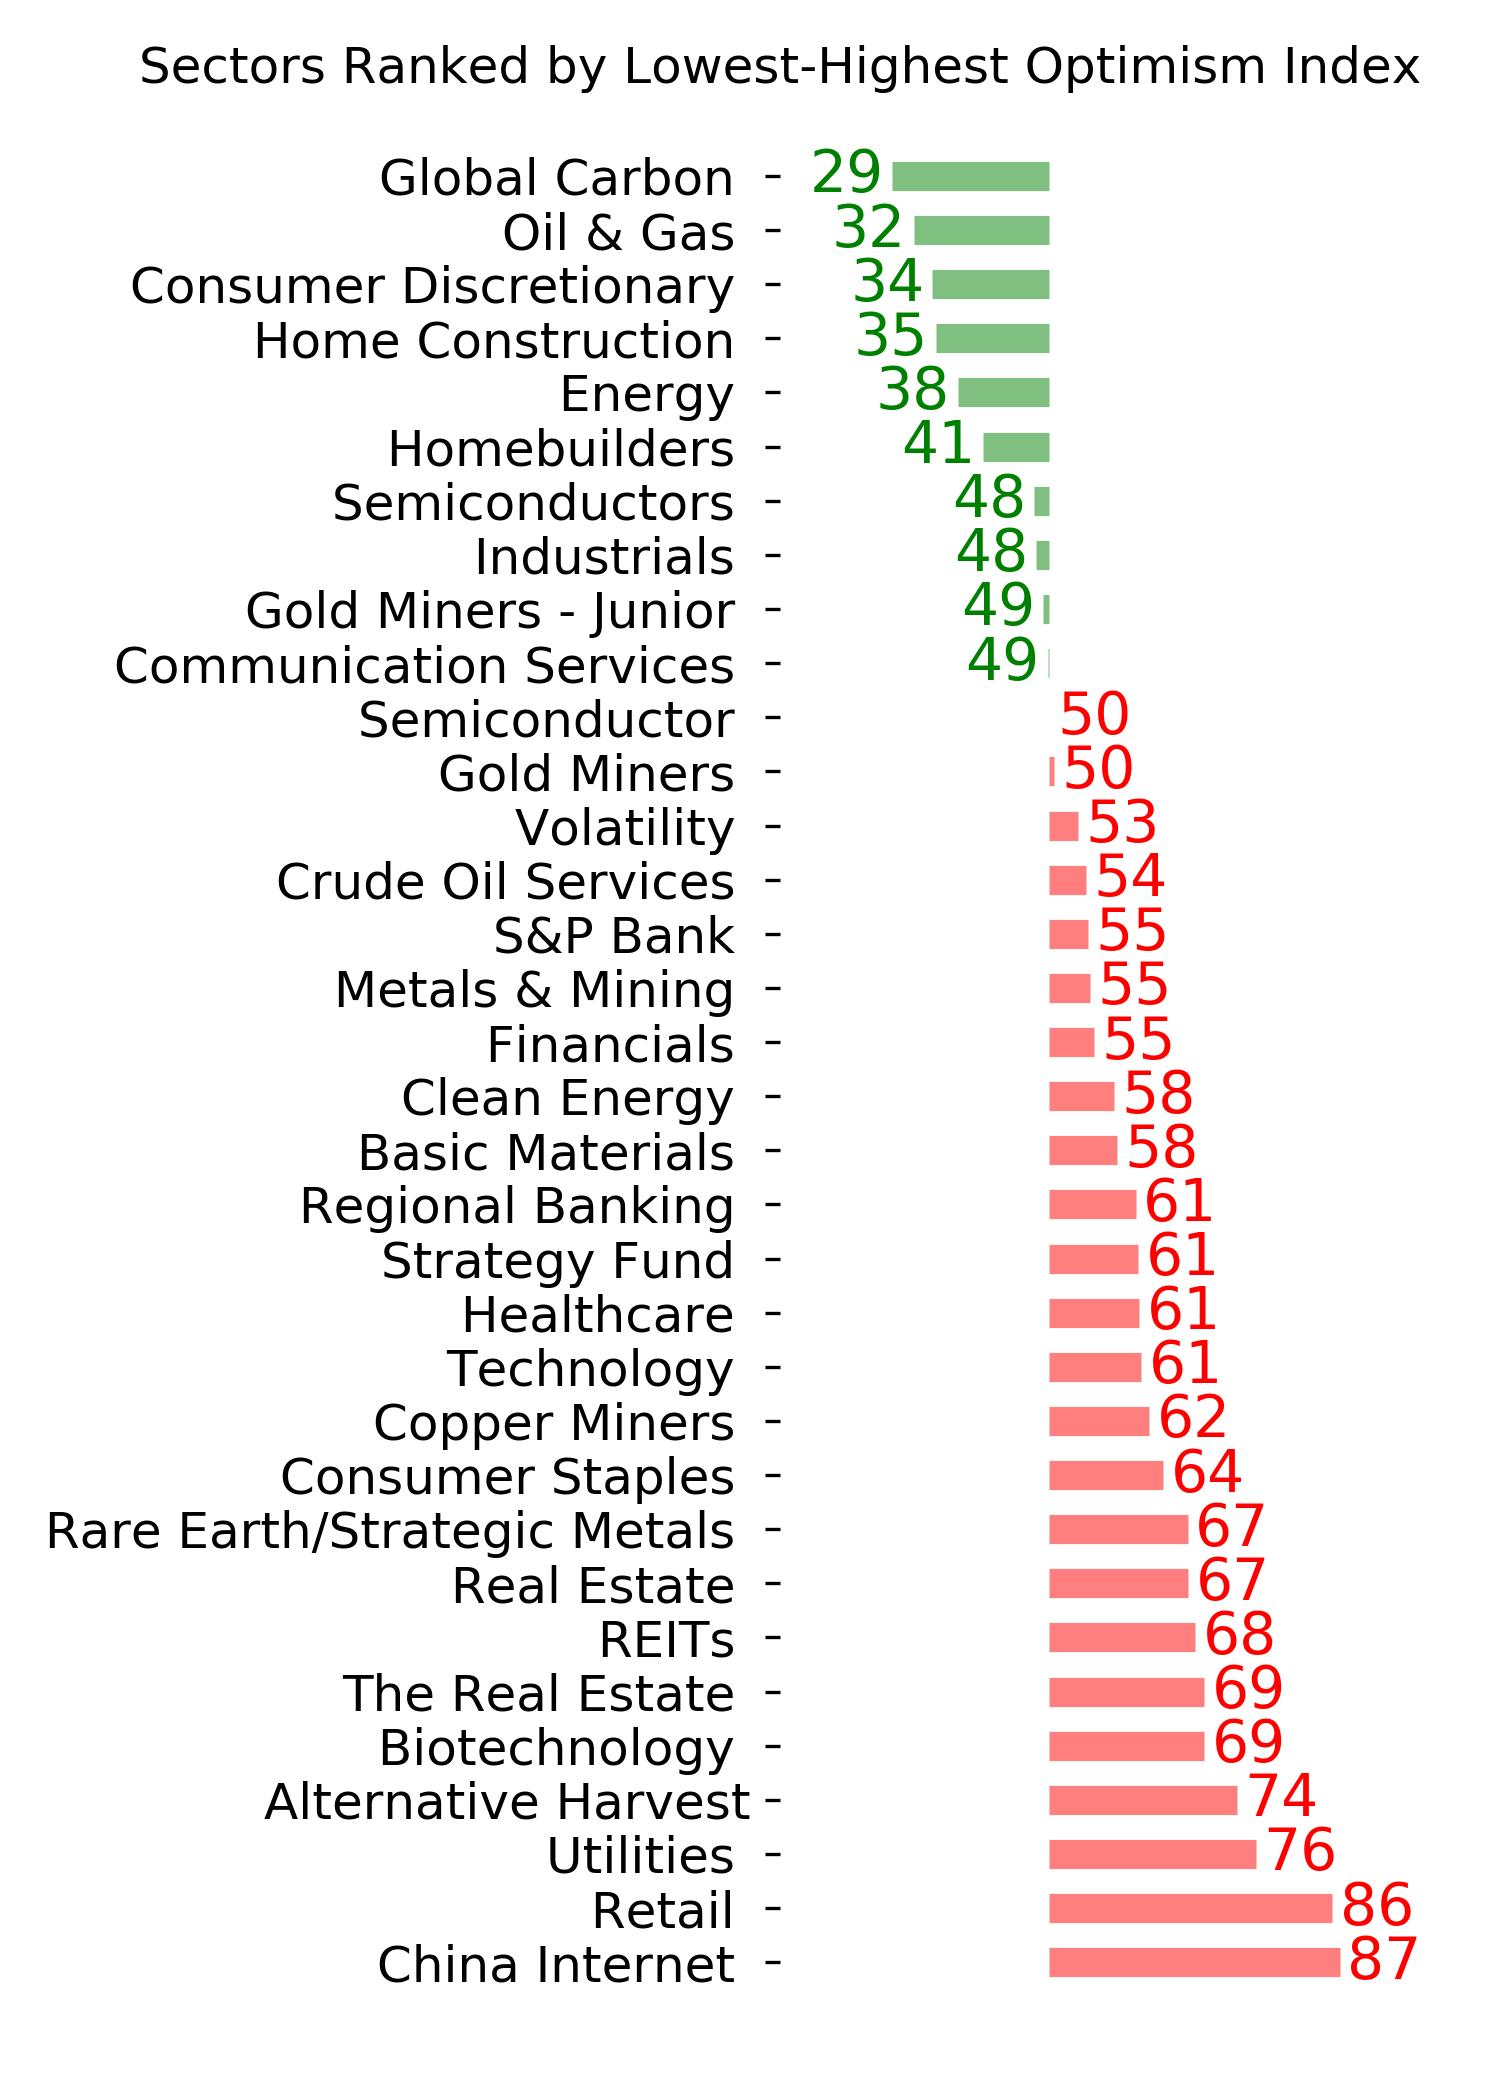
Indicators at Extremes
Phase Table
Ranks
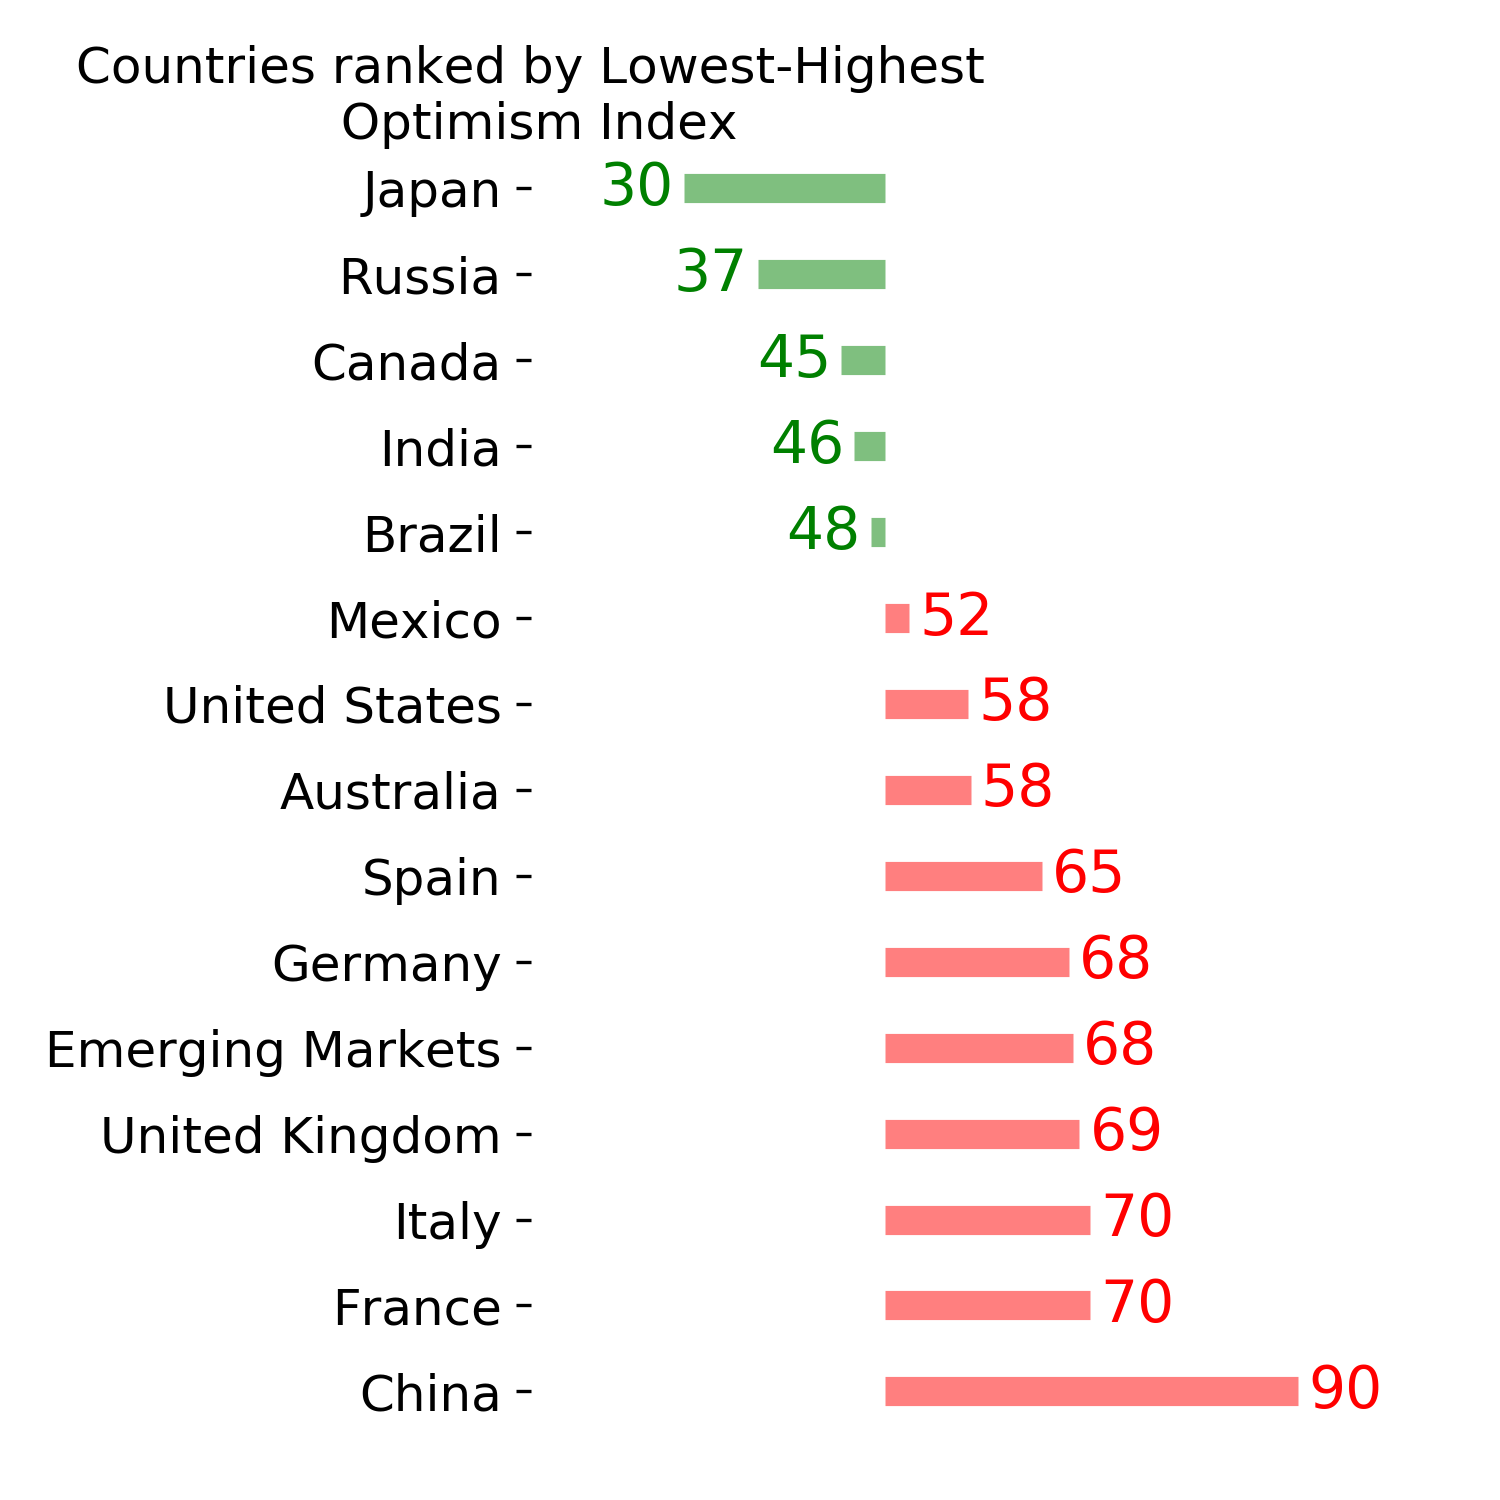
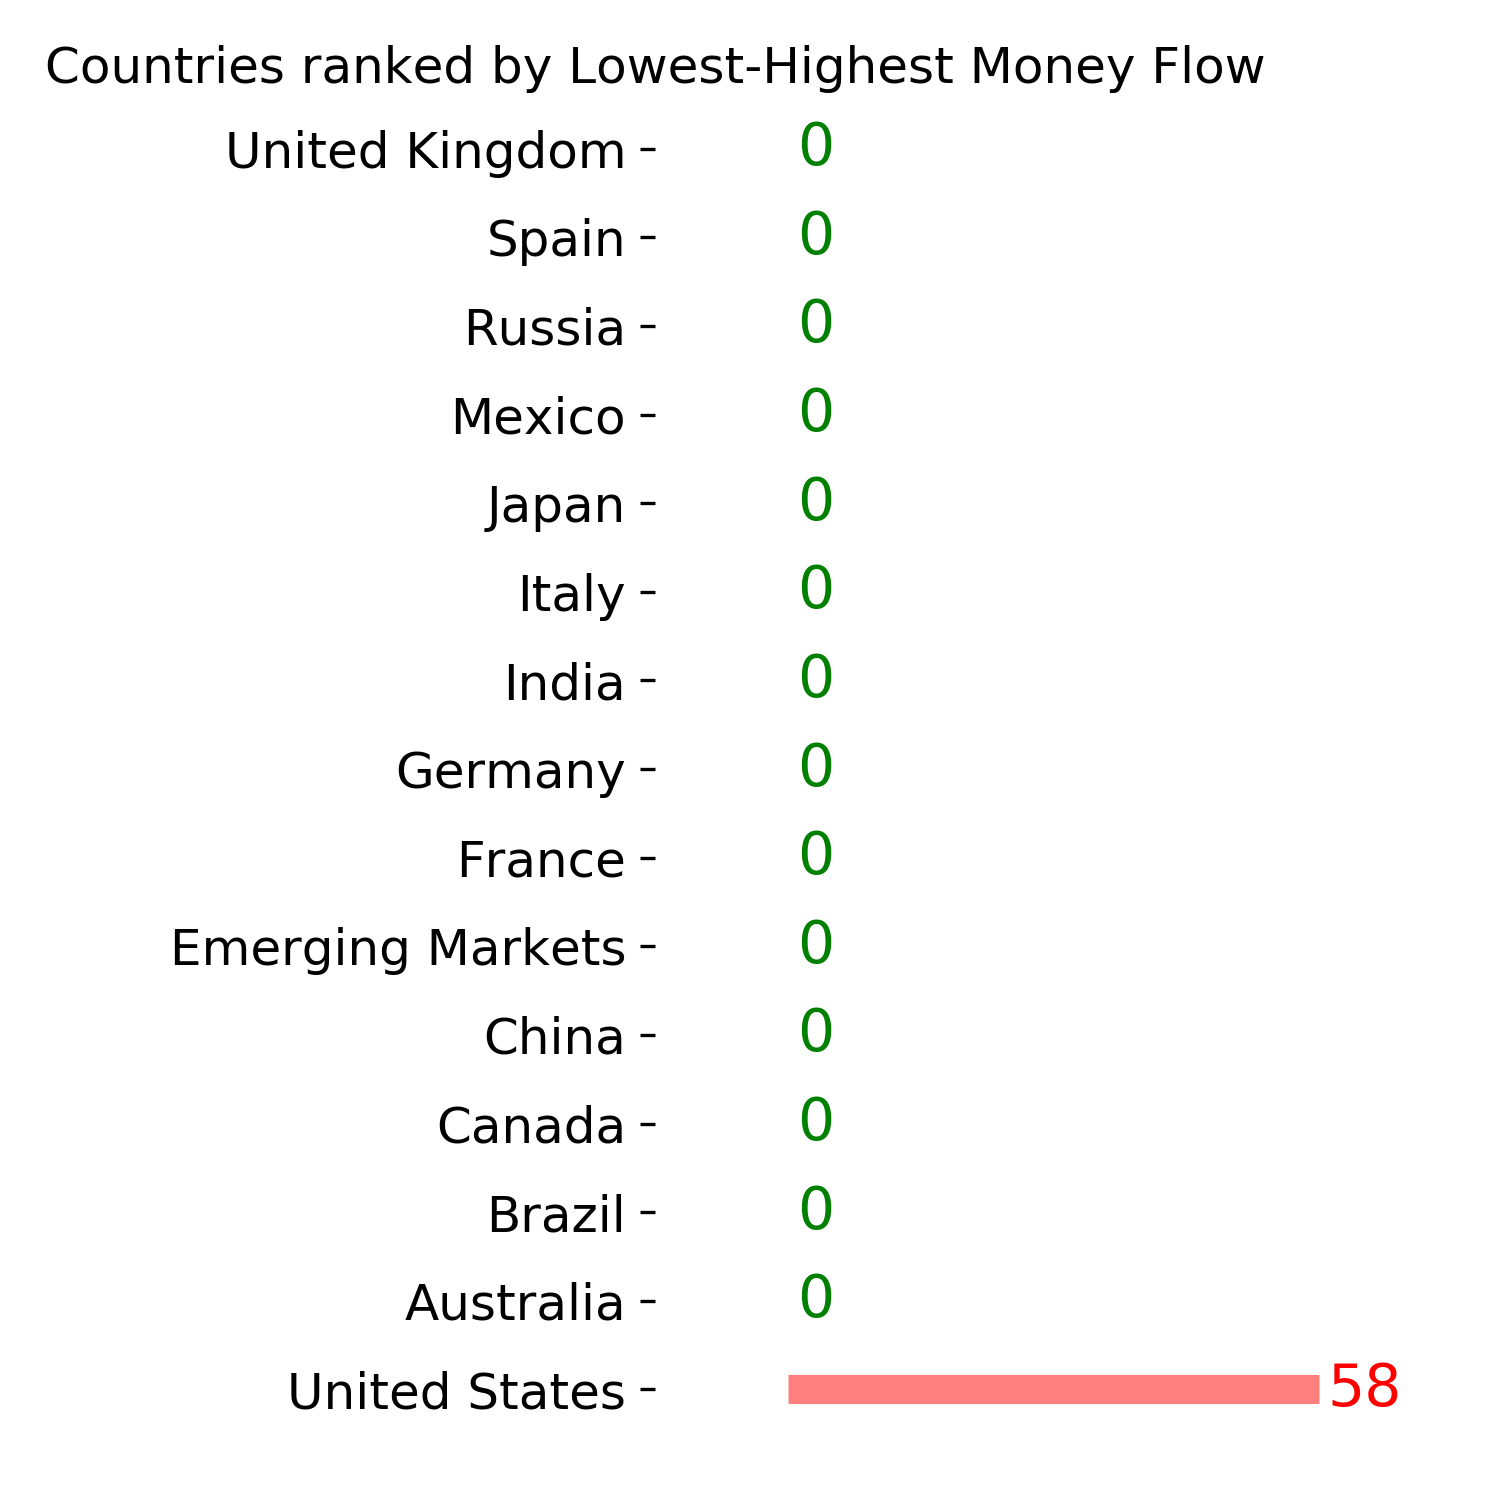
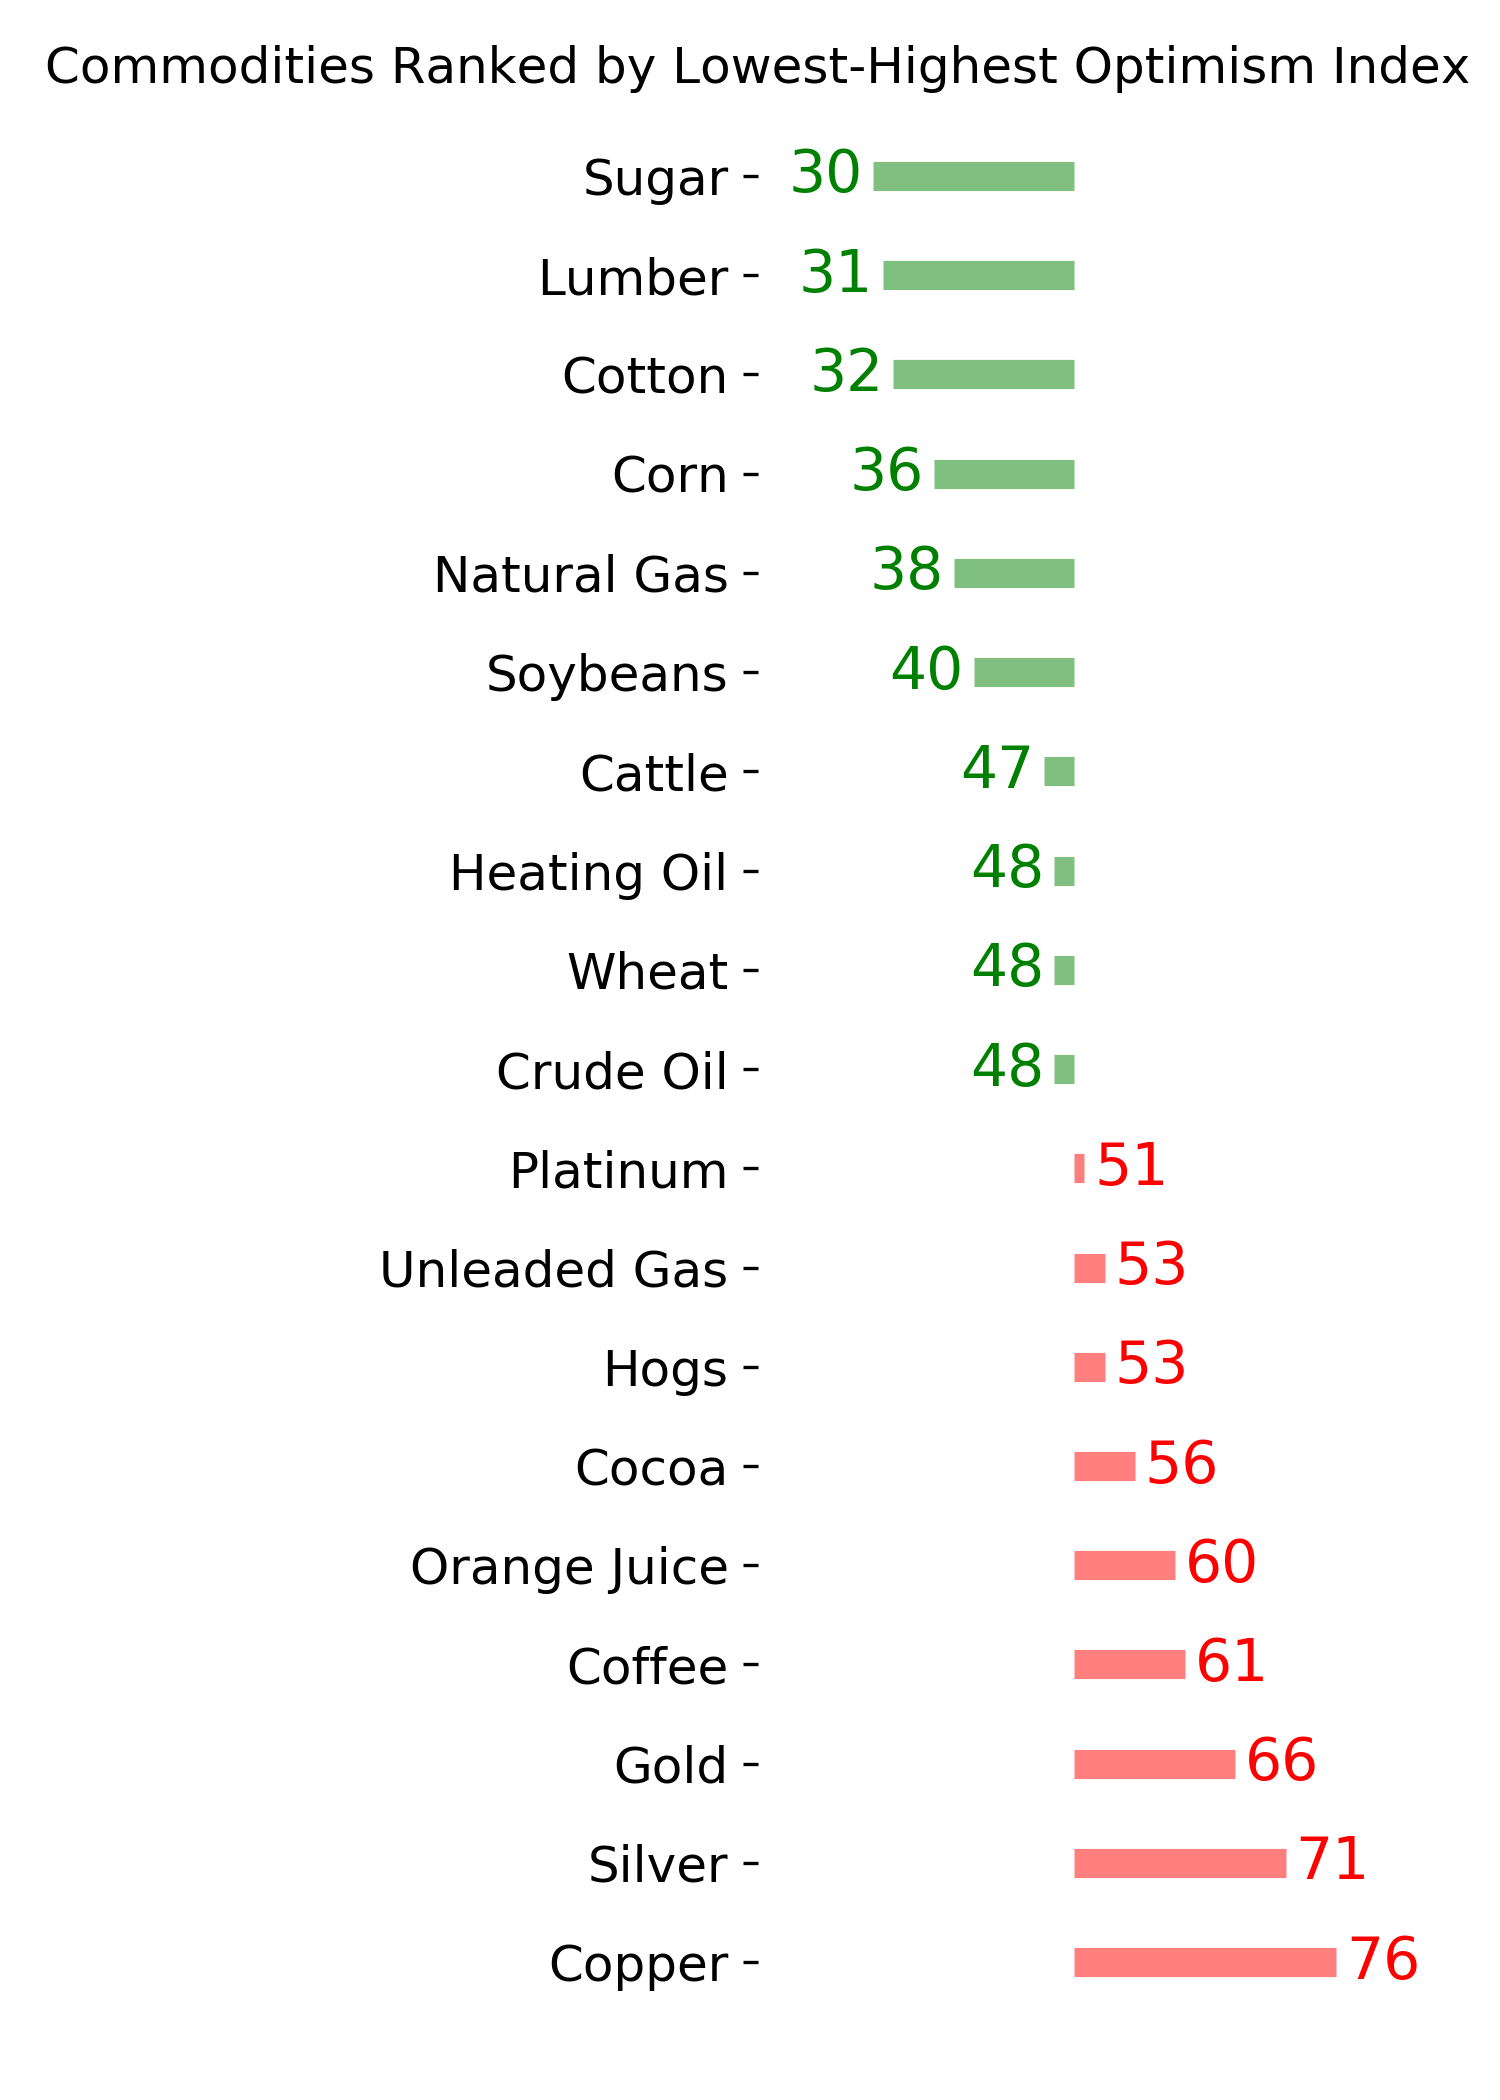
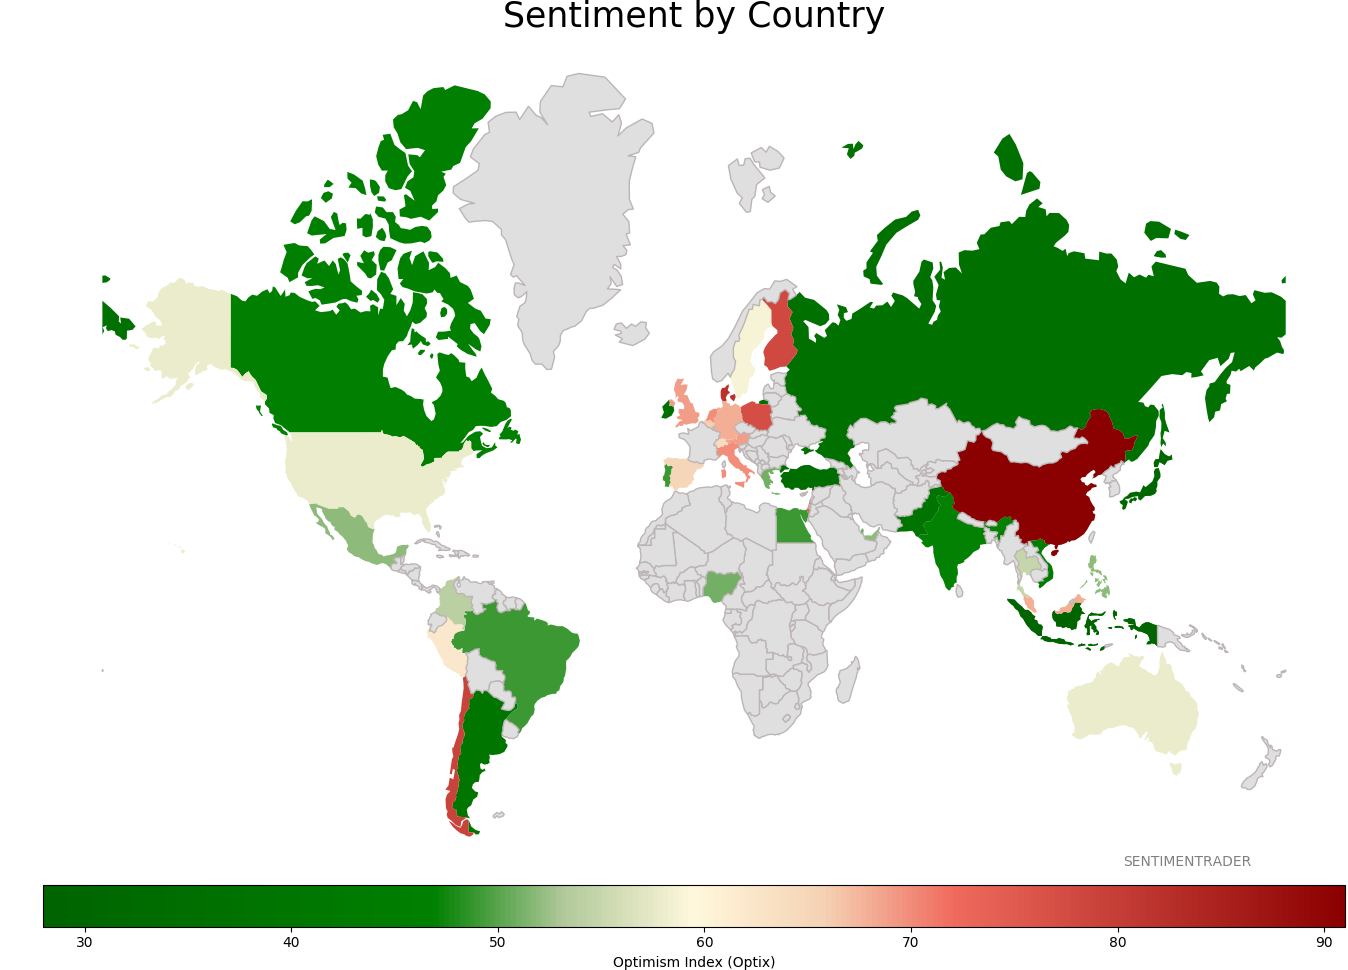
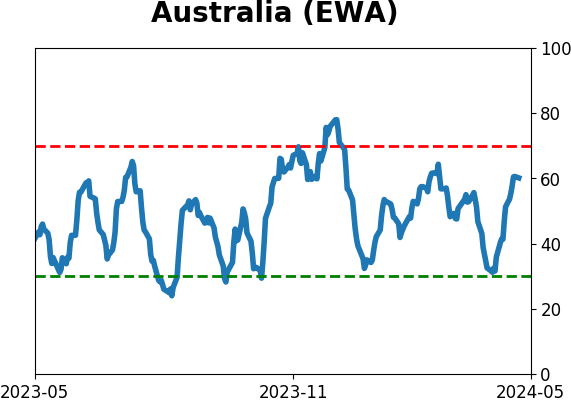
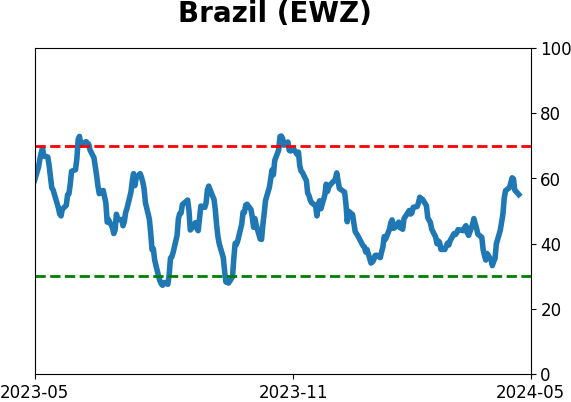
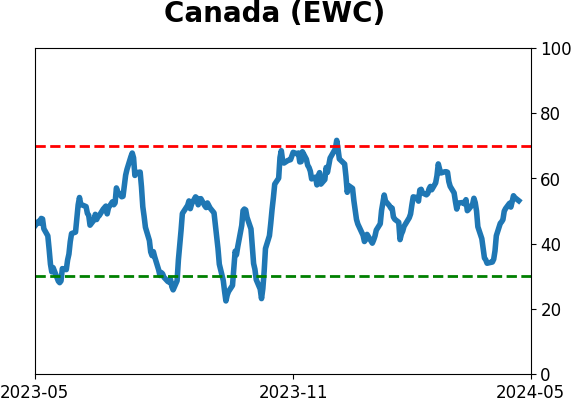
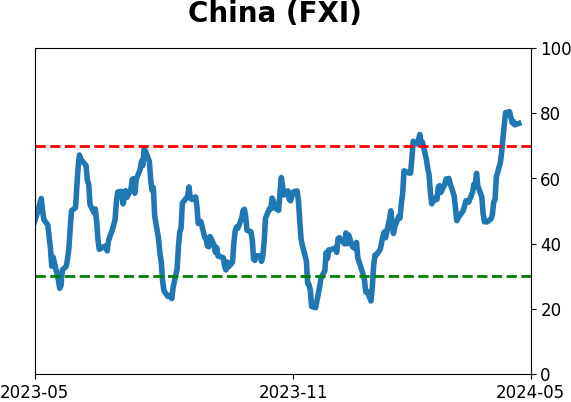
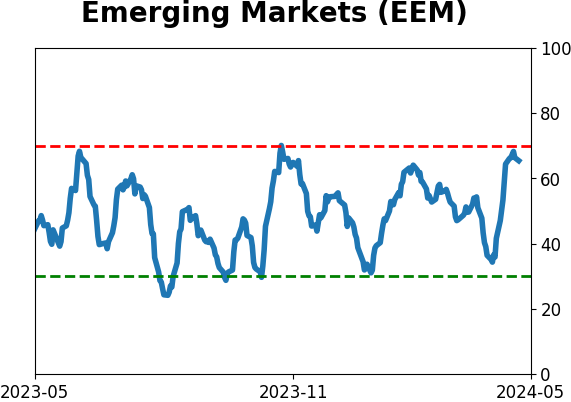
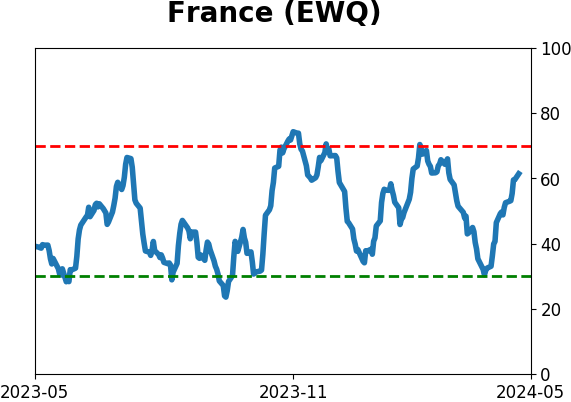
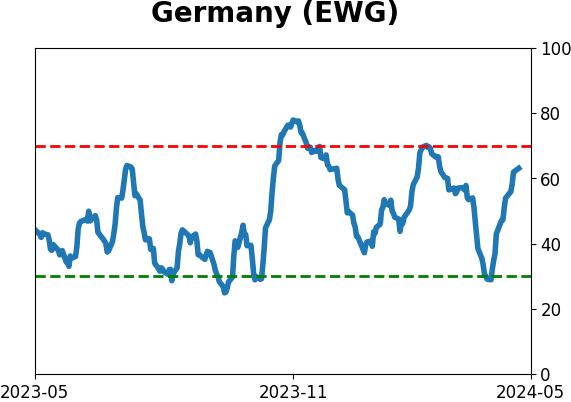
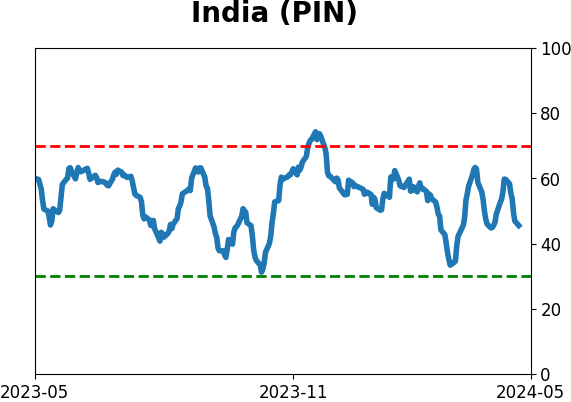
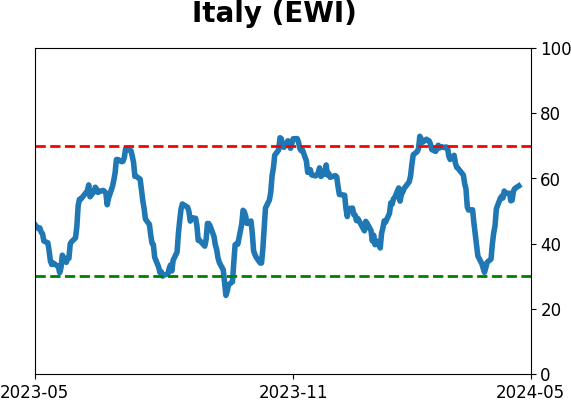
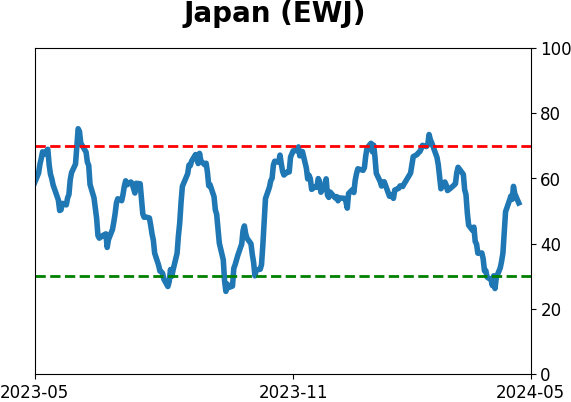
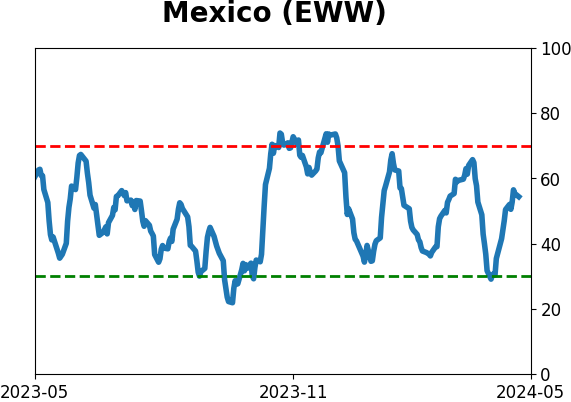
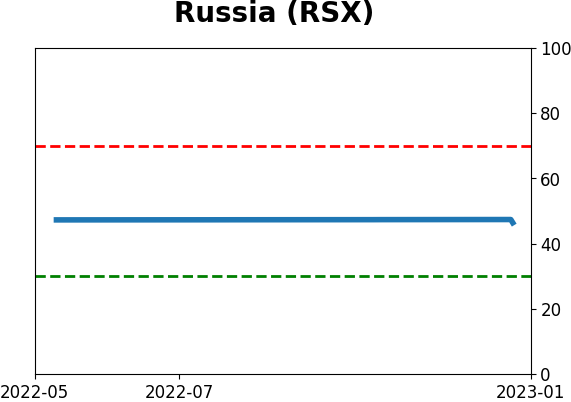
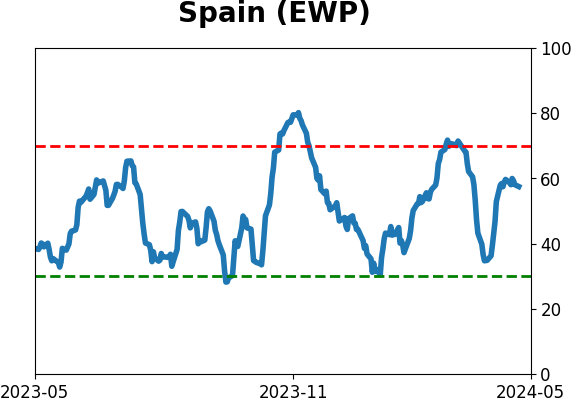
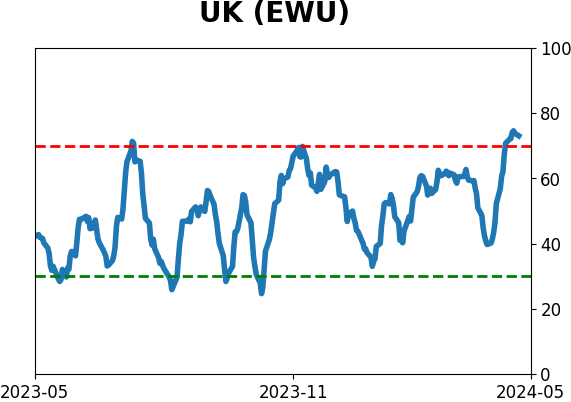
Sentiment Around The World
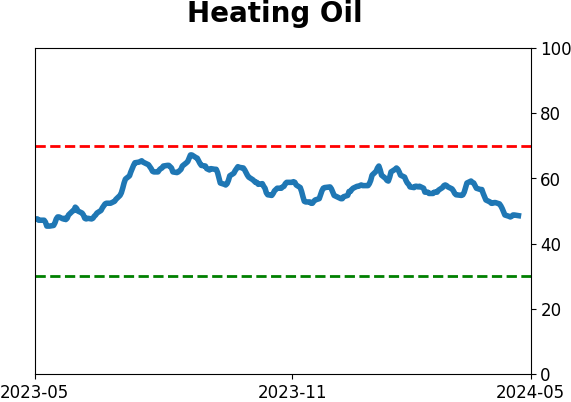
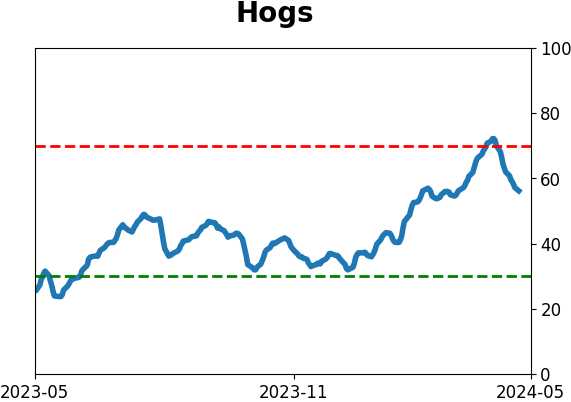
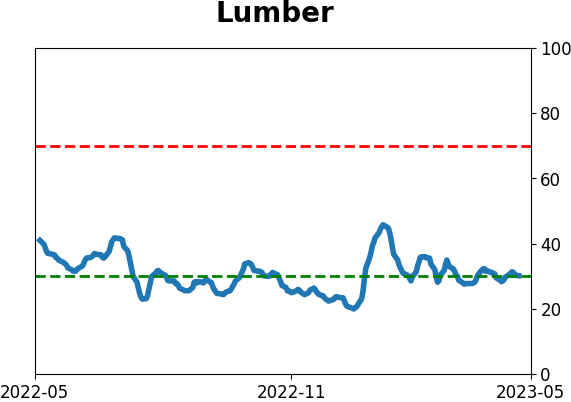
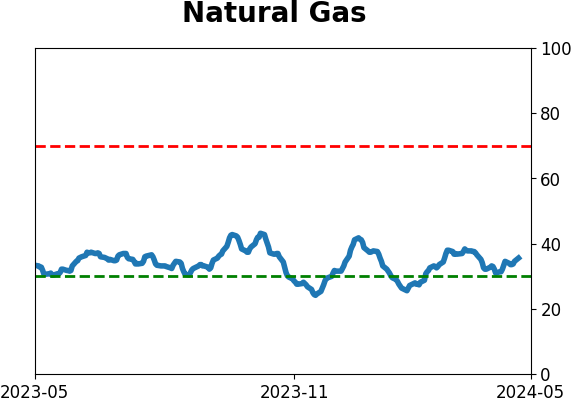
Optimism Index Thumbnails
|
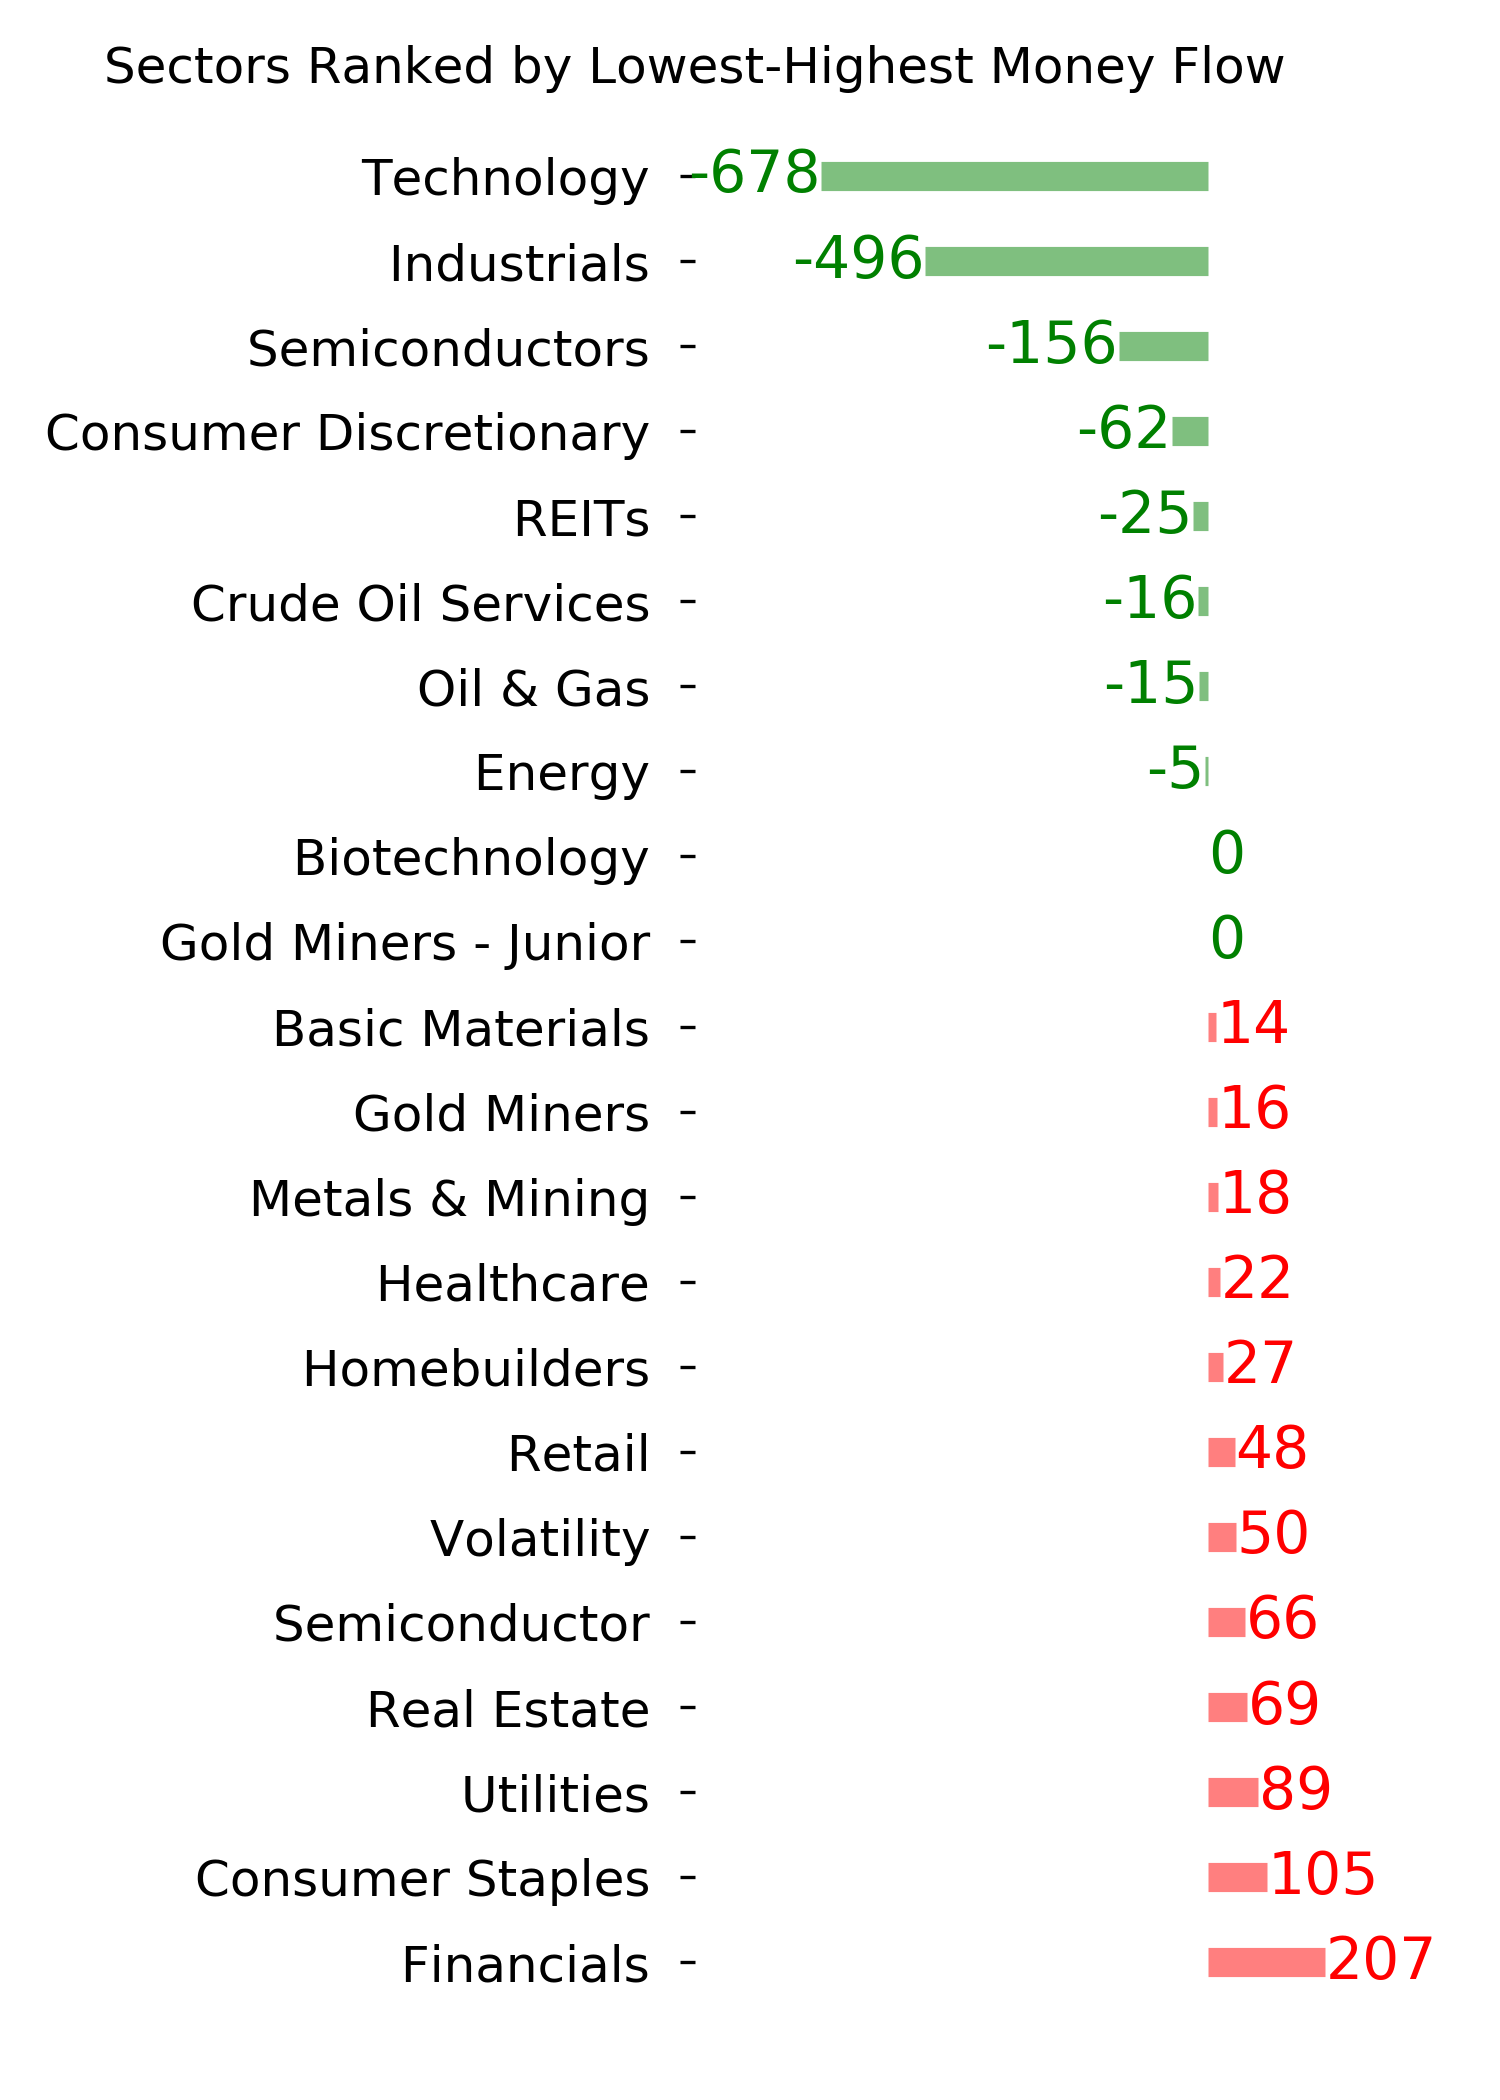
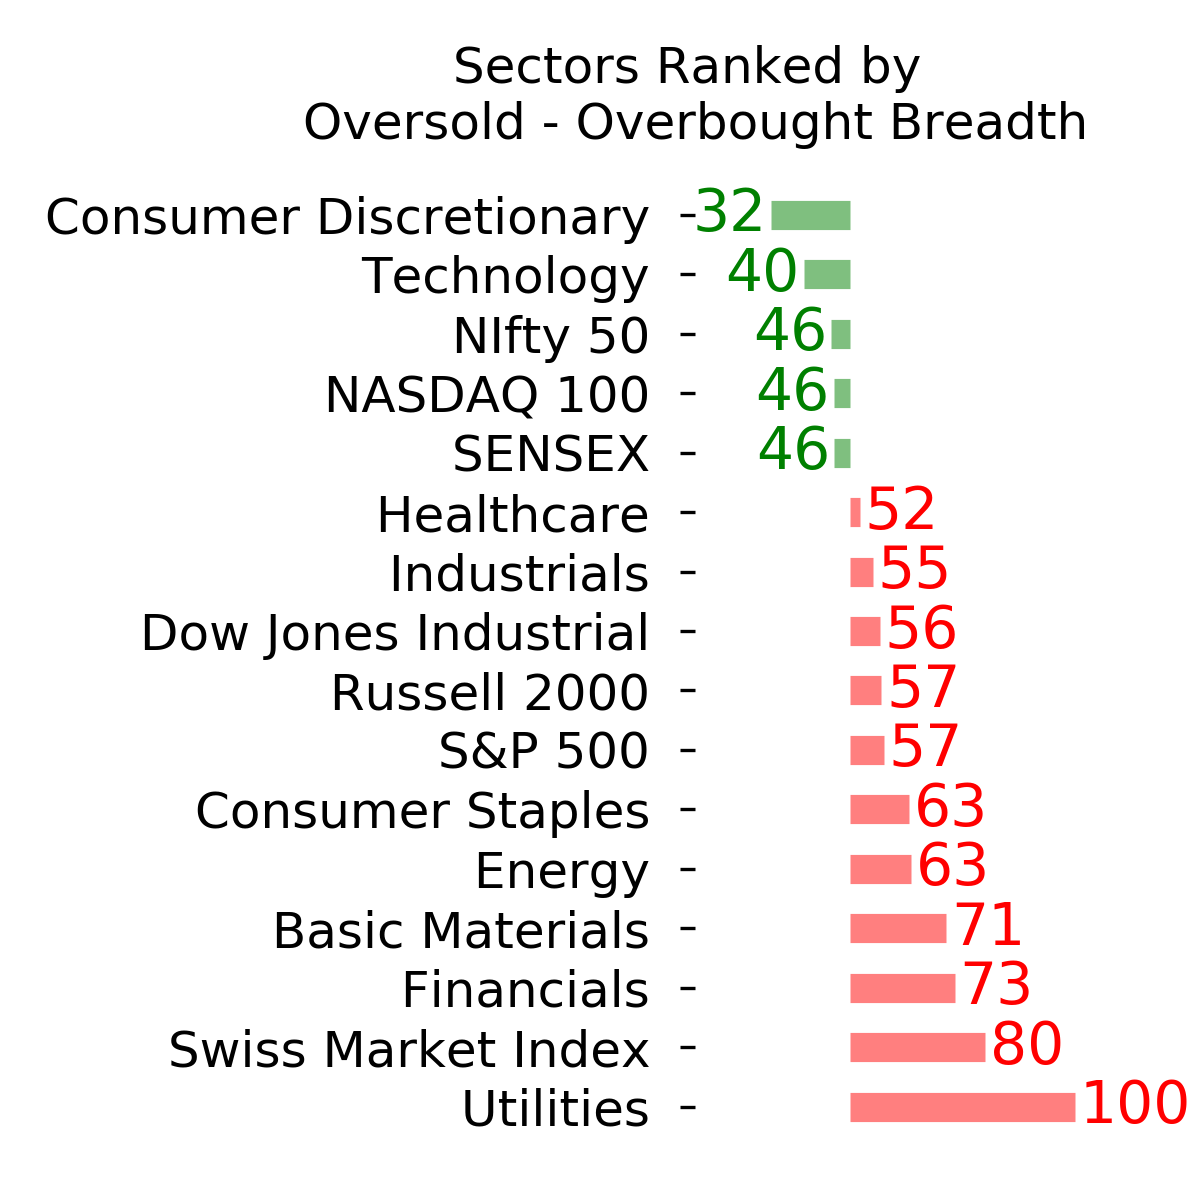
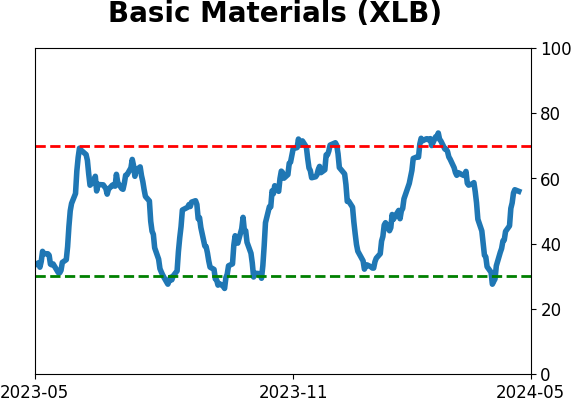
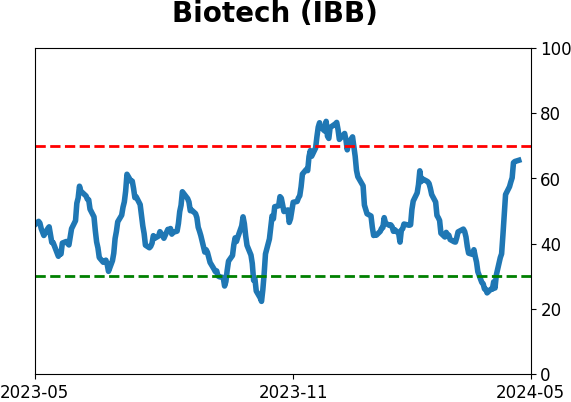
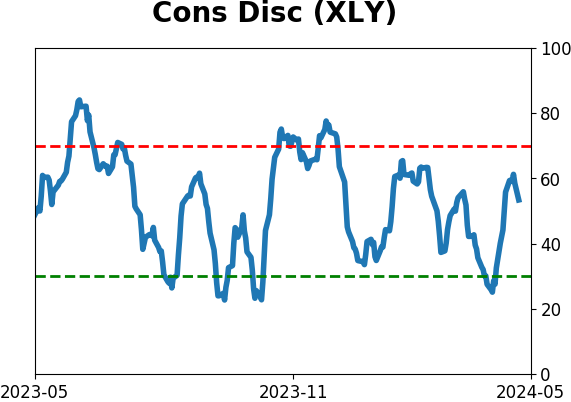
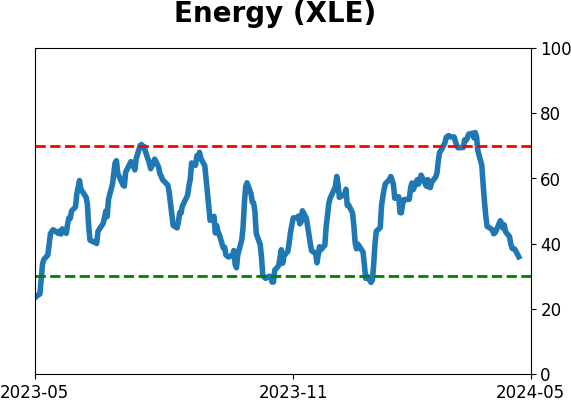
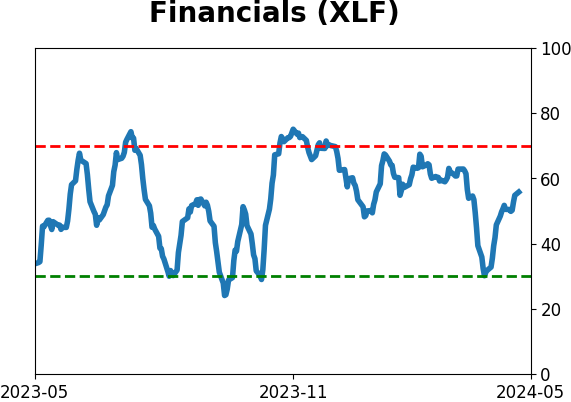
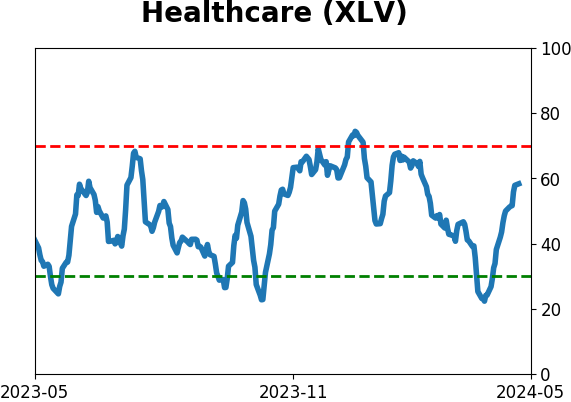
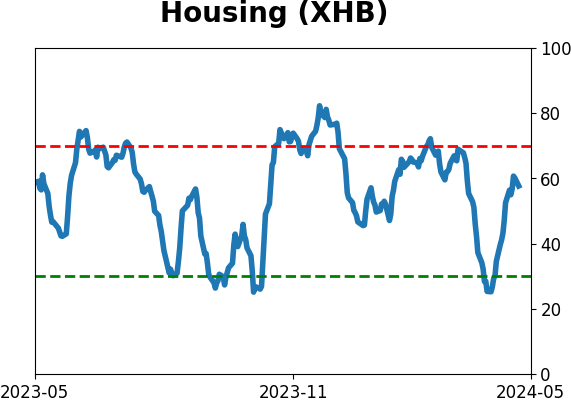
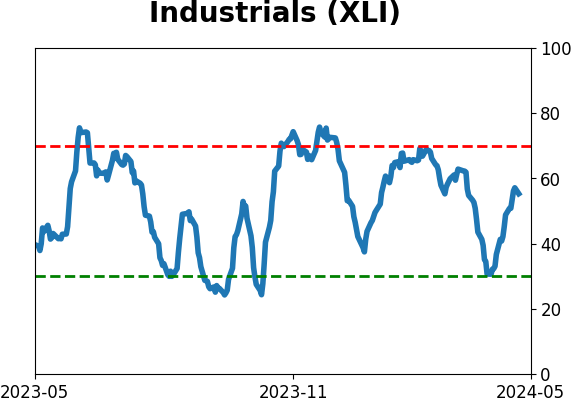
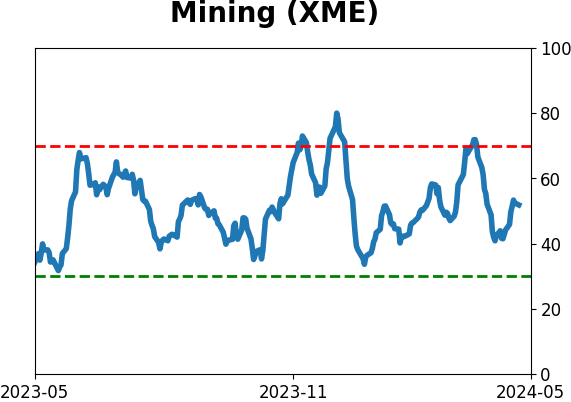
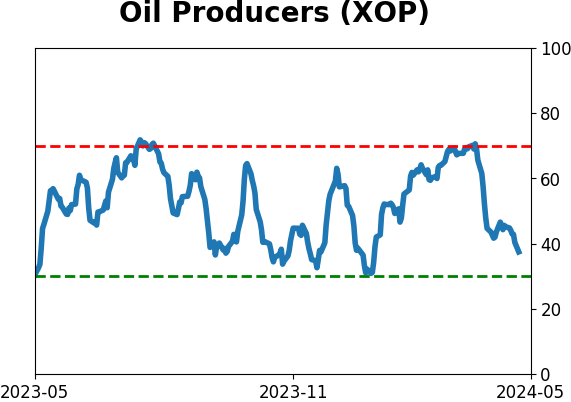
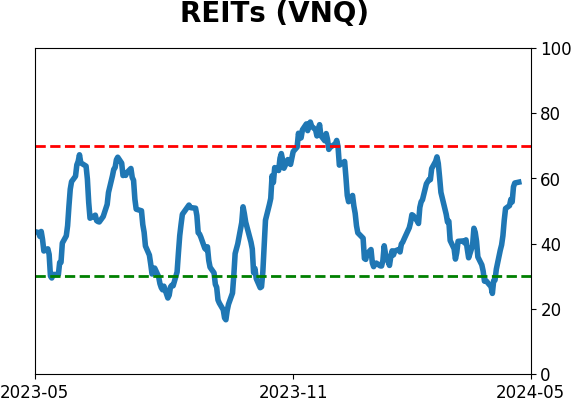
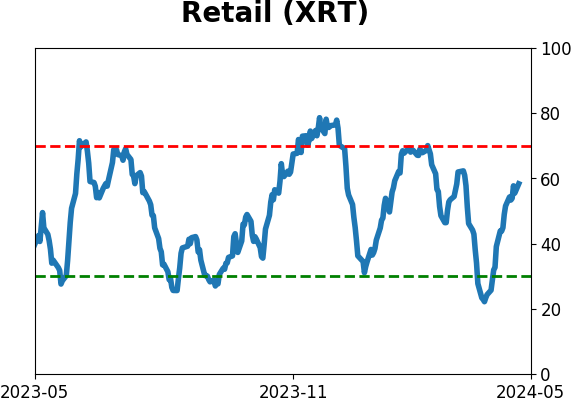
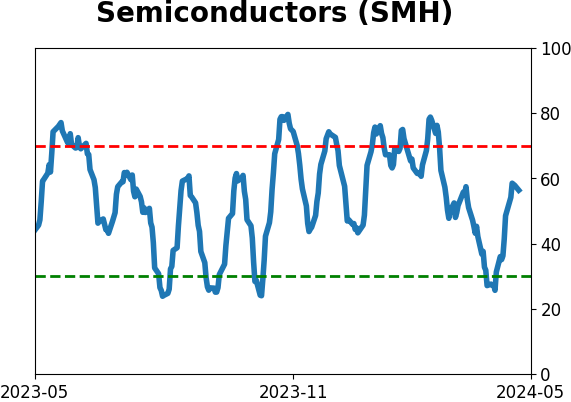
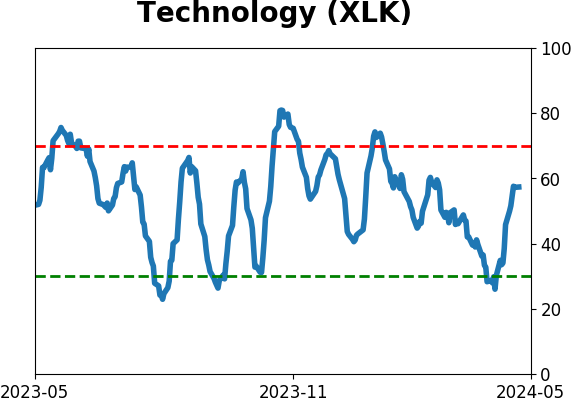
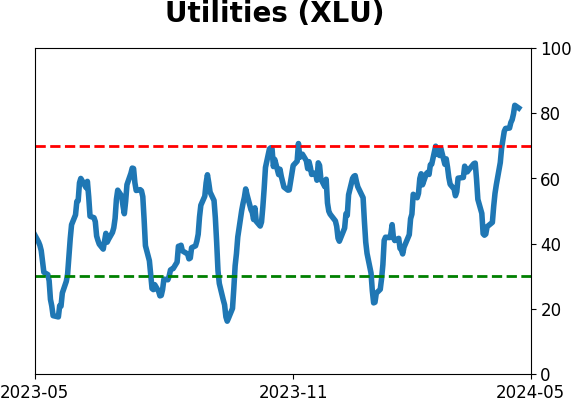
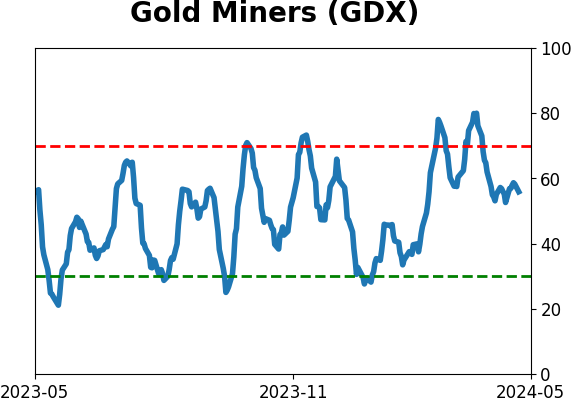
Sector ETF's - 10-Day Moving Average
|
|
|
Country ETF's - 10-Day Moving Average
|
|
|
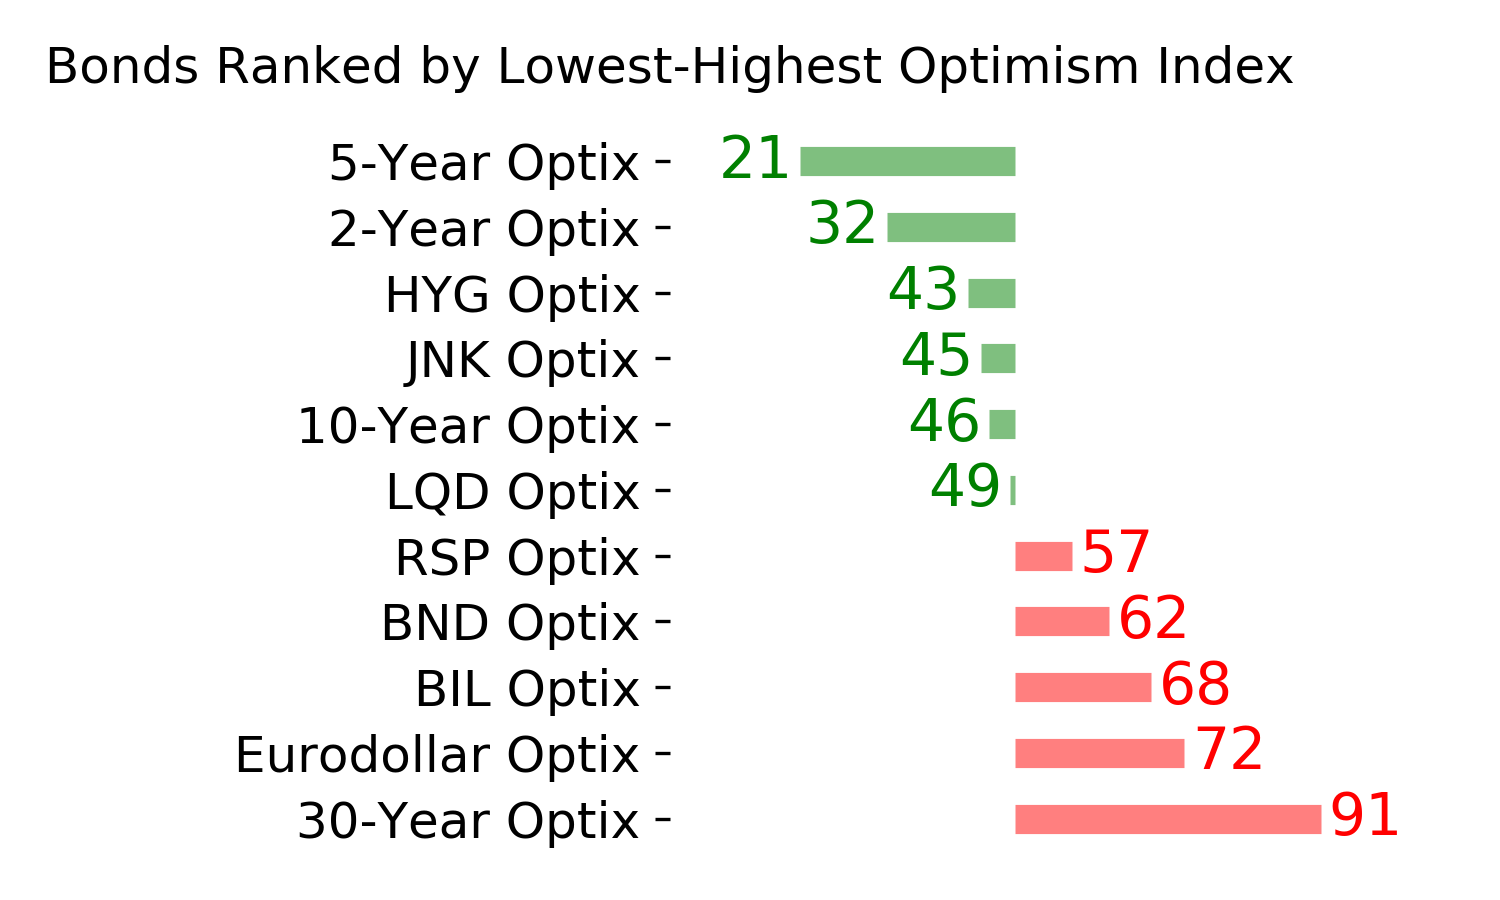
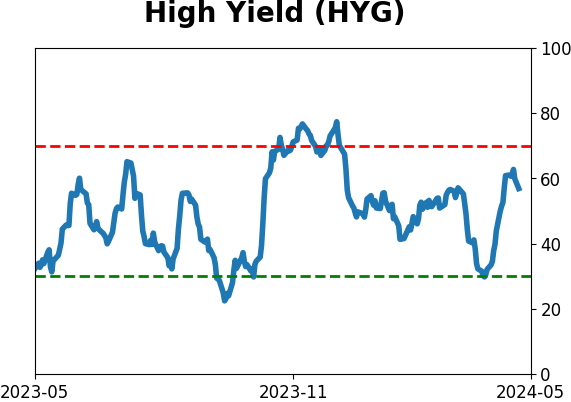
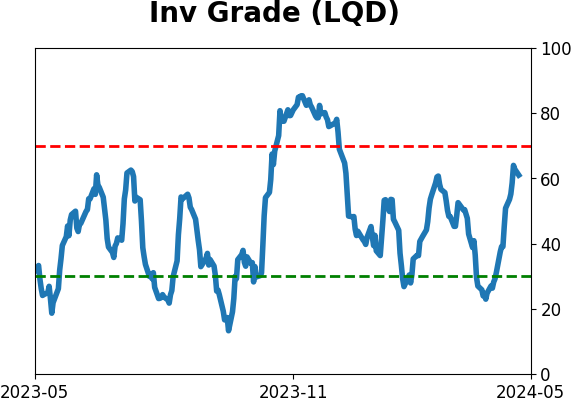
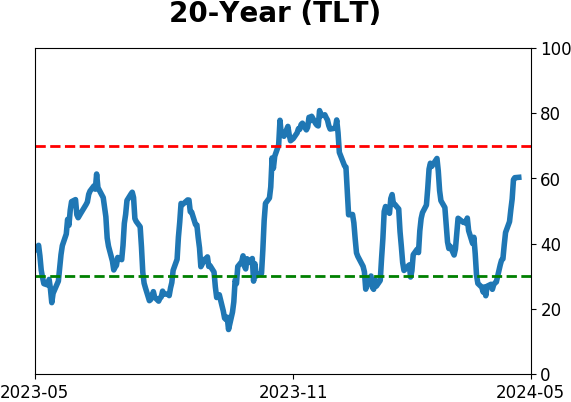
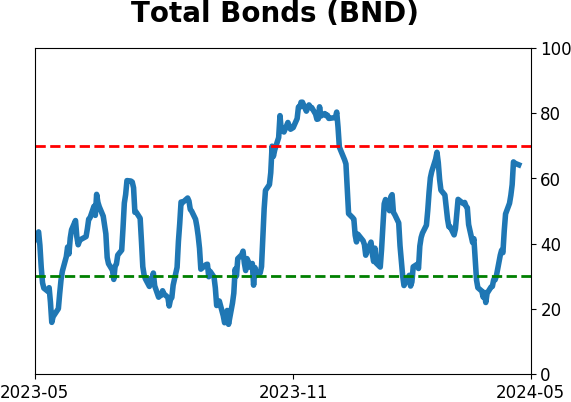
Bond ETF's - 10-Day Moving Average
|
|
|
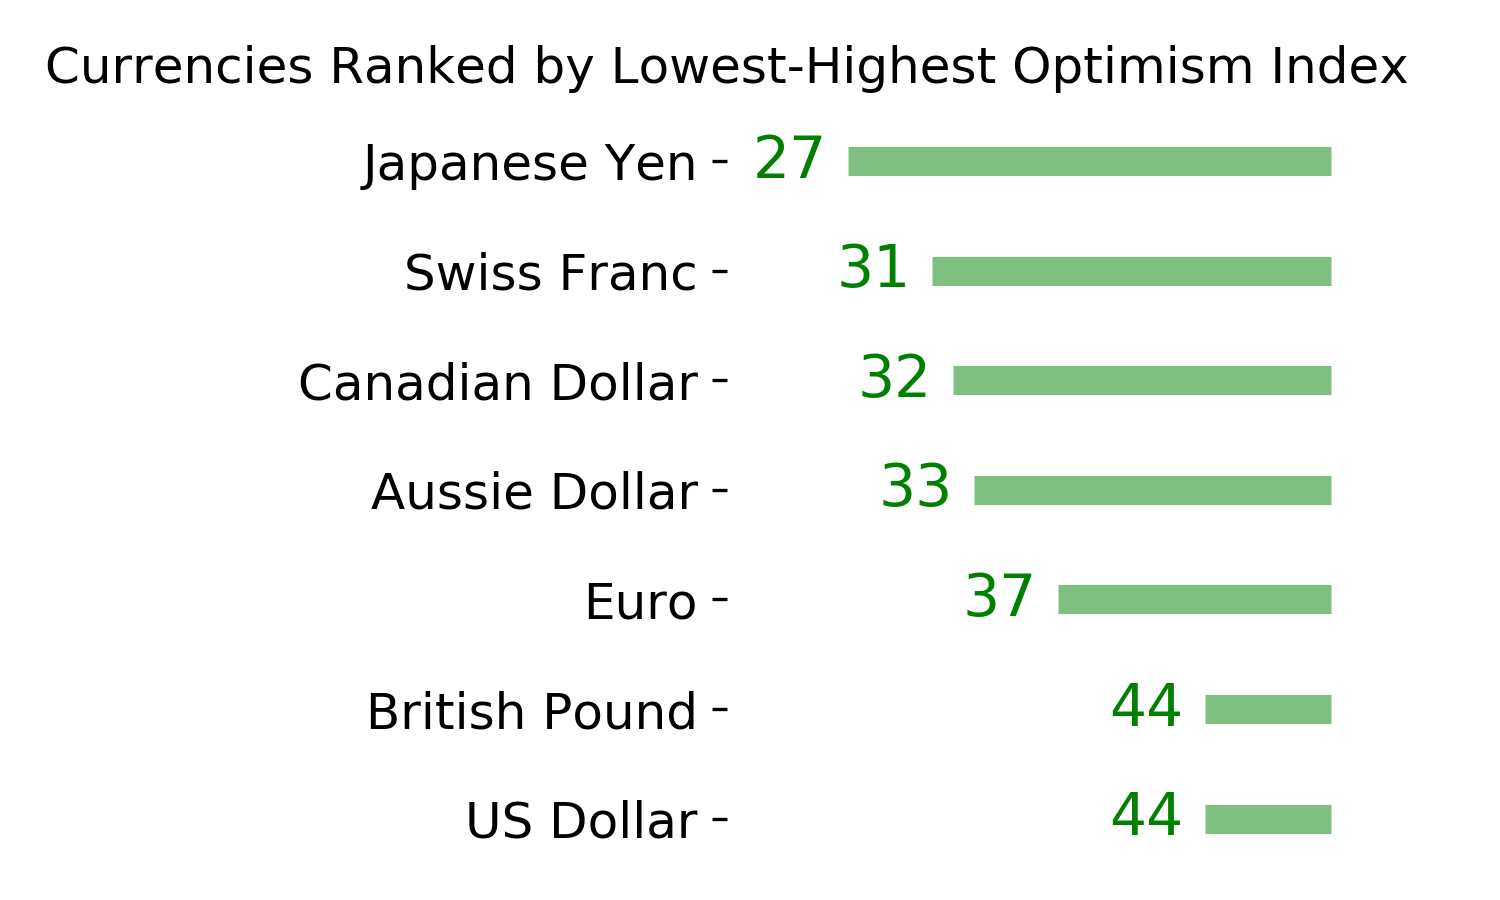
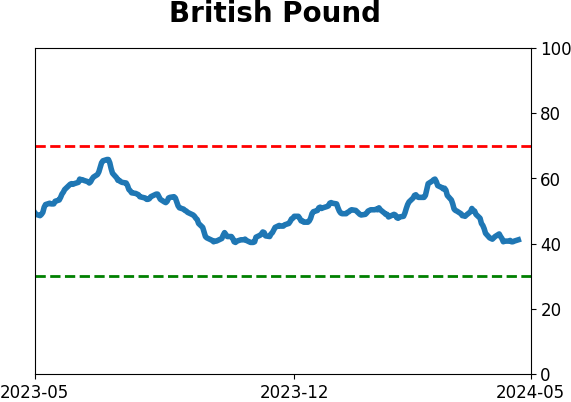
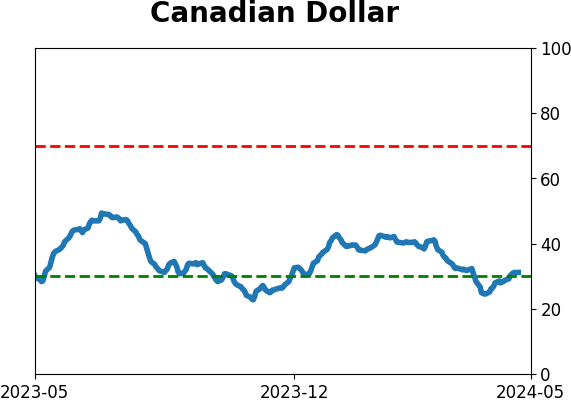
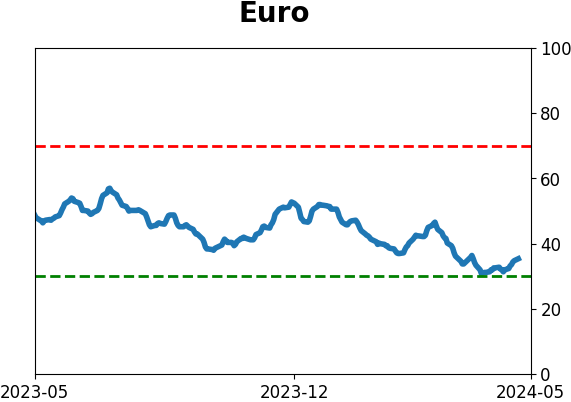
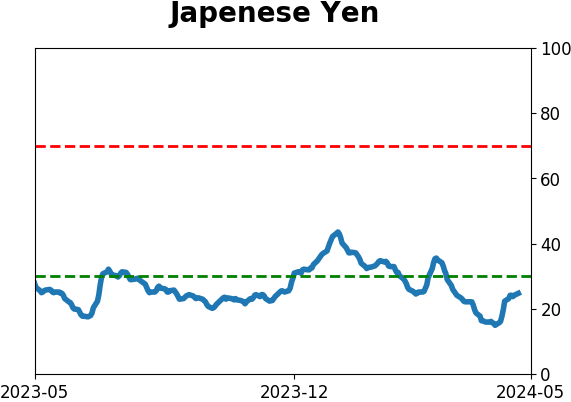
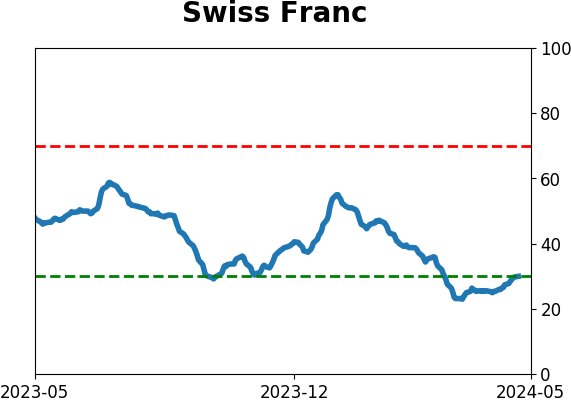
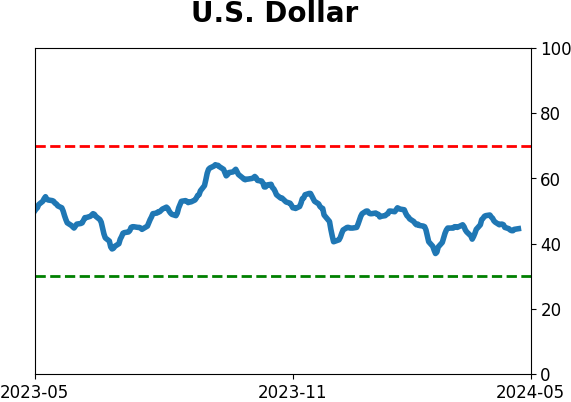
Currency ETF's - 5-Day Moving Average
|
|
|
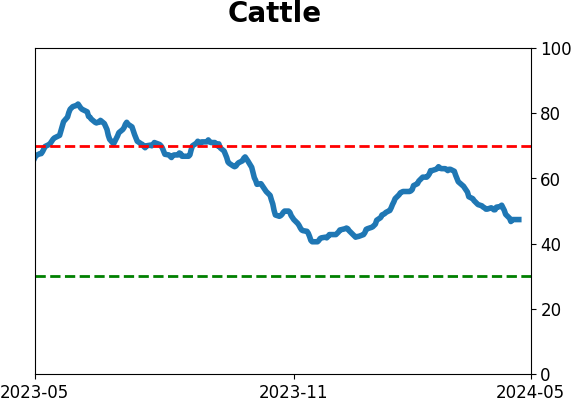
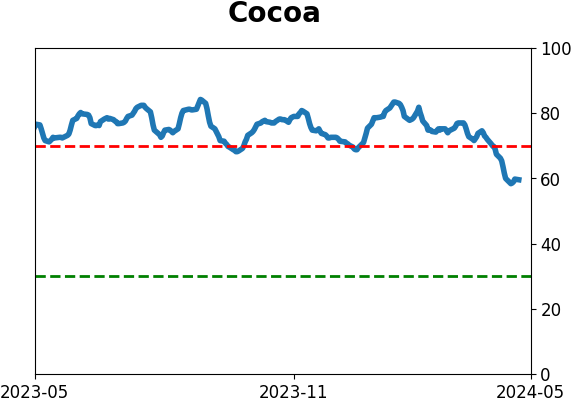
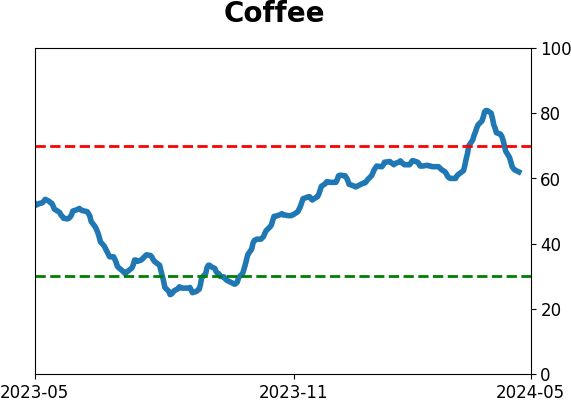
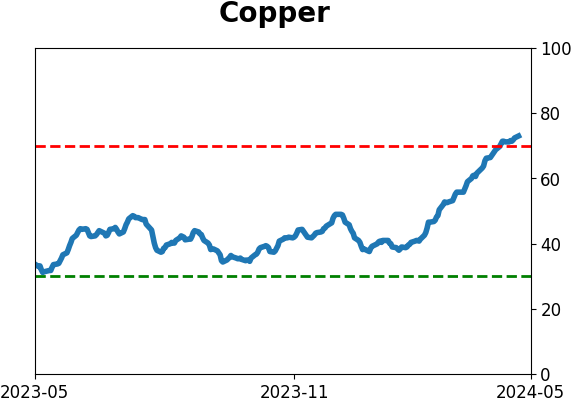
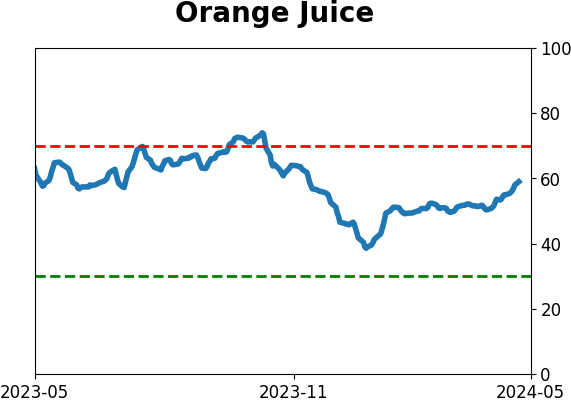
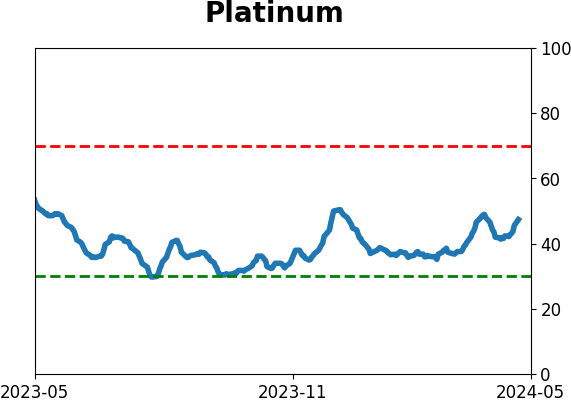
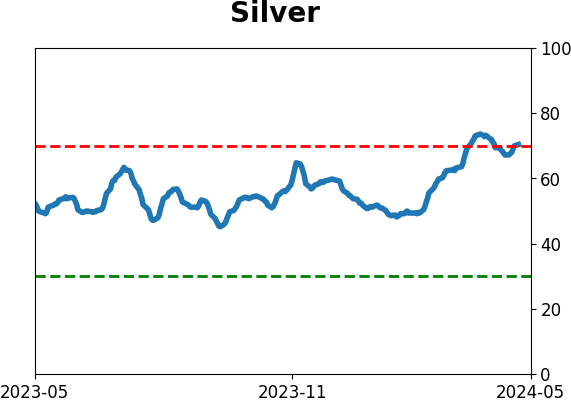
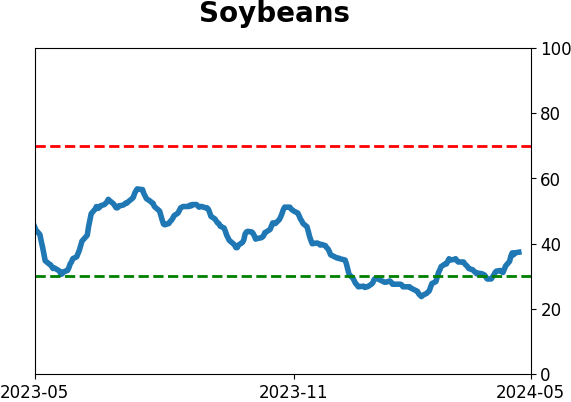
Commodity ETF's - 5-Day Moving Average
|
|