Headlines
|
|
The top 5 stocks are driving this rally, and that's not good:
The top 5 stocks in the S&P 500 are driving this rally. This handful of companies has accounted for nearly 25% of the S&P's total point gain since the March 23 low, among the highest percentages of any rally since 1990. Rallies that are driven by so few stocks have had a much harder time adding to gains.
A technical rejection:
The S&P 500 has been stuck under its widely-watched 200-day average for months now. After another attempt to climb back above it earlier this week, sellers stepped in again. Big rejections from below the 200-day average have seen stocks struggle in the past.
52-week high recovery: While stocks have gotten slammed in recent days, and the top-heavy rally has triggered some short- to medium-term warning signs, there are a few positive developments as well. In a premium note, Troy showed that for the first time in more than 2 months, more than 1% of securities on the NYSE managed to hit a 52-week high. While that didn't prevent shorter-term gyrations, each of the other times there was a recovery like this, the S&P 500 was higher a year later by double-digits (the dates were 1966-11-09, 1970-07-16, 1975-01-10, 1988-02-25, and 2009-04-02).
|
Smart / Dumb Money Confidence
|
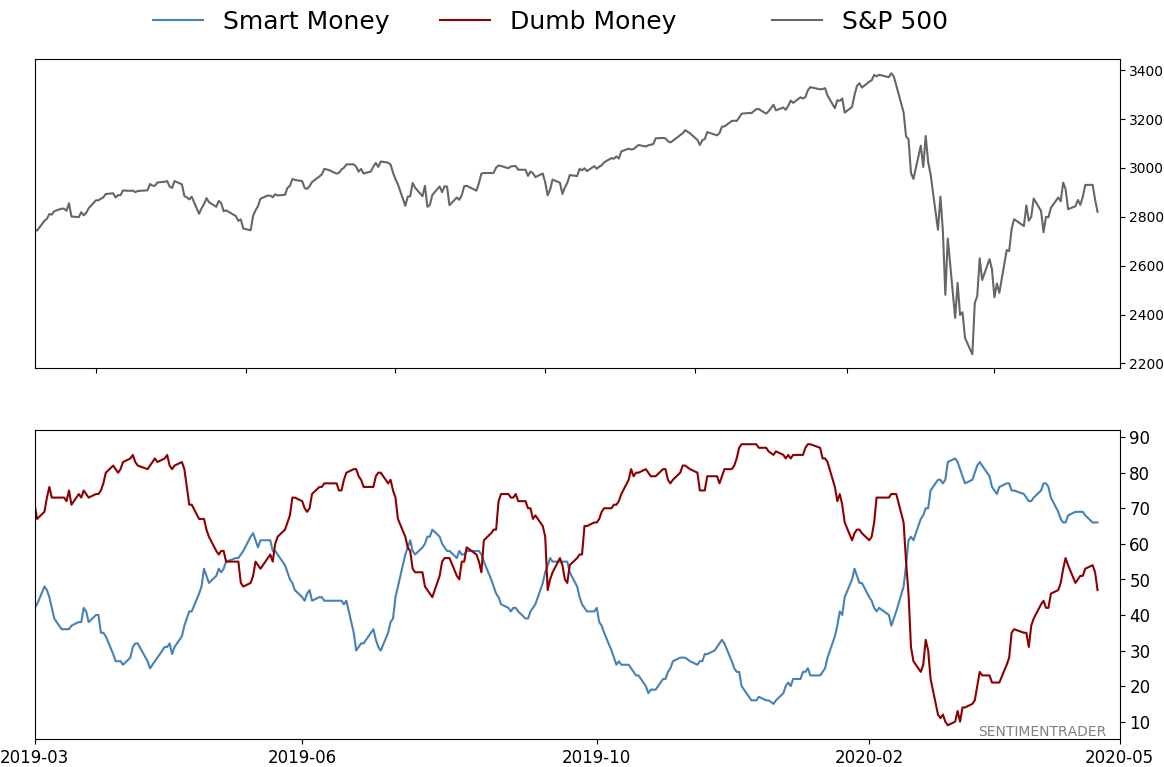
Smart Money Confidence: 66%
Dumb Money Confidence: 47%
|
|
Risk Levels
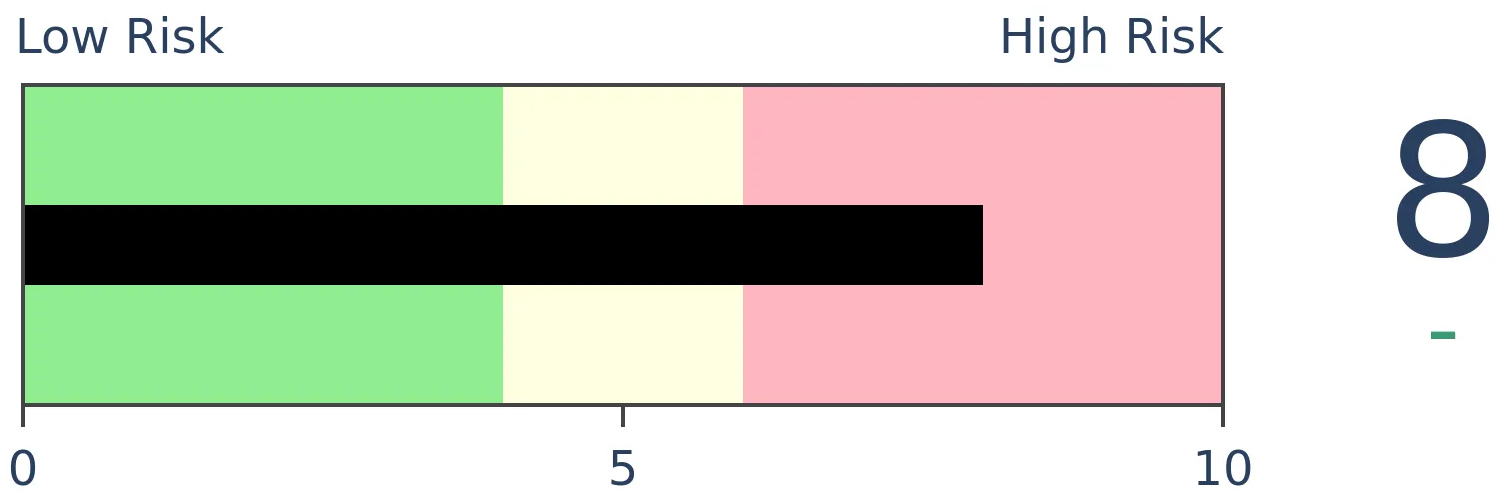
Stocks Short-Term
|
Stocks Medium-Term

|
|
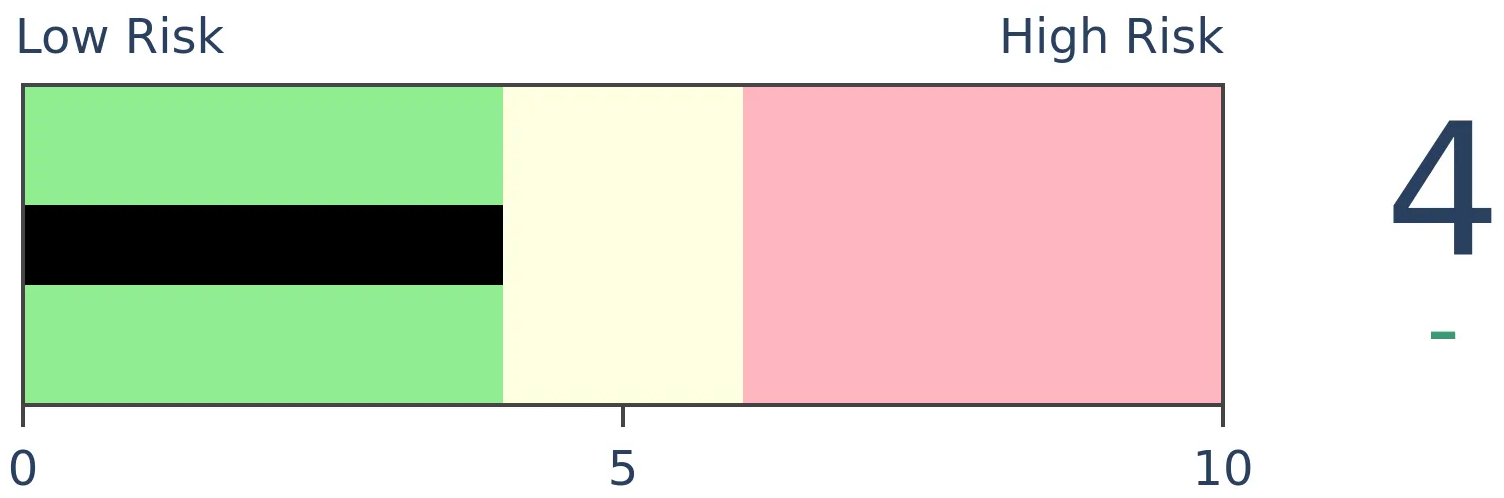
Bonds
|
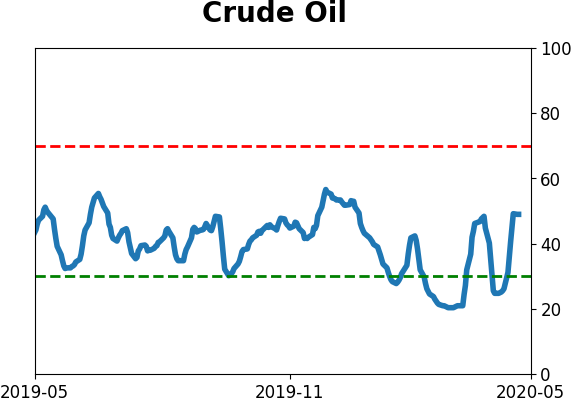
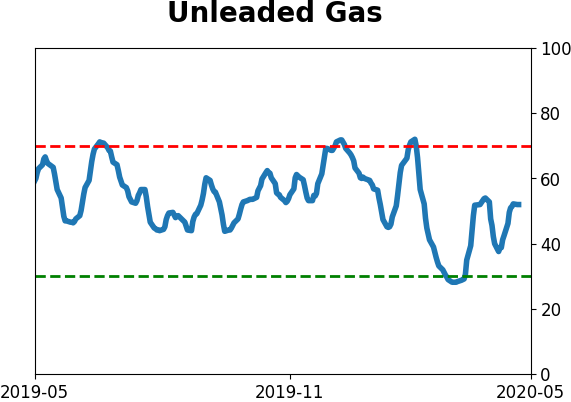
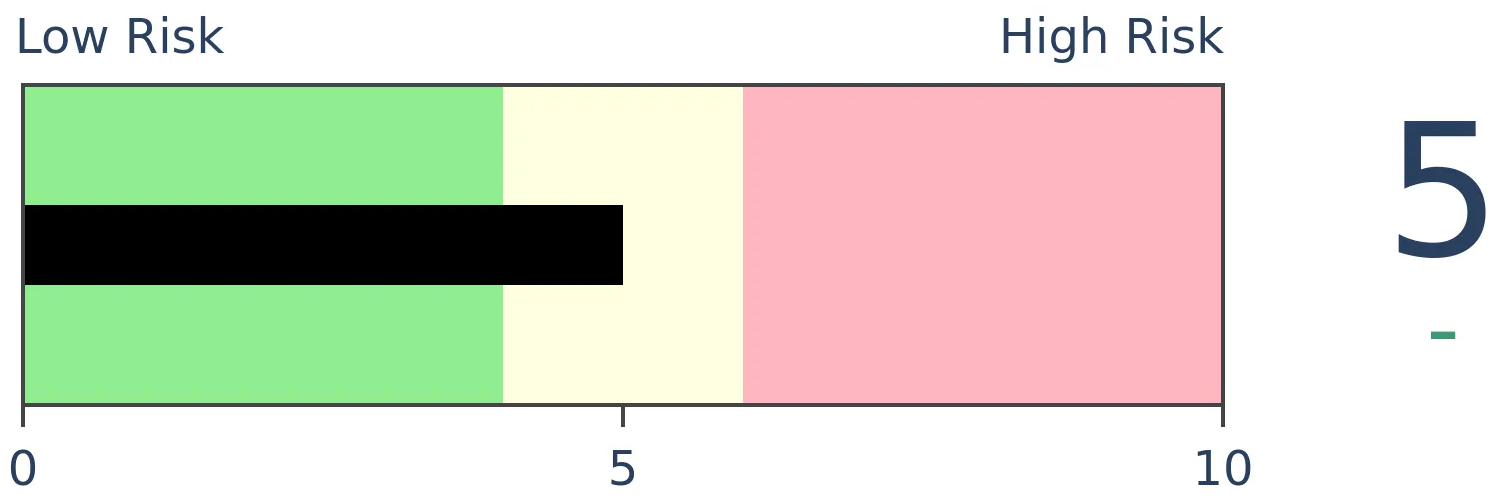
Crude Oil
|
|
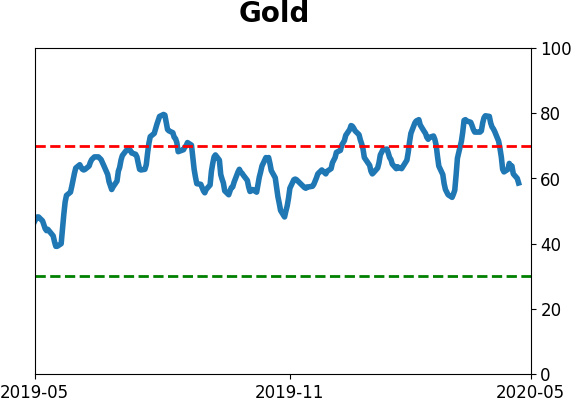
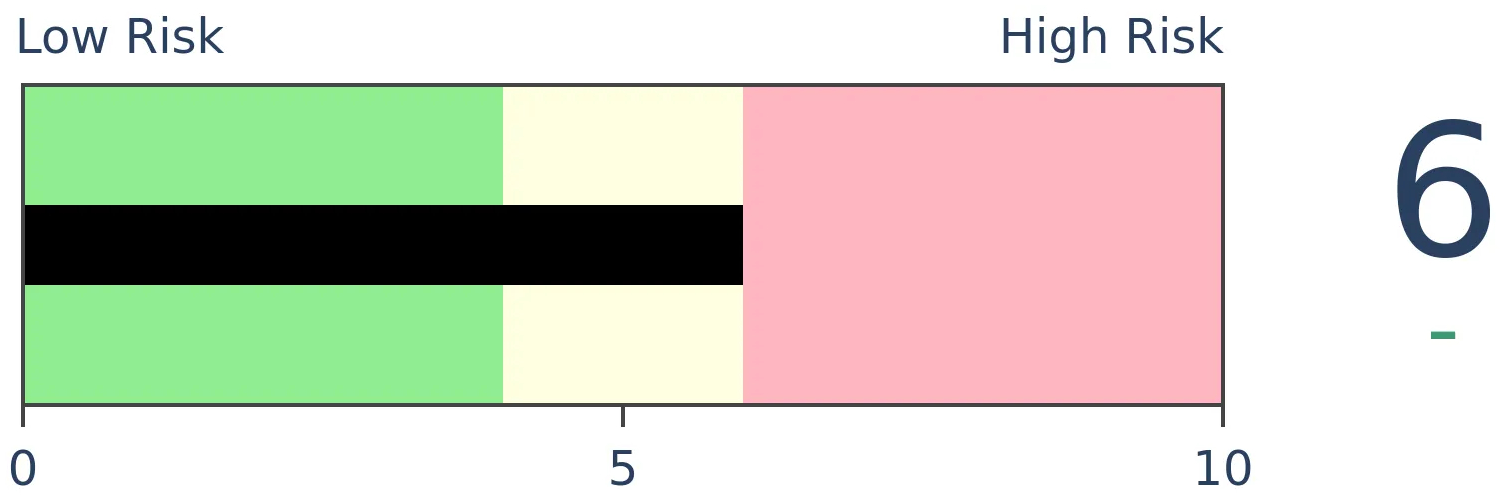
Gold
|
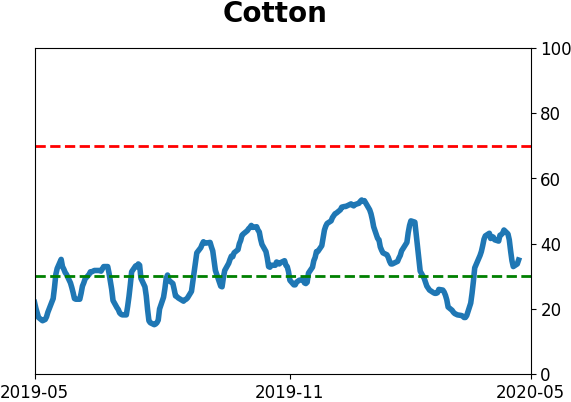
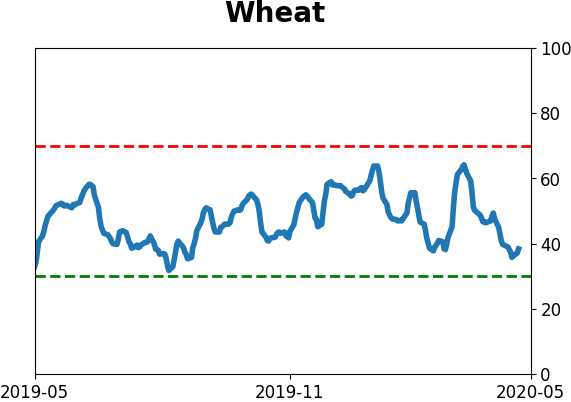
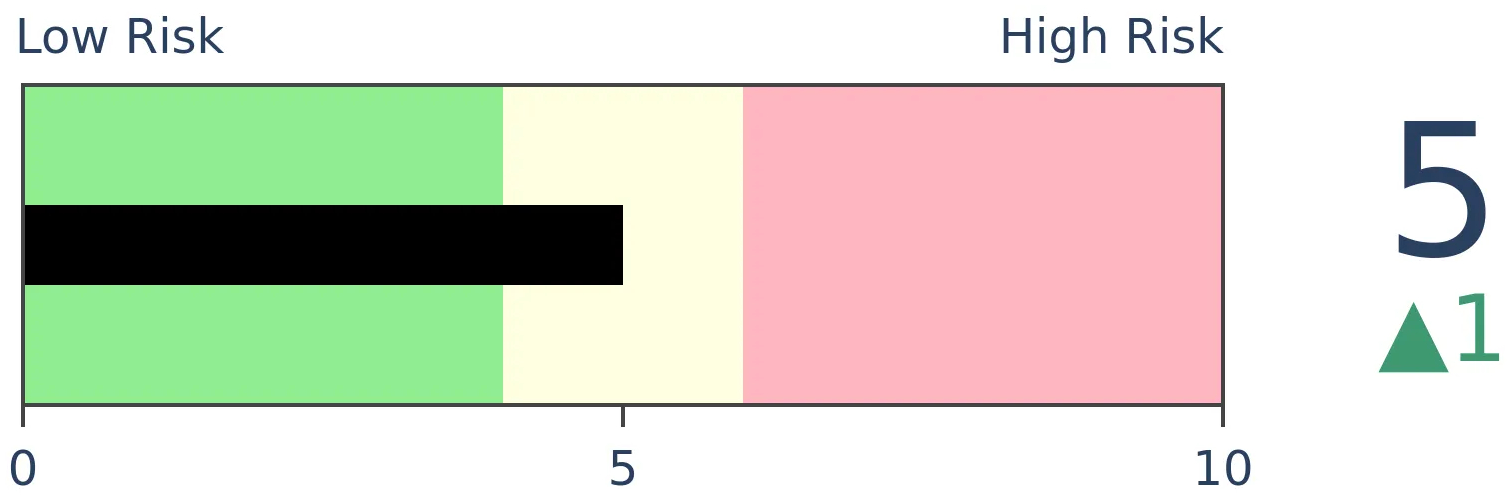
Agriculture
|
|
Research
BOTTOM LINE
The top 5 stocks in the S&P 500 are driving this rally. This handful of companies has accounted for nearly 25% of the S&P's total point gain since the March 23 low, among the highest percentages of any rally since 1990. Rallies that are driven by so few stocks have had a much harder time adding to gains.
FORECAST / TIMEFRAME
SPY -- Down, Medium-Term
|
The big winners just keep on winning, and it's starting to unnerve a lot of investors. It turns out they have a good reason for concern.
Most of us have seen some version of a chart like this from Goldman Sachs floating around:
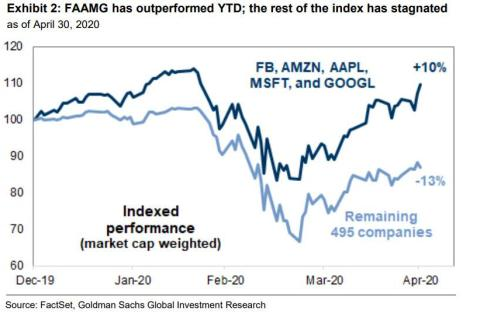
Some combination of FAANG or FAAMG (Facebook, Amazon, Apple, Netflix - or Microsoft - and Google) has been handily beating most other stocks. And that matters, because those stocks are huge, and they're driving a big portion of the gains.
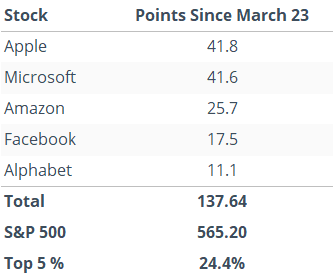
In the 35 days since the March 23 bottom, the top 5 drivers within the S&P 500 have accounted for 138 points out of the total 565 that the S&P has gained. So, only 5 stocks have accounted for more than 24% of the total point gain.
But...so what? Does it matter? Don't the top stocks always drive the index? Our good friend Tony Dwyer, the excellent strategist at Canaccord Genuity, helped answer this question in recent days, and it's not pretty.
To check, we'll look for every time the S&P 500 set a 52-week low, then rallied for 35 sessions. Over those 35-day periods, we'll look at the total points gained in the top 5 stocks versus the total points gained in the entire S&P 500.
Below, we can see the rallies that saw the top 5 stocks account for less than 20% of the S&P 500's total point gain.
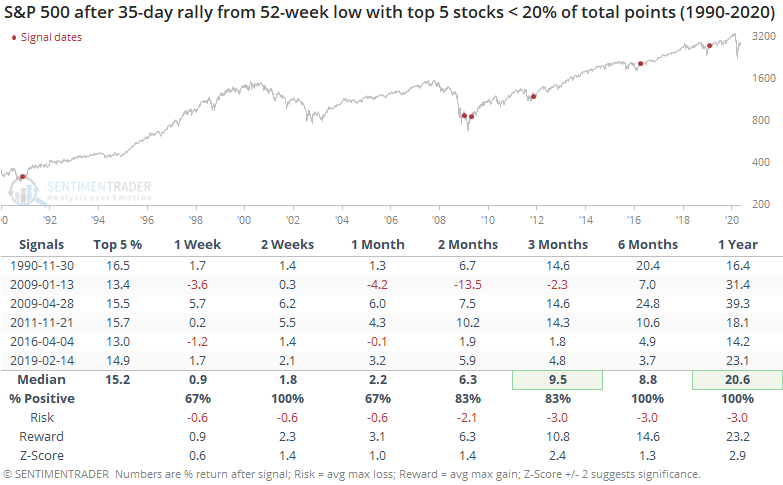
This was a good sign, with only one of them being a fakeout that ended up leading to a lower low. Each of the others proved to be sustainable, with excellent gains in the months ahead and a very positively skewed risk/reward ratio.
Now, let's check the 35-day rallies when the top 5 stocks accounted for more than 20% of the S&P's total gain. Bulls may want to avert their eyes.
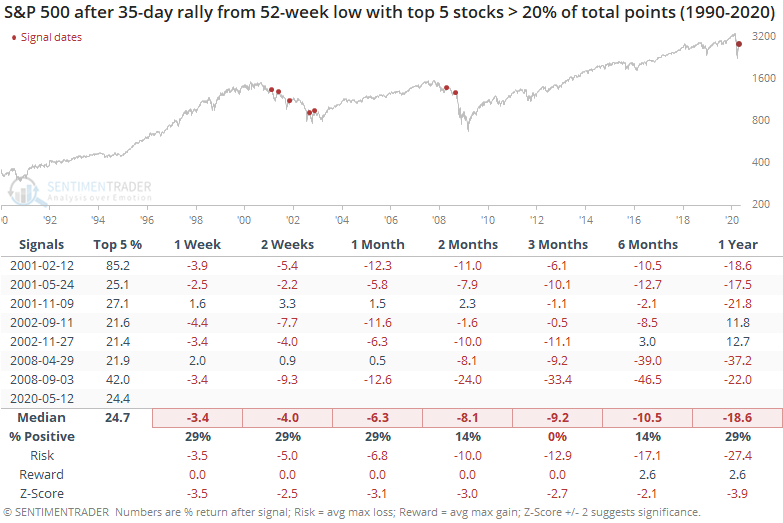
Every one of these proved to be a false rally, with the S&P losing ground over the next few months after each one. The risk/reward was horrid.
At 24.4%, the current weighting of the top 5 isn't as egregious as the worst time periods (like February 2001's weight of a whopping 85%) but it's definitely in the top tier.
There is no question we've seen unprecedented developments over the past two months. That makes any historical comparison questionable. From what we can see, though, when the initial rally off of a low is driven primarily by only a mere handful of stocks, it has been very difficult for the broader market to continue its gains.
BOTTOM LINE
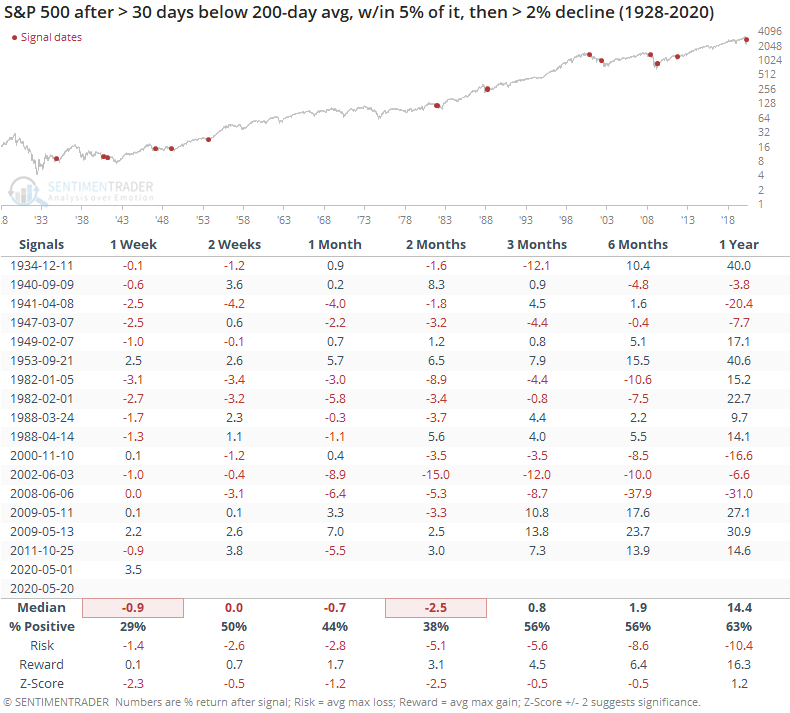
The S&P 500 has been stuck under its widely-watched 200-day average for months now. After another attempt to climb back above it earlier this week, sellers stepped in again. Big rejections from below the 200-day average have seen stocks struggle in the past.
FORECAST / TIMEFRAME
SPY -- Down, Medium-Term
|
Buyers have tried to push the most benchmarked index in the world above its most widely-watched moving average, and failed again. After nearing its 200-day average on Monday, selling pressure kicked in.
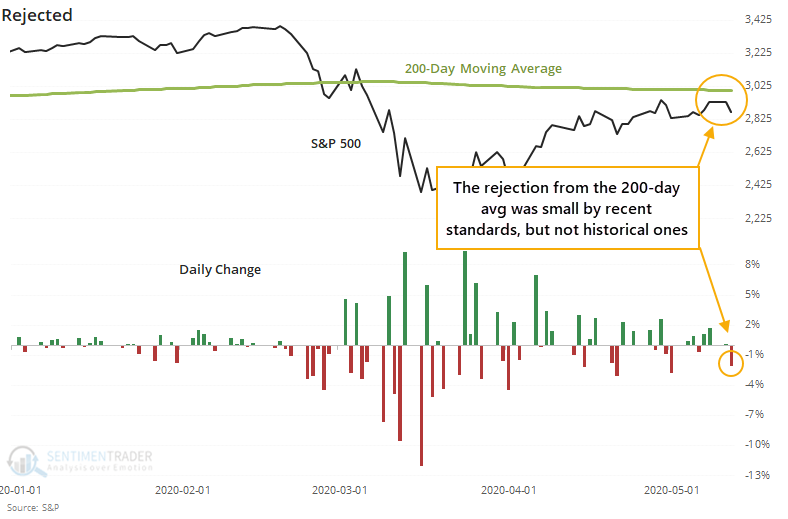
After being held below its 200-day average for more than two months, the S&P 500 climbed to within shouting distance of it, only to be slapped back on Tuesday. When we've seen big rejections while approaching from below the 200-day average, it has been a struggle for buyers to recover. All but three of them saw the S&P trade lower at some point over the next 1 to 12 weeks.
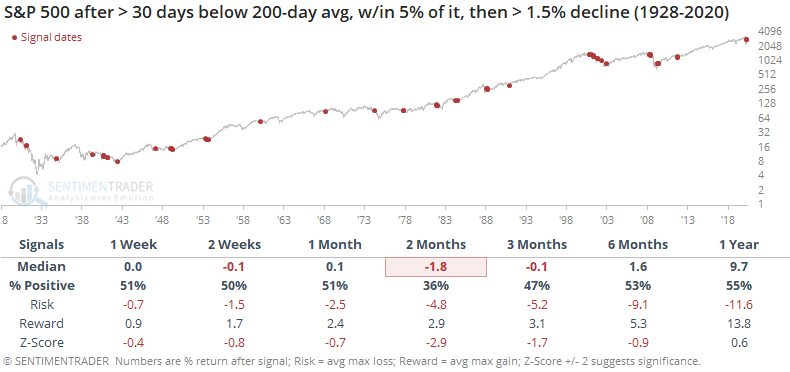
For a 1.5% decline, there were 56 signals. Of those, 82% of them saw a negative return anywhere from 1-12 weeks later.
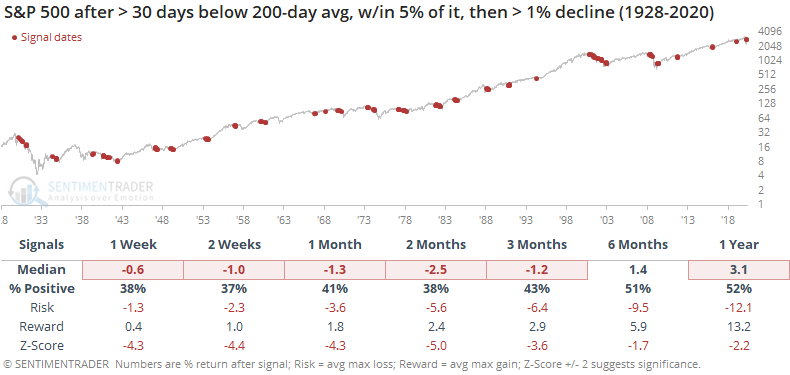
For a 1% decline, there were 144 signals, of which 85% saw a negative return at some point between the next 1-12 weeks.
The breadth thrusts and impressive retracement of the decline that we spent so much time going over in late March and early April remain the most compelling reasons to expect a further recovery. This is the hardest part of that attempt, when pessimism has mostly been driven off, and investors have to decide whether it's too-much-too-fast. Most of the time, it is. A rejection like stocks saw on Tuesday is another knock against the recovery attempt, and buyers need to step in again soon.
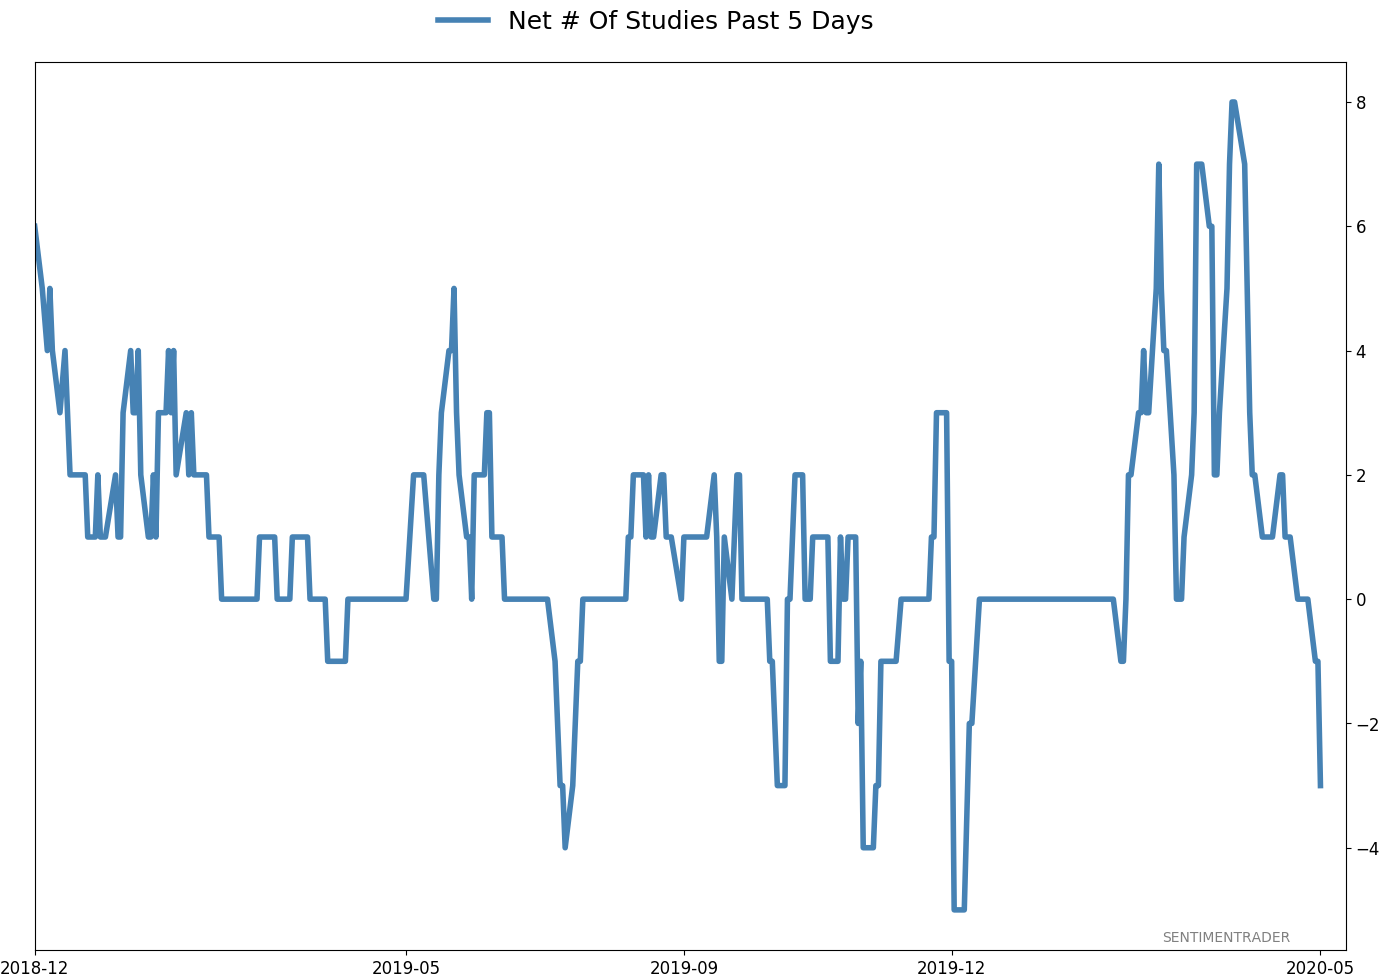
Active Studies
| Time Frame | Bullish | Bearish | | Short-Term | 0 | 6 | | Medium-Term | 12 | 3 | | Long-Term | 37 | 3 |
|
Indicators at Extremes
Portfolio
| Position | Weight % | Added / Reduced | Date | | Stocks | 38.9 | Reduced 10% | 2020-05-13 | | Bonds | 0.0 | Reduced 6.7% | 2020-02-28 | | Commodities | 5.1 | Added 2.4%
| 2020-02-28 | | Precious Metals | 0.0 | Reduced 3.6% | 2020-02-28 | | Special Situations | 0.0 | Reduced 31.9% | 2020-03-17 | | Cash | 56.0 | | |
|
Updates (Changes made today are underlined)
In the first months of the year, we saw manic trading activity. From big jumps in specific stocks to historic highs in retail trading activity to record highs in household confidence to almost unbelievable confidence among options traders. All of that came amid a market where the average stock couldn't keep up with their indexes. There were signs of waning momentum in stocks underlying the major averages, which started triggering technical warning signs in late January. The kinds of extremes we saw in December and January typically take months to wear away, but the type of selling in March went a long way toward getting there. When we place the kind of moves we saw into March 23 into the context of coming off an all-time high, there has been a high probability of a multi-month rebound. After stocks bottomed on the 23rd, they enjoyed a historic buying thrust and retraced a larger amount of the decline than "just a bear market rally" tends to. While other signs are mixed that panic is subsiding, those thrusts are the most encouraging sign we've seen in years. Shorter-term, there have been some warning signs popping up and our studies have stopped showing as positively skewed returns. I reduced my exposure some in late April and was looking for a pattern of lower highs and lower lows to reduce it further. With weakness on May 12, our studies turned even more negative over the short- to medium-term so I reduced a bit more. Some short-term indicators are already nearing oversold so we may get a quick rebound but it is what it is. If we see a clear pattern of lower lows, I may reduce even further in the week(s) ahead. Long-term prospects look decent because of the thrusts we saw off the low, but I'm more comfortable in cash in the interim. I'd consider adding back if we see our indicators and studies start to skew to the upside again, or if price action turns clearly better, indicating my caution is wrong.
RETURN YTD: -9.7% 2019: 12.6%, 2018: 0.6%, 2017: 3.8%, 2016: 17.1%, 2015: 9.2%, 2014: 14.5%, 2013: 2.2%, 2012: 10.8%, 2011: 16.5%, 2010: 15.3%, 2009: 23.9%, 2008: 16.2%, 2007: 7.8%
|
|
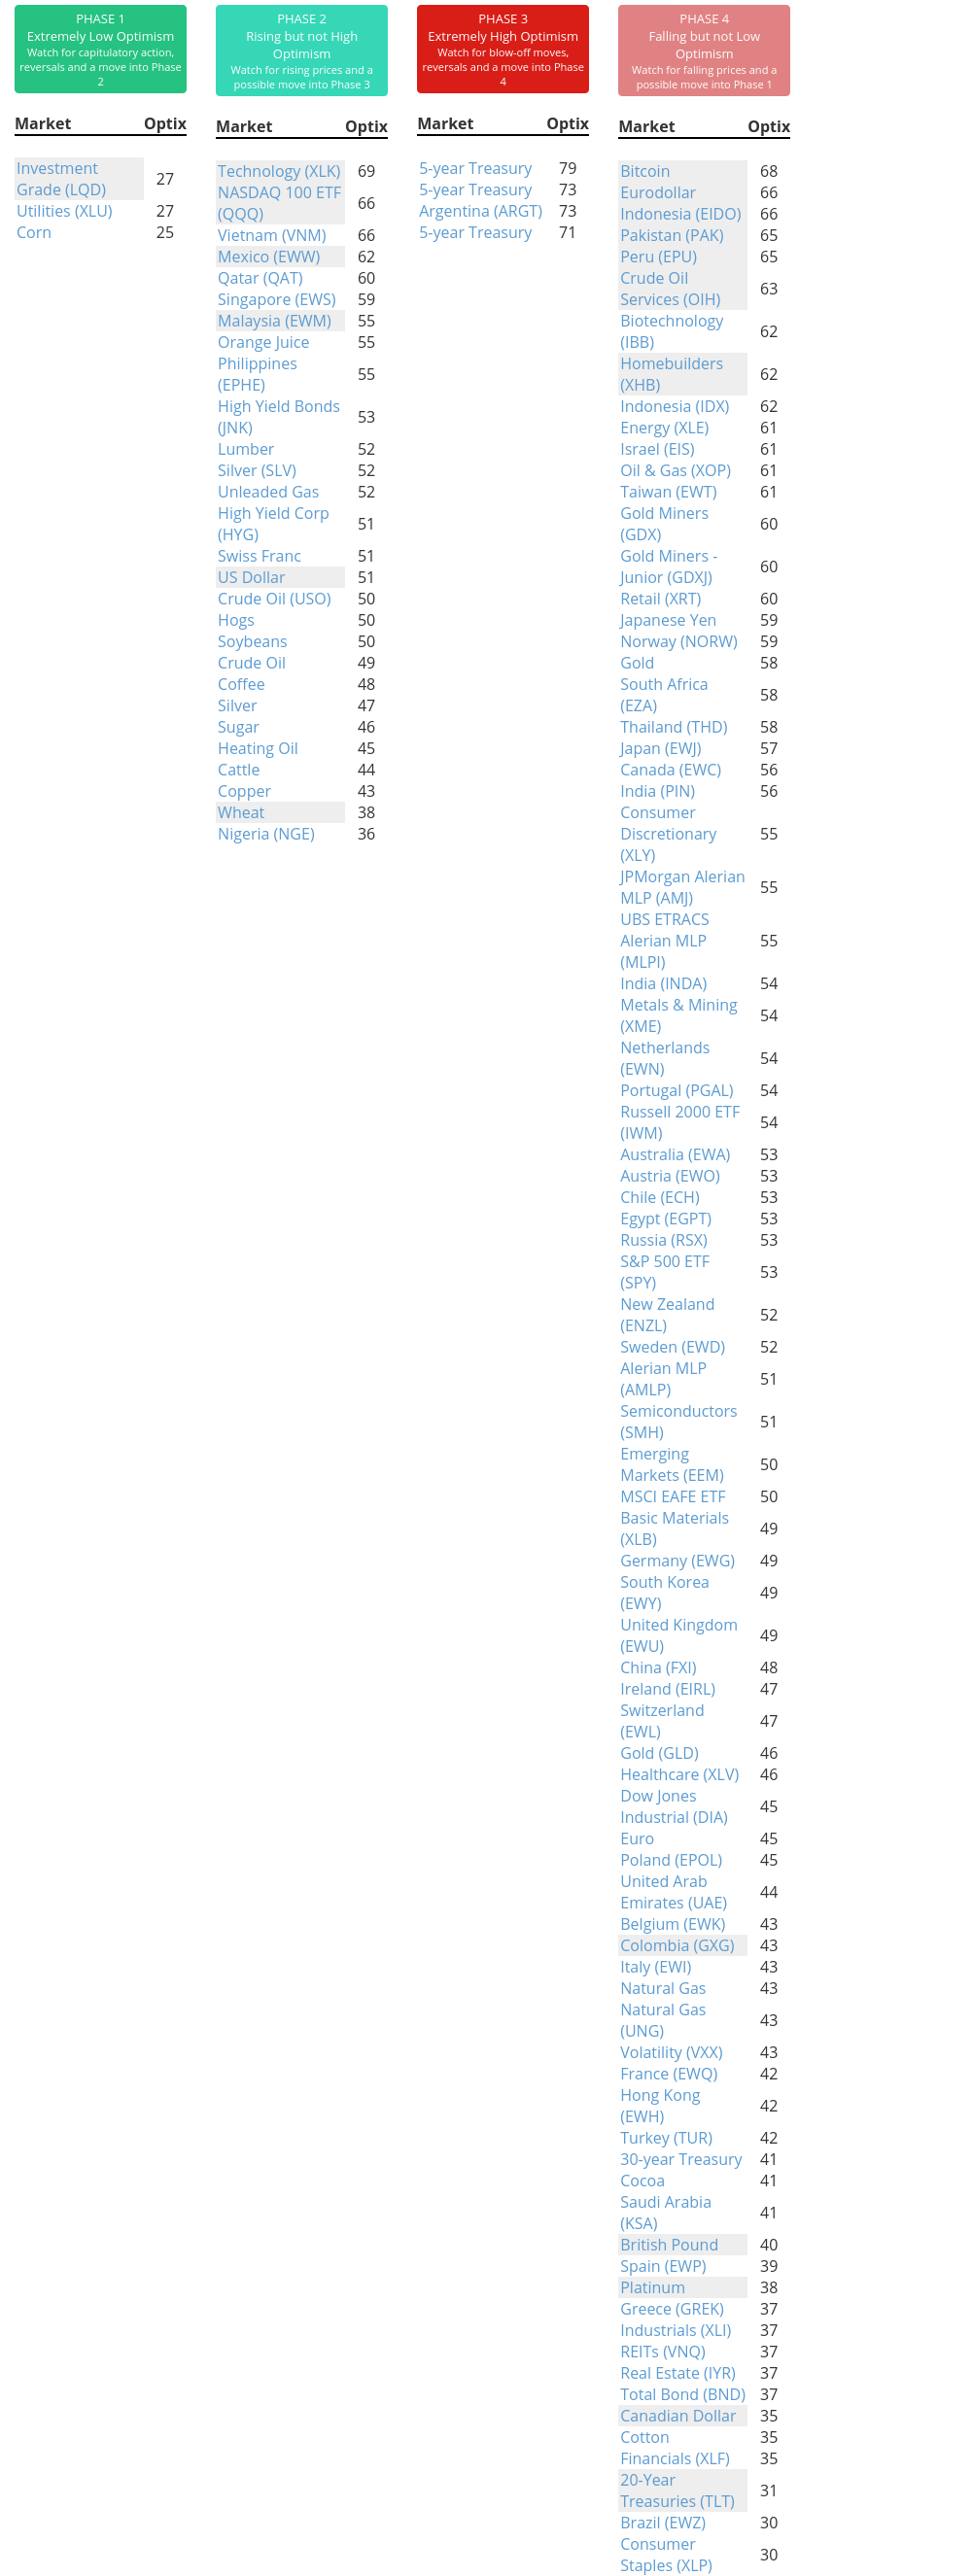
Phase Table
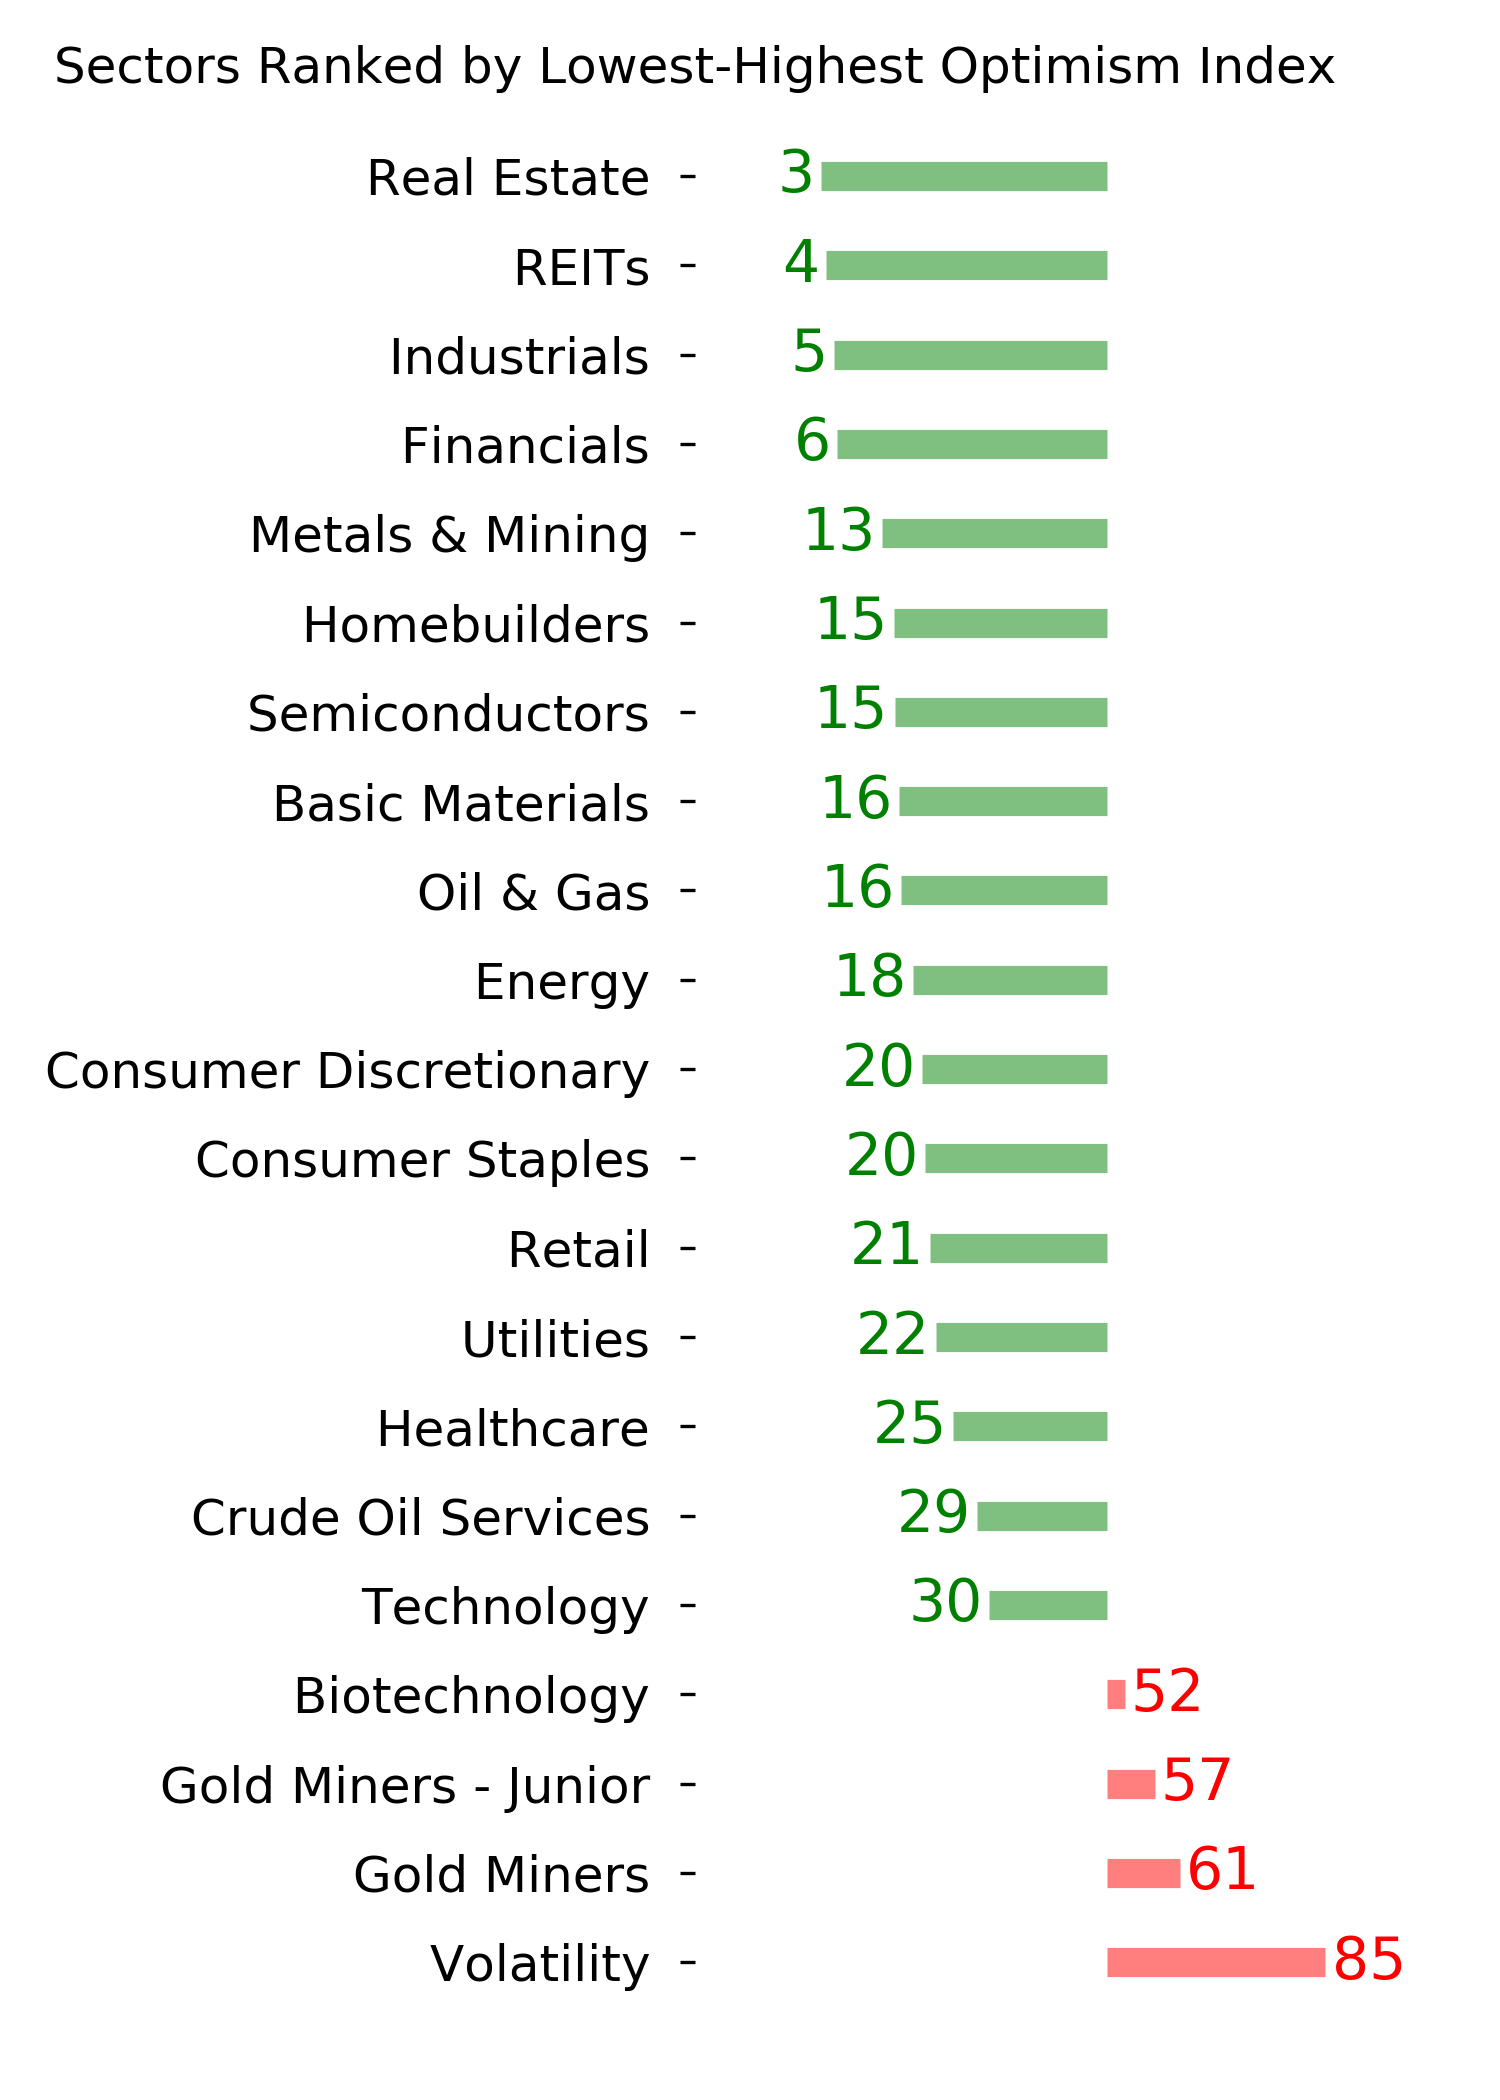
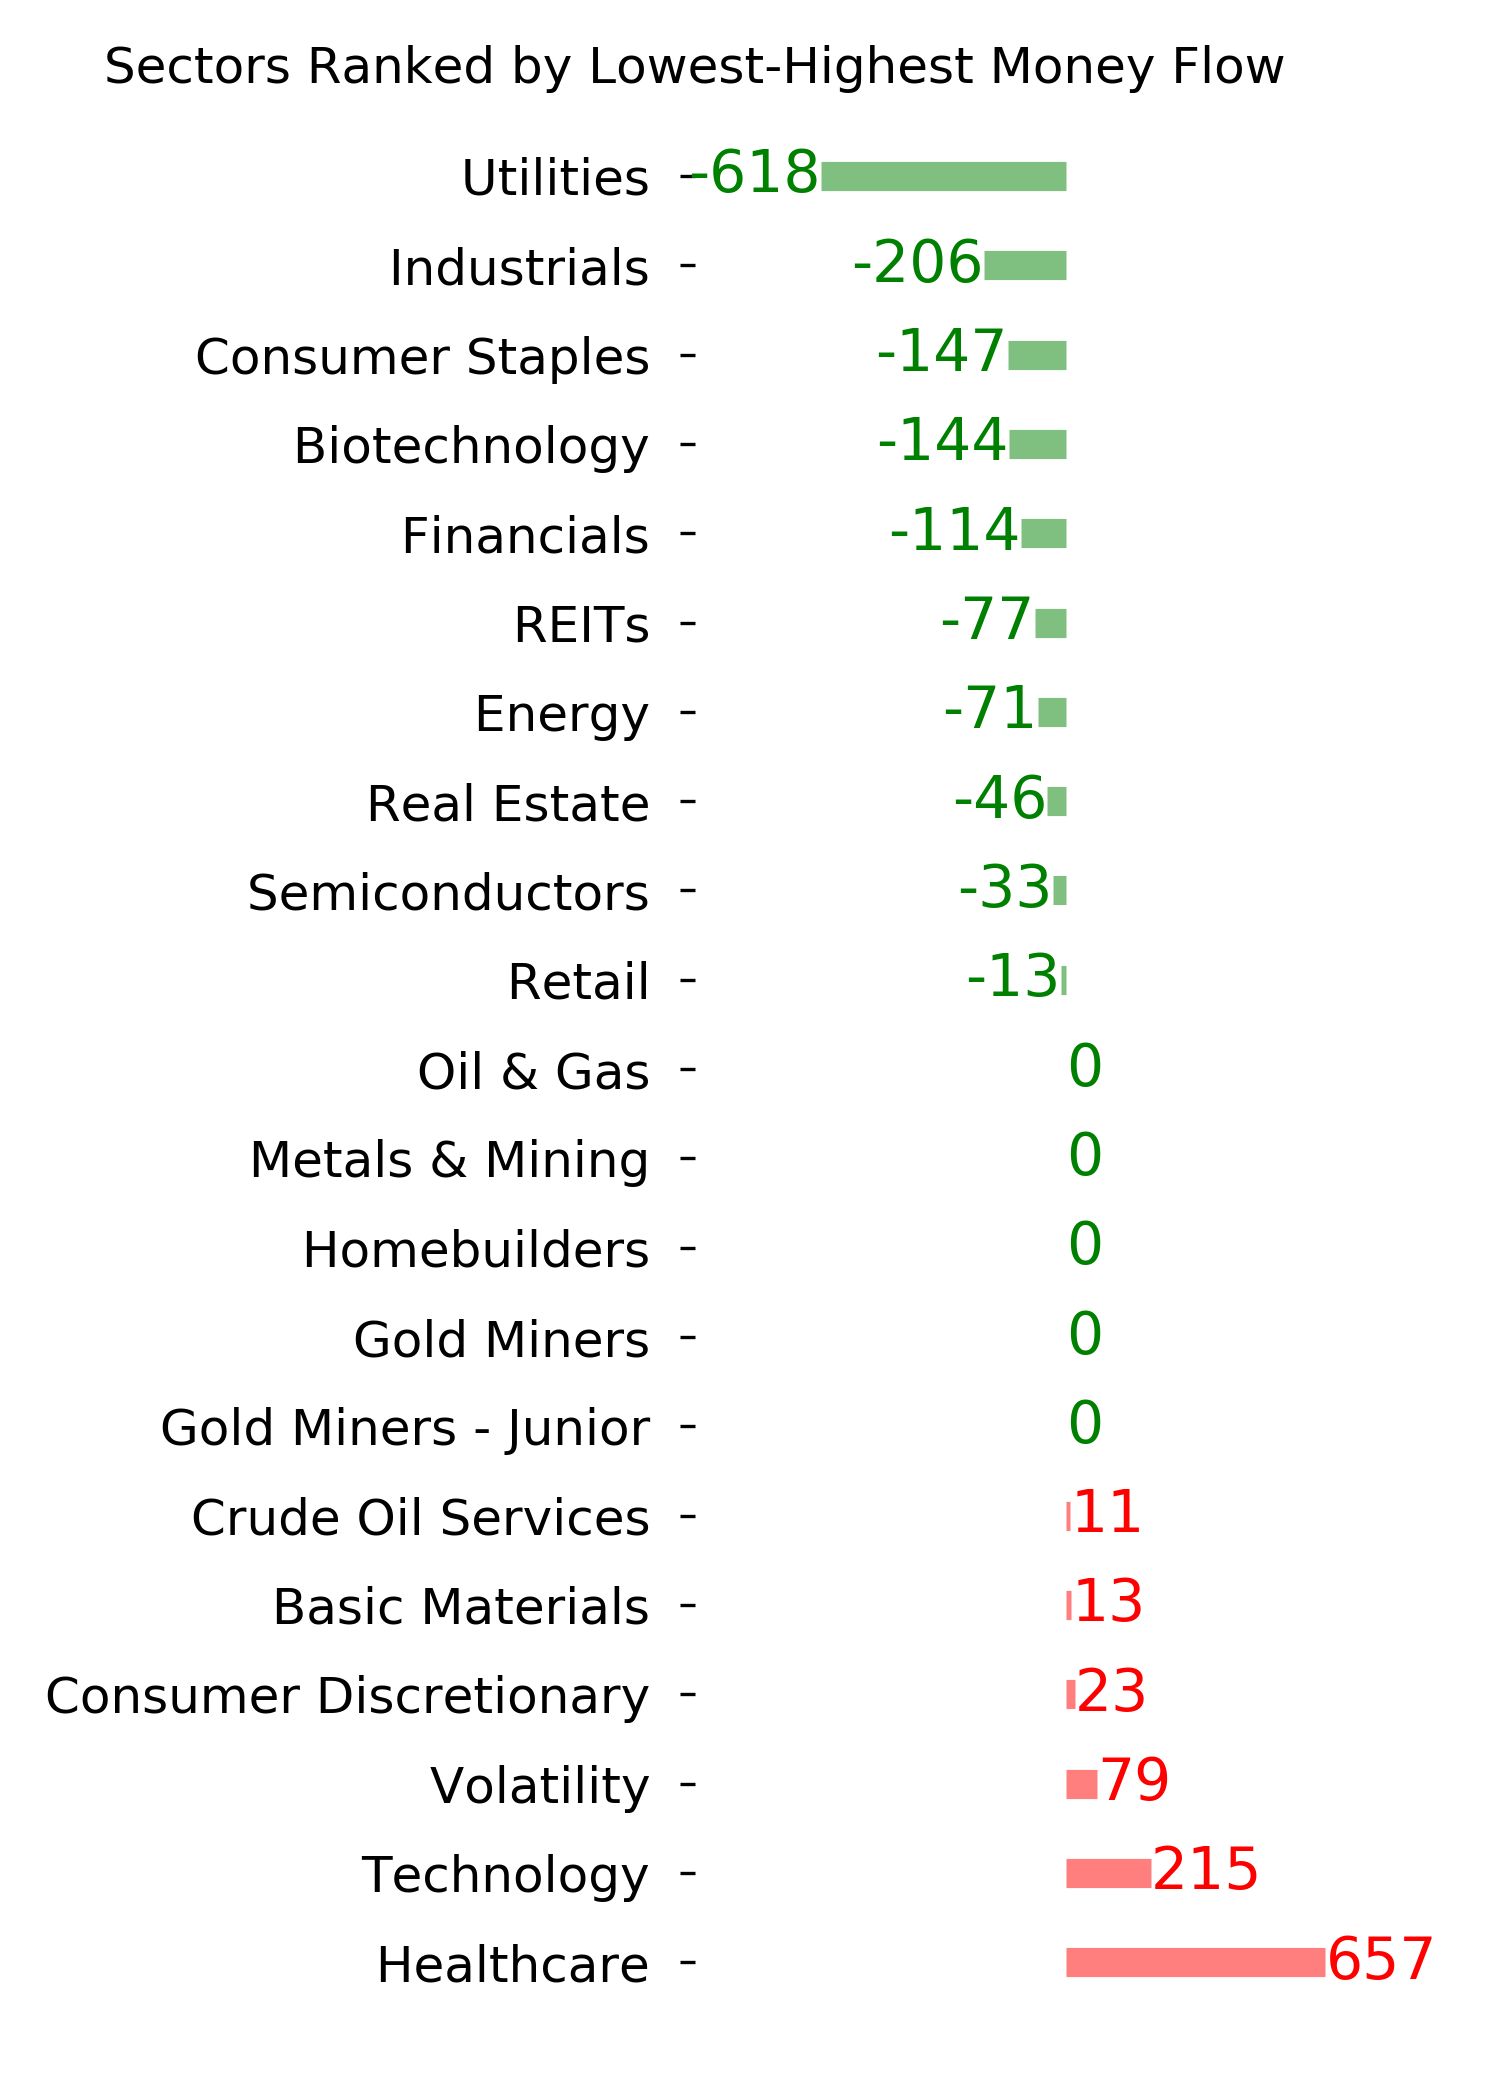
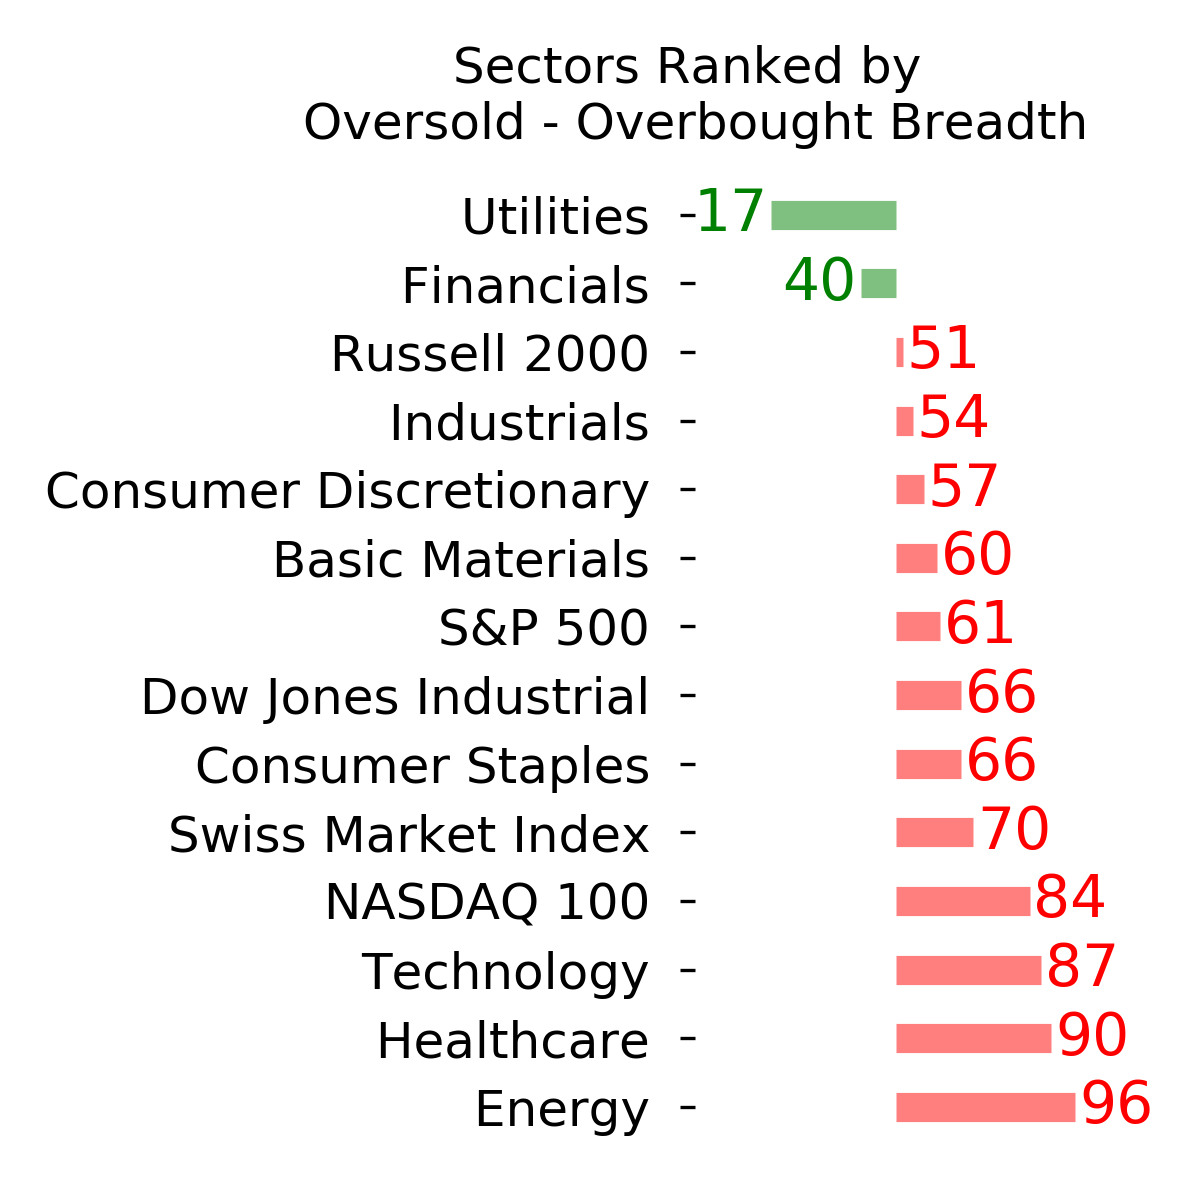
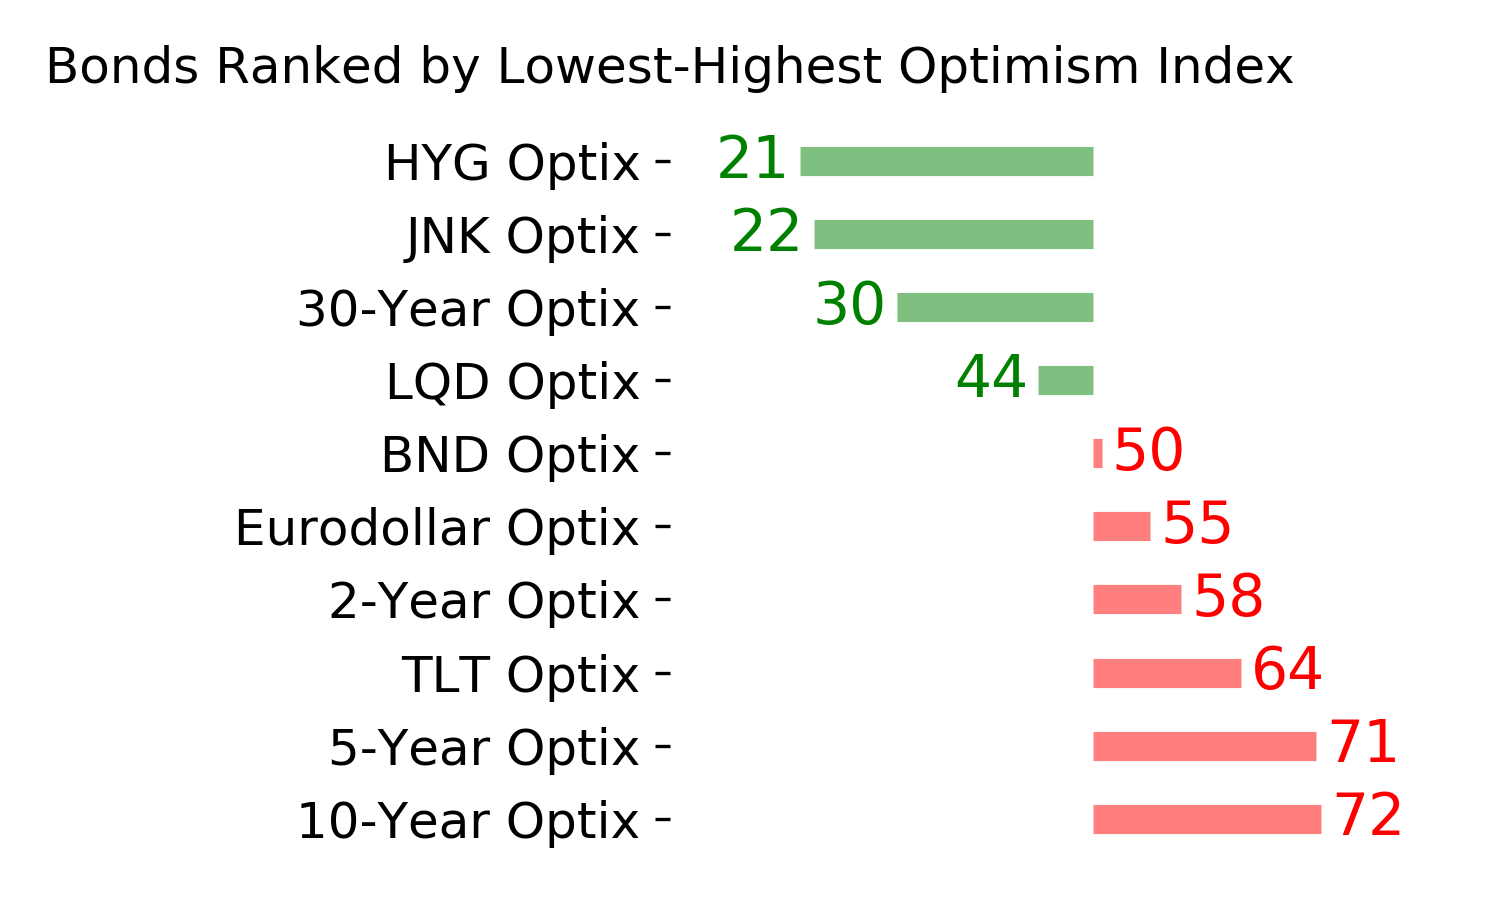
Ranks
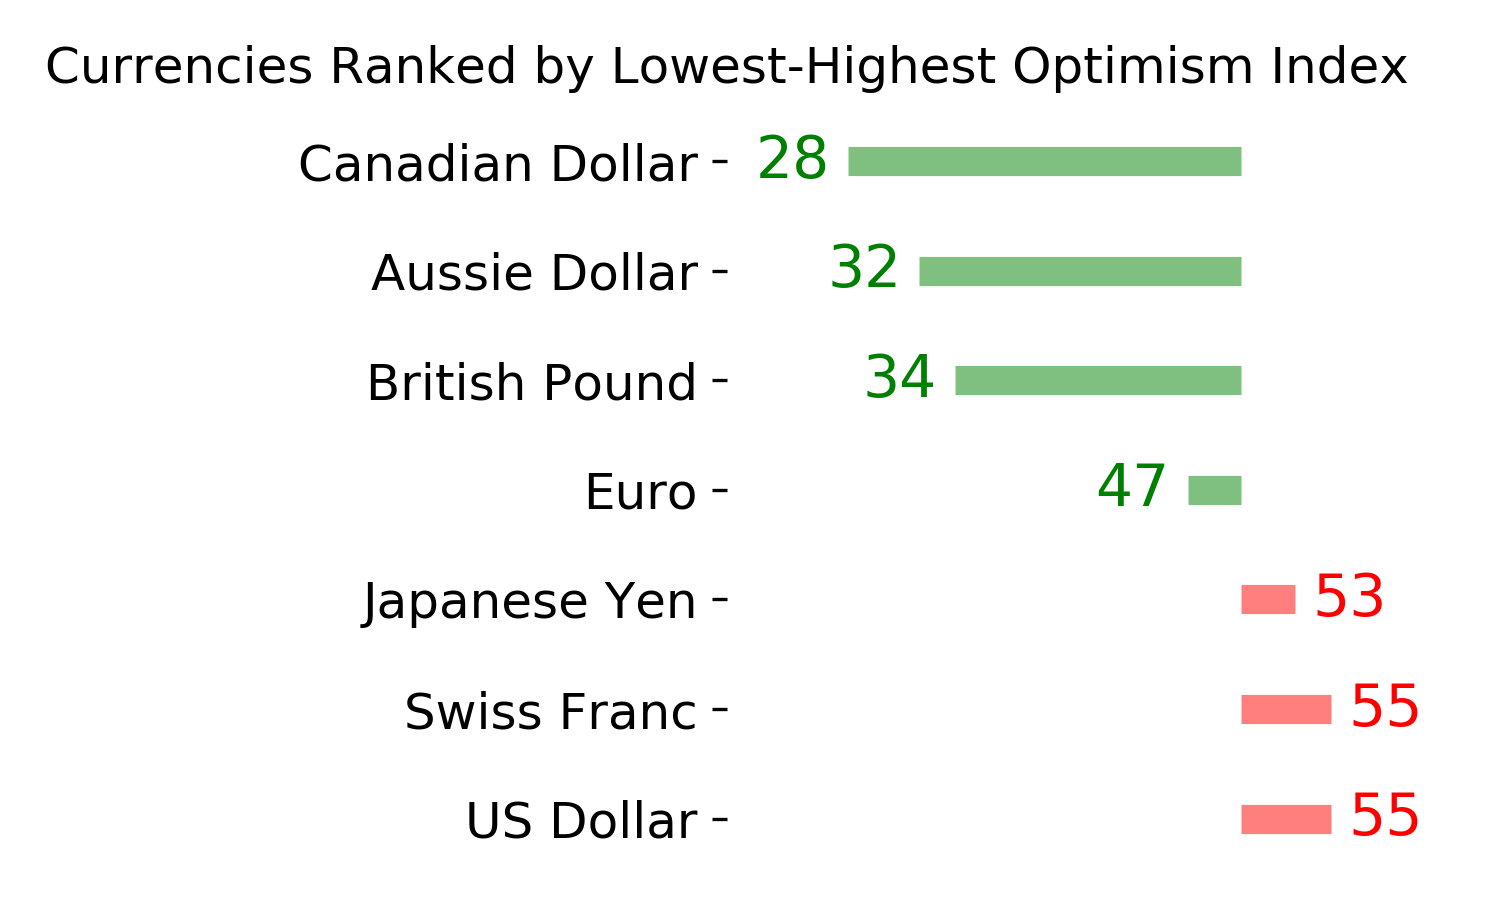
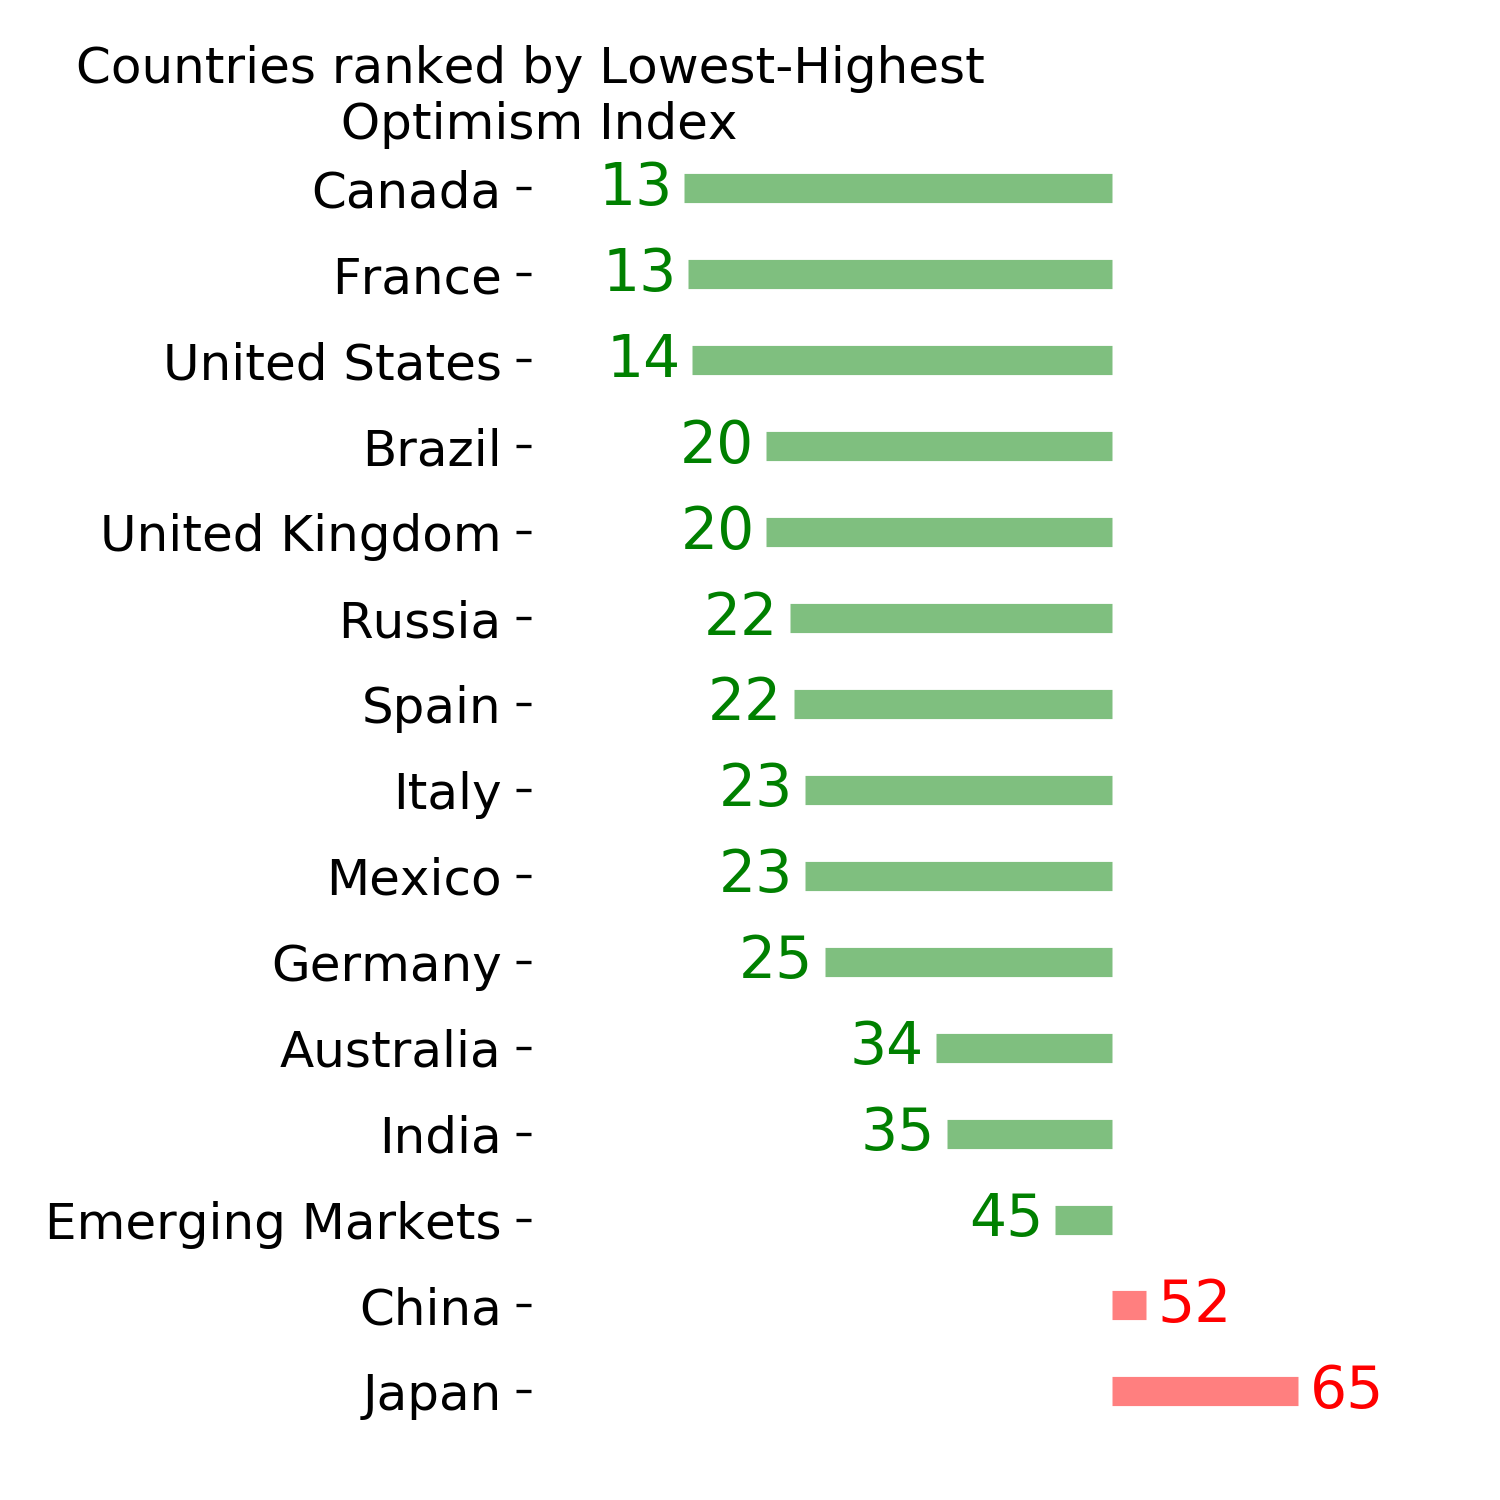
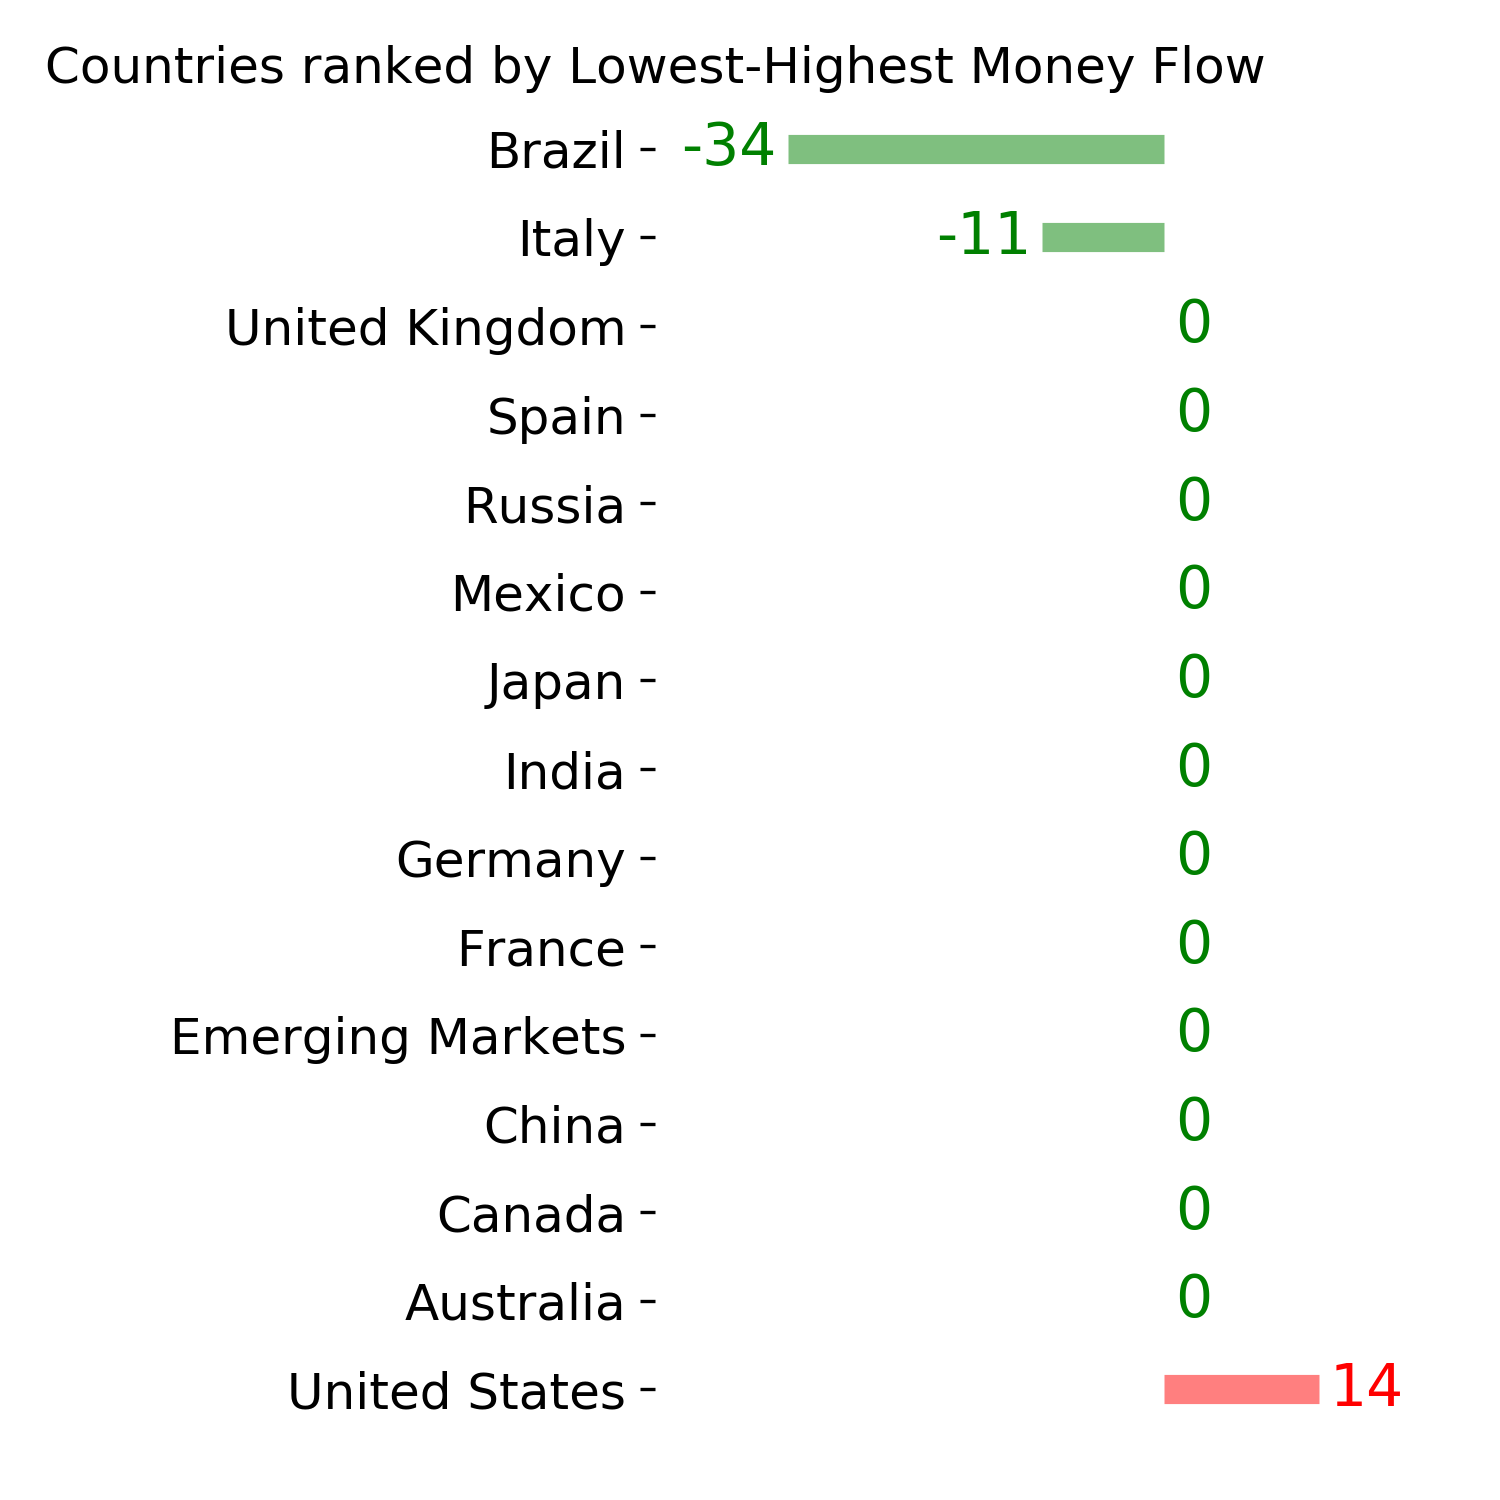
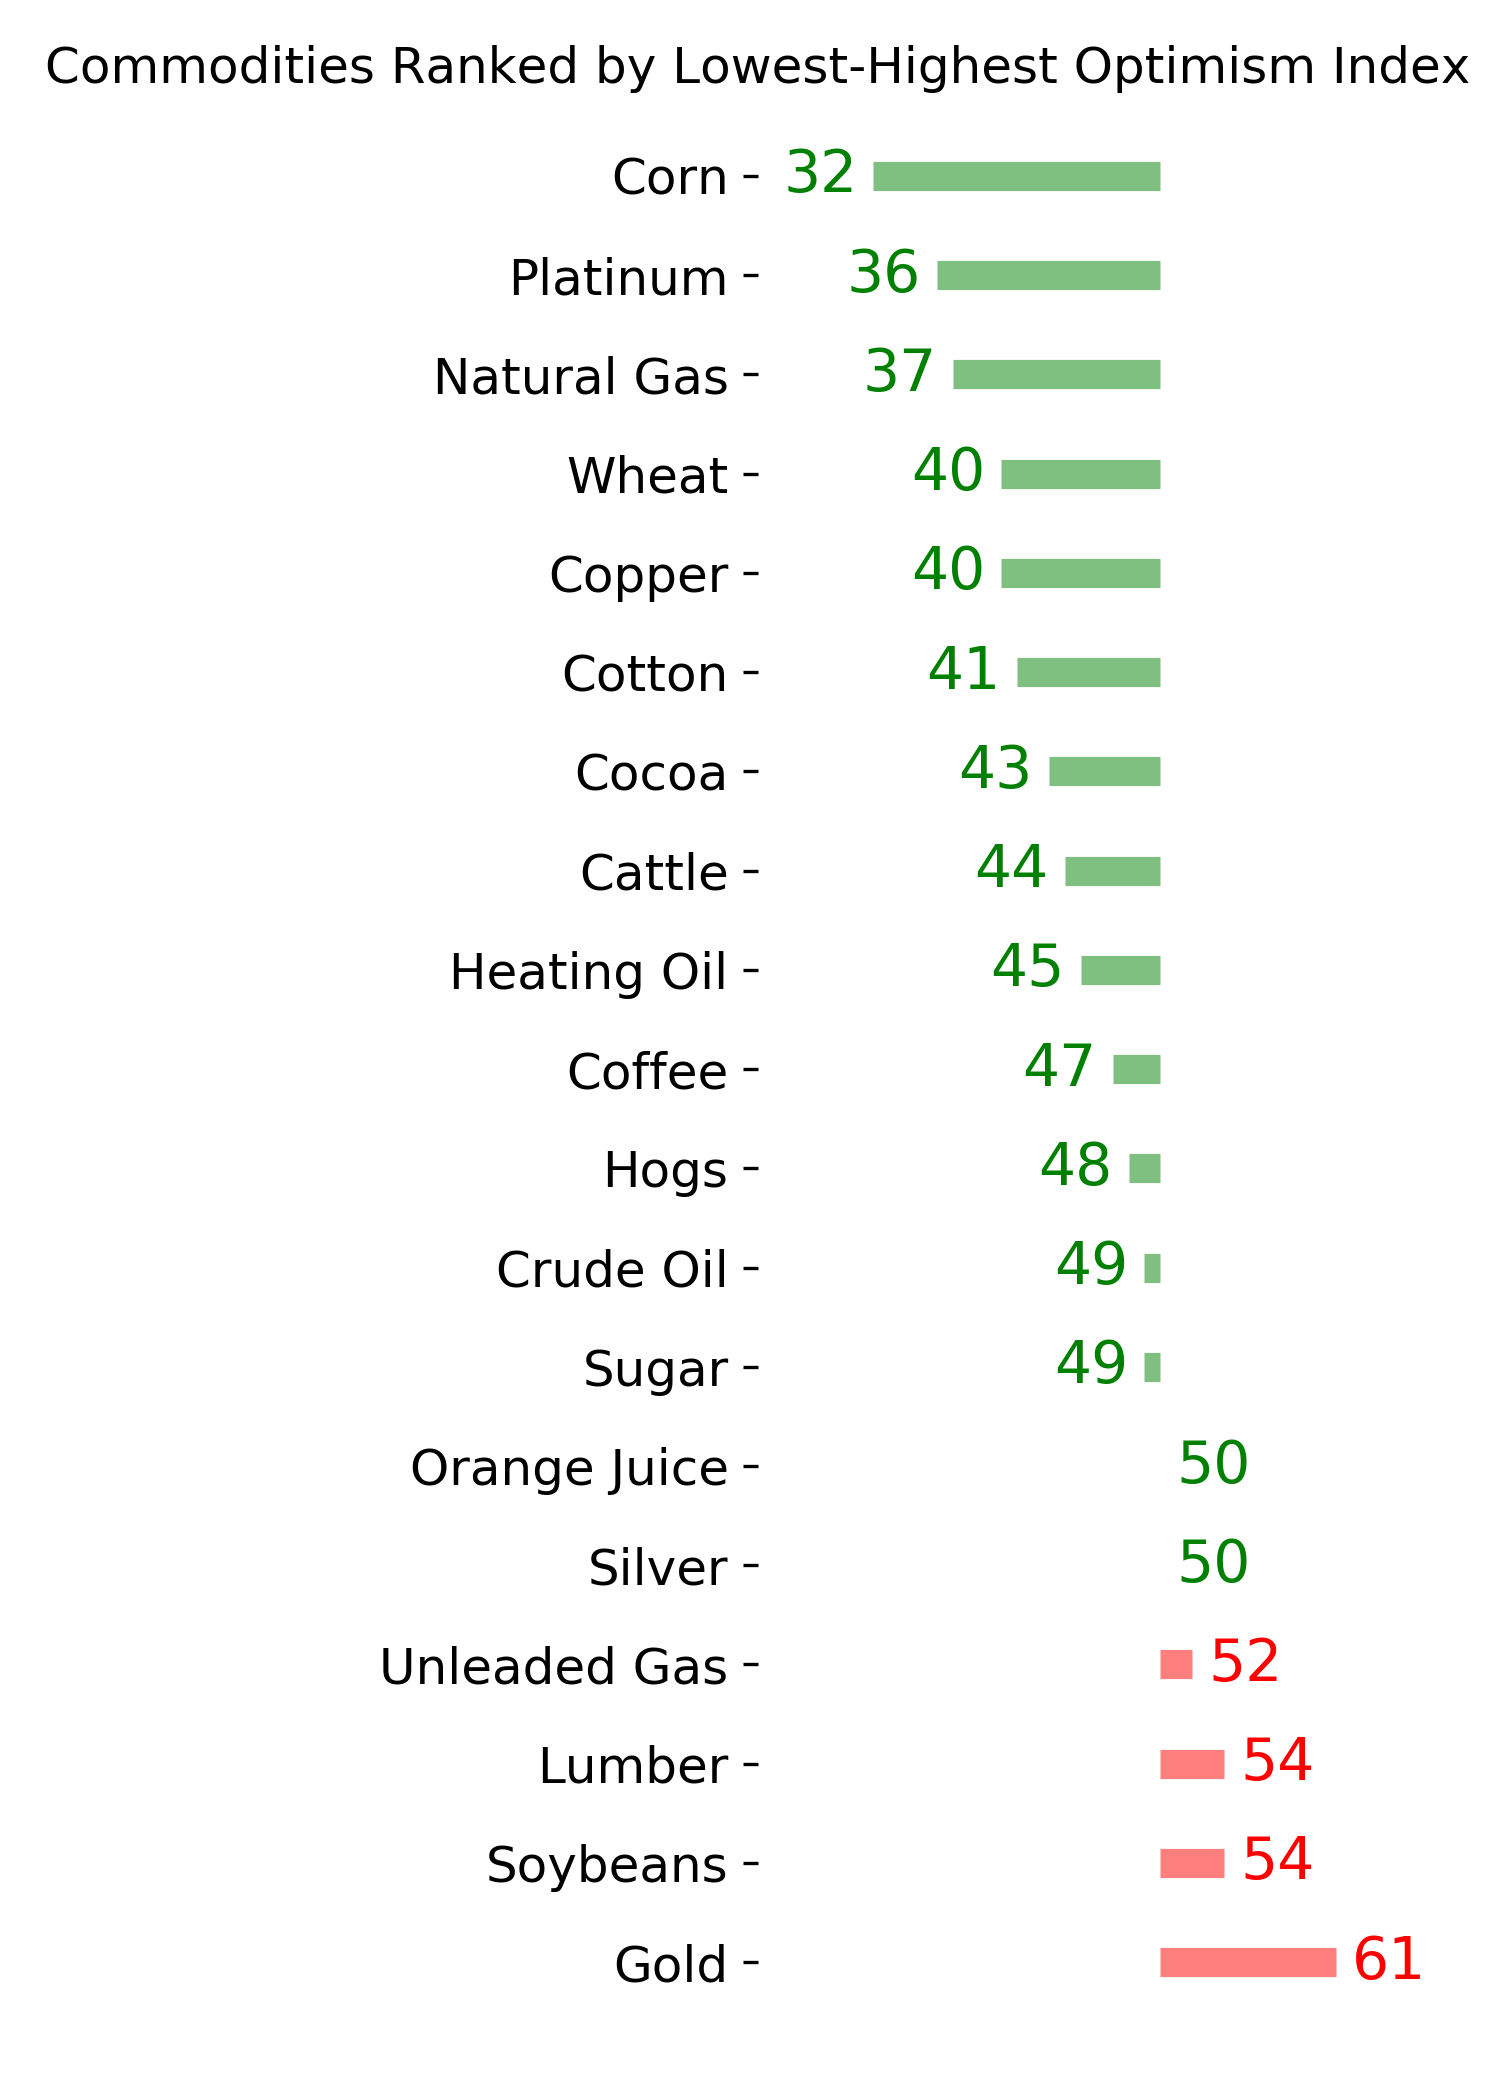
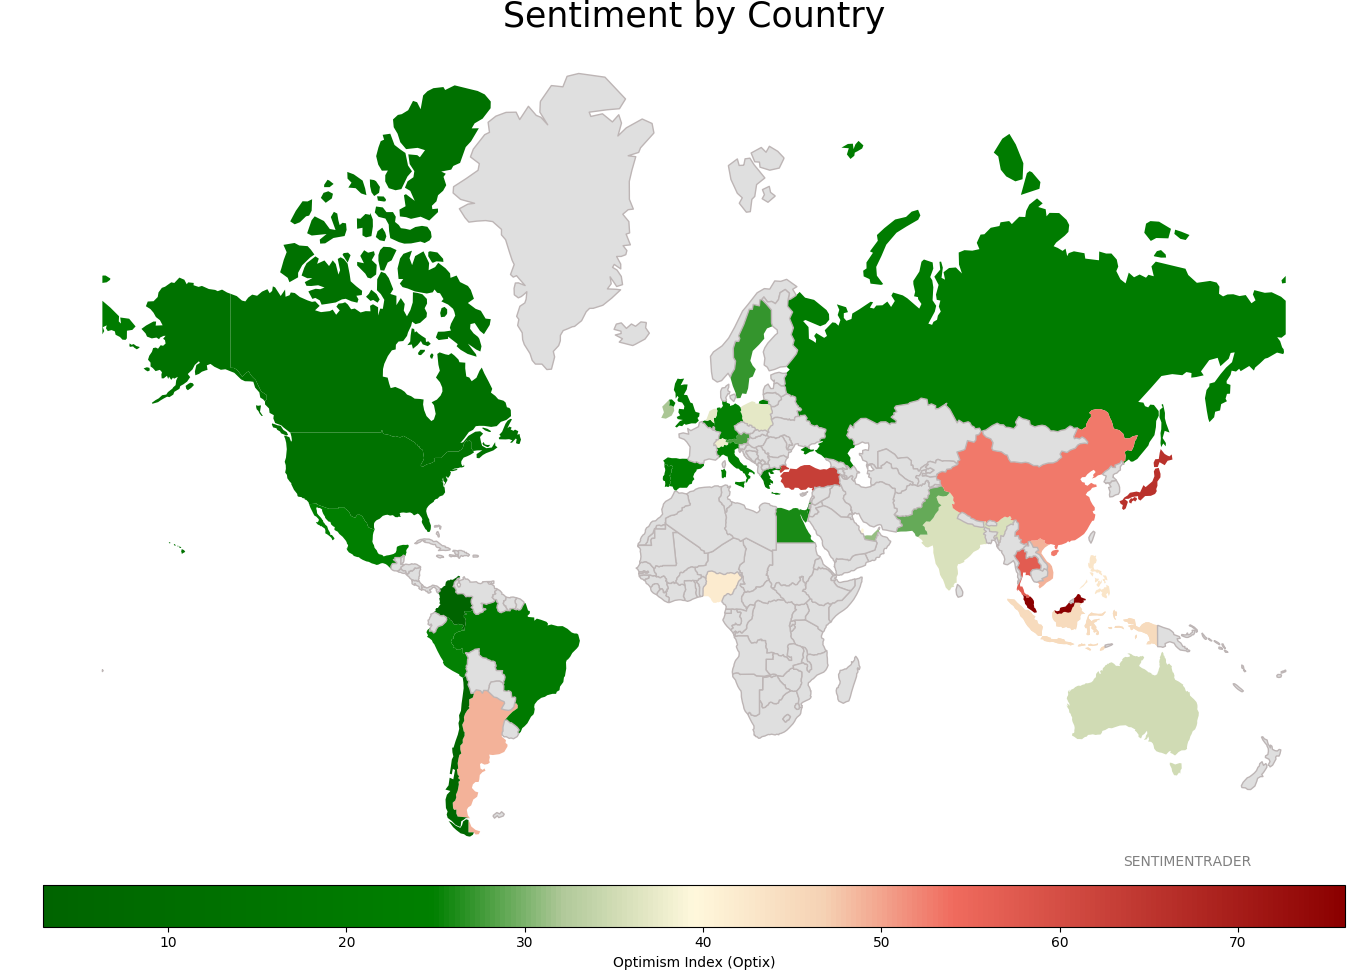
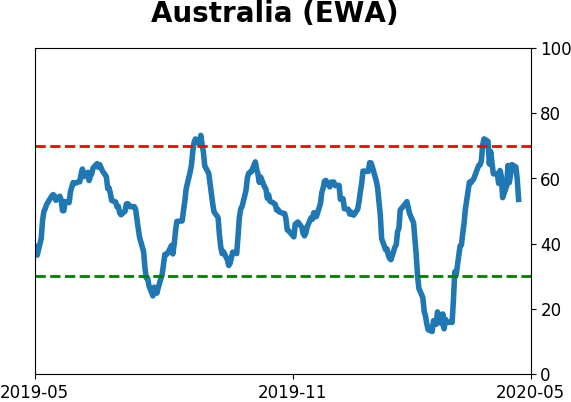
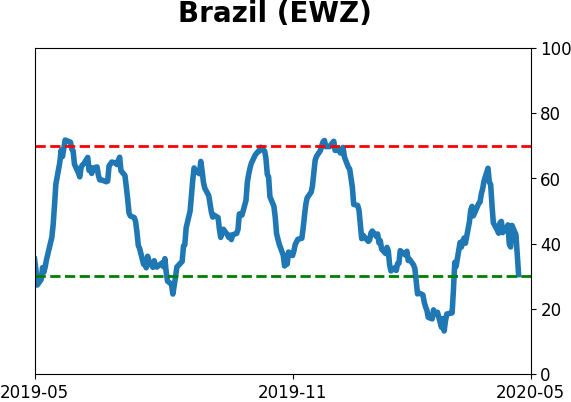
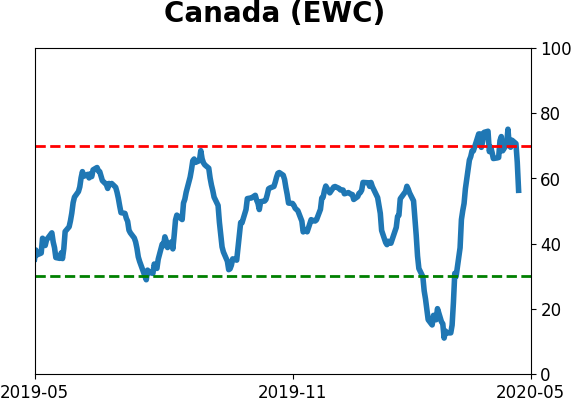
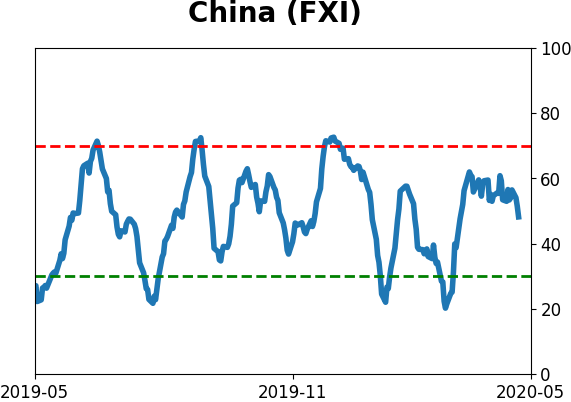
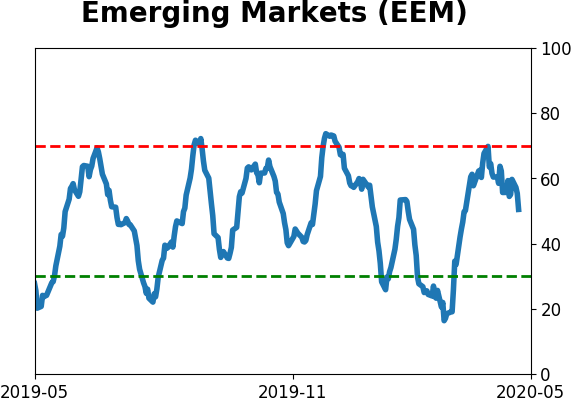
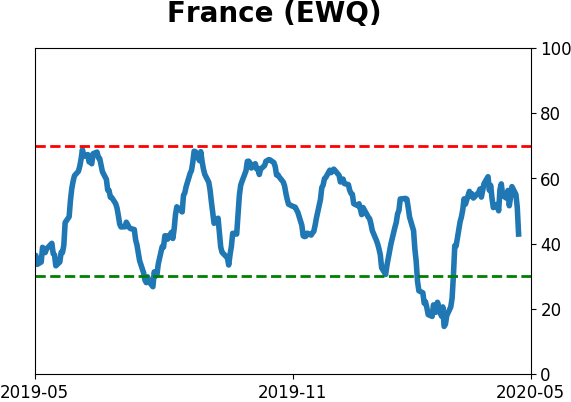
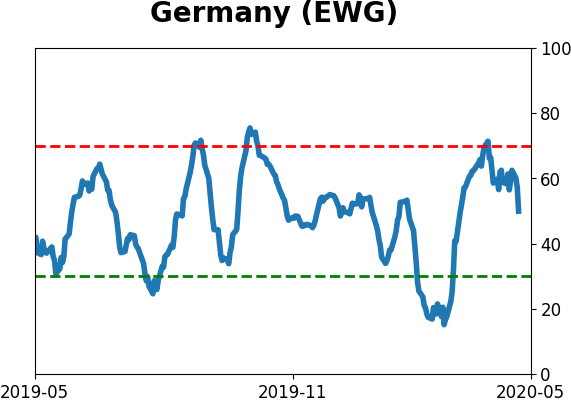
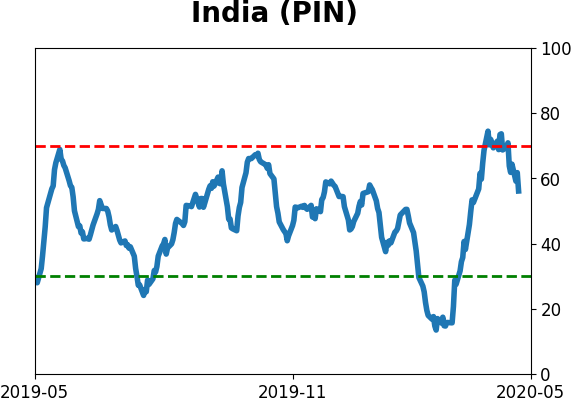
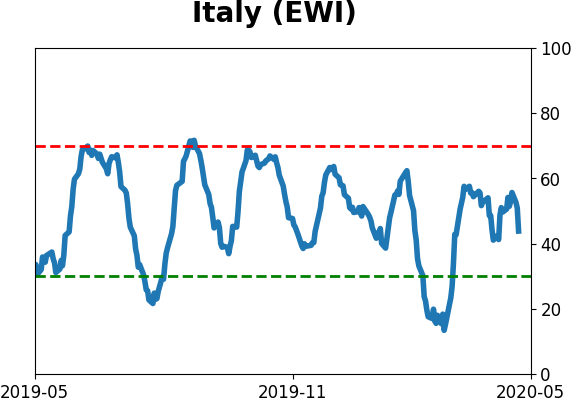
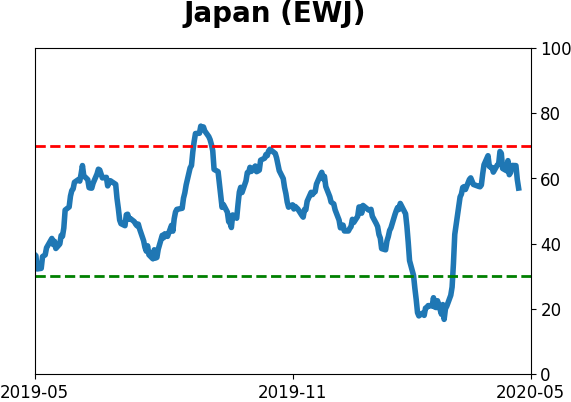
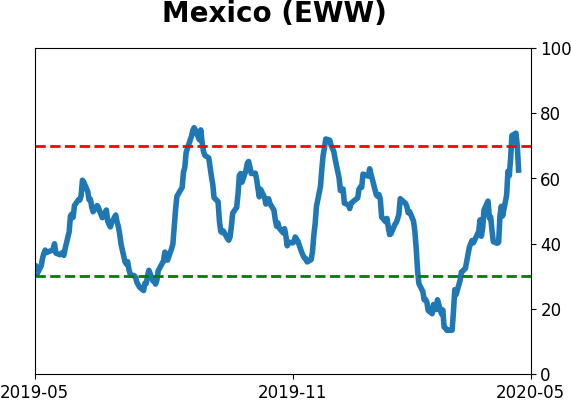
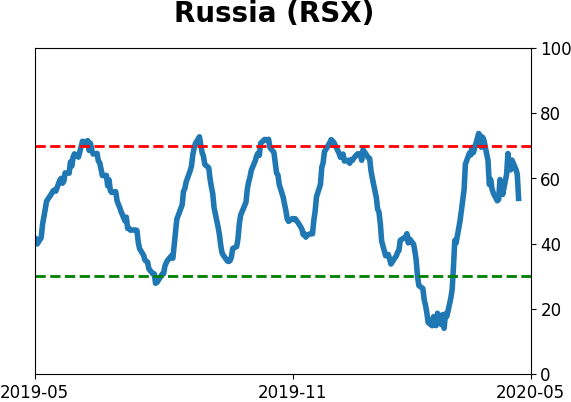
Sentiment Around The World
Optimism Index Thumbnails
|
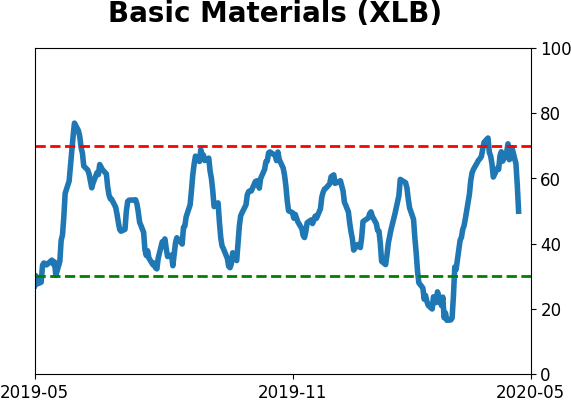
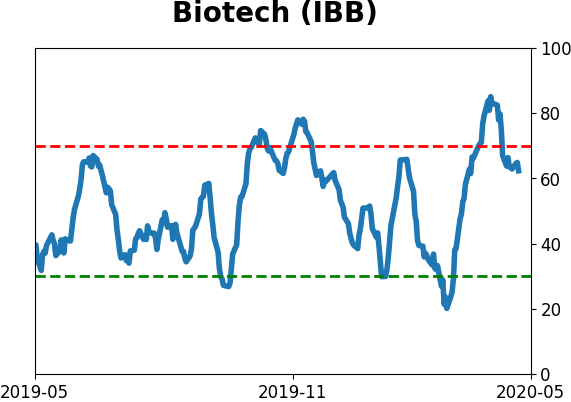
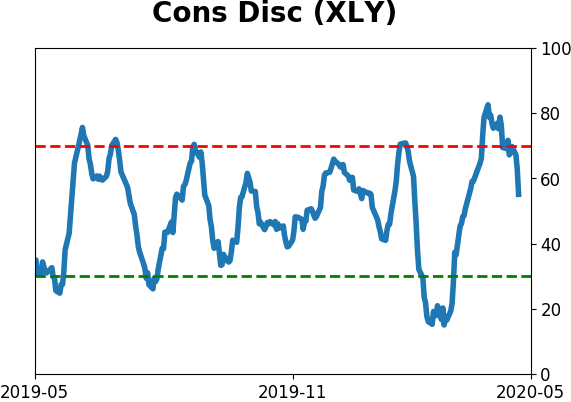
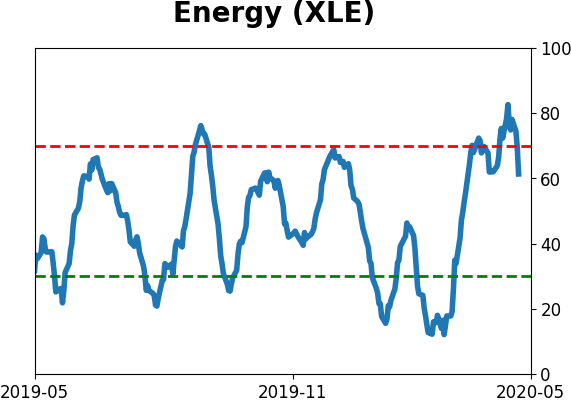
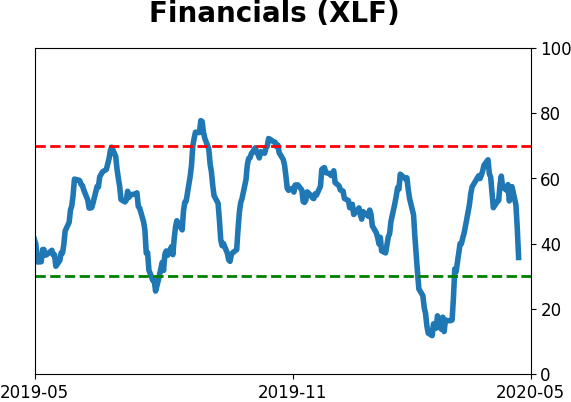
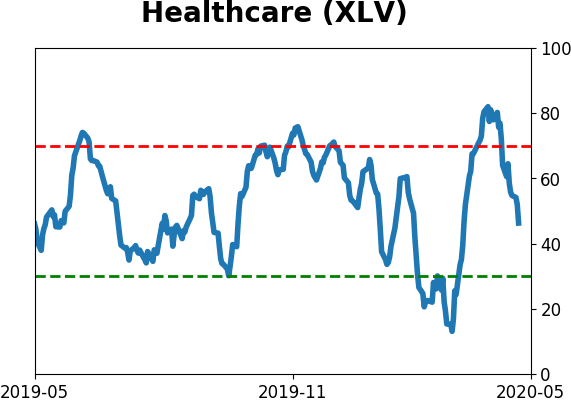
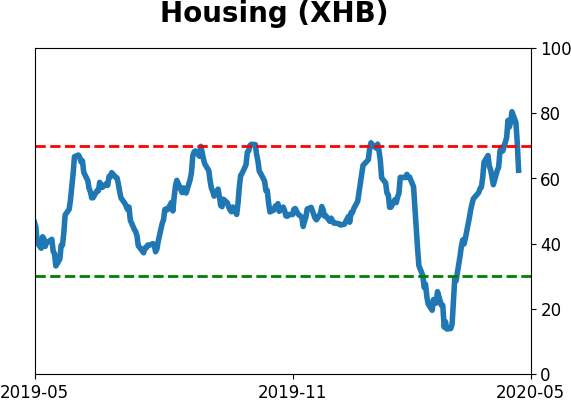
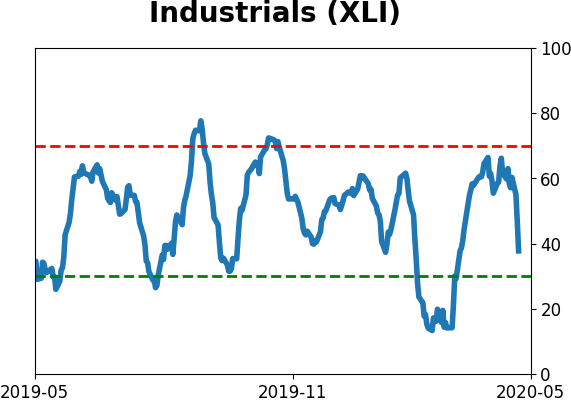
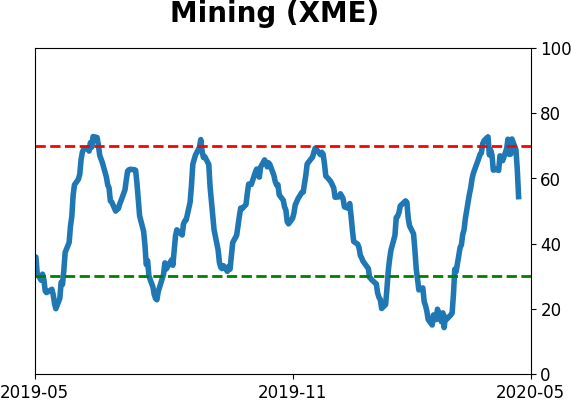
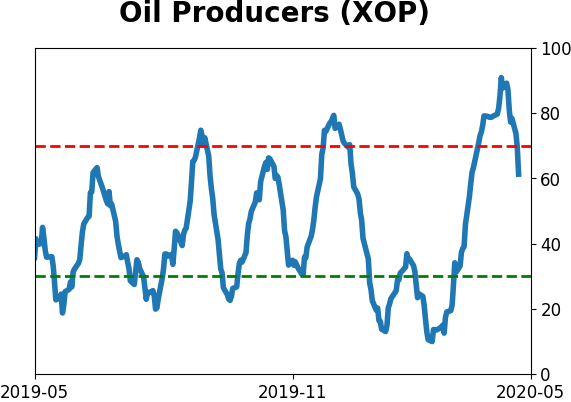
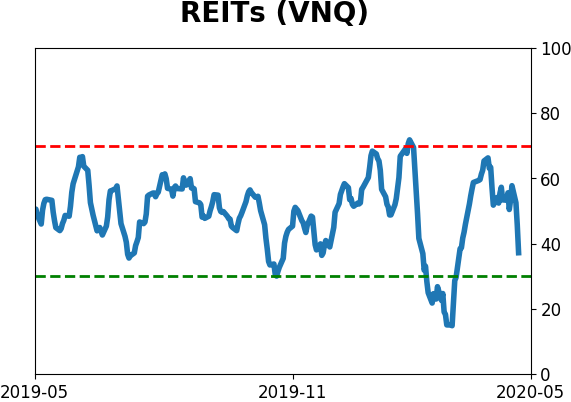
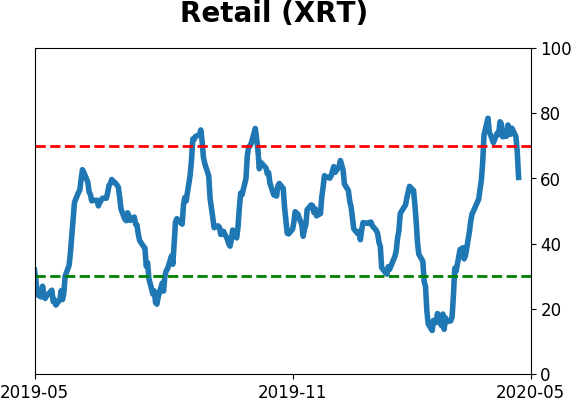
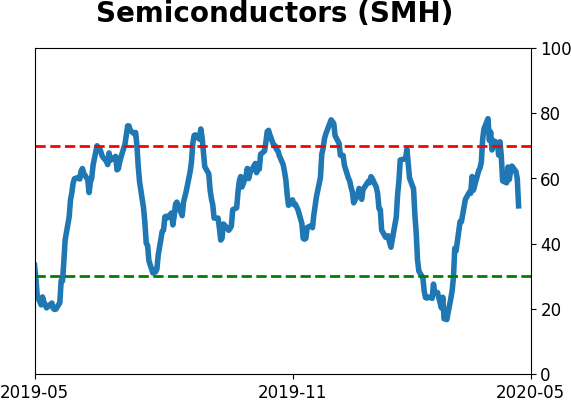
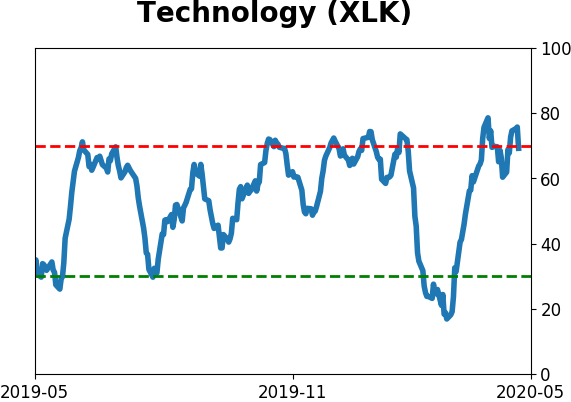
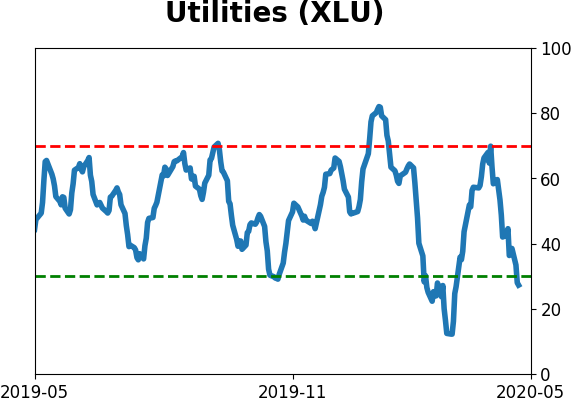
Sector ETF's - 10-Day Moving Average
|
|
|
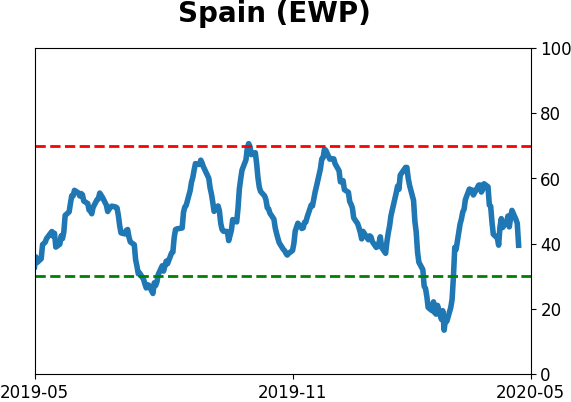
Country ETF's - 10-Day Moving Average
|
|
|
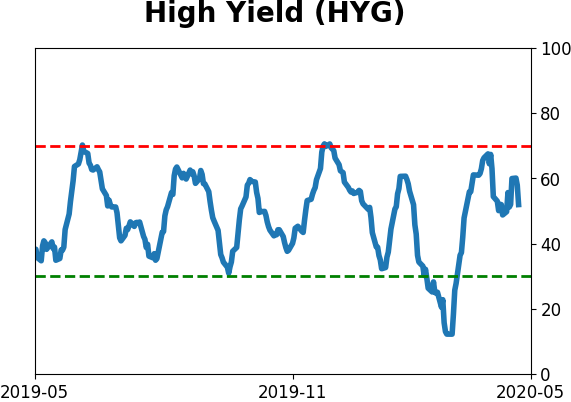
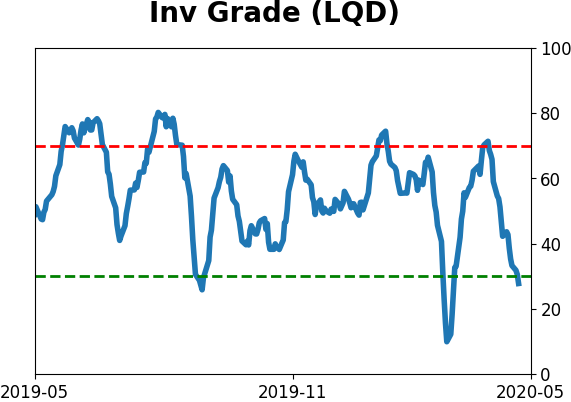
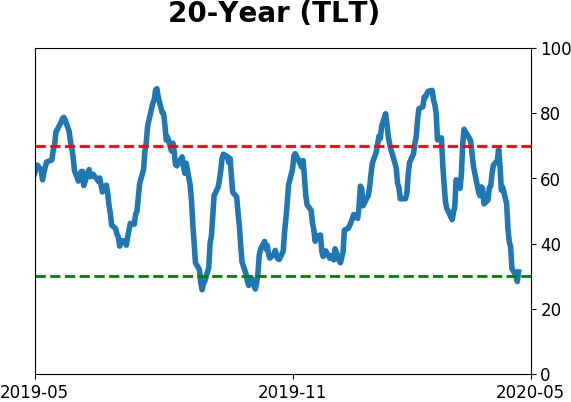
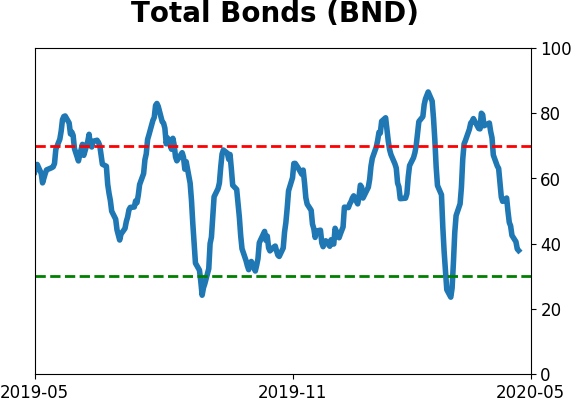
Bond ETF's - 10-Day Moving Average
|
|
|
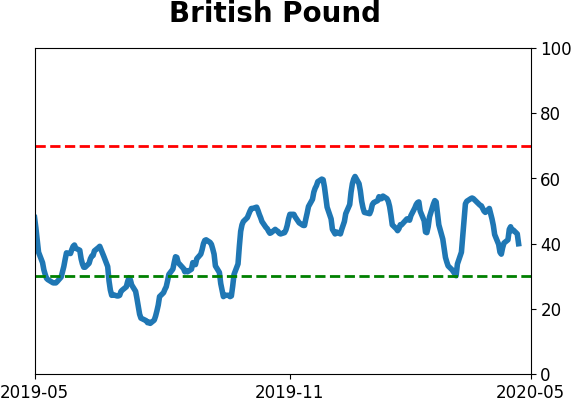
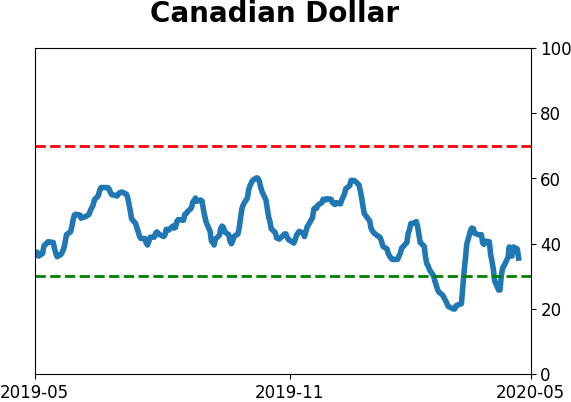
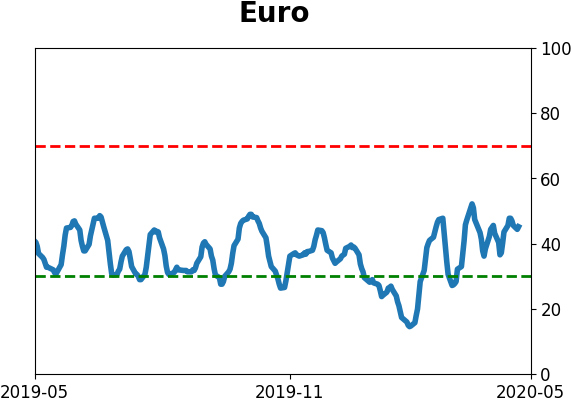
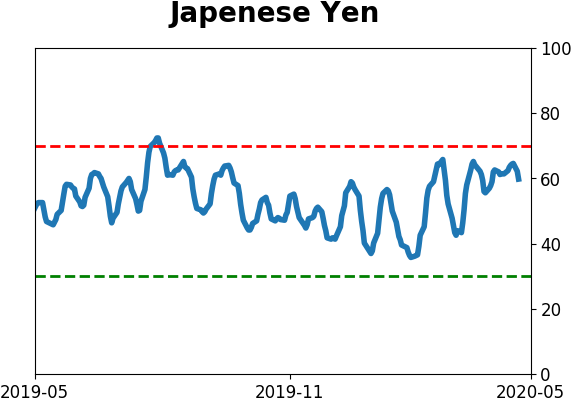
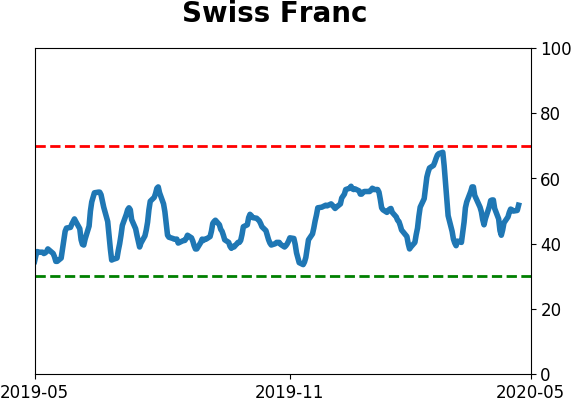
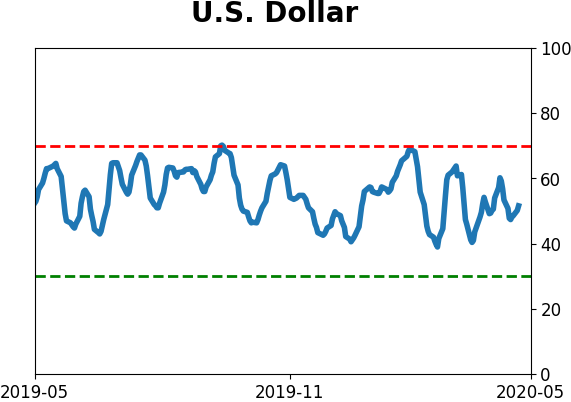
Currency ETF's - 5-Day Moving Average
|
|
|
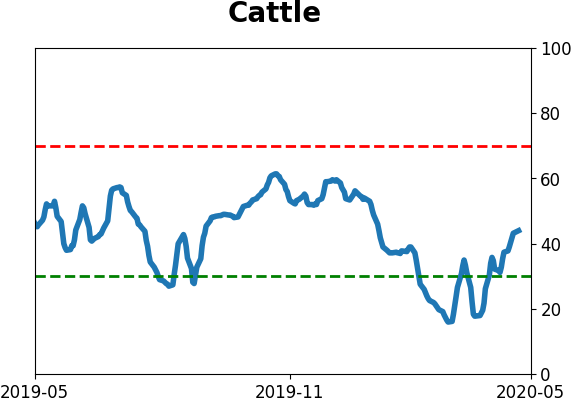
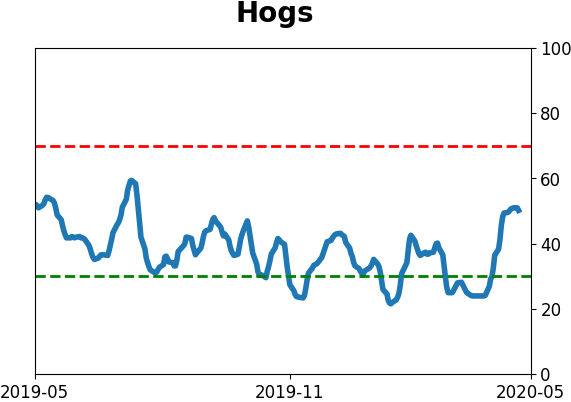
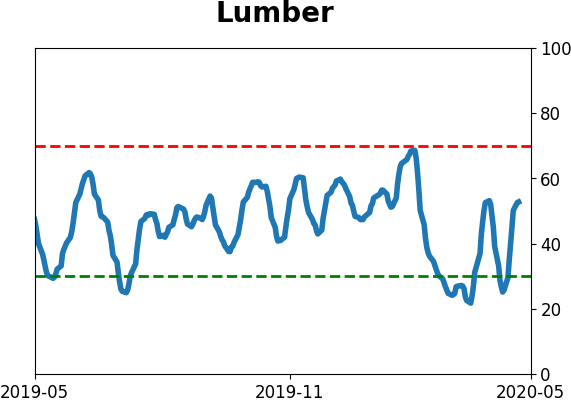
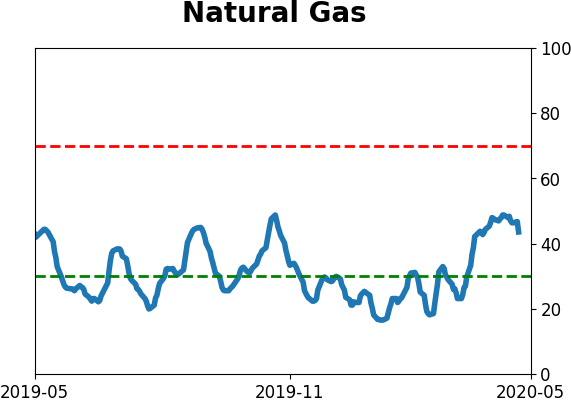
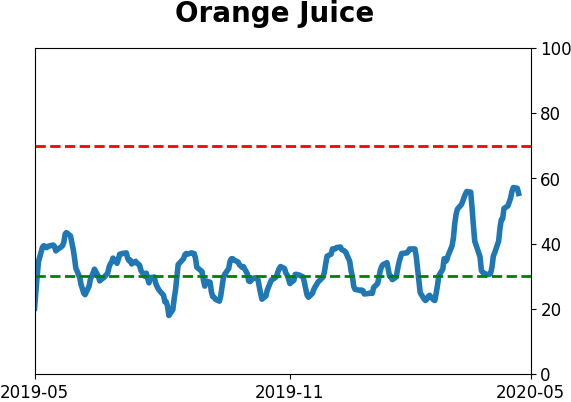
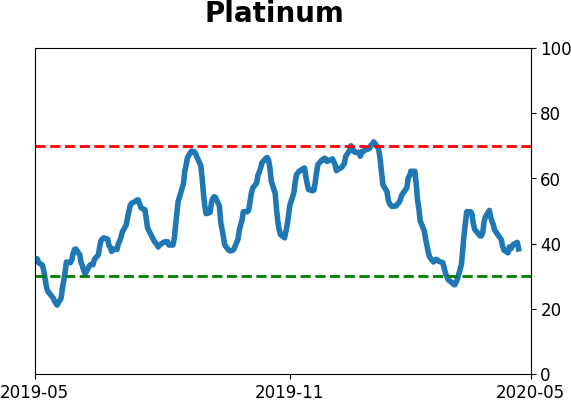
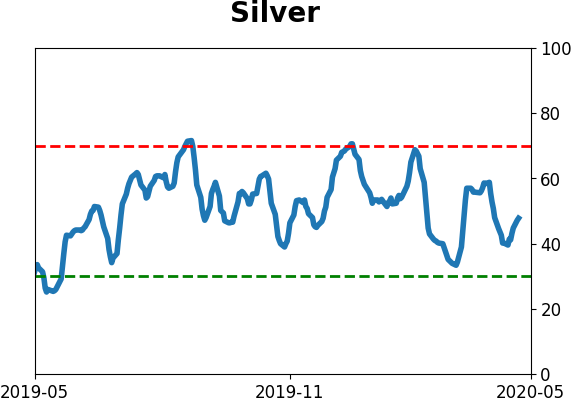
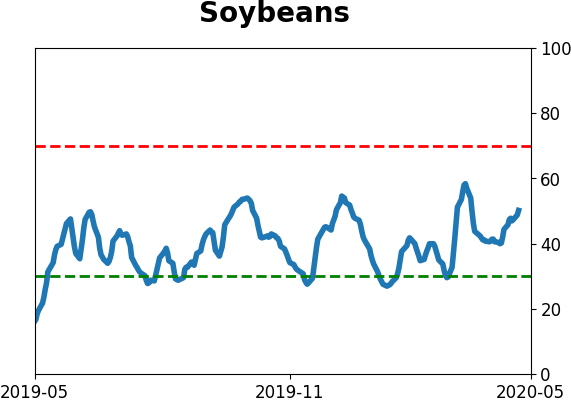
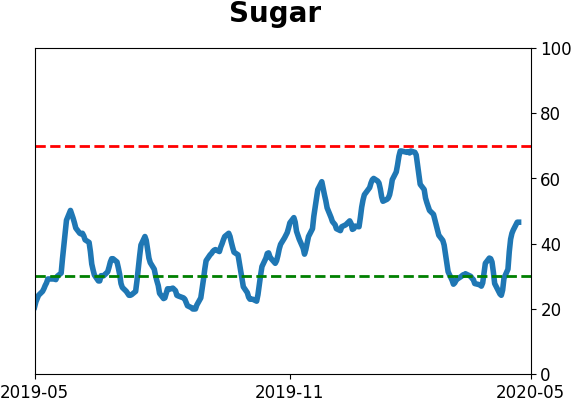
Commodity ETF's - 5-Day Moving Average
|
|