Daily Report : TradingEdge Weekly for May 10 - Bullish consumers, impressive thrusts, surging utilities

| View/Print a PDF version of this Report |
Headlines
|
TradingEdge Weekly for May 10 - Bullish consumers, impressive thrusts, surging utilities: This week, we saw that stocks have seen an impressive run, with a thrust in the number of advancing versus declining stocks. It's no surprise that investors and consumers have seen this and are feeling highly optimistic. Economic surprises are turning negative, and utilities have been outperforming - odd to see during a bull run. |
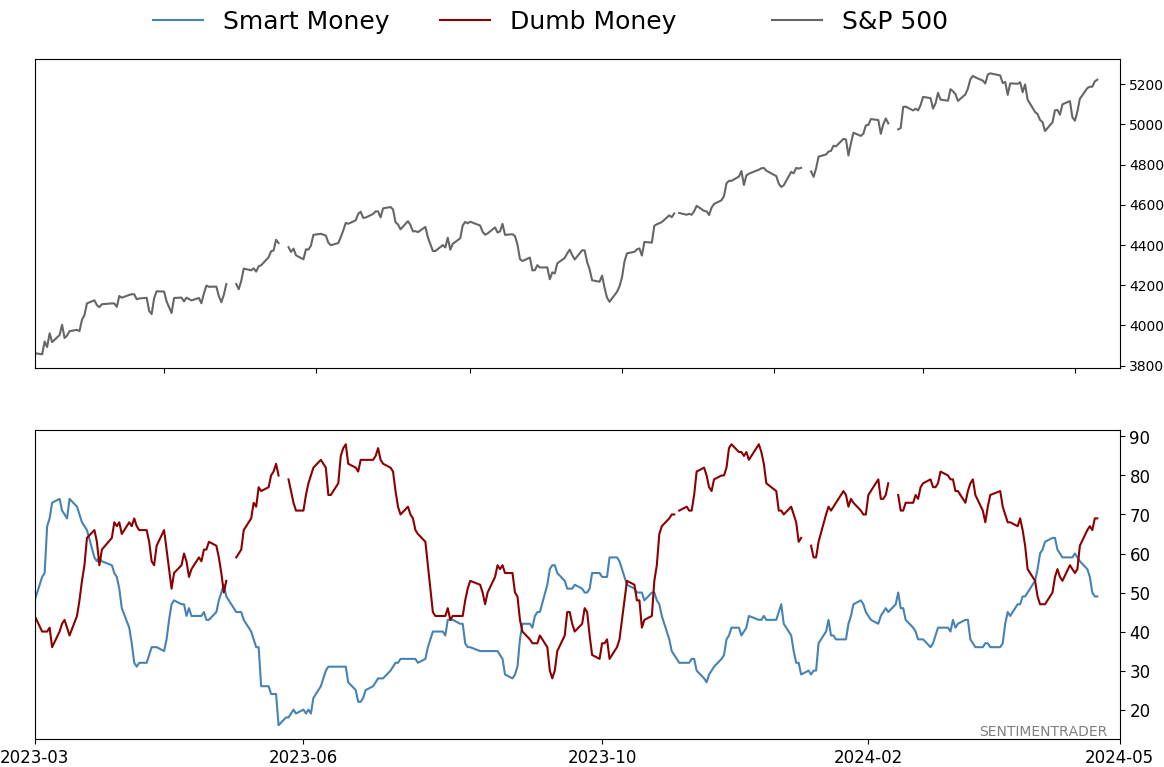
Smart / Dumb Money Confidence
|
|
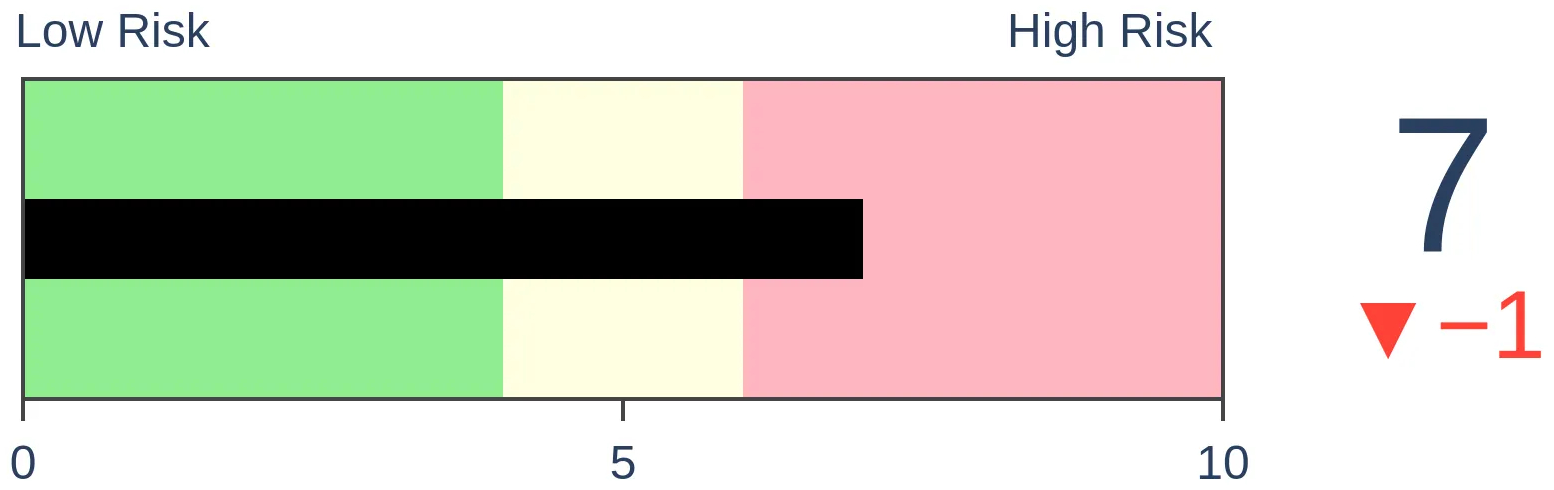
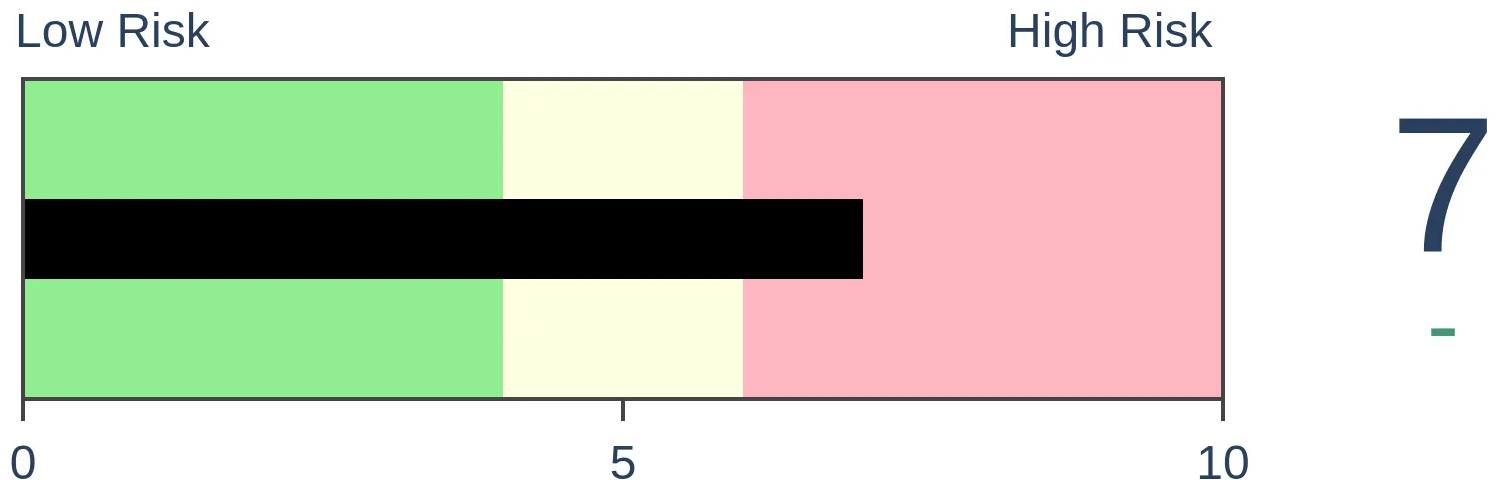
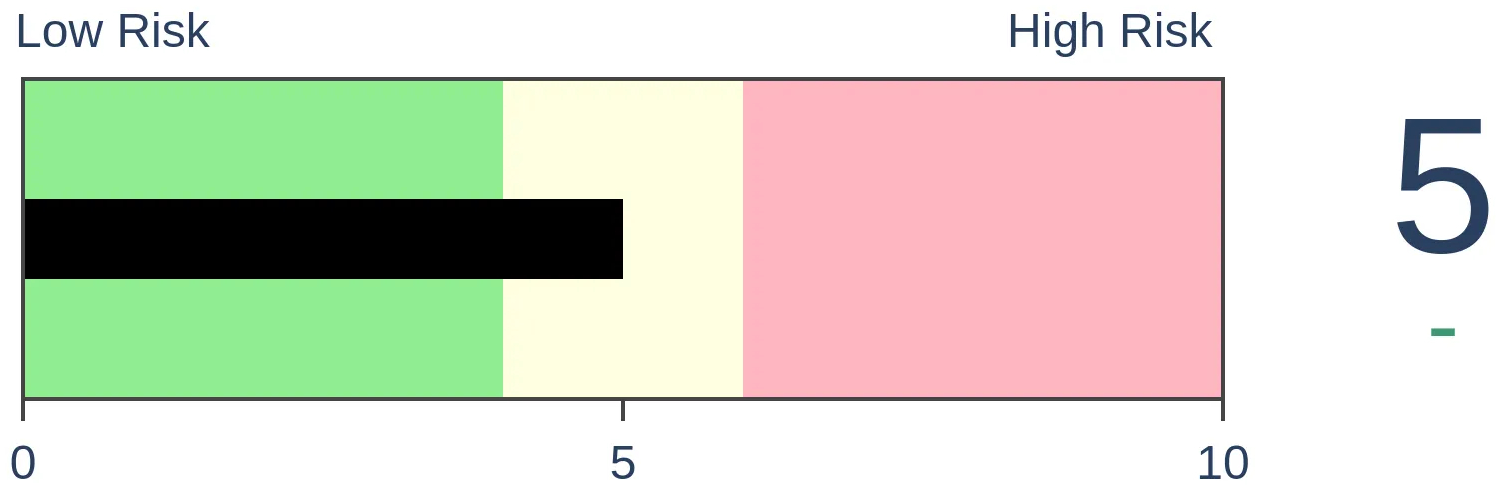
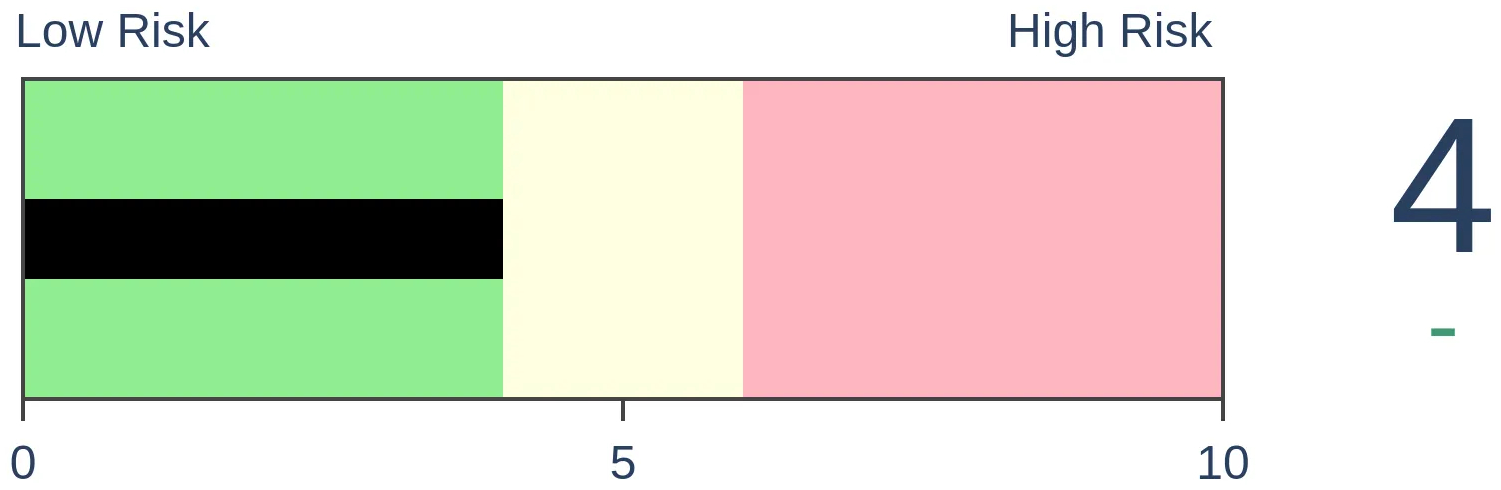
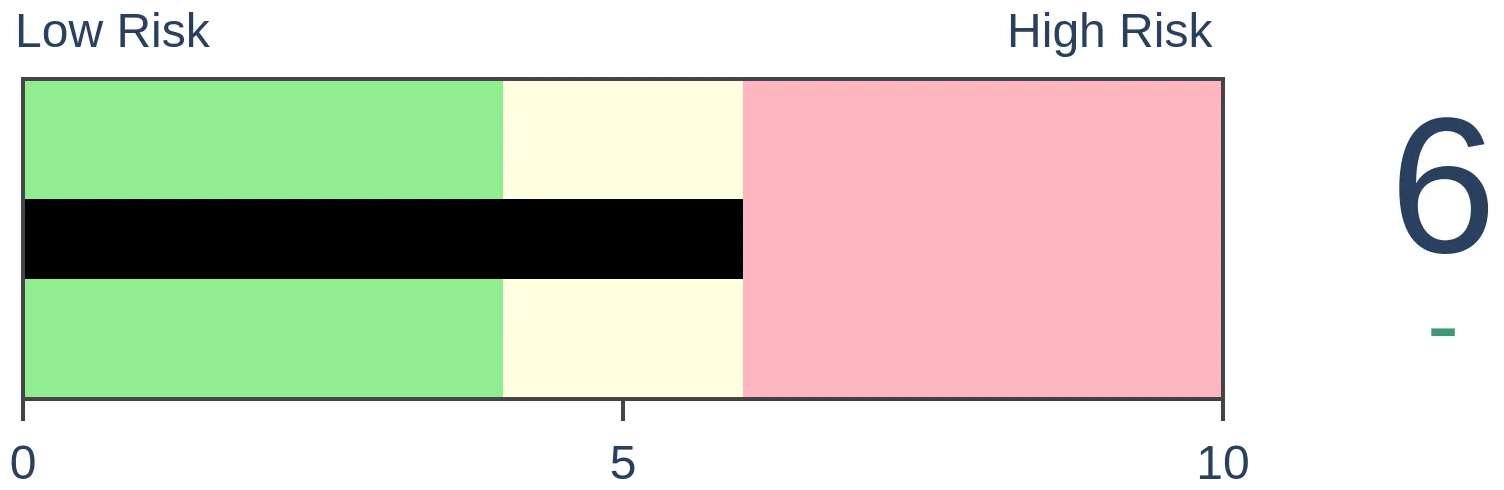
Risk Levels
|
|
|

Research
TradingEdge Weekly for May 10 - Bullish consumers, impressive thrusts, surging utilitiesBy Jason GoepfertBOTTOM LINEThis week, we saw that stocks have seen an impressive run, with a thrust in the number of advancing versus declining stocks. It's no surprise that investors and consumers have seen this and are feeling highly optimistic. Economic surprises are turning negative, and utilities have been outperforming - odd to see during a bull run. FORECAST / TIMEFRAME |
Key points:
- Consumers are uber bullish on U.S. stocks
- Those stocks have been doing well, with an impressive 3-day thrust
- While impressive, the thrust was quite enough to be considered "official"
- Traders are still showing some anxiety via the options market
- Among big tech stocks, anxiety has been relieved somewhat
- Economic surprises are turning negative after being very positive
- Utilities have handily outperformed the market
- The Hang Seng is showing signs of ending a long bear market
- A risky time for biotech bears
Consumers are allocating more to stocks
After a brutal 2022, optimism has returned among investors and has even spread more widely to general consumers in the U.S. Pretty much everyone is now aware of how strong stocks have been.
Combining three major surveys of investor and consumer asset allocations shows that sentiment ranks among the highest in decades (especially the past two) as of the end of April.
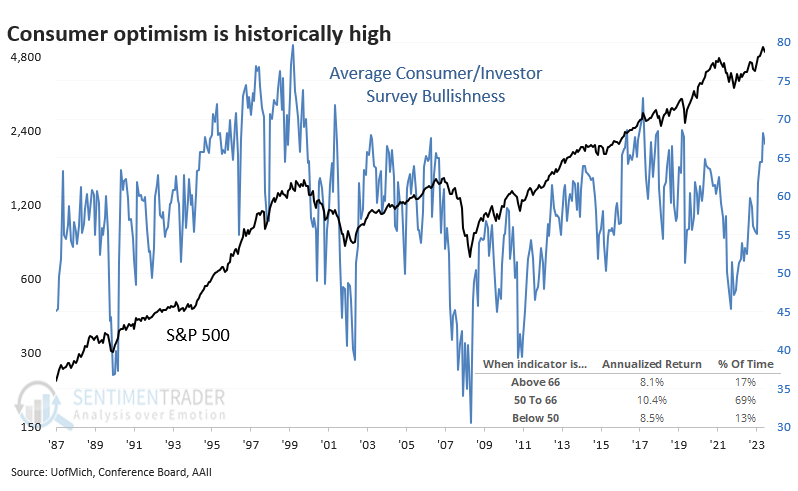
We can see from the chart that when sentiment has been low, the S&P 500's annualized returns have been +8.5%, versus +10.4% when it was neutral. And its returns were a bit worse, at +8.1%, when it was historically high. It's not a drastic difference.
It can be helpful to add context to the current level of optimism about stocks' future returns, and that context is that sentiment emerged from woeful pessimism a couple of years ago. The table below shows the other times sentiment cycled from extreme to extreme. As always, we have to be cautious about minuscule sample sizes, but it helps that the results were consistent.
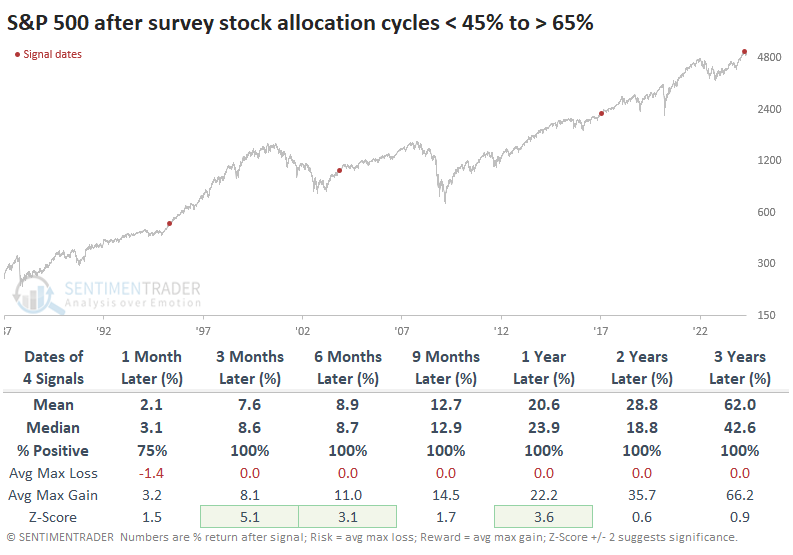
The consistency is especially acute when looking at the table of maximum gains and declines across time frames. This uses monthly closing prices, so intra-month drawdowns are not considered. After these cycles, there was a whole lot of reward and essentially no risk.
Three-day thrust
Over three sessions, advancing issues on the NYSE have significantly outpaced declining issues. Dean showed that similar advance-decline ratio skews preceded outstanding returns and win rates for the S&P 500.
For only the 32nd time since 1931, the NYSE advance-decline ratio exceeded a threshold of 3 to 1 for three consecutive trading sessions. Over 14 of them were triggered when the S&P 500 was above its 200-day moving average, highlighting the rarity of this event.
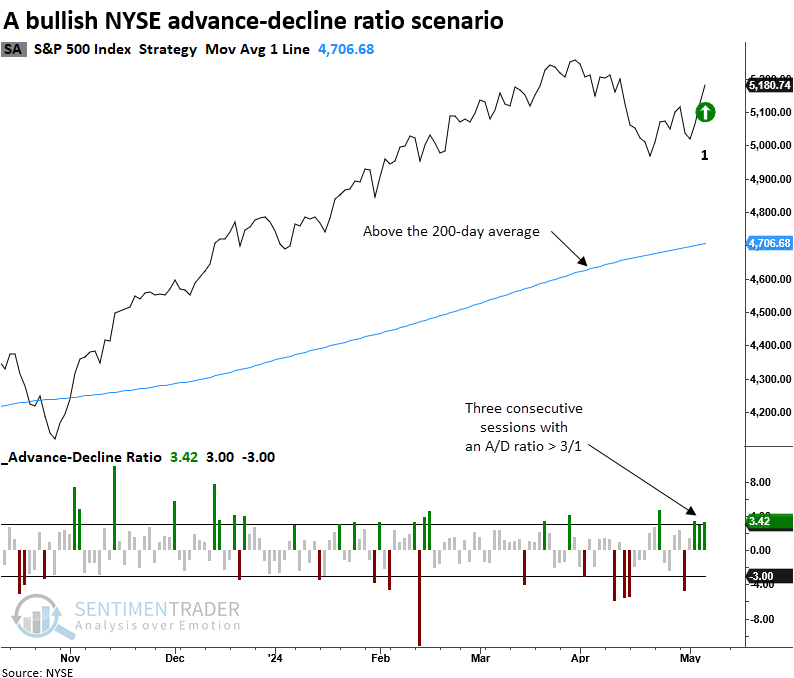
Following three successive instances where the NYSE advance-decline ratio exceeded 3 to 1, with the S&P 500 above its 200-day average, the world's most benchmarked index rallied 100% of the time over the subsequent three and six months. A year later, the S&P 500 exhibited gains in 92% of occurrences, with the only loss being a 0.9% drop in 1933.
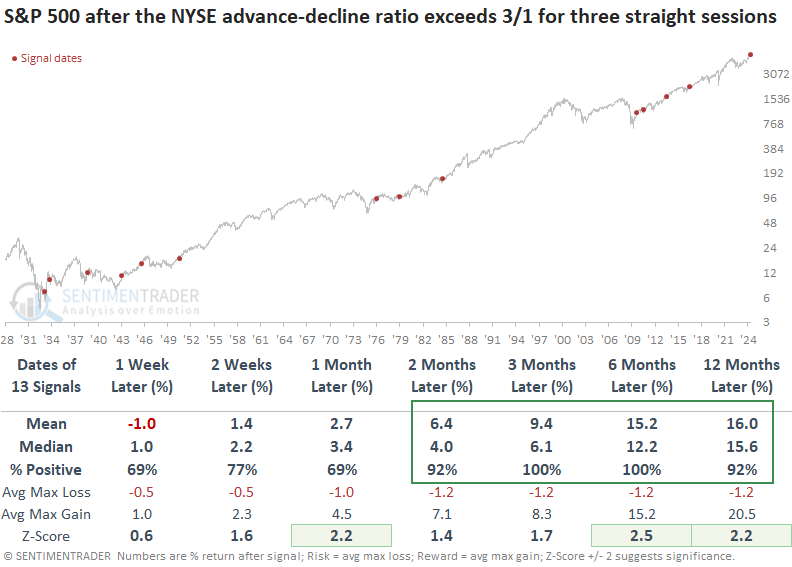
Since the 1929-42 secular bear market, there hasn't been a single instance of a maximum loss exceeding -10% over the subsequent year, a truly remarkable environment.
Suppose we lower the ratio threshold from 3/1 to 2.75/1 to increase the sample size. In that case, returns and win rates remained excellent, with 6 out of 7 horizons exhibiting significance relative to historical returns over the study period.
Failing up
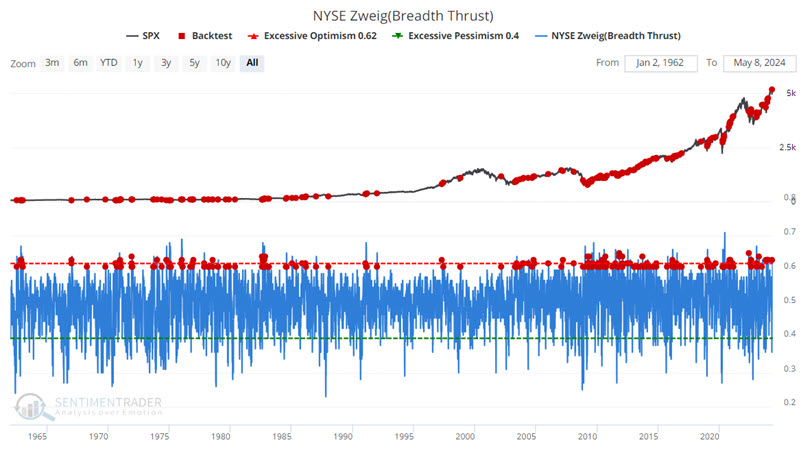
The bad news is that the market failed to achieve an "official" Zweig Breadth Thrust. But Jay suggested the good news is that it came close - and historically, that's typically been a good sign.
An official Zweig Breadth Thrust occurs when the 10-day moving average for the percentage of advancing stocks on the New York Stock Exchange rises from 40% or lower to 61.5% or higher in ten trading days or less. The indicator recently completed a run, but the move took more than ten trading days to complete. So technically, it failed to qualify.
The good is that it might not matter all that much.
Let's consider a much less stringent test. For this test, we will consider any reading by our Zweig Breadth Thrust indicator that crosses above 0.60 (i.e., 60%), regardless of whether it first dropped below 0.40. The most recent signal occurred on 2023-05-06.
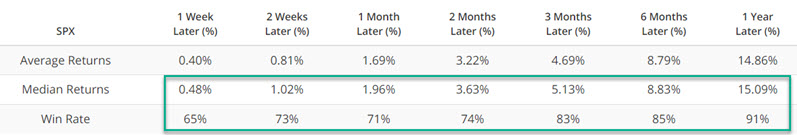
We also get some interesting results if we apply this signal to the Nasdaq 100 Index.
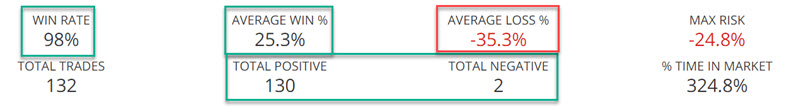
The good news: As you can see in the screenshot below, of the 132 signals versus the Nasdaq 100 since 1985, the Nasdaq 100 has shown a subsequent 12-month gain 130 times and a loss only twice.
The bad news: The losses were a -35.08% loss following the 2002-03-06 signal and a -35.55% loss following the 2008-02-01 signal.
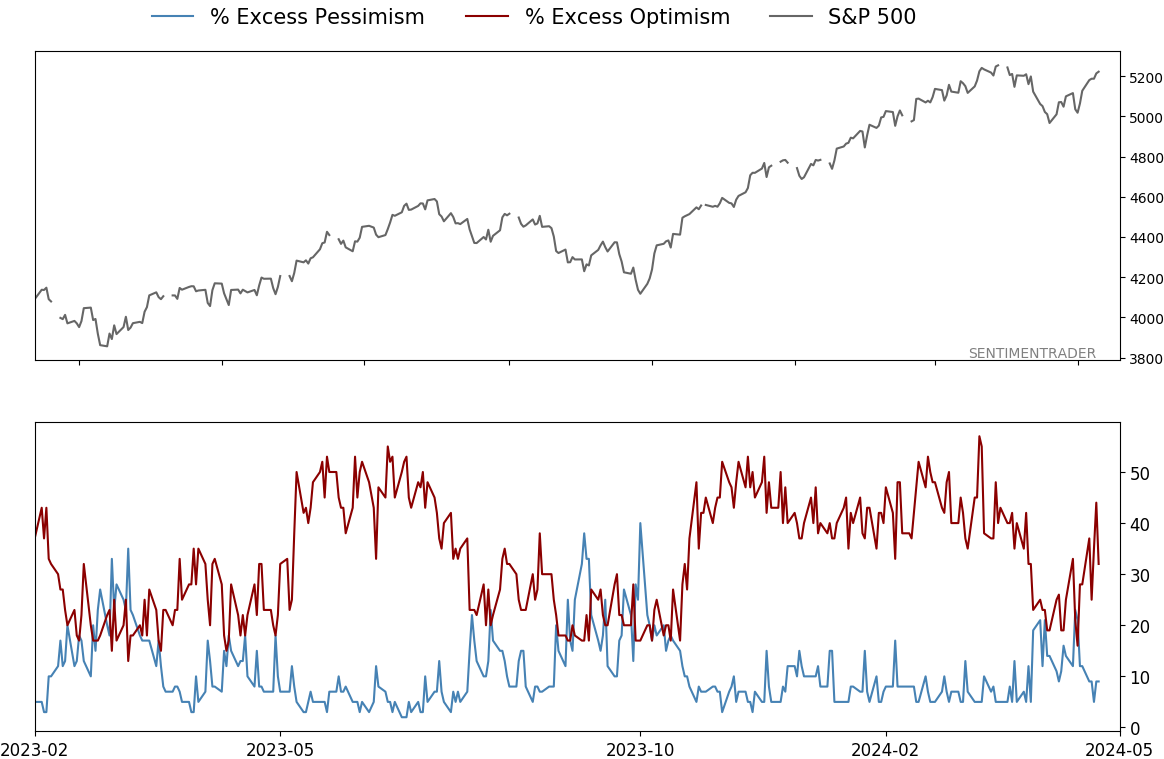
Option anxiety
Jay noted that even though the S&P 500 remains in an uptrend, several option related indicators are flashing oversold signals.
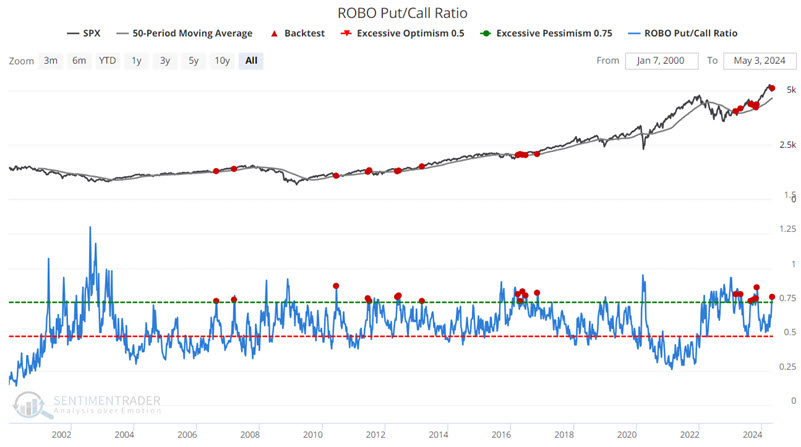
ROBO is an acronym we coined for Retail-Only, Buy-to-Open. This ratio focuses on small traders to better understand what they're trying to do. If we isolate the trades to those of 10 contracts or less and further restrict them to buys and opening transactions only, we can get an accurate picture of what retail traders are doing.
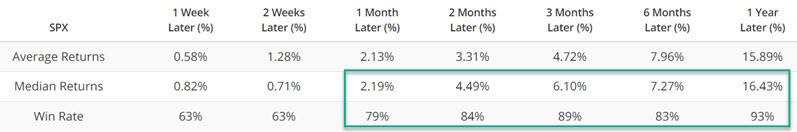
When the ROBO put/call ratio is high, small traders are buying many puts in relation to calls, which suggests that they believe their stocks will decline. This is bullish for the market once it reaches an extreme. The chart below highlights those dates when the ROBO Put/Call Ratio crossed above 0.75 while the S&P 500 was above its 50-week moving average. The latest signal occurred on 2024-04-26.
Jay also looked at OEX option open interest, and aggregated options activity within the S&P 500.
Also, it's notable that premiums on puts versus calls is declining from a record level. This is the ratio of total put premiums paid each week relative to total call premiums, so it directly reflects how much options traders are paying for one relative to the other. The chart below highlights those rare occasions when the 50-day average of the Put/Call Premium crossed below 1.00.
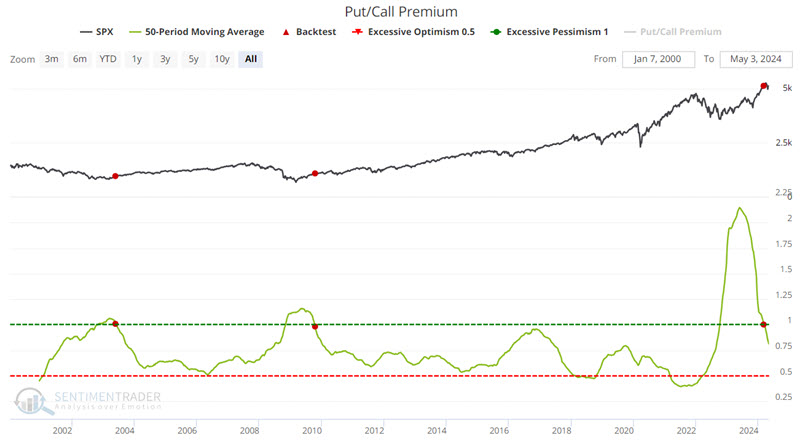
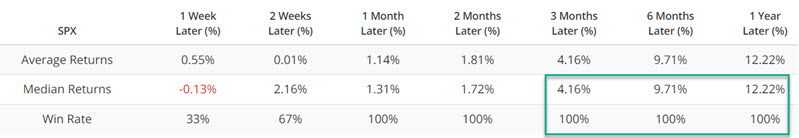
The only precedents were the ends of the 2002 and 2008 bear markets.
Big tech nervousness recedes
Several sentiment-based indicators for the Nasdaq 100 generated buy signals, which Dean showed have mostly preceded a resumption of its upward trajectory.
Over the last month, sentiment-based indicators for the Nasdaq 100 have signaled heightened levels of uncertainty among investors. Last week, the fear subsided, shifting these indicators lower following a reset in the upper end of their recent ranges. This reversal has triggered a flurry of buy alerts from trading models based on the volatility index, liquidity premium, and aggregated put/call ratio.
The CBOE calculates a volatility index for the S&P 500 and several other indexes like the Nasdaq 100. Commonly known as the VIX or the fear gauge, it measures market expectations of near-term volatility conveyed by index option prices. It tends to rise when investors are uncertain or fearful about a market's direction. Conversely, when apprehension subsides, volatility reverts lower.
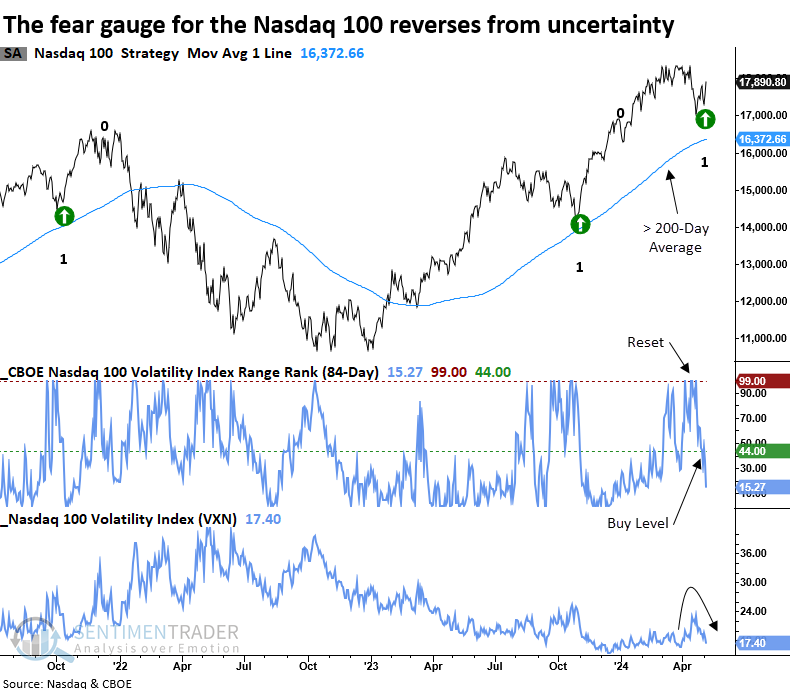
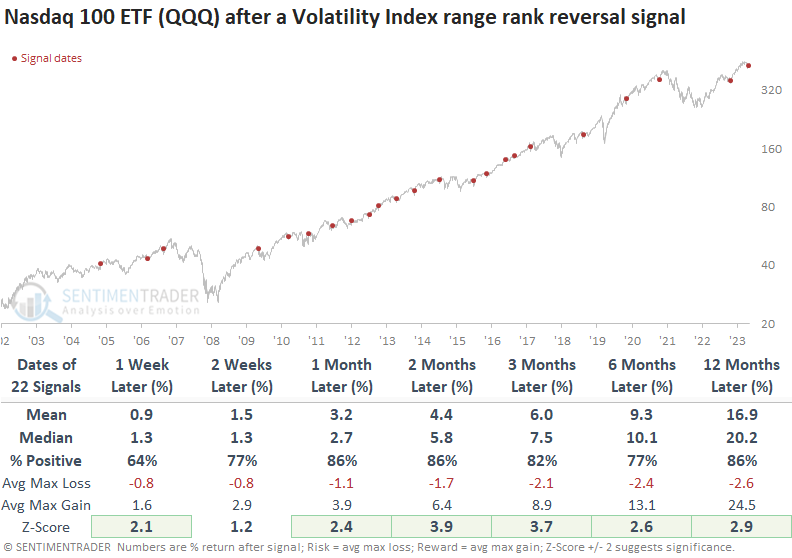
Whenever the Nasdaq 100 Volatility Index (VXN) 's 84-day range rank cycled from greater than 99% to less than 44%, with the index above its 200-day average and exhibiting positive momentum, the popular ETF (QQQ) rallied with remarkable consistency.
Over the following month, the QQQ ETF was higher at some point in all but one case. Additionally, over that same time frame, it only suffered one maximum loss exceeding -3.4%.
Dean showed similar behavior following reversals in a couple of other measures of Nasdaq 100 anxiety, including the Liquidity Premium and Aggregated Put/Call Ratio. Both showed a consistent tendency to lead to higher prices and above-average returns.
More negative economic surprises
Time and again since 2022, a devastating year for many, investors have been looking for reasons to sell. None of them have been particularly compelling based on historical behavior.
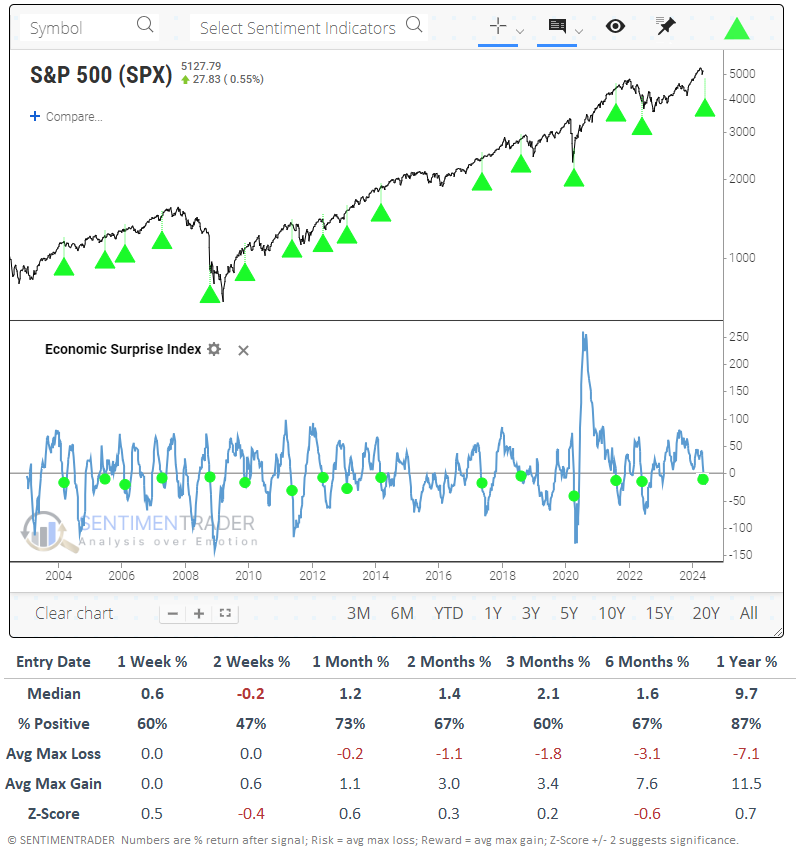
One that popped up lately is disappointing economic reports. While that may be welcome to some as it could help sway the Fed to cut rates, a deteriorating economy is not generally a welcome background for stock prices. And according to Citigroup, economic surprises have gone from positive to the most negative in over a year.
The chart and table below show each time that economic surprises have cycled from very positive (above +50) to meaningfully negative (below -5). While the S&P 500's returns over the next couple of weeks were somewhat poor, that was the only time frame of concern. After that, they weren't much different than random. A year later, the S&P was higher after all but two signals, and those were both limited losses.
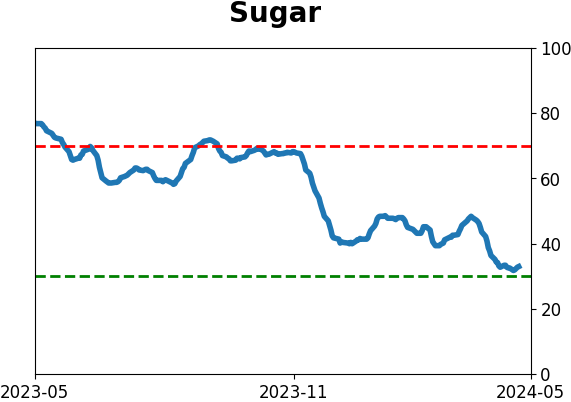
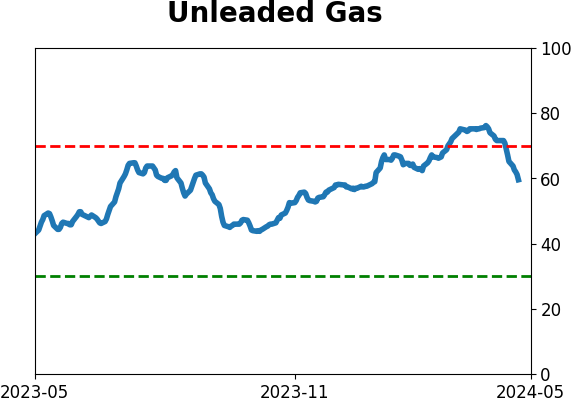
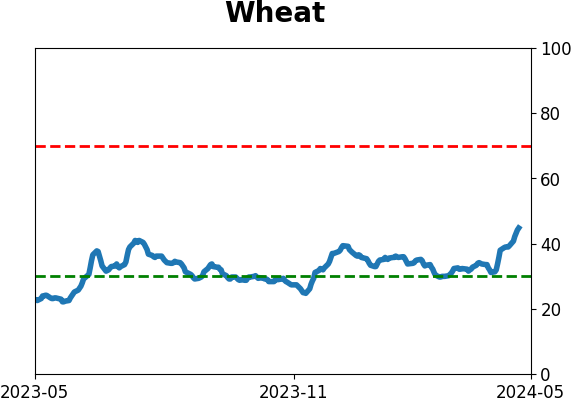
Among other indexes and markets, not too much stood out. Treasury notes showed some weakness in price over the next 2-3 months, meaning yields rose - not necessarily what one would expect with weaker-than-expected economic reports. Gold and the broader commodity complex performed poorly over the short- to medium-term.
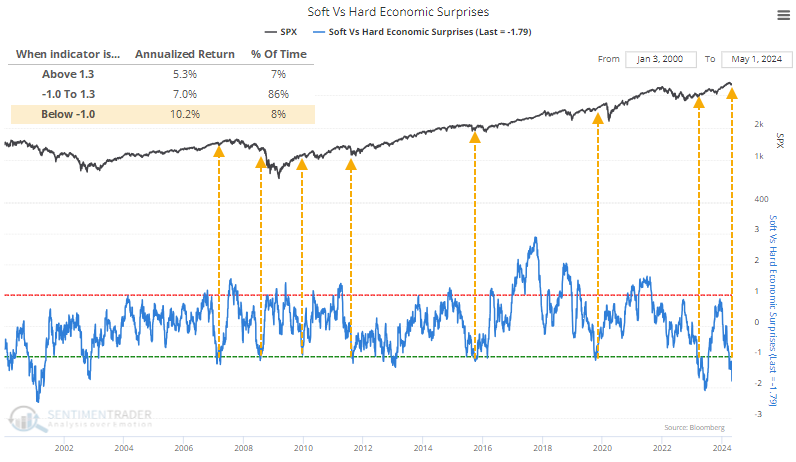
Much of the decline in surprises has come among "soft" economic releases, such as surveys. "Hard" data, such as retail sales, which are less open to subjective interpretation, have held up relatively better. Because of that, the difference between soft and hard surprises has plunged to one of the lowest levels in more than 20 years.
When soft-hard surprises cycled from near +1 to -1, it tended to precede favorable market conditions but was way too early in 2008 and didn't help ahead of the pandemic panic in 2020.
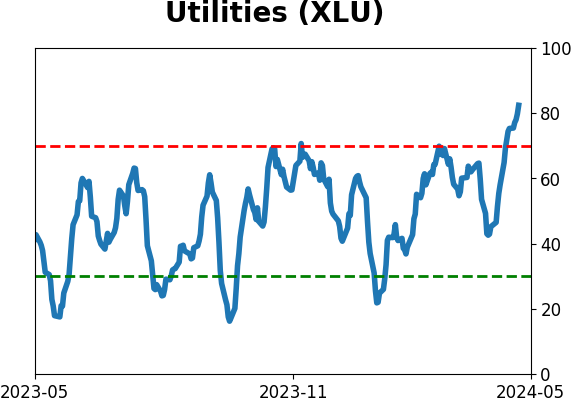
A staid sector beating the market
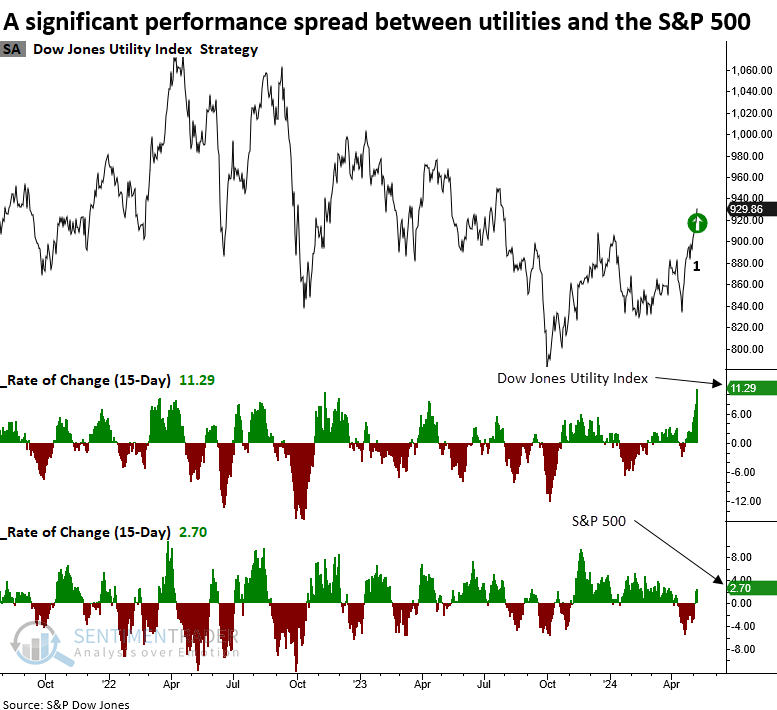
Over the last three weeks, the Dow Jones Utility Index has significantly outperformed the S&P 500. Dean showed that comparable return profiles suggest the positive momentum in Utilities could persist over the next month.
Over the last three weeks, the Dow Jones Utility Index has rallied 11.29%, significantly outpacing the S&P 500's 2.79% return. In a search for historical parallels, and adjusting the thresholds to 10% for the Utility Index and 5% for the S&P 500, there was a sample size of 22 instances. So, relatively rare.
Following periods when the Dow Jones Utility Index rallied 10% over three weeks as the S&P 500 rose less than 5%, the favorable price momentum in the traditionally defensive group tended to persist over the following month, increasing 73% of the time with a median gain of 2.8%.
It's worth noting that instances where the S&P 500 remained within 5% of its 5-year high showed a positive outcome in 5 out of 6 cases in the subsequent month. However, 4 out of 6 precedents turned negative a year later.
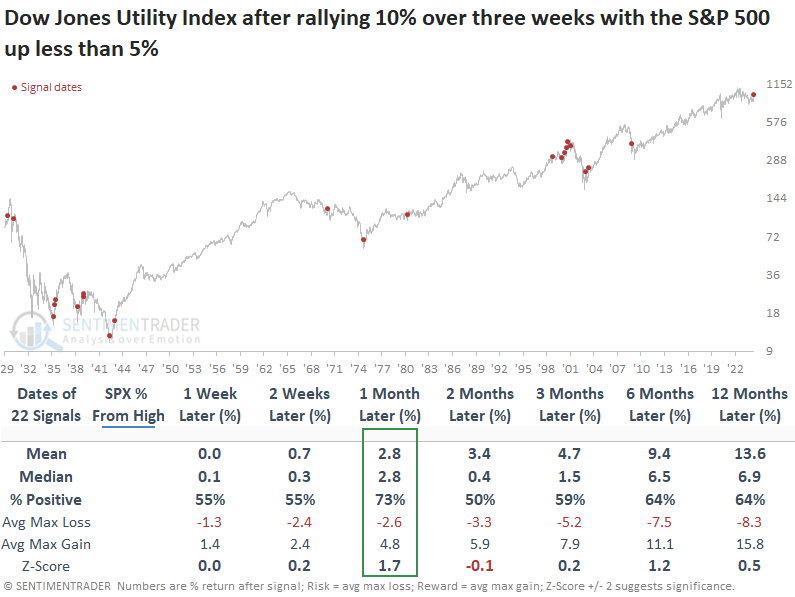
While median returns for the S&P 500 showed an upward bias over the following year and exceeded historical tendencies over the study period, the Dotcom bust's precedents notably impacted win rates.
The Dow Jones Utility Index showed a reasonably consistent bias to outperform the S&P 500, especially over the subsequent month. Unsurprisingly, the defensive group failed to keep pace with the world's most benchmarked index a year later.
Quite a run in Hong Kong
After months and months of false starts and some of the worst pessimism we've seen in any market in decades, Chinese stocks are getting some positive attention. As recently as February, we noted how this was the most hated market in the world.
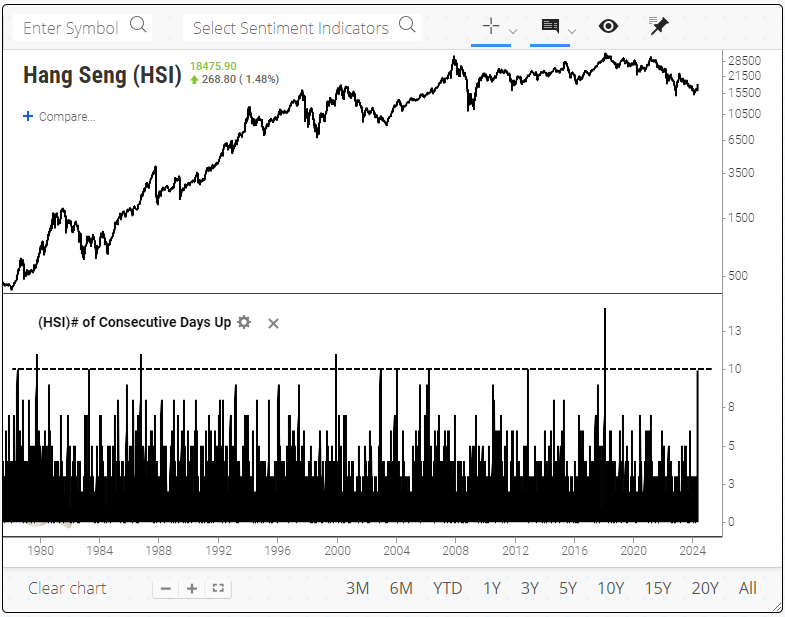
There are different markets, indexes, and exchanges when it comes to "China," but for these purposes, we'll look at Hong Kong, specifically the Hang Seng index. For the first time in six years, buyers have pushed the Hang Seng higher for the tenth consecutive session.
It has been rare to see this level of commitment, even during protracted bull markets. When it comes after the index had suffered at least a corrective phase, then short-term returns were mixed, but long-term returns were positive in each case.
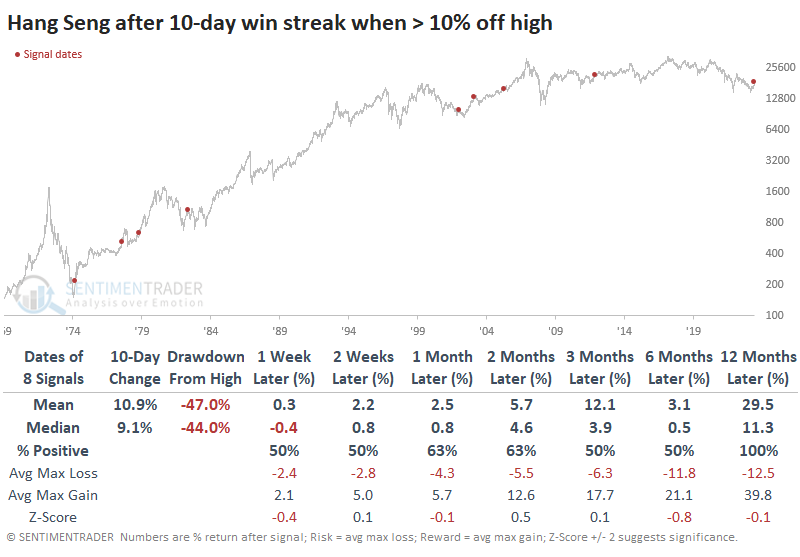
If we look at the most impressive streaks after the worst drawdowns, the sample size necessarily contracts uncomfortably, but the results improved.
The 10-day win streak occurred as more than 2.5 stocks advanced for every one that declined. The index hasn't seen that level of overwhelming buying interest since 2017.
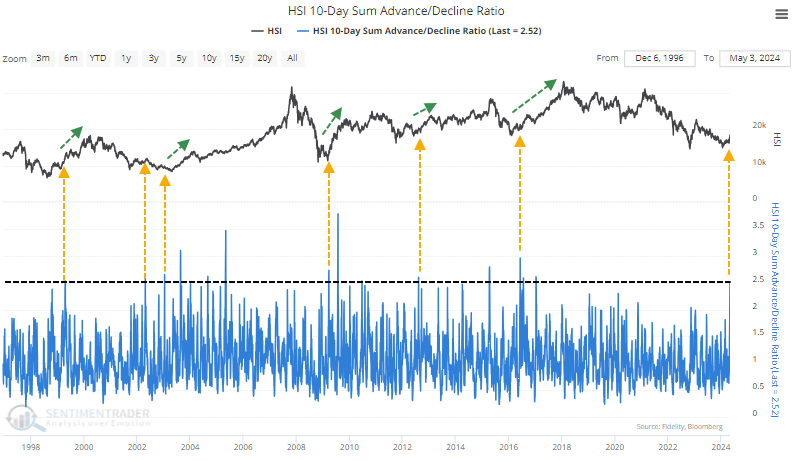
If we look at the most similar situations, there were only three precedents when this buying impulse was triggered after a long drought and significant drawdown. One led to a temporary lower low, then triggered again, ending the bear market. The other signal in 2009 was a sign the bear market was over.
The recovery hasn't just been in short-term trends. For the first time in months, more than 60% of stocks in the Hang Seng have closed above their 200-day moving average. When we see this climb above 60% for the first time in at least six months, the index has a good record of adding to gains in the weeks and months ahead.
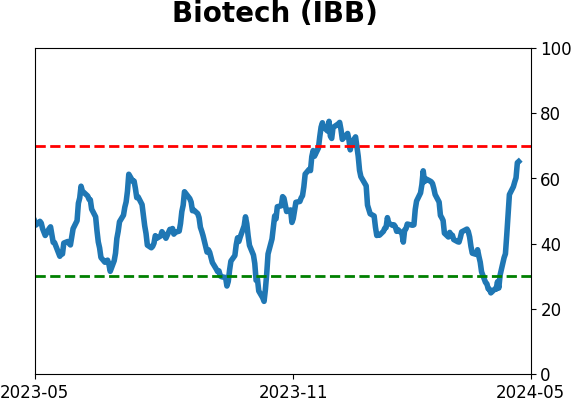
Biotech bull window
The iShares Biotechnology ETF (ticker IBB) just bounced off of an oversold level, and Jay noted that IBB is also entering its most favorable seasonal period of the year.
As always, seasonality is "climate, not weather." That said, note that ticker IBB is entering its most favorable seasonal period of the year, as shown in the chart below.
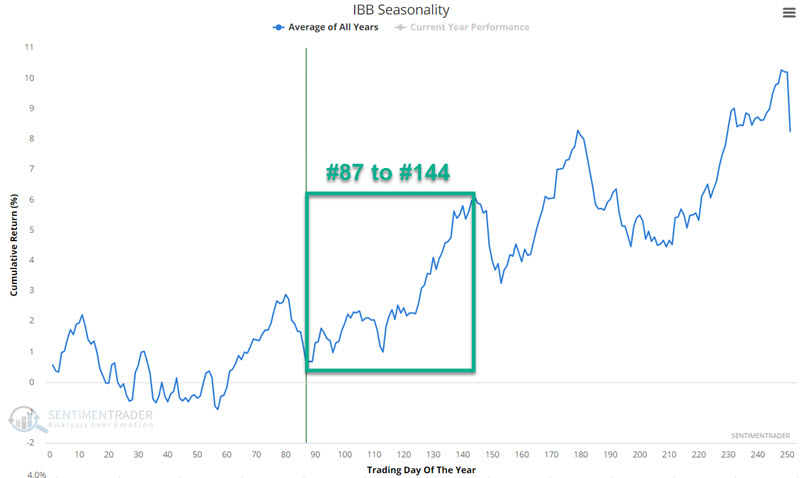
This favorable period extends from the close of Trading Day of the Year (TDY) #87 through TDY #144. For 2024, it extends from the close of 2024-05-06 through 2024-07-29.
Ticker IBB started trading in 2001. The chart below displays the hypothetical growth of $1 invested in IBB only during the TDY #87 through TDY #144 period every year since then.
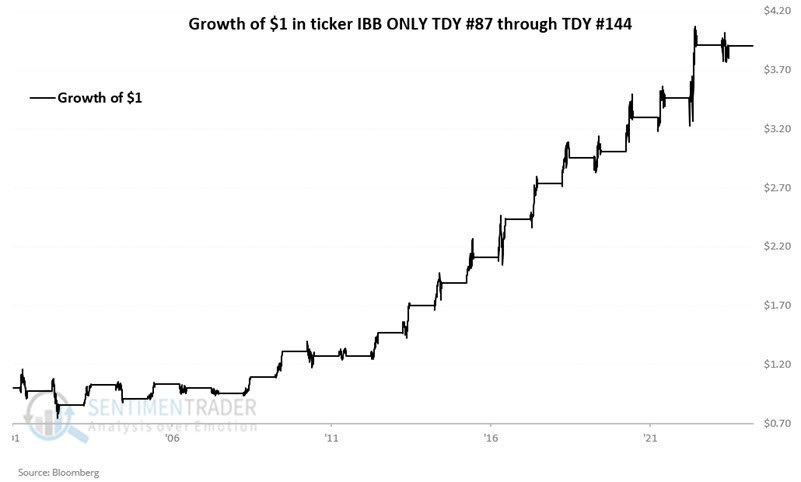
A Win Rate of 70% is good, but it also implies that this is not a sure thing. The most favorable signs are that the median gain is 3.6 times the median loss and moves of 10% or more skew heavily to the positive side.
About TradingEdge Weekly...
The goal of TradingEdge Weekly is to summarize some of the research published to SentimenTrader over the past week. Sometimes there is a lot to digest, and this summary highlights the highest conviction or most compelling ideas we discussed. This is NOT the published research; rather, it pulls out some of the most relevant parts. It includes links to the published research for convenience, and if you don't subscribe to those products, it will present the options for access.
Indicators at Extremes
|
|
|
Phase Table
|
|
|
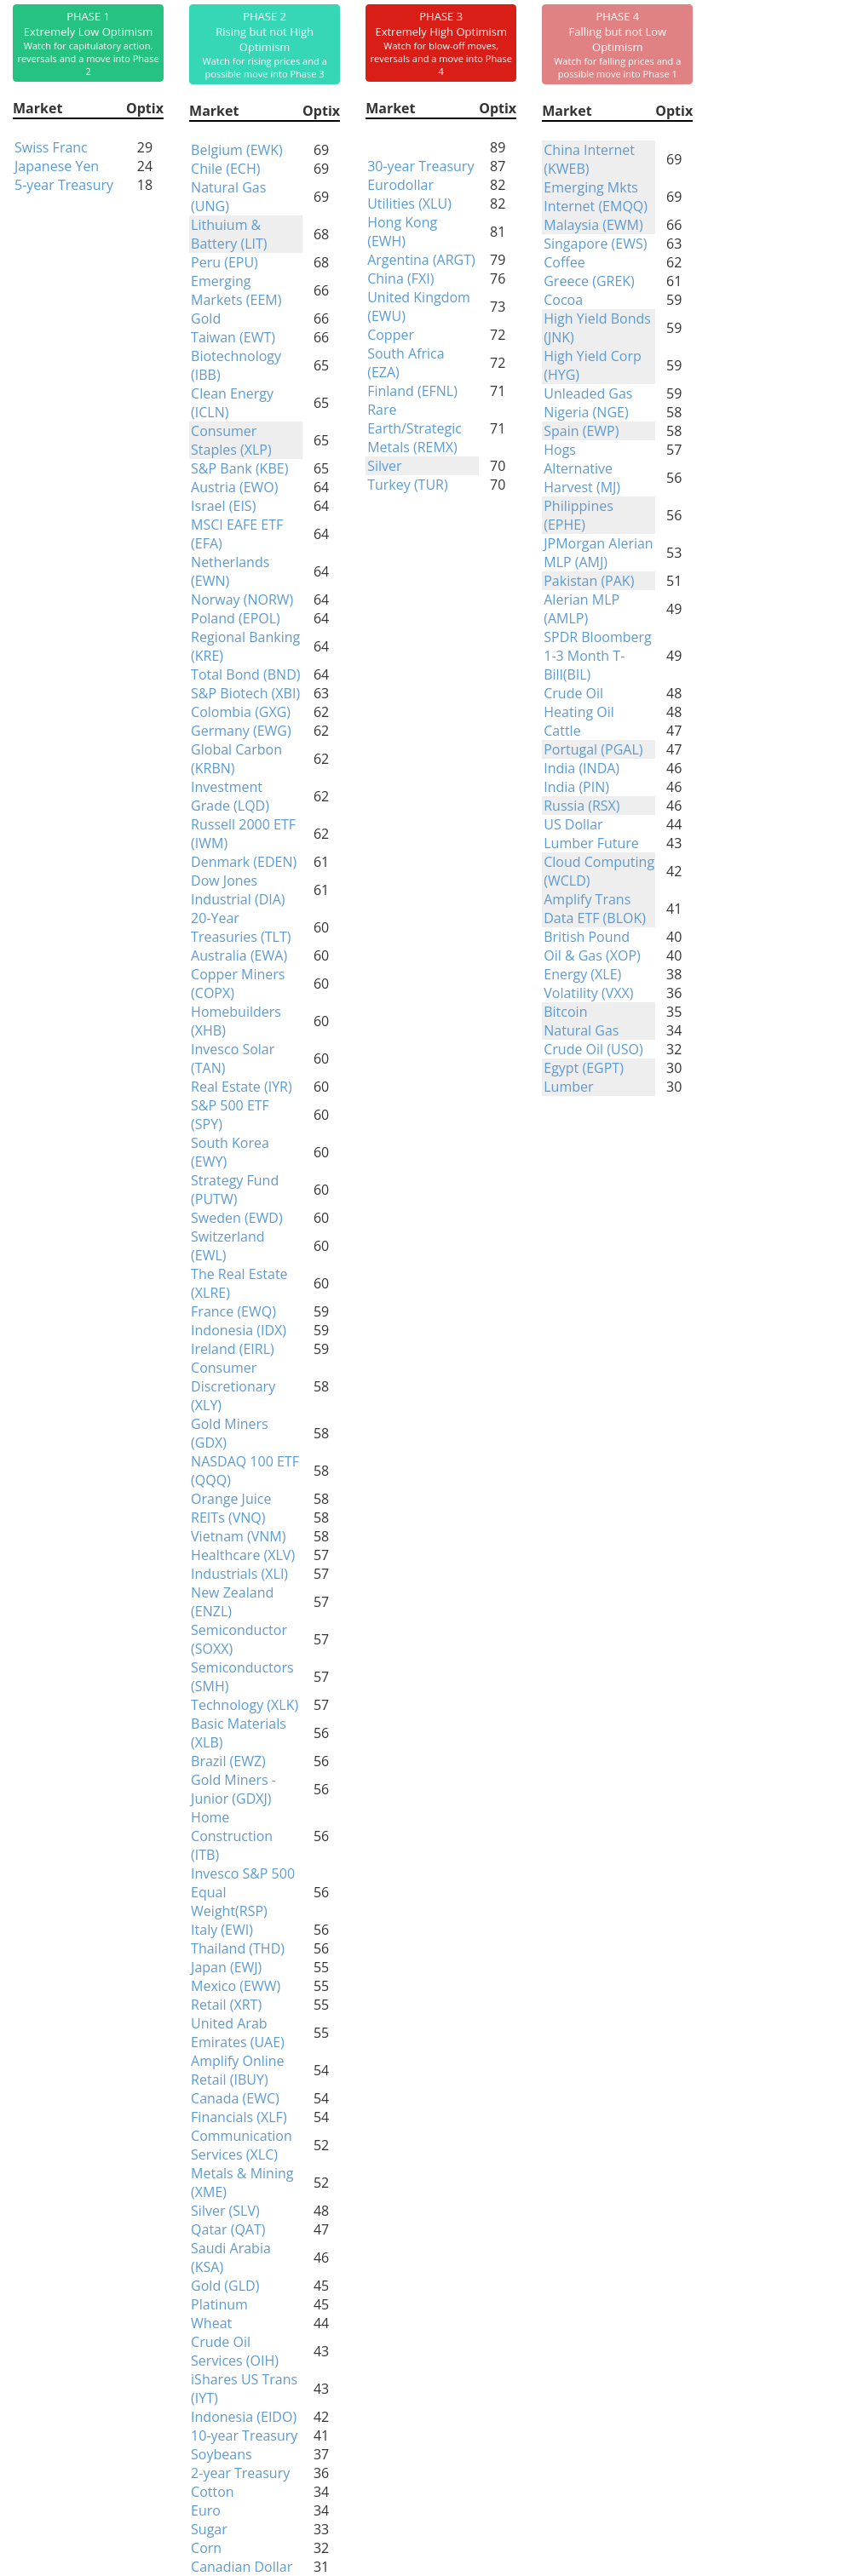
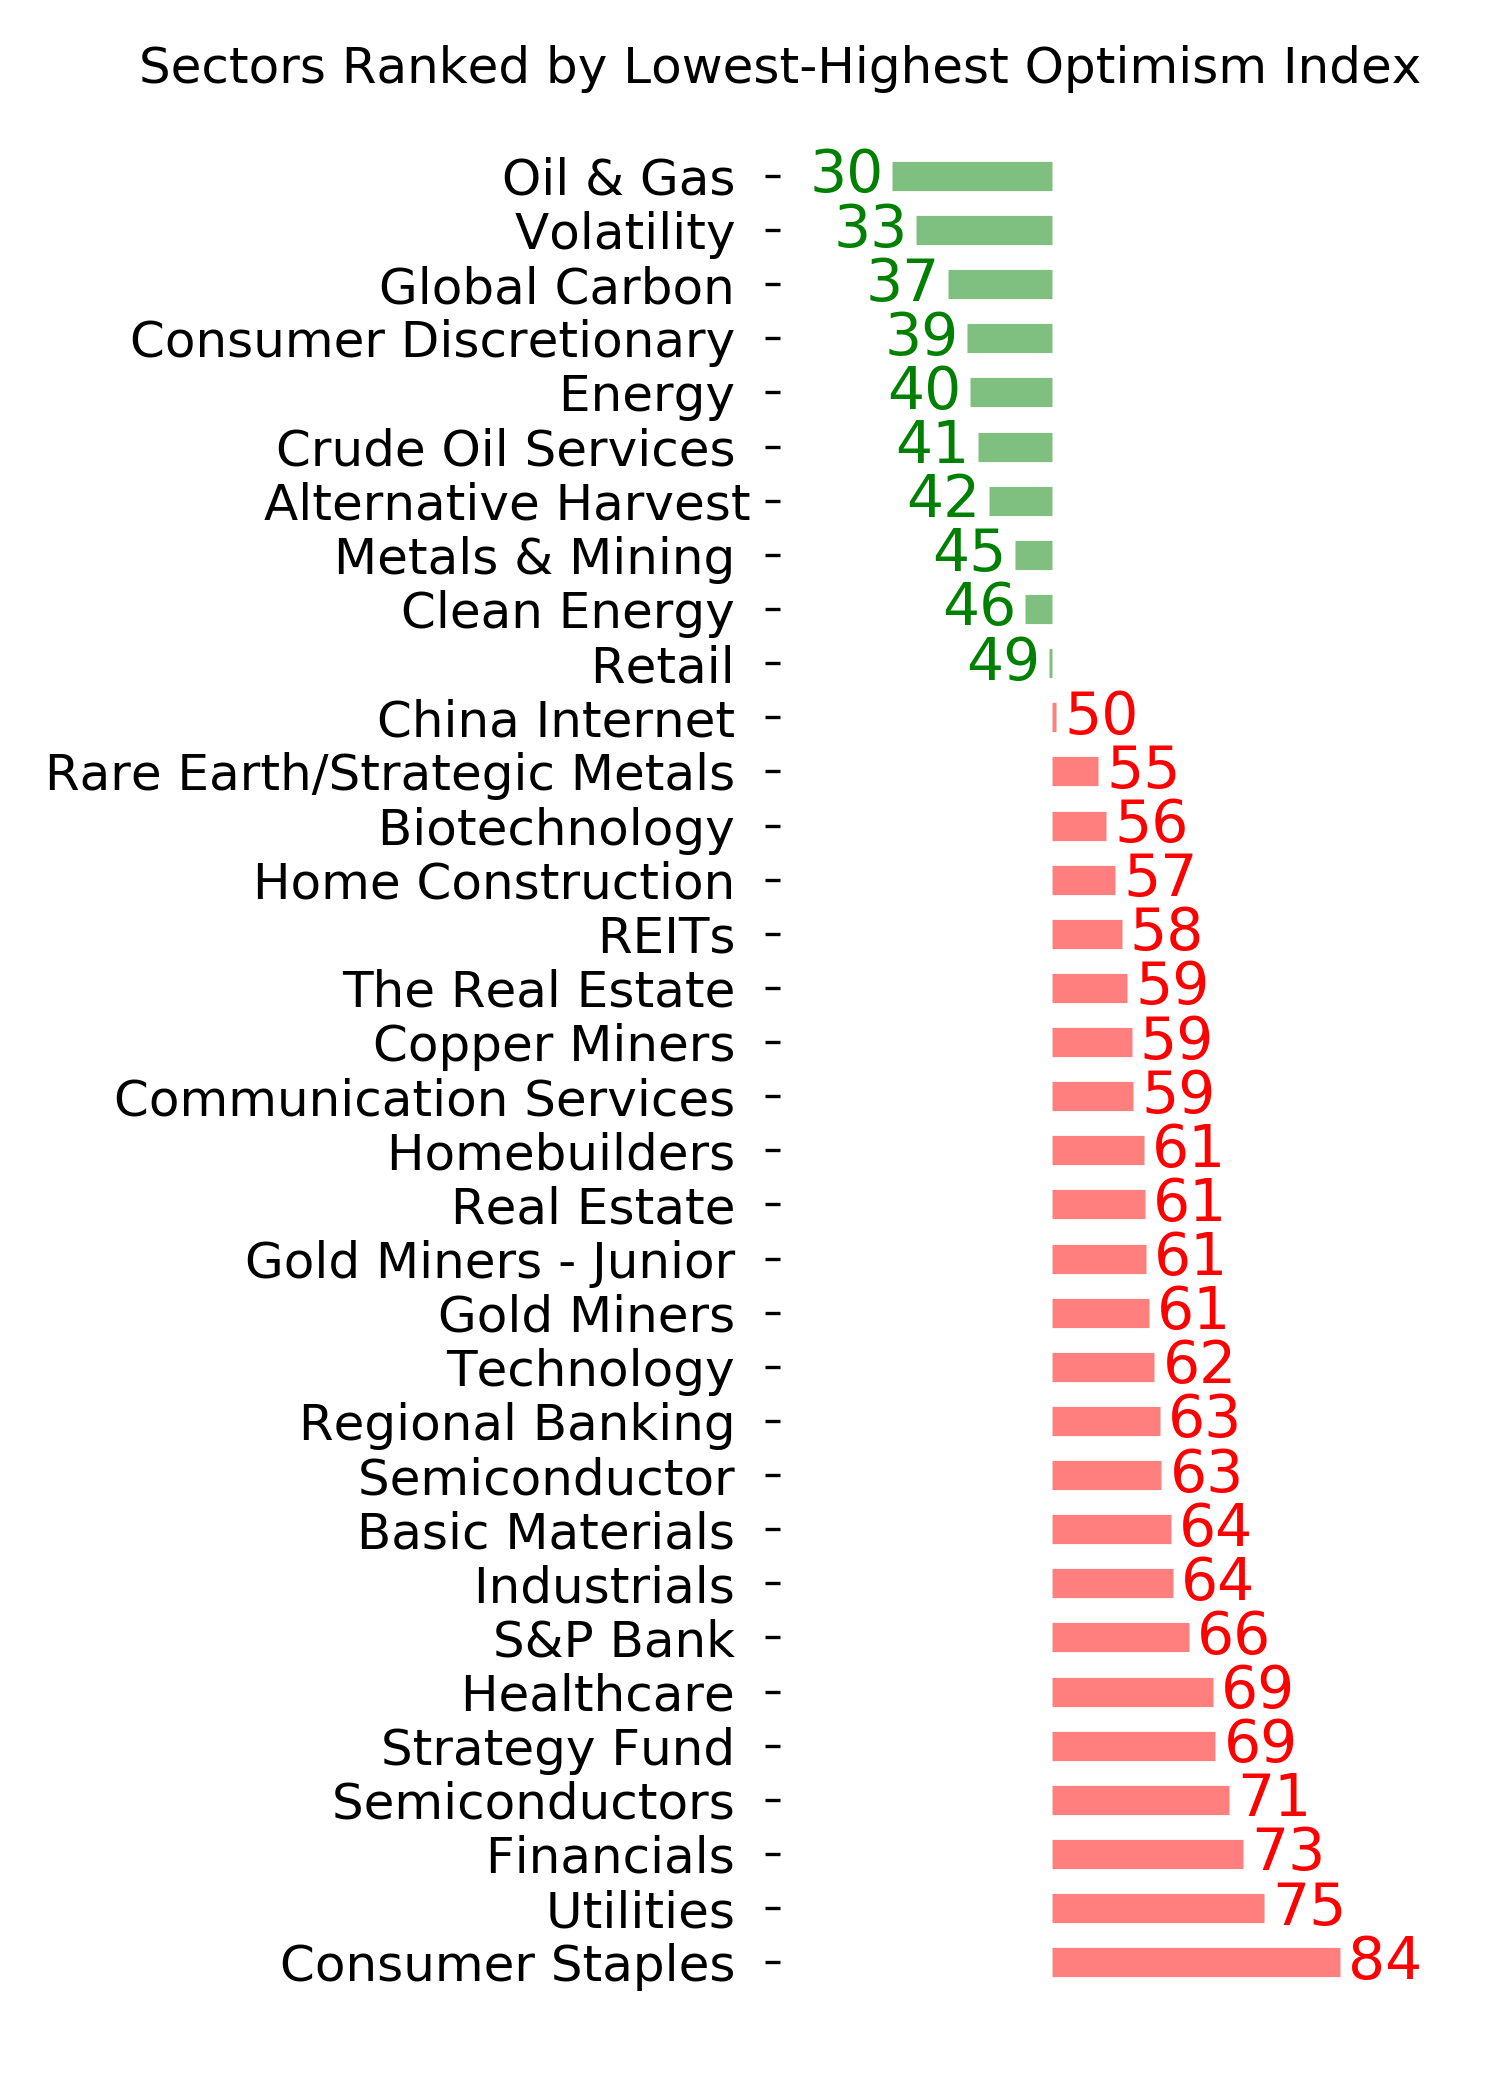
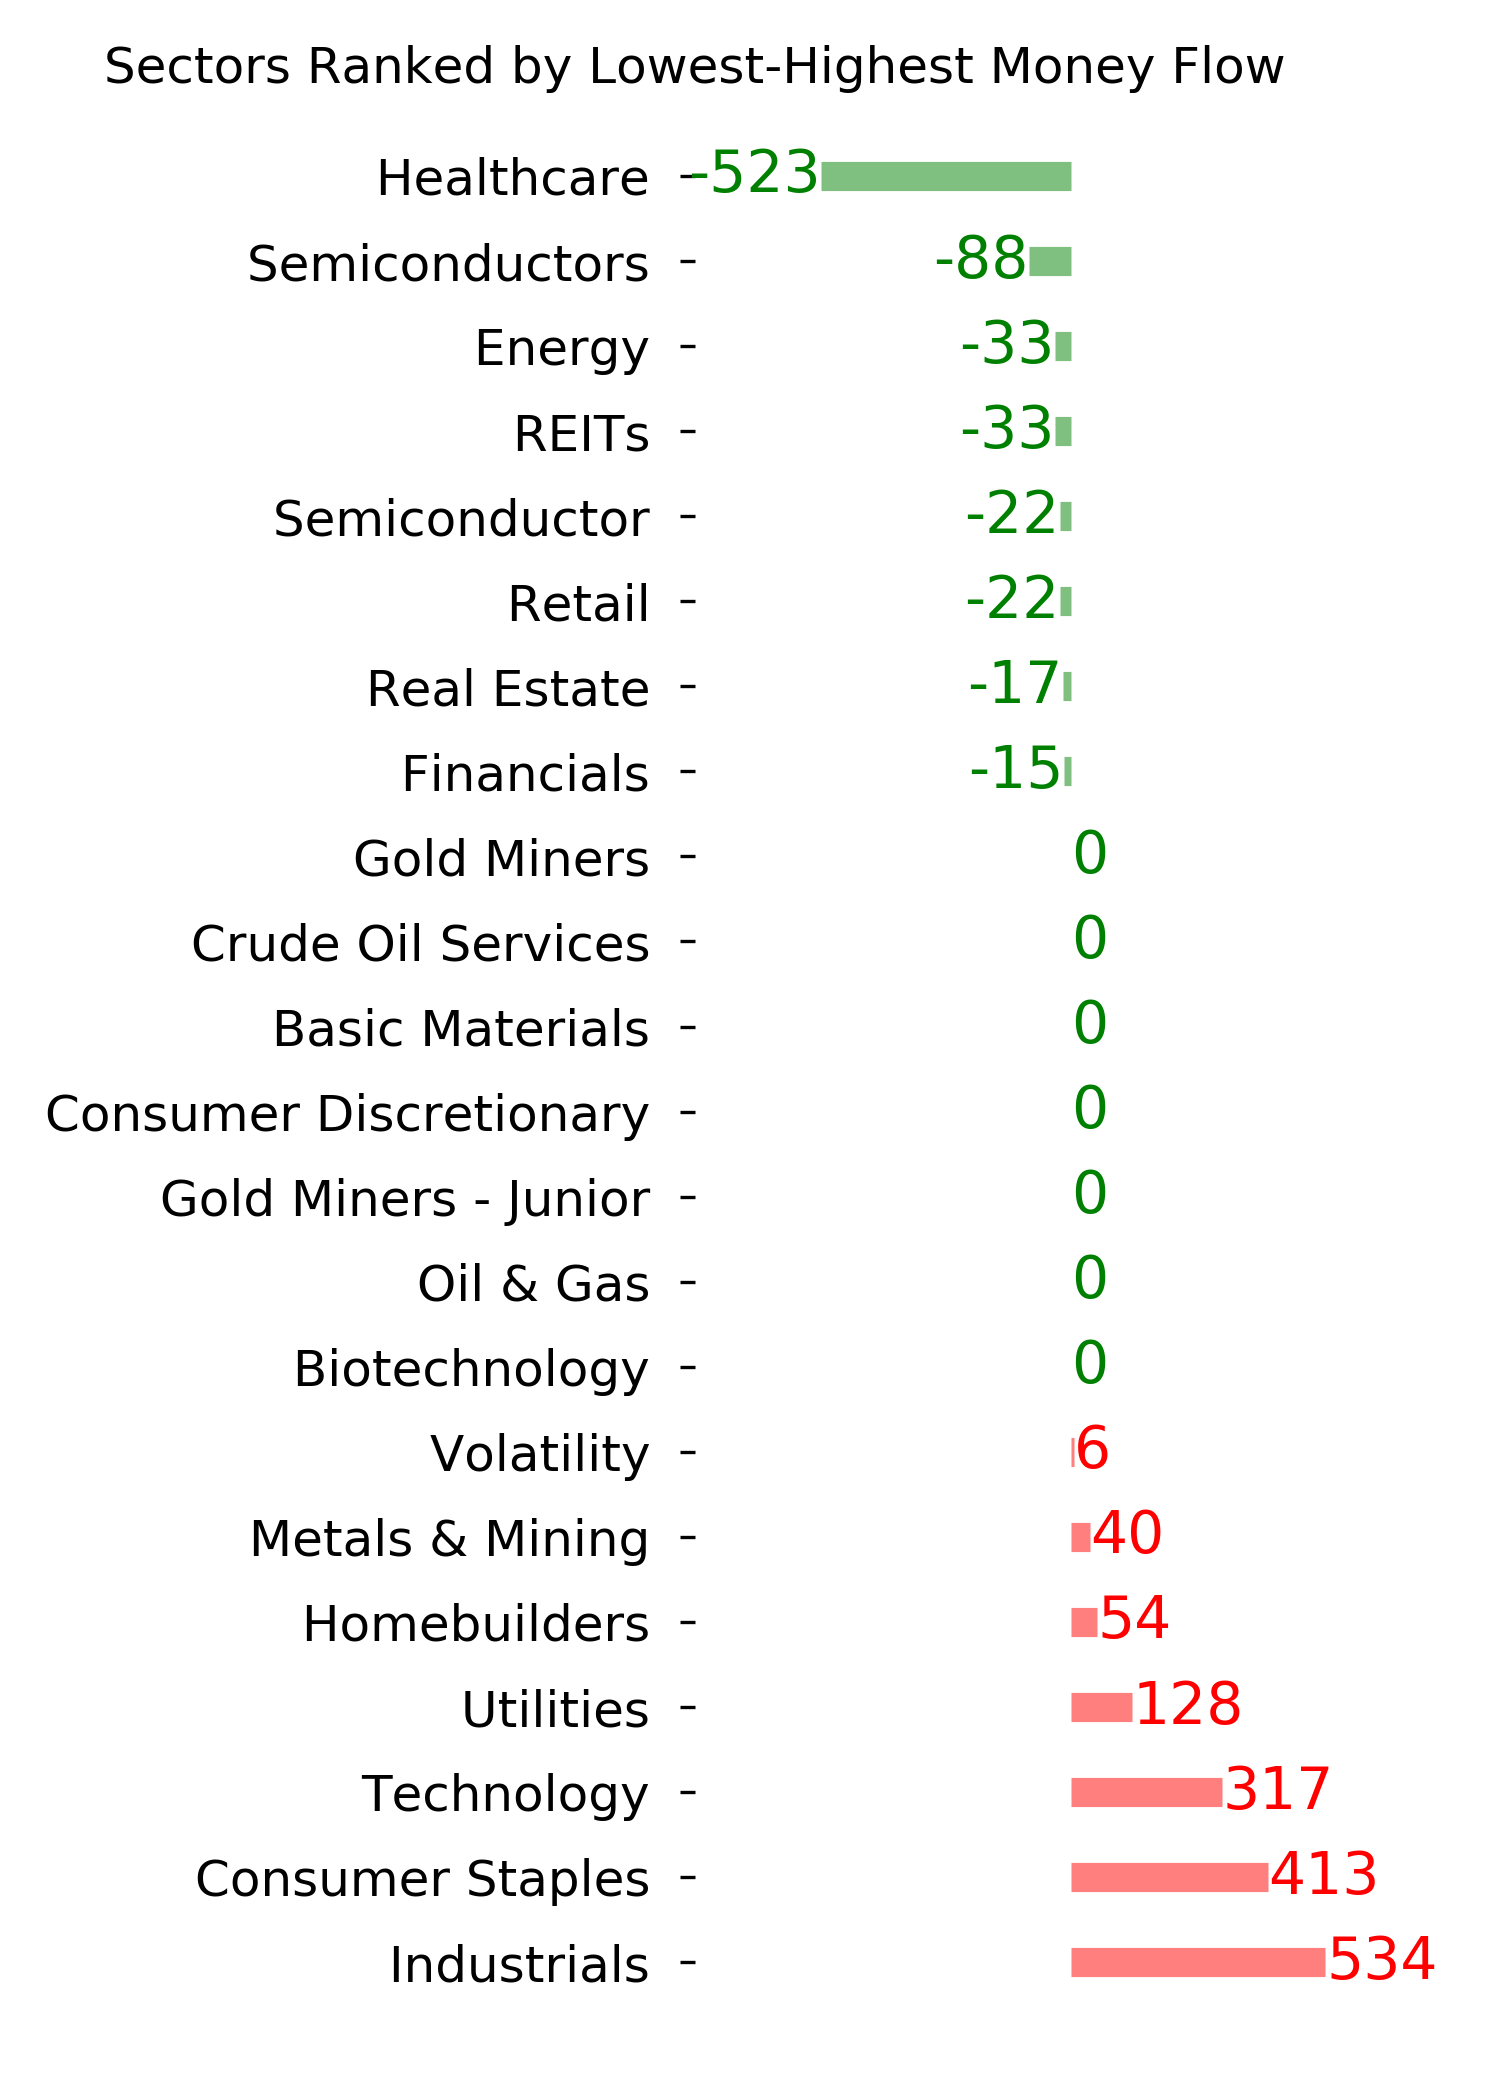
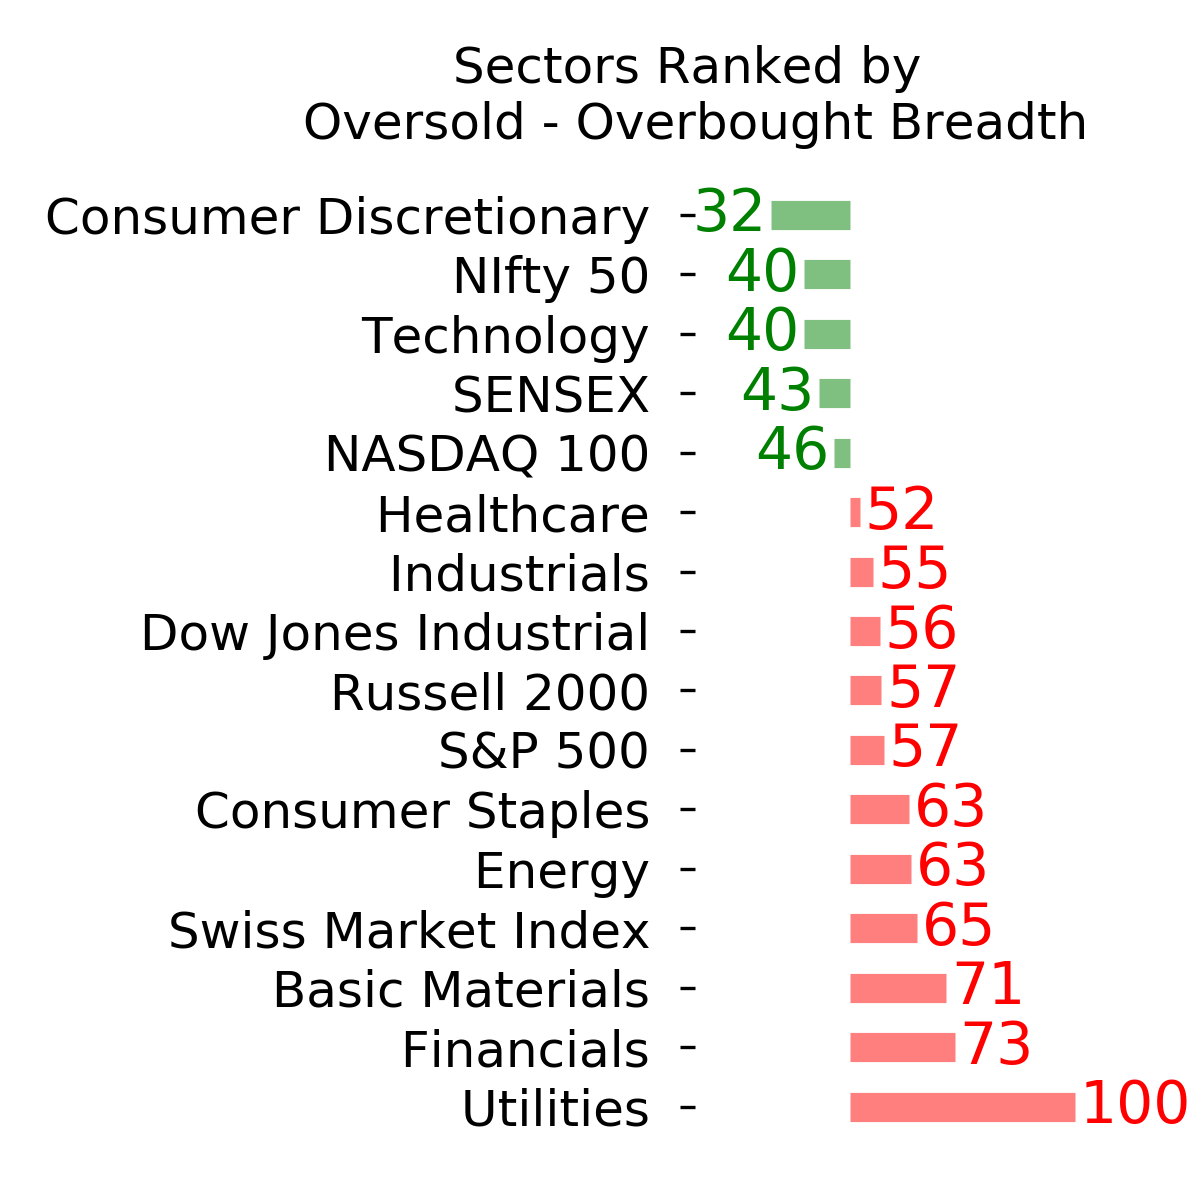
Ranks
|
|
|
|
|
|
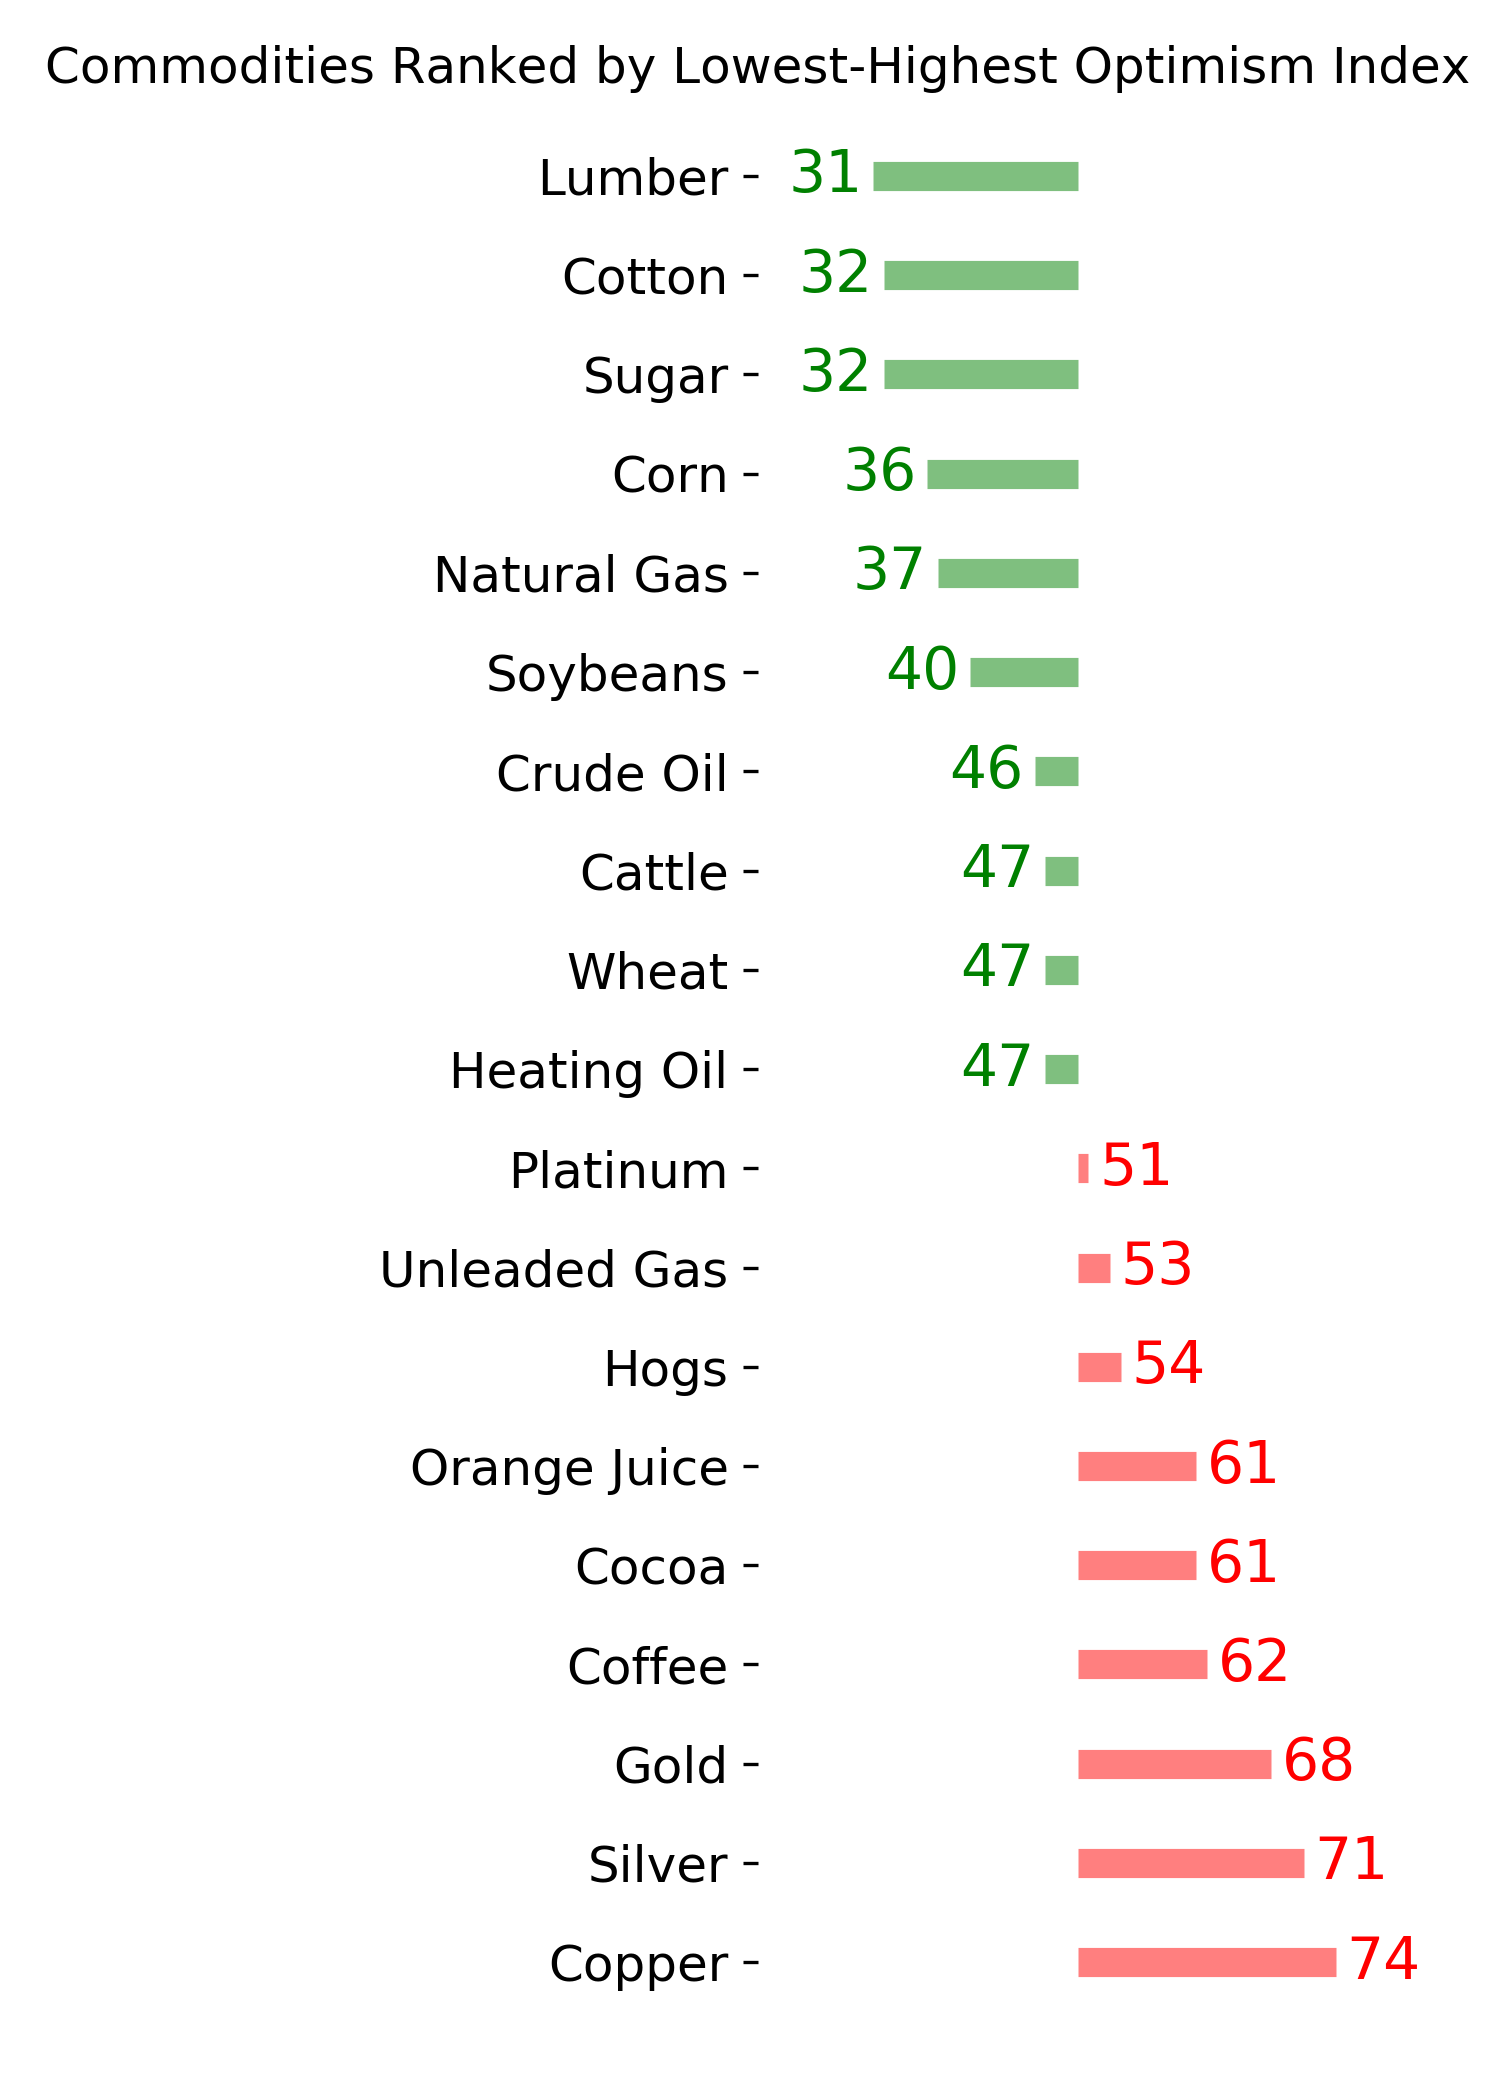
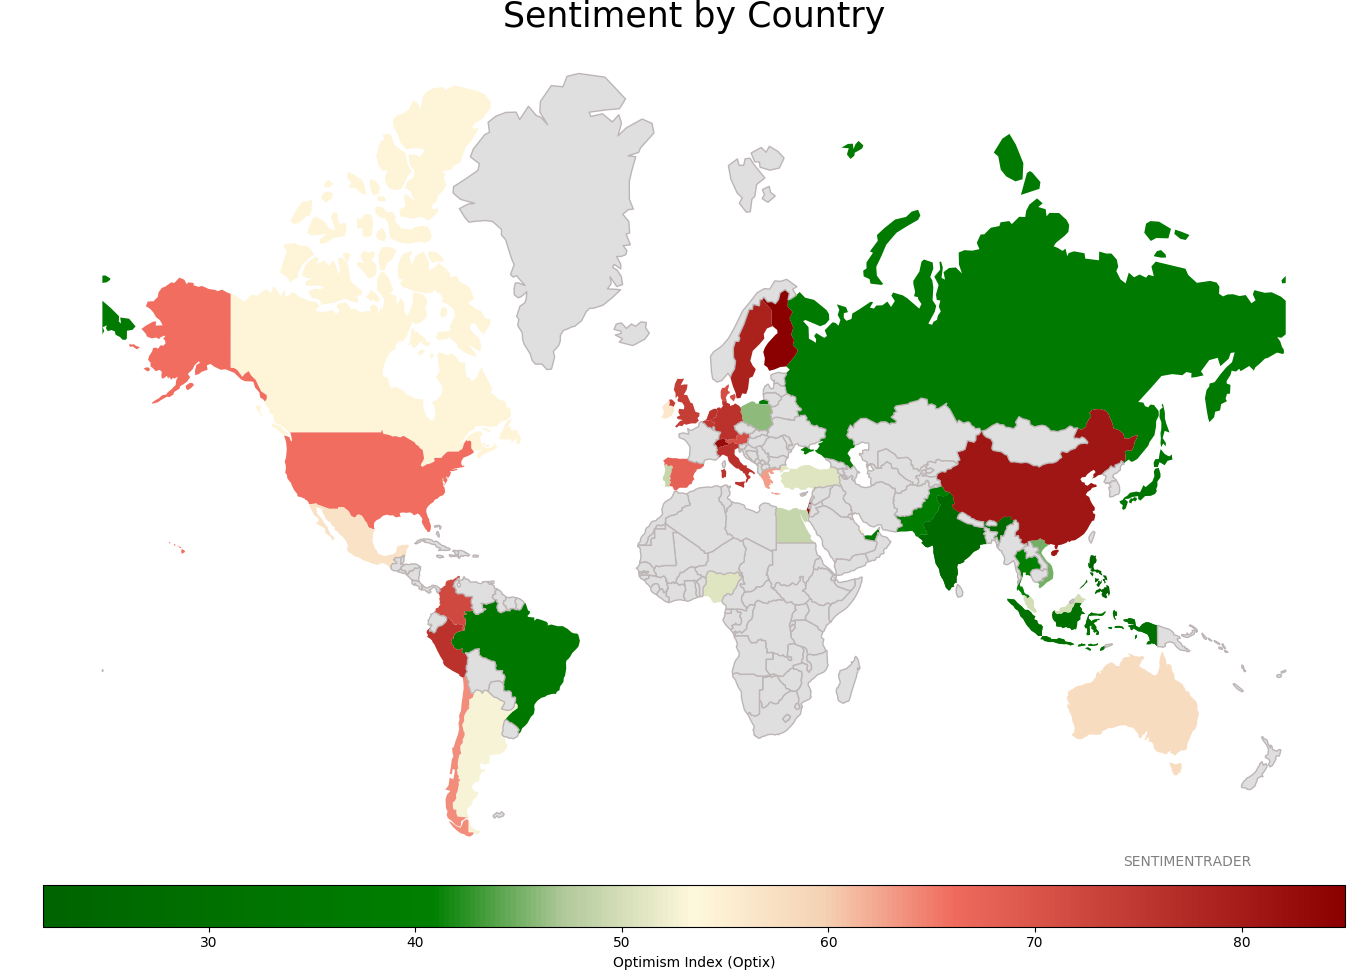
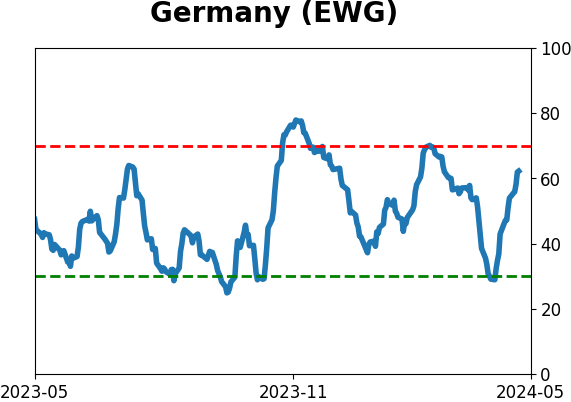
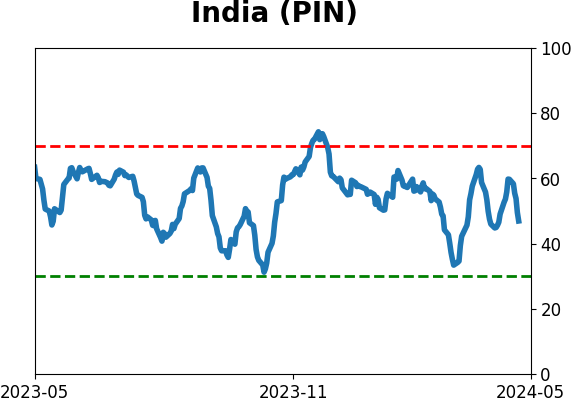
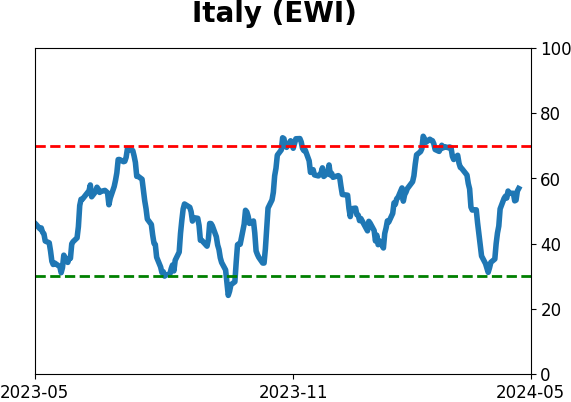
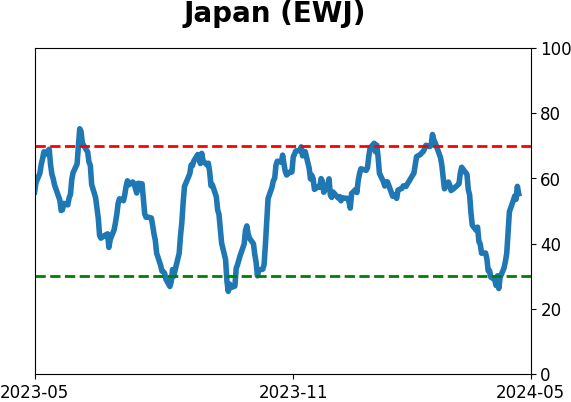
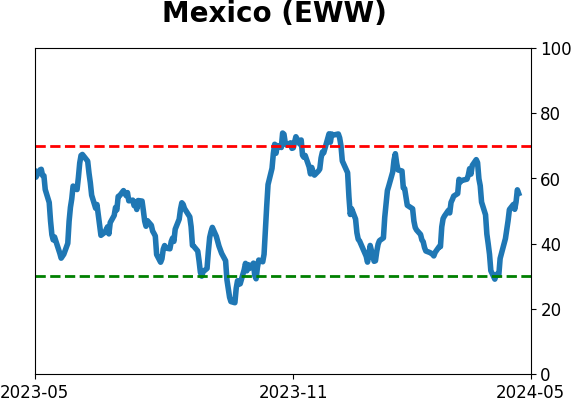
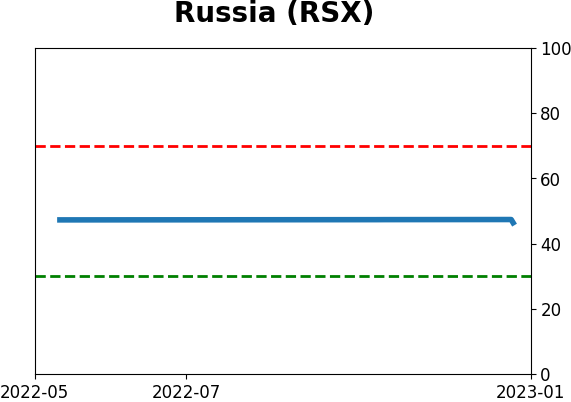
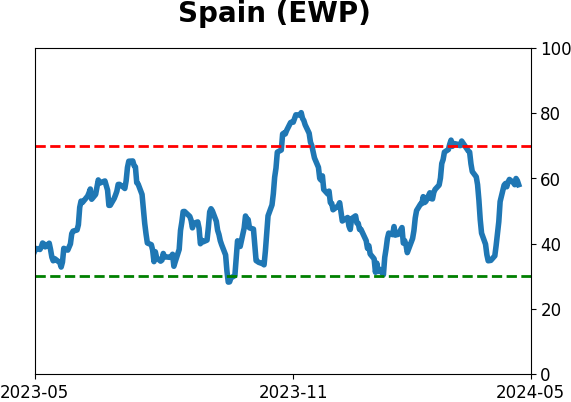
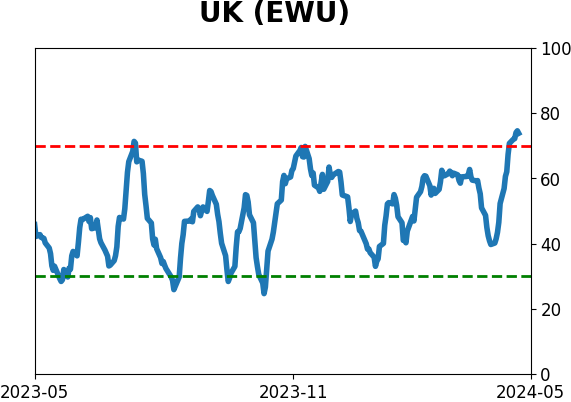
Sentiment Around The World
|
|
|
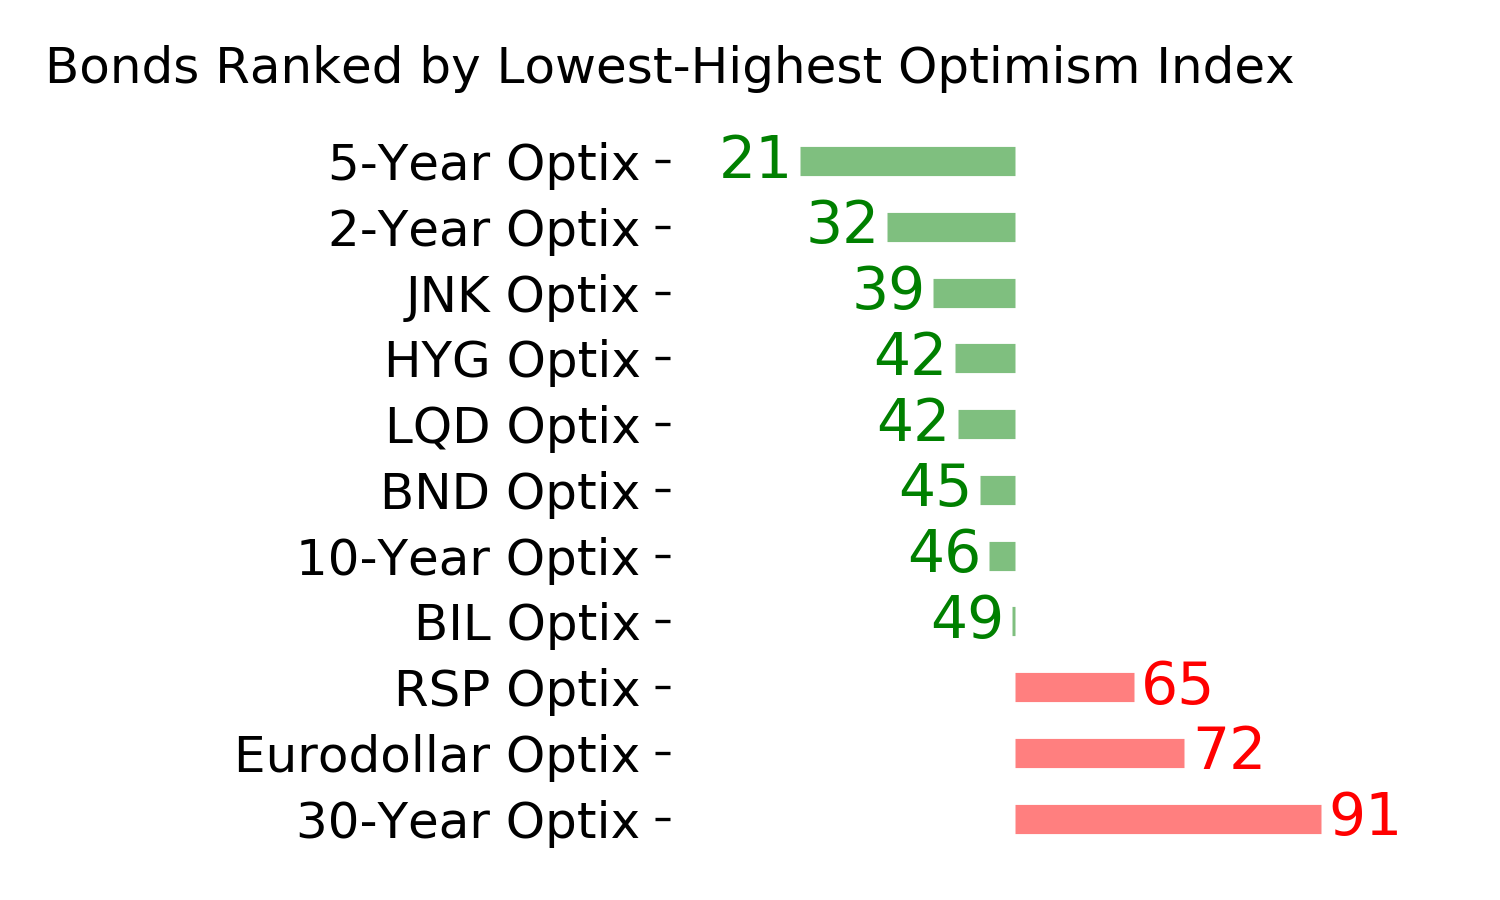
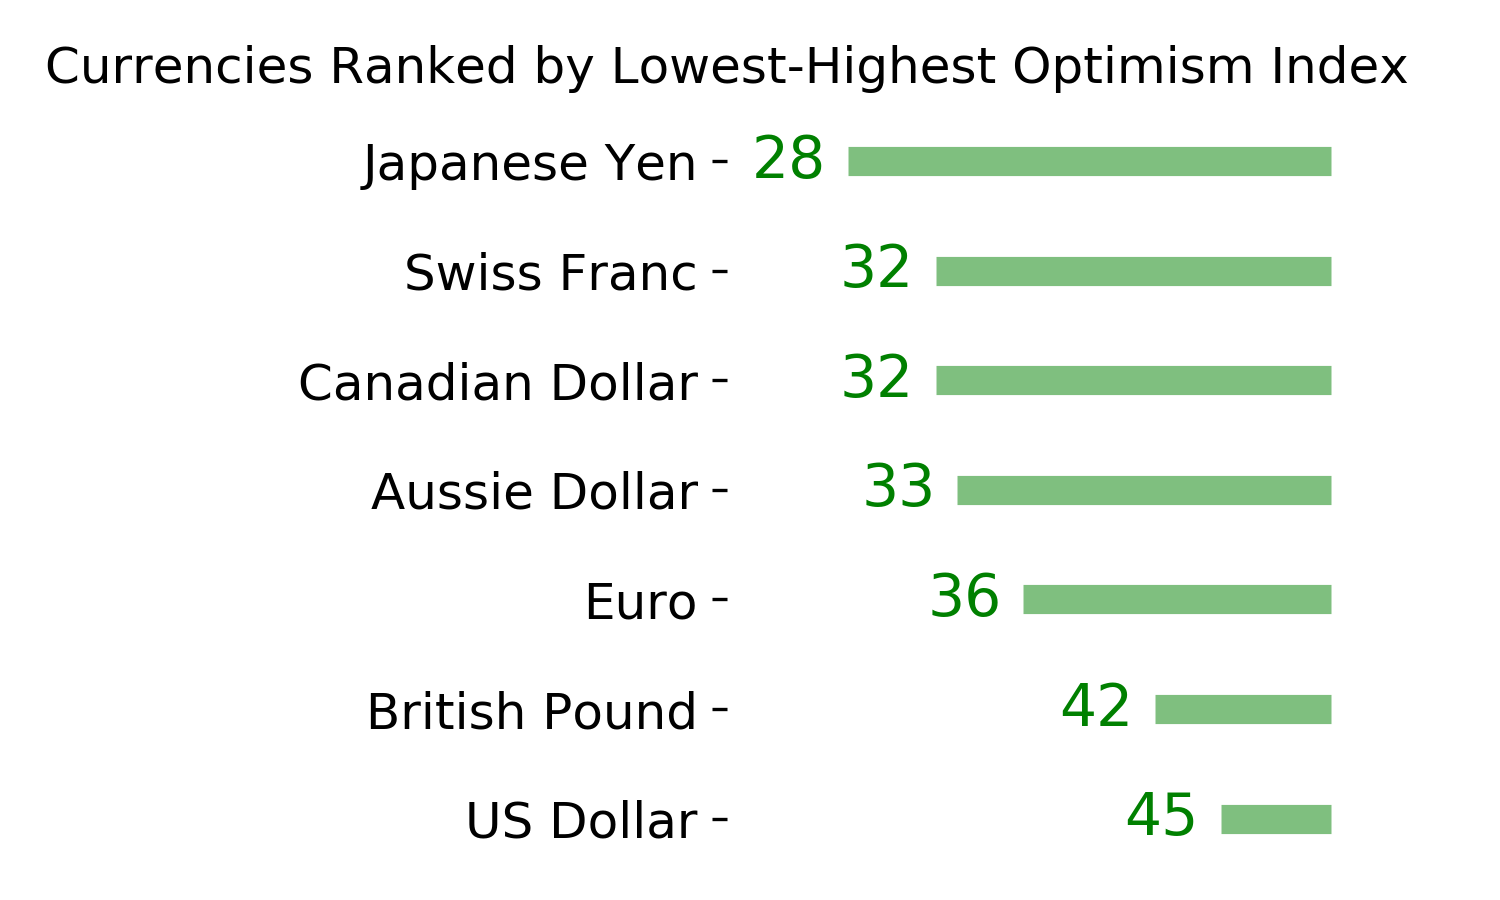
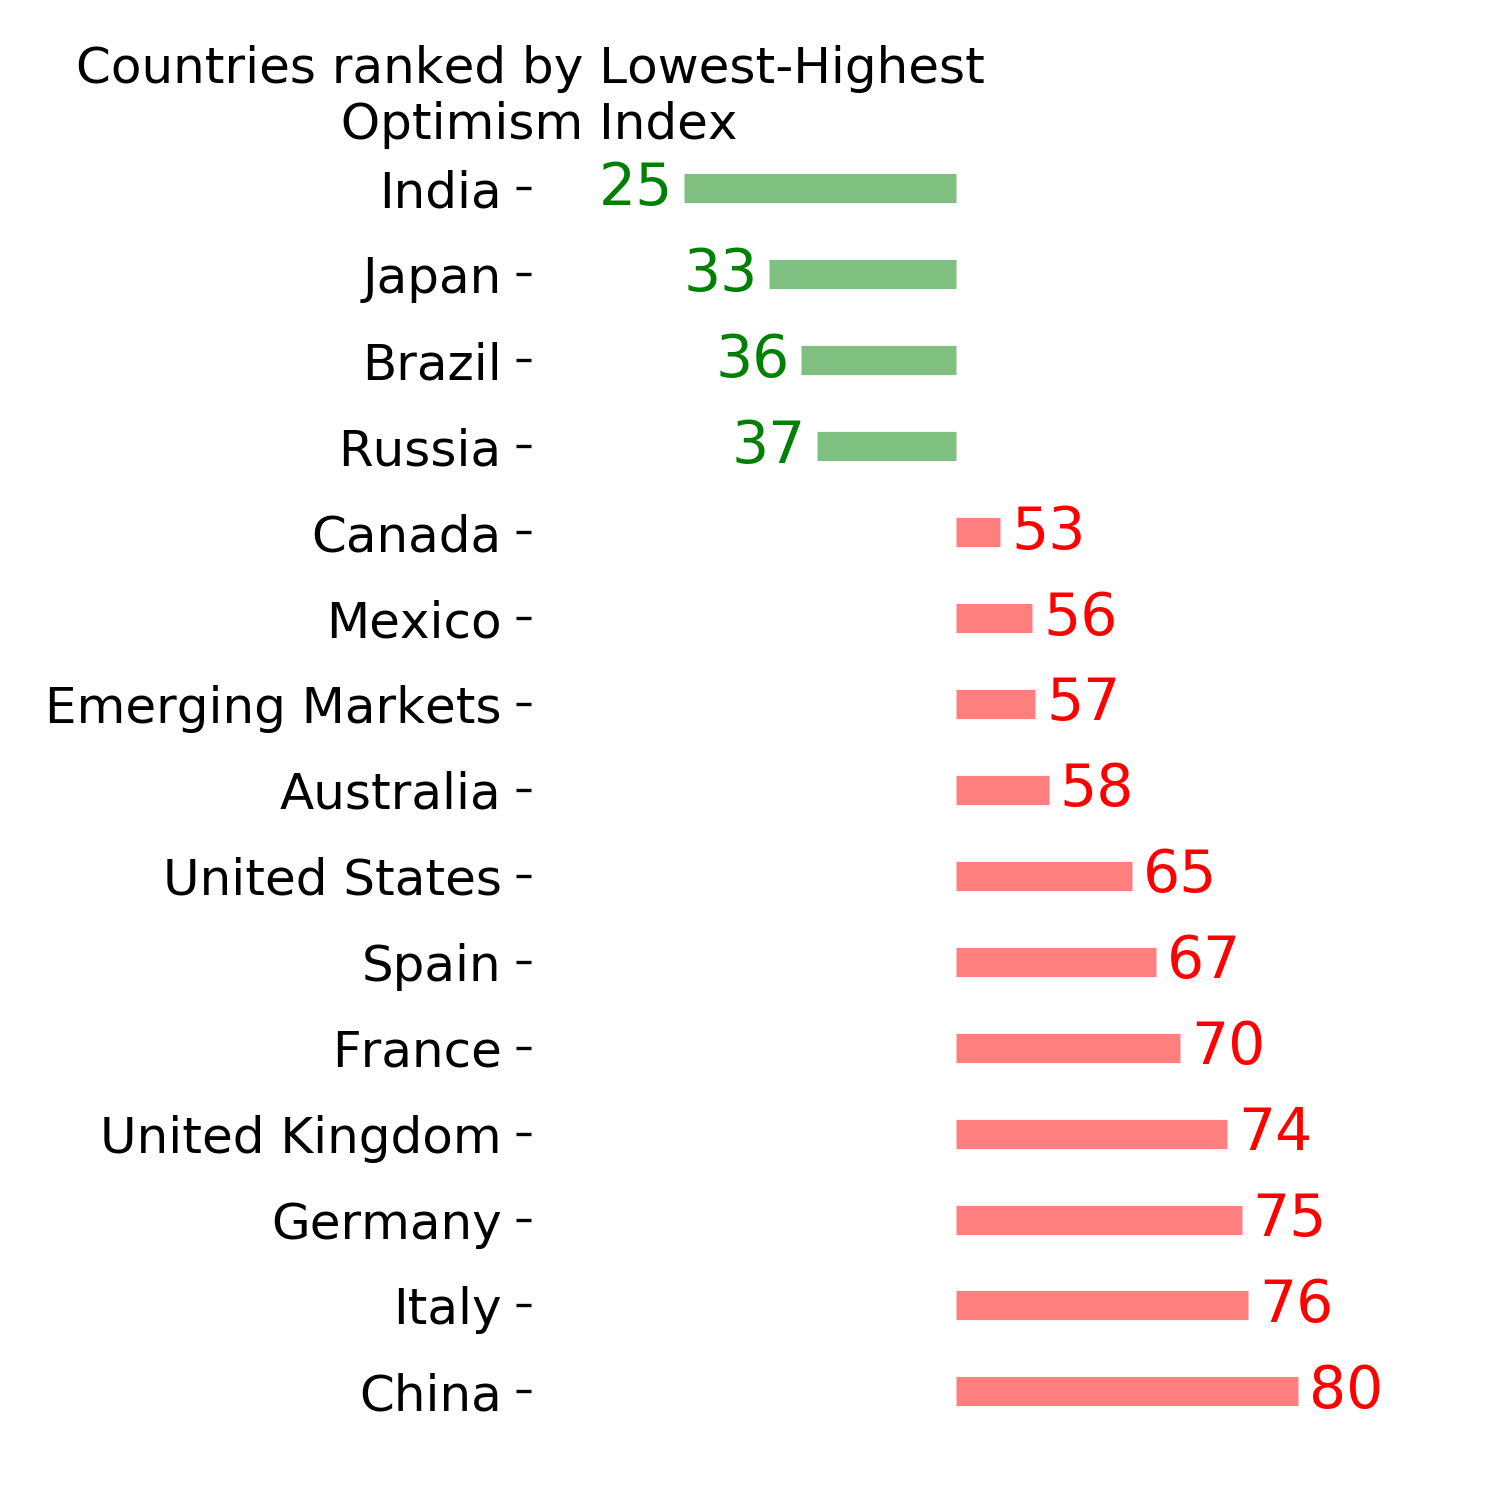
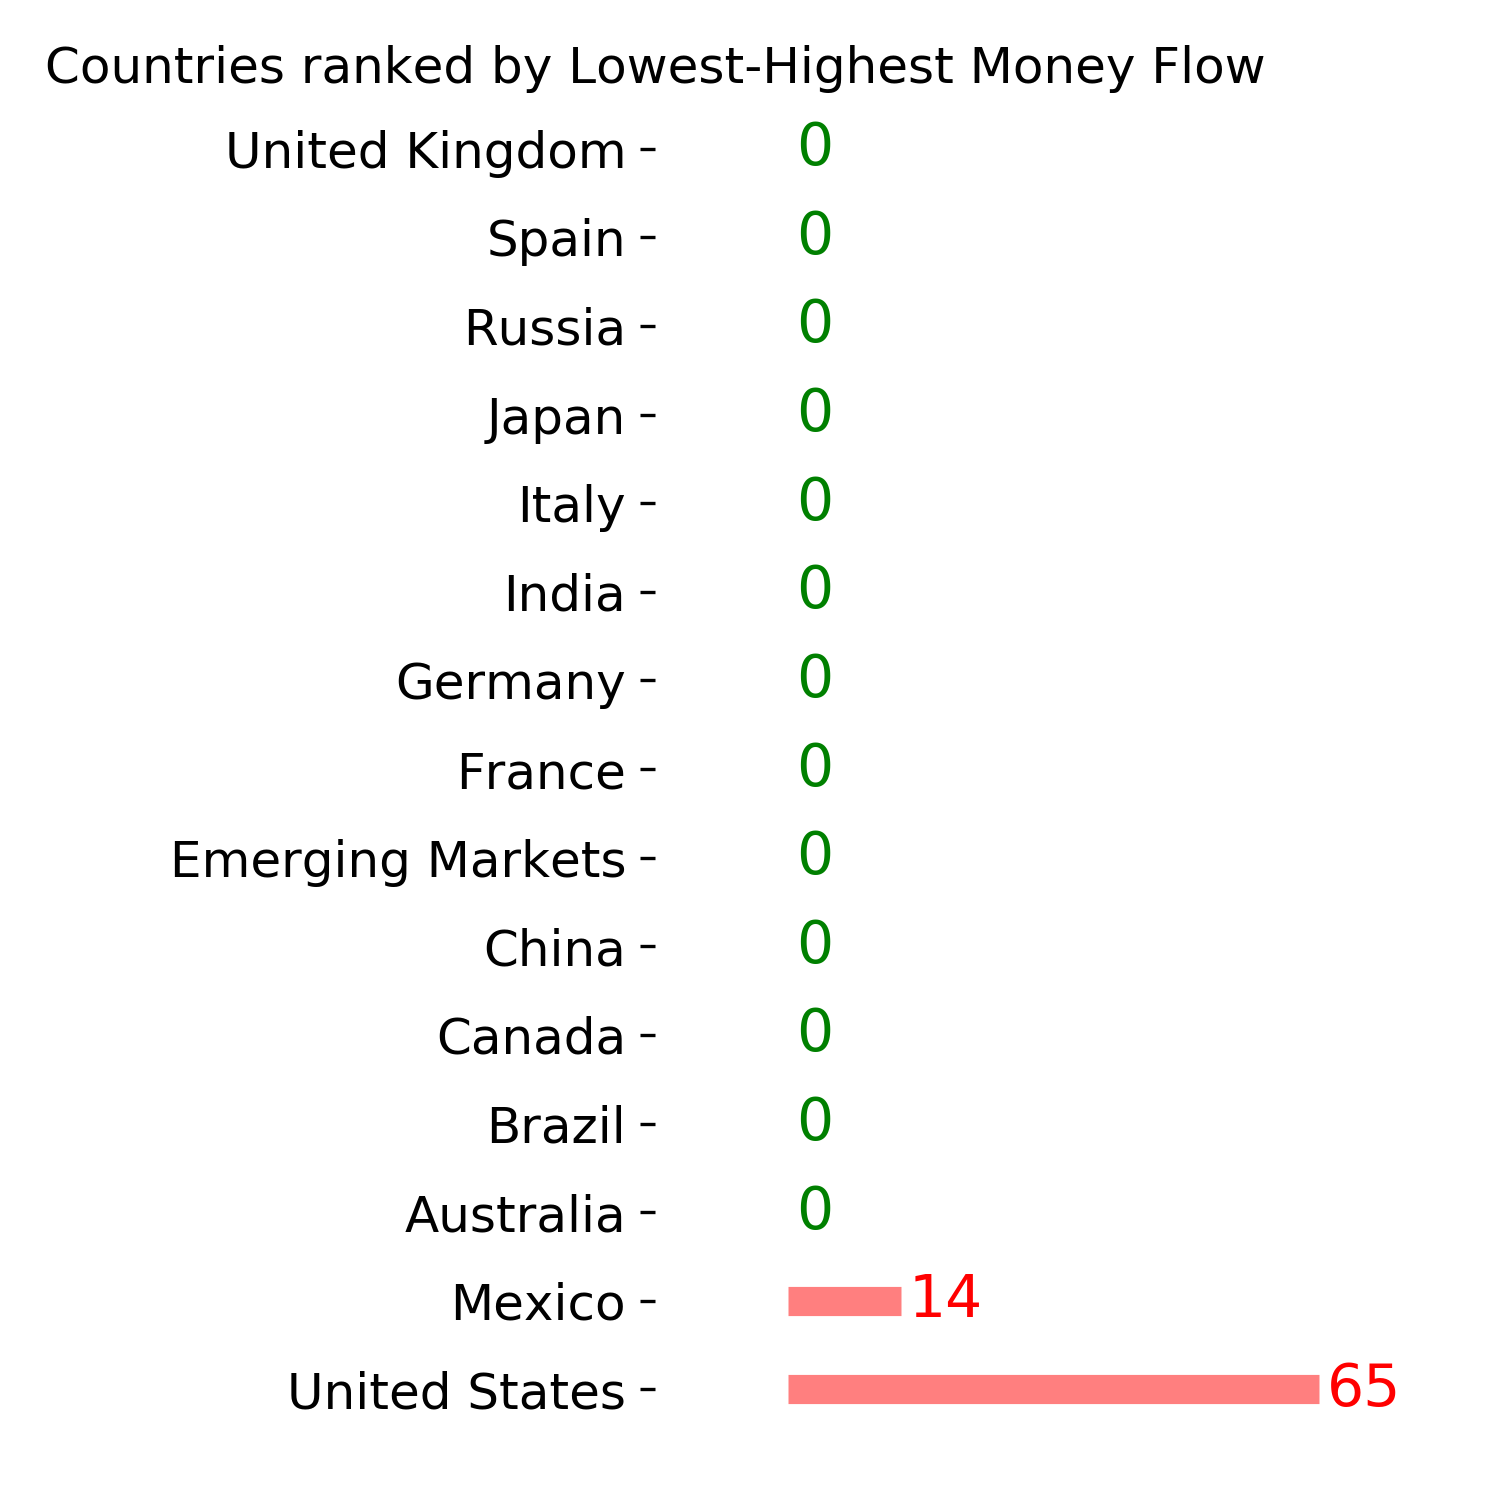
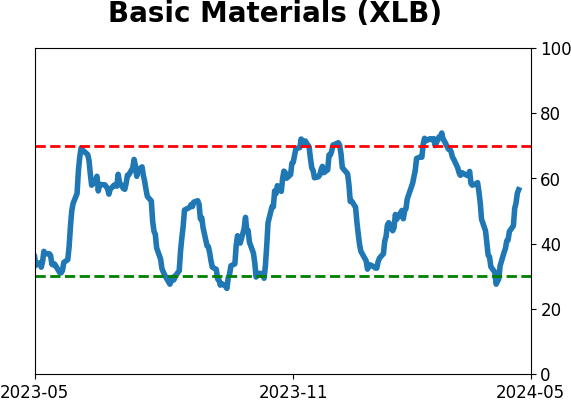
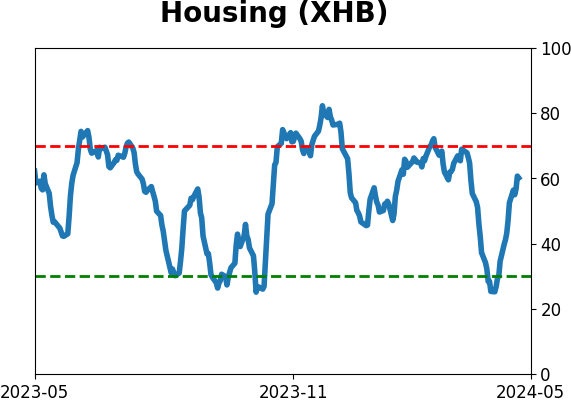
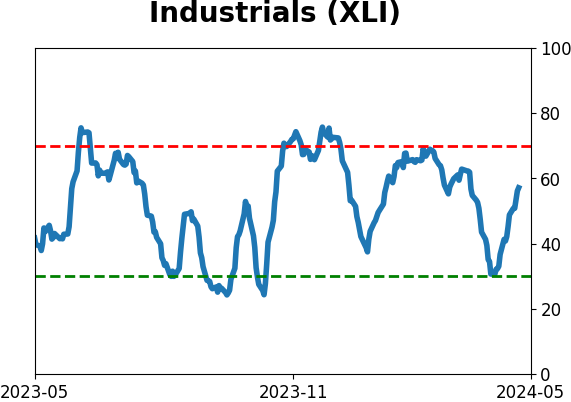
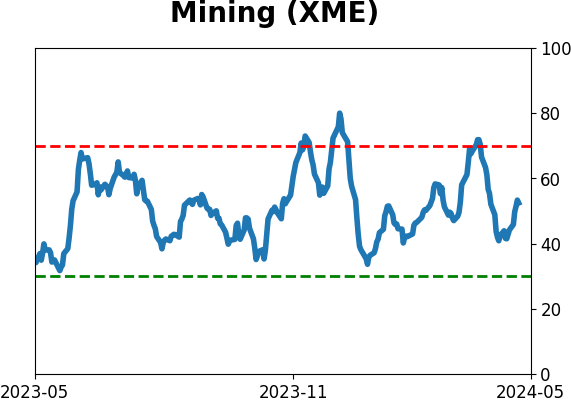
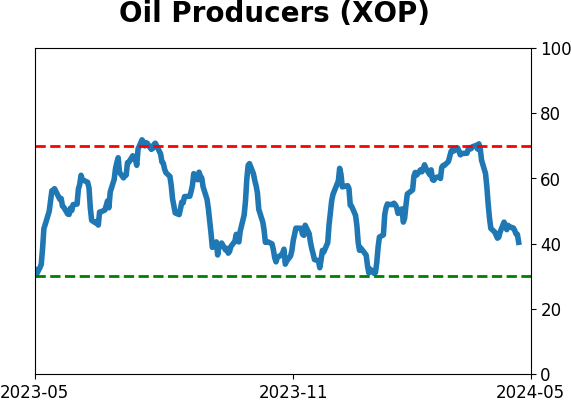
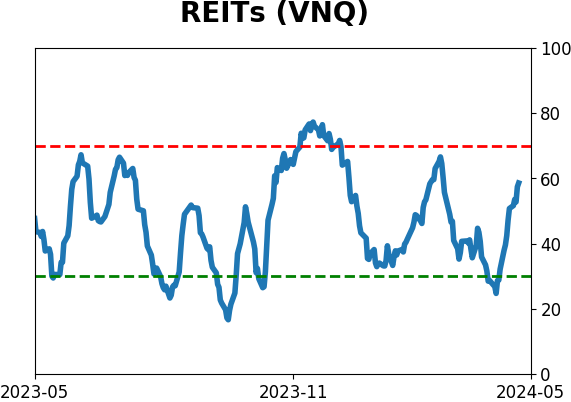
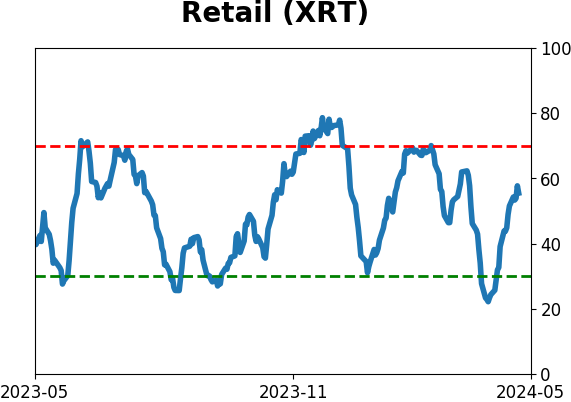
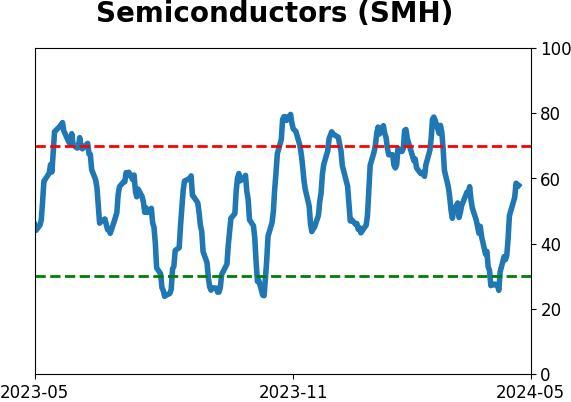
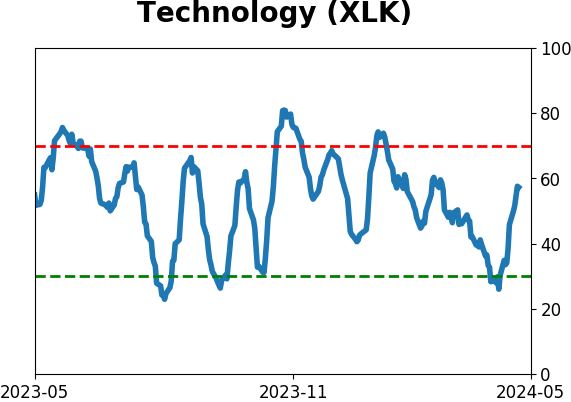
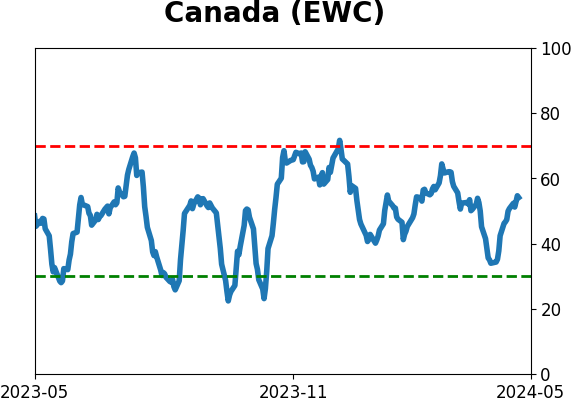
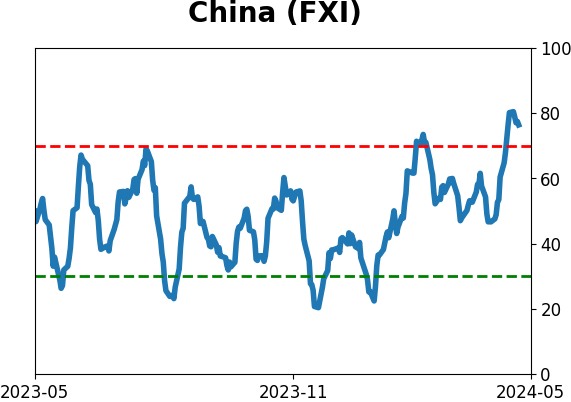
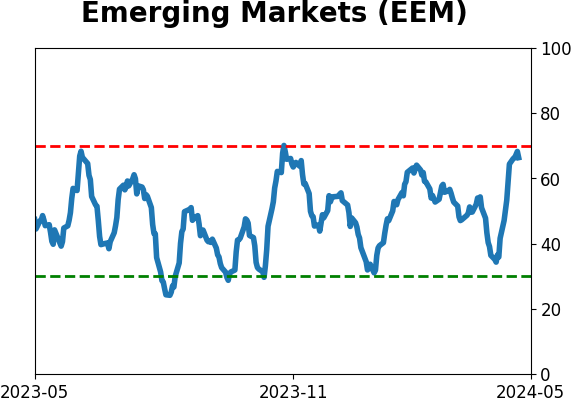
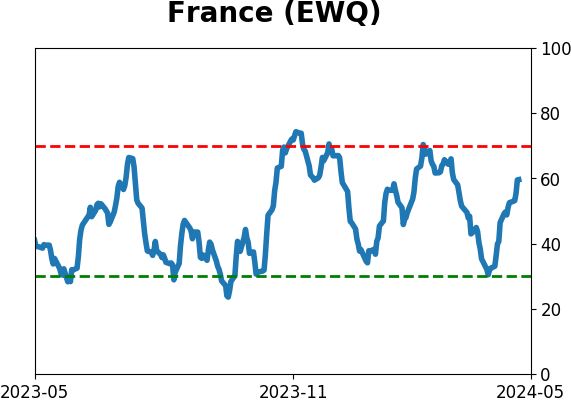
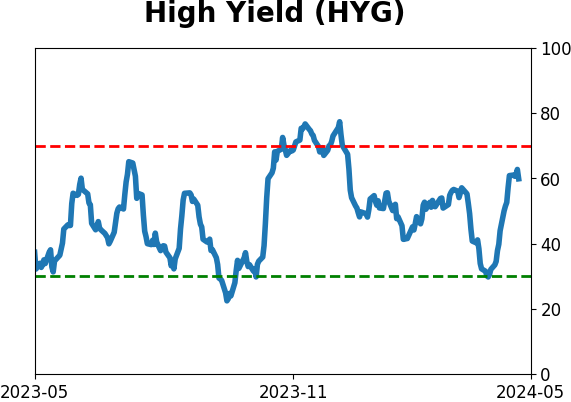
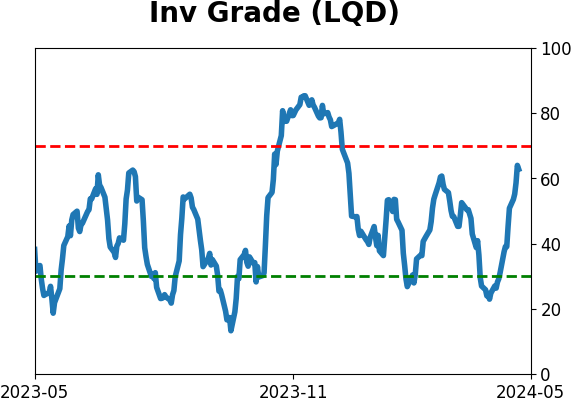
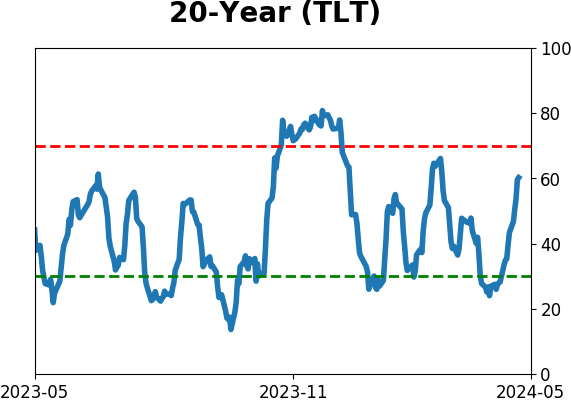
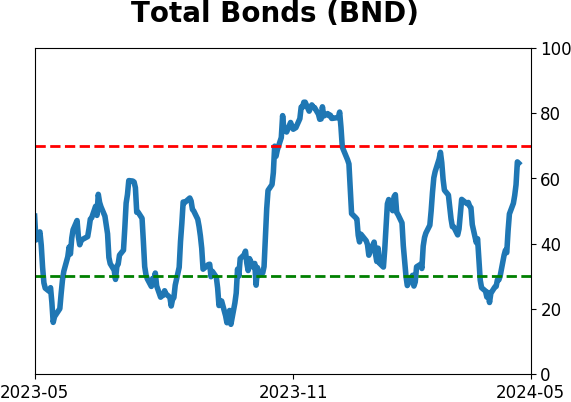
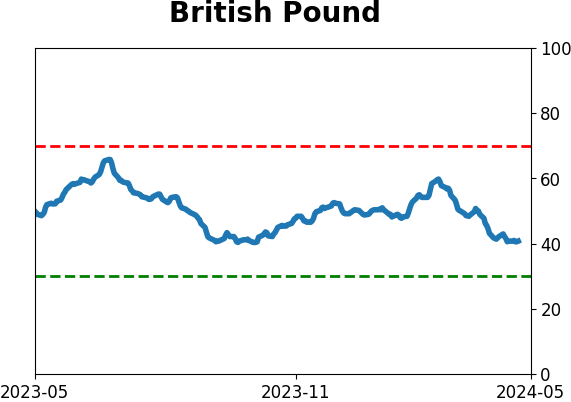
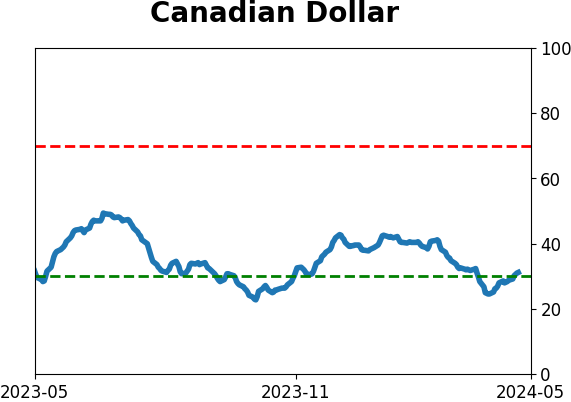
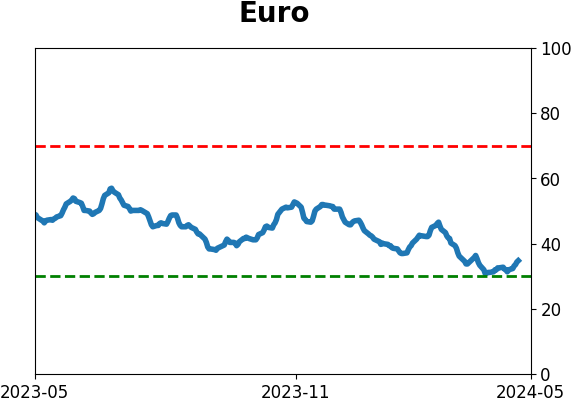
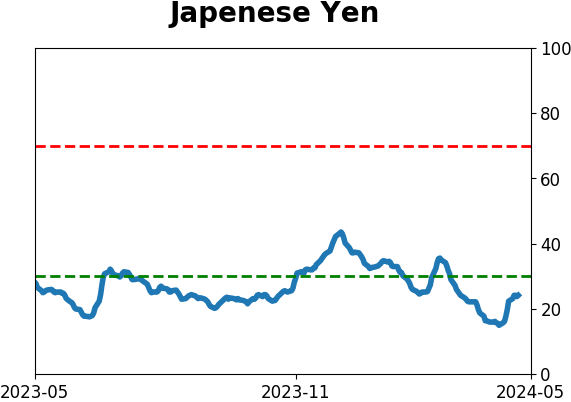
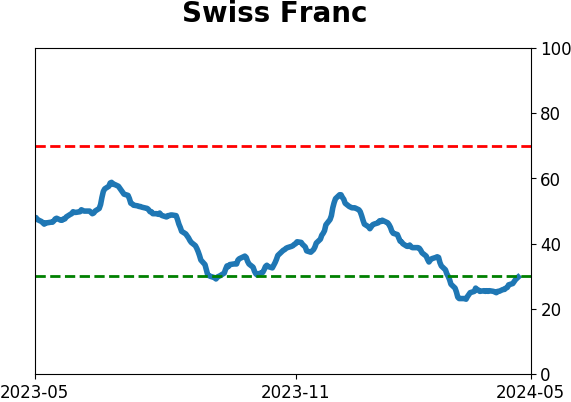
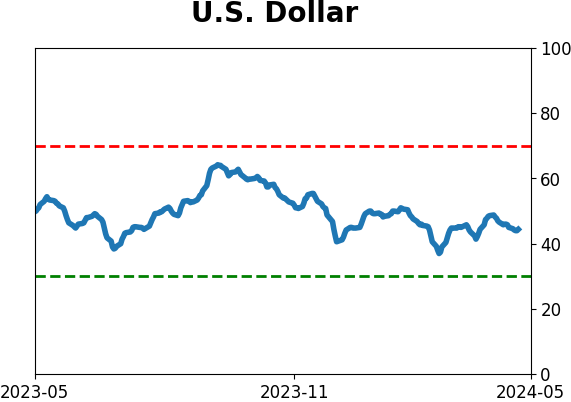
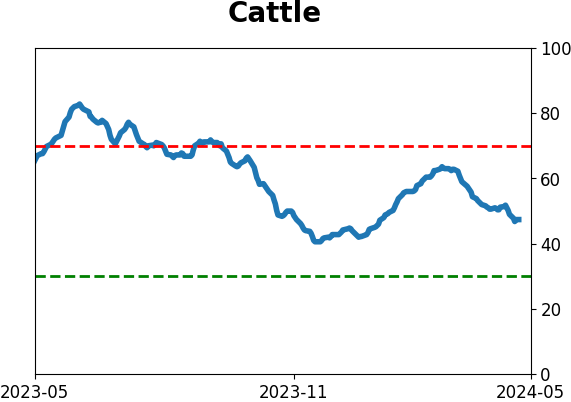
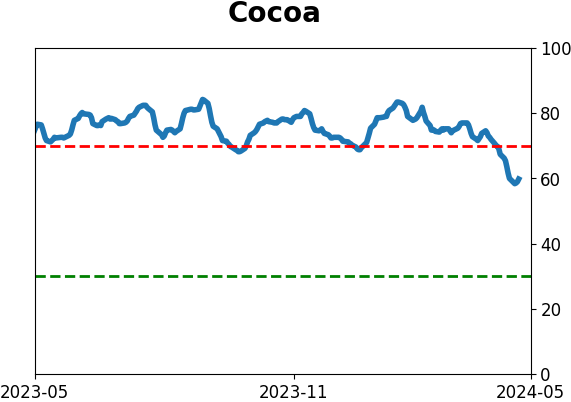
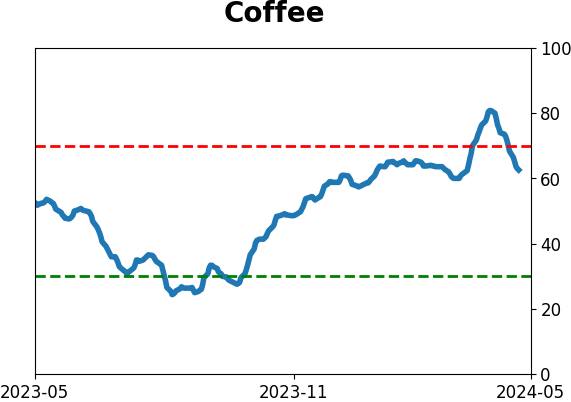
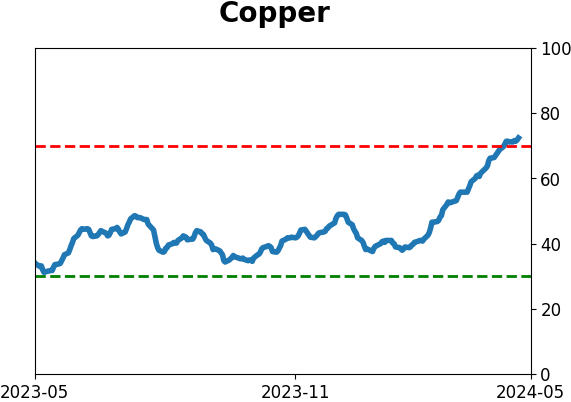
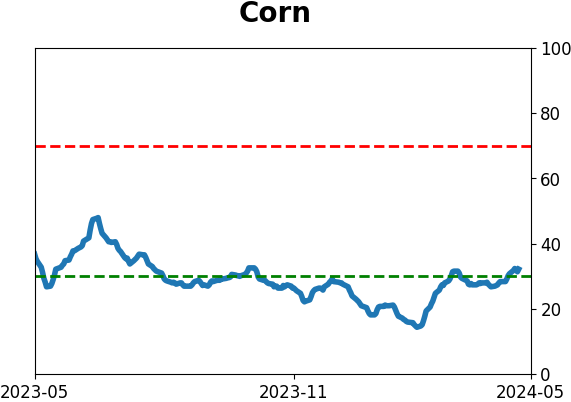
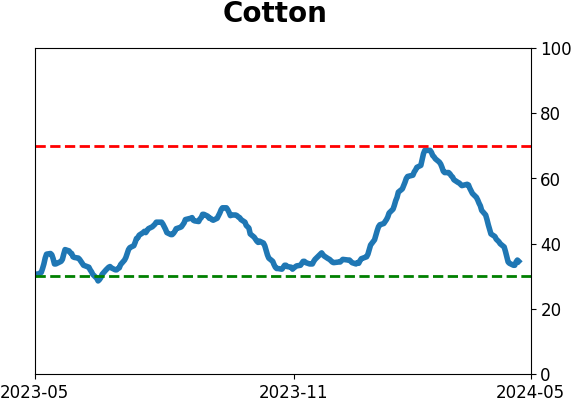
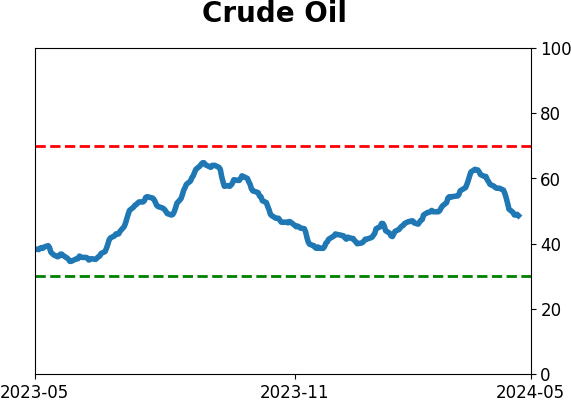
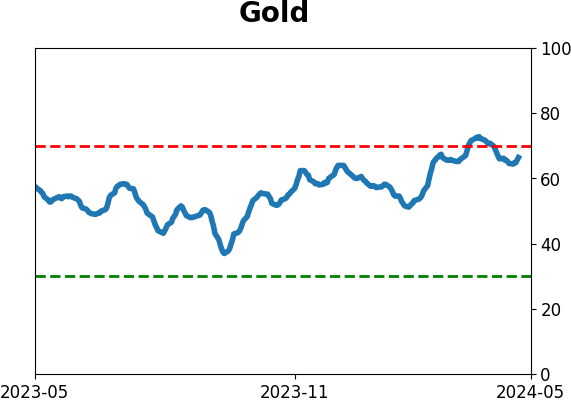
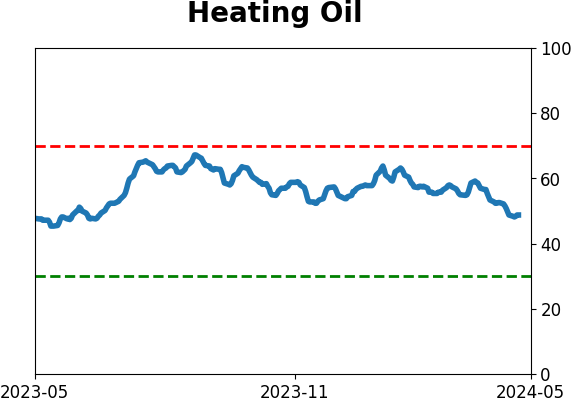
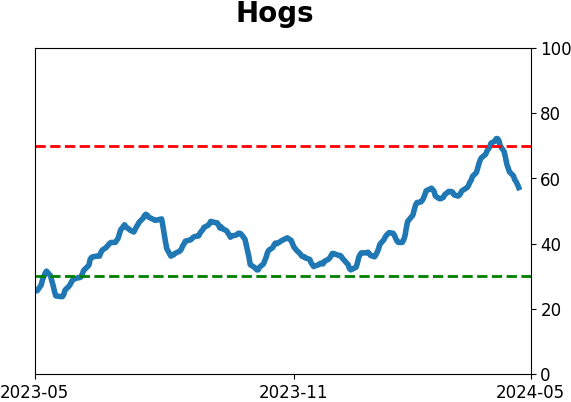
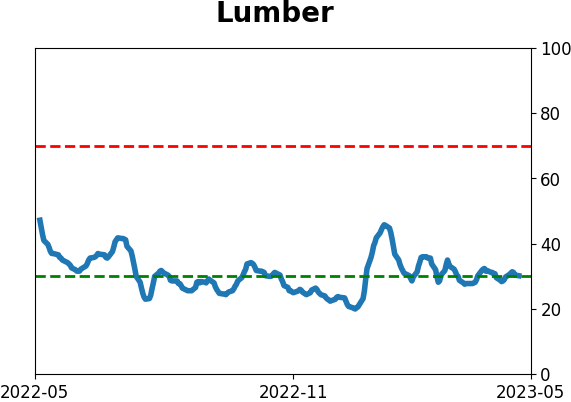
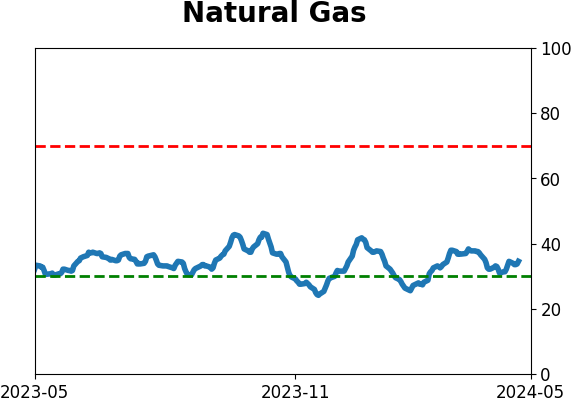
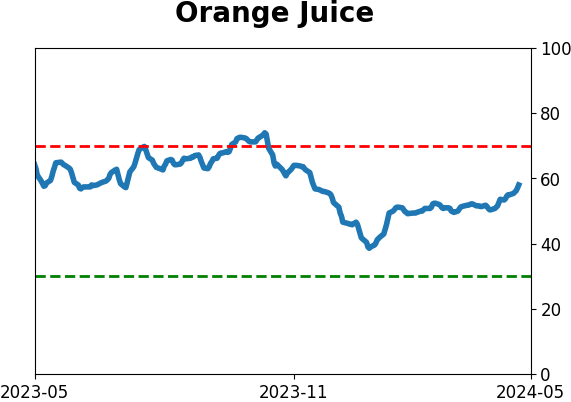
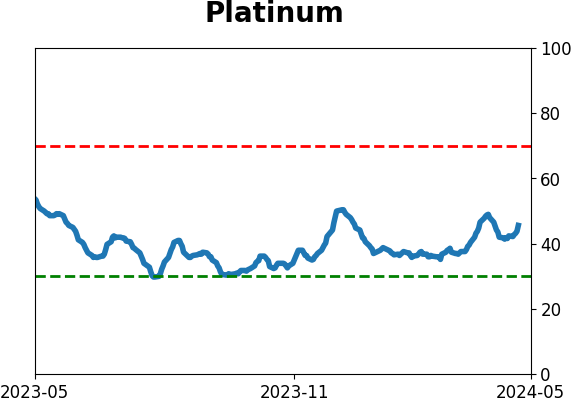
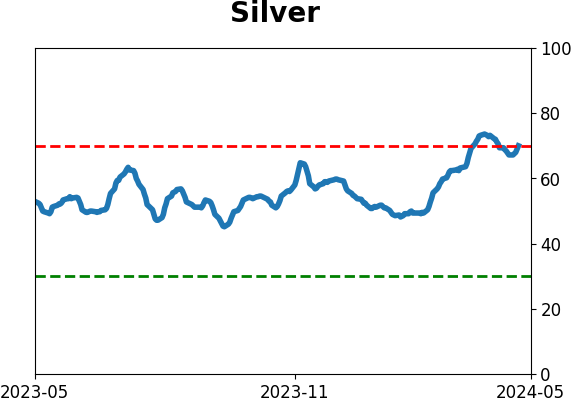
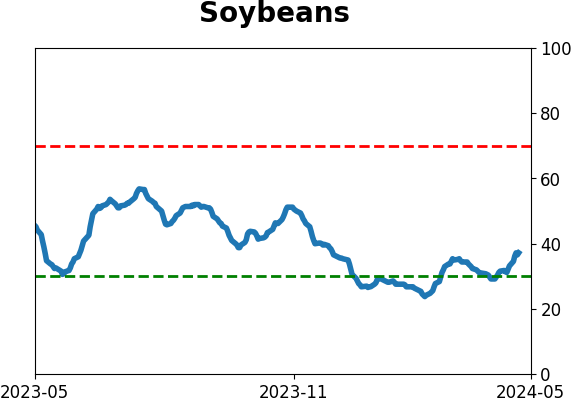
Optimism Index Thumbnails
|
|
|
|
|
|
|
|
|
|
|
|
|
|
|
|
|
|
|
|
|