Headlines
|
|
Financial conditions tighten so quickly they're likely to reverse:
Thanks to plunging stocks and bonds and volatile currencies, financial conditions are tightening substantially and quickly. A Goldman Sachs index has already jumped more than 2%, one of the largest moves in 40 years. After similar moves, stocks struggled in the short term while the dollar rallied.
|
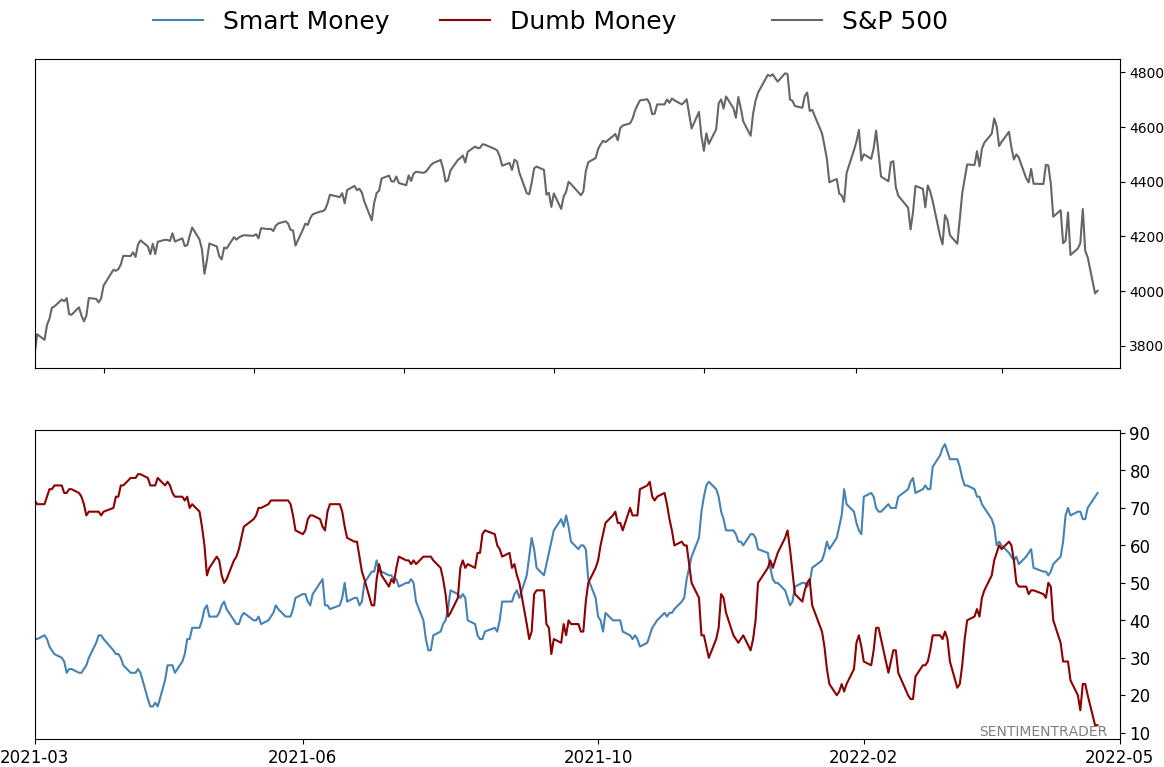
Smart / Dumb Money Confidence
|
Smart Money Confidence: 74%
Dumb Money Confidence: 12%
|
|
Risk Levels
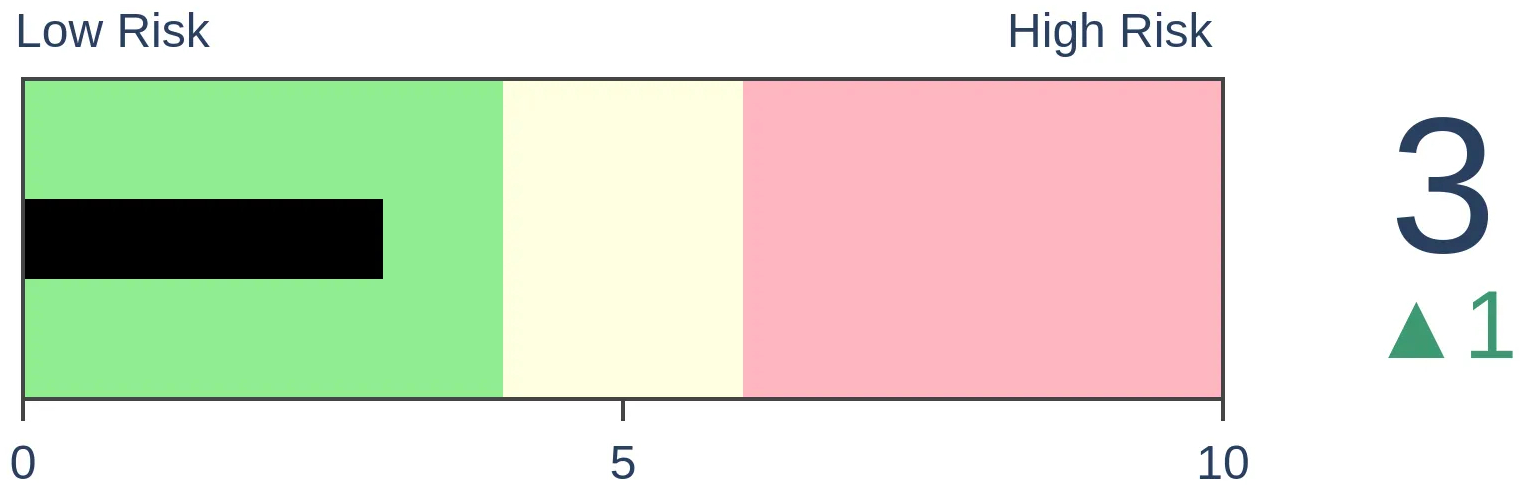
Stocks Short-Term
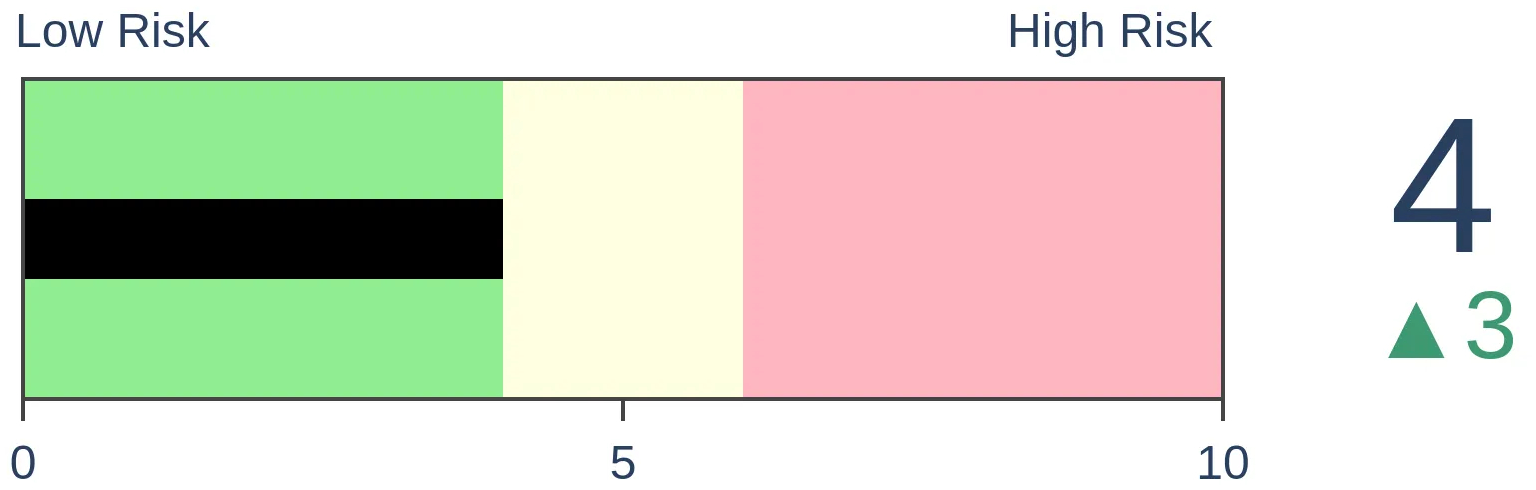
|
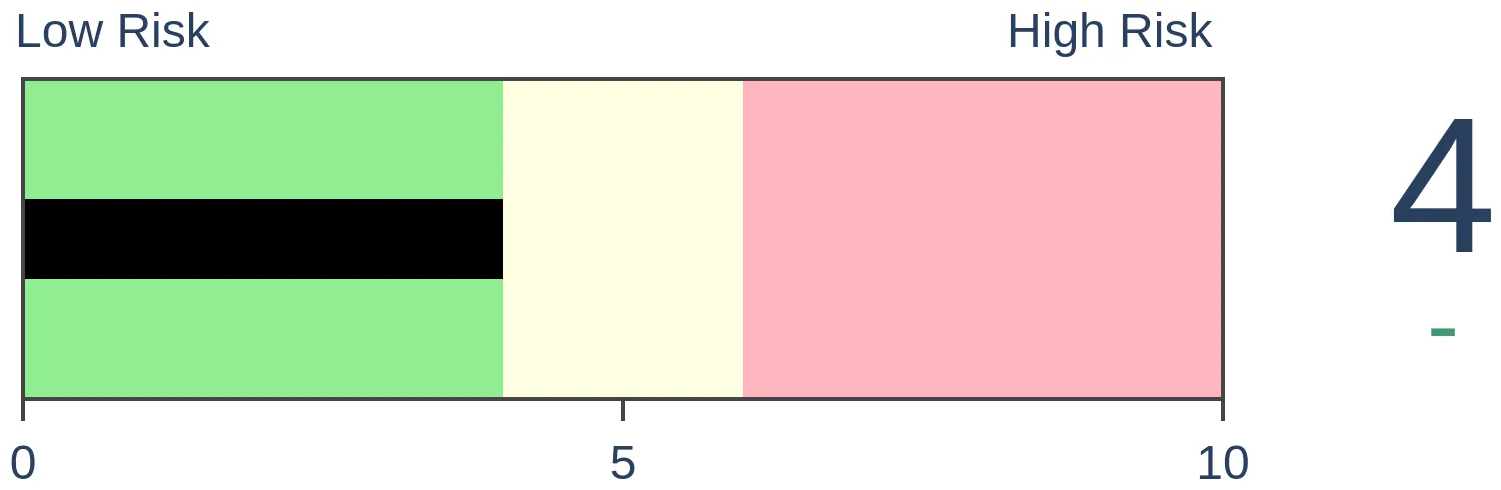
Stocks Medium-Term
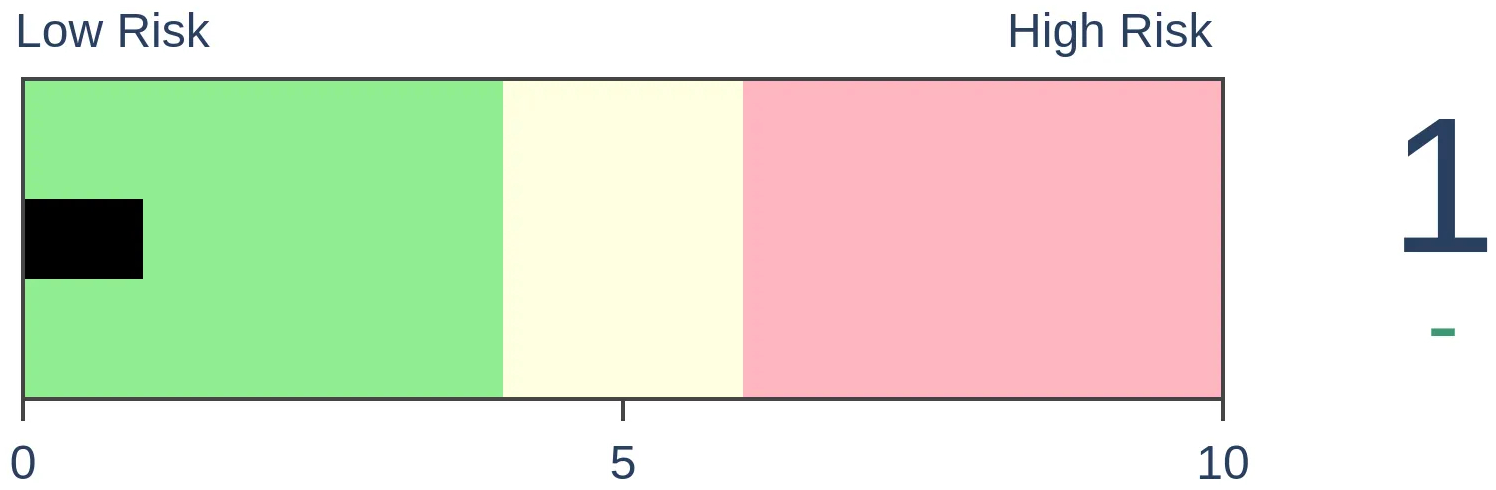
|
|
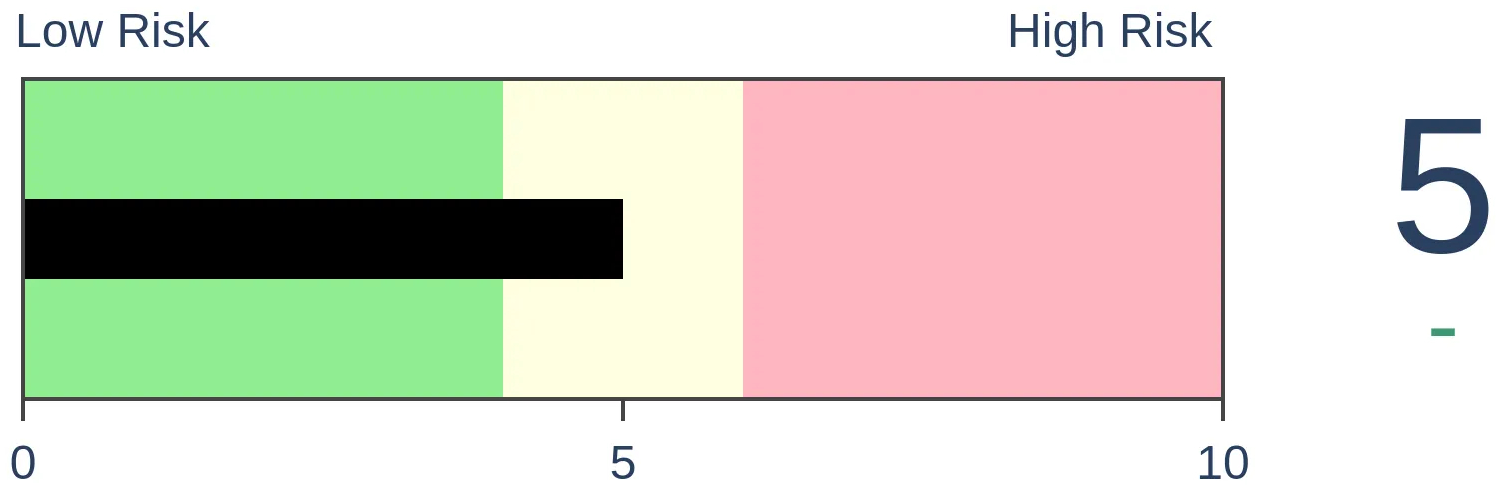
Bonds
|
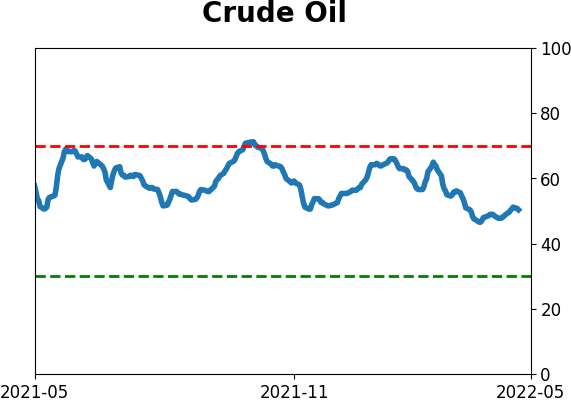
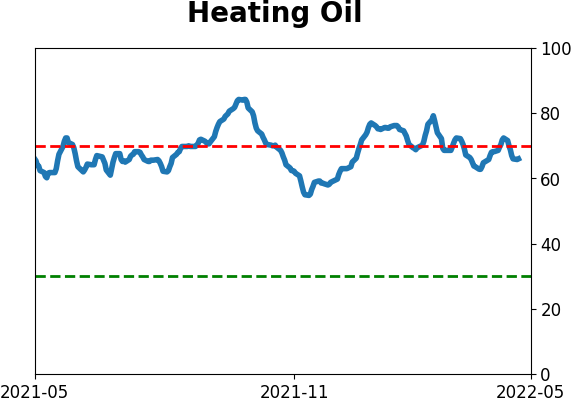
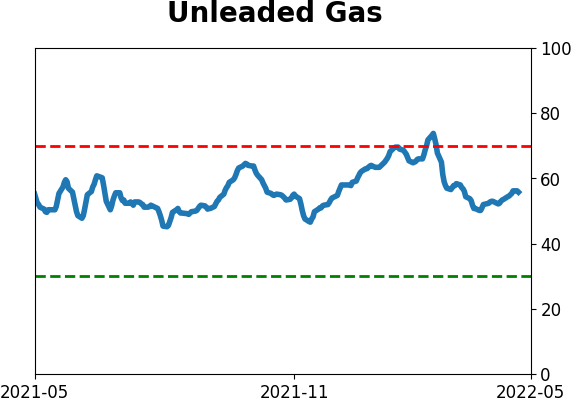
Crude Oil
|
|
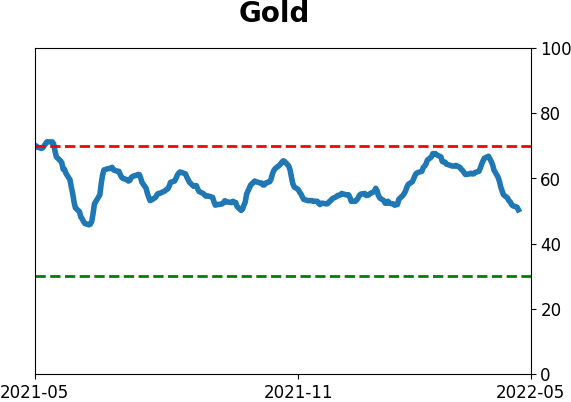
Gold
|
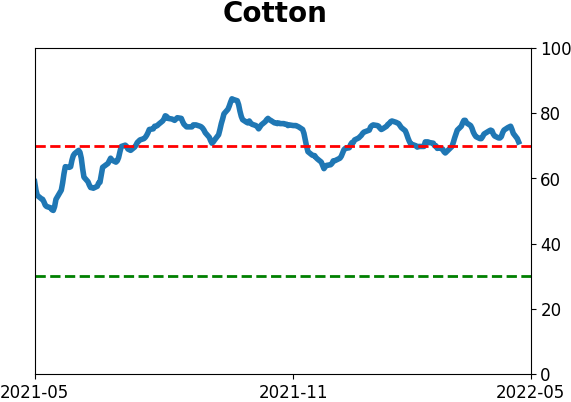
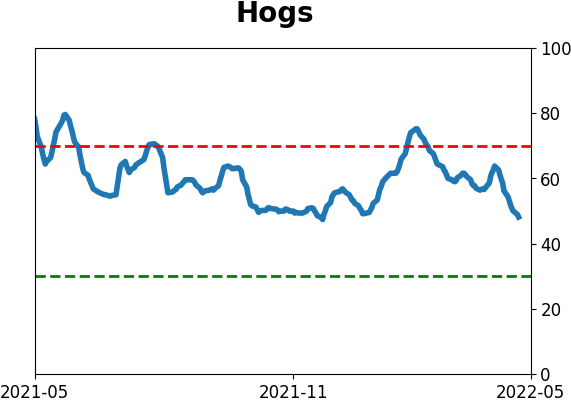
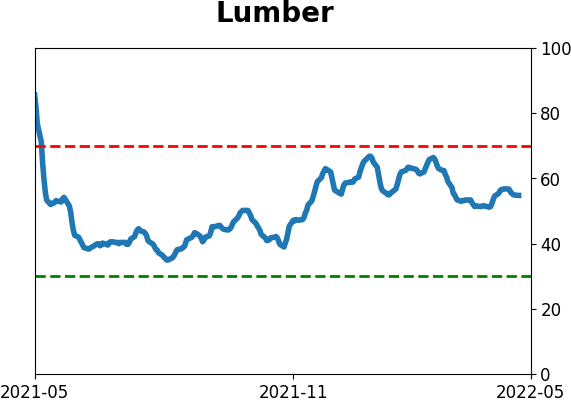
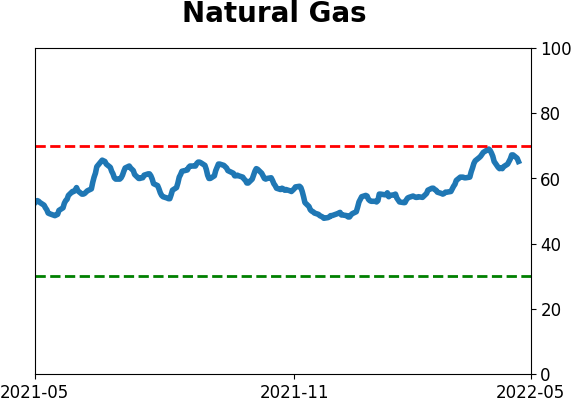
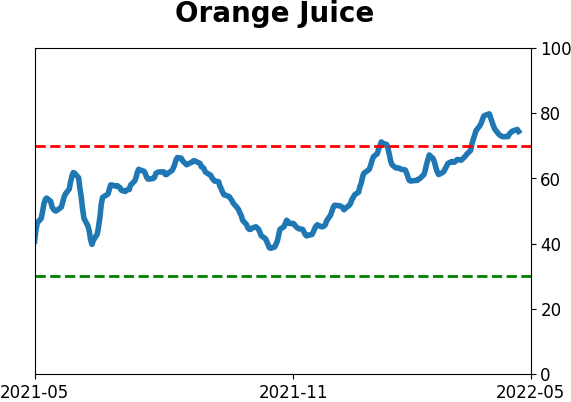
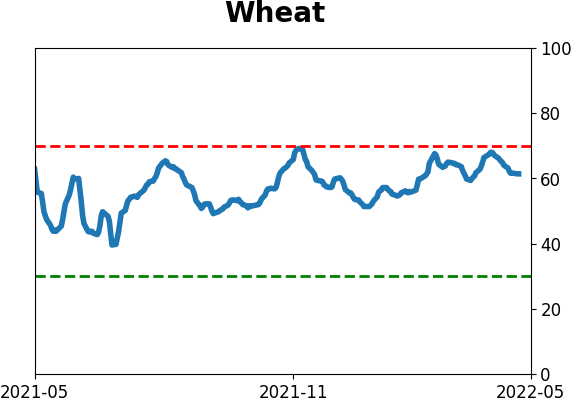
Agriculture

|
|
Research
By Jason Goepfert
BOTTOM LINE
Thanks to plunging stocks and bonds and volatile currencies, financial conditions are tightening substantially and quickly. A Goldman Sachs index has already jumped more than 2%, one of the largest moves in 40 years. After similar moves, stocks struggled in the short term while the dollar rallied.
FORECAST / TIMEFRAME
None
|
Key points:
- A Goldman Sachs index of financial conditions has jumped 2% in the past six months
- While that doesn't seem like much, it's one of the largest - and fastest - increases in 40 years
- After similar moves, stocks struggled in the short-term, and the dollar benefitted
One of the fastest tightening cycles in 40 years
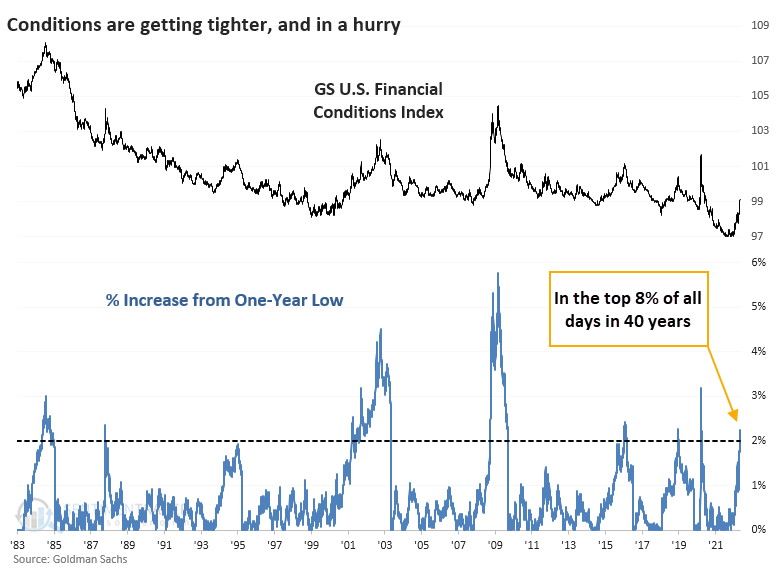
With a plunging stock market, rising interest rates, and increasing currency volatility, financial conditions are tightening fast. The Goldman Sachs U.S. Financial Conditions Index has soared since it was sitting at all-time lows less than six months ago.
The Financial Conditions Index incorporates indicators like exchange rates, equity volatility, and borrowing costs, all of which affect the availability of funding.
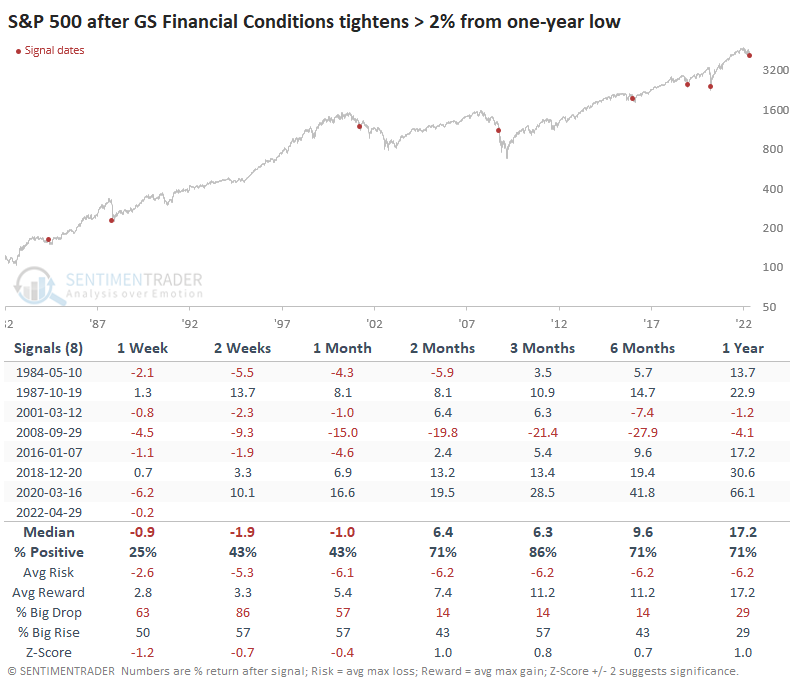
While a 2% tightening in financial conditions doesn't sound like much, it ranks in the top 8% of all readings over the past 40 years. It has also happened very fast - it's the third-quickest tightening out of all cycles, behind the crashes in 1987 and 2020.
Stock investors did not like these developments. Once financial conditions tightened 2% from a low, the S&P 500 tended to suffer short-term losses. The only exceptions were the aftermath of the '87 crash, when the plunge in stock prices was the main driver of tightening conditions, and 2018 when stocks suffered the Christmas panic. While short-term returns were weak, over the medium- to long-term, the only losses were in 2008 and 2001 - granted, huge exceptions. But even 2001 saw a multi-month rebound before failing again.
A negative for overseas markets and commodities
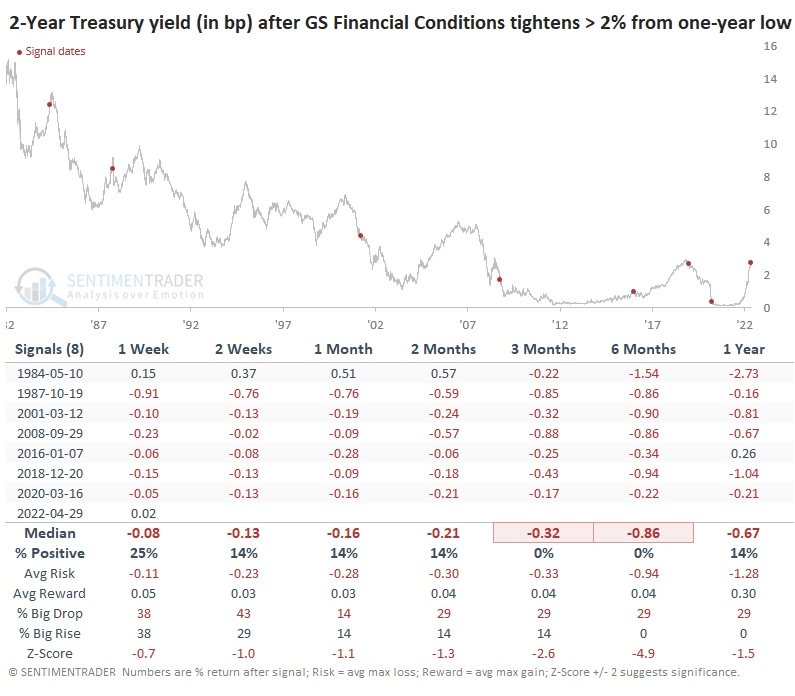
Part of the reason why stocks tended to rebound over the next several months is that conditions tended to get more favorable. The yield on 2-year Treasuries declined over the next 3-6 months every time. This yield has an extremely tight correlation with the FOMC's target interest rate.
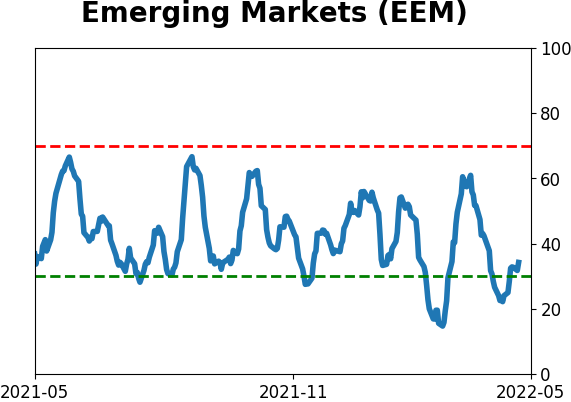
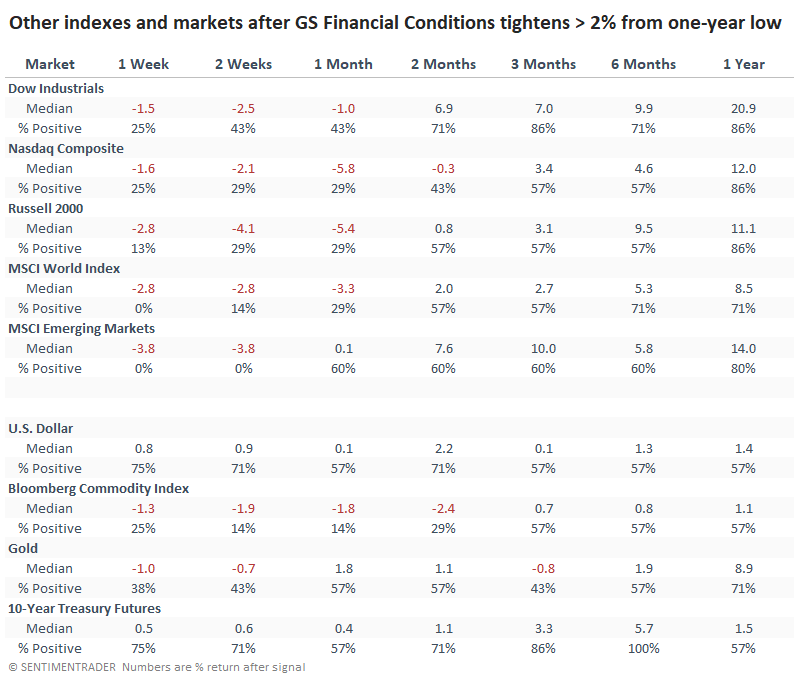
The Nasdaq Composite and Russell 2000 struggled during the first month, then showed better returns, but the Dow Industrials were more consistently positive among other indexes and markets. Overseas markets, especially emerging markets, performed horribly in the first month, then tended to rebound over the medium- to long-term.
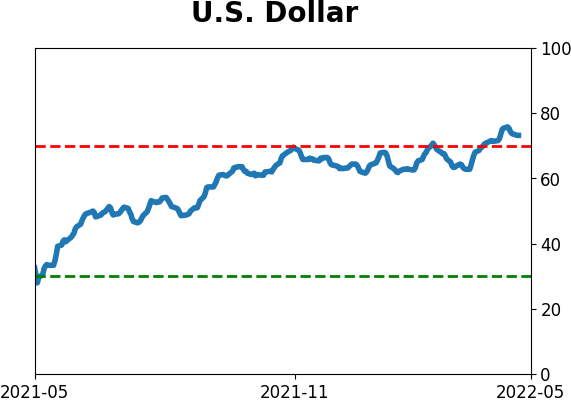
The U.S. dollar did well in the immediate aftermath of the tighter conditions, which meant that commodities and gold struggled. Both trends evened out in the months following. Because of the mostly favorable environment for bonds since the inception of the data in 1982, 10-year Treasury futures did well, especially over the next six months when they showed a gain after each signal.
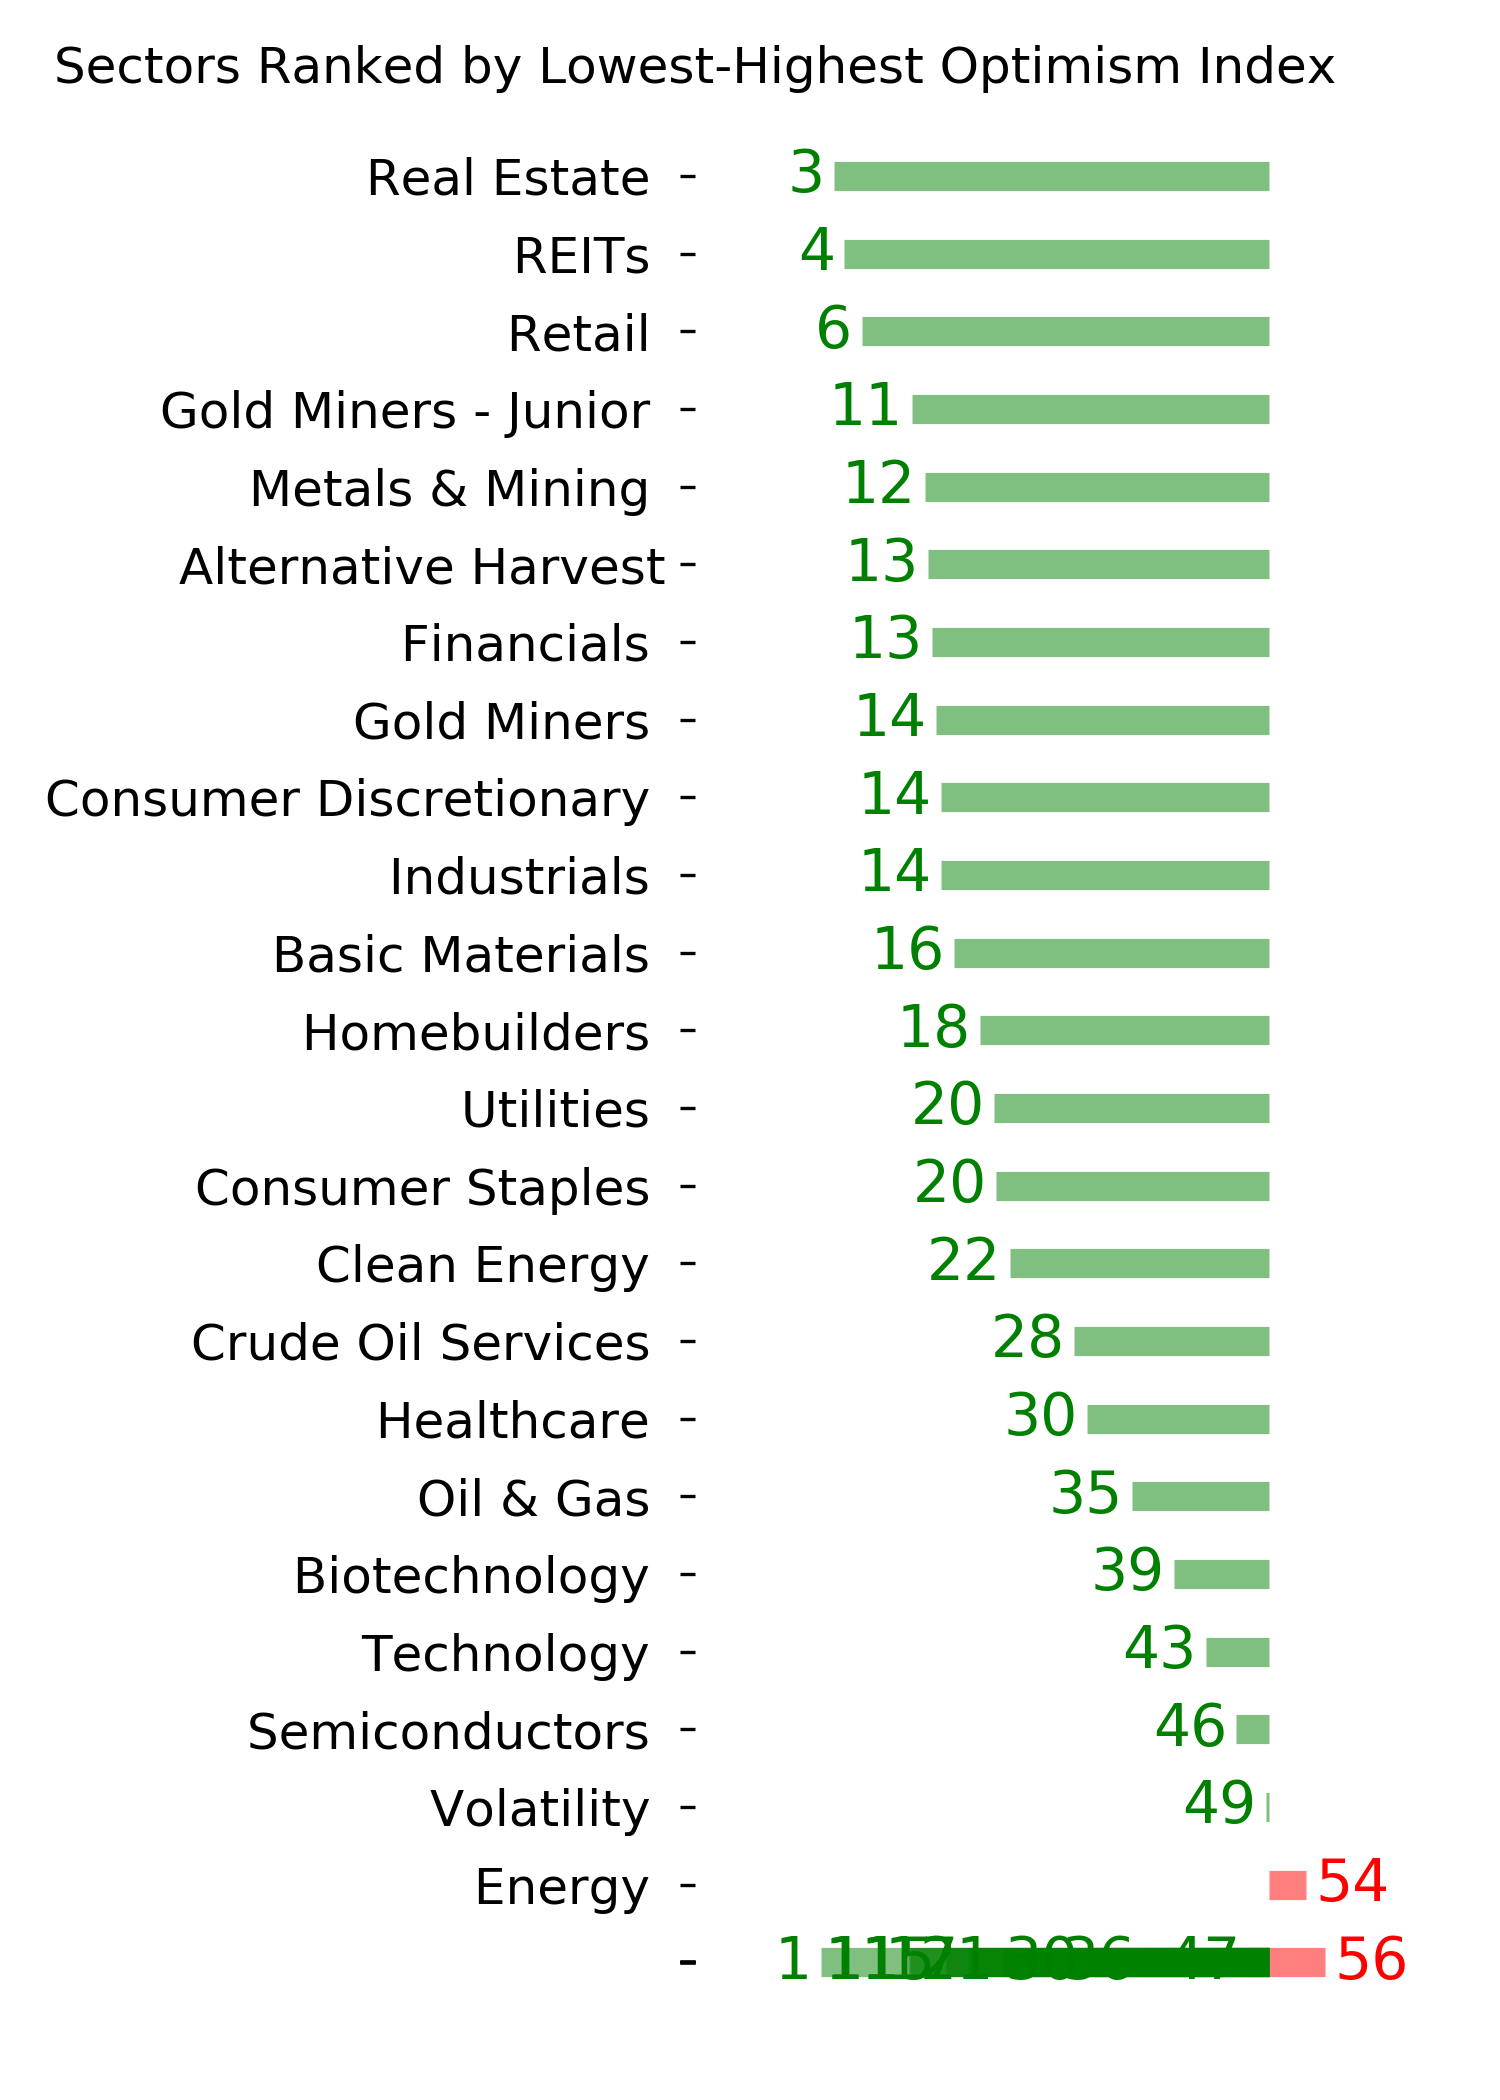
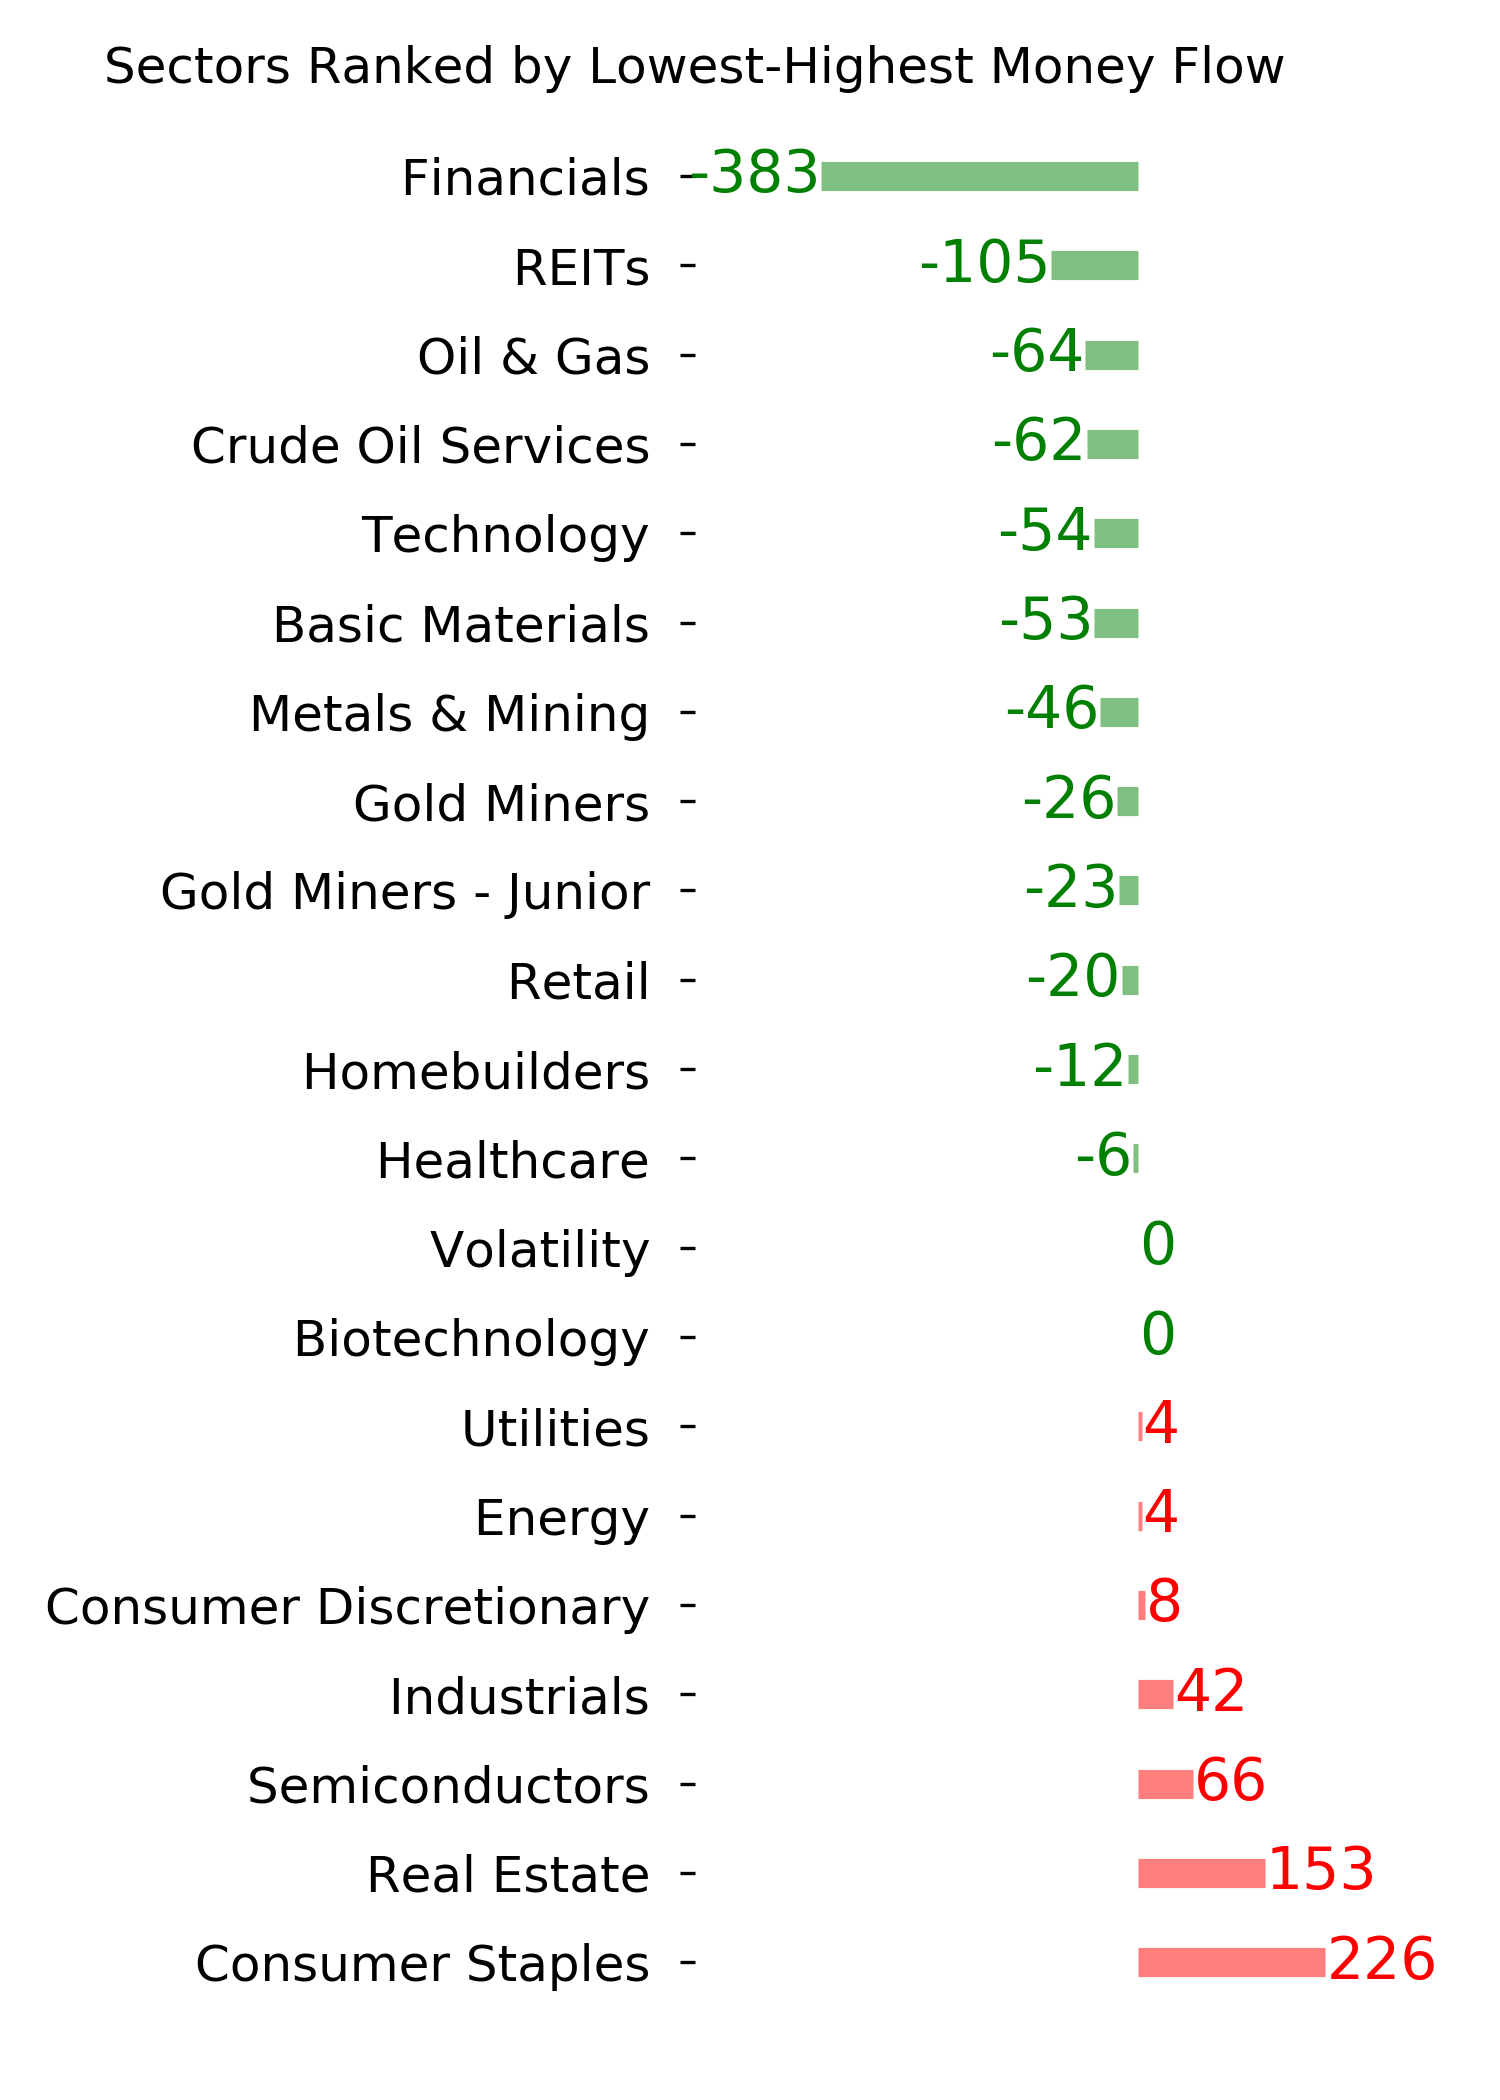
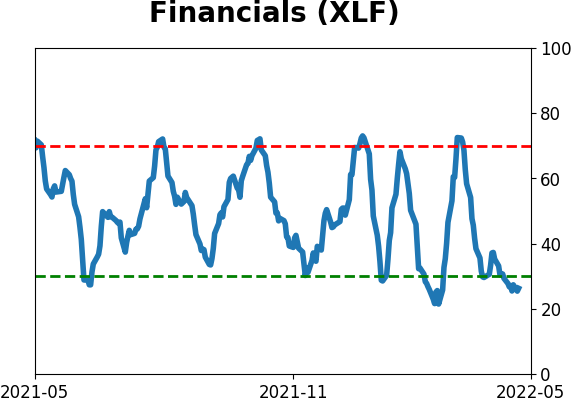
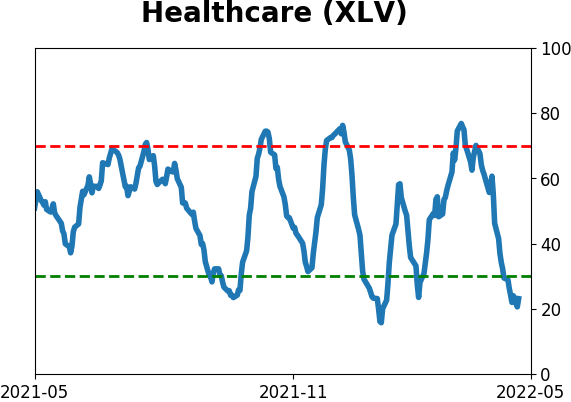
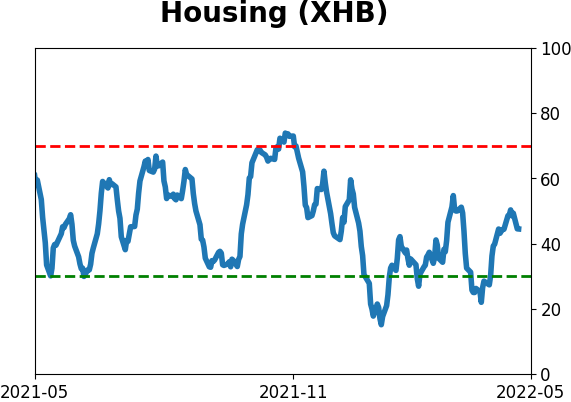
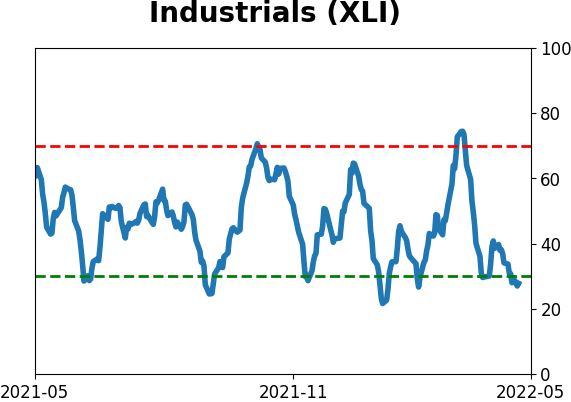
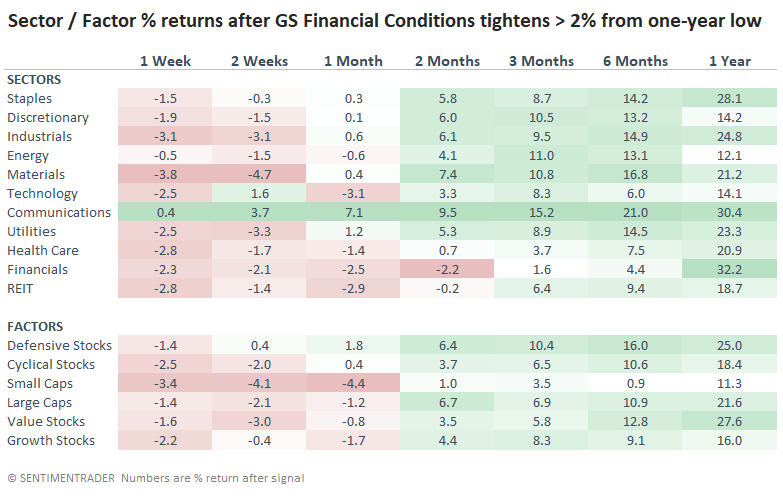
Among sectors and factors, defensive groups tended to fare the best, though Financials were in the running over the long term. They were the only sector with a negative median return two months later but also one of only two sectors or factors with a larger than 30% median return over the next year.
What the research tells us...
Tightening funding conditions are not a positive development for almost any financial asset. Those who are long should want conditions to loosen. The only saving grace is that conditions have tightened so fast that some external factor will help put a brake on the rise. While a rise of 2% from a low in financial conditions ranks among the most extreme moves in 40 years, they can go further, and 2001 and 2008 prove that it doesn't necessarily mean the end of selling pressure. But typically, it does mean that further short-term weakness would be likely to reverse in the coming months.
Indicators at Extremes
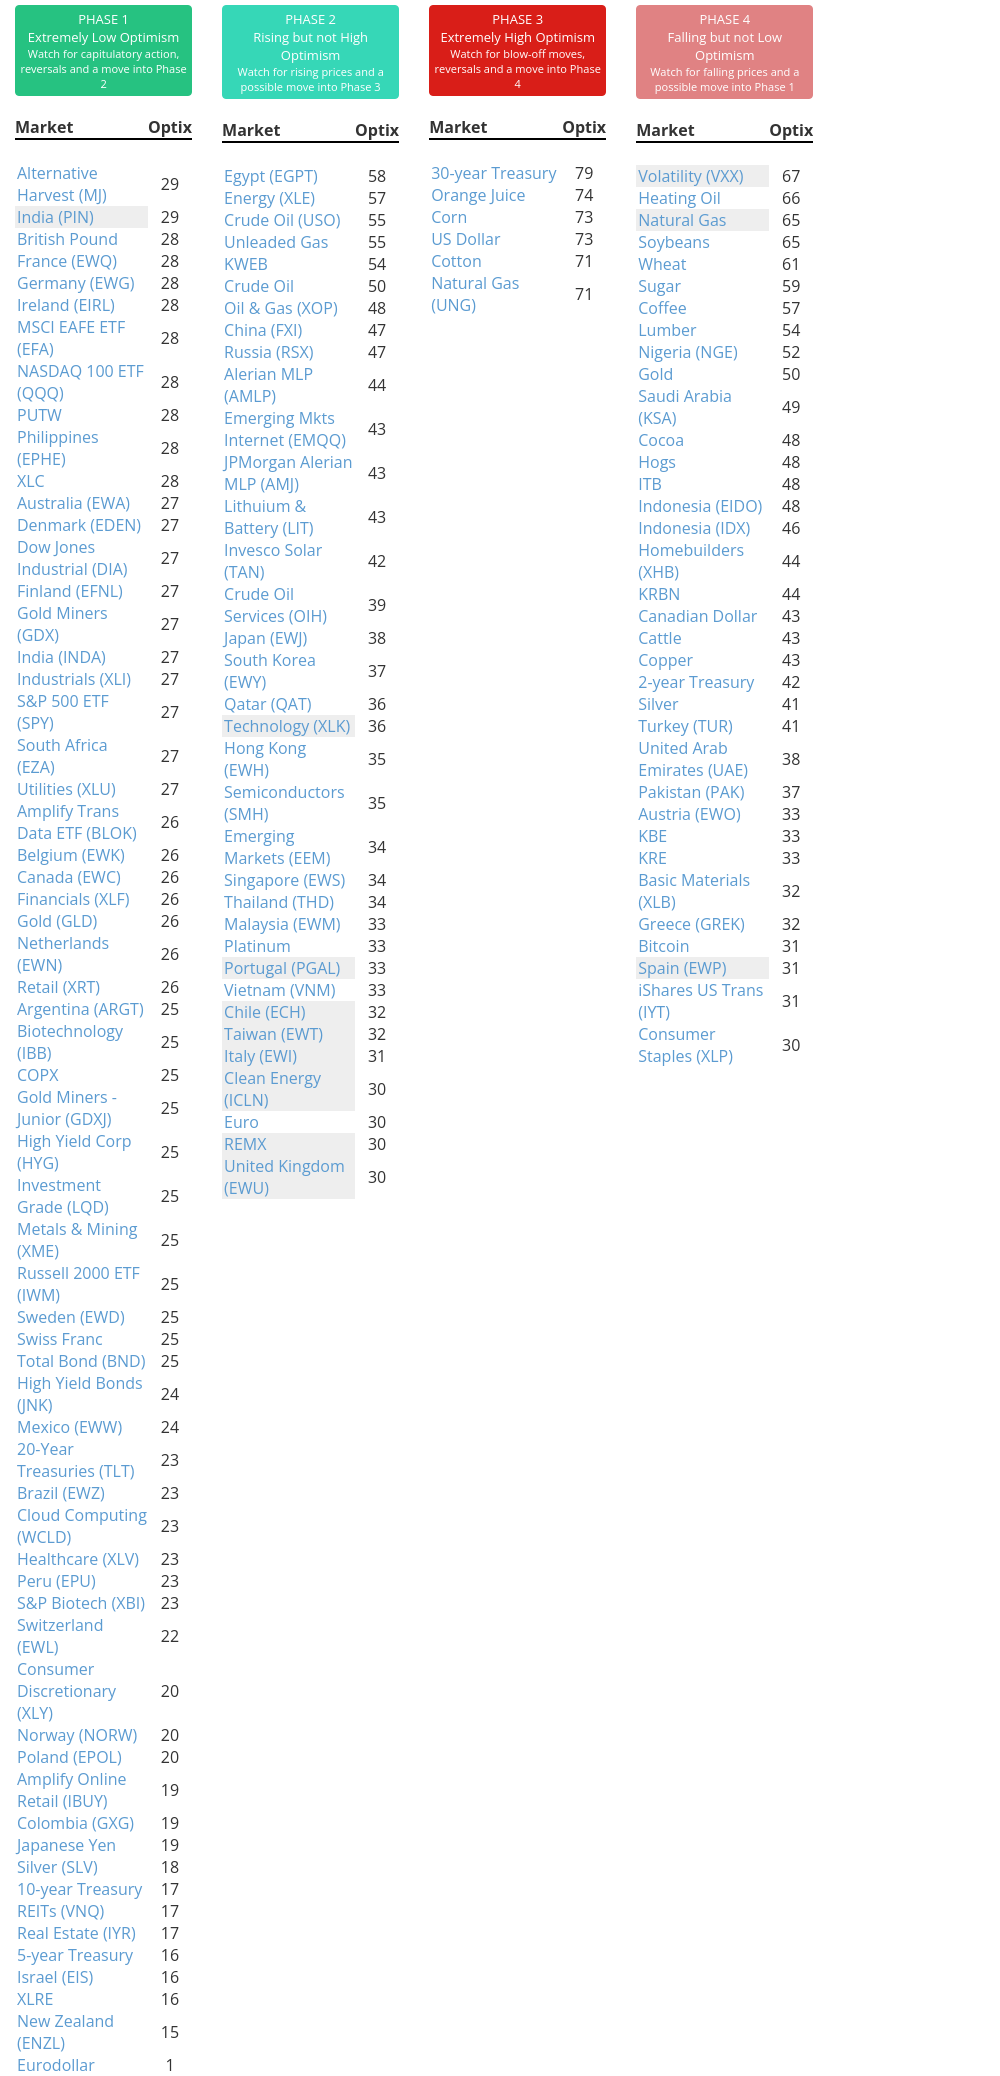
Phase Table
Ranks
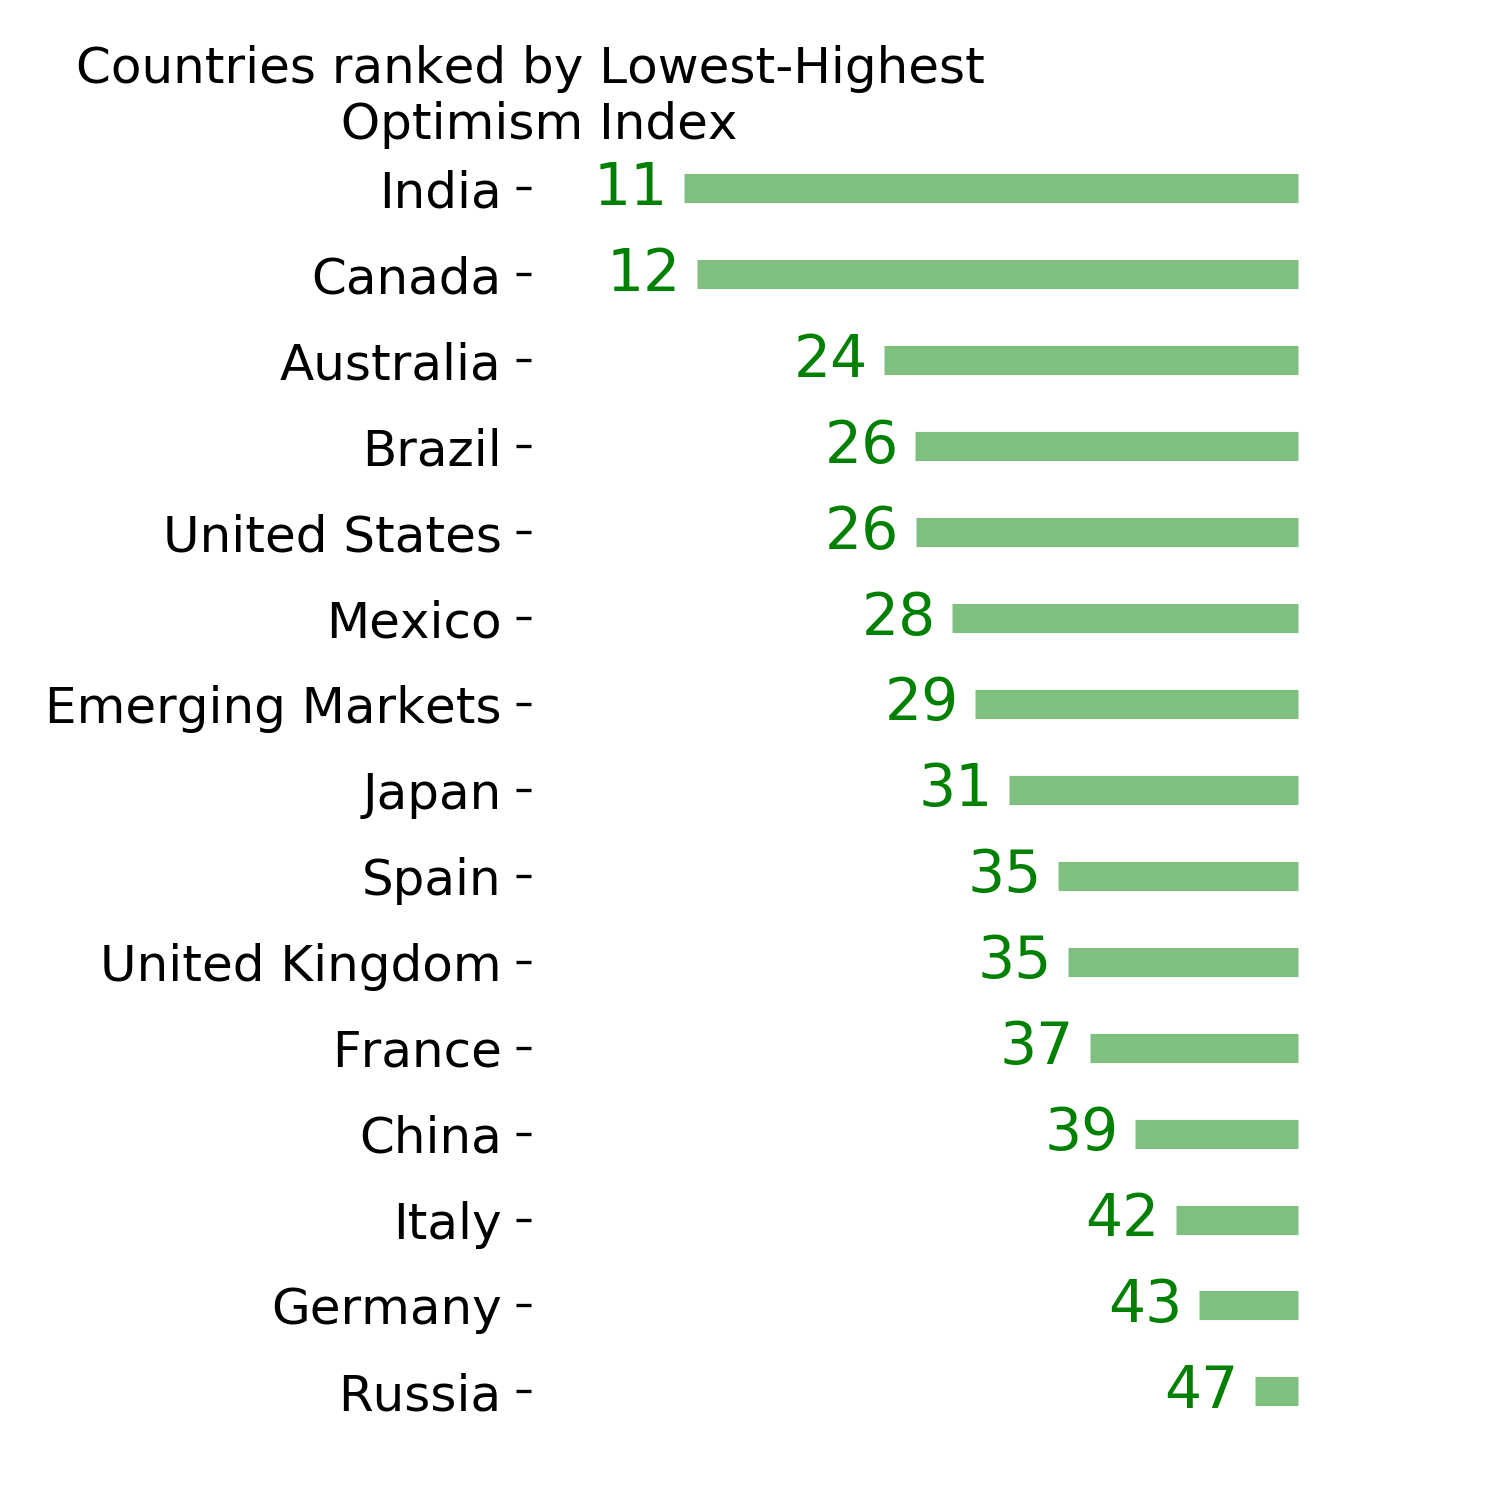
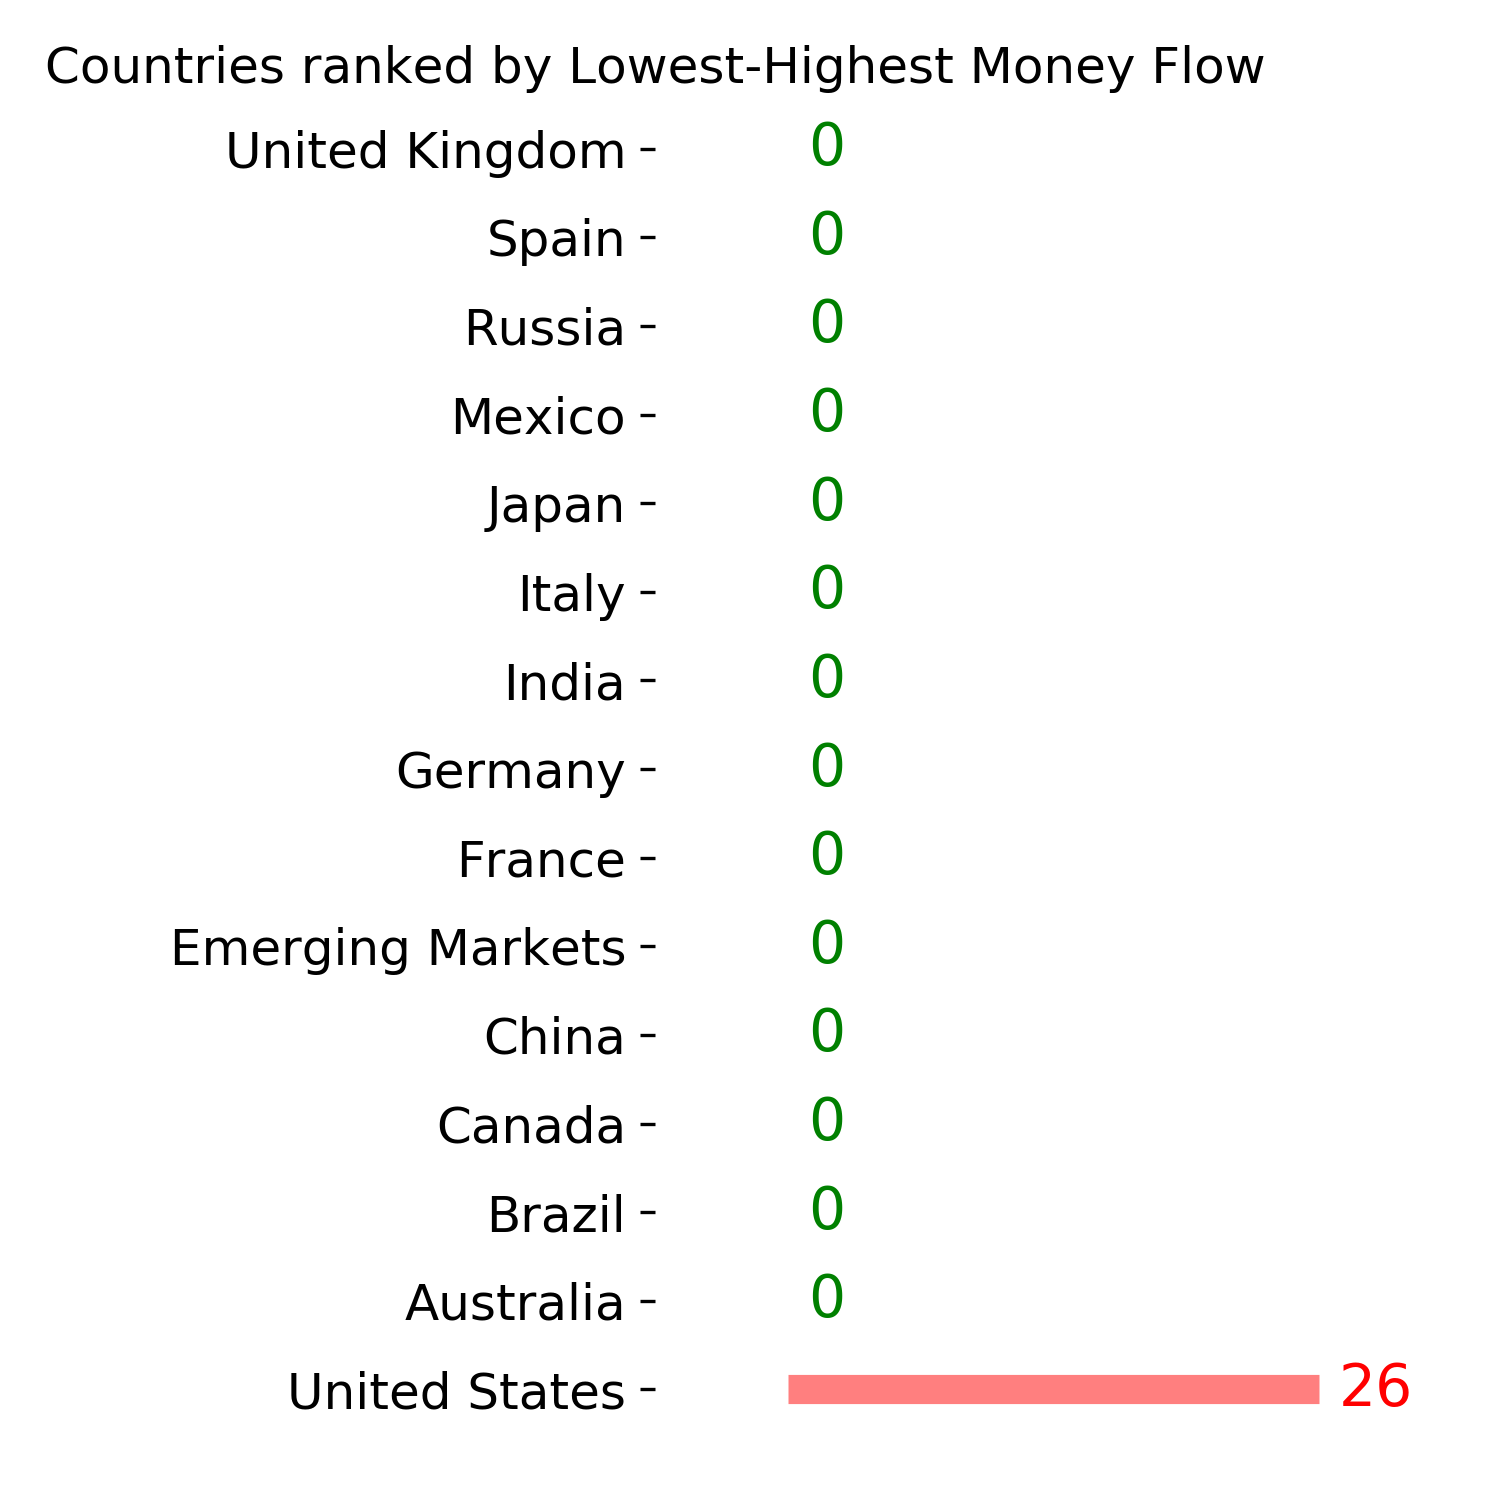
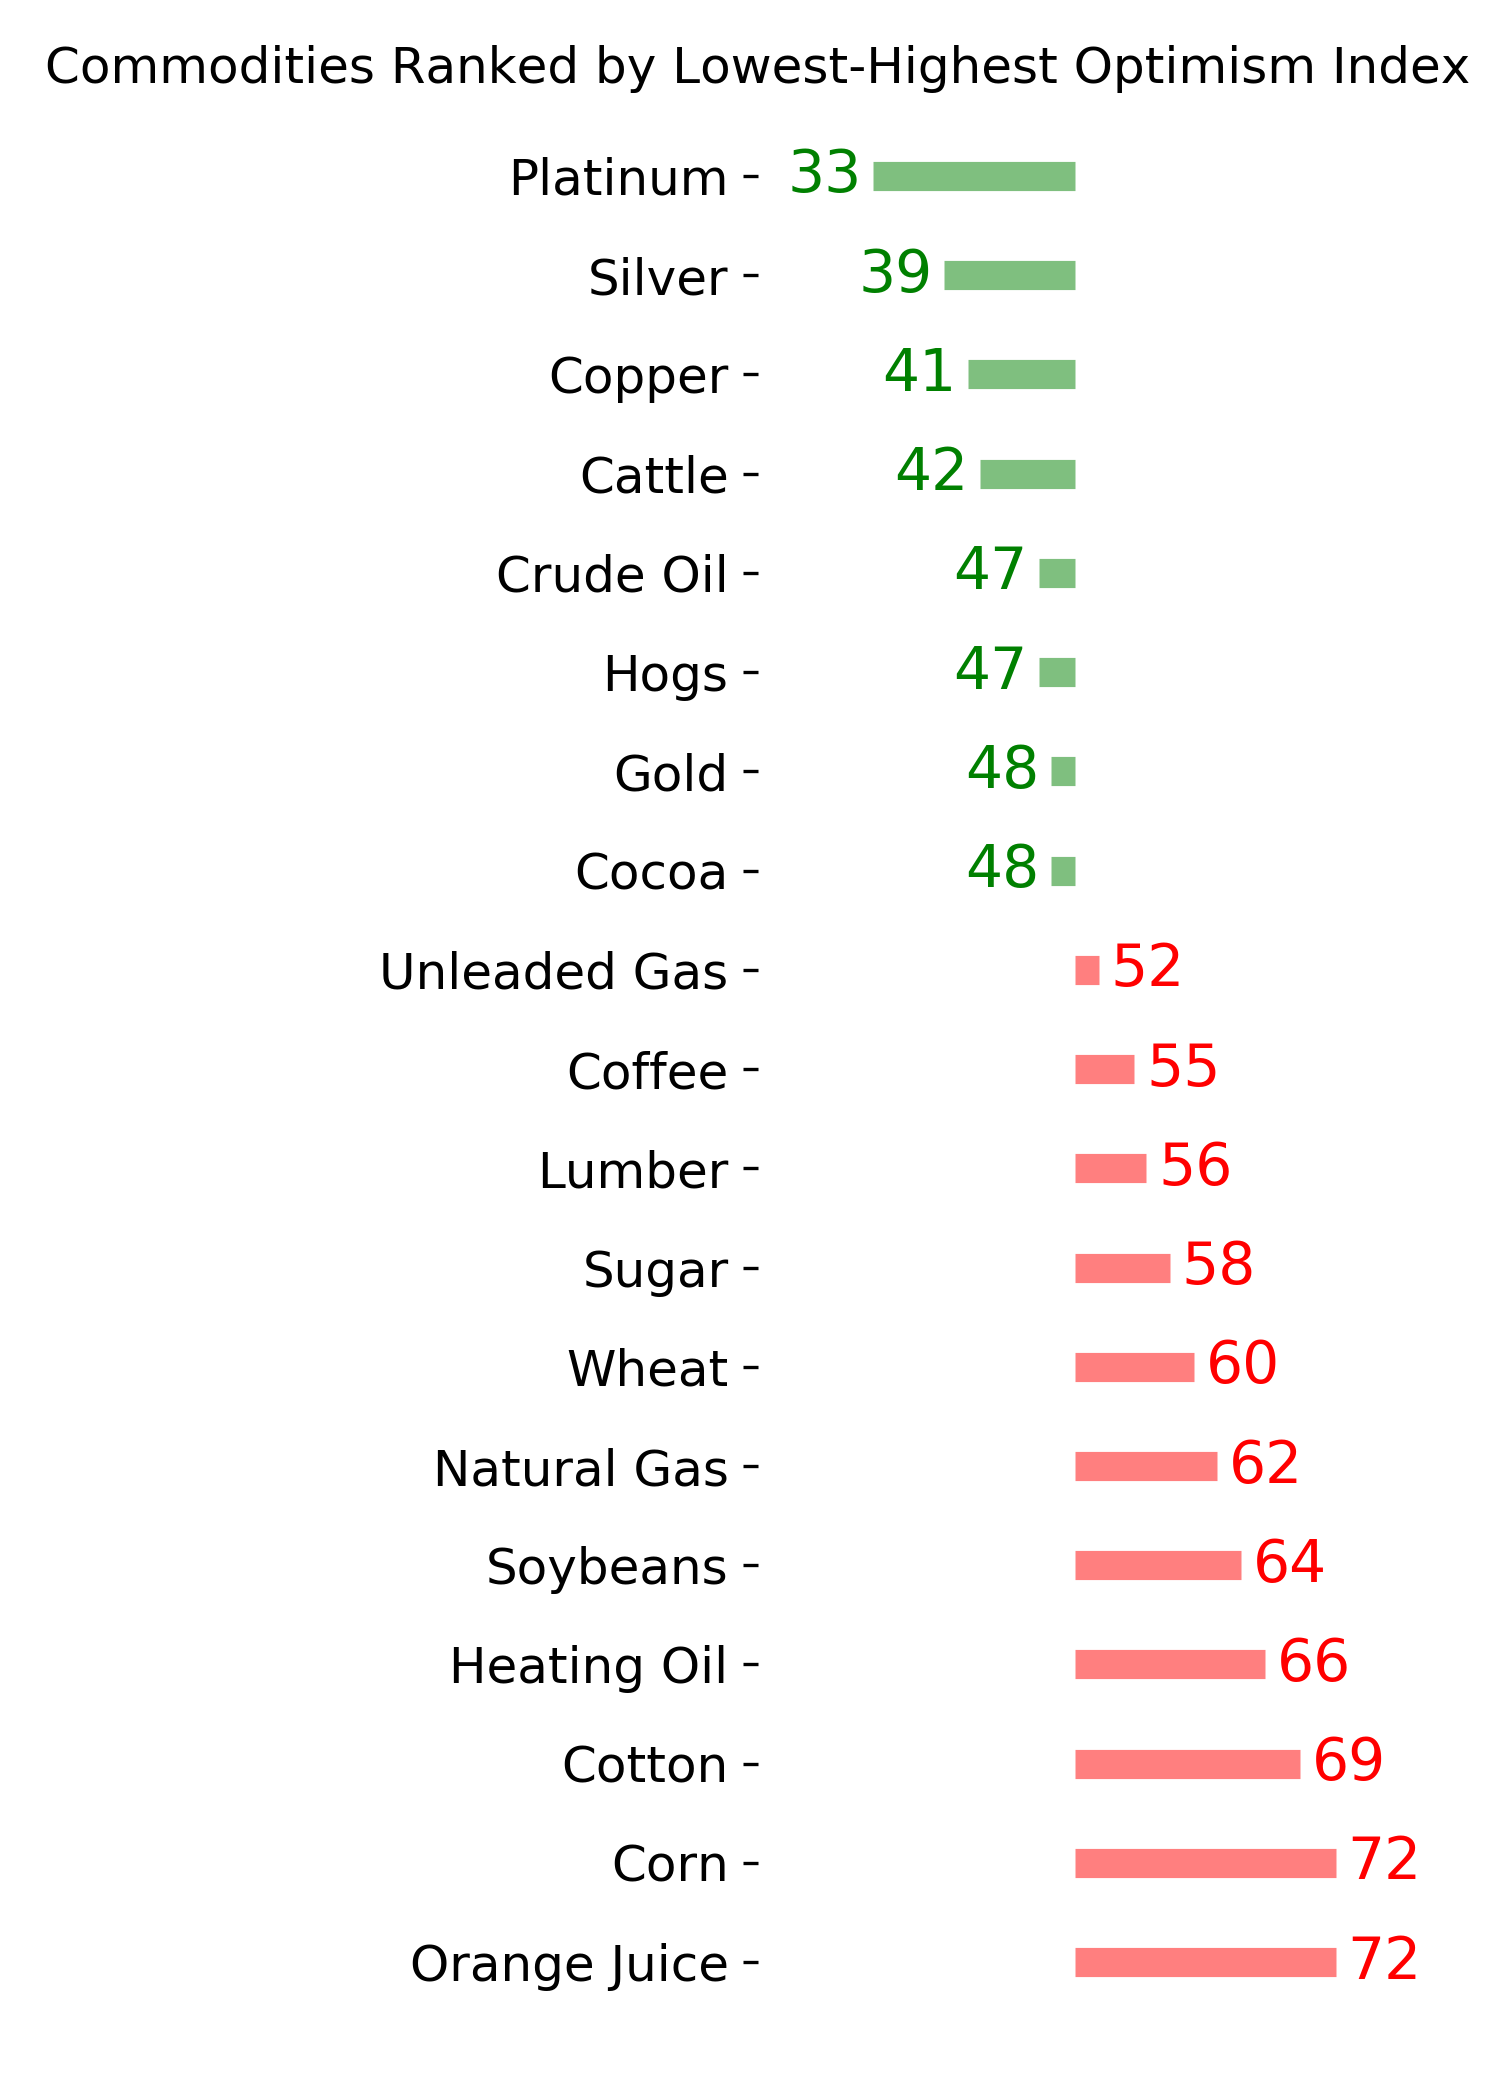
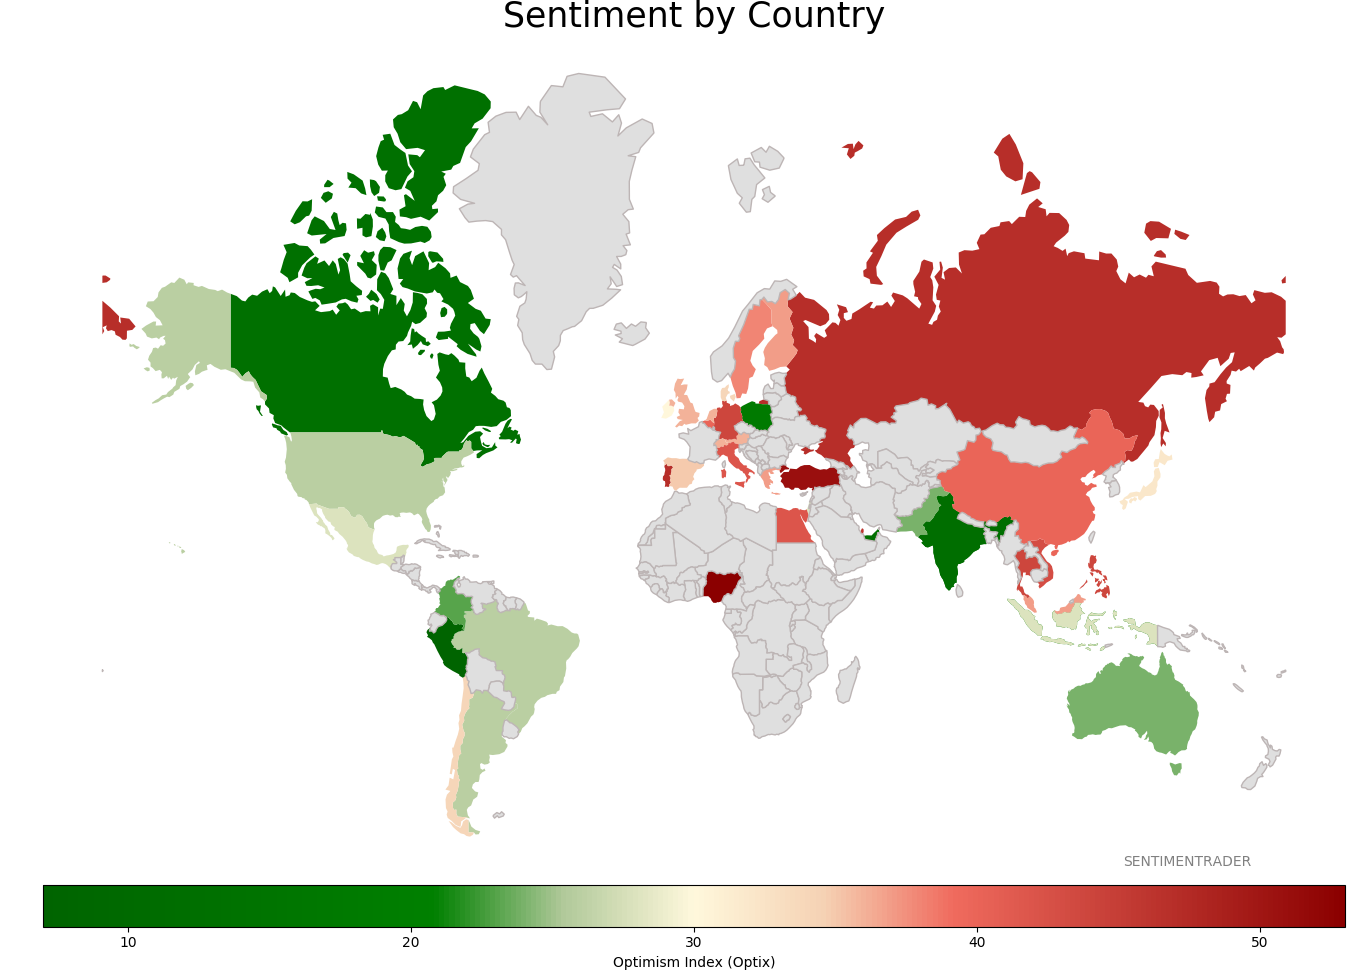
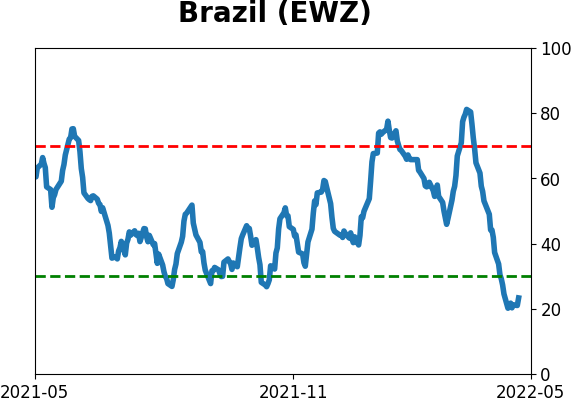
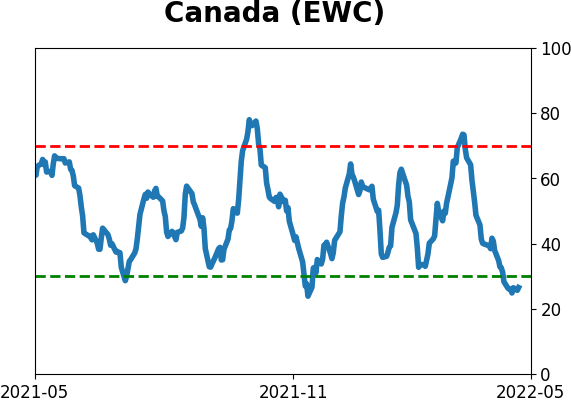
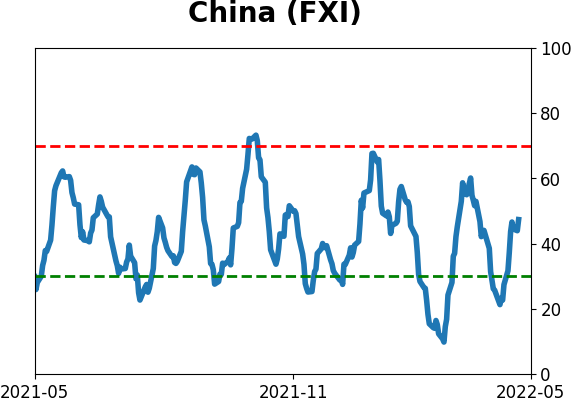
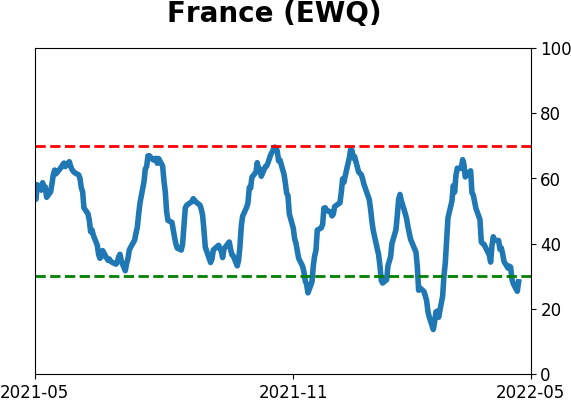
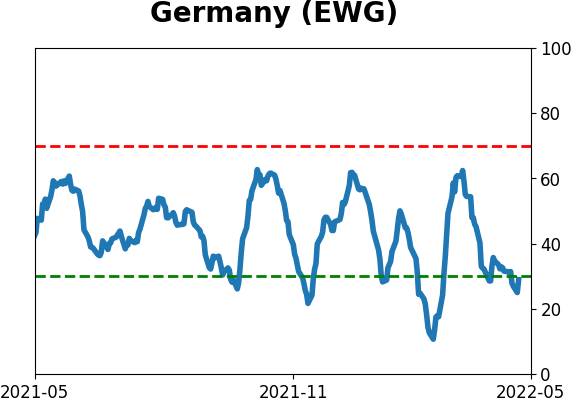
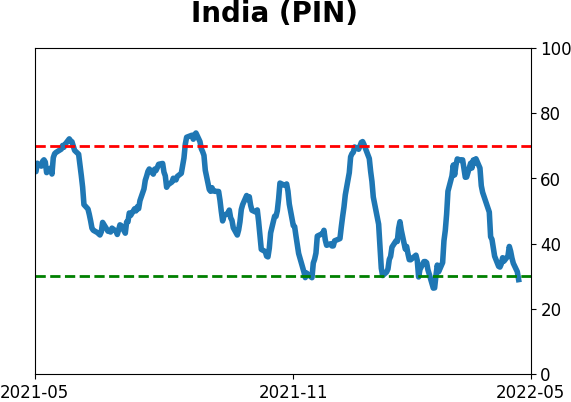
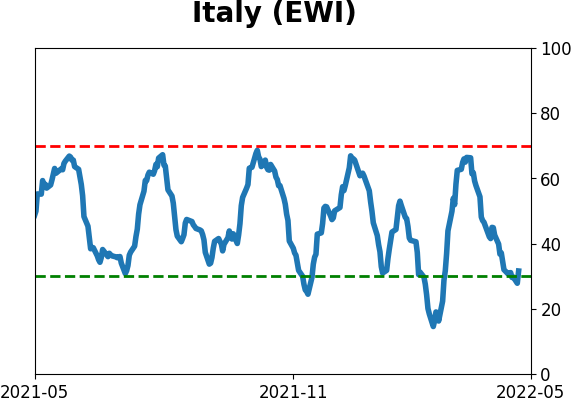
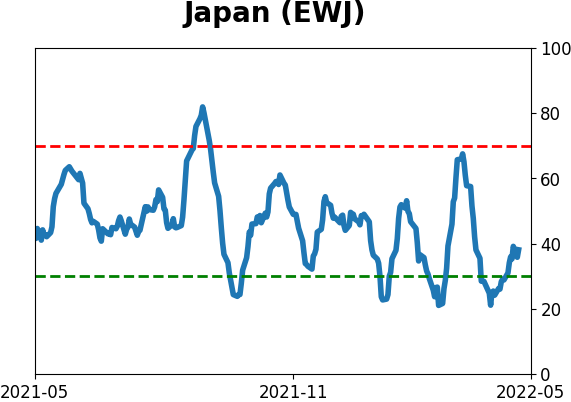
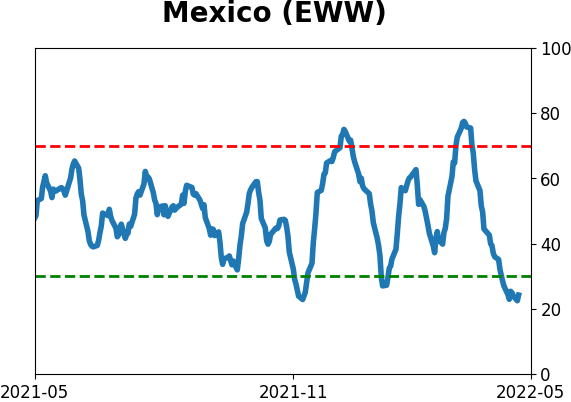
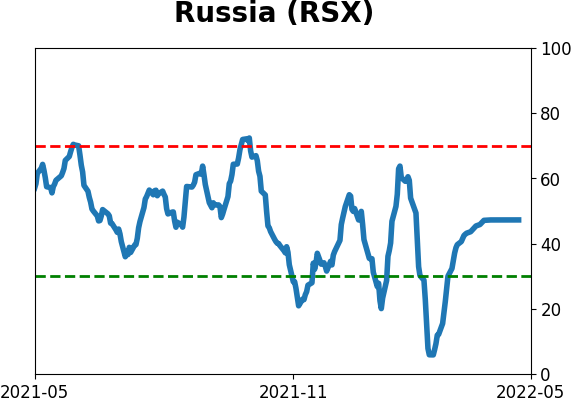
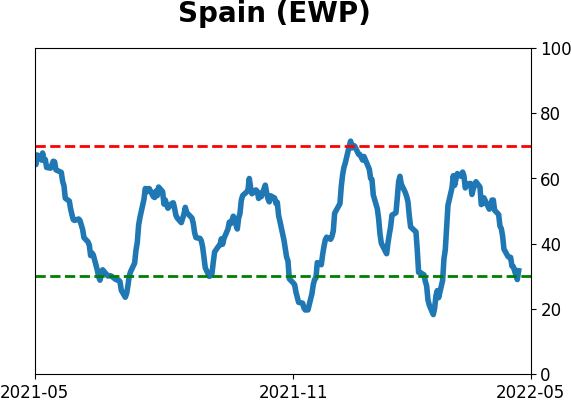
Sentiment Around The World
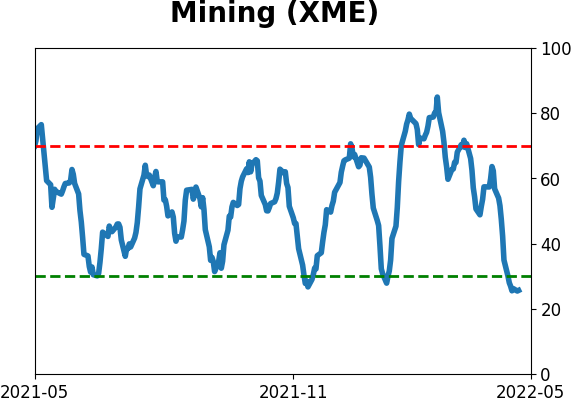
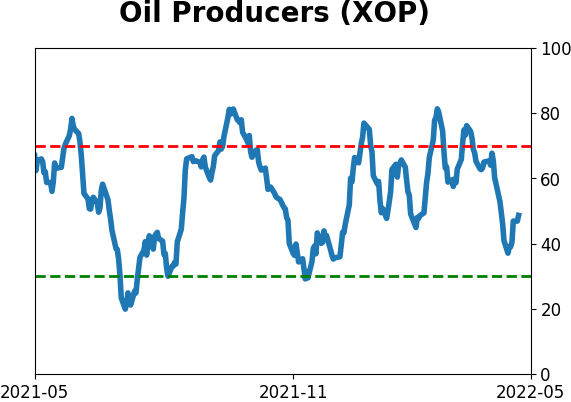
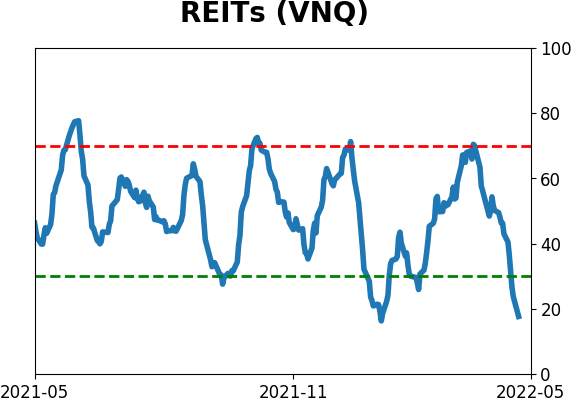
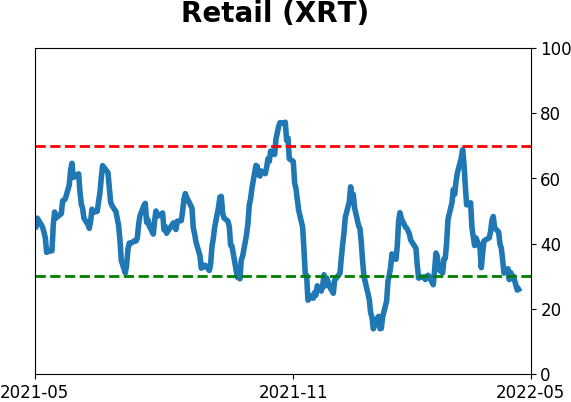
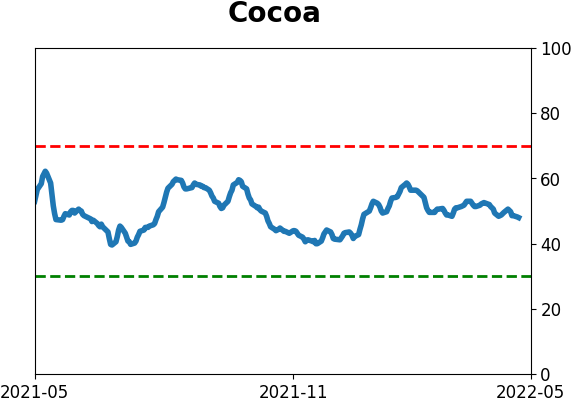
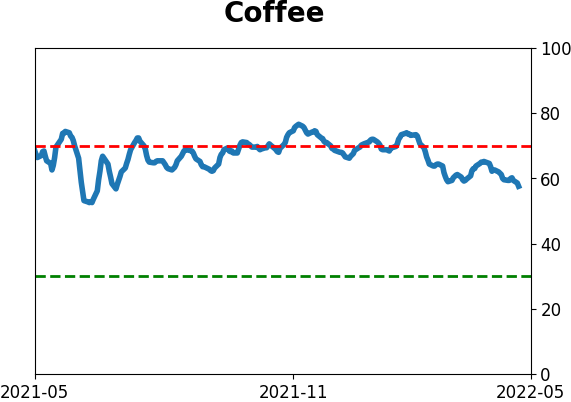
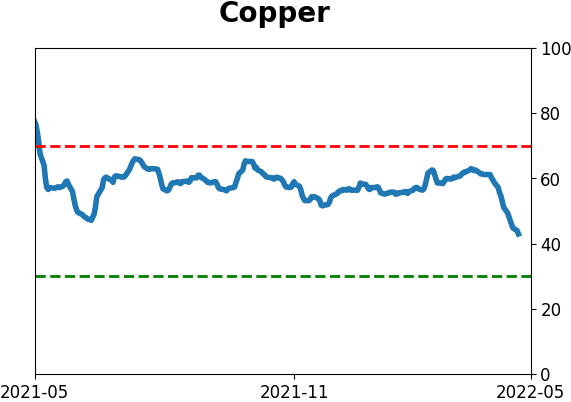
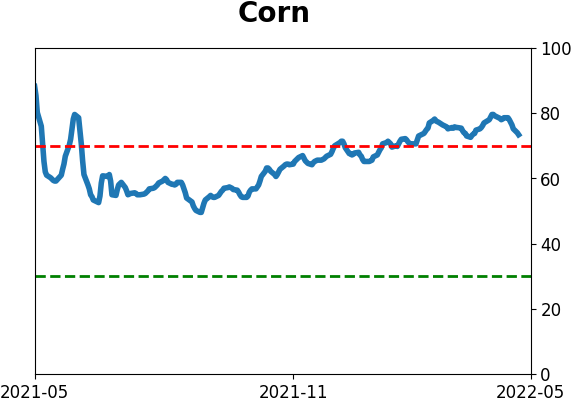
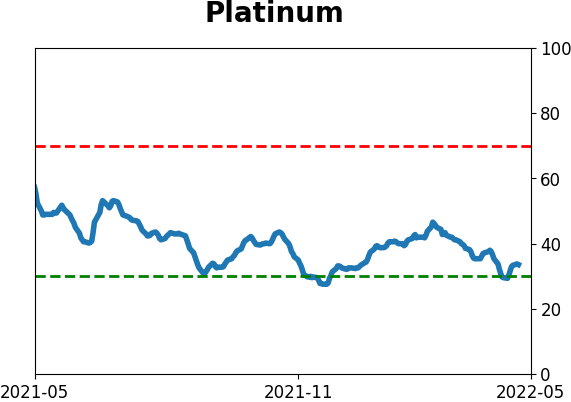
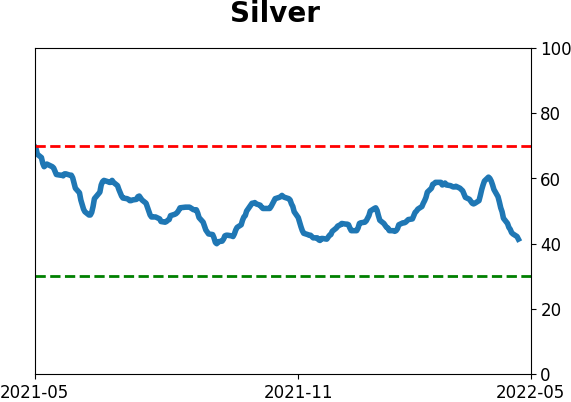
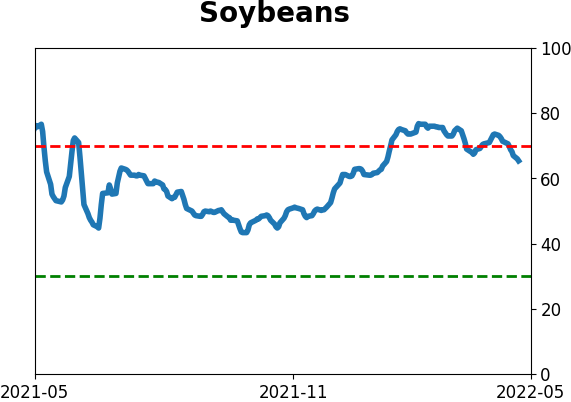
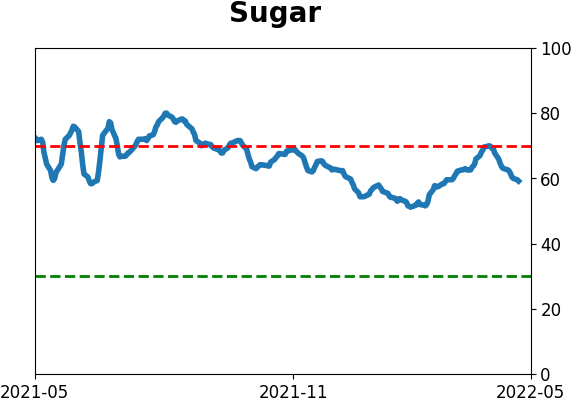
Optimism Index Thumbnails
|
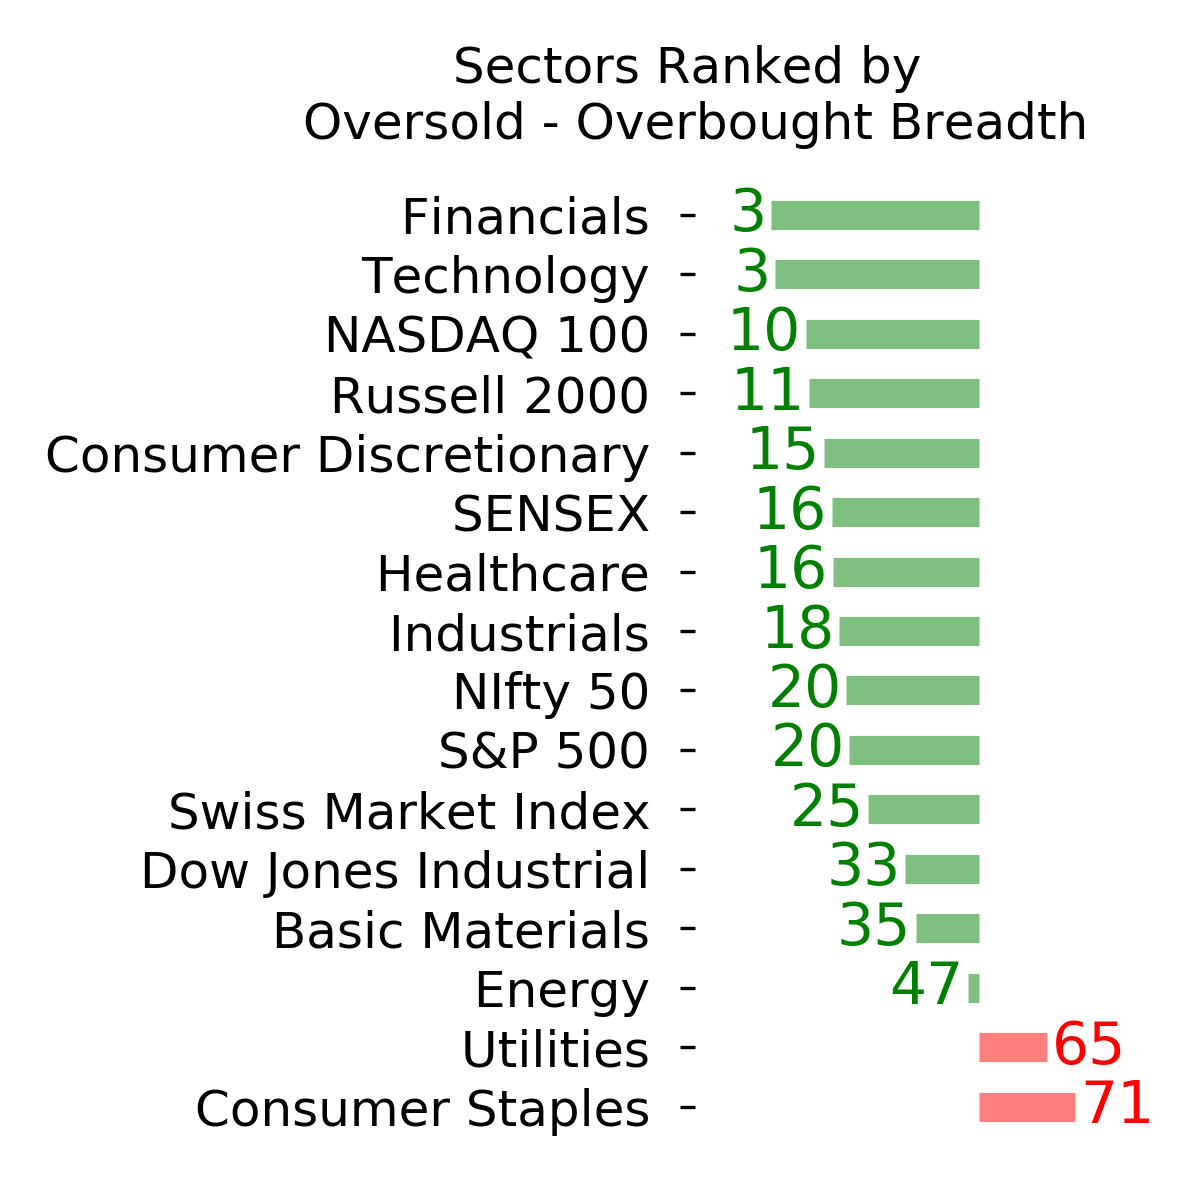
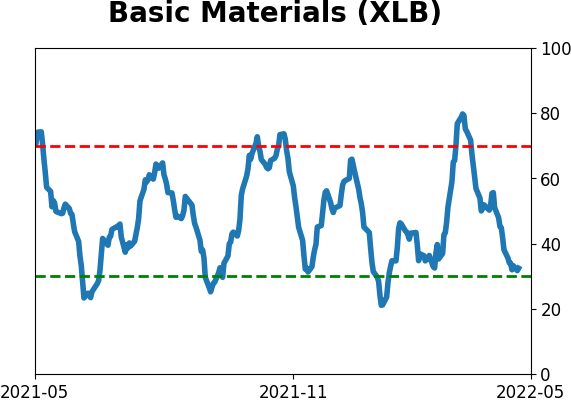
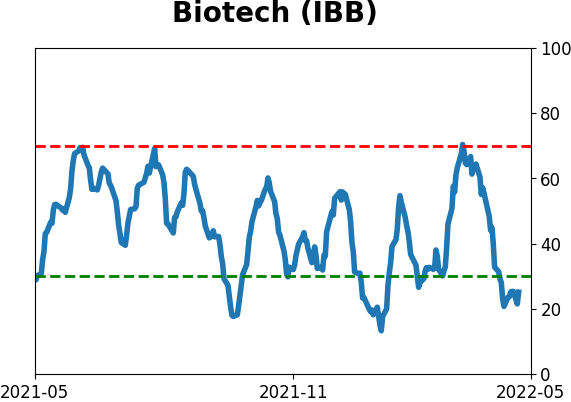
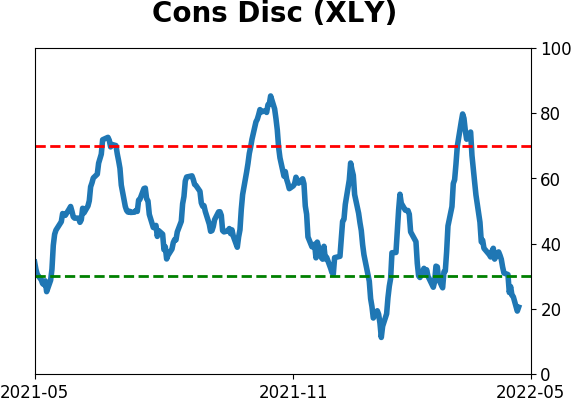
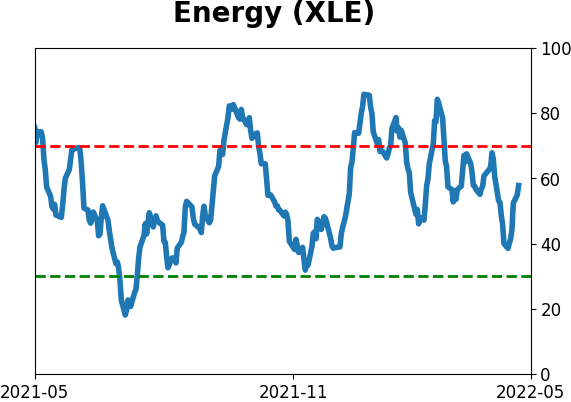
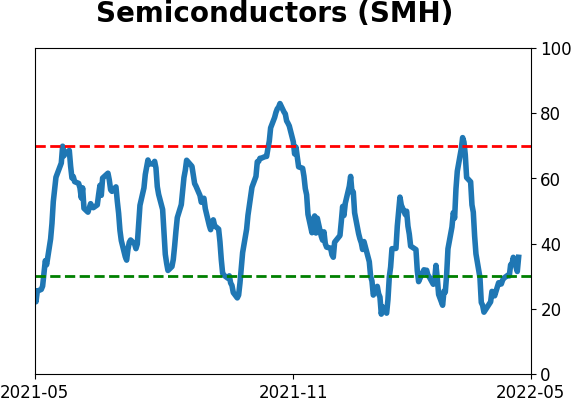
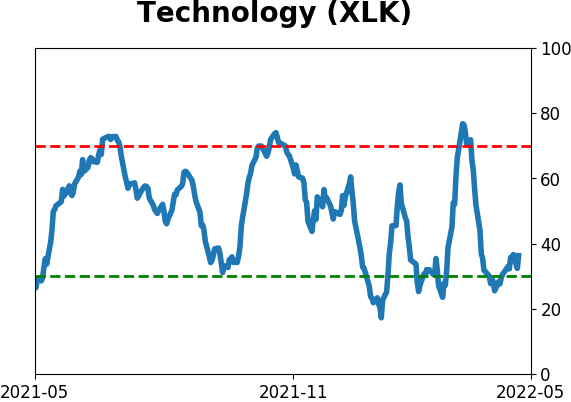
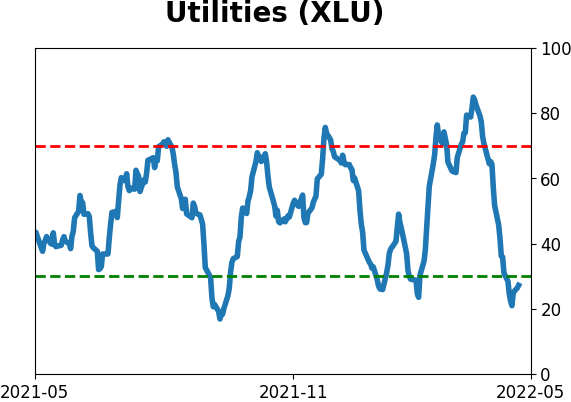
Sector ETF's - 10-Day Moving Average
|
|
|
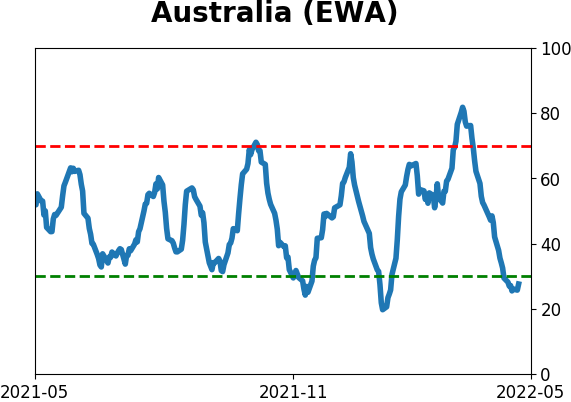
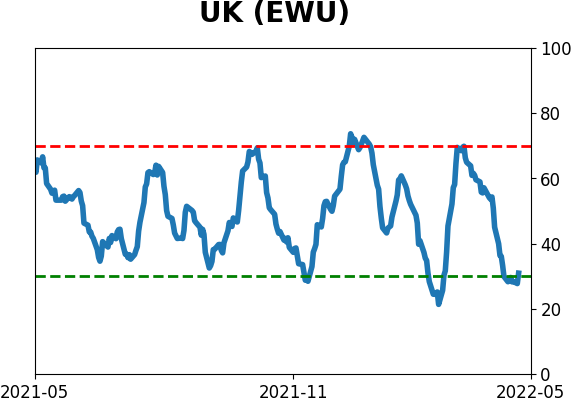
Country ETF's - 10-Day Moving Average
|
|
|
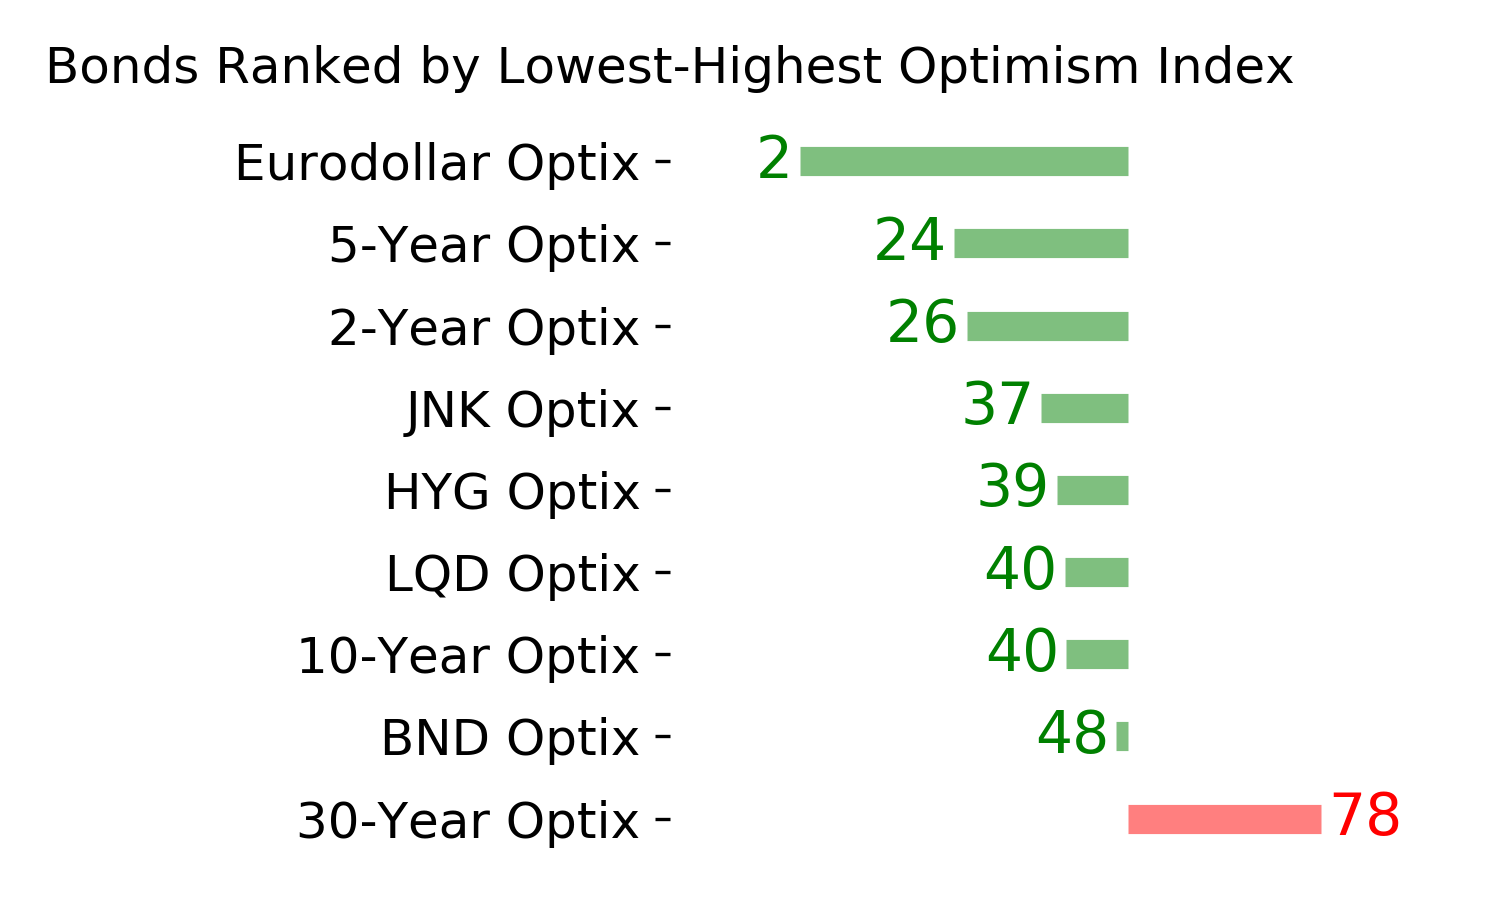
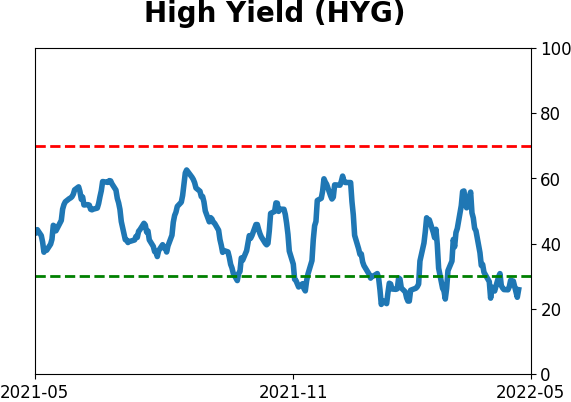
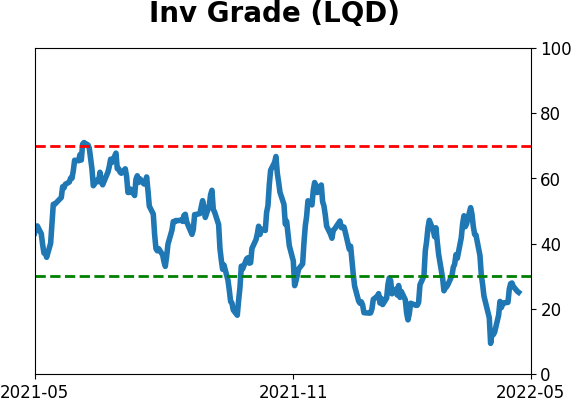
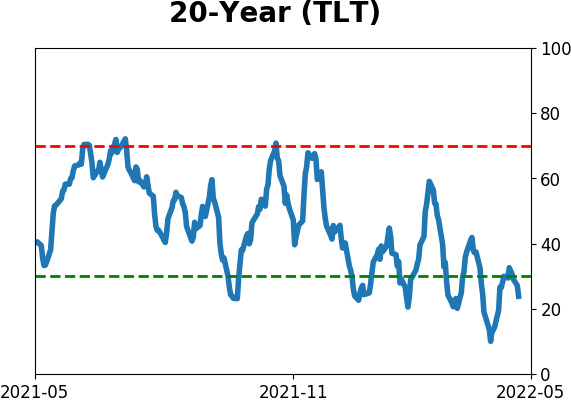
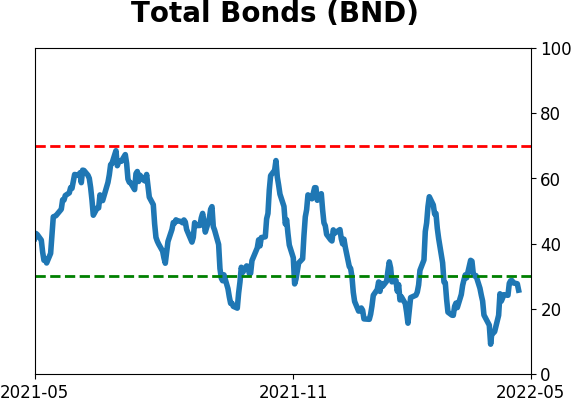
Bond ETF's - 10-Day Moving Average
|
|
|
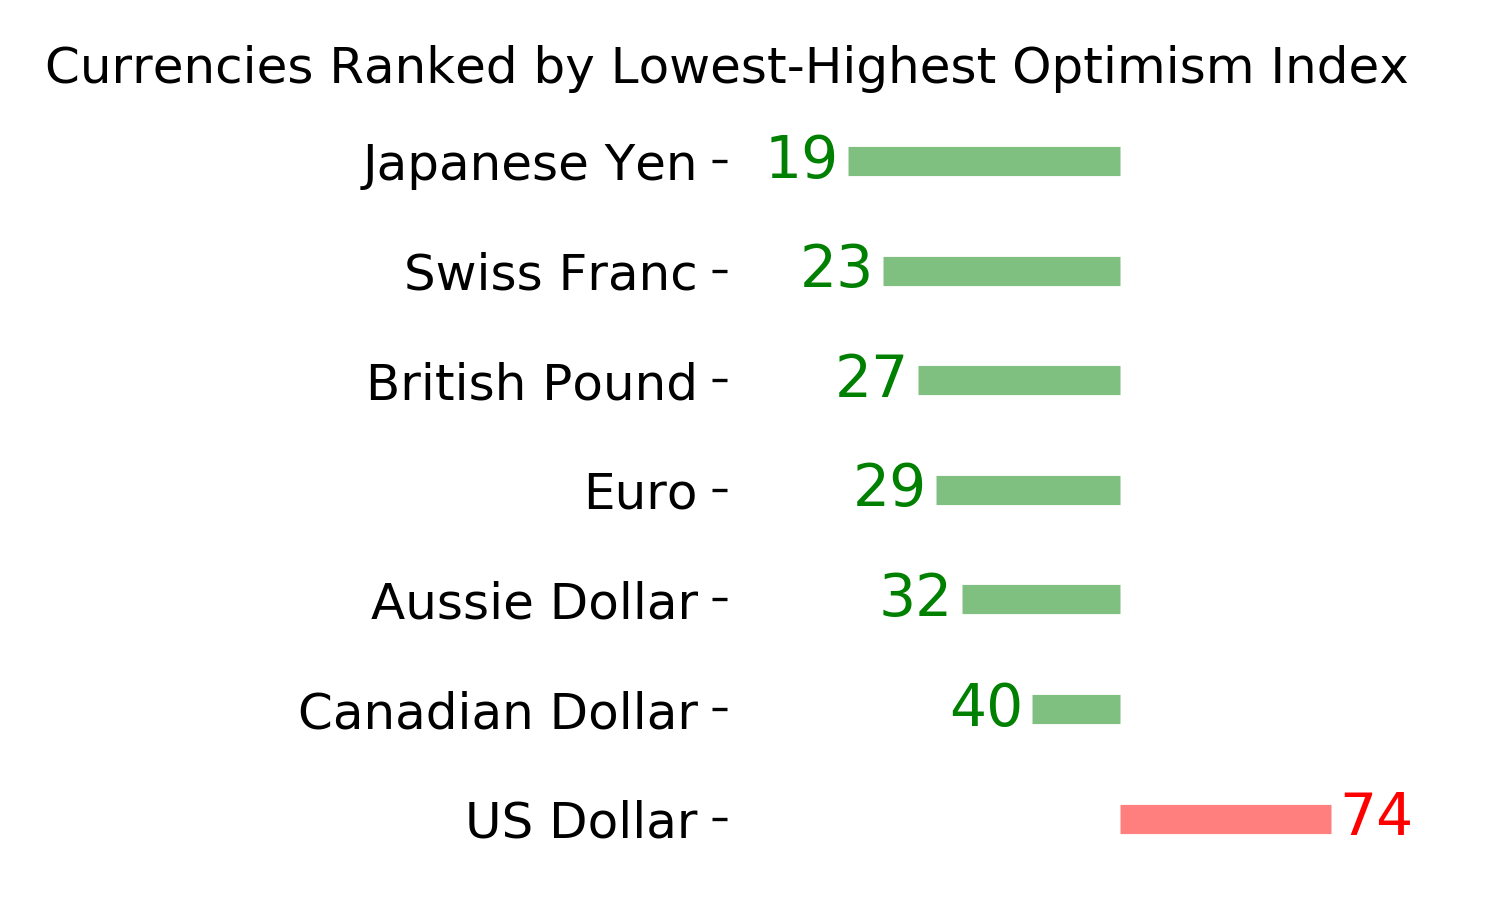
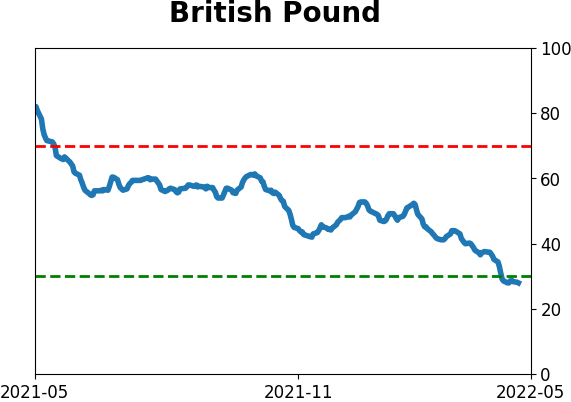
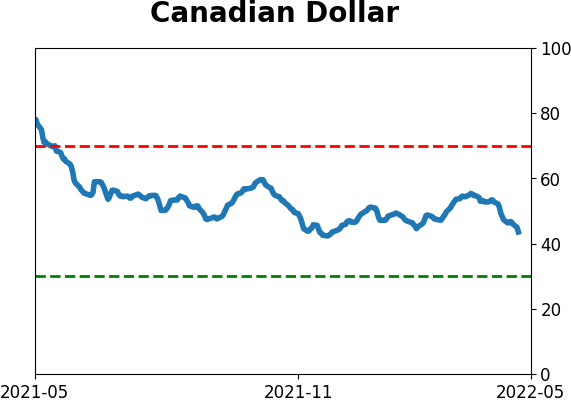
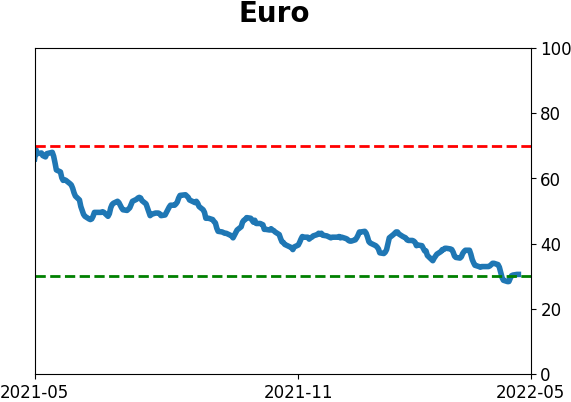
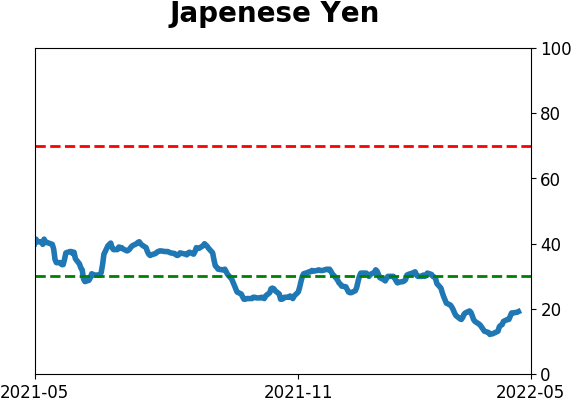
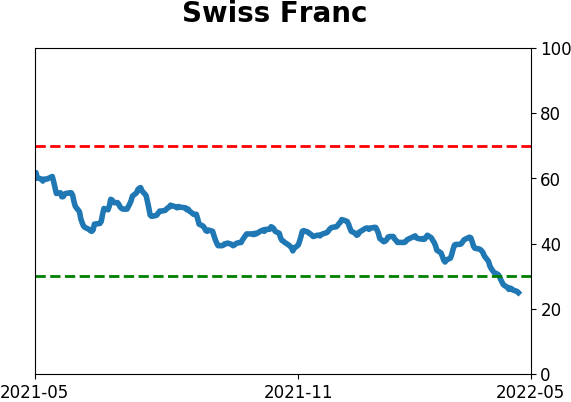
Currency ETF's - 5-Day Moving Average
|
|
|
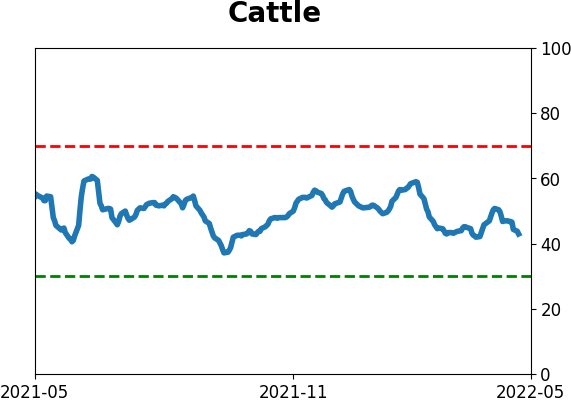
Commodity ETF's - 5-Day Moving Average
|
|