Daily Report : TradingEdge Weekly for May 9 - A big push off the lows, record breadth, sector strength

| View/Print a PDF version of this Report |
Headlines
|
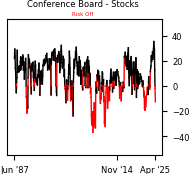
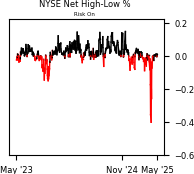
TradingEdge Weekly for May 9 - A big push off the lows, record breadth, sector strength: This week, we saw that stocks have enjoyed a historically strong thrust off the lows, retracing more than 50% of the decline, with strong and persistent breadth. Advance/decline lines for major indices hit record highs, even though consumer confidence continues to crater. Cyclical sectors are dominating relative strength, and others are showing seasonal weakness. |
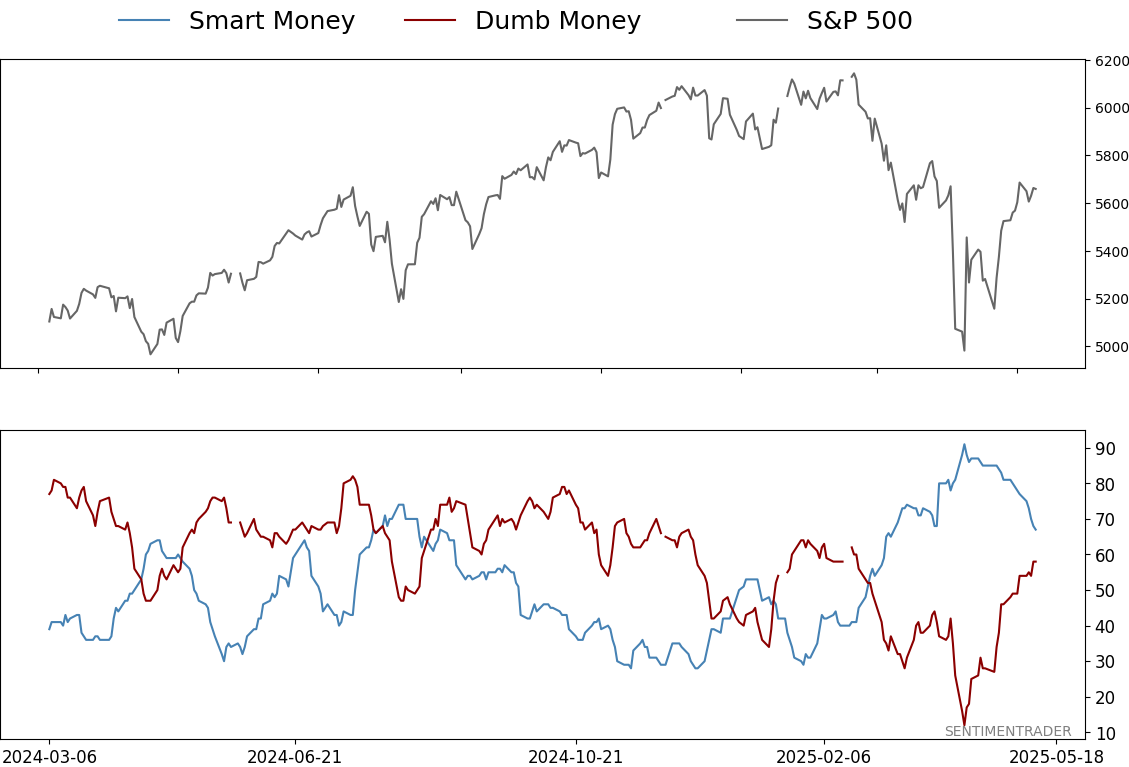
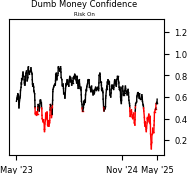
Smart / Dumb Money Confidence
|
|
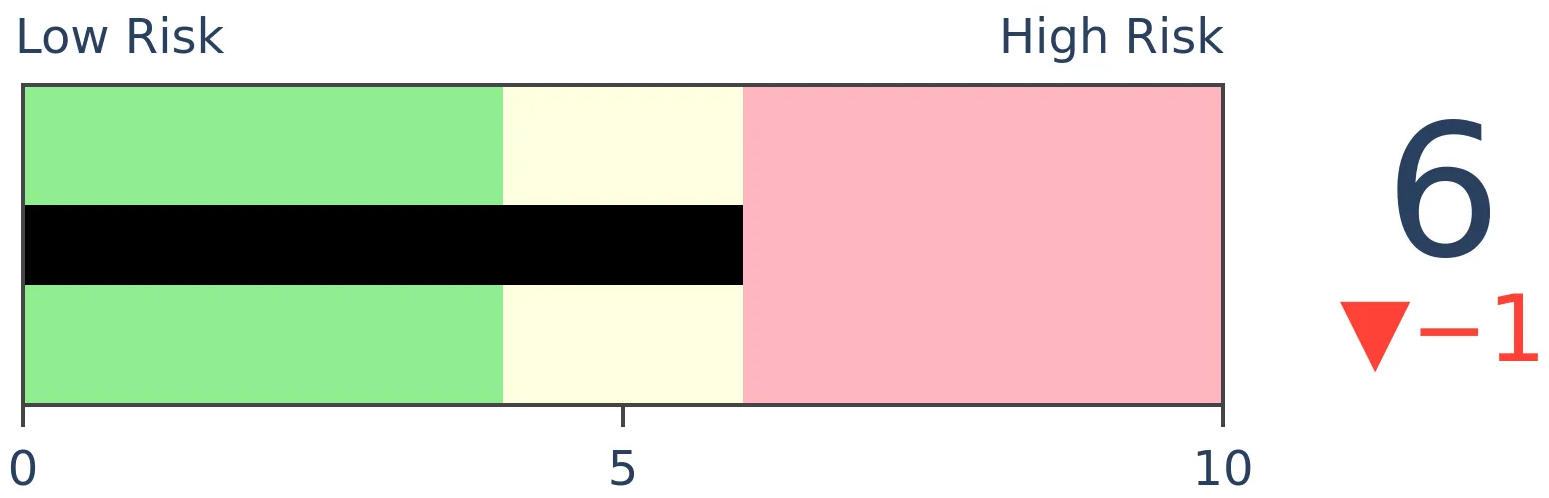
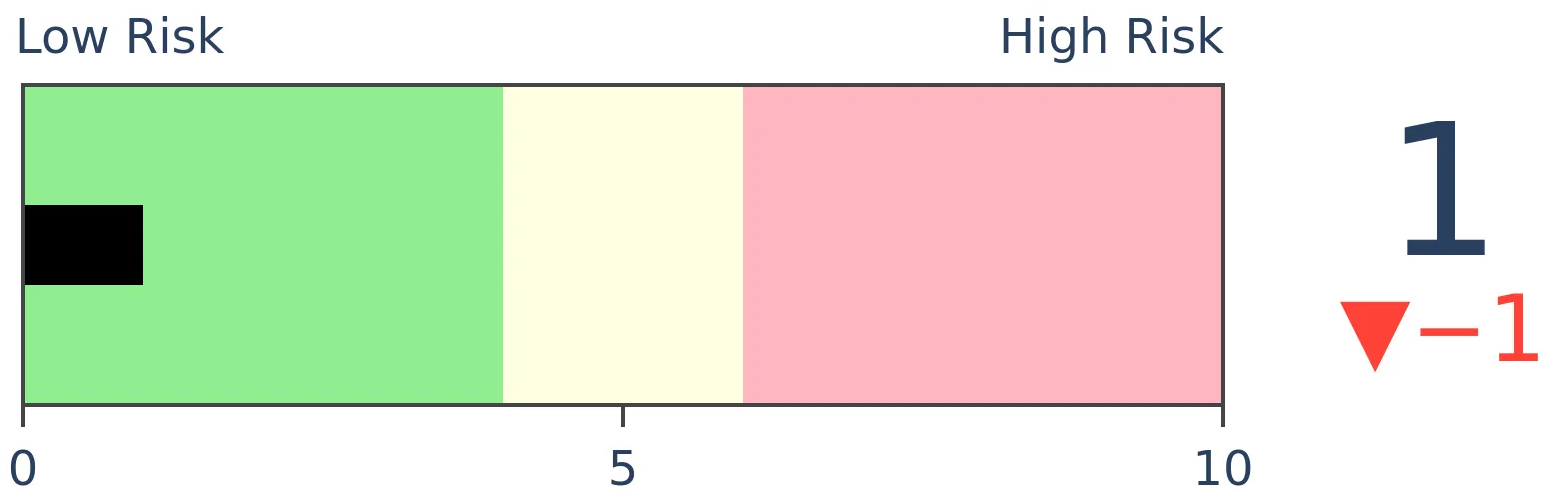
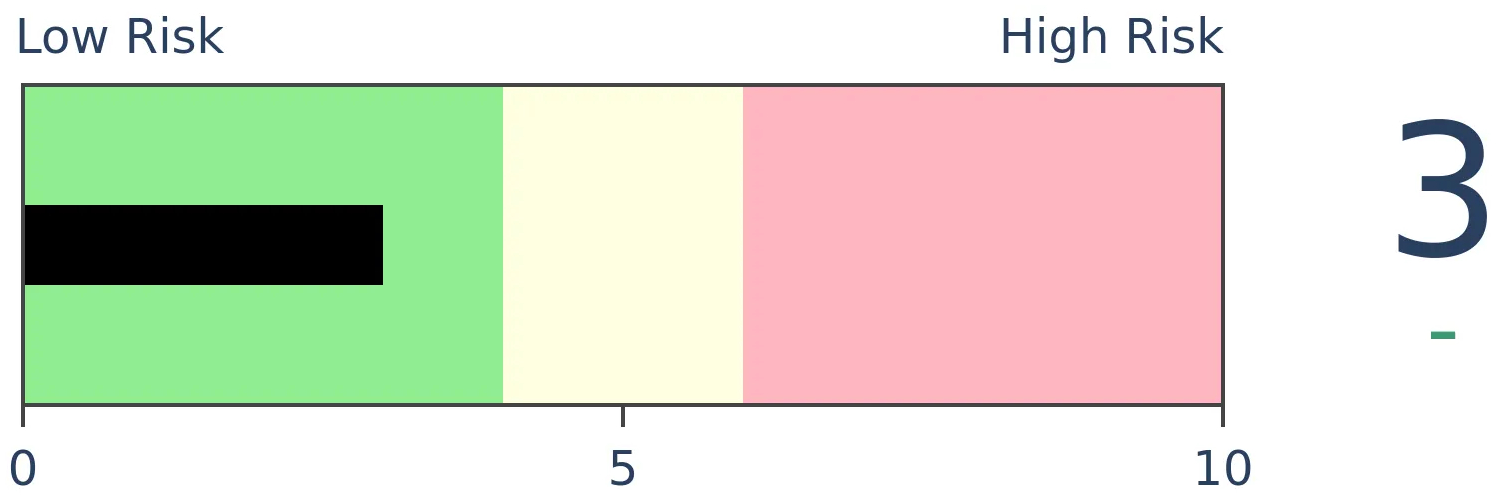
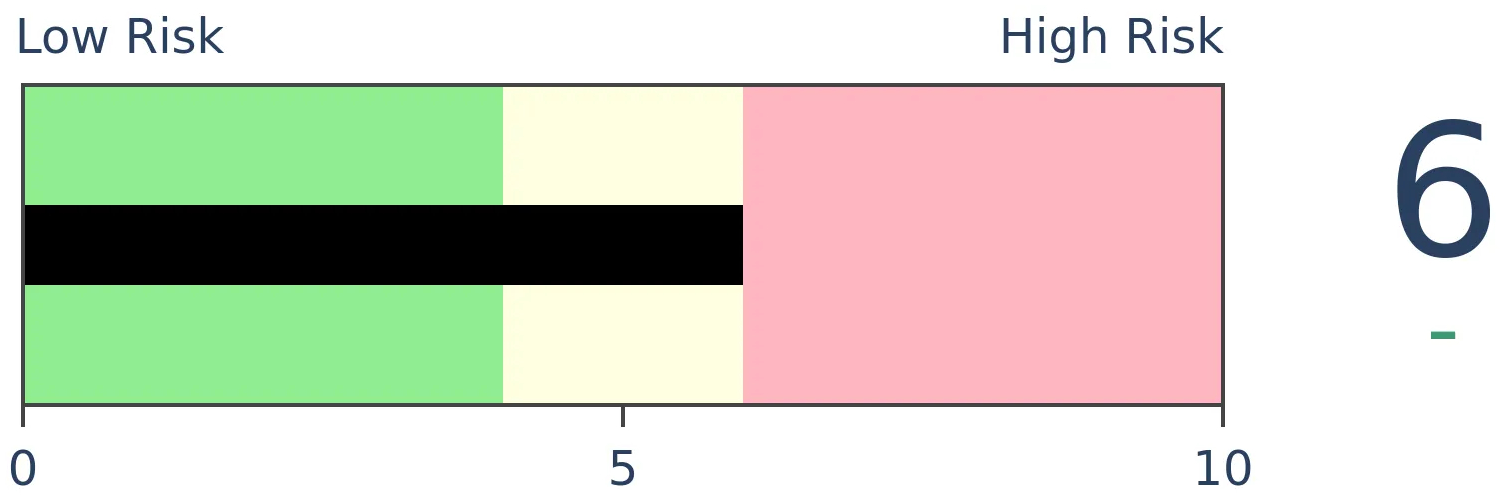
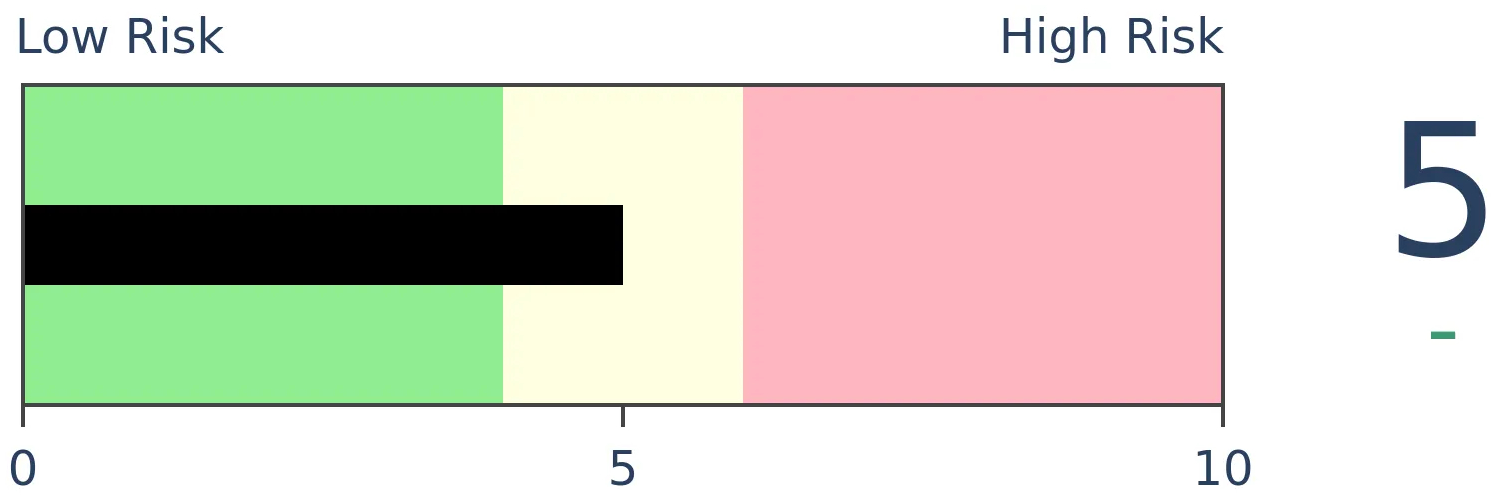
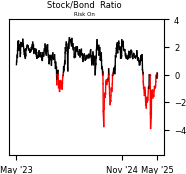
Risk Levels
|

|
|
Research
TradingEdge Weekly for May 9 - A big push off the lows, record breadth, sector strengthBy Jason GoepfertBOTTOM LINEThis week, we saw that stocks have enjoyed a historically strong thrust off the lows, retracing more than 50% of the decline, with strong and persistent breadth. Advance/decline lines for major indices hit record highs, even though consumer confidence continues to crater. Cyclical sectors are dominating relative strength, and others are showing seasonal weakness. FORECAST / TIMEFRAME |
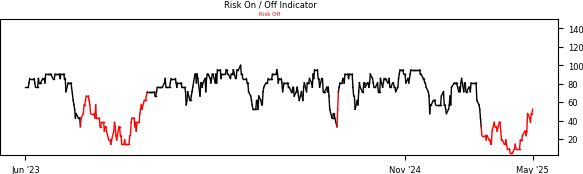
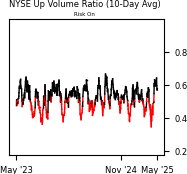
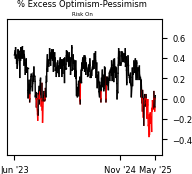
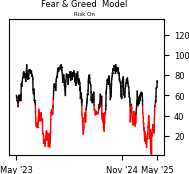
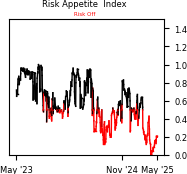
Sentiment Risk On / Risk Off Overview
| ||
|
|
|
|
|
|
|
|
|
|
|
|
Indicators at Extremes
|
|
|
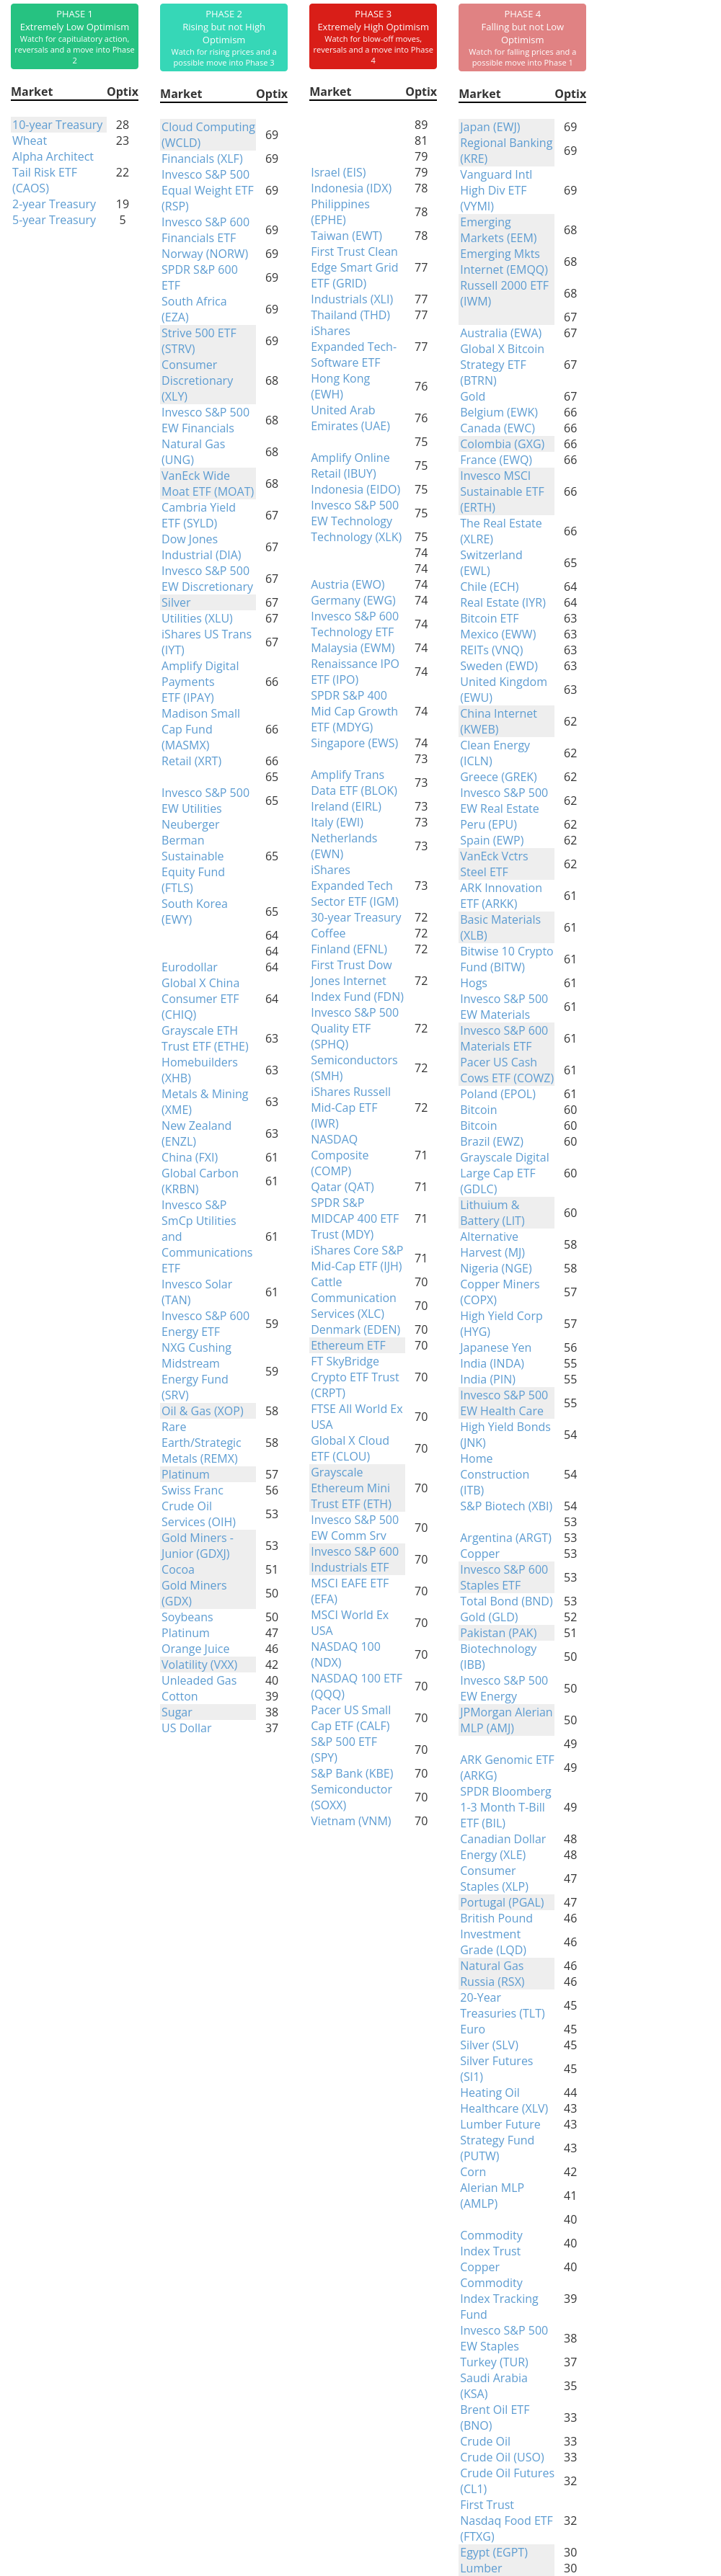
Phase Table
|
|
|
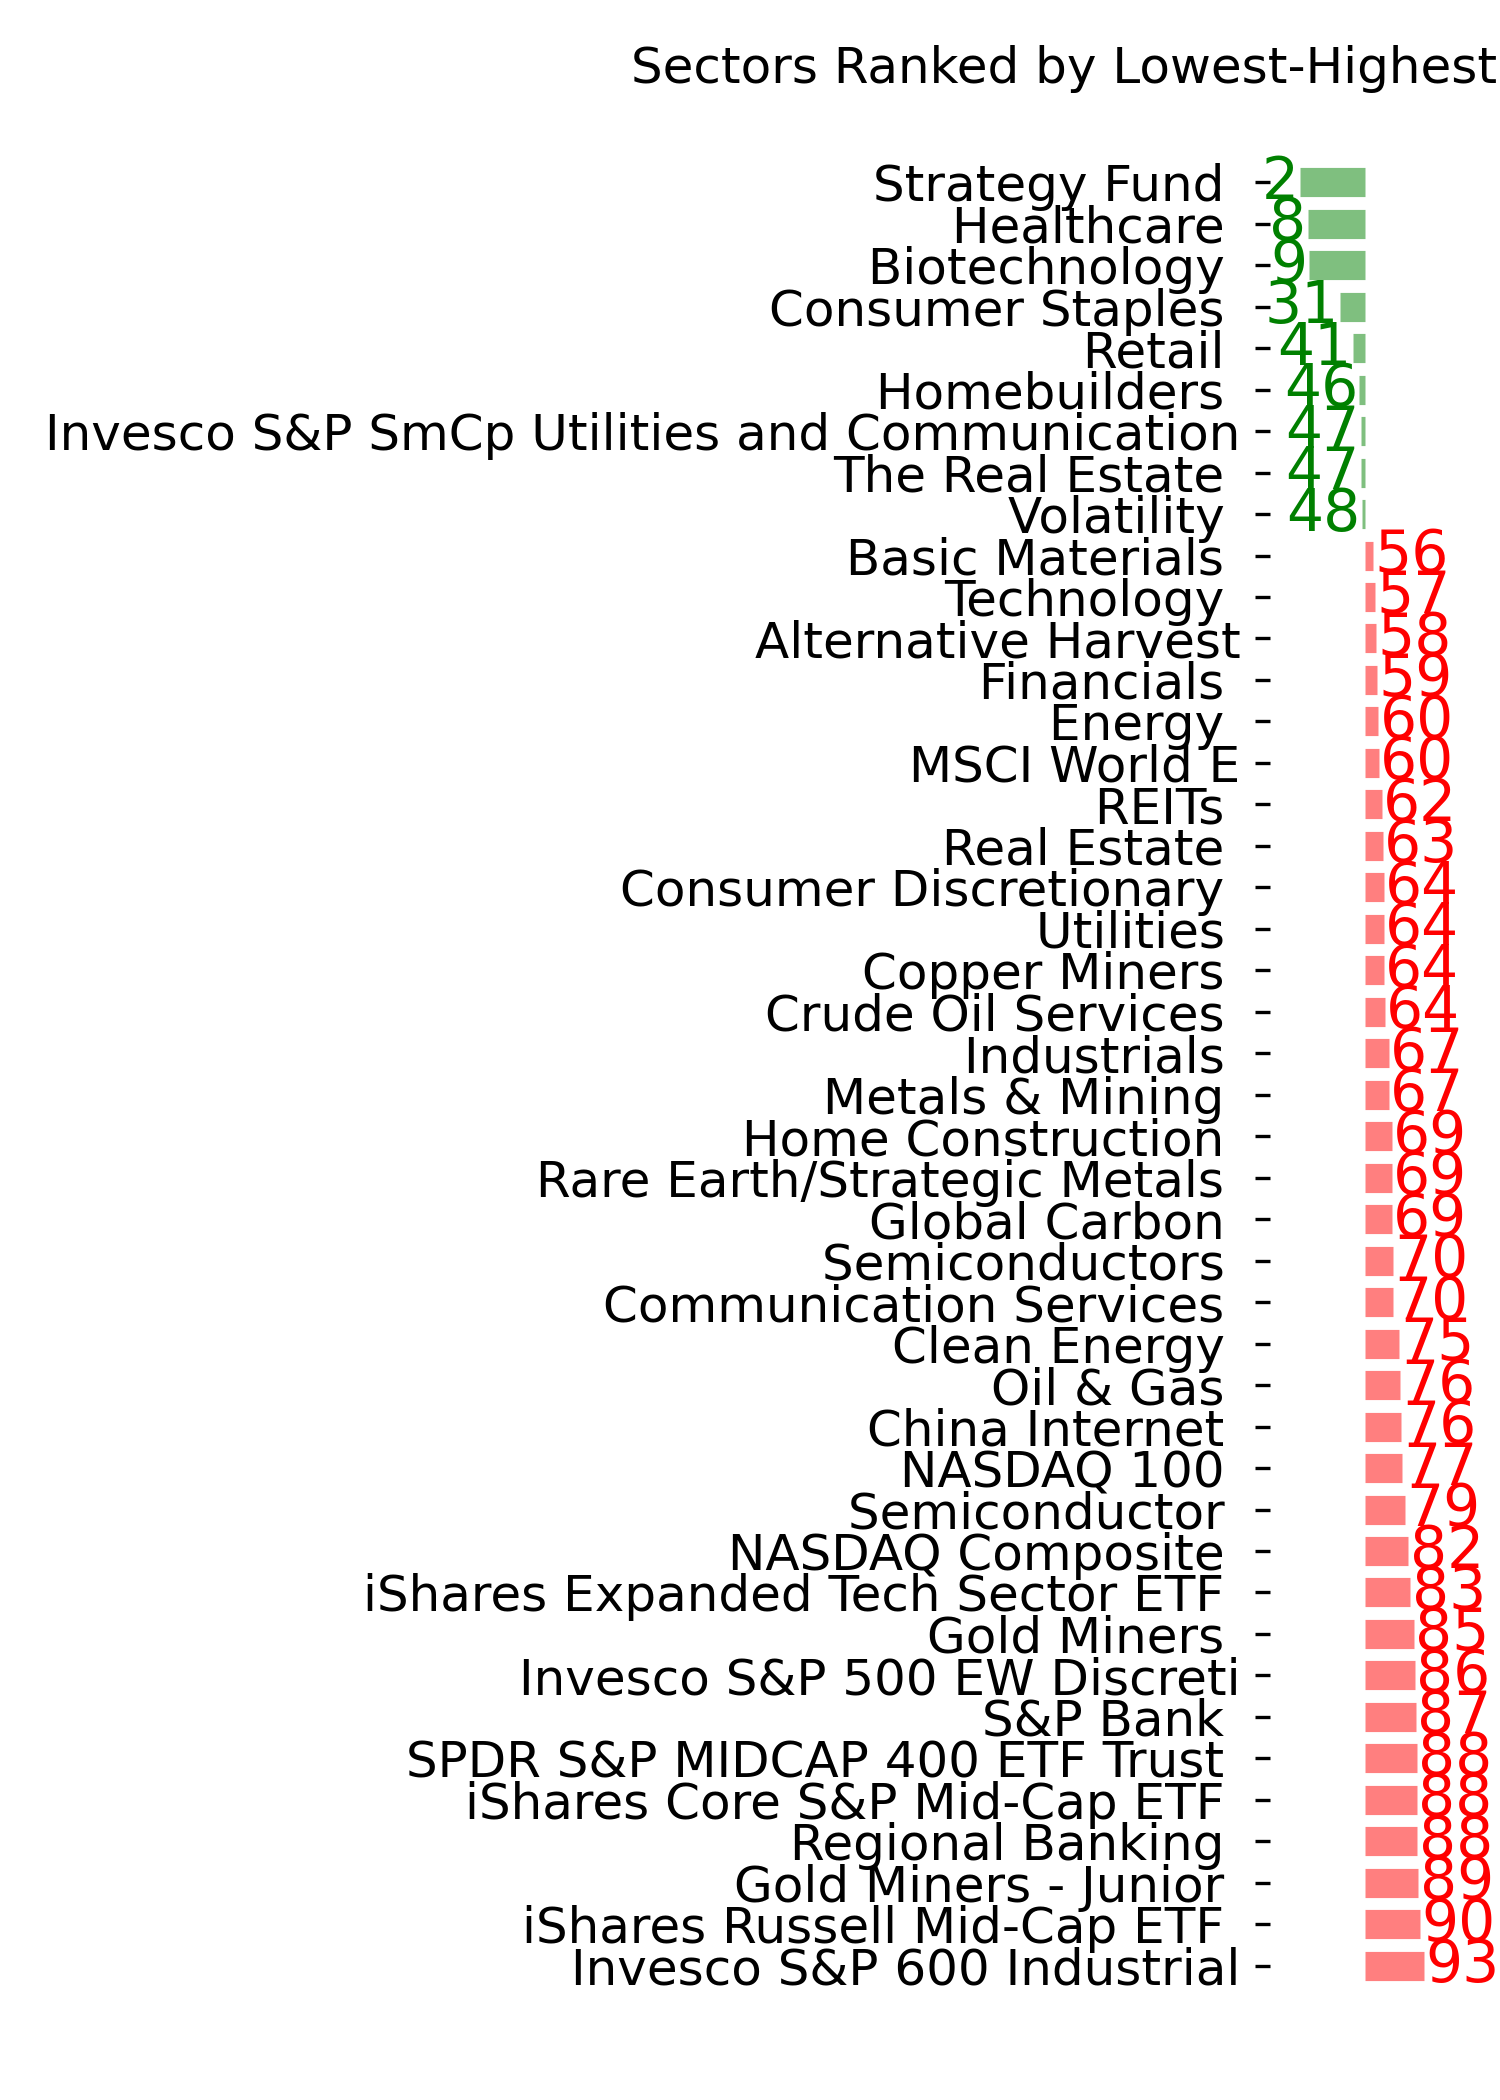
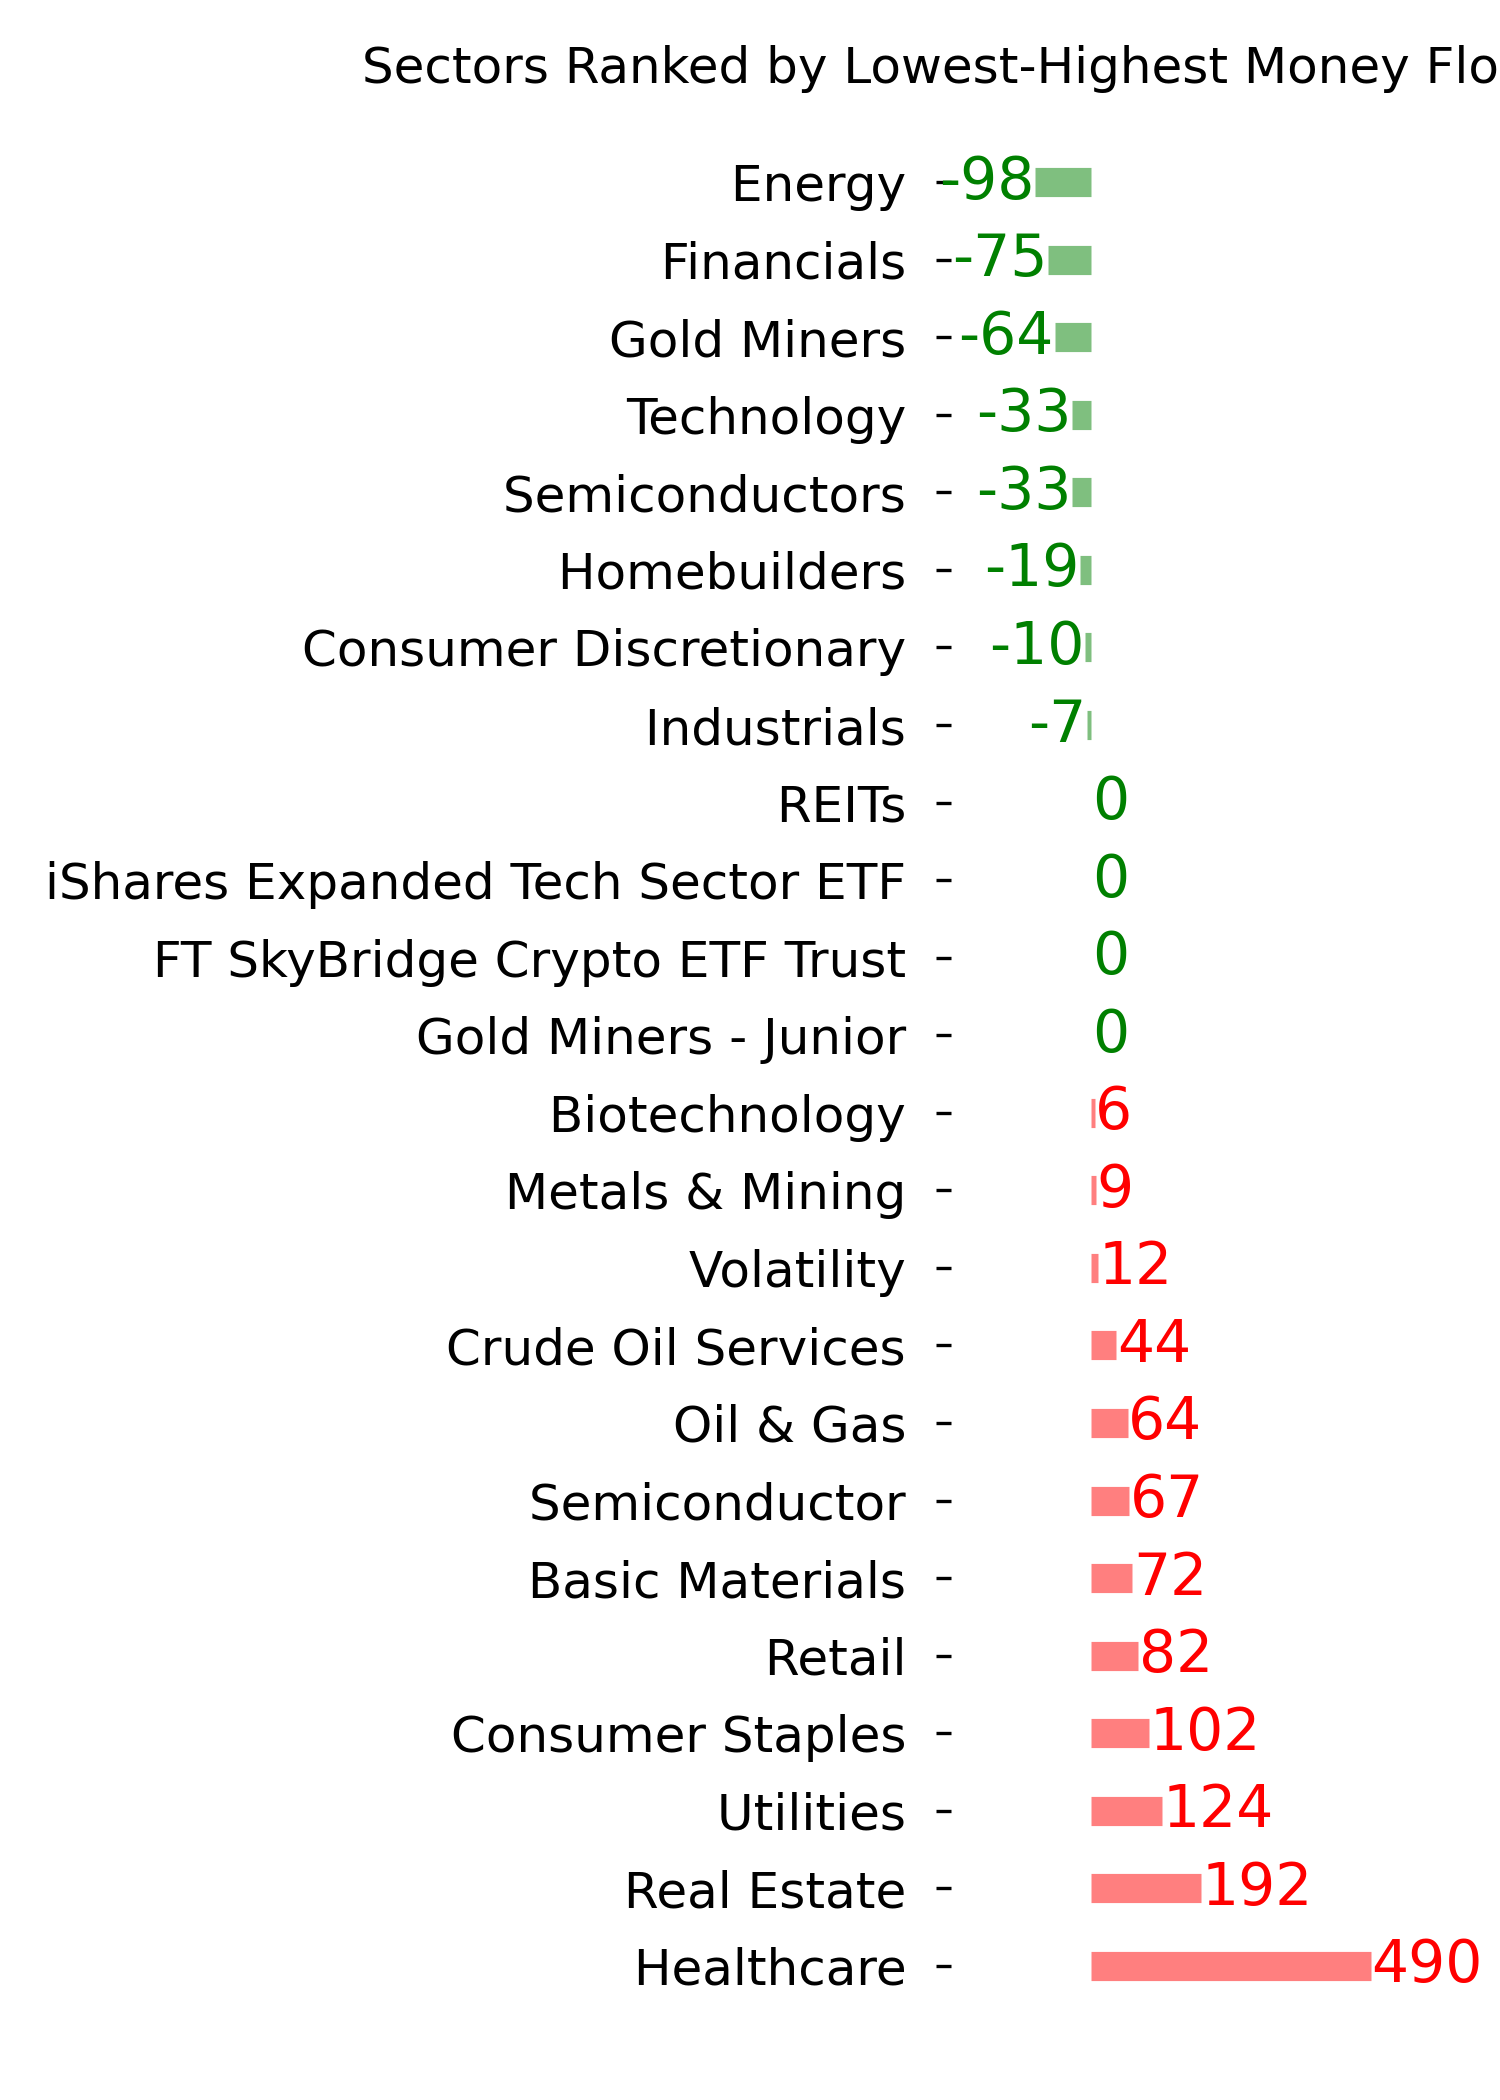
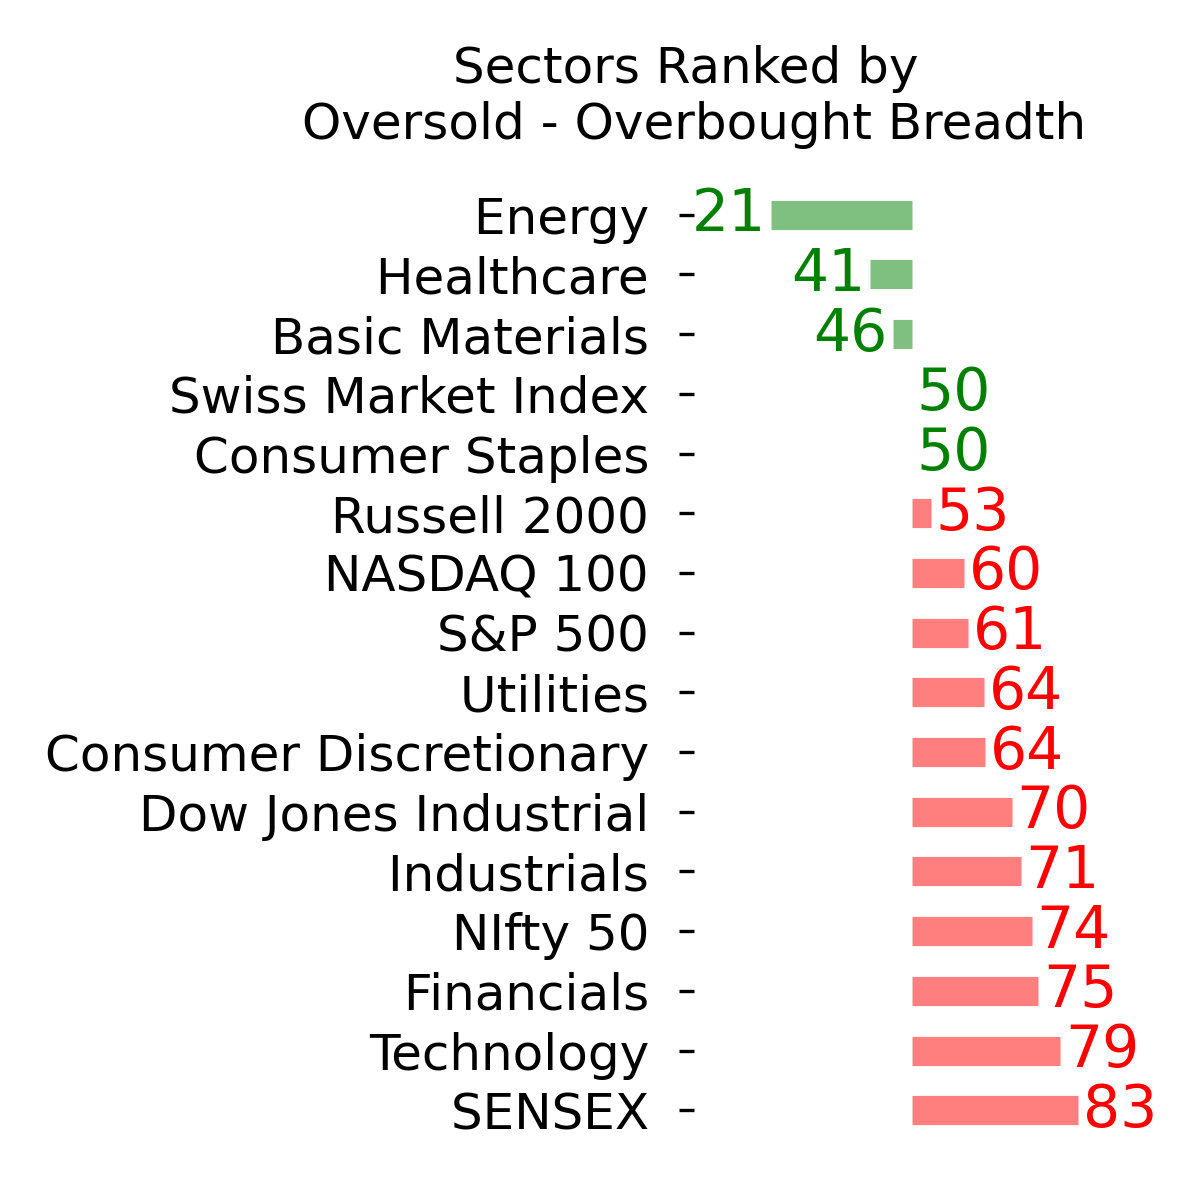
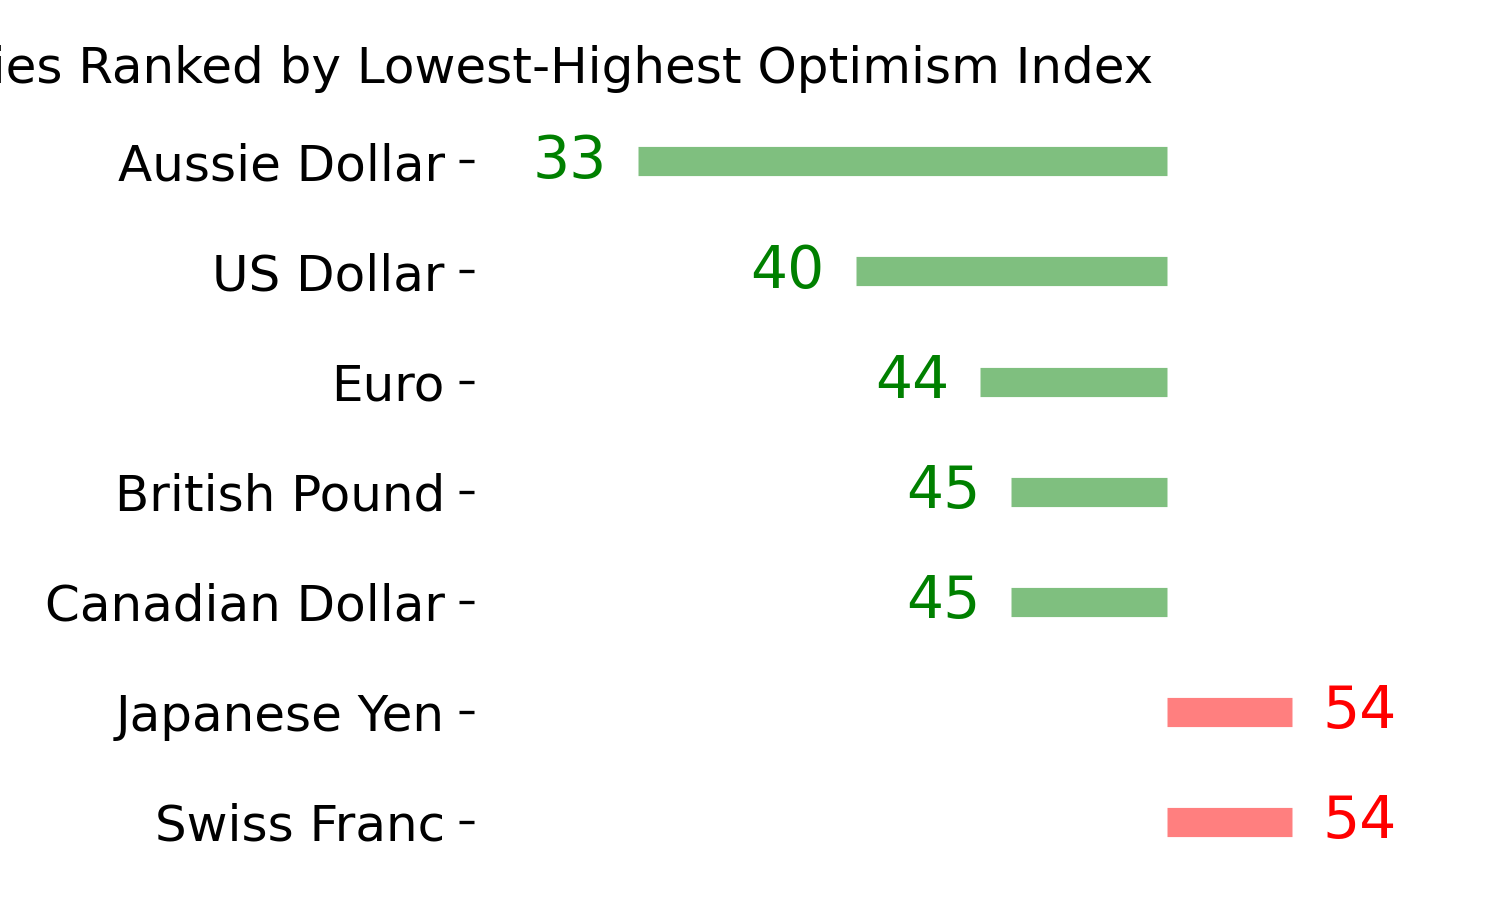
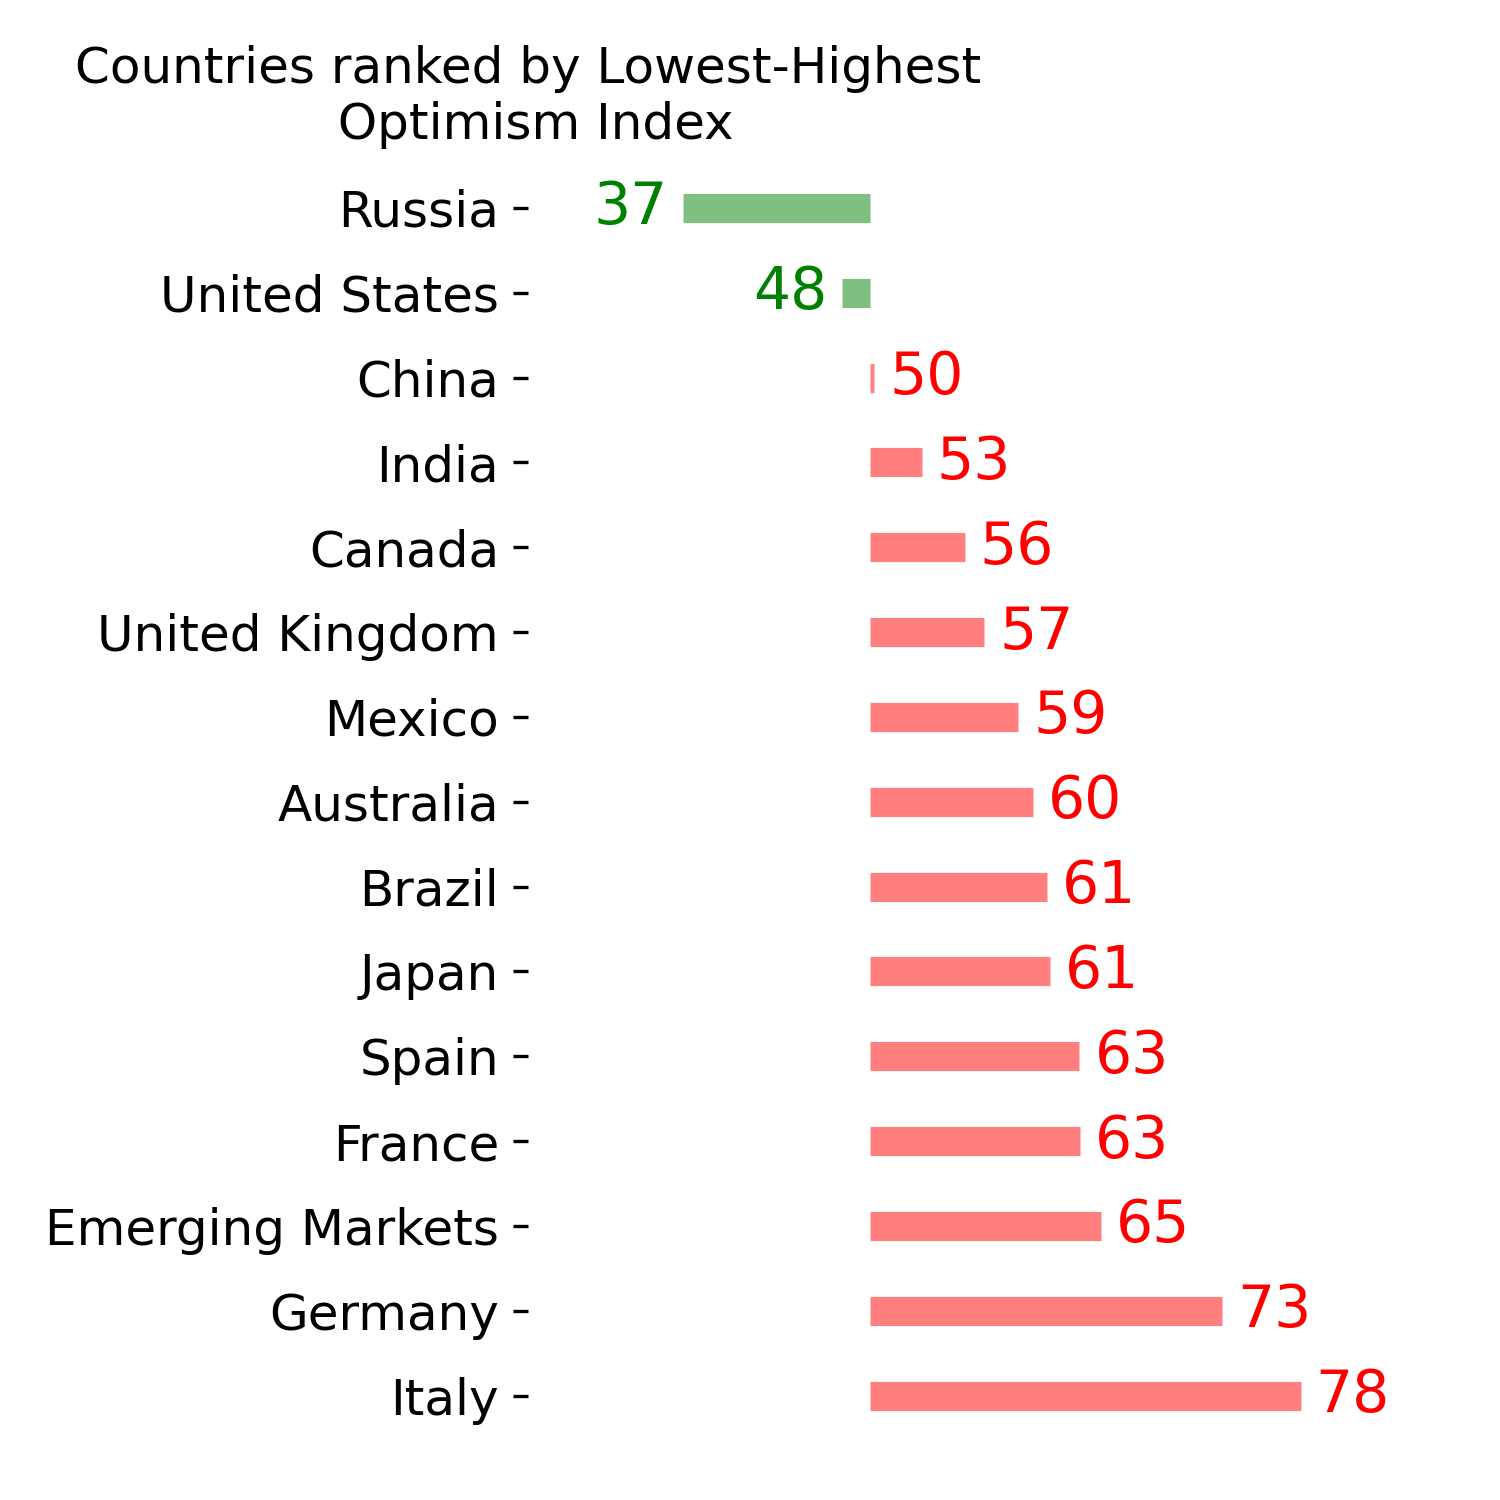
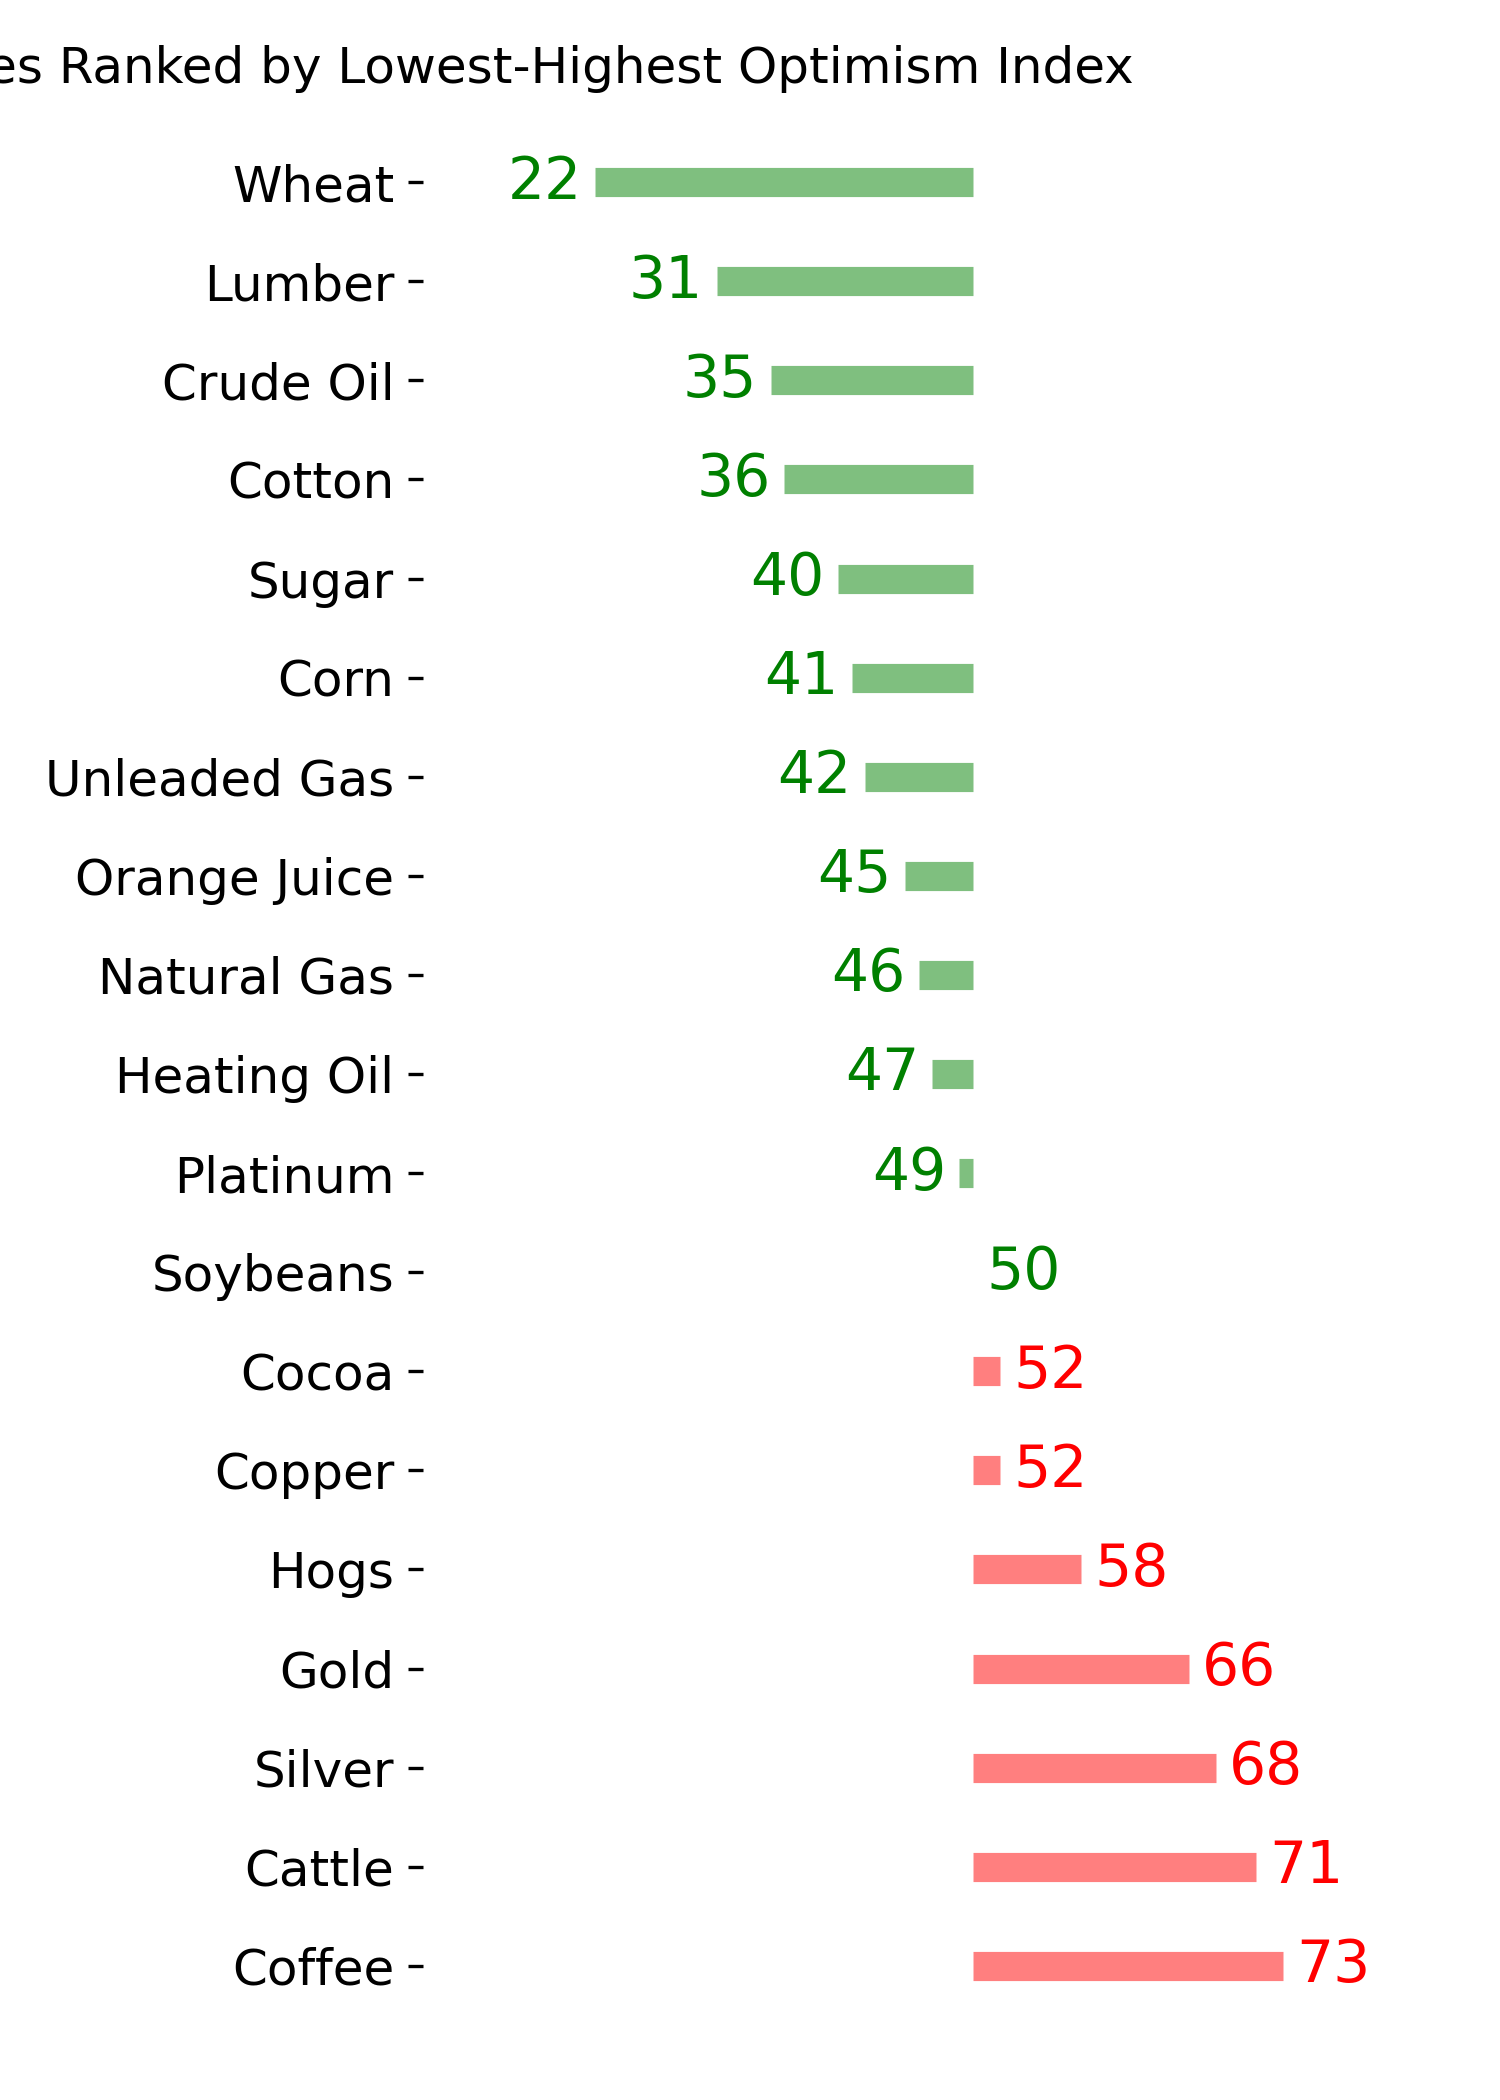
Ranks
|
|
|
|
|
|
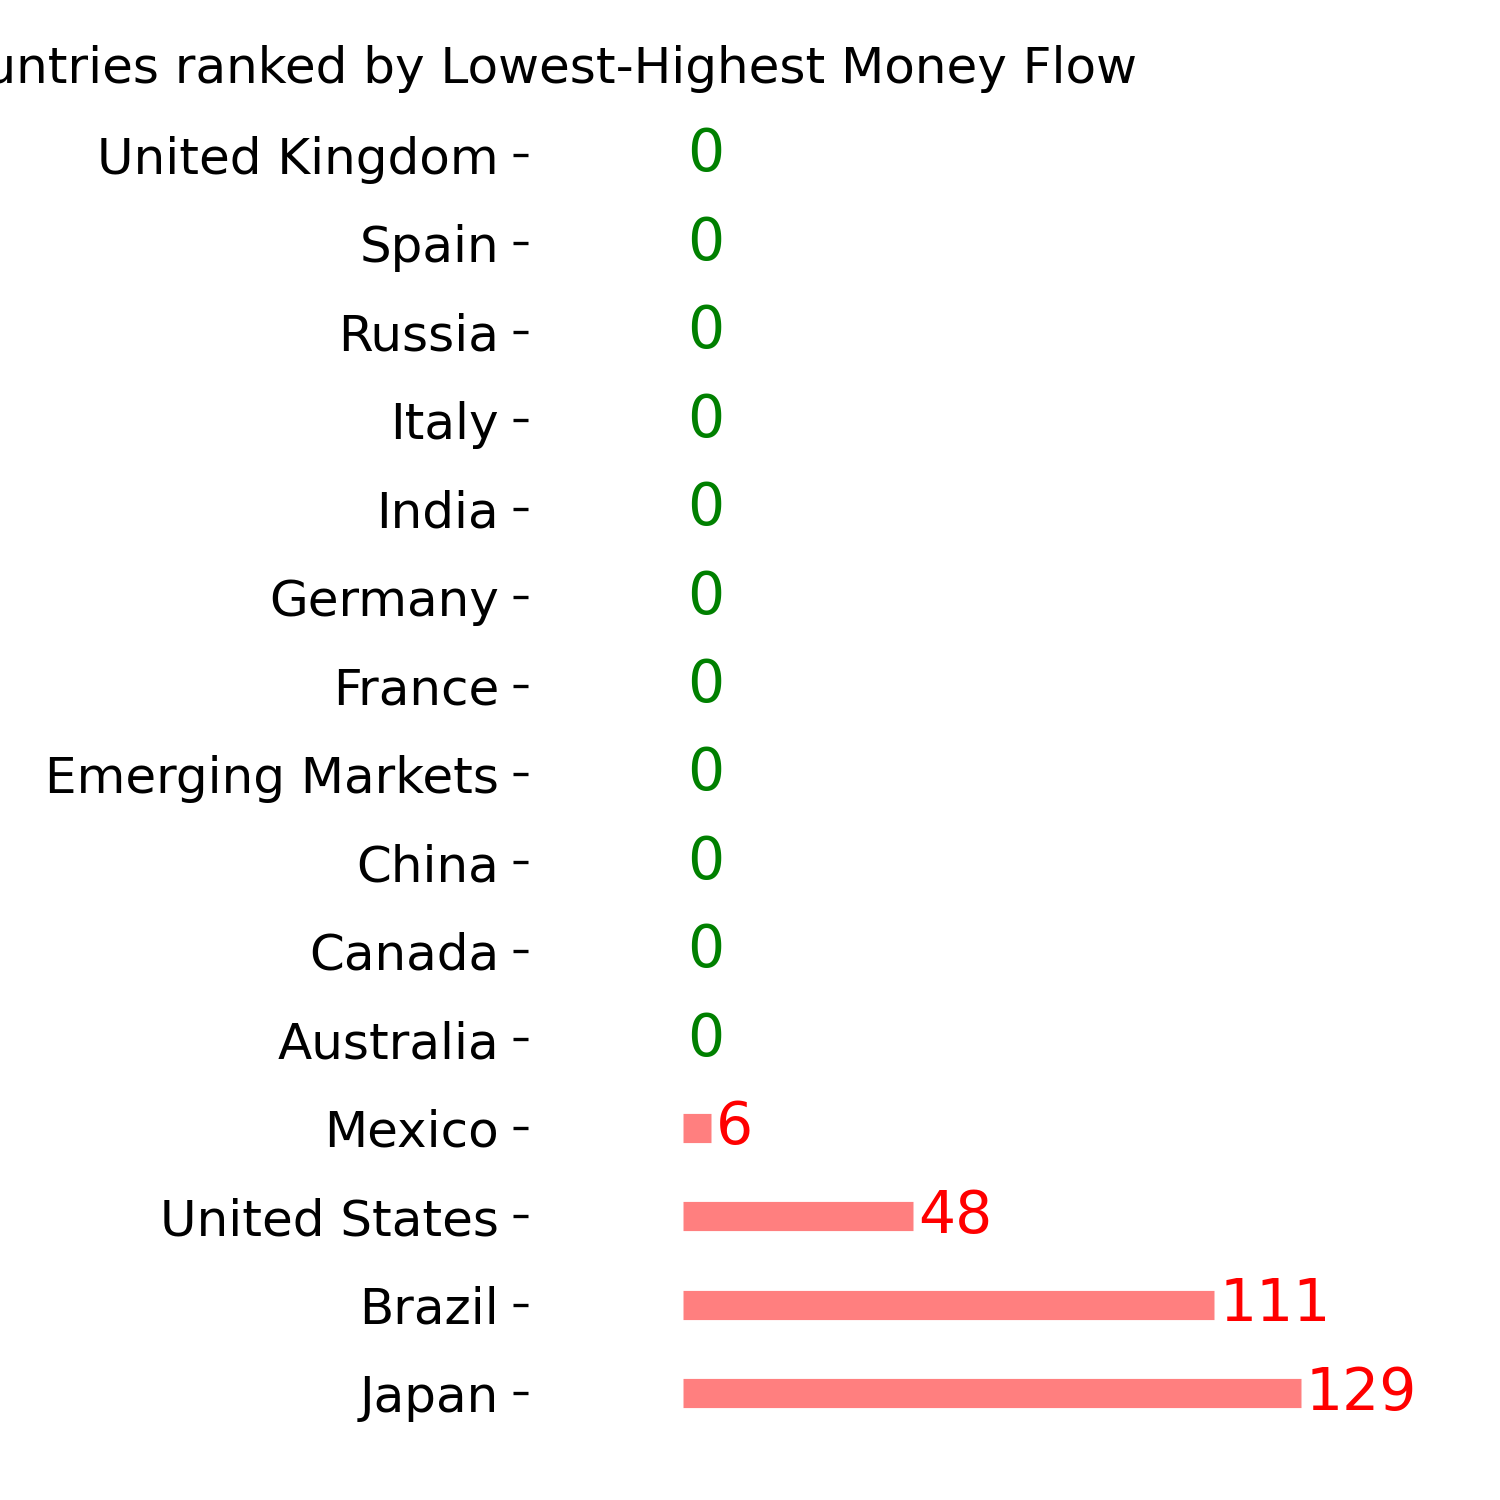
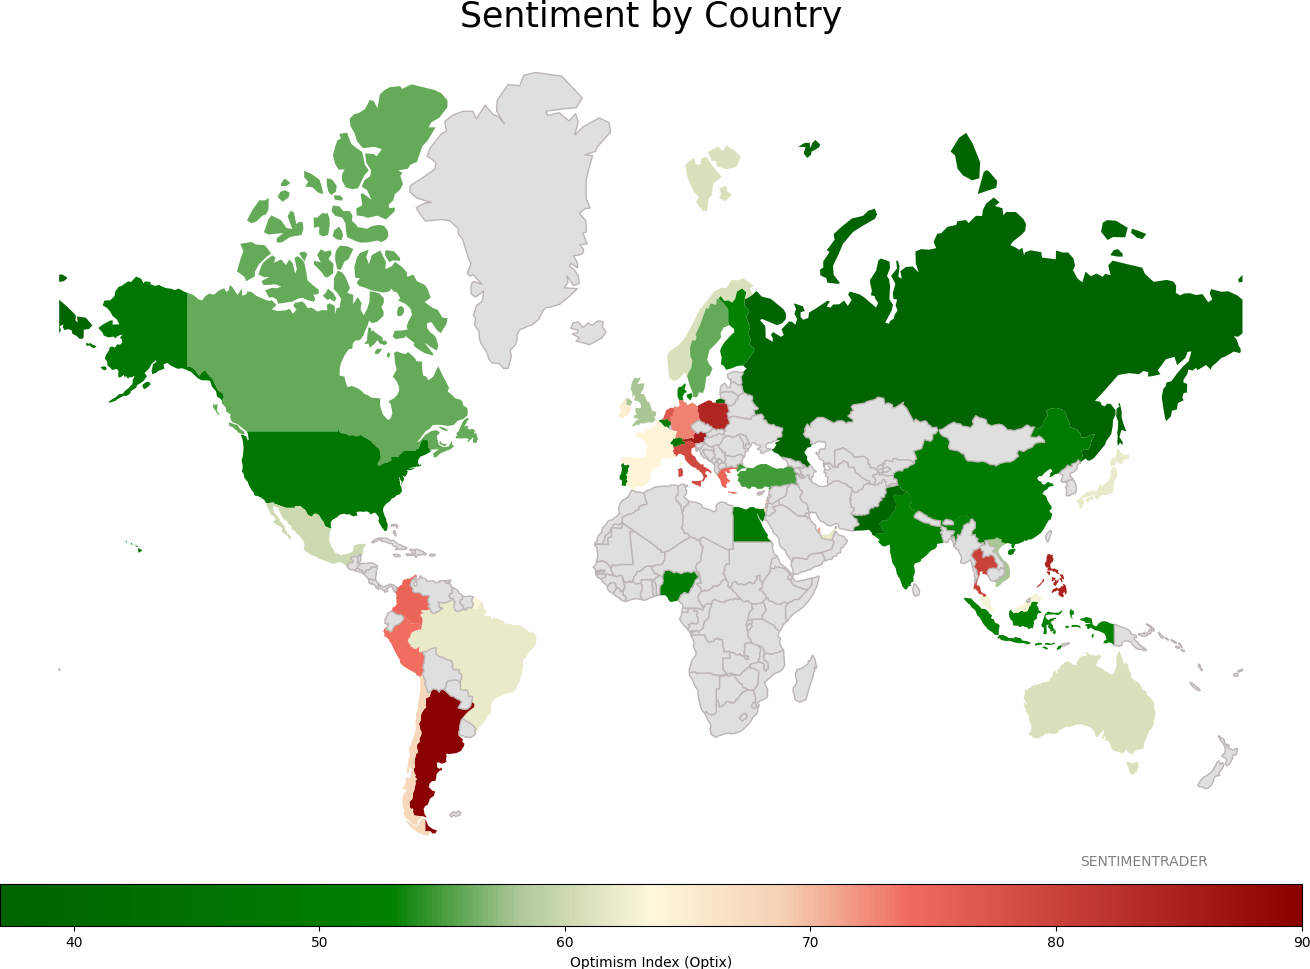
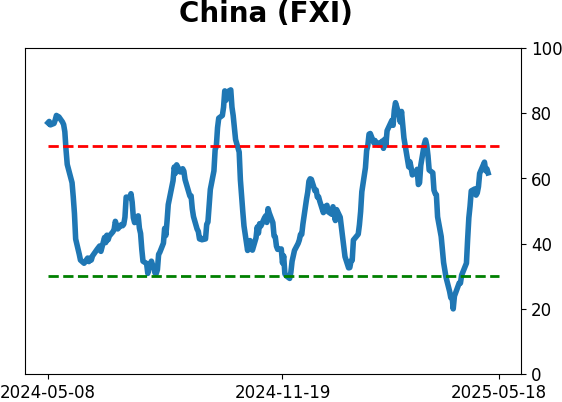
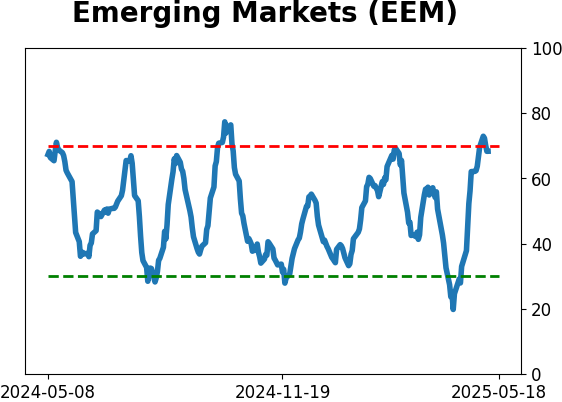
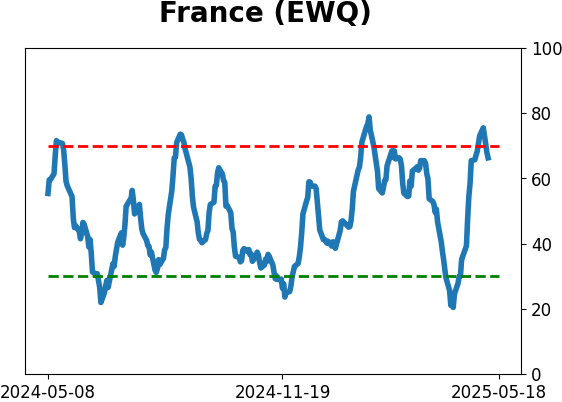
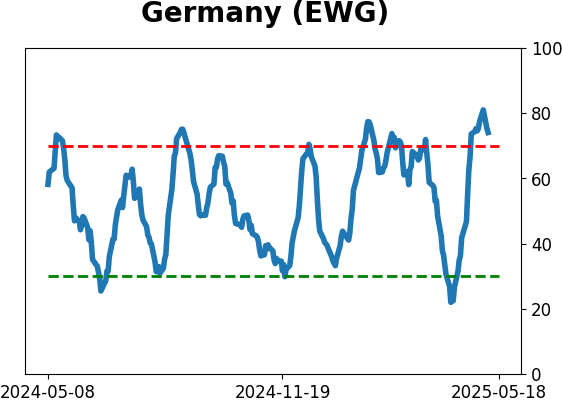
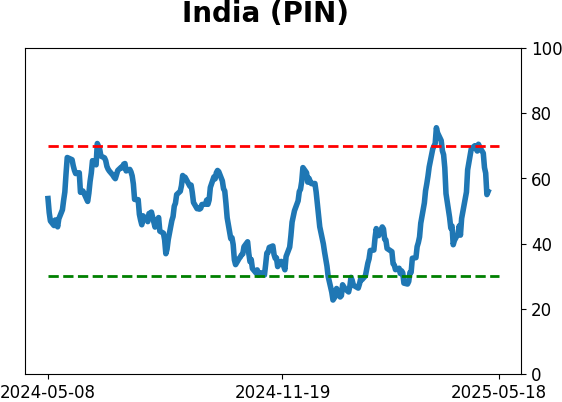
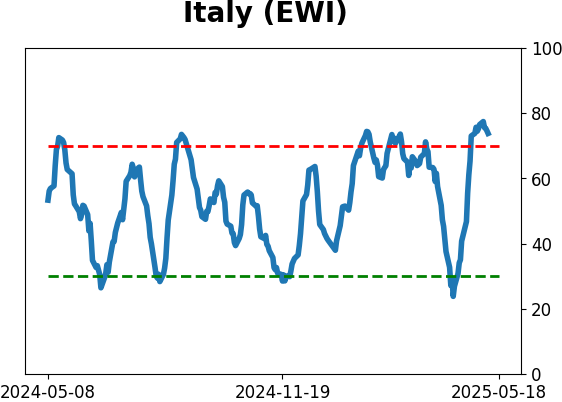
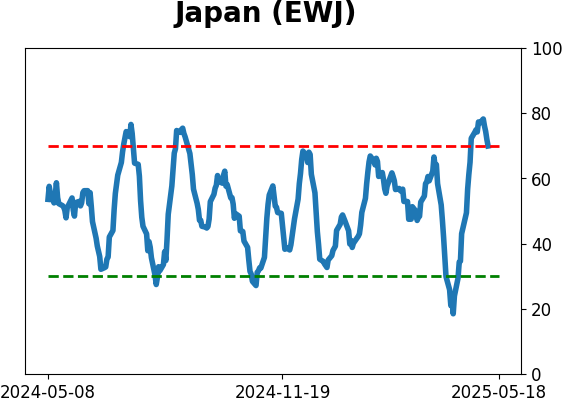
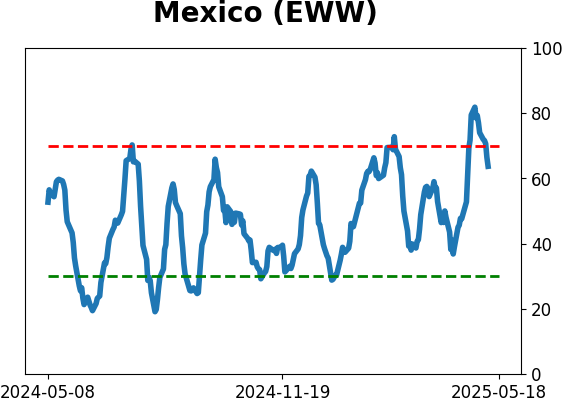
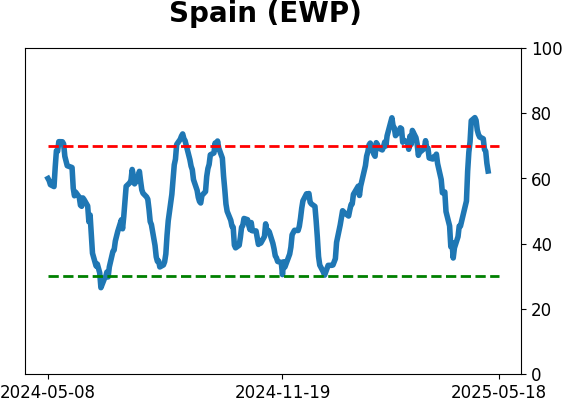
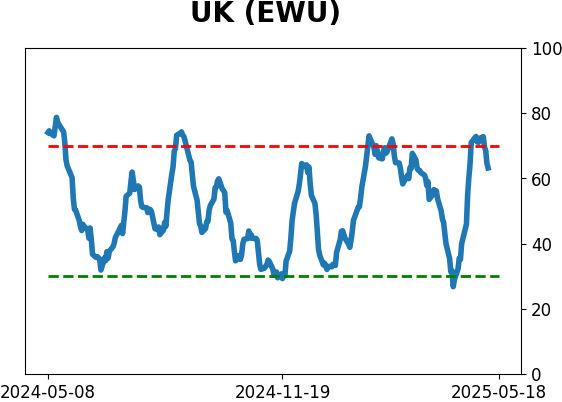
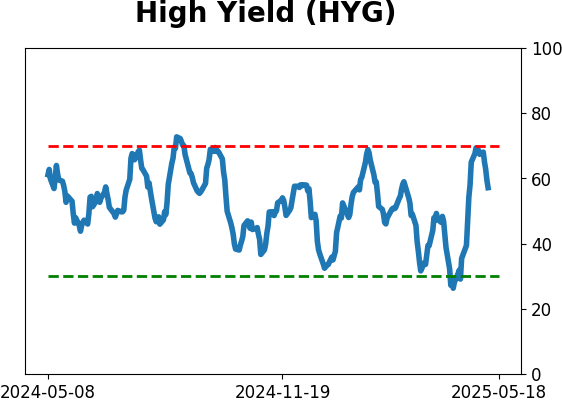
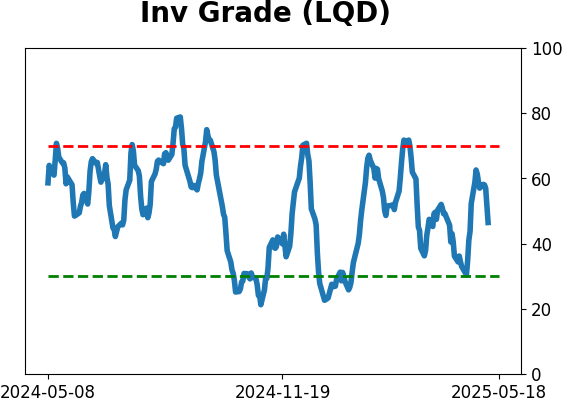
Sentiment Around The World
|
|
|
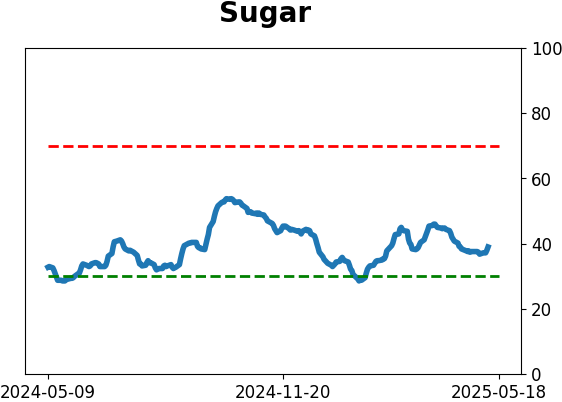
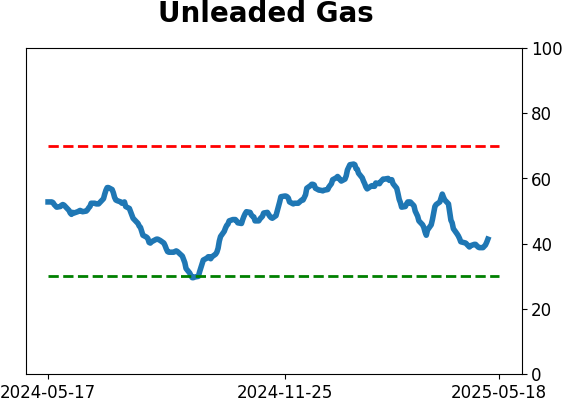
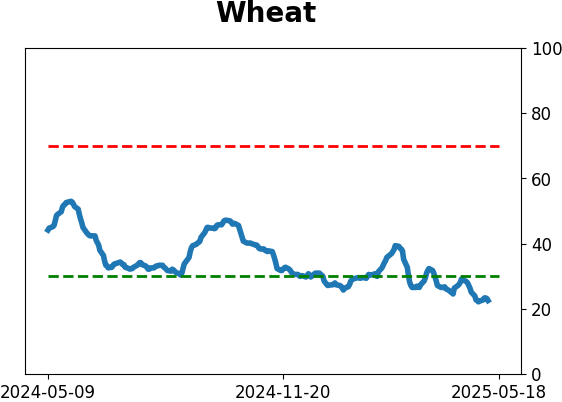
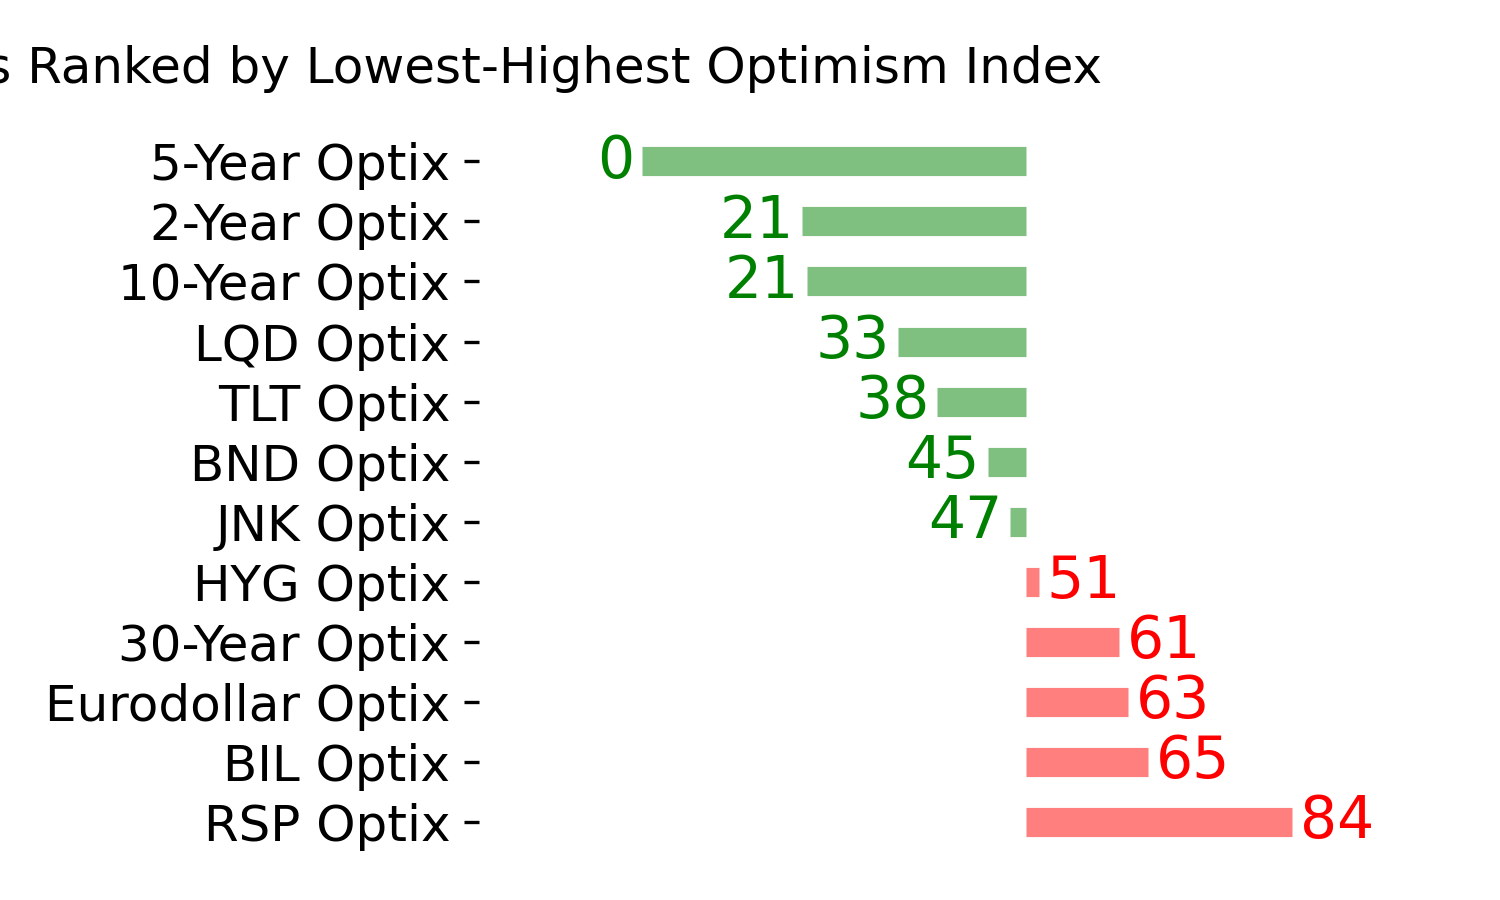
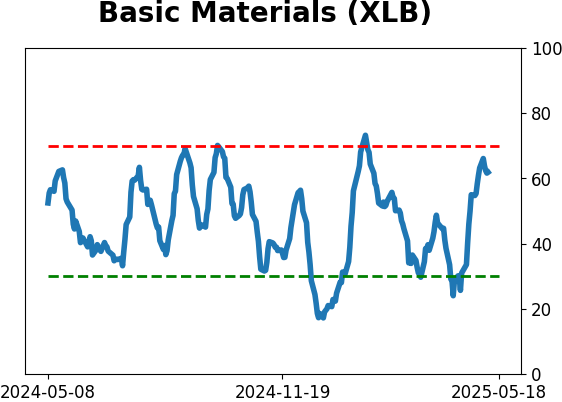
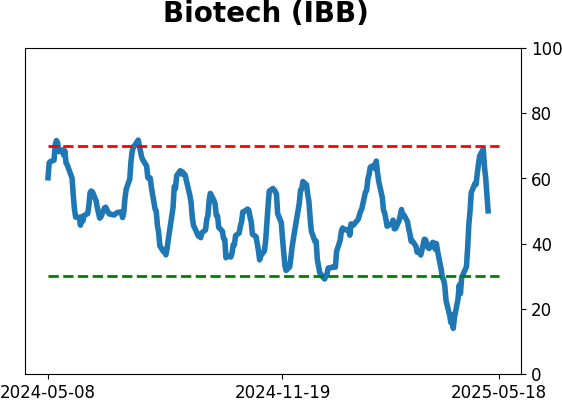
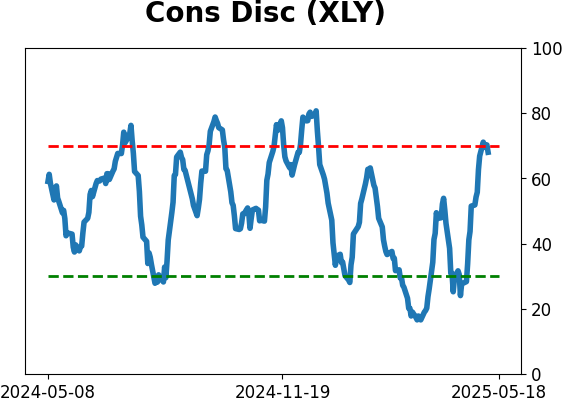
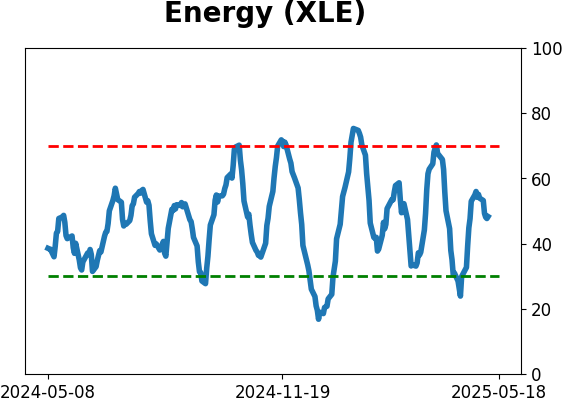
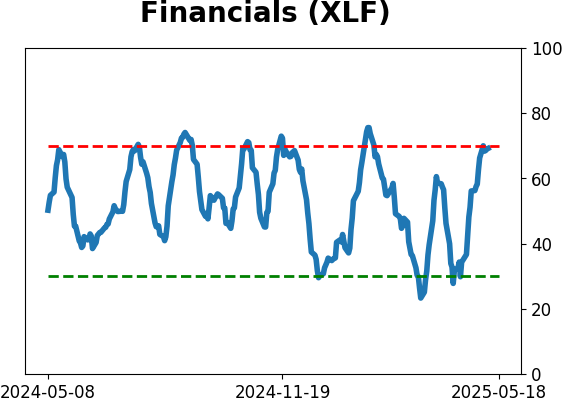
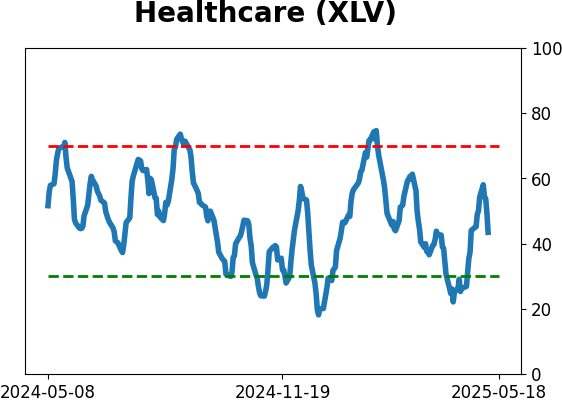
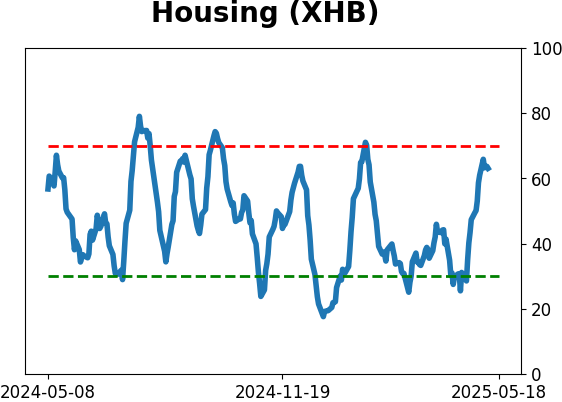
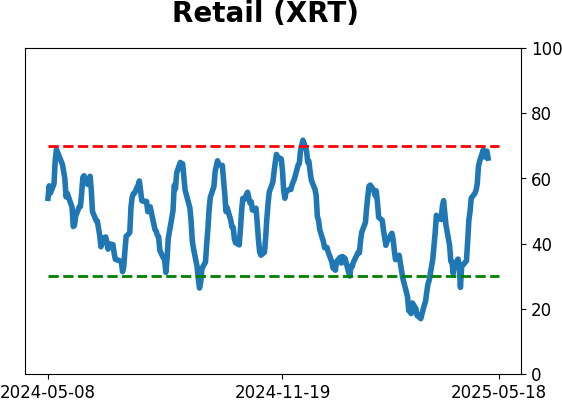
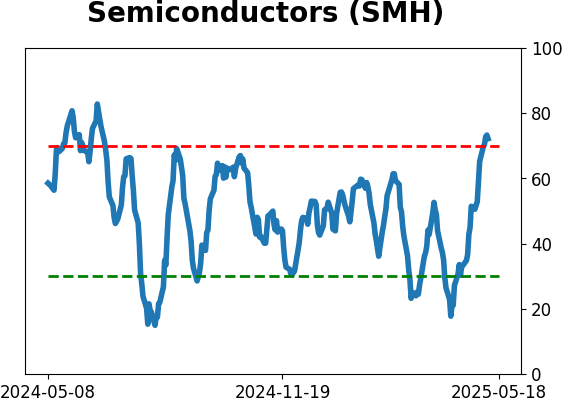
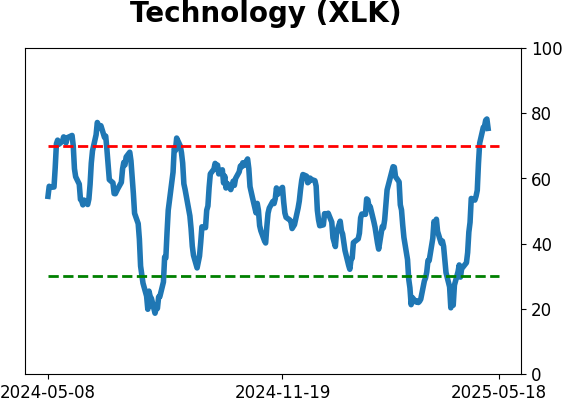
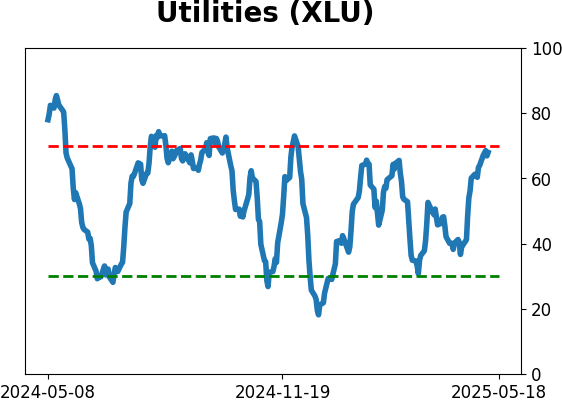
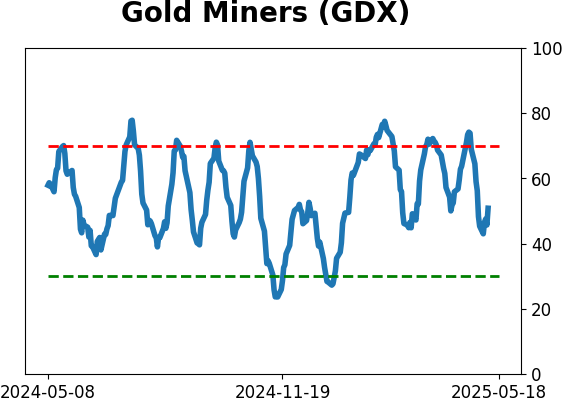
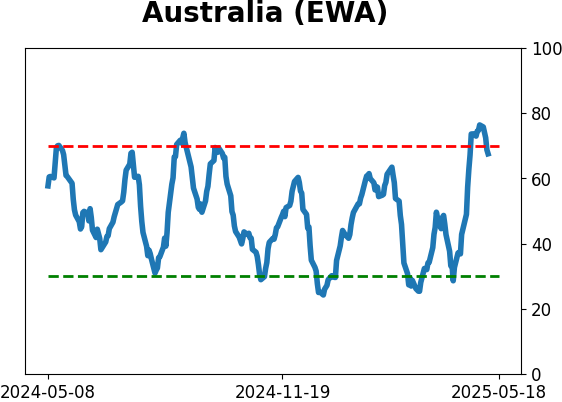
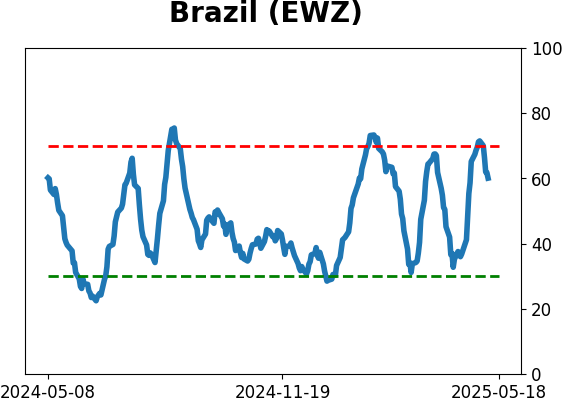
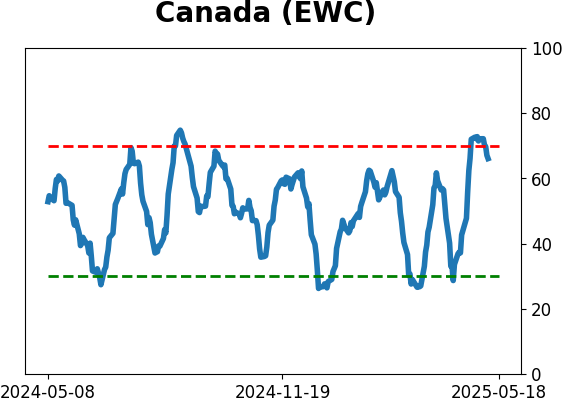
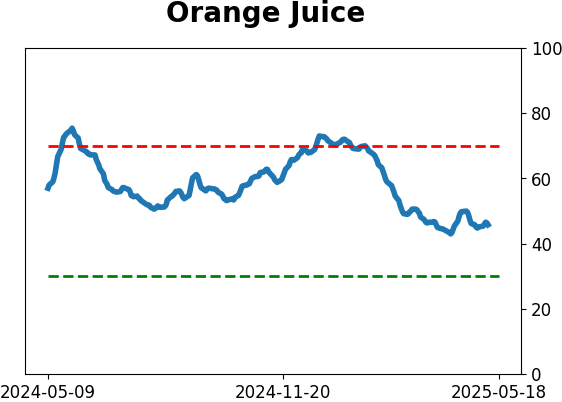
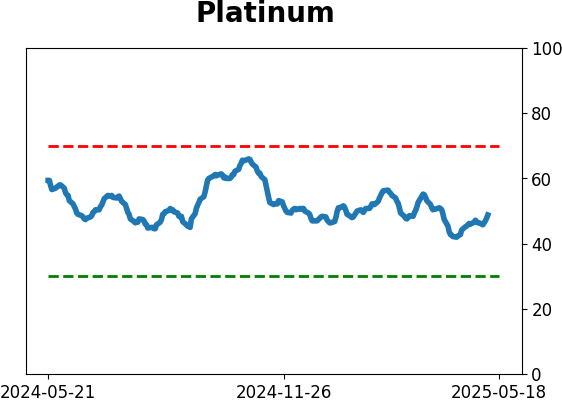
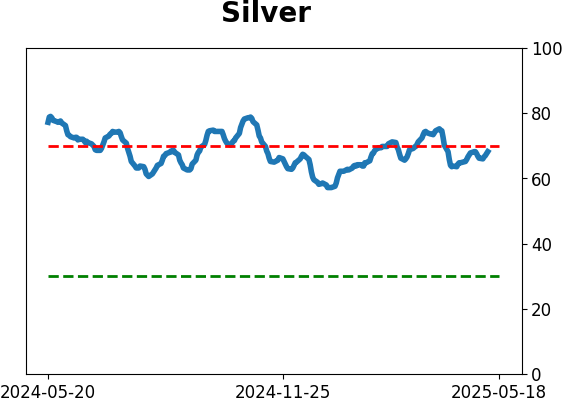
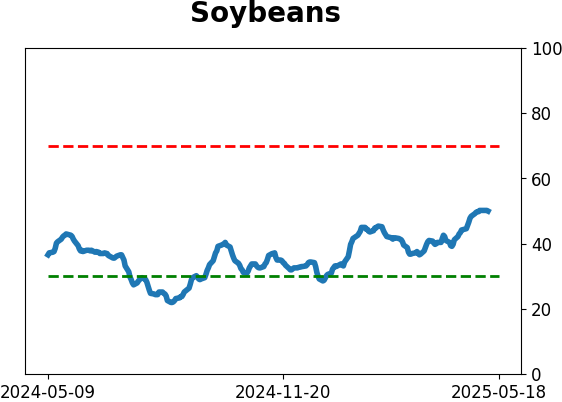
Optimism Index Thumbnails
|
|
|
|
|
|
|
|
|

|
|
|
|
|
|
|
|
|
|
|
|