Headlines
|
|
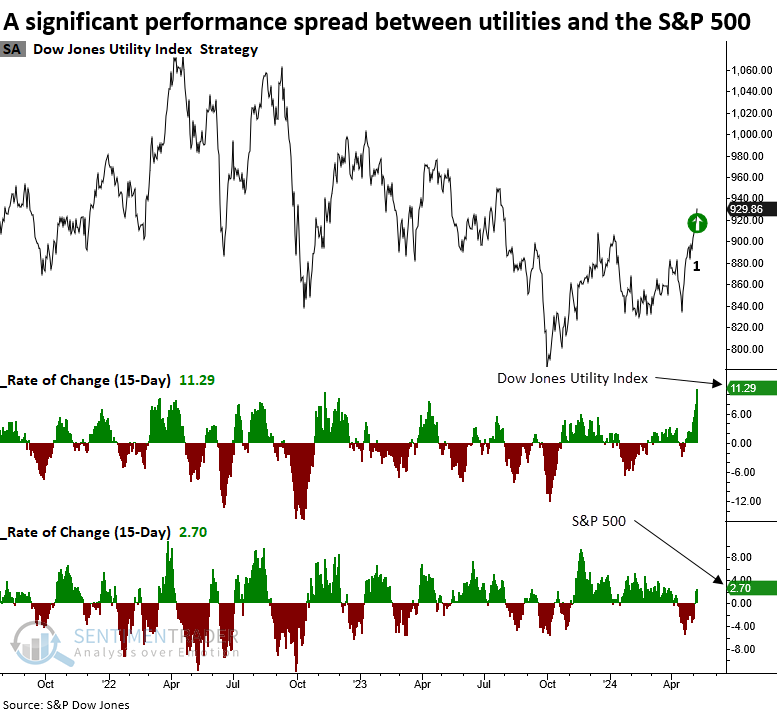
What's the market message from surging utility stocks:
Over the last three weeks, the Dow Jones Utility Index outperformed the S&P 500 by one of the most signficant amounts in over 90 years. Similar precedents suggest the positive momentum in the traditionally defensive index persists over the ensuing month, potentially yielding superior returns compared to the S&P 500.
|
Smart / Dumb Money Confidence
|
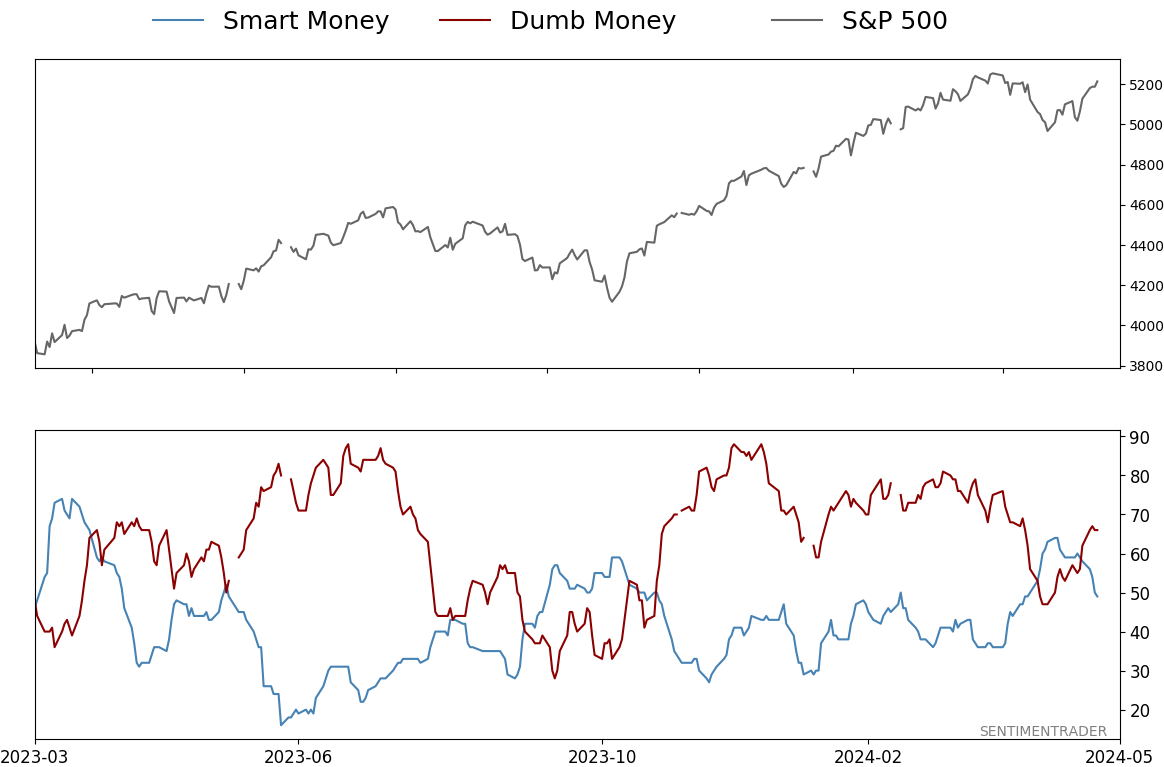
Smart Money Confidence: 49%
Dumb Money Confidence: 66%
|
|
Risk Levels
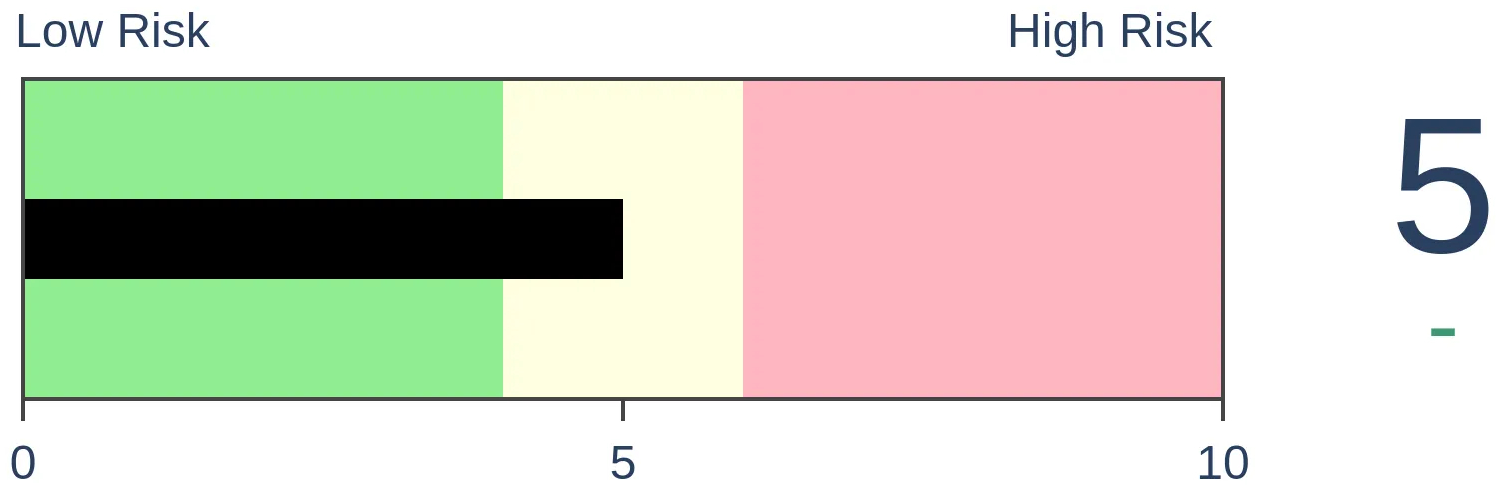
Stocks Short-Term
|
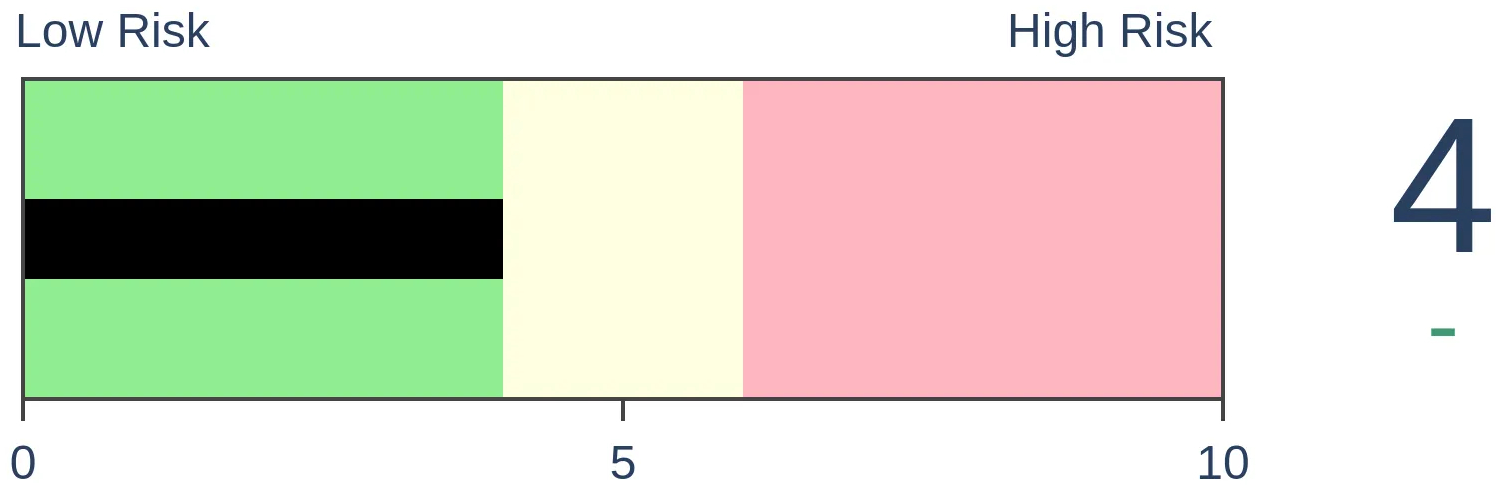
Stocks Medium-Term
|
|
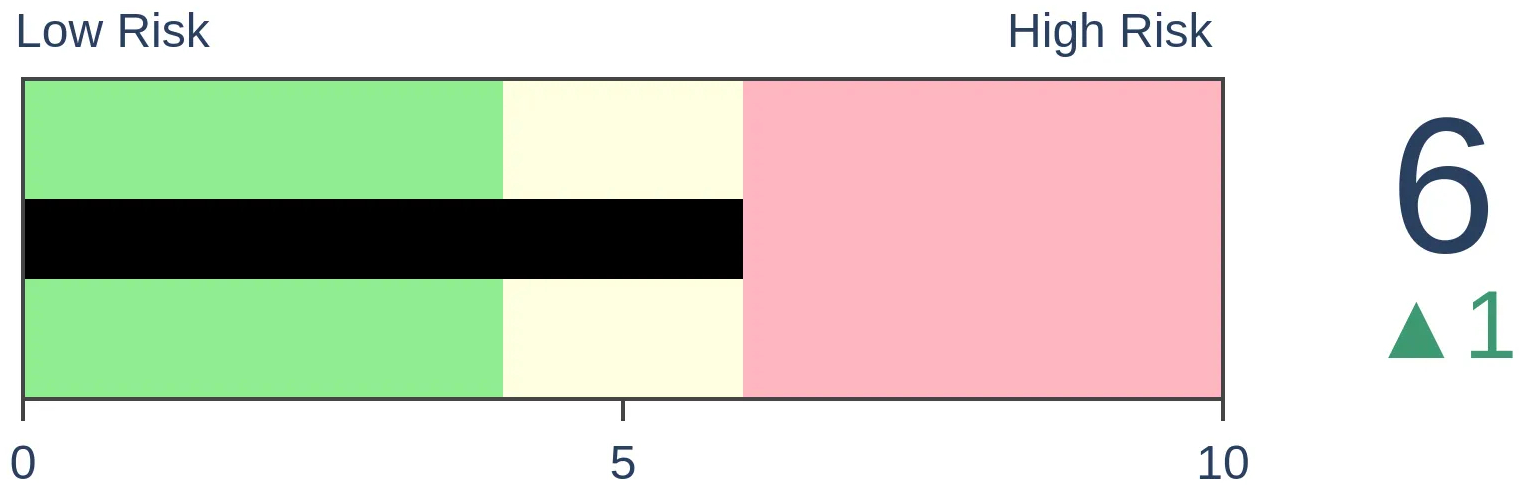
Bonds
|
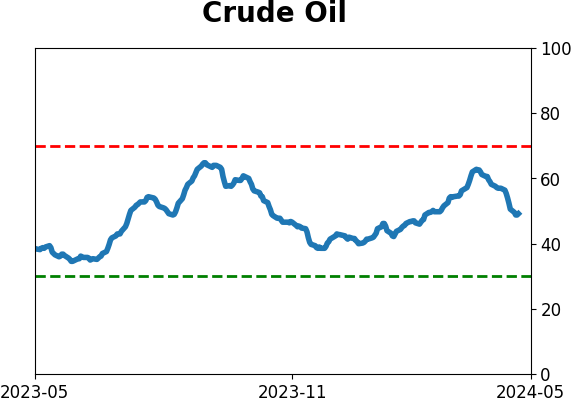
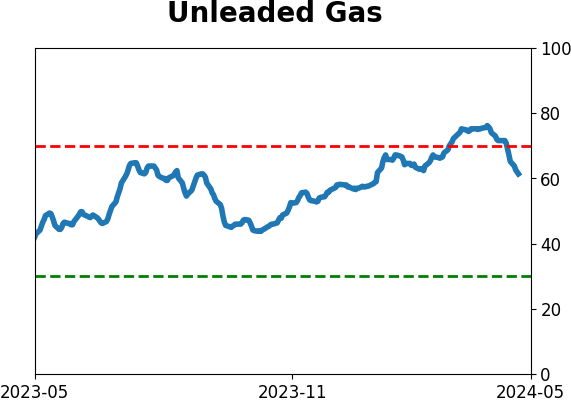
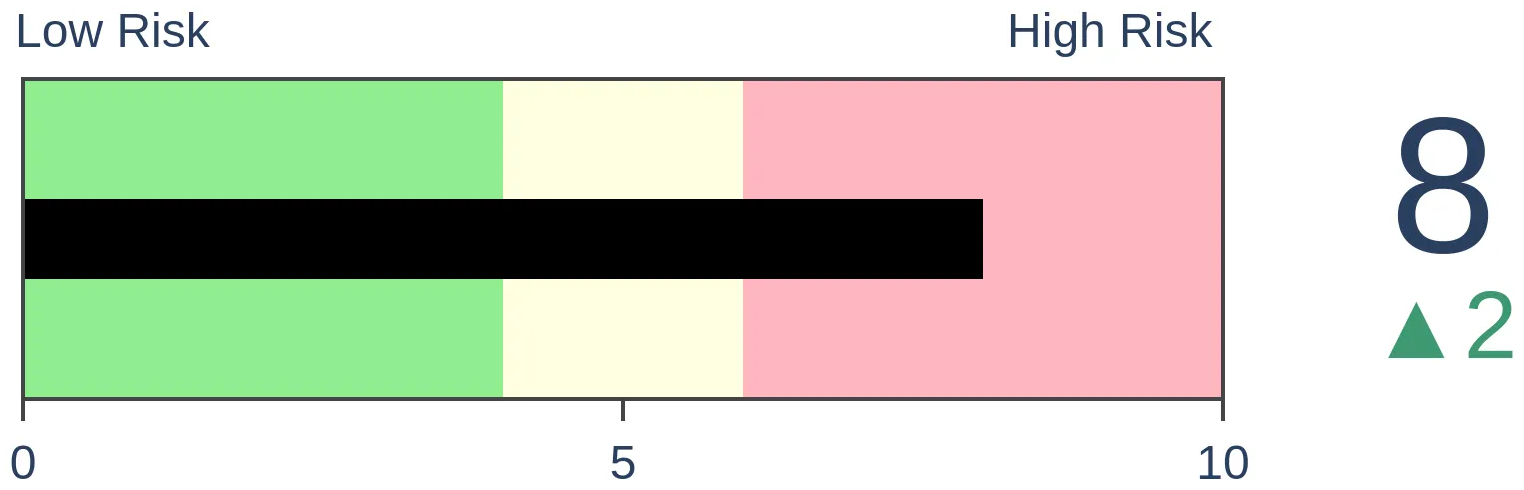
Crude Oil
|
|
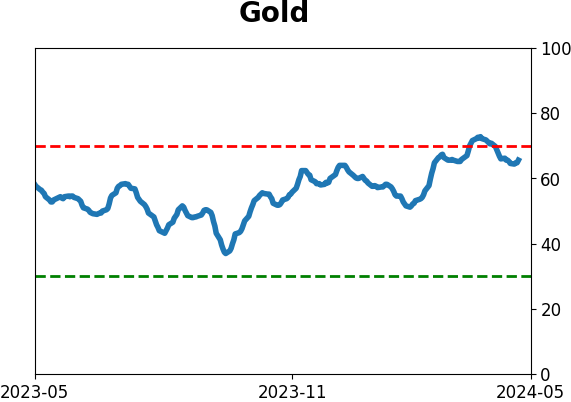
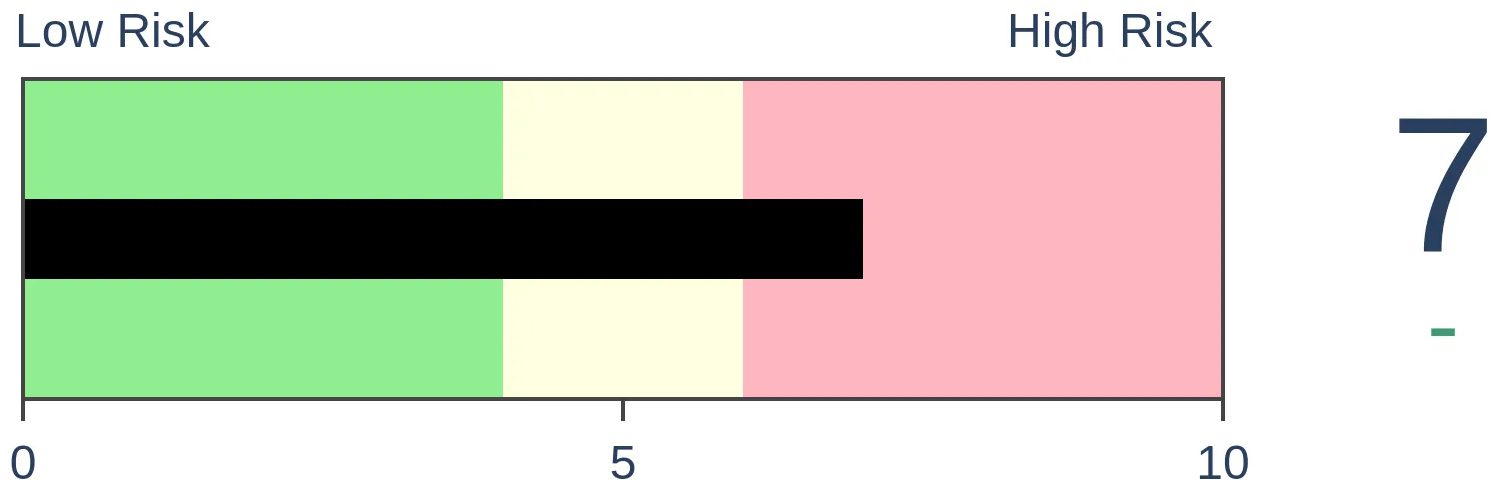
Gold
|
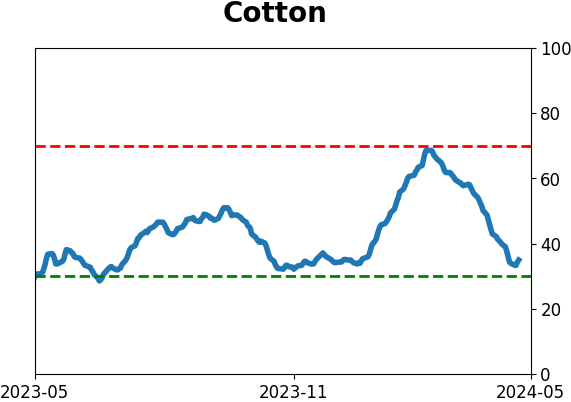
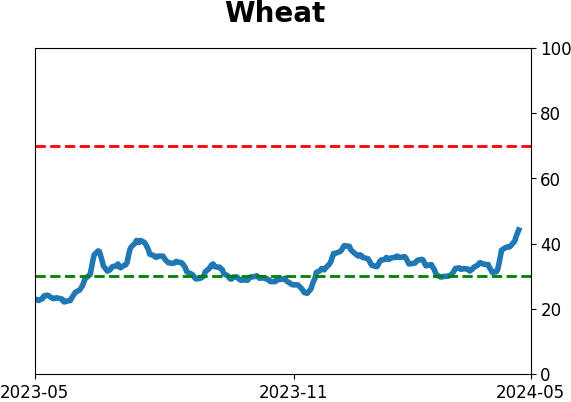
Agriculture

|
|
Research
By Dean Christians
BOTTOM LINE
Over the last three weeks, the Dow Jones Utility Index outperformed the S&P 500 by one of the most signficant amounts in over 90 years. Similar precedents suggest the positive momentum in the traditionally defensive index persists over the ensuing month, potentially yielding superior returns compared to the S&P 500.
FORECAST / TIMEFRAME
None
|
Key points:
- Over the last three weeks, the Dow Jones Utility Index has significantly outperformed the S&P 500
- Comparable return profiles suggest the positive momentum in Utilities could persist over the next month
- From a relative perspective, the Utility Index outperformed the S&P 500
What, if any, insights can we derive from Utilities outperforming the S&P 500
Rennie Yang from @MarketTells tweeted an interesting scenario regarding Utilities. Over the last three weeks, the Dow Jones Utility Index has rallied 11.29%, significantly outpacing the S&P 500's 2.79% return.
In my search for historical parallels, I found only seven other precedents since 1929. However, adjusting the thresholds to 10% for the Utility Index and 5% for the S&P 500 expanded the sample size to 22 instances.
These short-term bursts of utility index outperformance typically coincided with the aftermath of significant bear markets, potentially signifying a catch-up trade from a defensive laggard. But the occurrences that triggered when the S&P 500 was near a high, like now, raise a concern. Such instances notably transpired in 1929 and 2000. Cue the scary music.
Similar relative performance trends suggest further upside momentum
Following periods when the Dow Jones Utility Index rallied 10% over three weeks as the S&P 500 rose less than 5%, the favorable price momentum in the traditionally defensive group tended to persist over the following month, increasing 73% of the time with a median gain of 2.8%.
It's worth noting that instances where the S&P 500 remained within 5% of its 5-year high showed a positive outcome in 5 out of 6 cases in the subsequent month. However, 4 out of 6 precedents turned negative a year later.
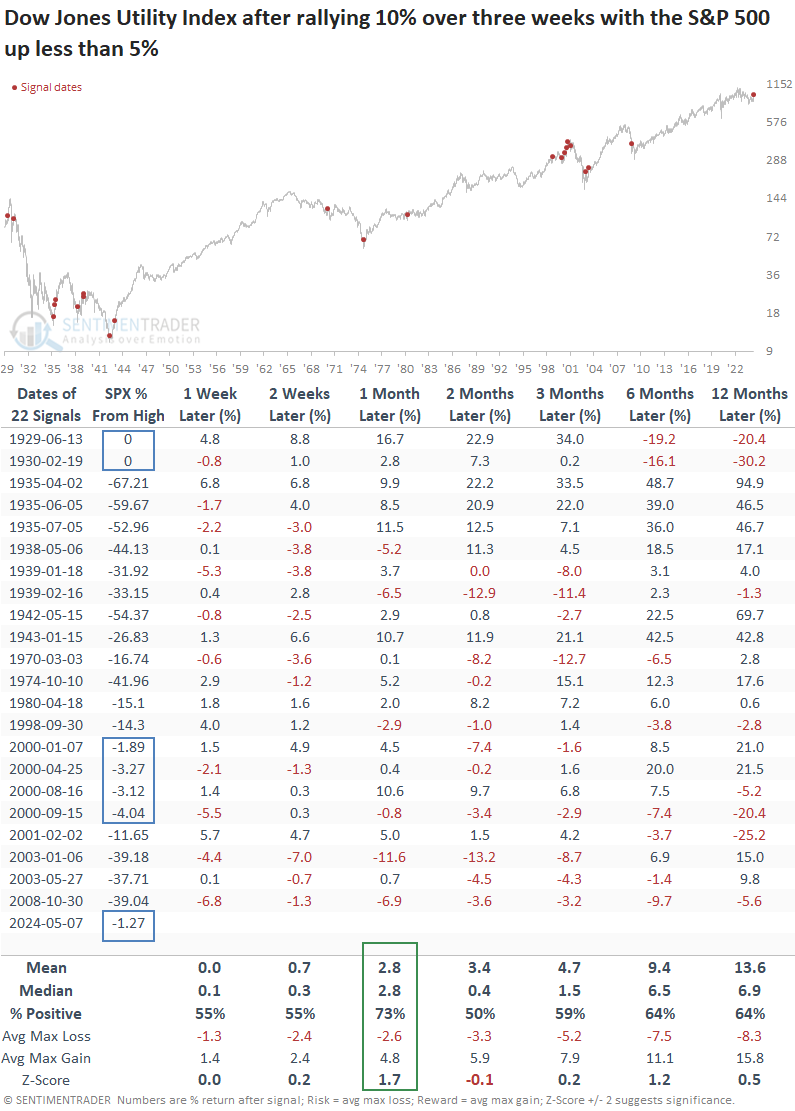
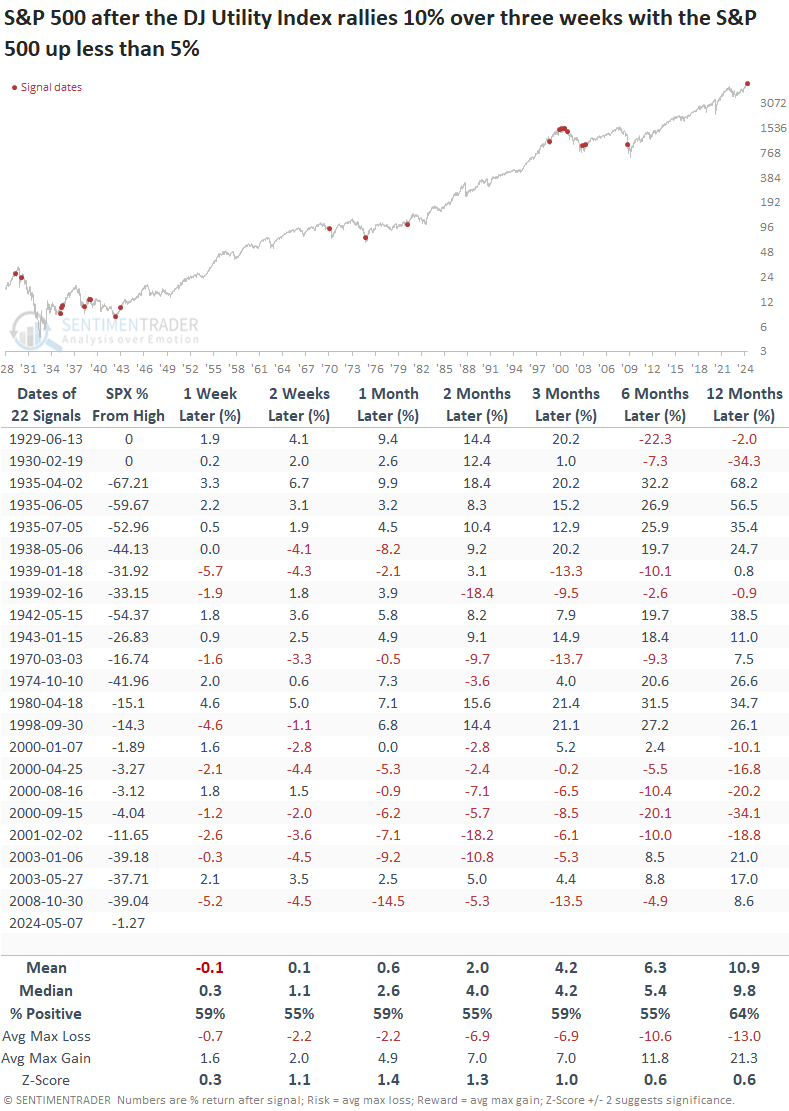
While median returns for the S&P 500 showed an upward bias over the following year and exceeded historical tendencies over the study period, the Dotcom bust's precedents notably impacted win rates.
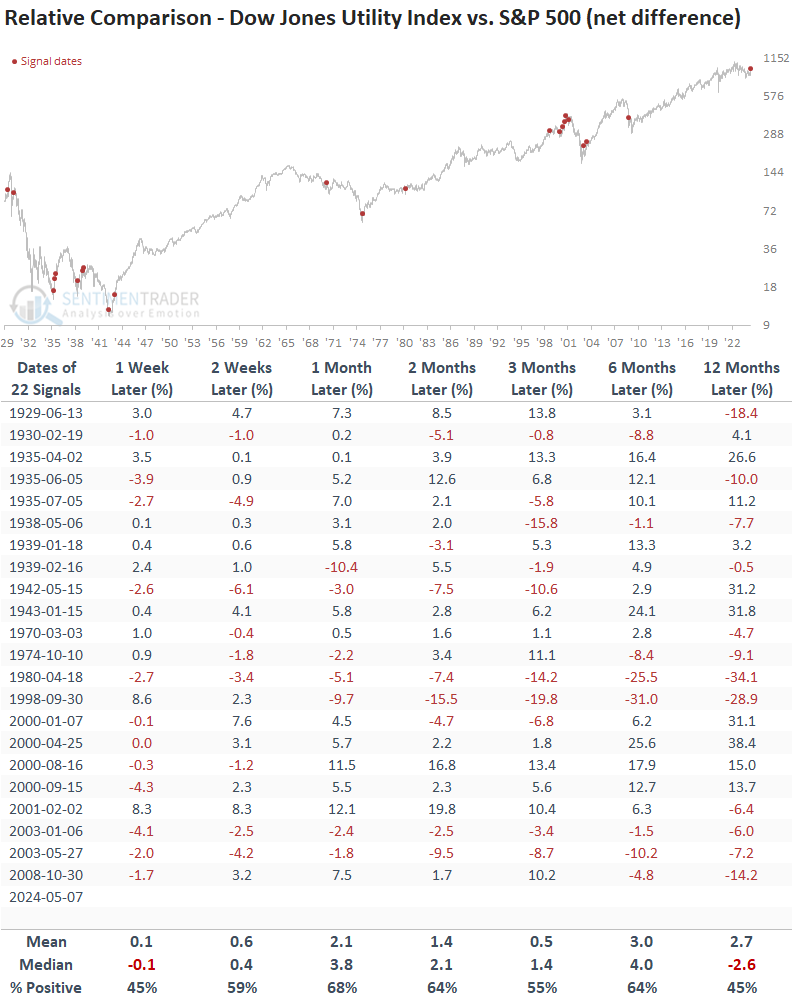
The Dow Jones Utility Index showed a reasonably consistent bias to outperform the S&P 500, especially over the subsequent month. Unsurprisingly, the defensive group failed to keep pace with the world's most benchmarked index a year later.
What the research tells us...
Utility stocks have experienced a significant surge over the past three weeks, notably outperforming the S&P 500. Investors could be taking their cues from a dip in yields or getting excited about future power needs for AI and EVs. While I won't delve into these narratives, historical data suggests that the positive price momentum in the Dow Jones Utility Index could persist over the next month, potentially outperforming the S&P 500. Though uncommon, historical parallels such as 1929 and 2000 underscore the importance of being open to all potential outcomes.
Indicators at Extremes
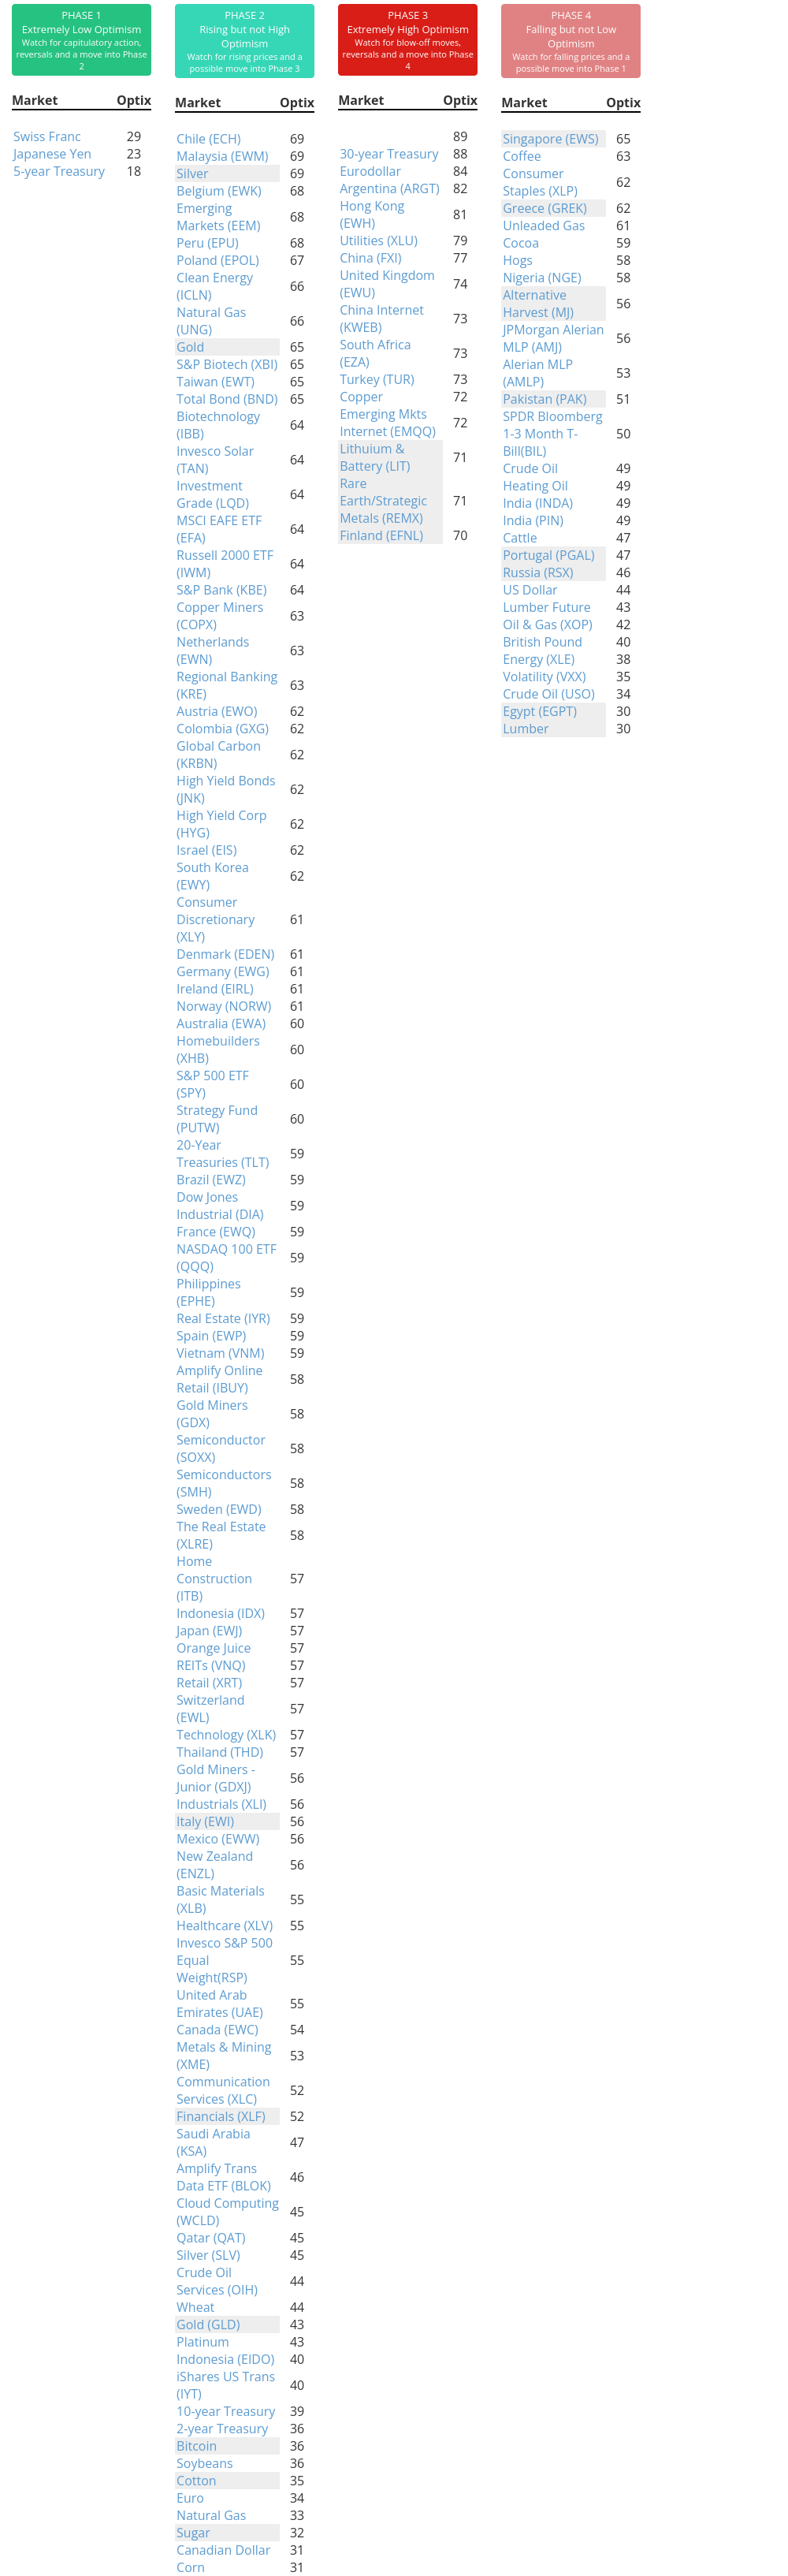
Phase Table
Ranks
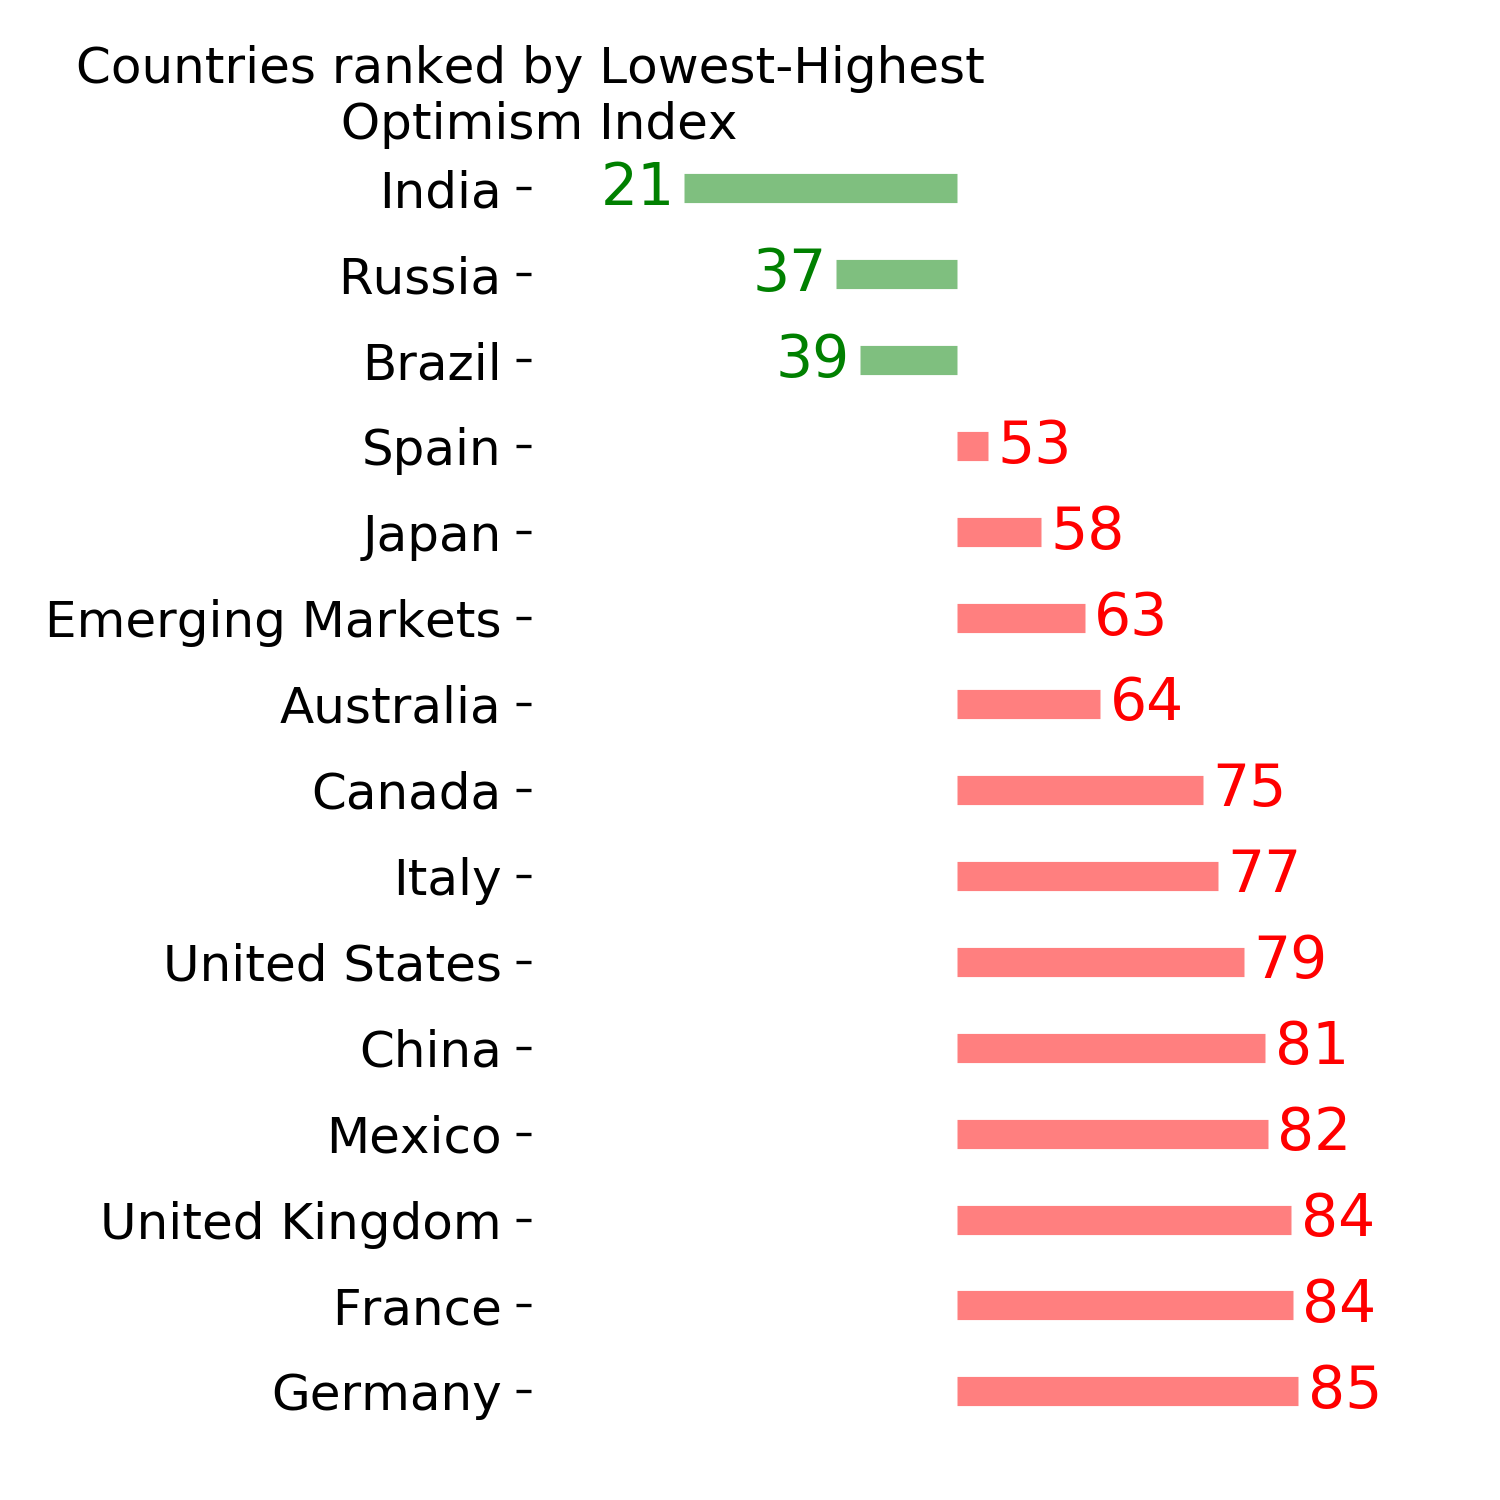
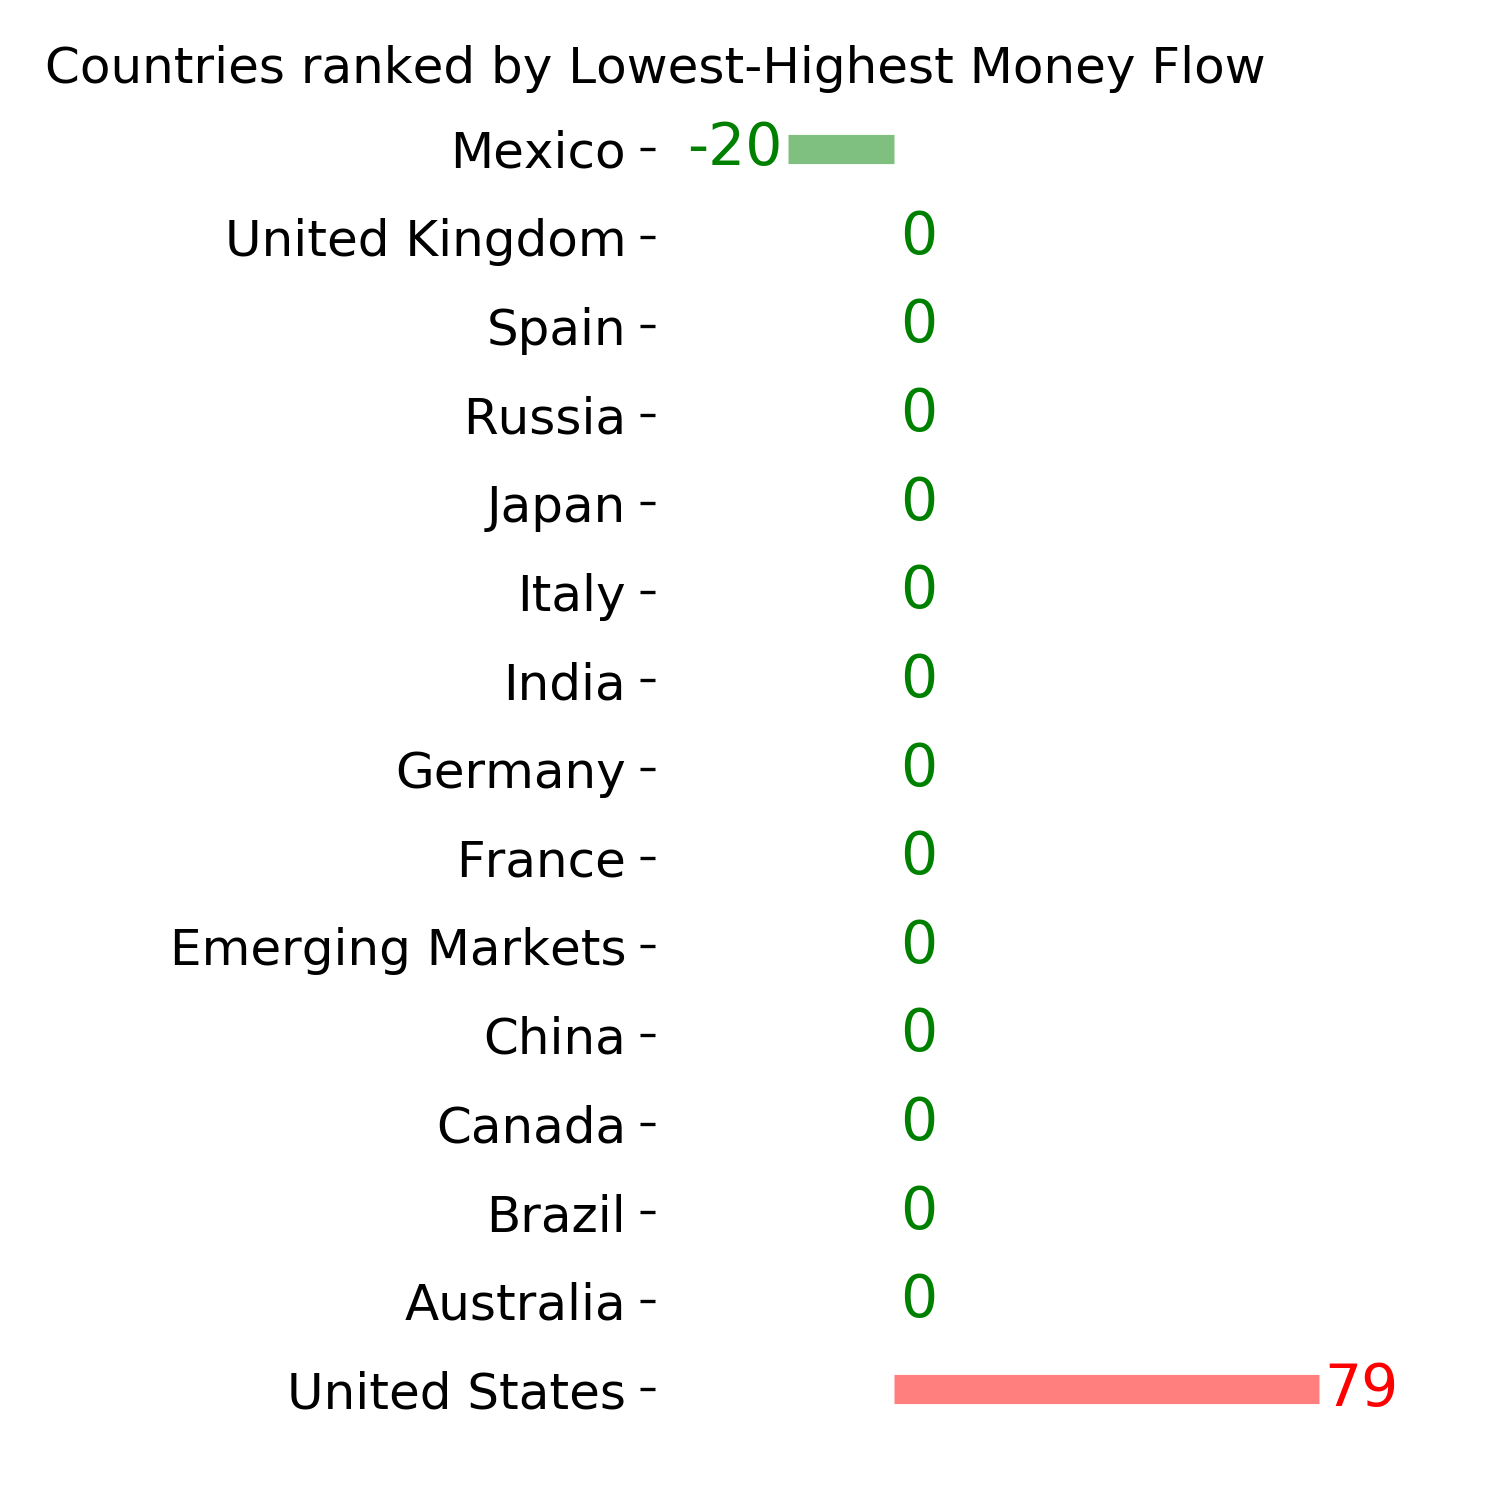
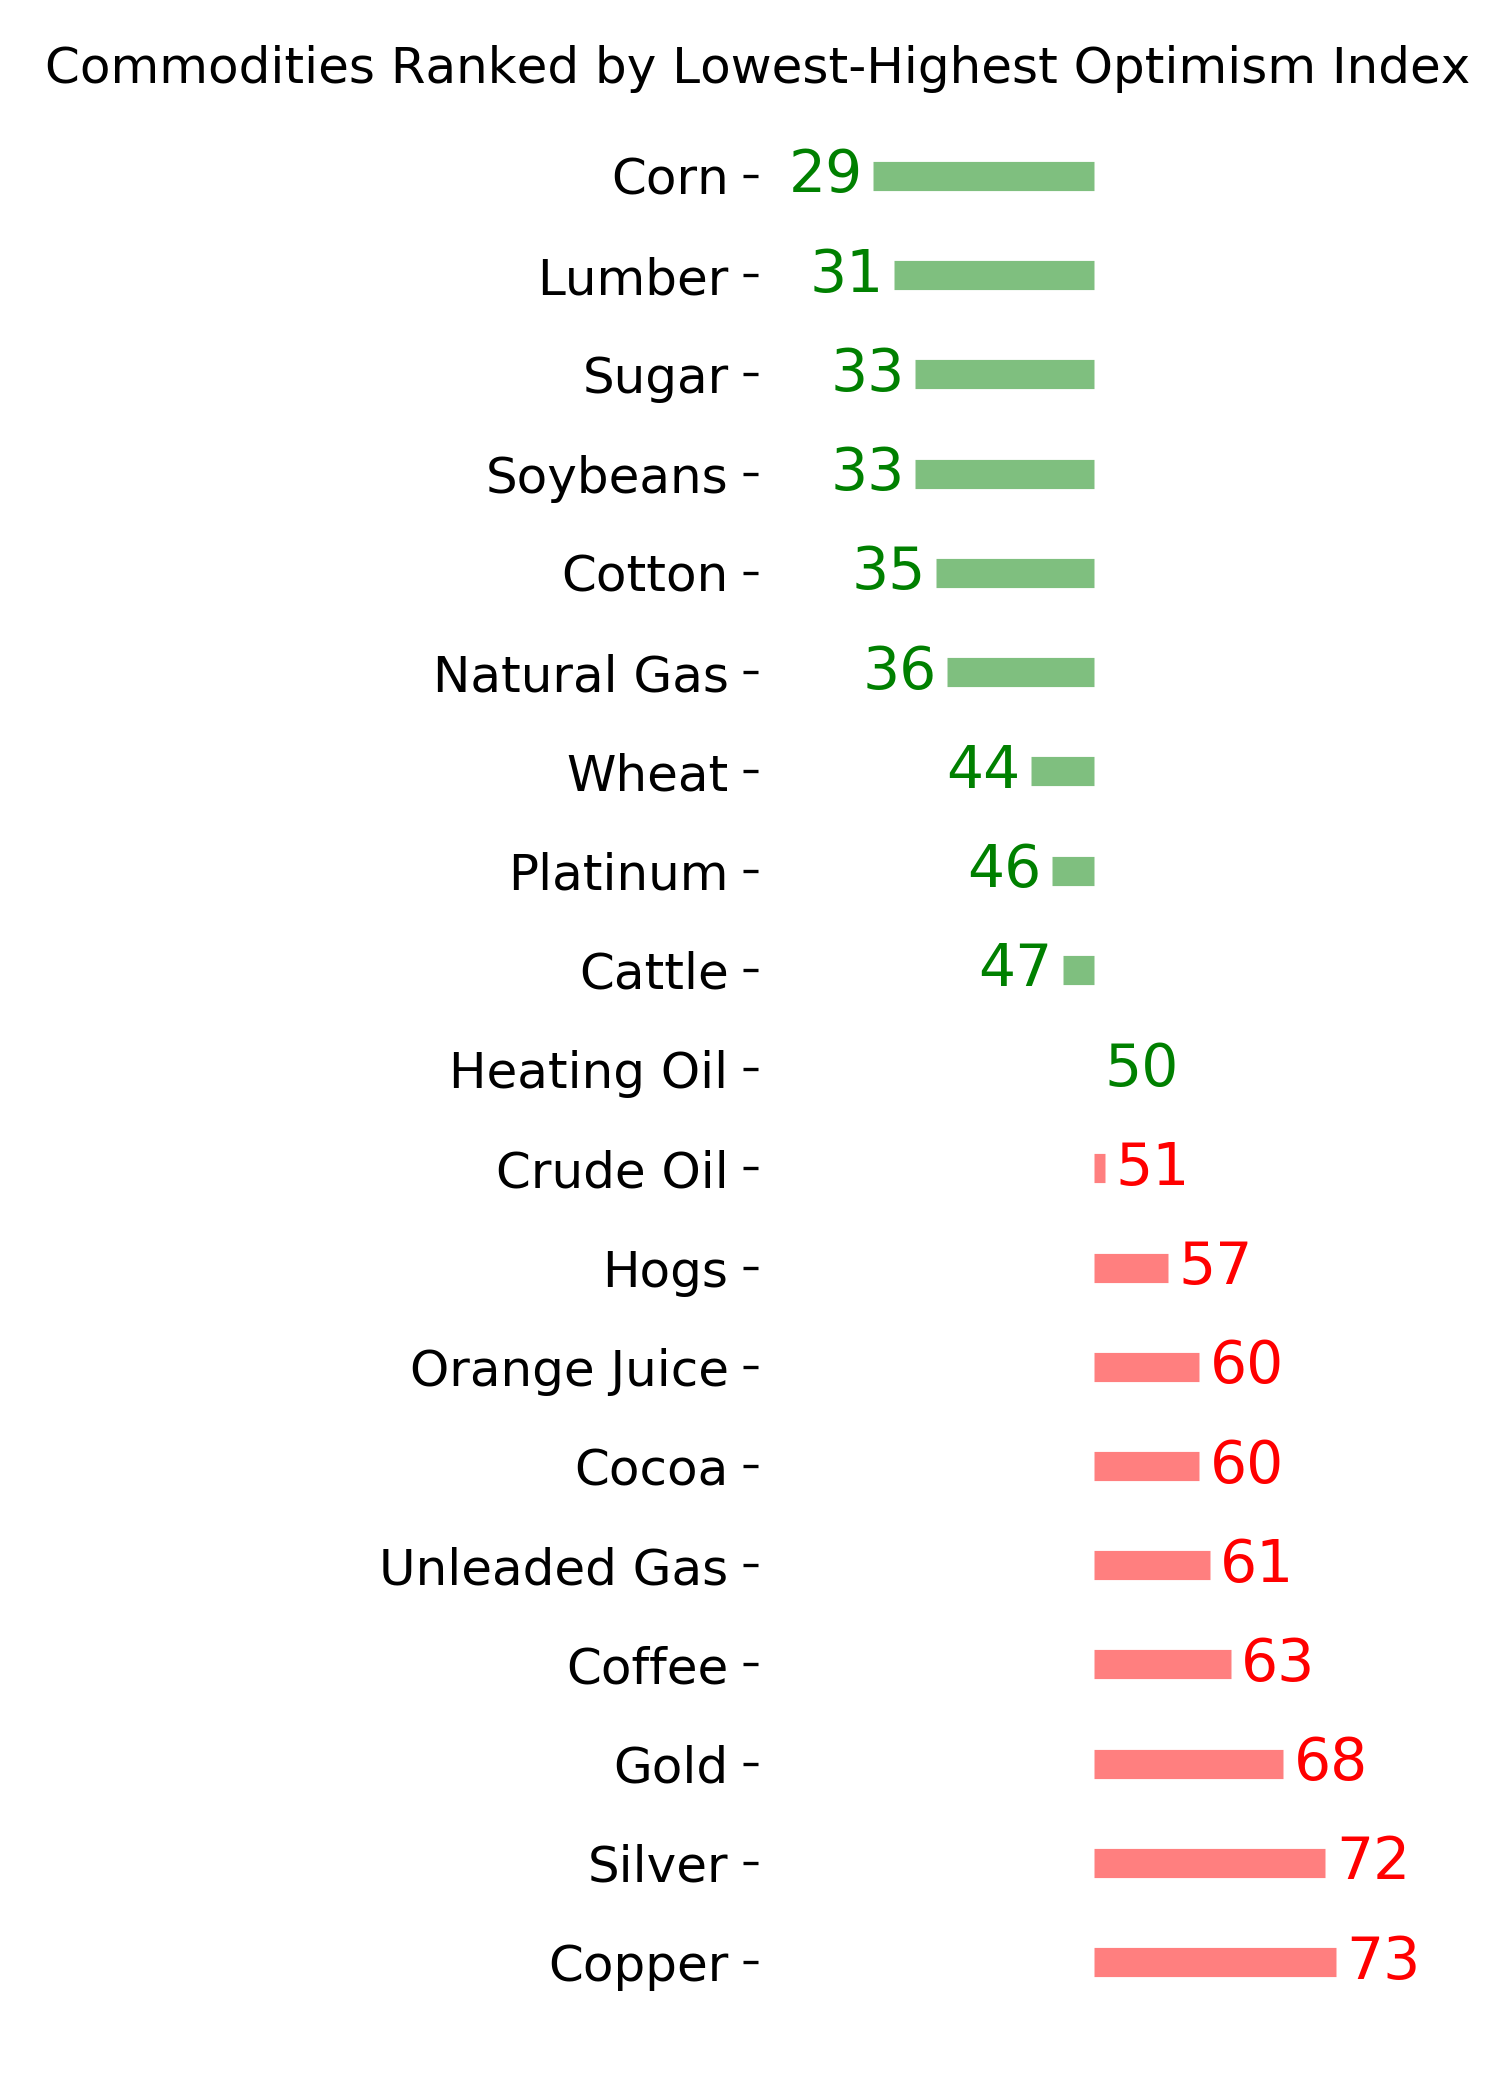
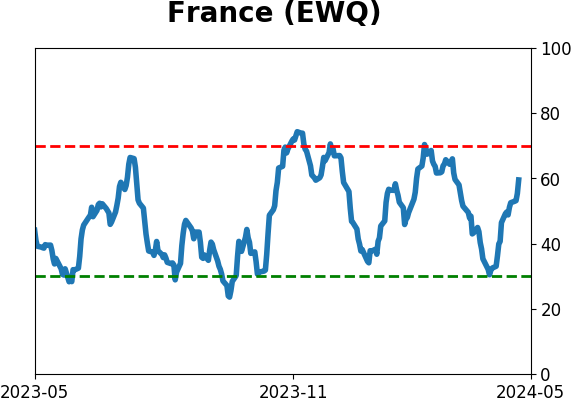
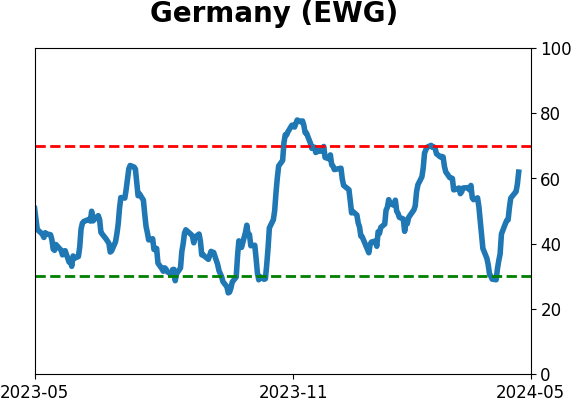
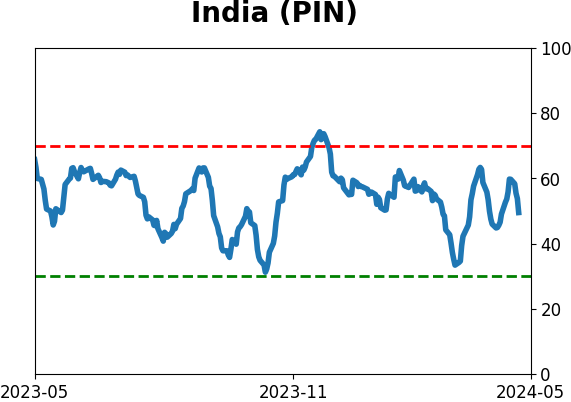
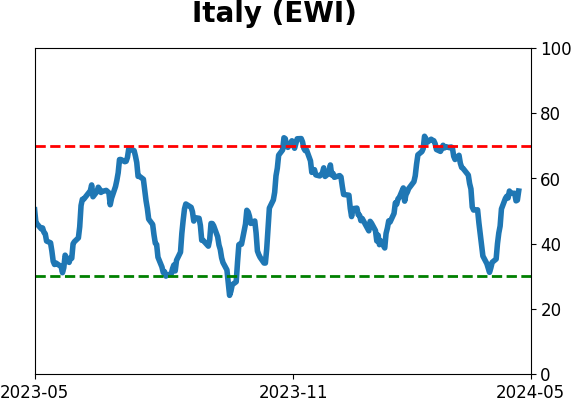
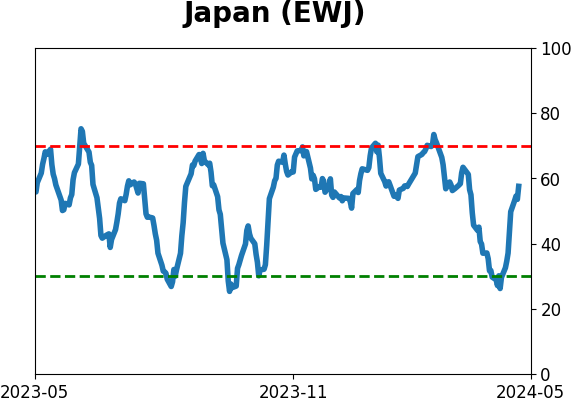
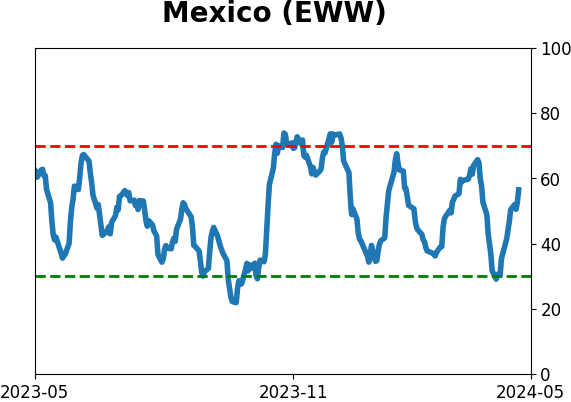
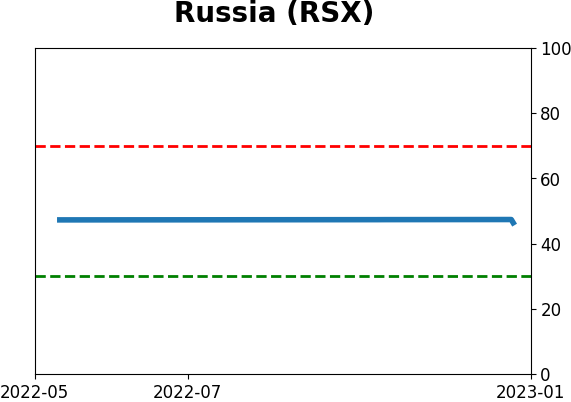
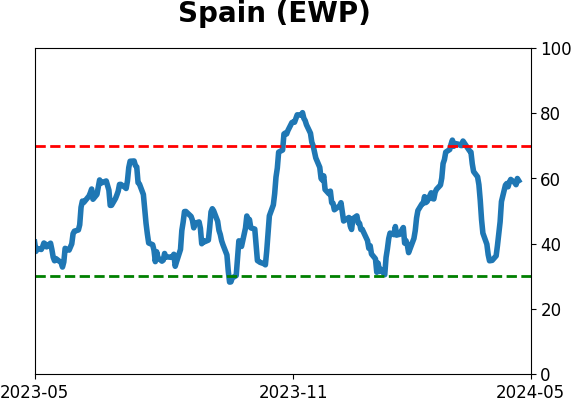
Sentiment Around The World
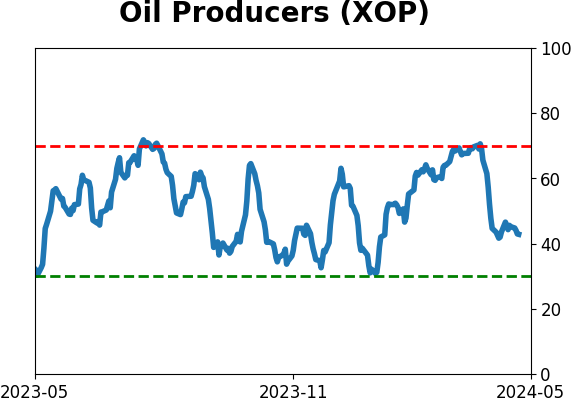
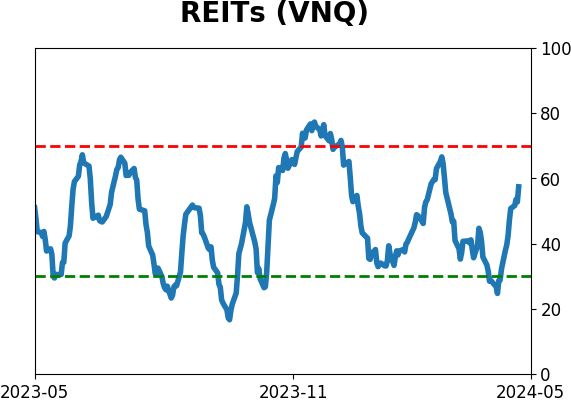
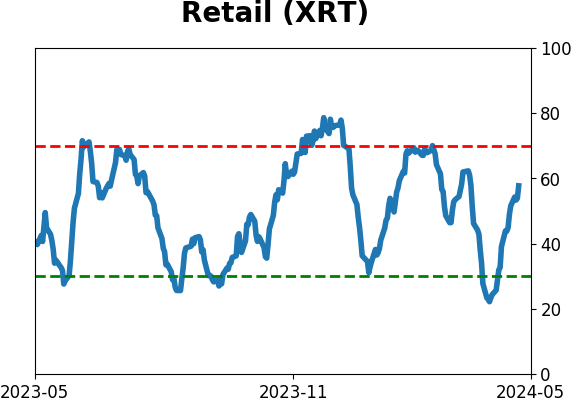
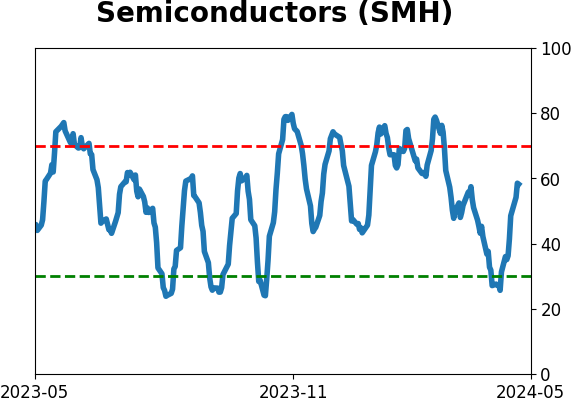
Optimism Index Thumbnails
|
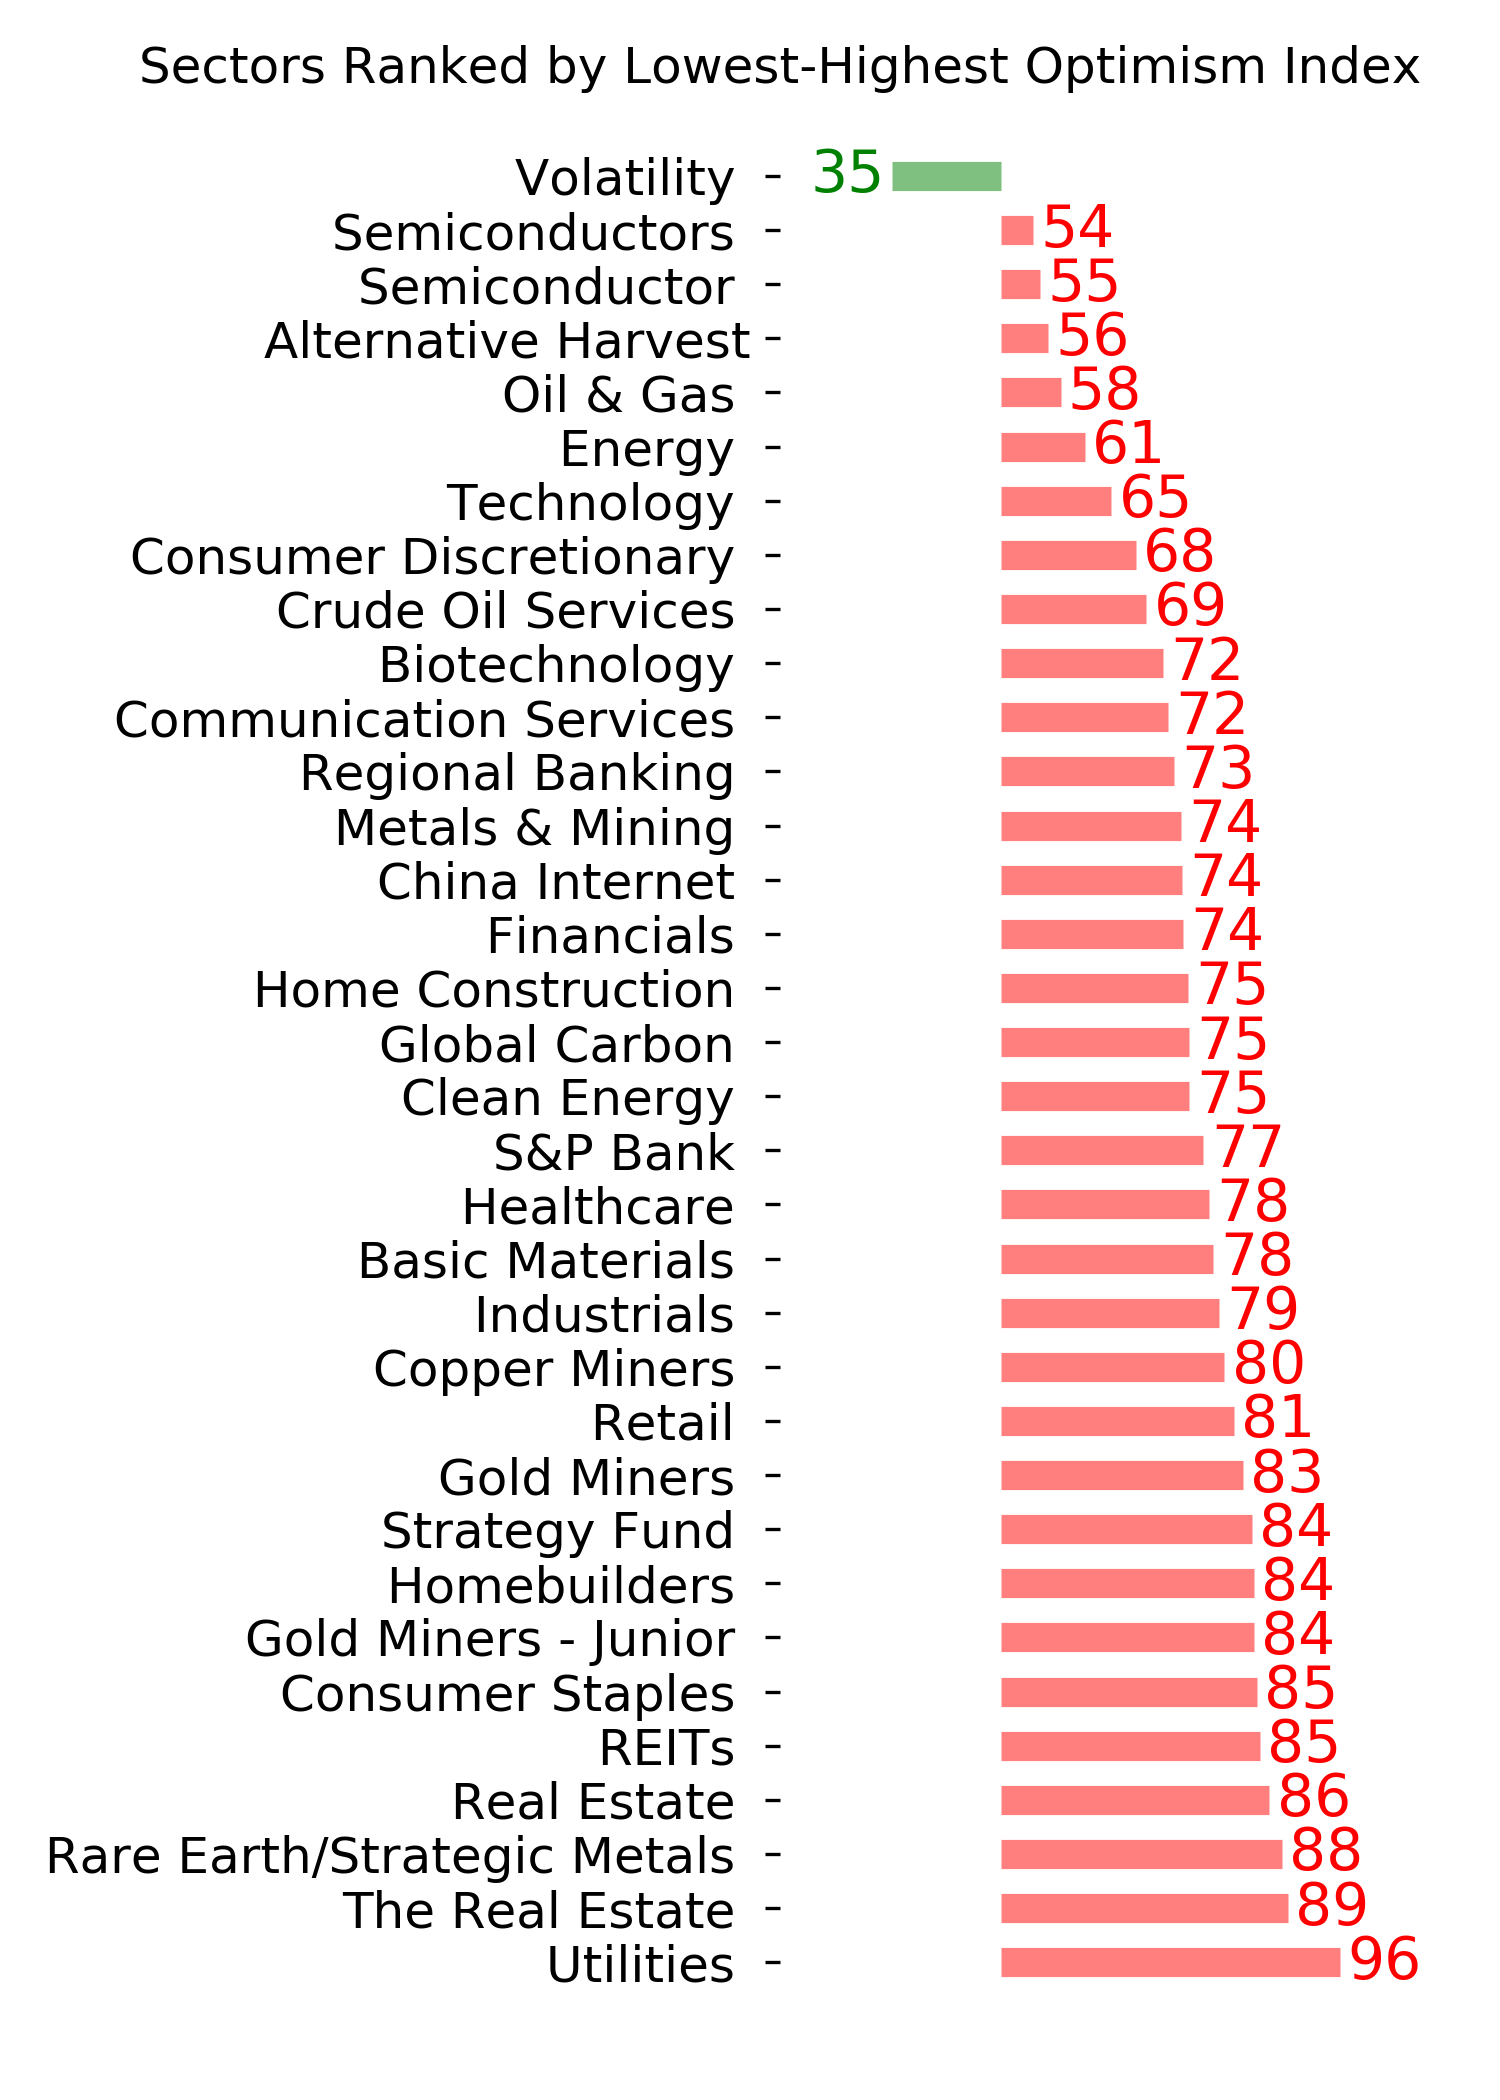
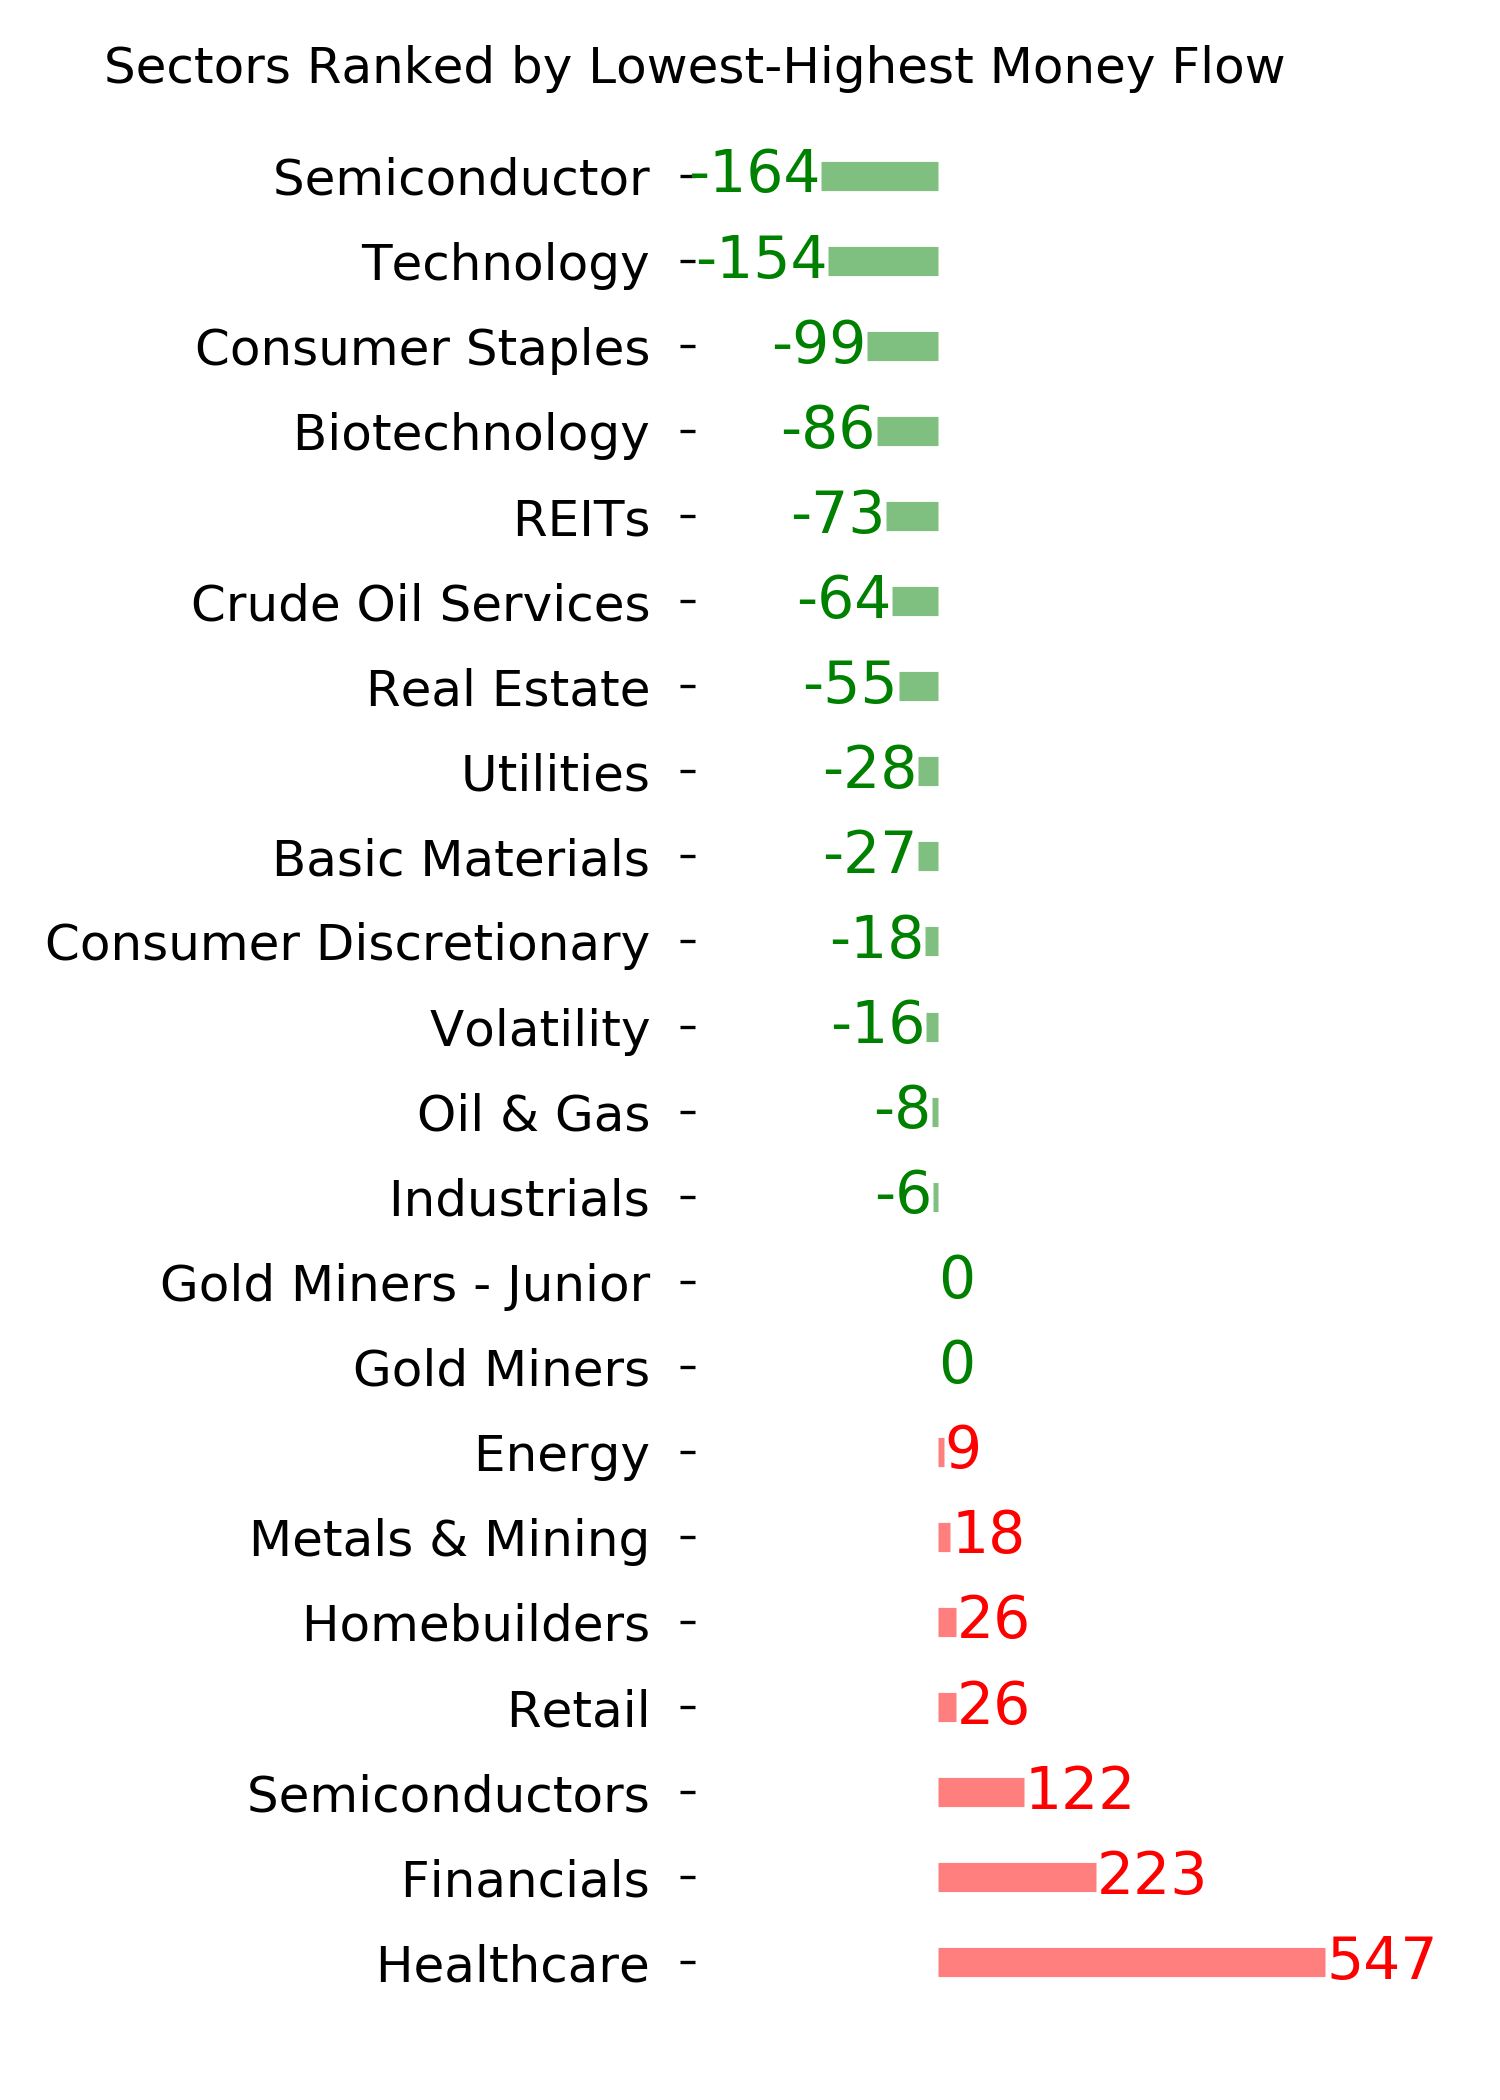
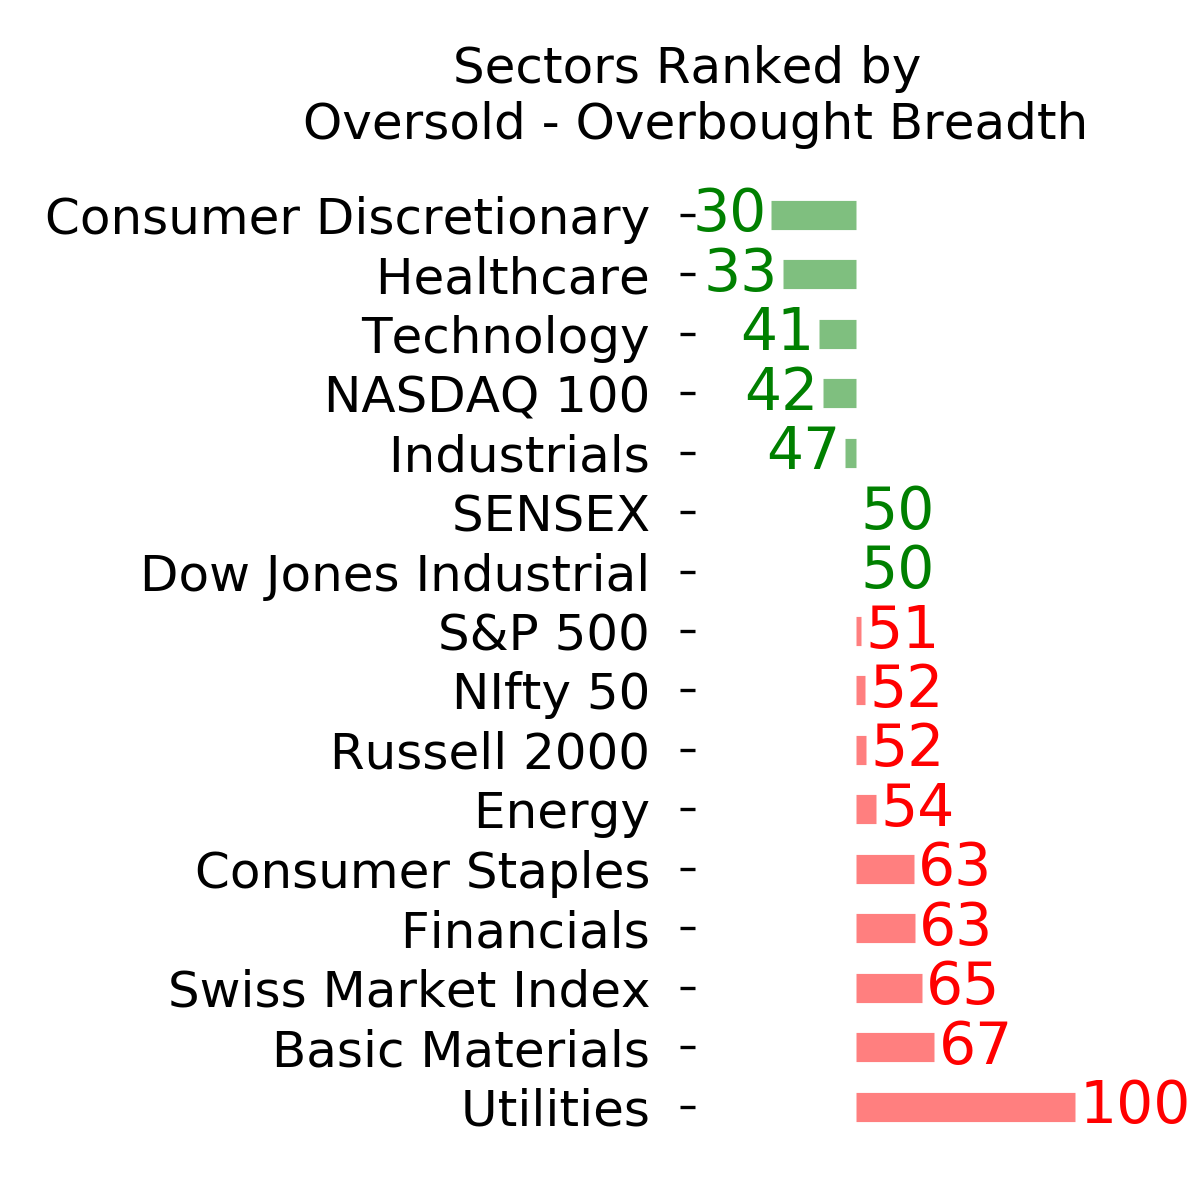
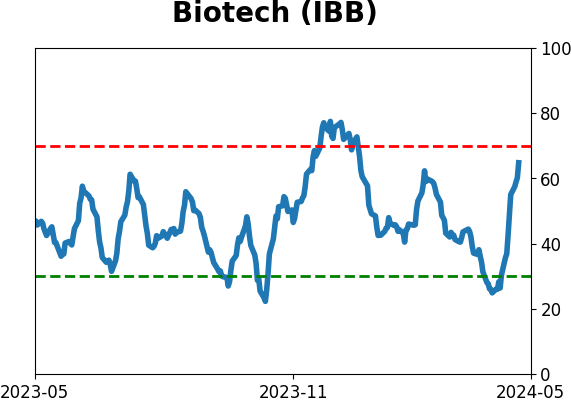
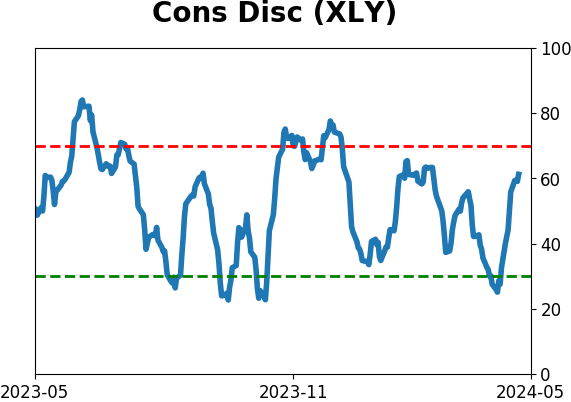
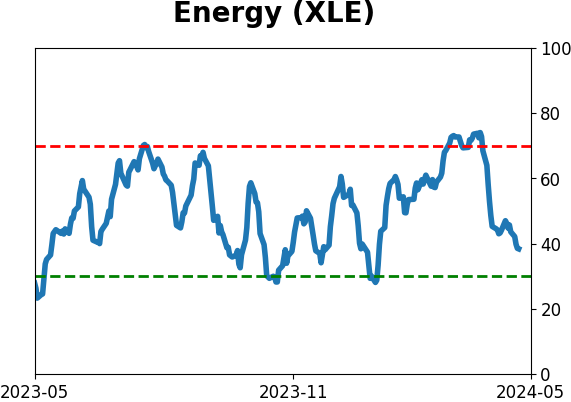
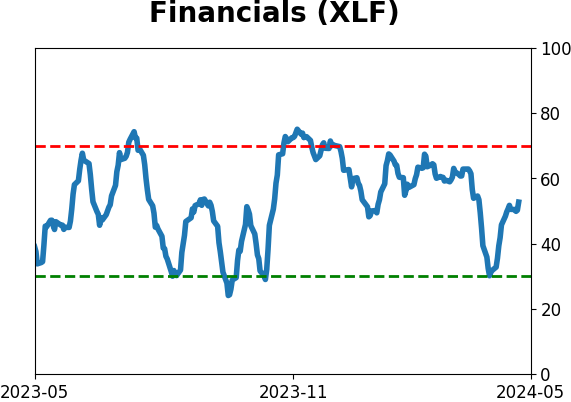
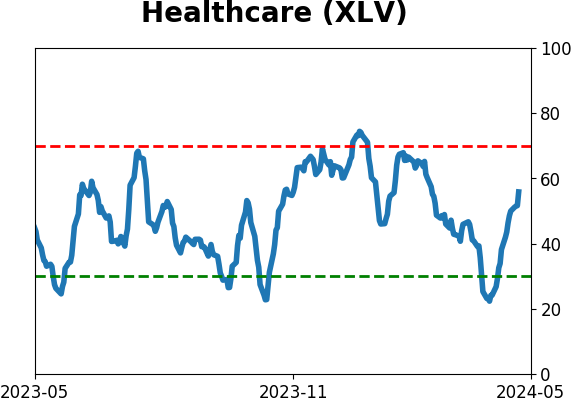
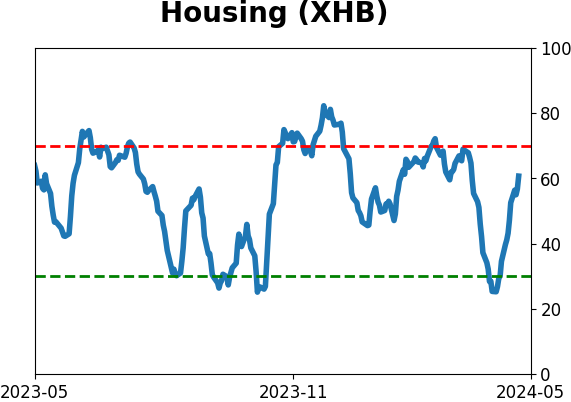
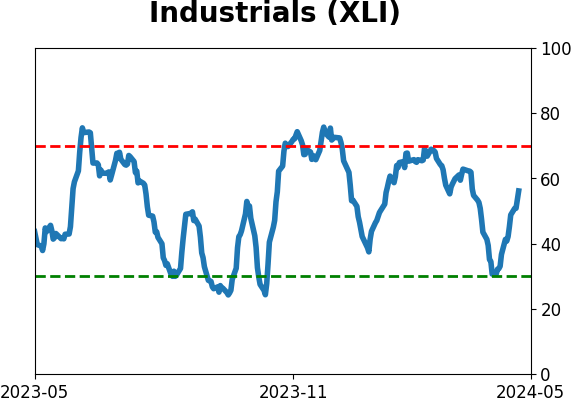
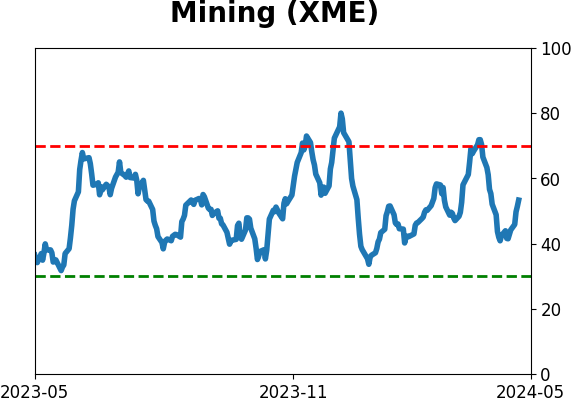
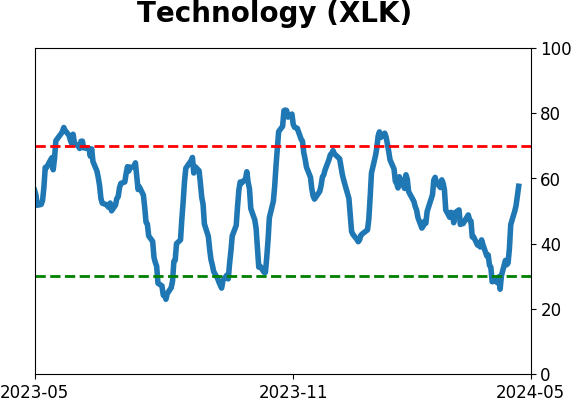
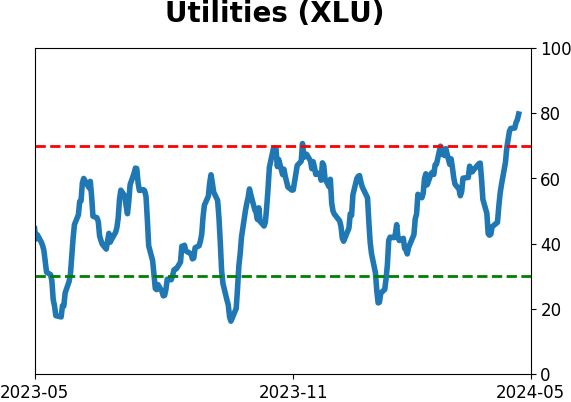
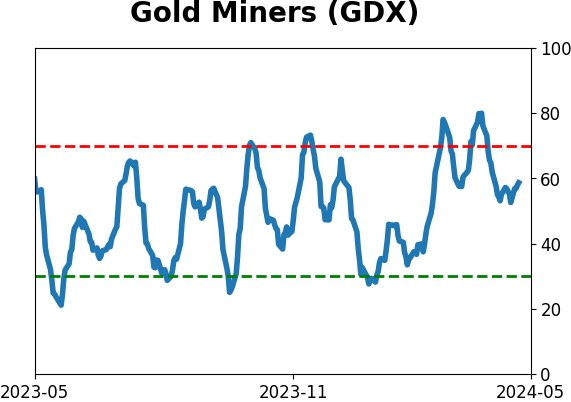
Sector ETF's - 10-Day Moving Average
|
|
|
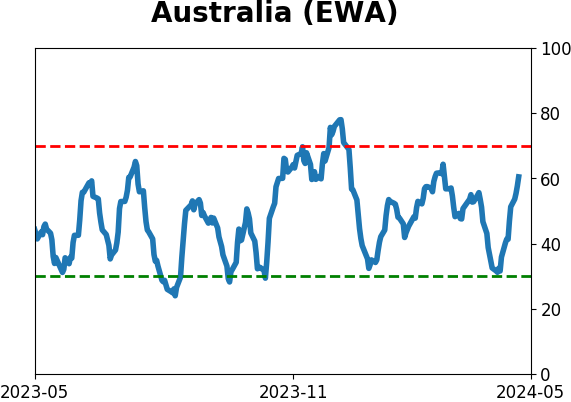
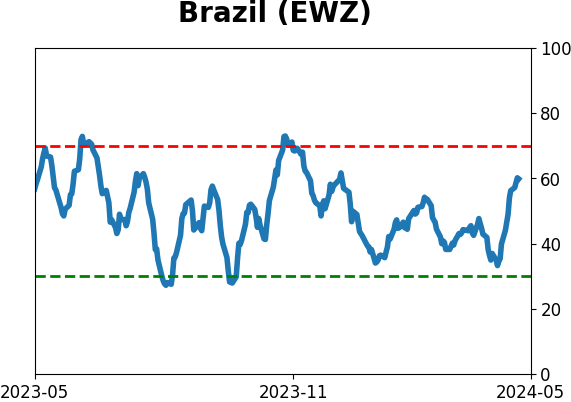
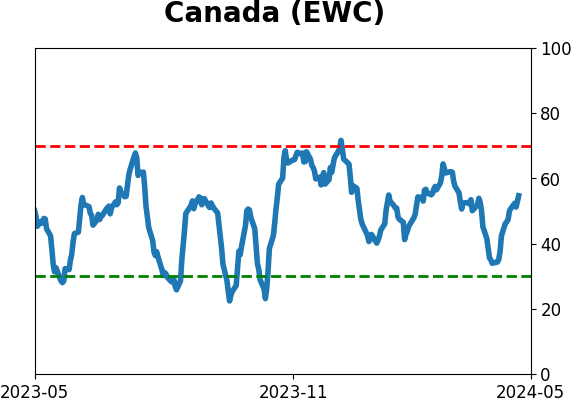
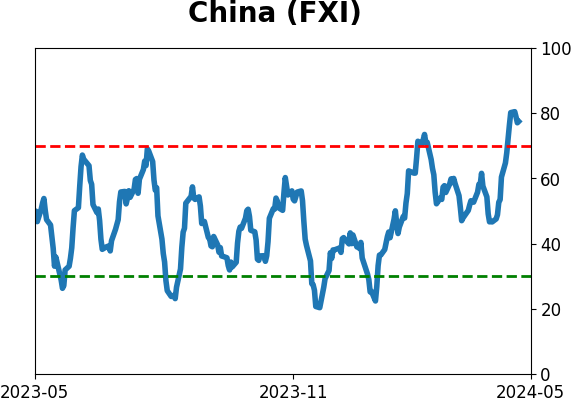
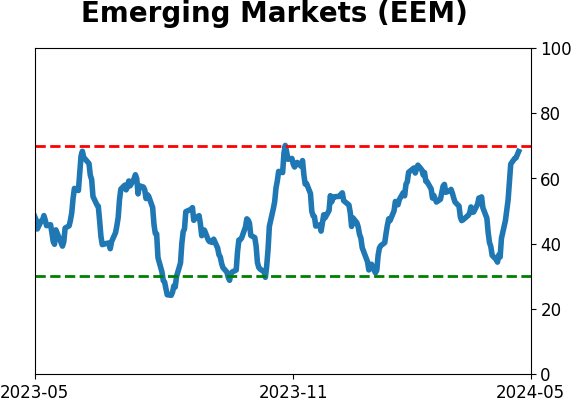
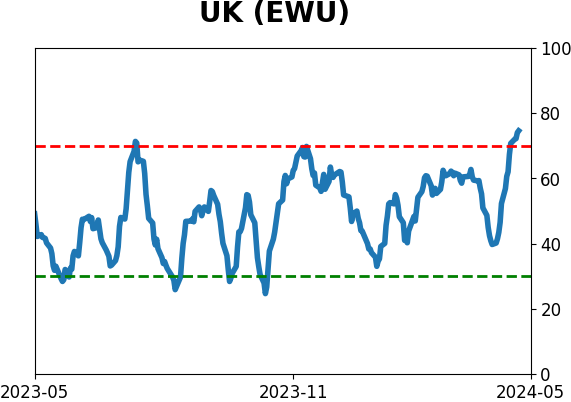
Country ETF's - 10-Day Moving Average
|
|
|
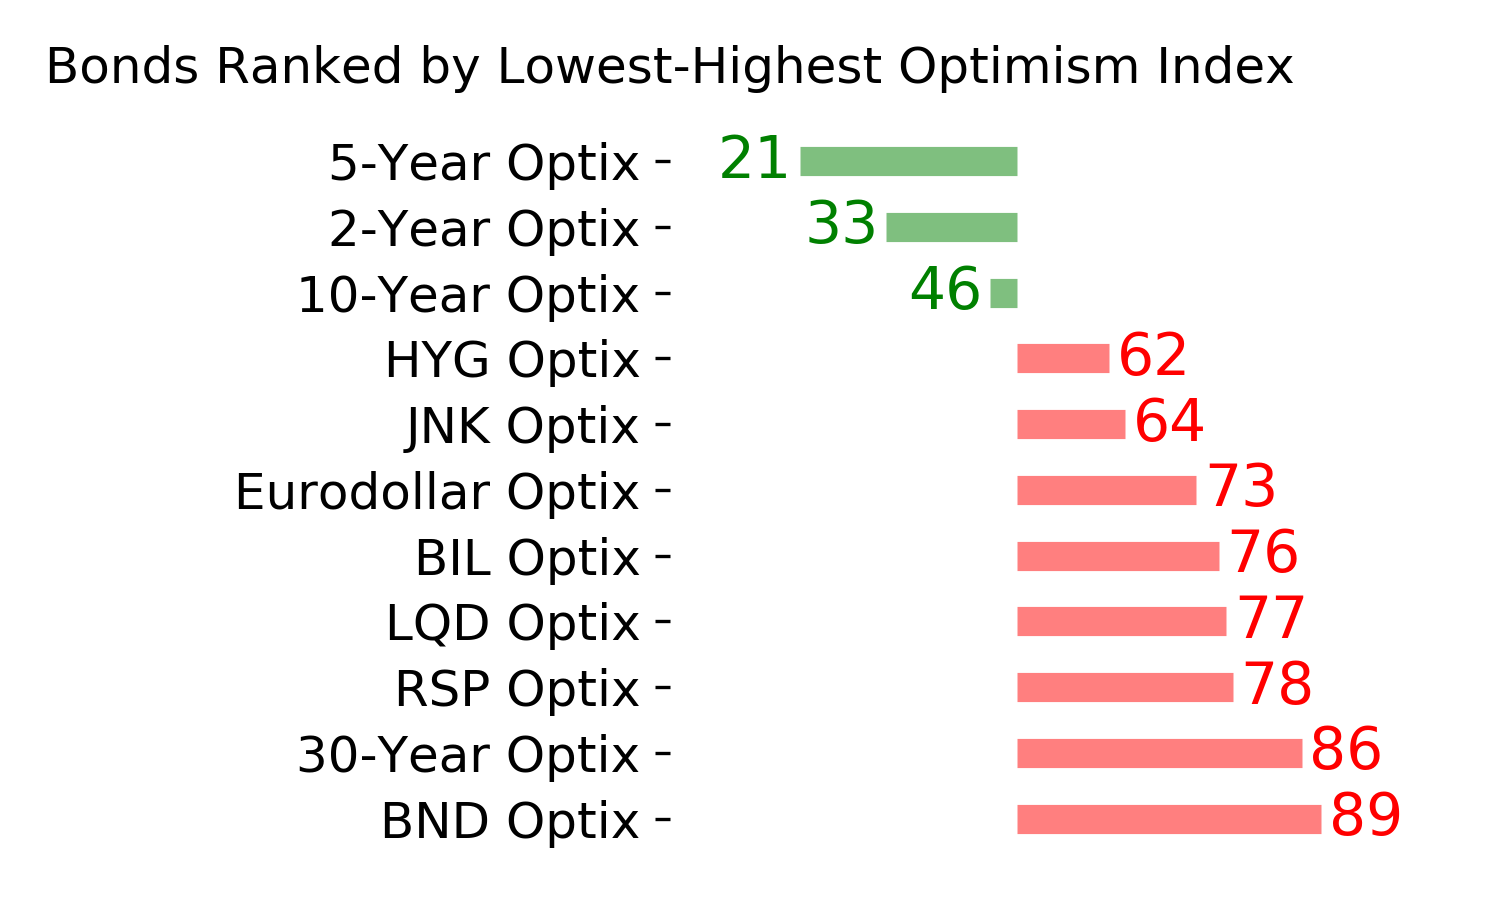
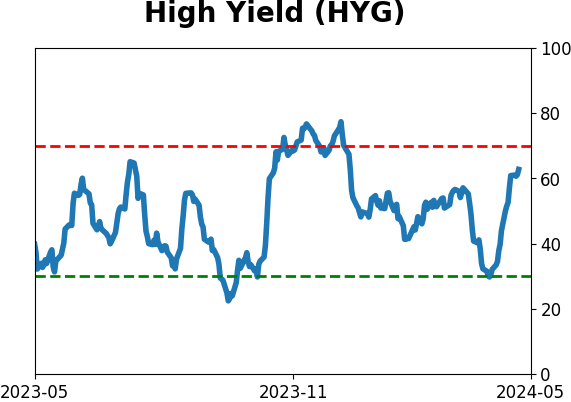
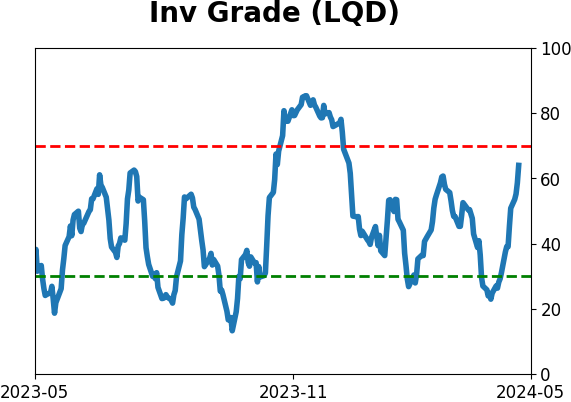
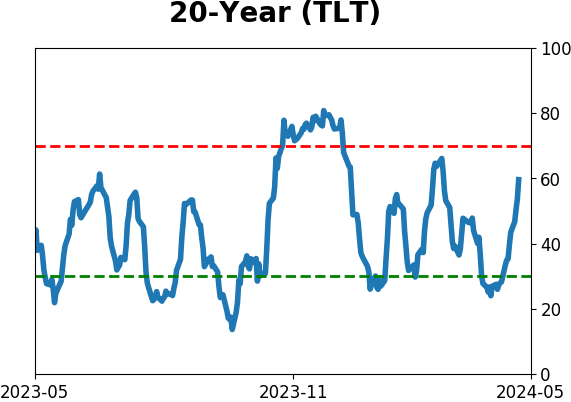
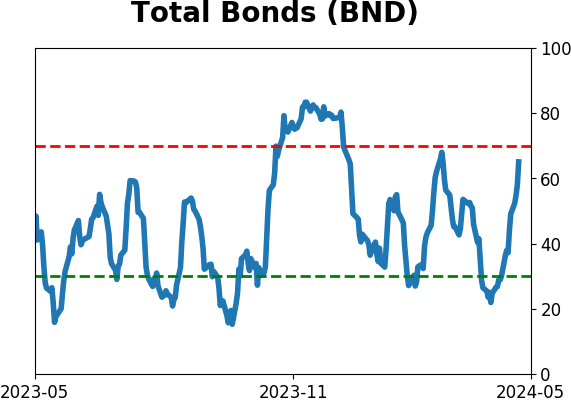
Bond ETF's - 10-Day Moving Average
|
|
|
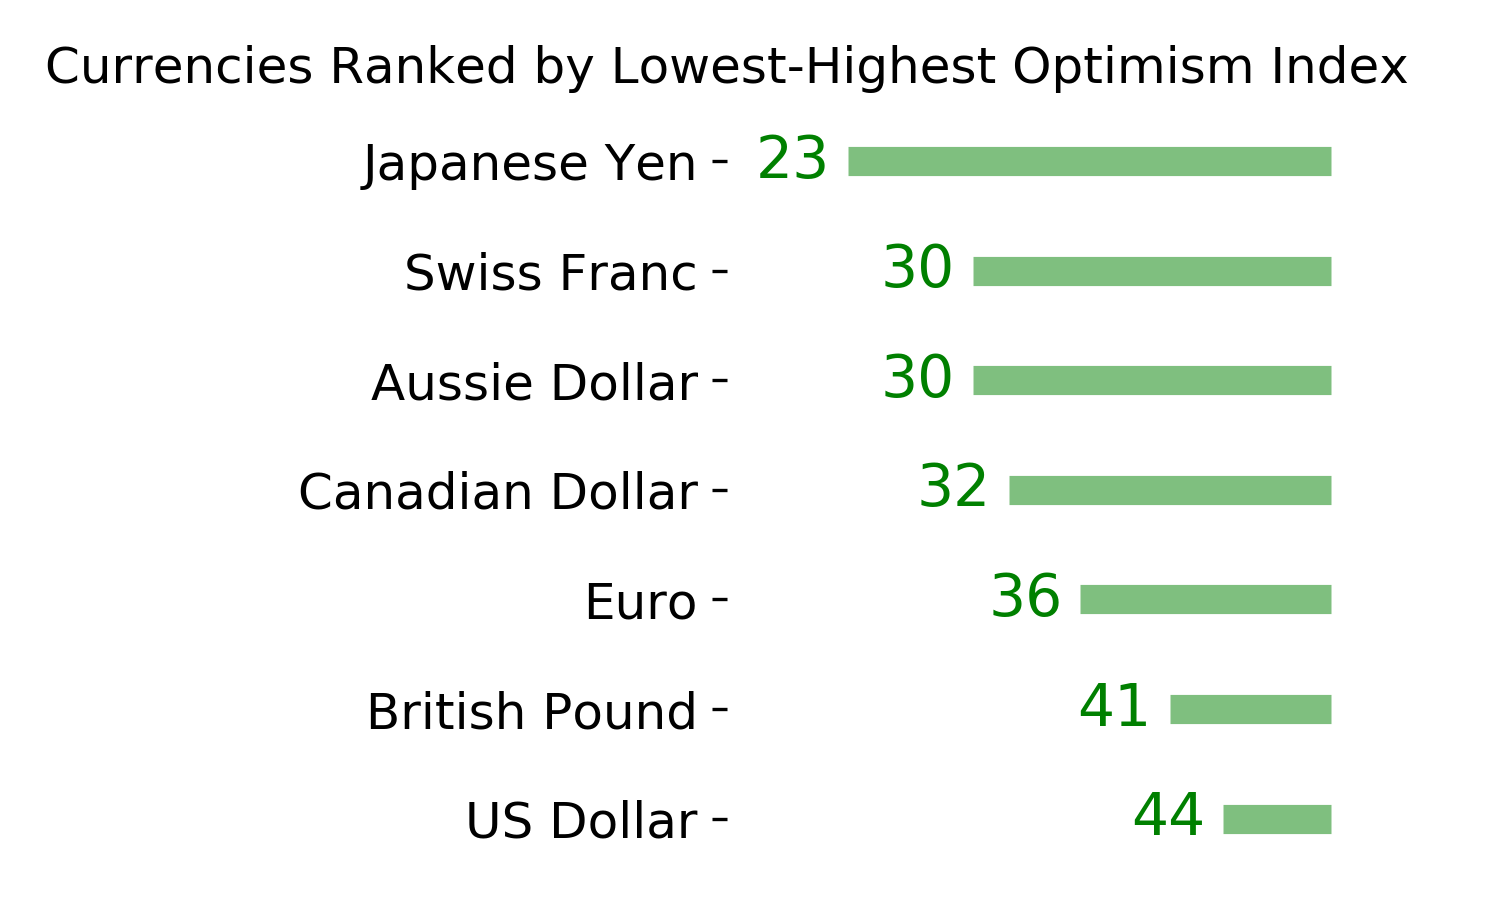
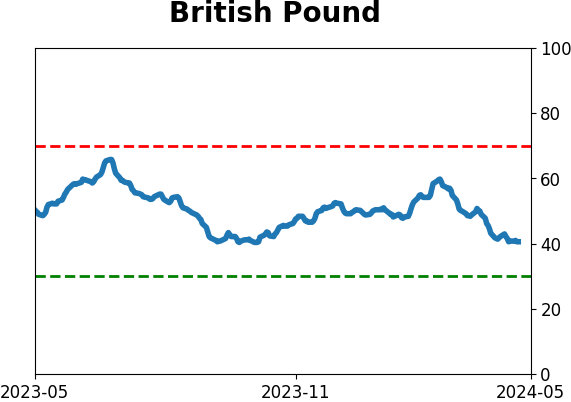
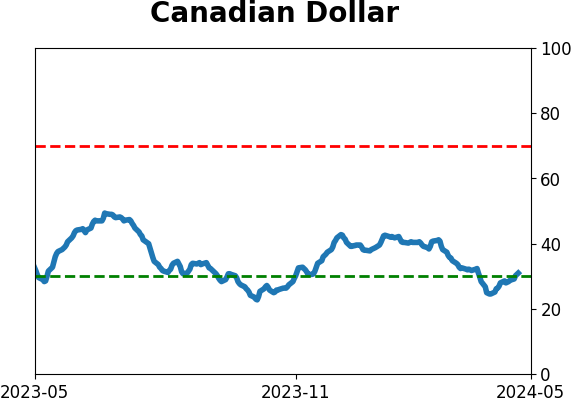
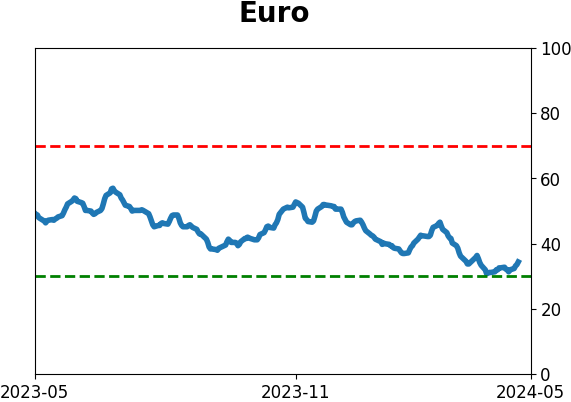
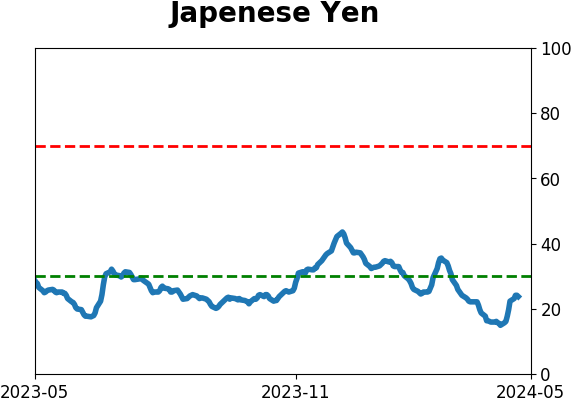
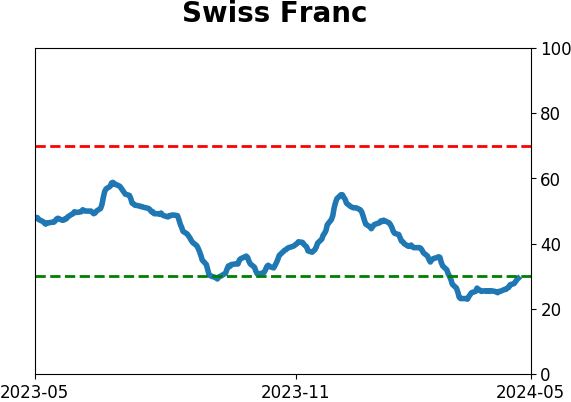
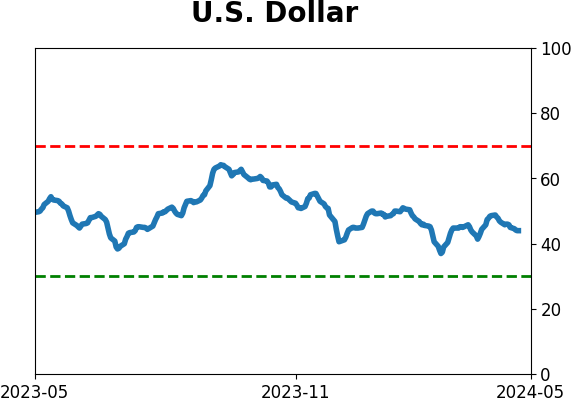
Currency ETF's - 5-Day Moving Average
|
|
|
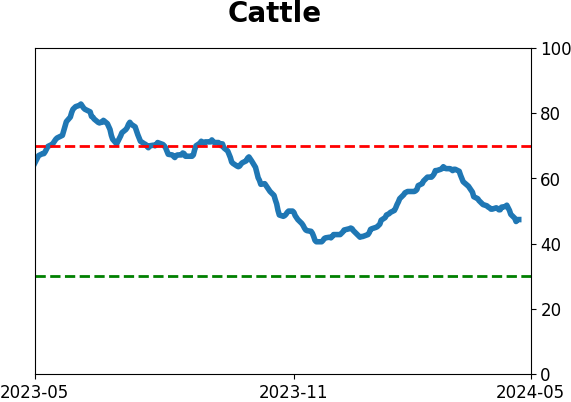
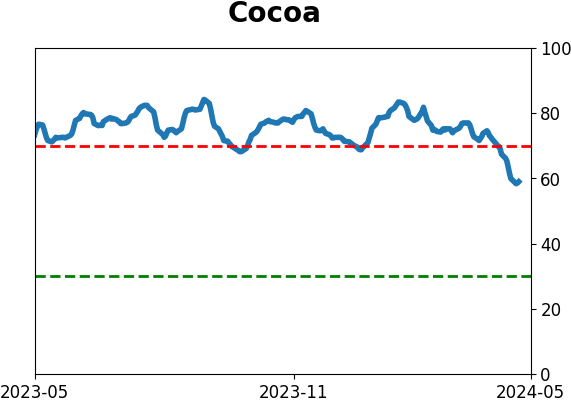
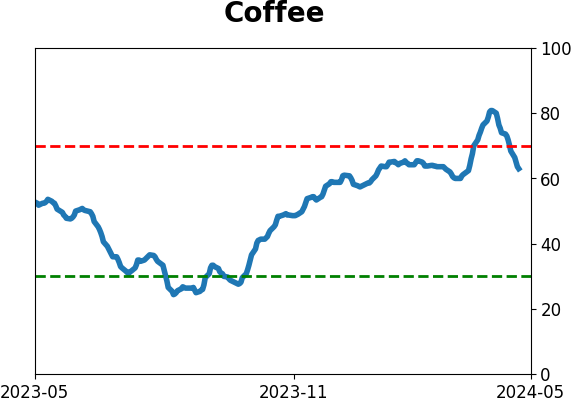
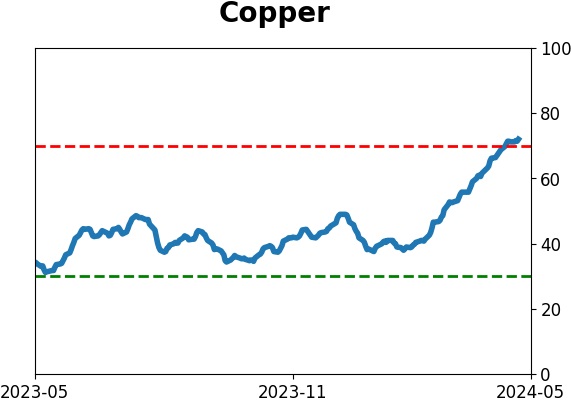
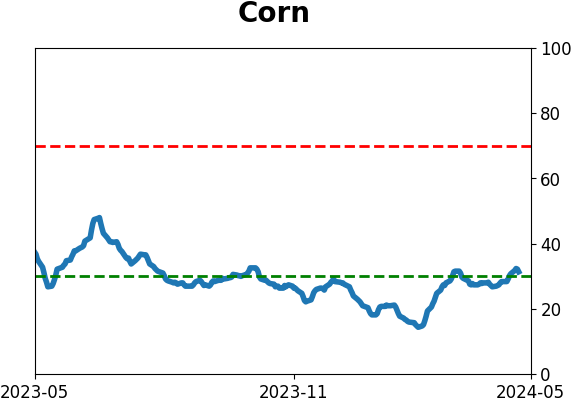
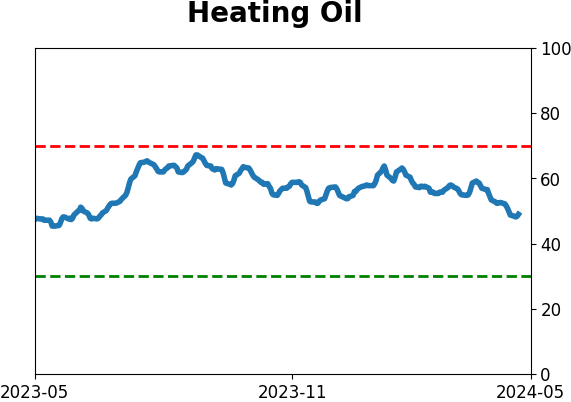
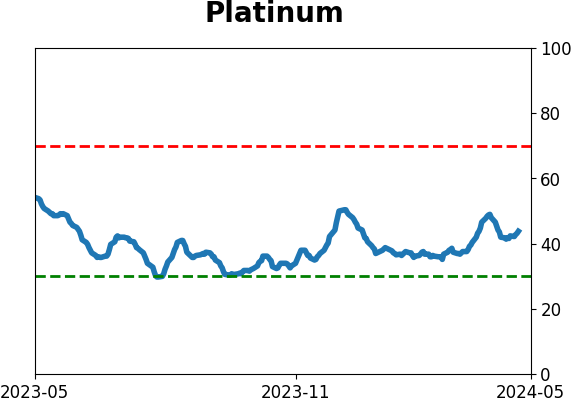
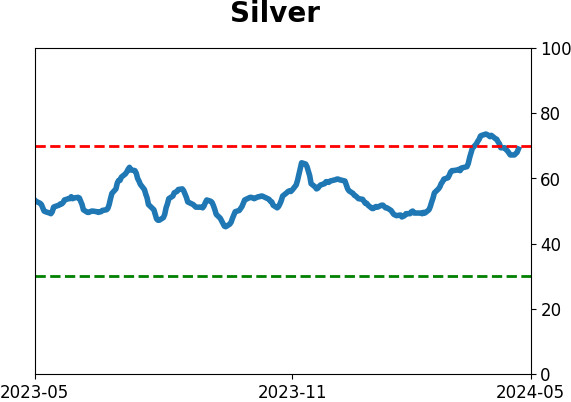
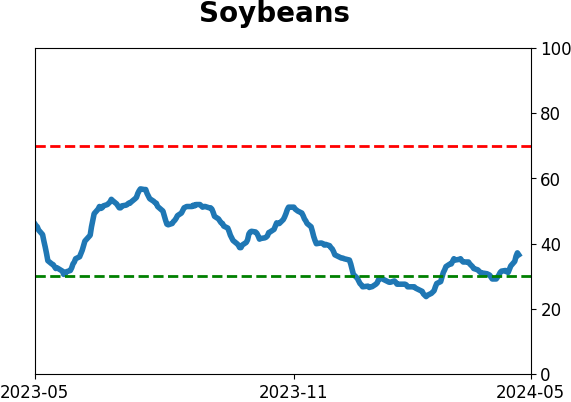
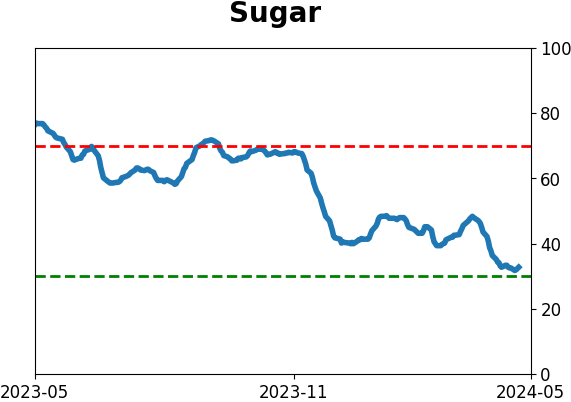
Commodity ETF's - 5-Day Moving Average
|
|