Headlines
|
|
The S&P 500's valuation has dropped by a third:
The S&P 500's Price/Earnings Ratio has declined more than 35% from its recent peak. That ranks among the largest drawdowns in valuation since the 1950s, and its forward returns tend to be good following such a large reset.
Big tech meltdown:
The Nasdaq 100 index of big tech stocks is facing a very large negative gap down open as traders continue to have a "sell first" mentality.
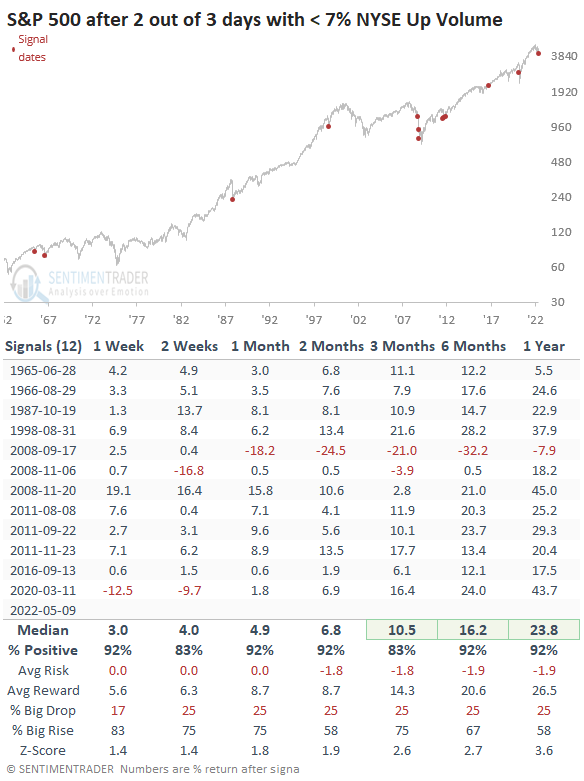
So bad it's good?: About the only positive from today's session is that the selling pressure has been so compressed, it could be a medium- to long-term positive. This was the 2nd session out of the past 3 with at least 93% of NYSE volume flowing into stocks that declined on the day. Over the past 60 years, this has been a rare sign of severe - and potentially exhaustive - selling. The only instance that didn't see a rebound was September 2008, during the height of the meltdown of the financial system.
|
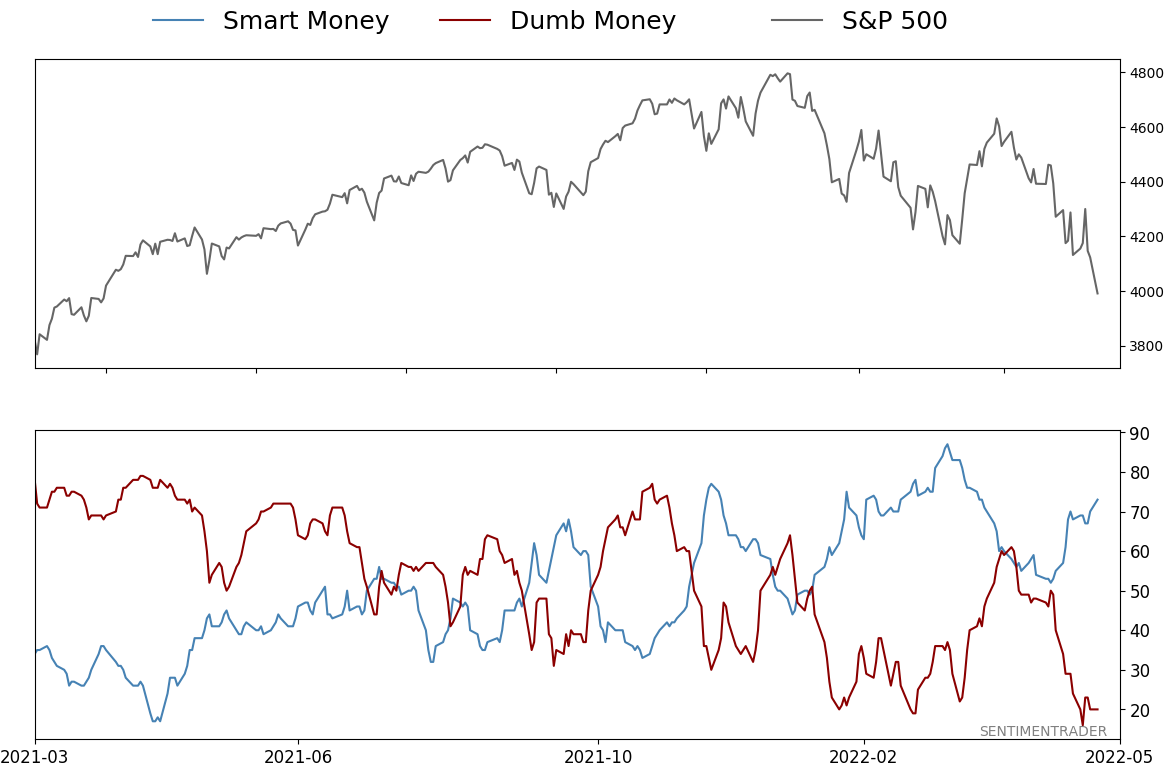
Smart / Dumb Money Confidence
|
Smart Money Confidence: 73%
Dumb Money Confidence: 20%
|
|
Risk Levels
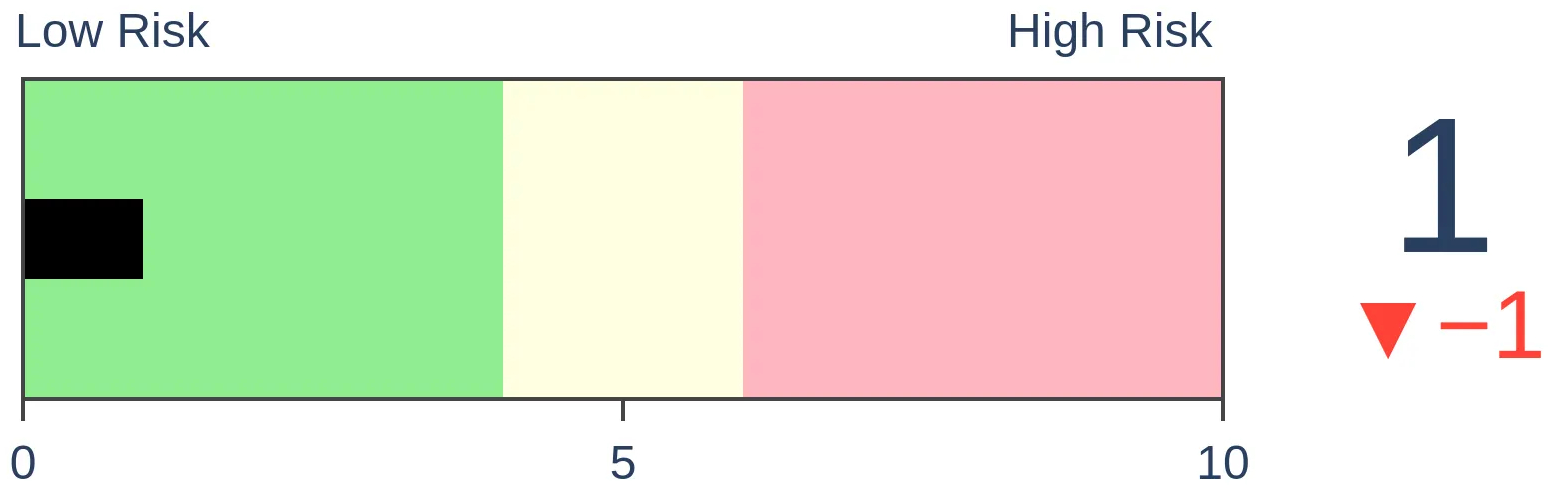
Stocks Short-Term
|
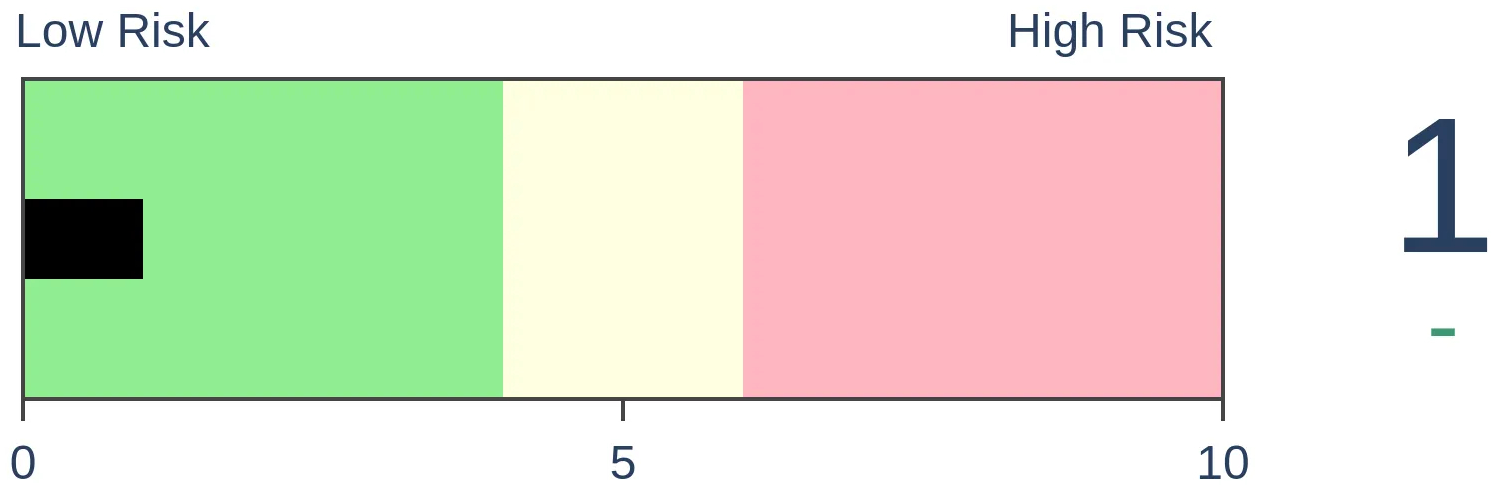
Stocks Medium-Term
|
|
Bonds
|
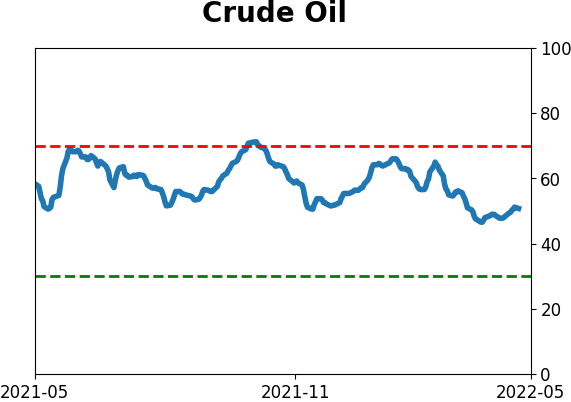
Crude Oil

|
|
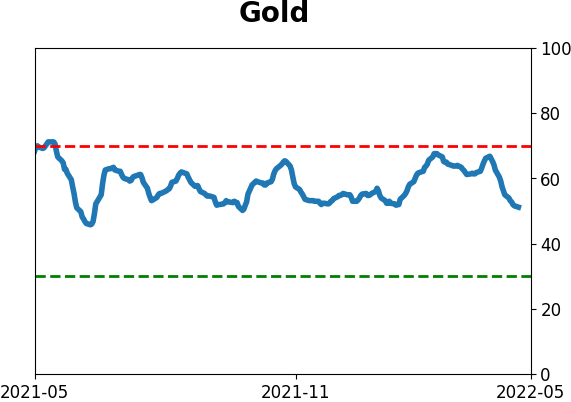
Gold
|
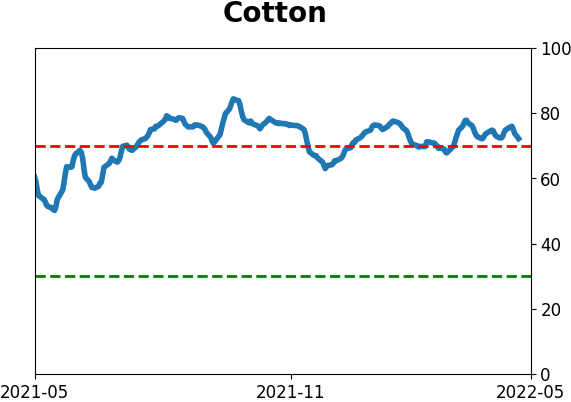
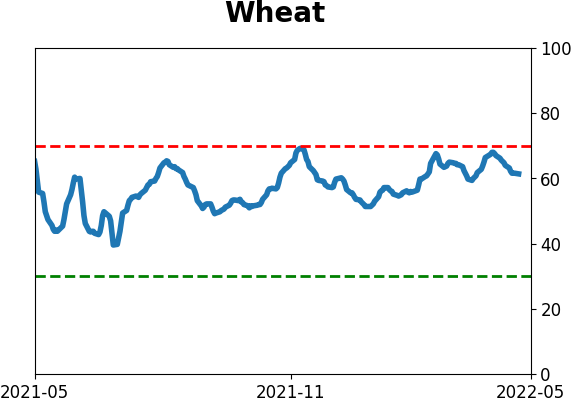
Agriculture
|
|
Research
By Jason Goepfert
BOTTOM LINE
The S&P 500's Price/Earnings Ratio has declined more than 35% from its recent peak. That ranks among the largest drawdowns in valuation since the 1950s, and its forward returns tend to be good following such a large reset.
FORECAST / TIMEFRAME
None
|
Key points:
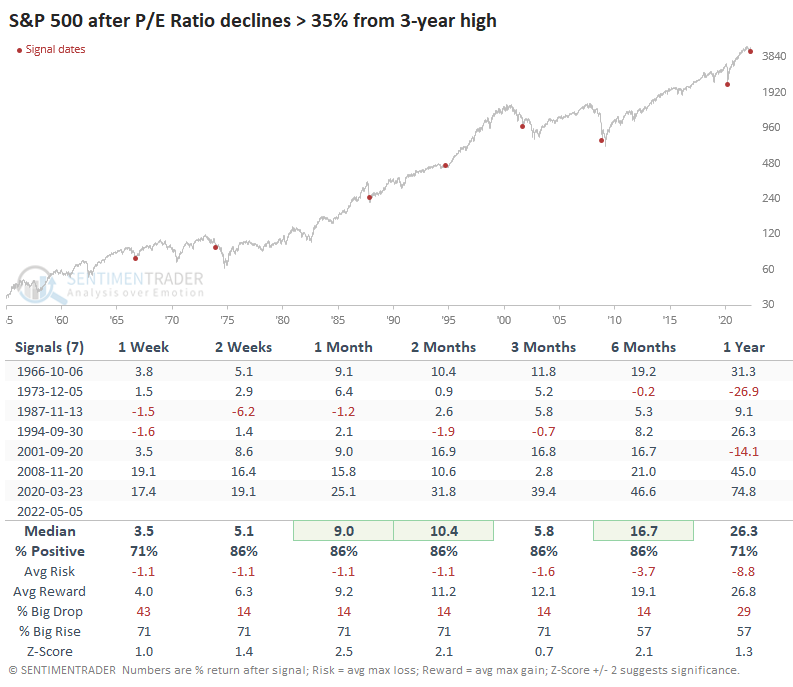
- The S&P 500's trailing Price/Earnings Ratio has declined 35% from its 3-year high
- That ranks among the largest drawdowns in valuation in 70 years
- Forward returns from similarly sharp valuation contractions tended to be good over the next several months
Valuation has dropped by a third
Stock prices have taken a tumble, but as-reported earnings haven't. Prices usually lead earnings, so it's possible (probable, even) that earnings will start to decline.
But they haven't yet, so the combination of falling prices and steady or even rising earnings has caused the S&P 500's Price/Earnings Ratio to plunge. As it craters below 20, the P/E Ratio is nearing its average of 17 from the past 70 years.
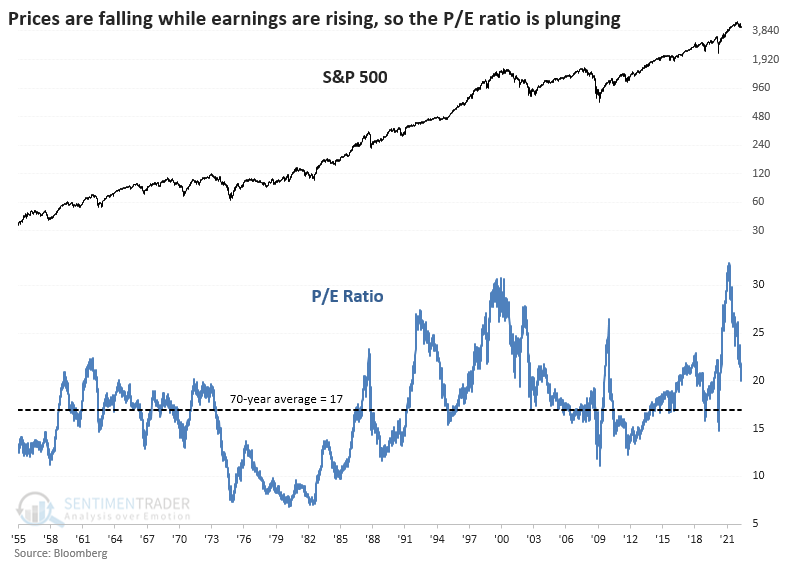
While the S&P has pulled back less than 15% from its one-year high, its valuation metric has plunged more than twice as much, more than 35%. The largest drawdown in valuation from a three-year high was 63% in 1974 followed by a couple of 50% resets after the 1987 market crash and the 2008 financial crisis. The current drawdown ranks in the bottom 15% of all days since the early 1950s.
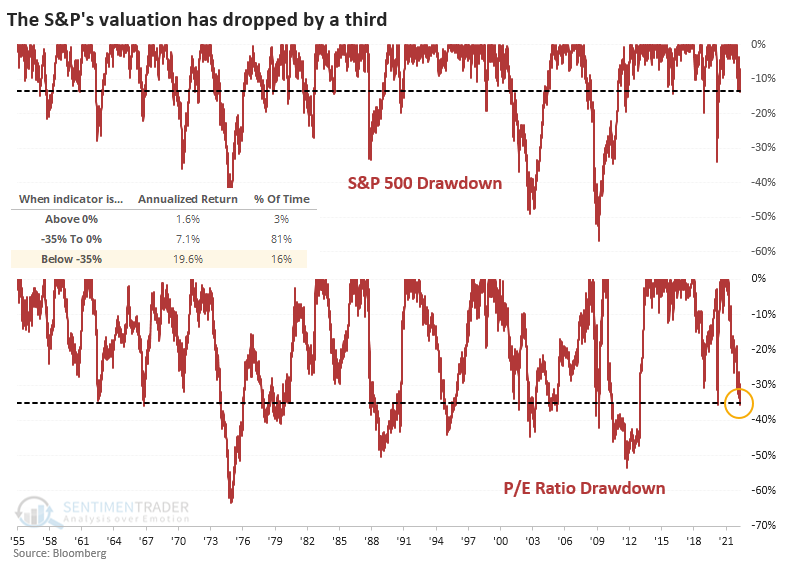
The S&P 500's annualized return when its P/E Ratio was more than 35% off its peak was an impressive +19.6%, thanks to large and persistent rebounds following protracted selloffs.
The table below uses a signal-based approach, looking at the S&P's future returns once its valuation dropped by more than 35% from a multi-year high. Over the medium-term, its performance was very good, with only isolated and small losses. But two of them, in 1974 and 2001, triggered during the halfway mark of protracted bear markets.
So, is the S&P 500 index's price more likely to catch down to its valuation, or is its valuation more likely to catch up to its price? Divergences are always tricky, but the table below shows every time the index was in less than a 15% drawdown while its valuation drawdown was at least twice that.
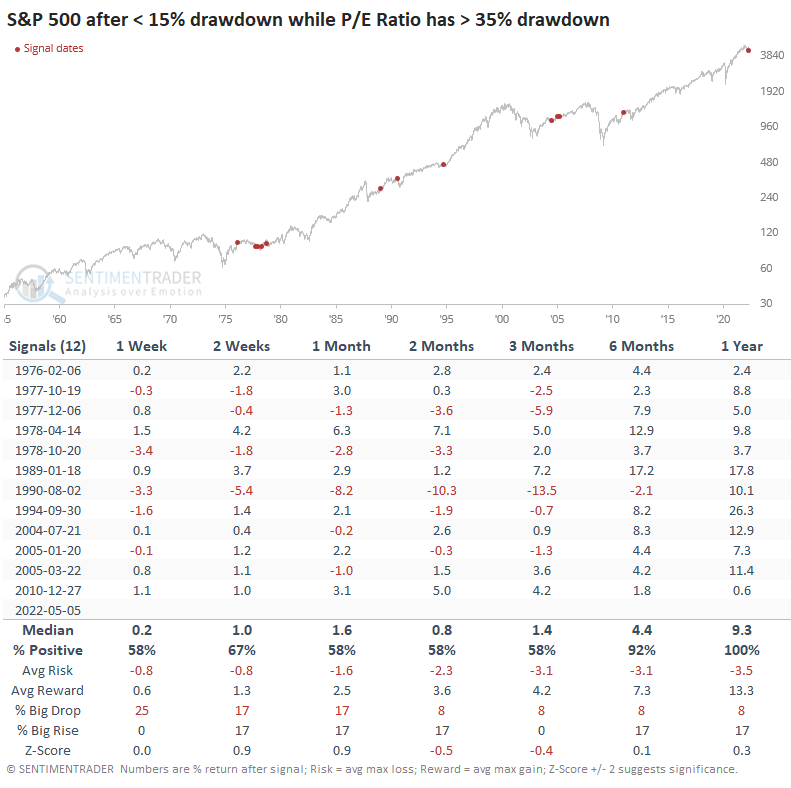
Returns were good for the index going forward, about in line with random up to six months later. From there forward, though, the S&P did very well, at least in terms of consistency. Its average return was mediocre, but it showed a positive return every time over the next year.
What the research tells us...
Investors are dealing with a head-spinning number of cross-currents at the moment, and the market environment doesn't help. It's very poor, rallies are being sold, and extremes aren't generating the kinds of buying interest that characterized much of the past 12 years. The past week witnessed more extremes in pessimism, which even during bear markets tend to lead to multi-week or even multi-month rebounds. The sudden re-valuation of the most important index in the world is becoming compelling because that was a major headwind heading into this decline. Now, we need to see some of the bear market hallmarks evaporate and get some thrusts in buying interest that don't get sold immediately.
By Jason Goepfert
BOTTOM LINE
The Nasdaq 100 index of big tech stocks is facing a very large negative gap down open as traders continue to have a "sell first" mentality.
FORECAST / TIMEFRAME
None
|
This is a quick note to answer some questions this morning related to the continued meltdown in Big Tech. As this is published, the Nasdaq 100 index is indicated down more than 2% from Friday's close.
In case there is any doubt about what kind of market environment we're in, this type of behavior has only been seen during the "crash-y" parts of bear markets. Those are the only times we've had to endure such large opening losses in the Nasdaq 100 when the index is already hitting at least a one-year low.
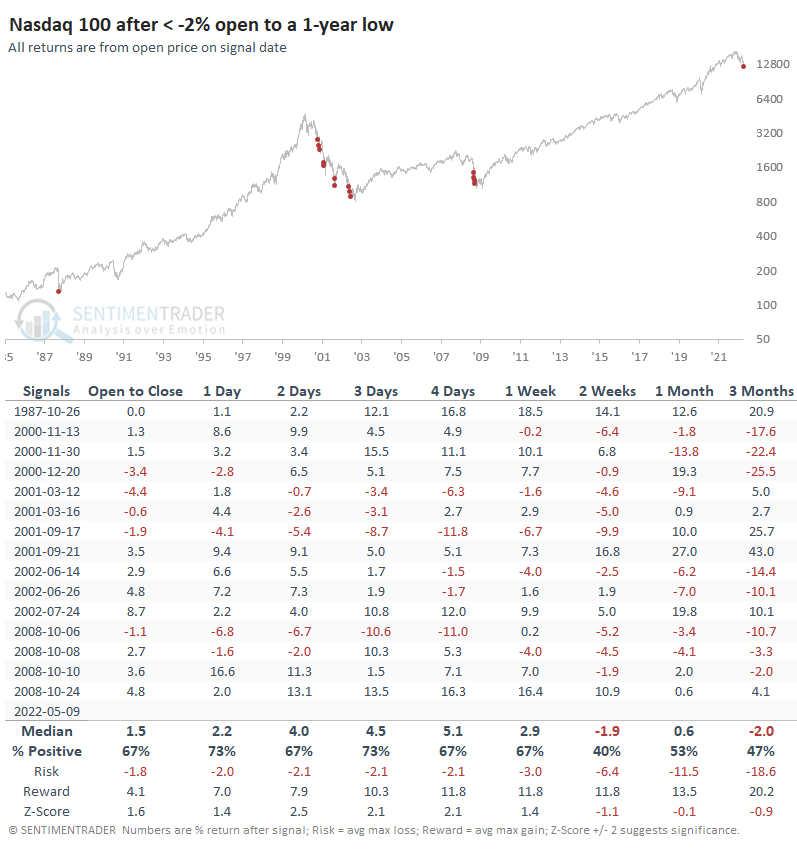
For anyone who was watching markets during the financial crisis, this was a regular feature as traders digested all the woeful headlines over the weekend and started the week with even more dread. But because that was a relatively quick crash, there was only once in October of that year when we saw behavior like we're facing today.
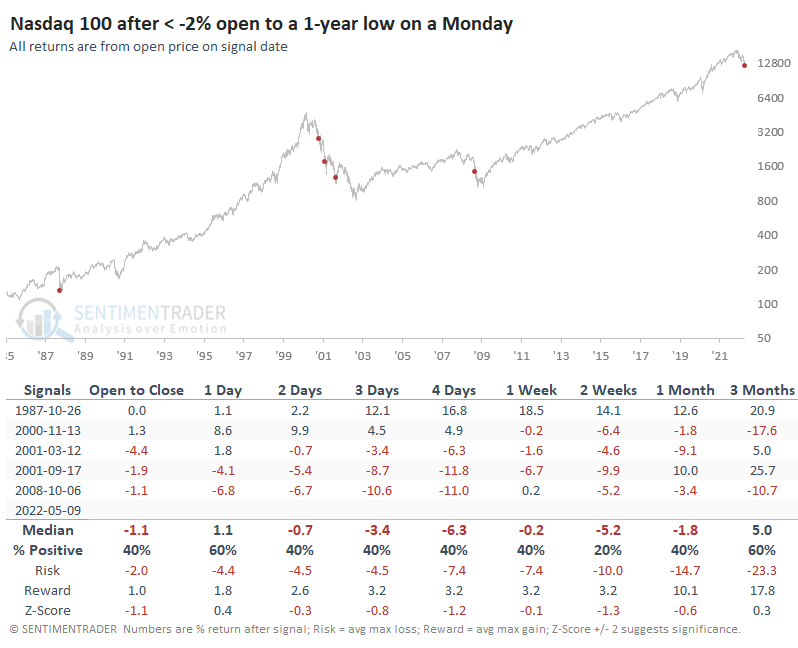
The sample size is tiny, but the only time it paid for traders to buy the dip in these cases was the initial tremor following the '87 crash. The others saw more weakness in the days/weeks ahead.
Even if futures recover a bit before the open, the implications don't change much as long as the negative gap is 1% or more. This is an atrocious market environment across virtually all financial assets, unlike anything the current generation (or the two generations before) has witnessed. It remains a time to be very judicious about having a buy-the-dip mentality.
Indicators at Extremes
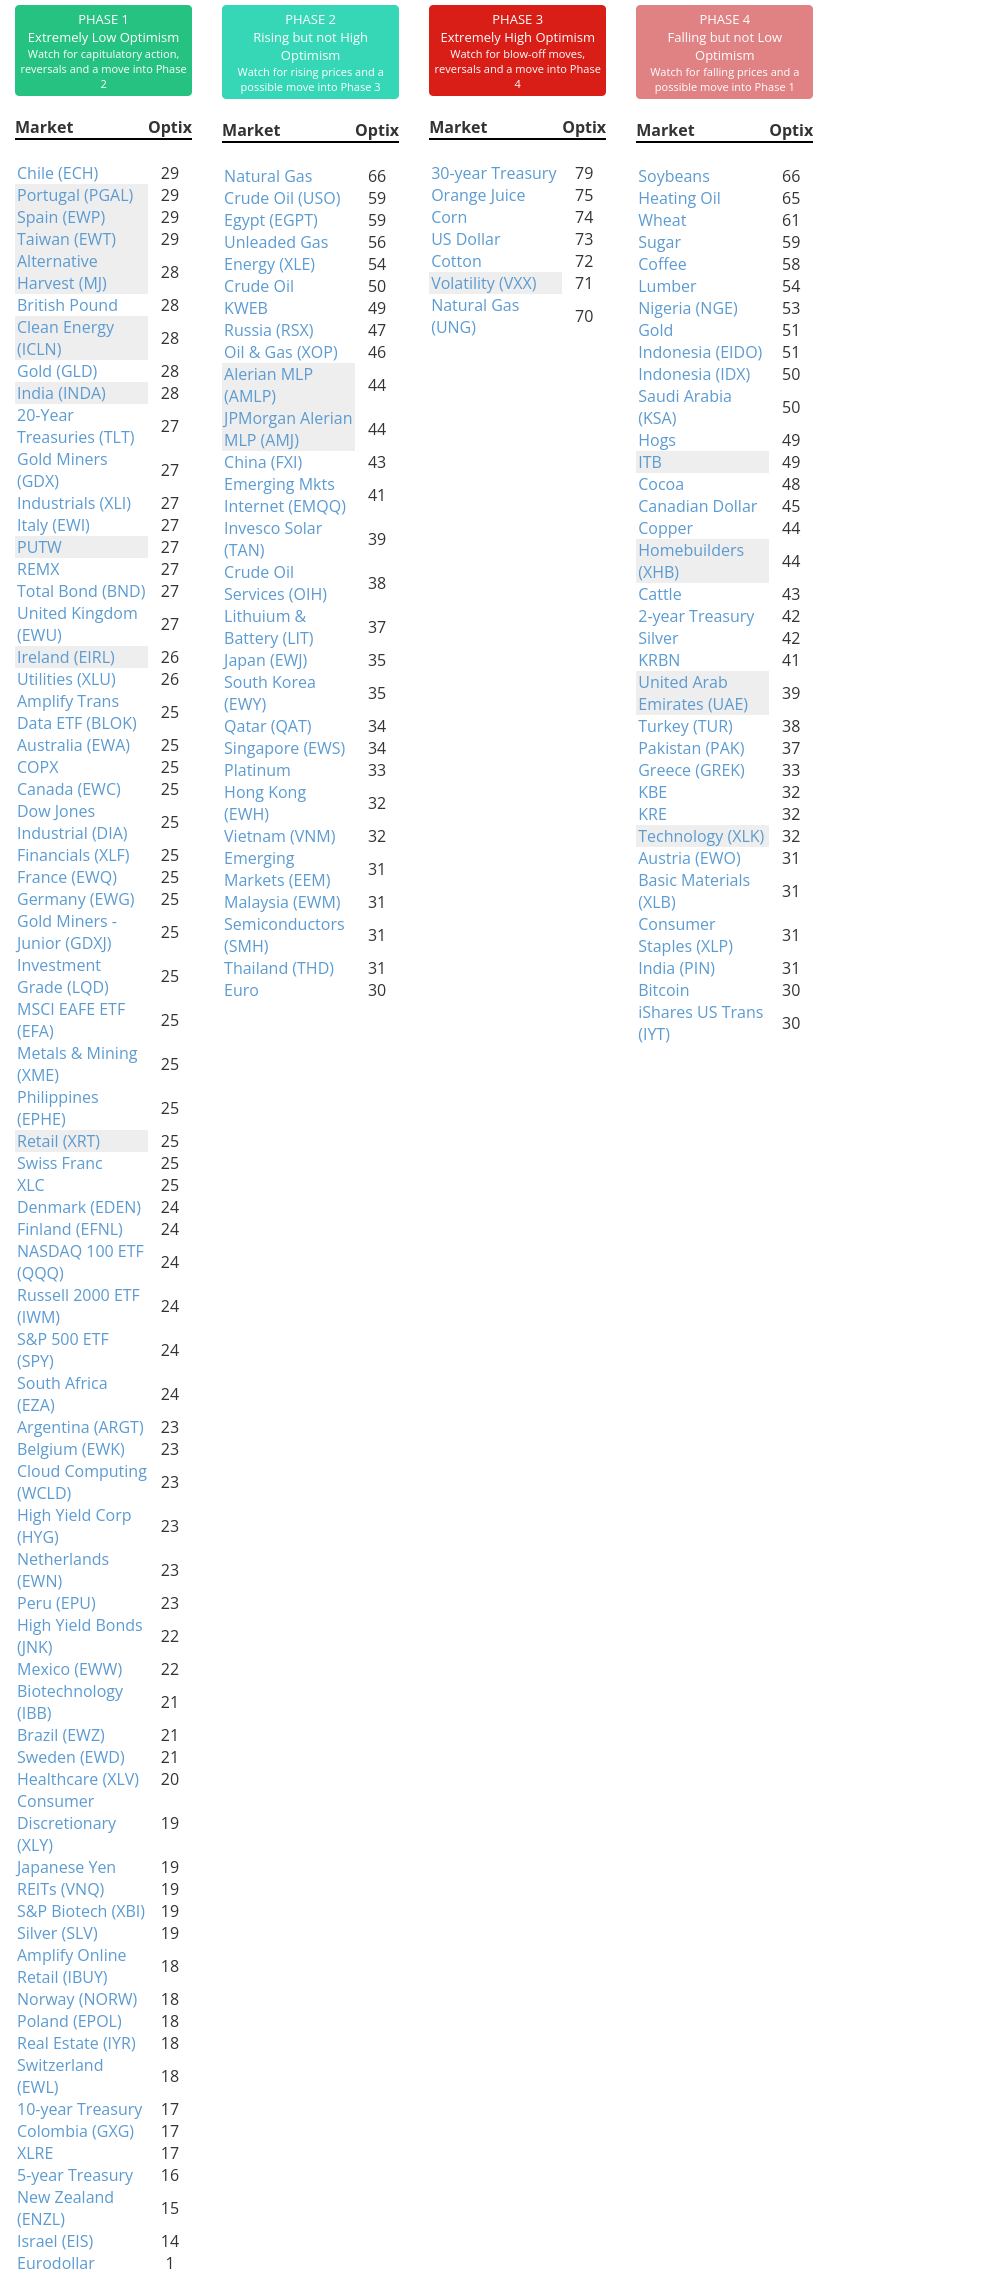
Phase Table
Ranks
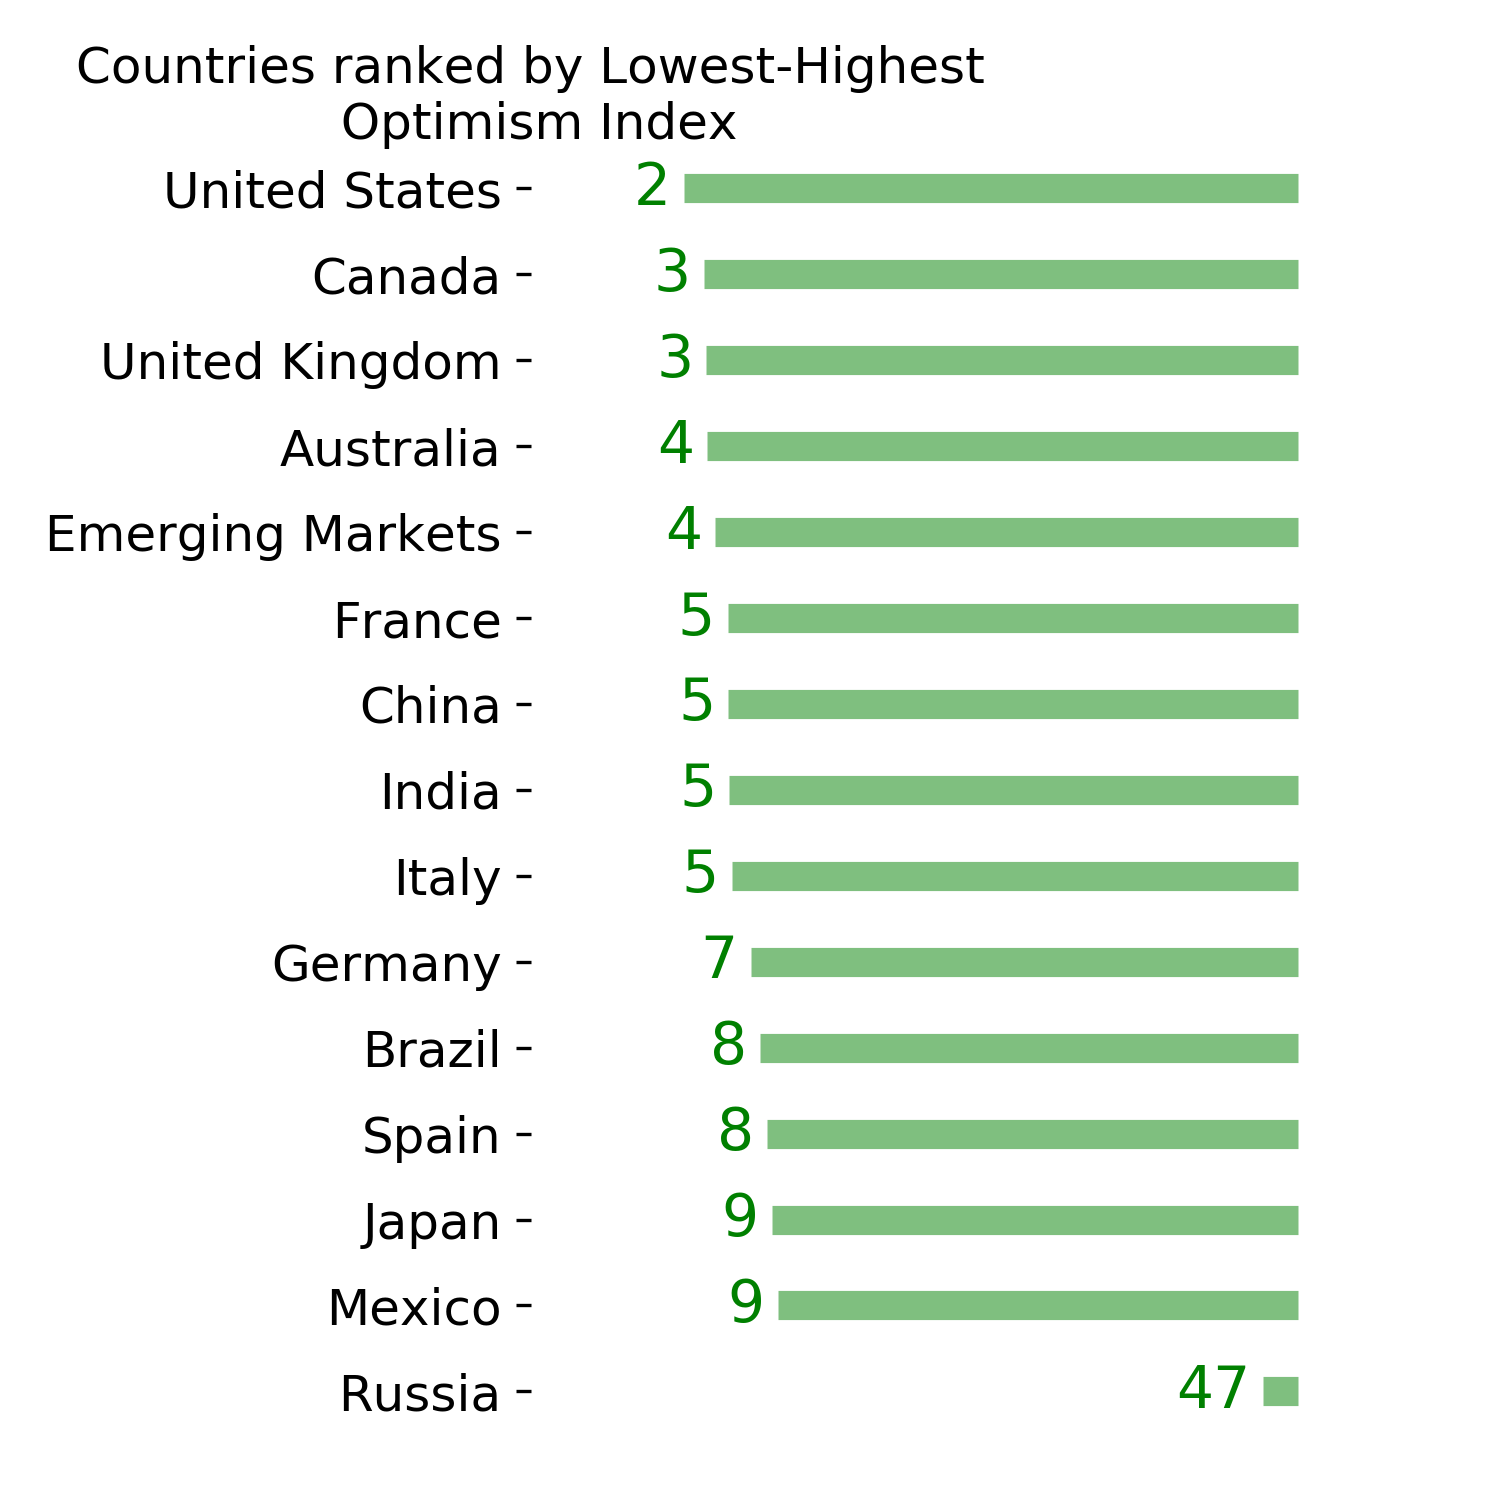
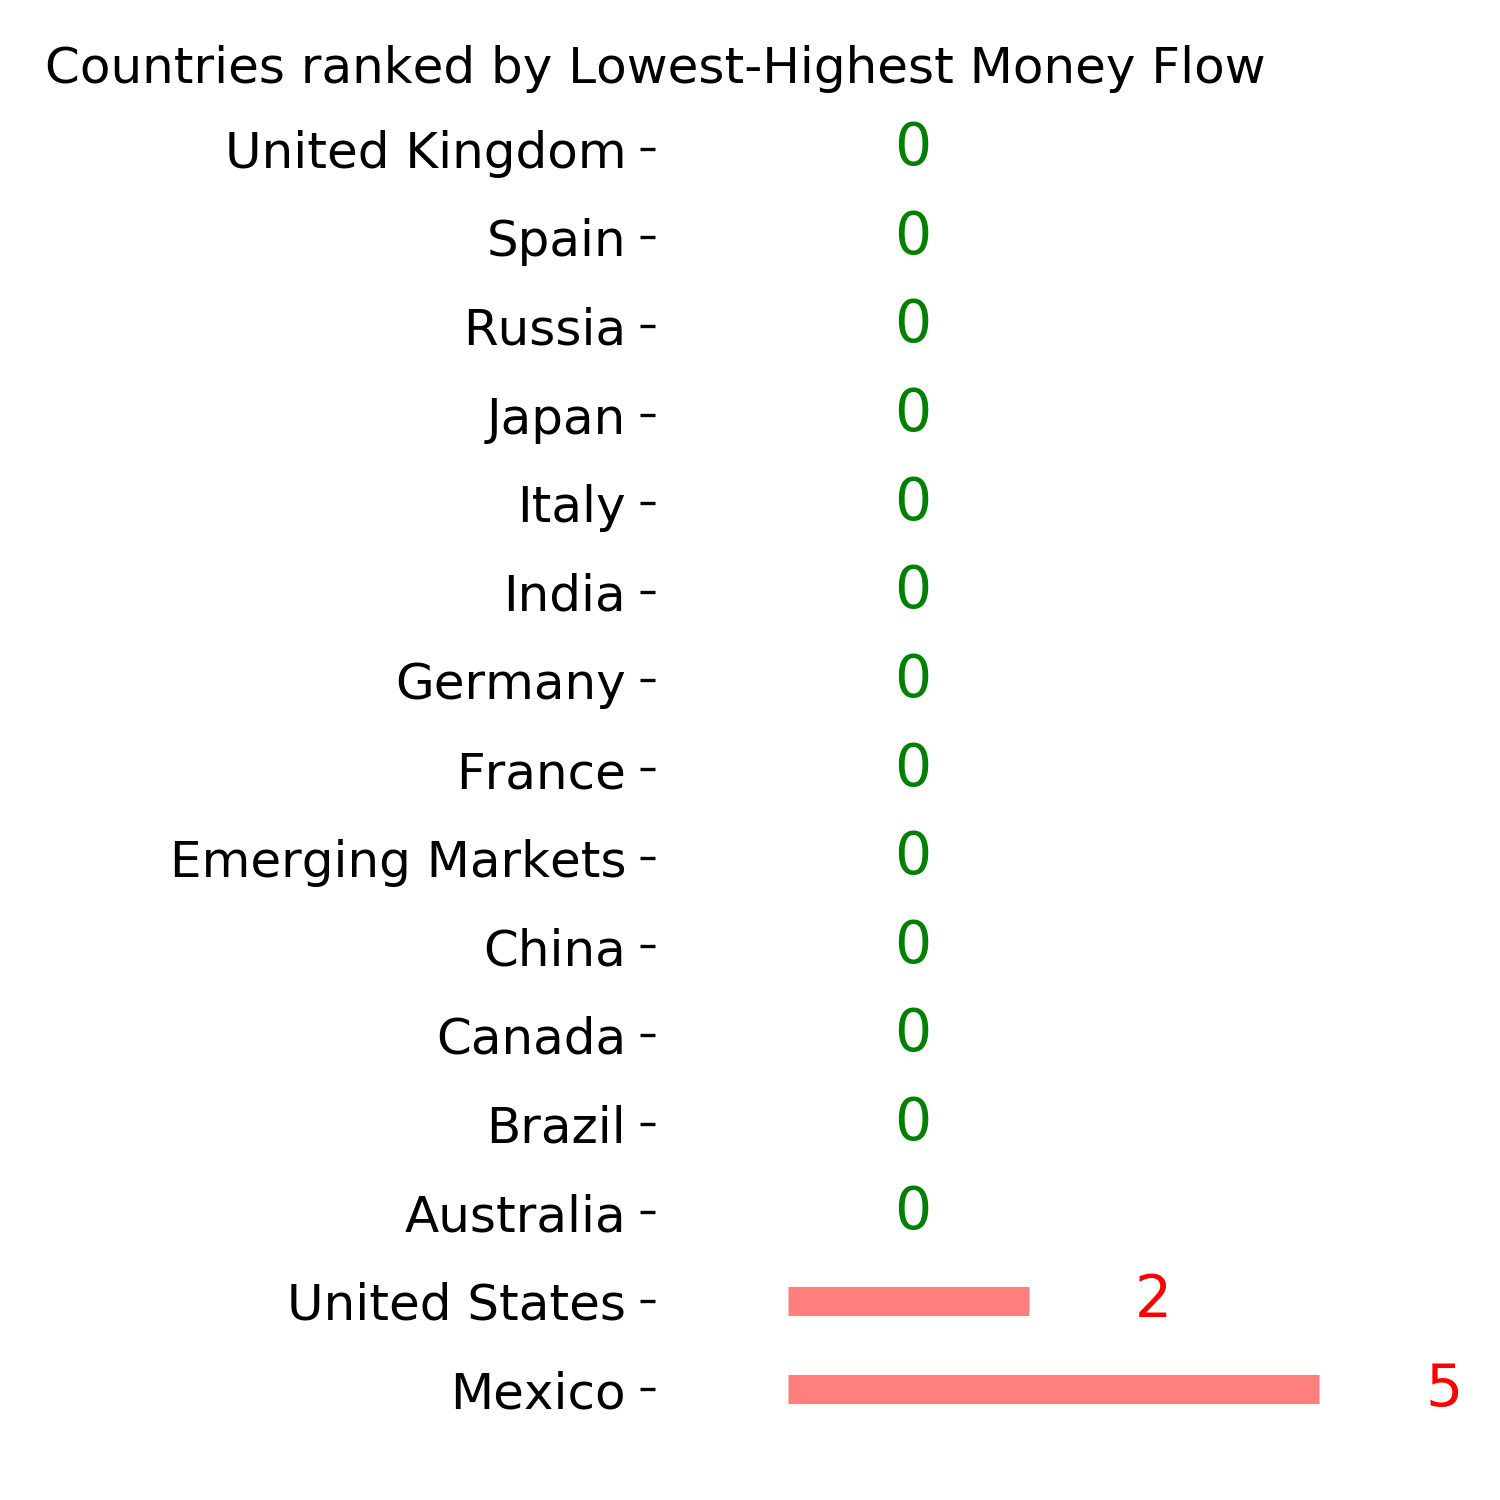
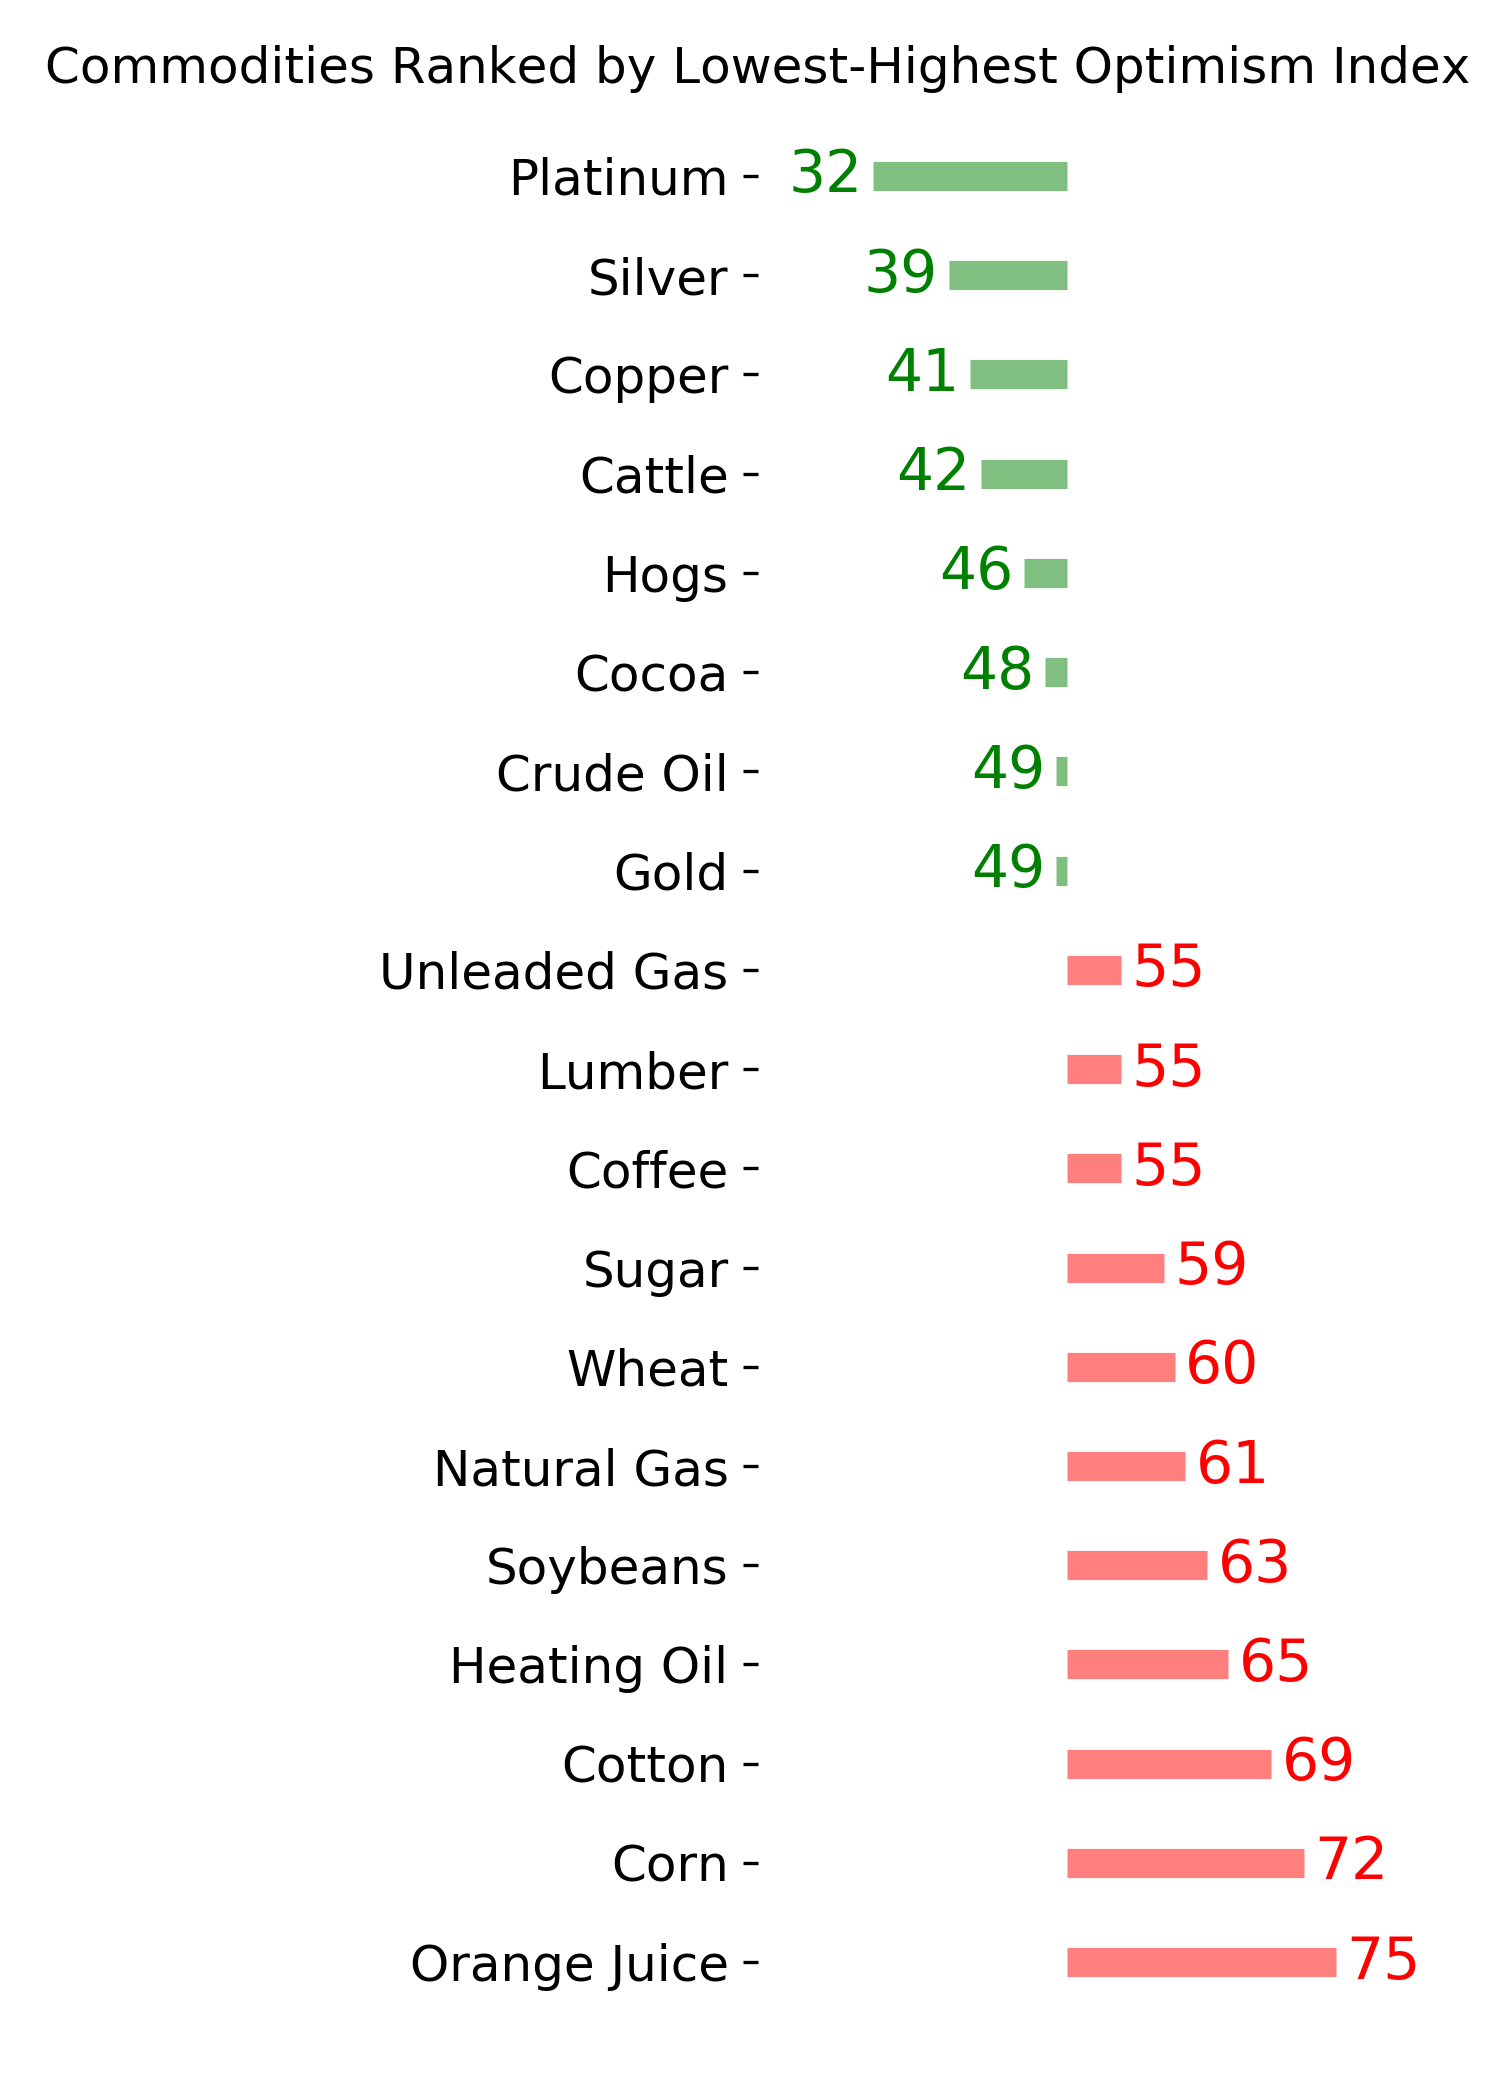
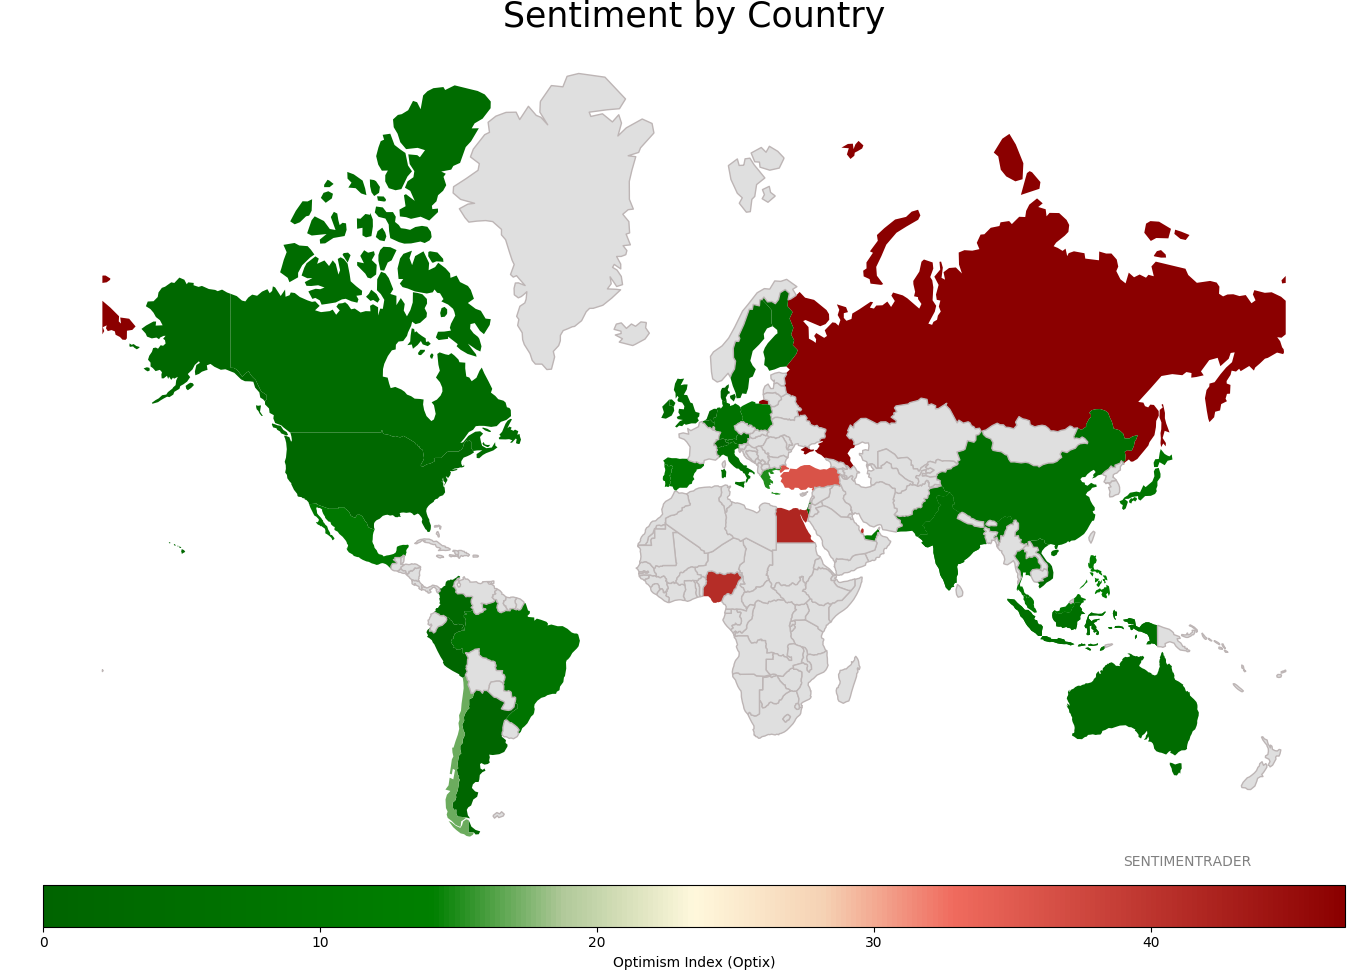
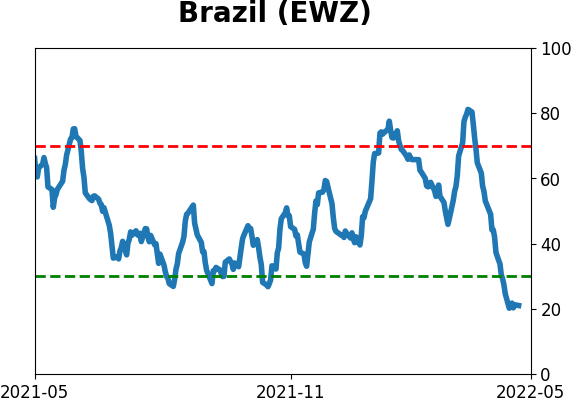
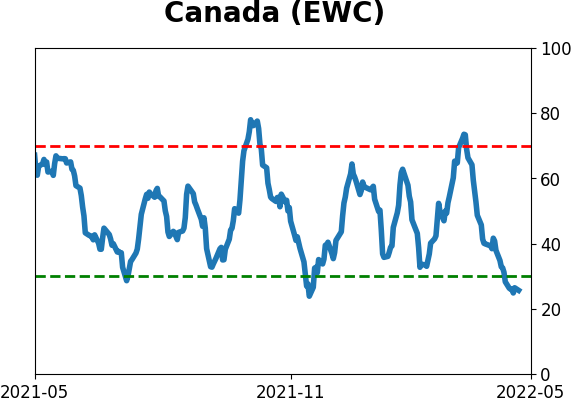
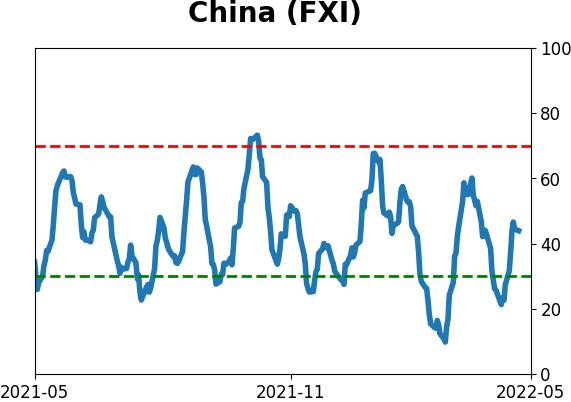
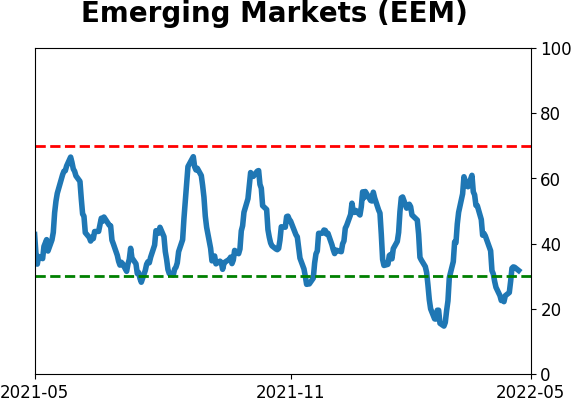
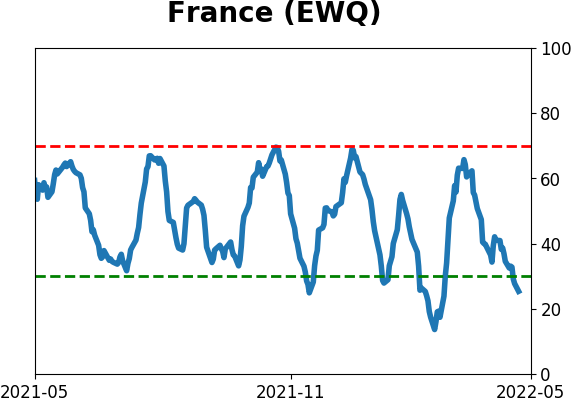
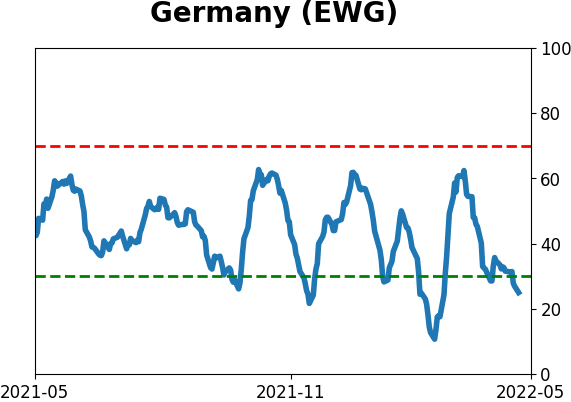
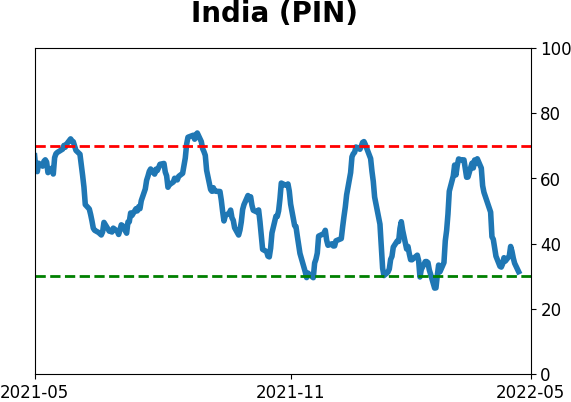
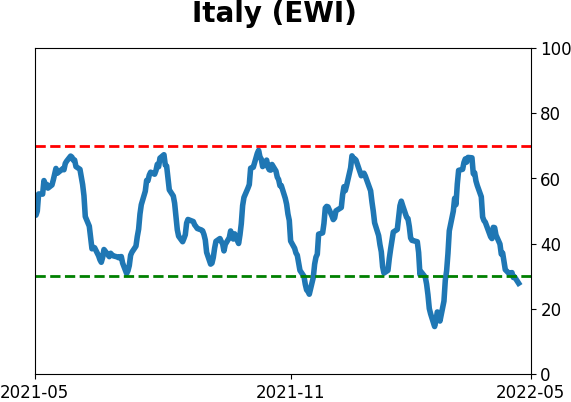
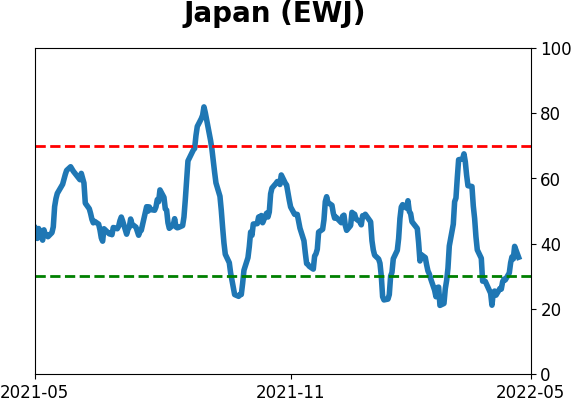
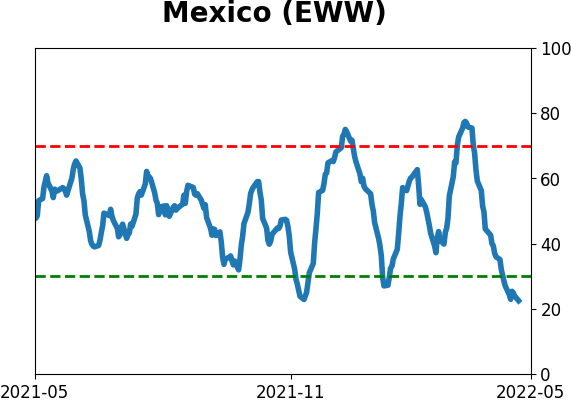
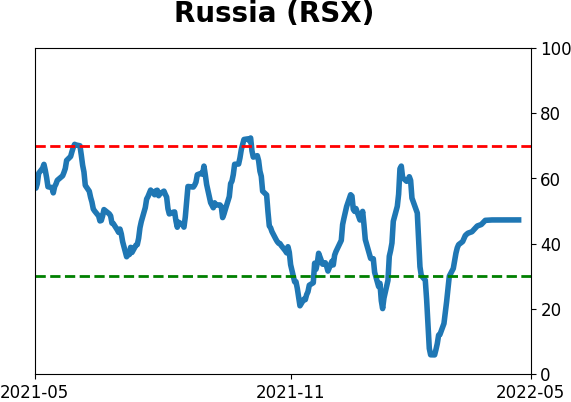
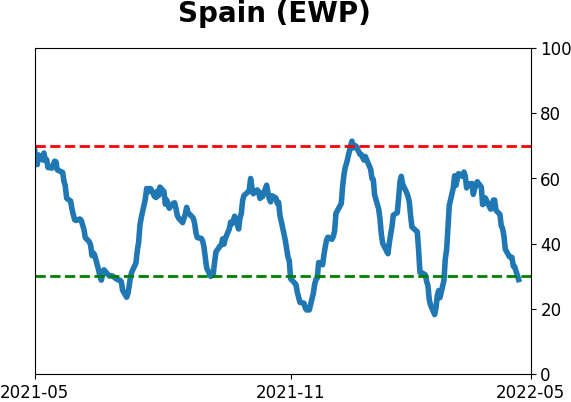
Sentiment Around The World
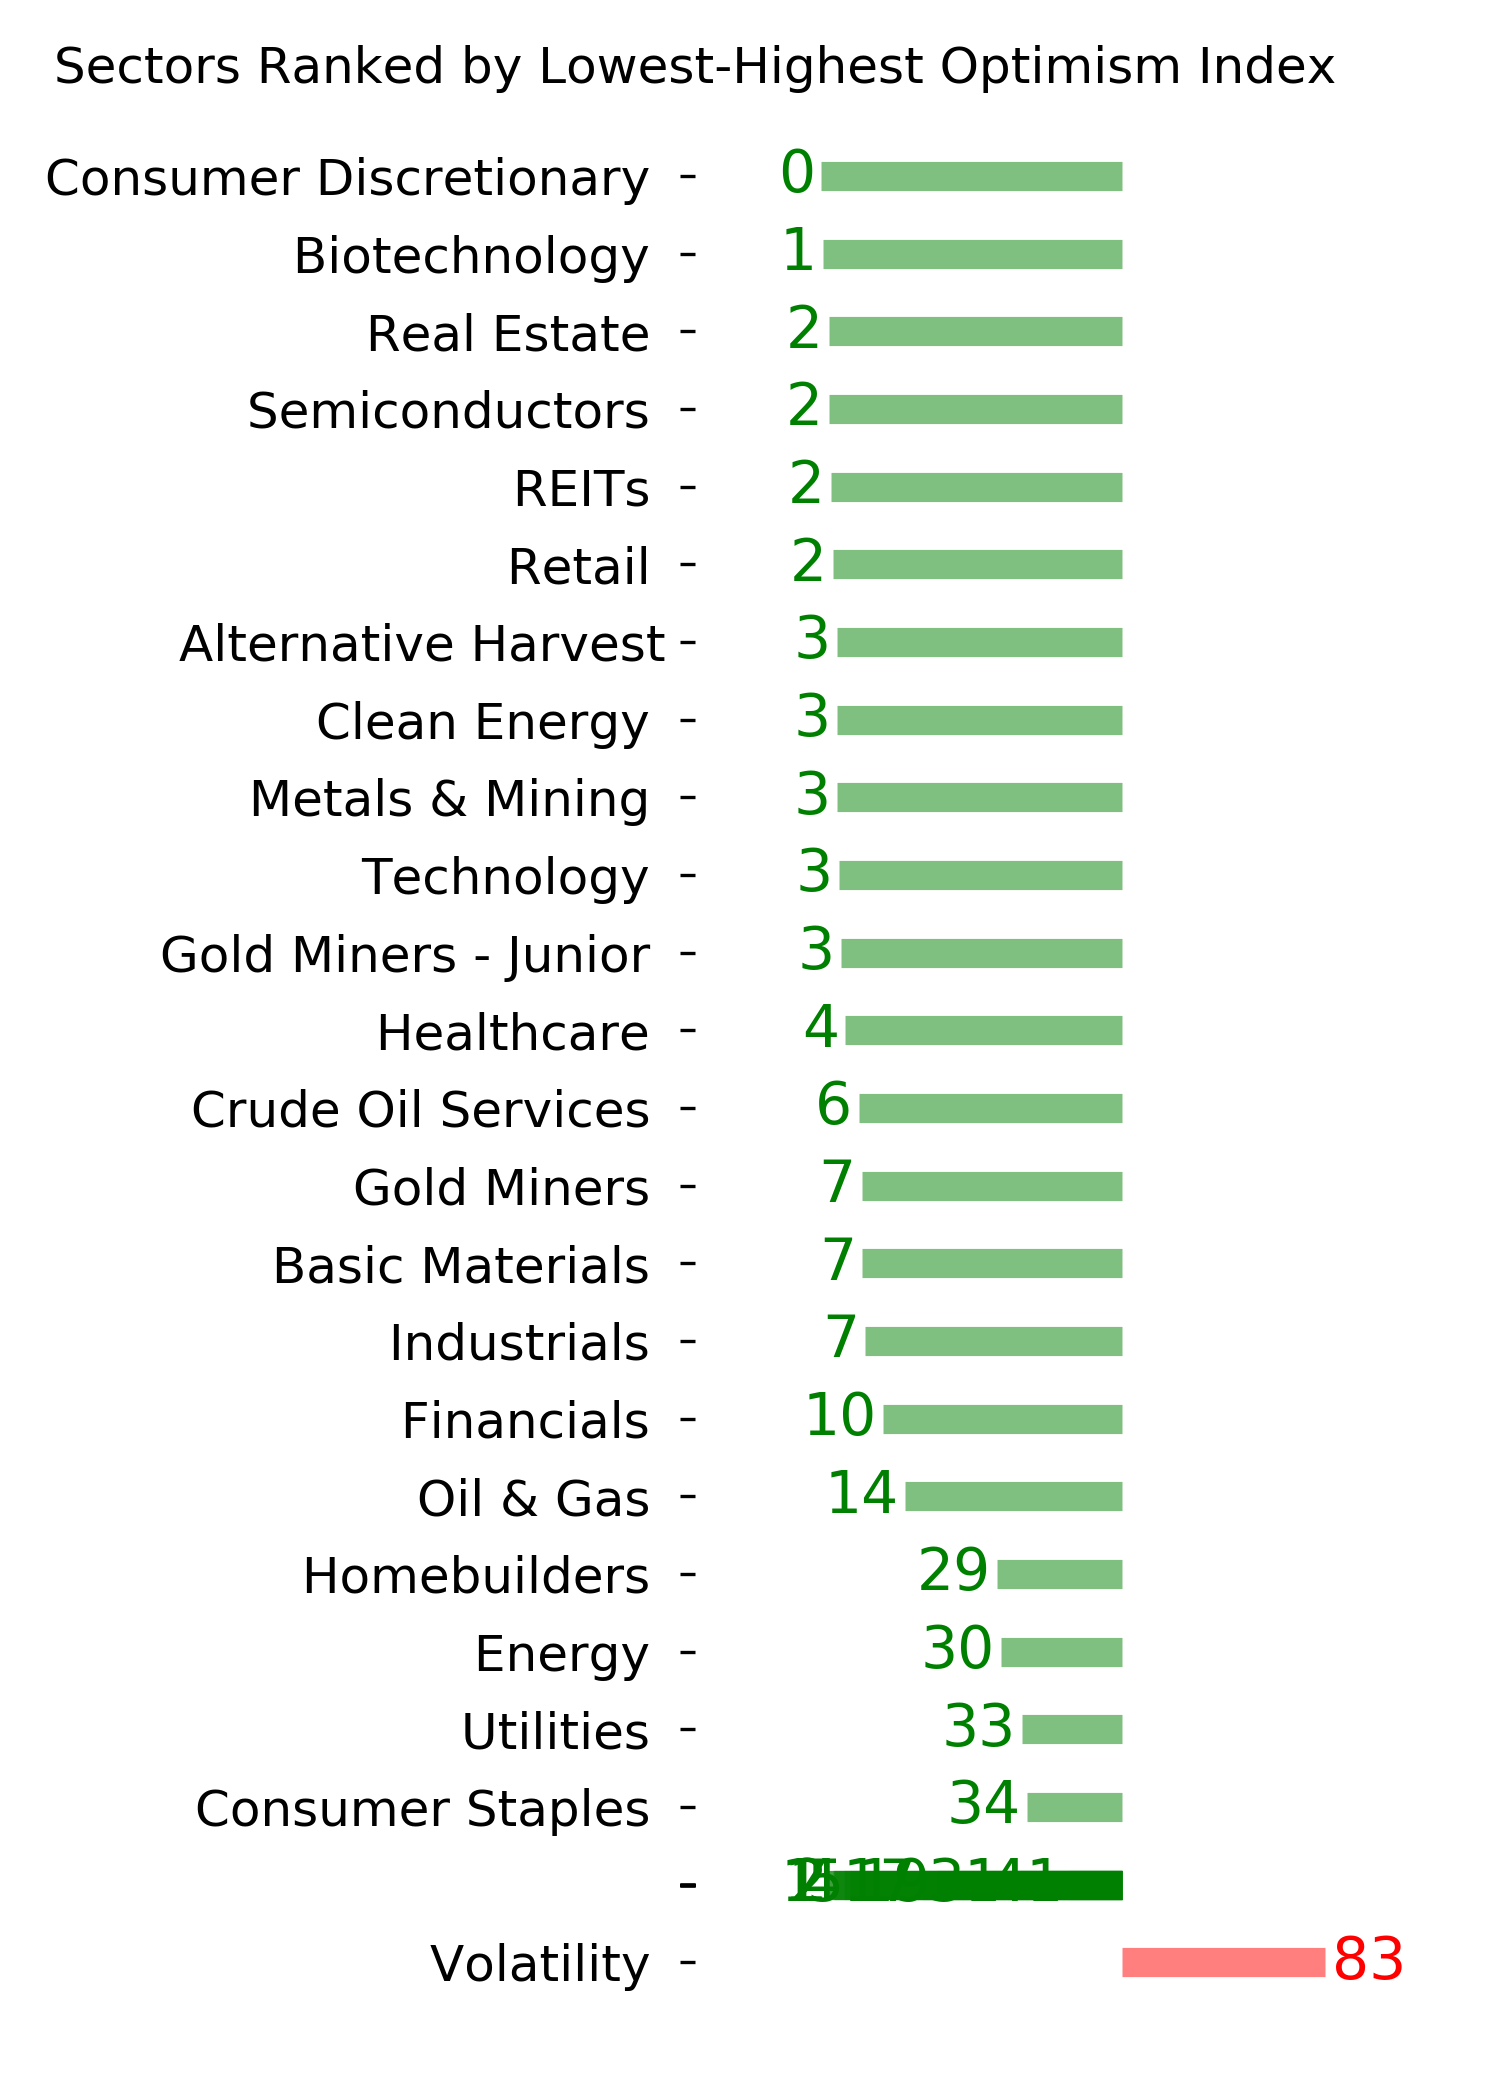
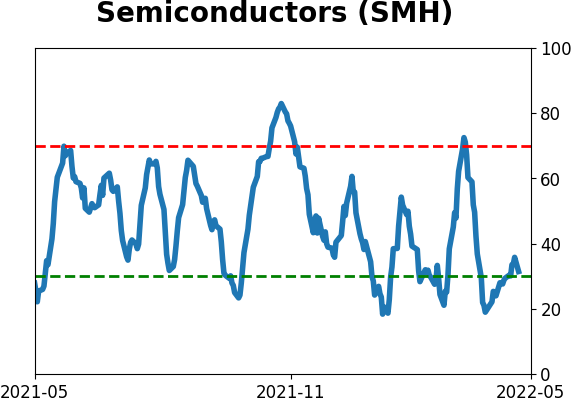
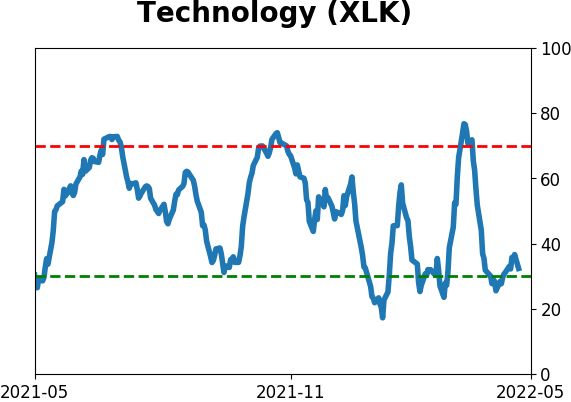
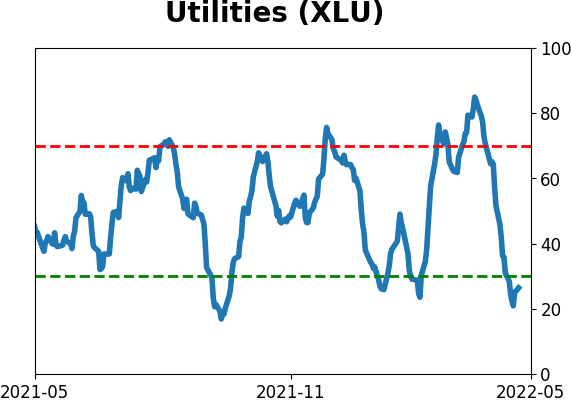
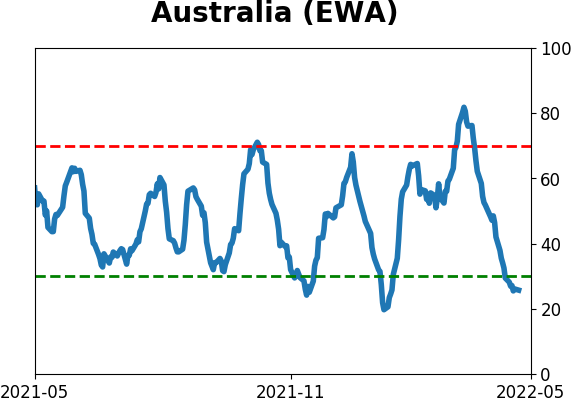
Optimism Index Thumbnails
|
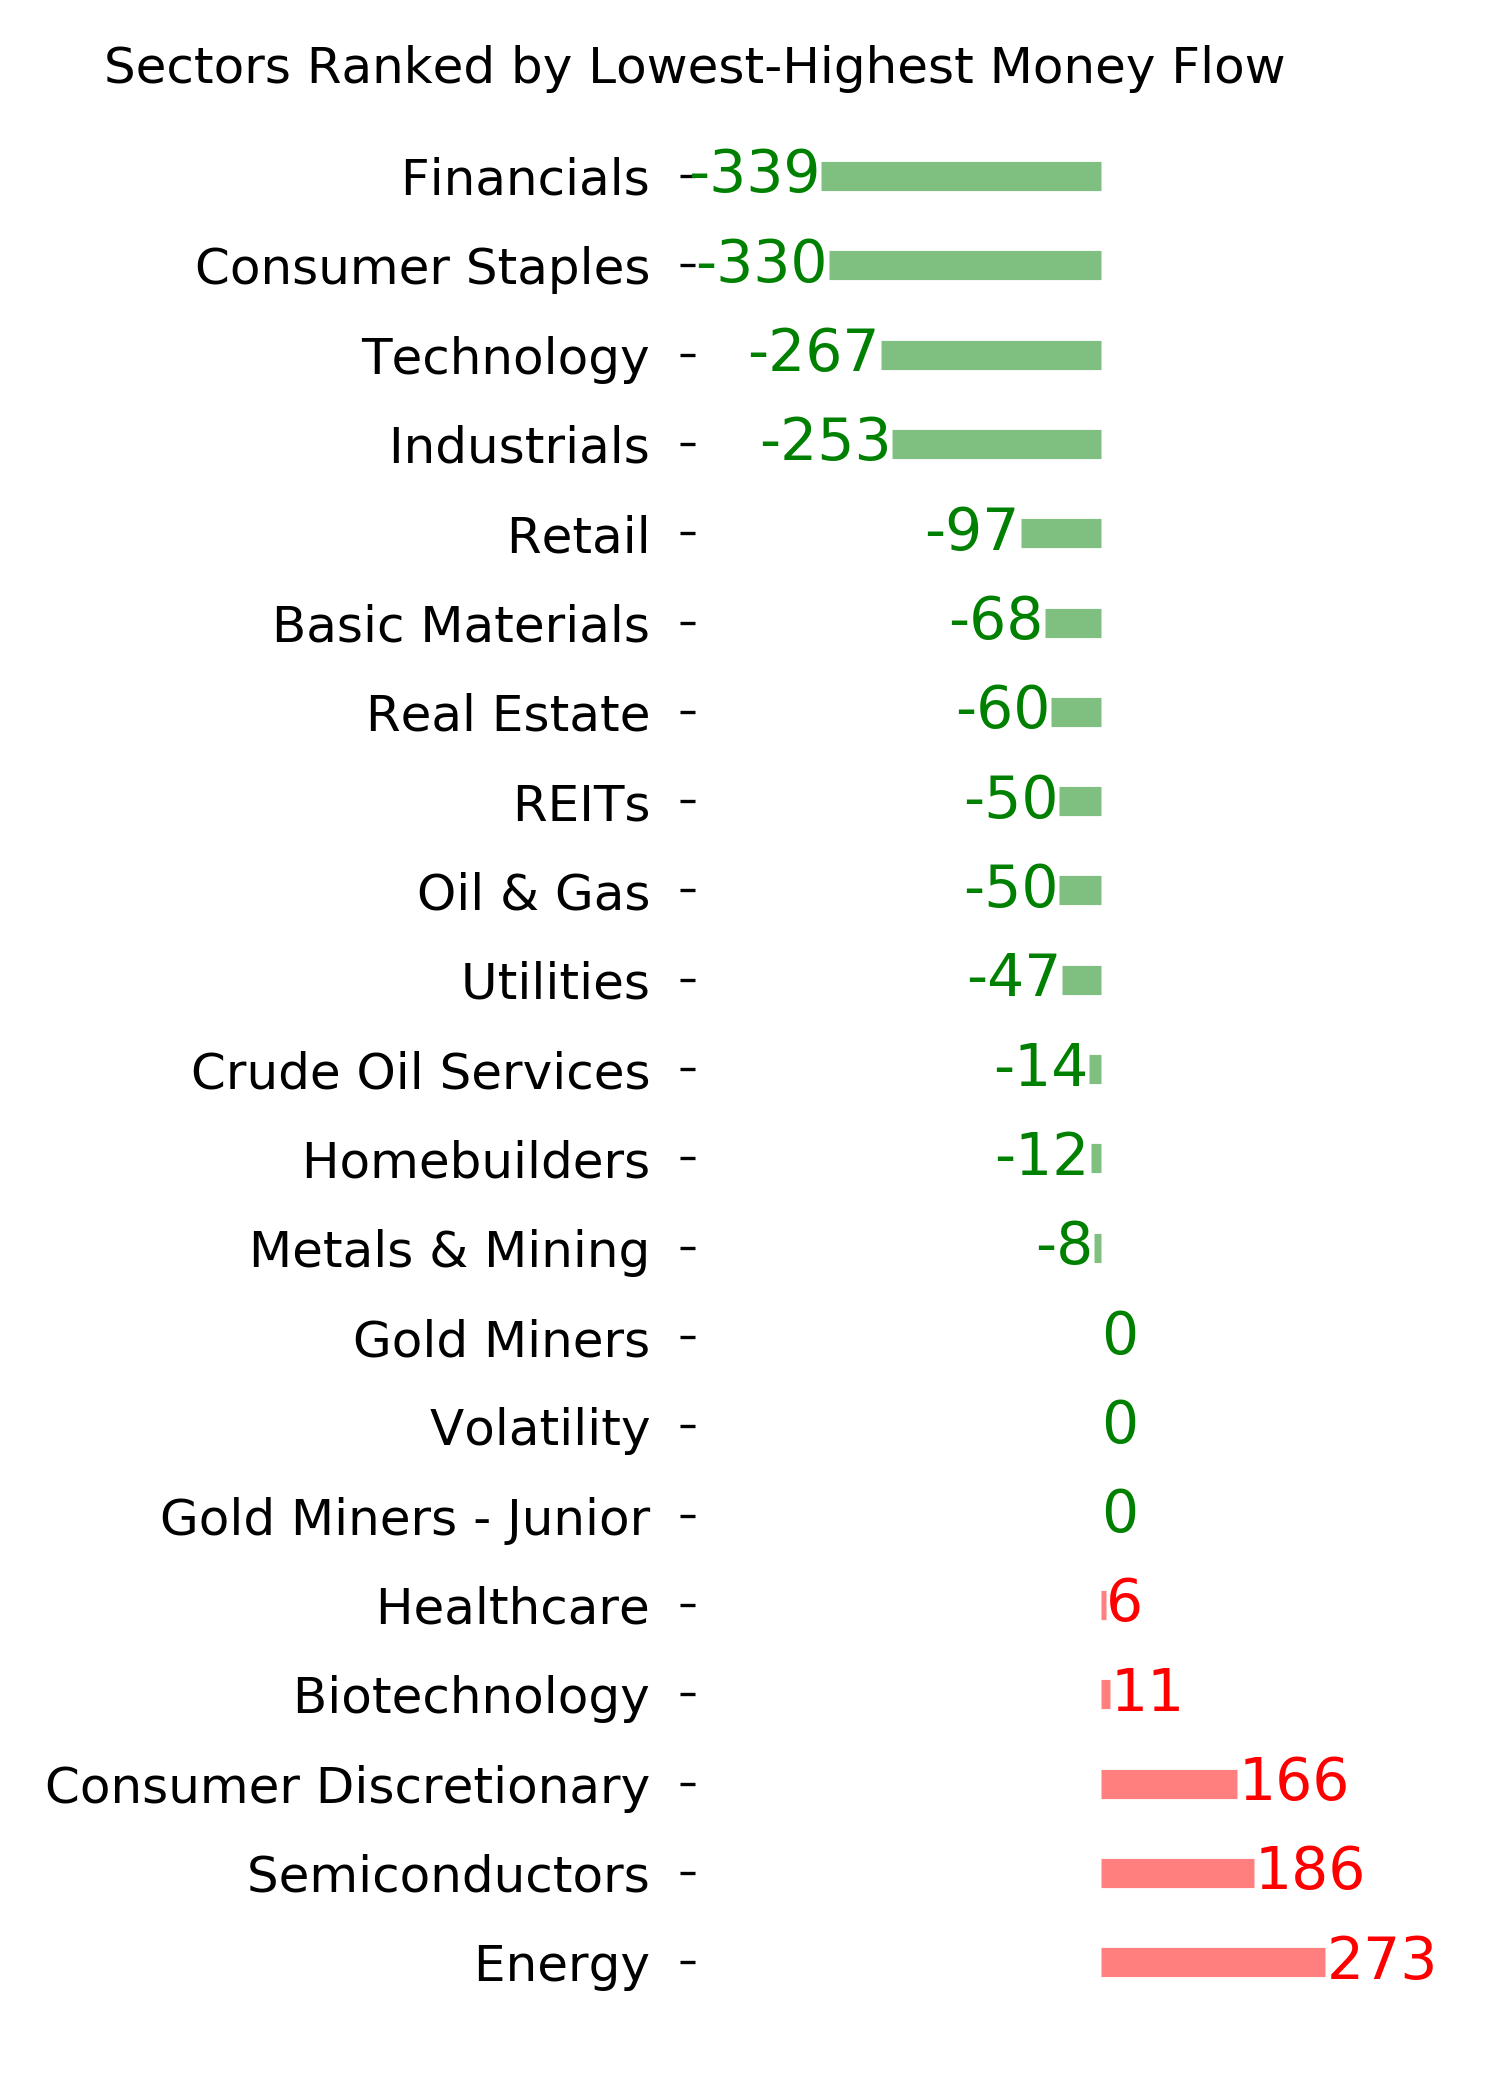
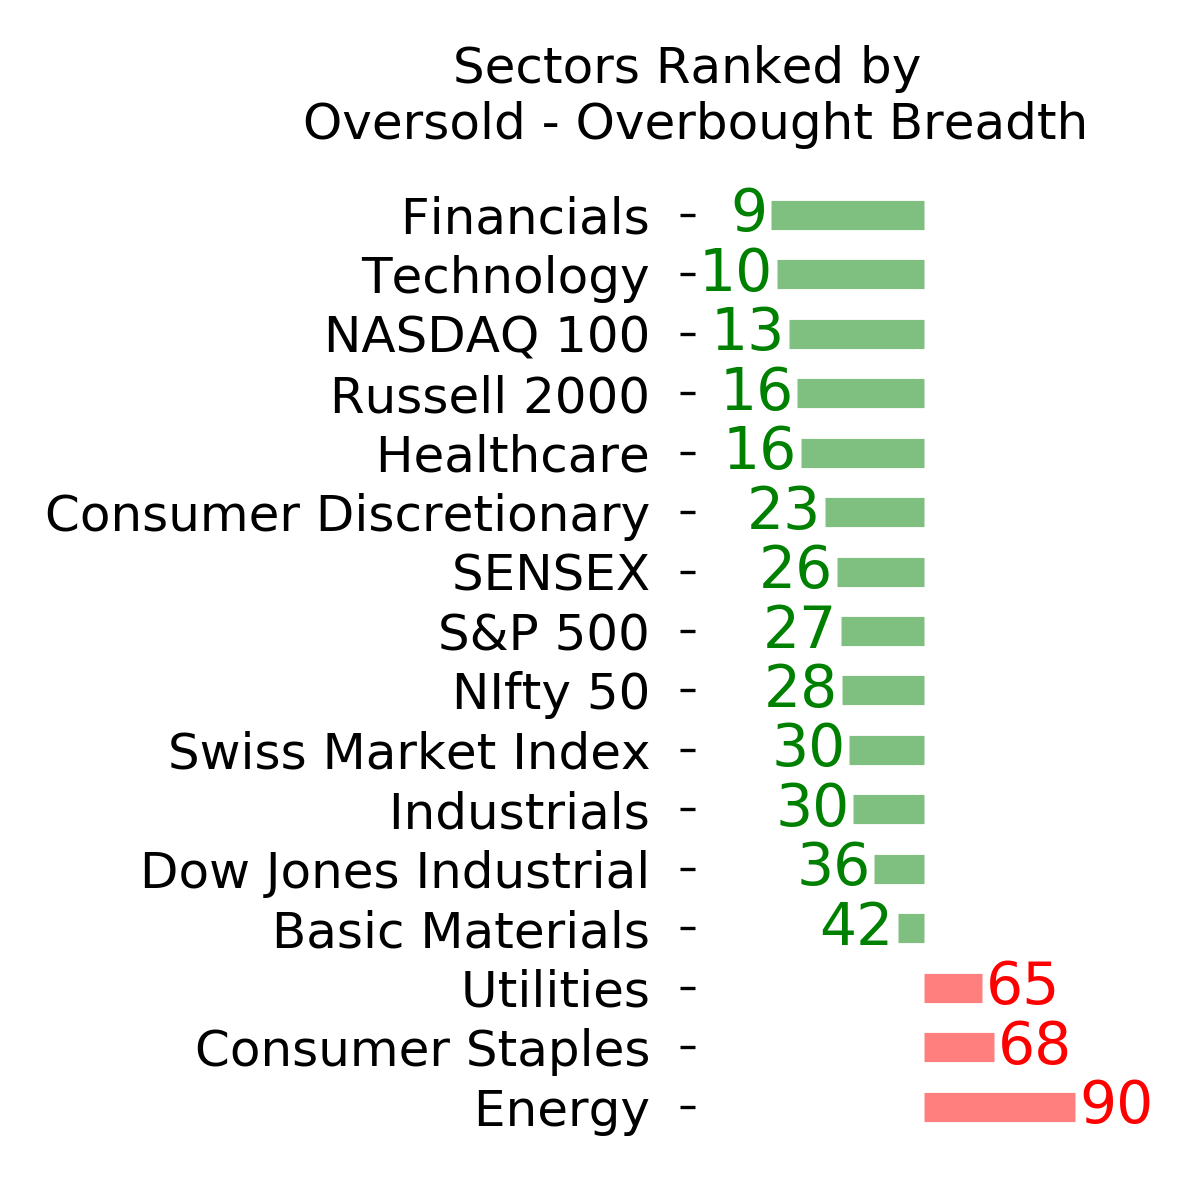
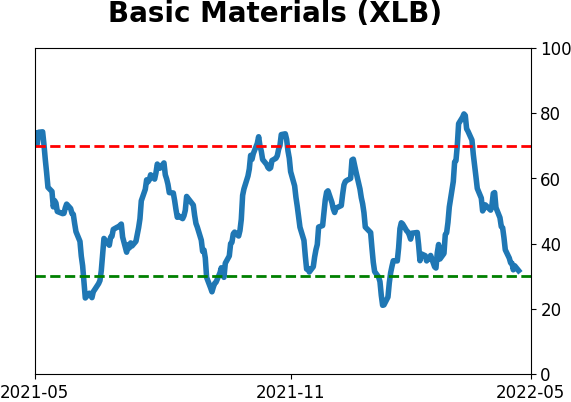
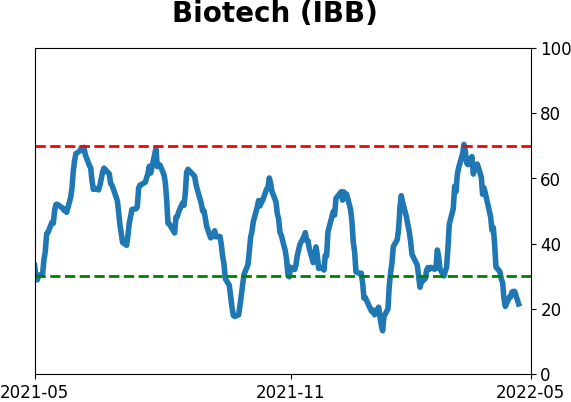
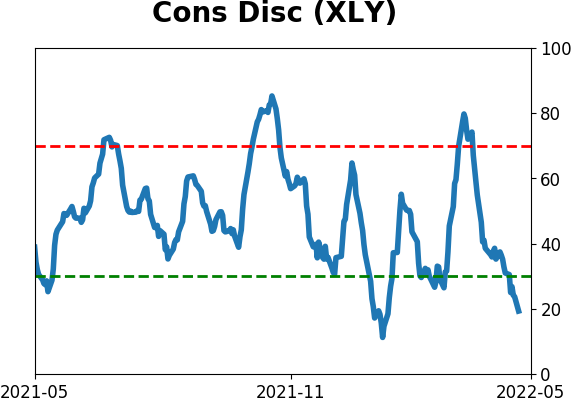
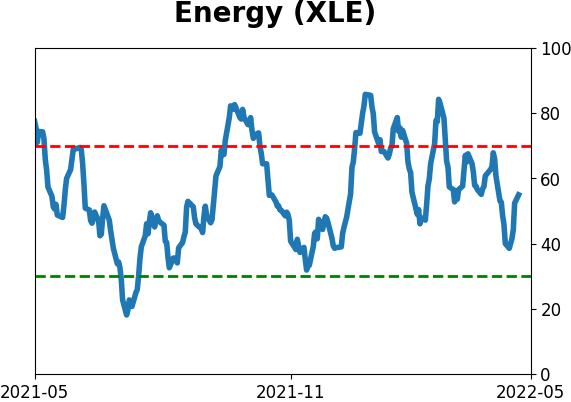
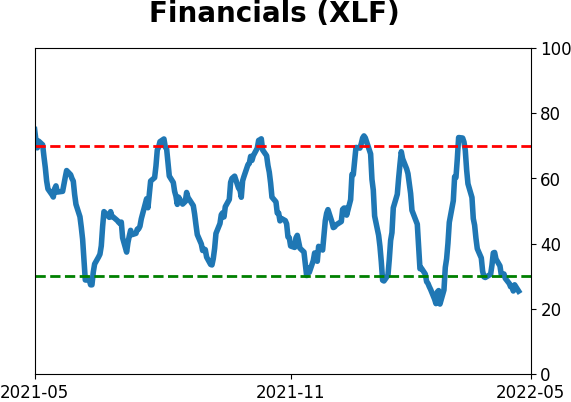
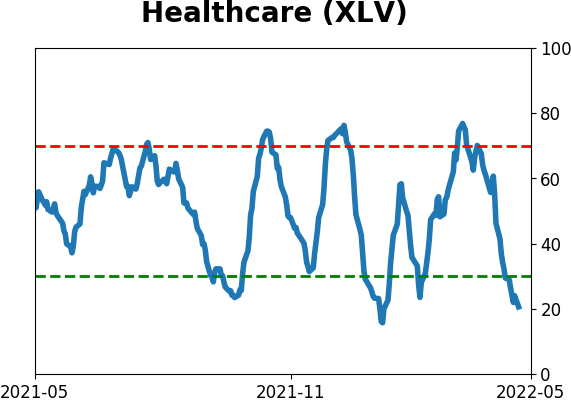
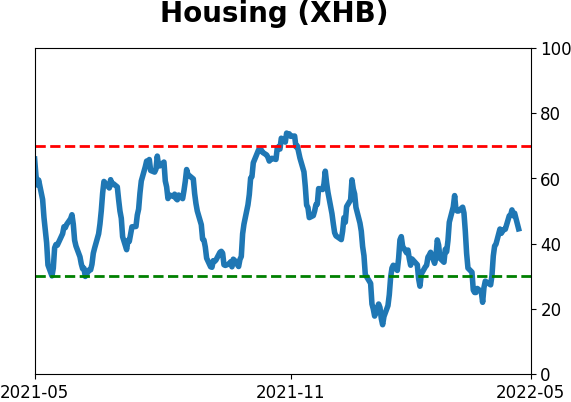
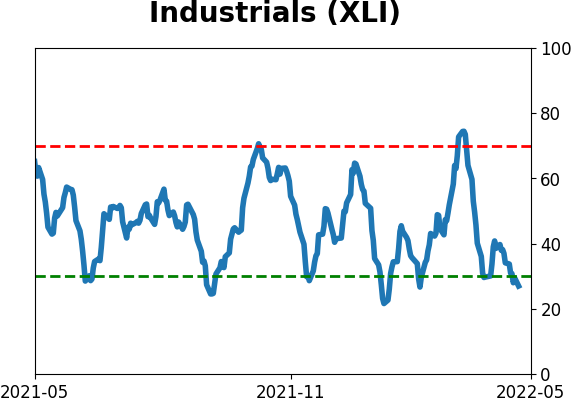
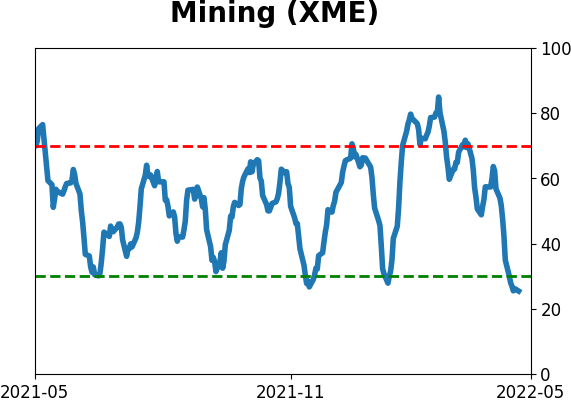
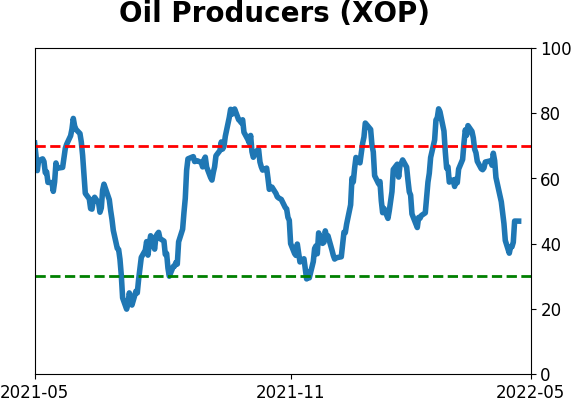
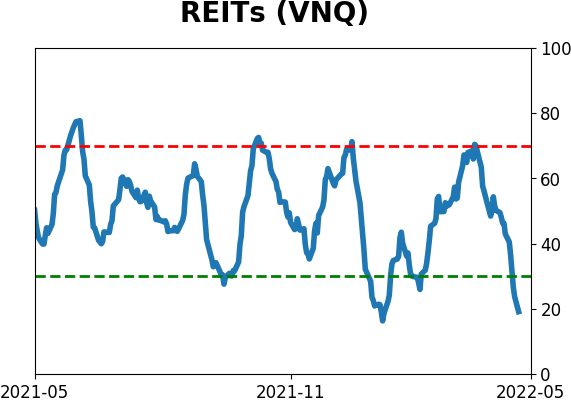
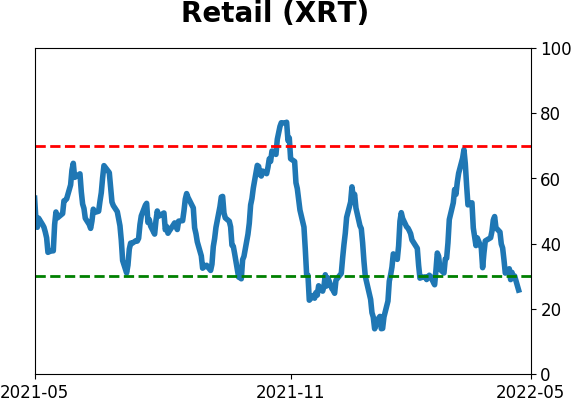
Sector ETF's - 10-Day Moving Average
|
|
|
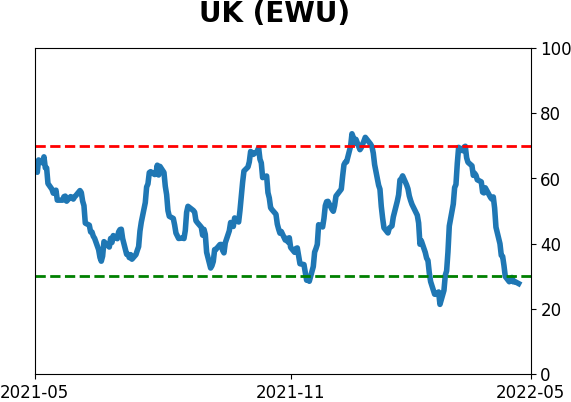
Country ETF's - 10-Day Moving Average
|
|
|
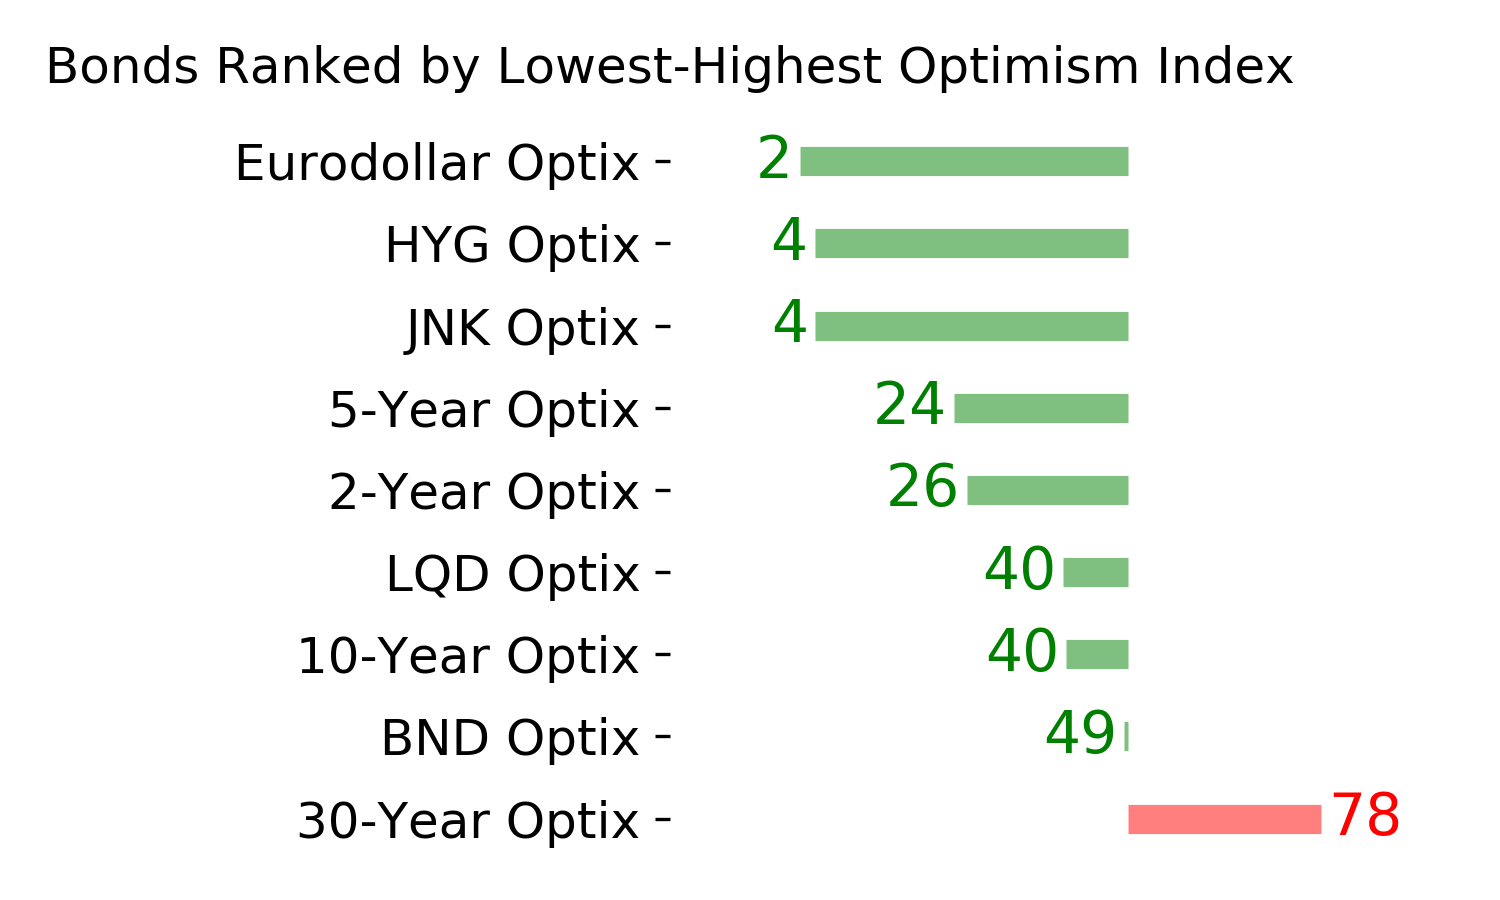
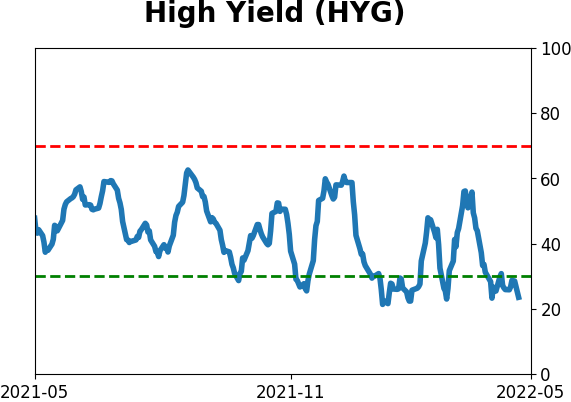
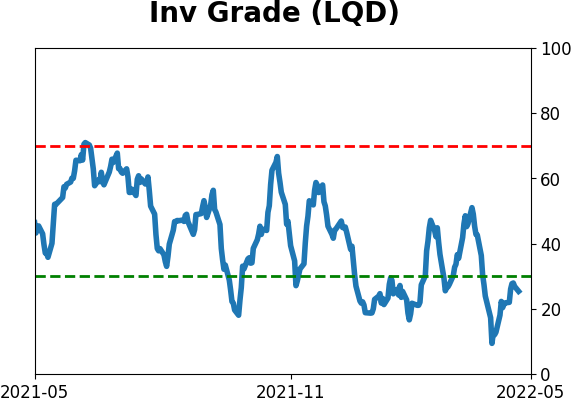
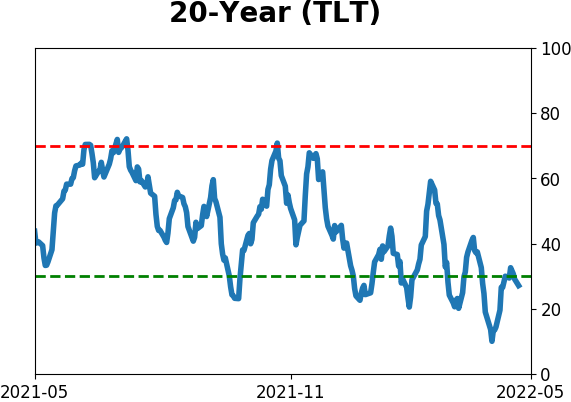
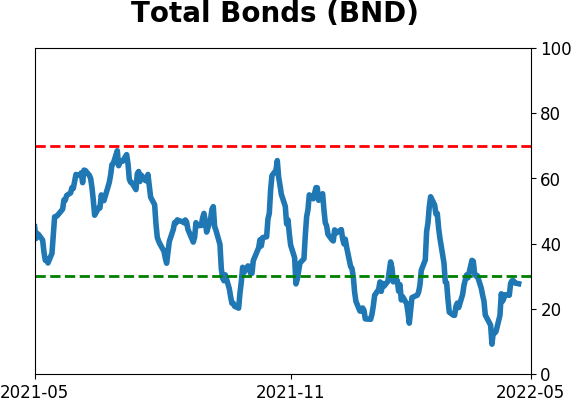
Bond ETF's - 10-Day Moving Average
|
|
|
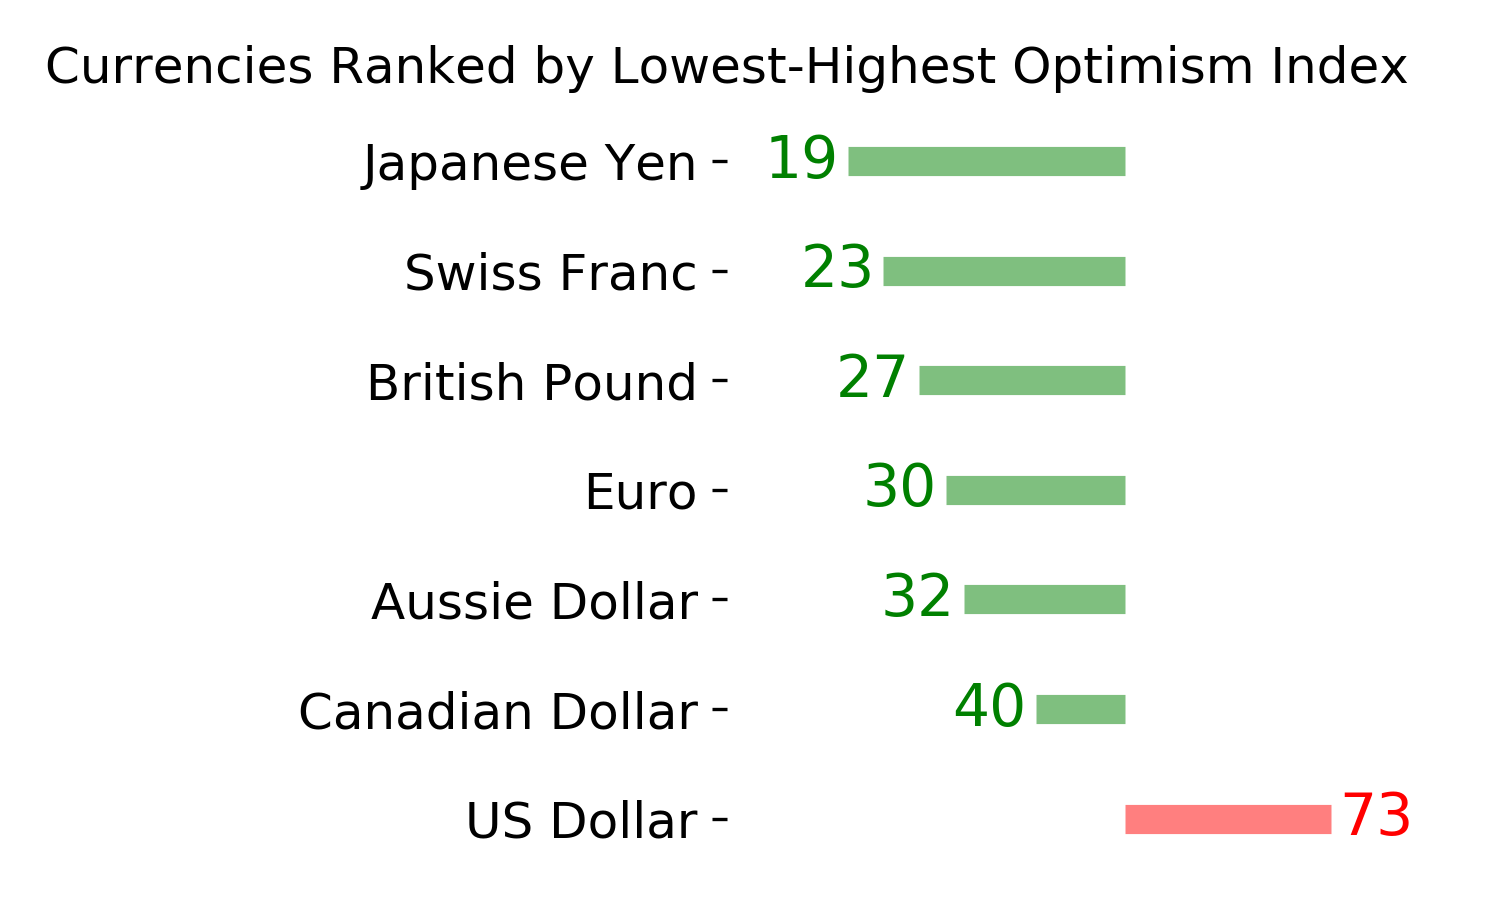
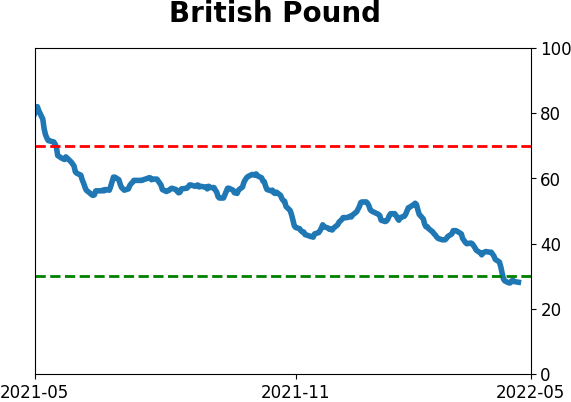
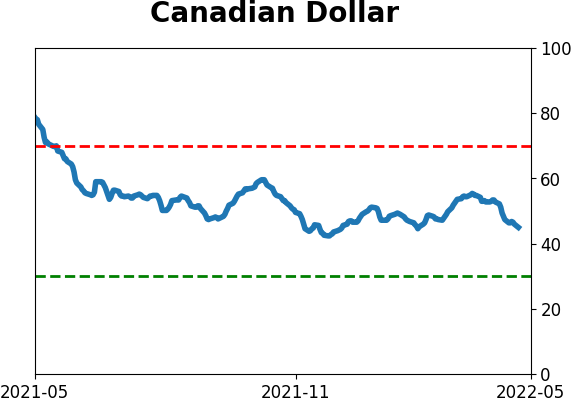
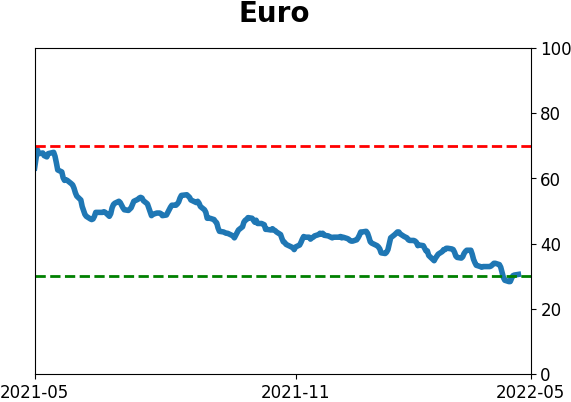
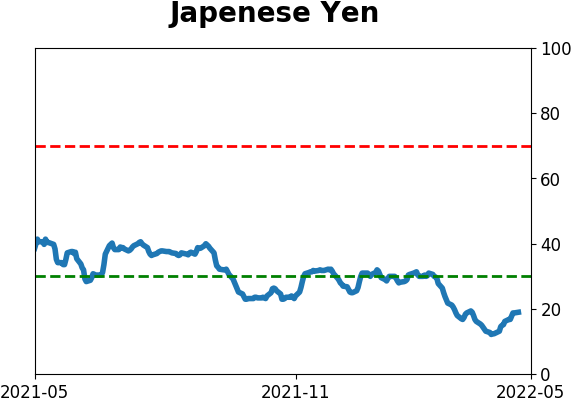
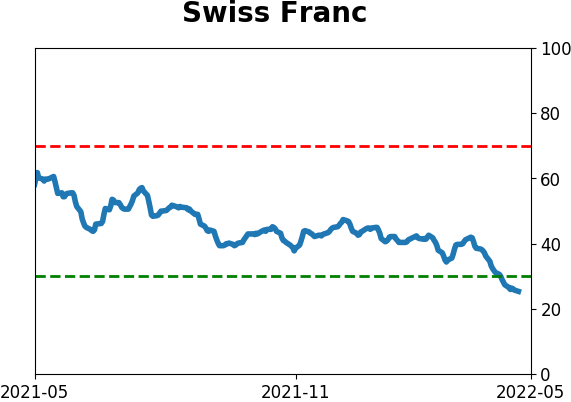
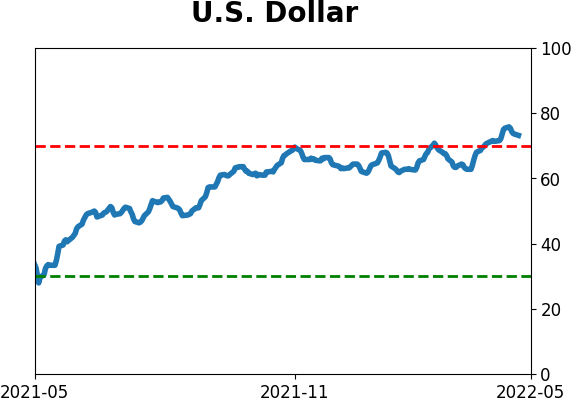
Currency ETF's - 5-Day Moving Average
|
|
|
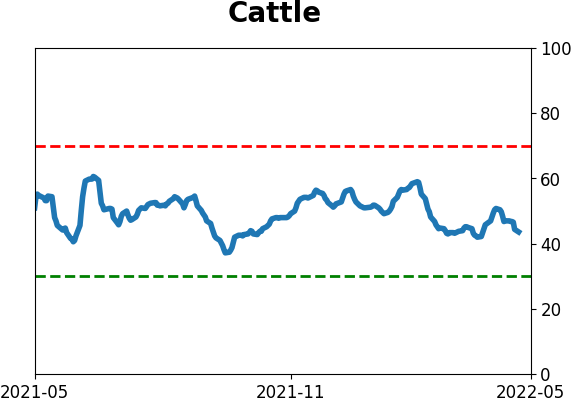
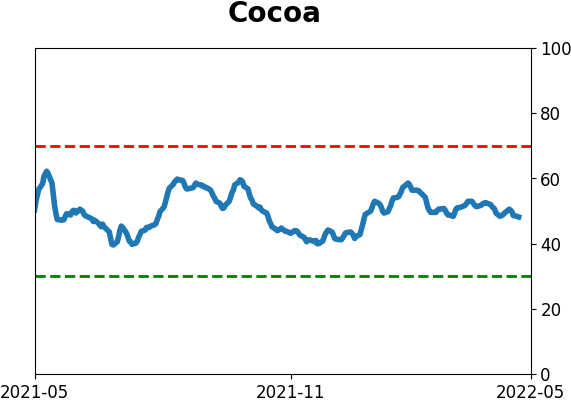
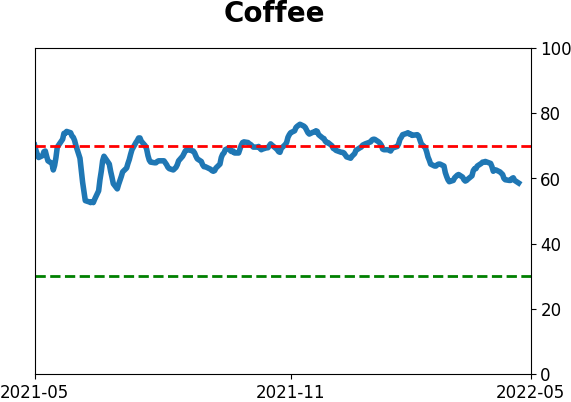
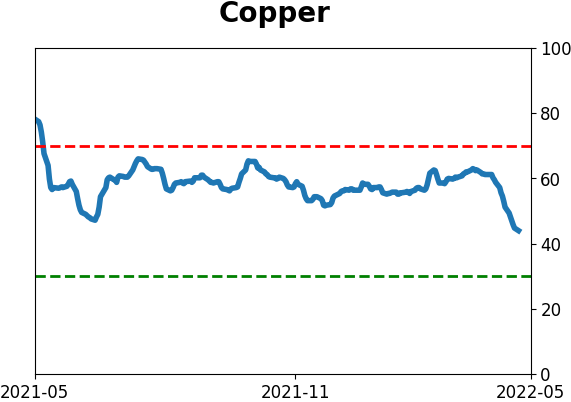
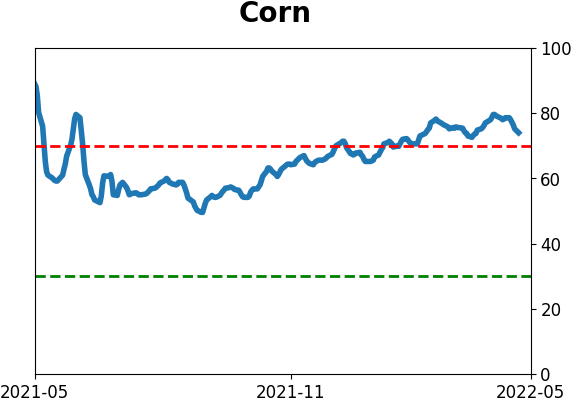
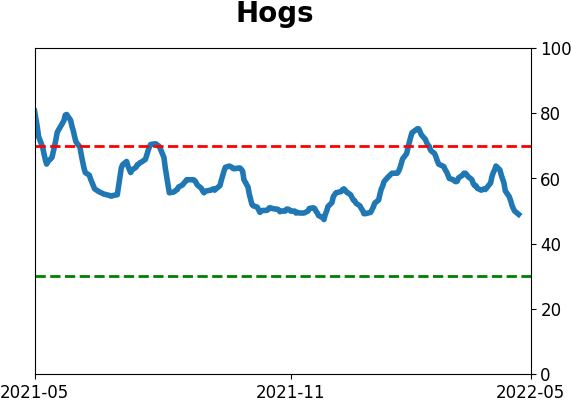
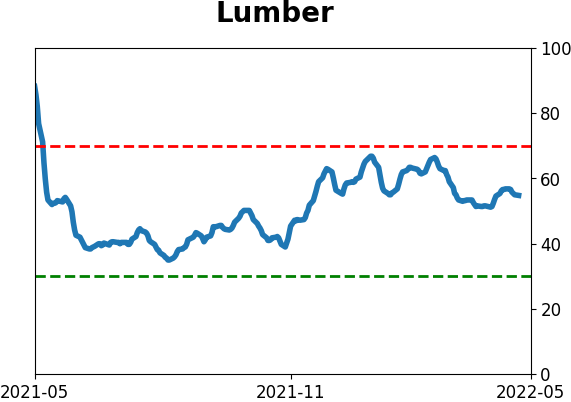
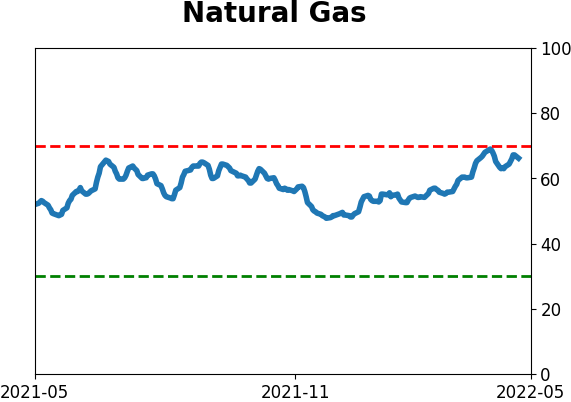
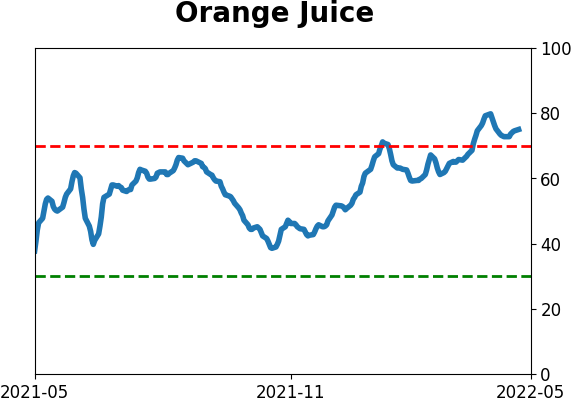
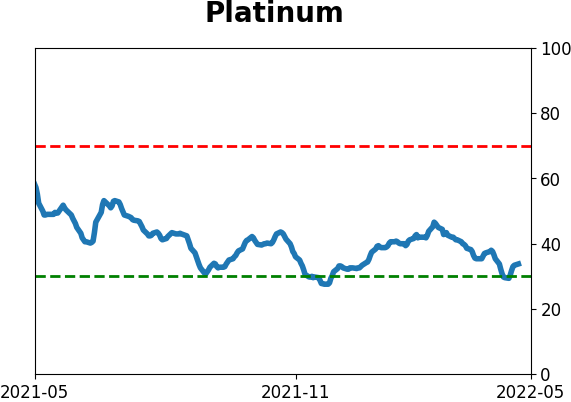
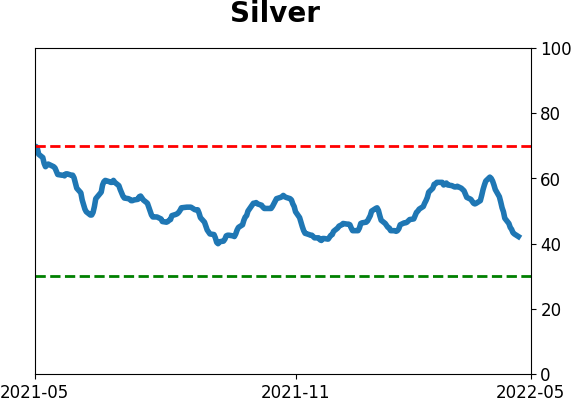
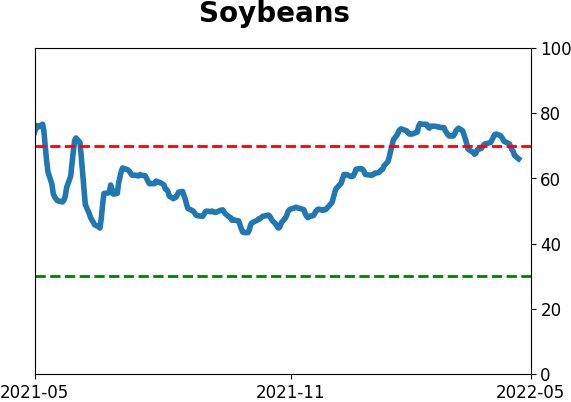
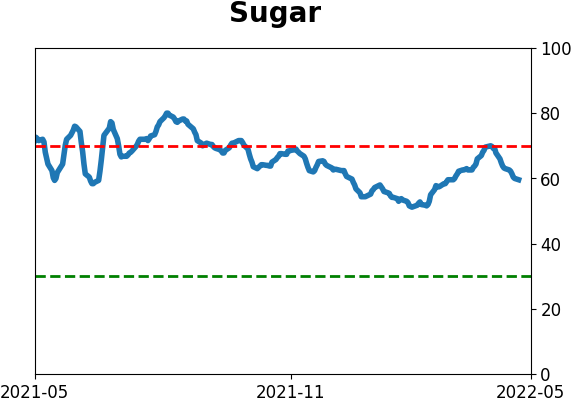
Commodity ETF's - 5-Day Moving Average
|
|