Headlines
|
|
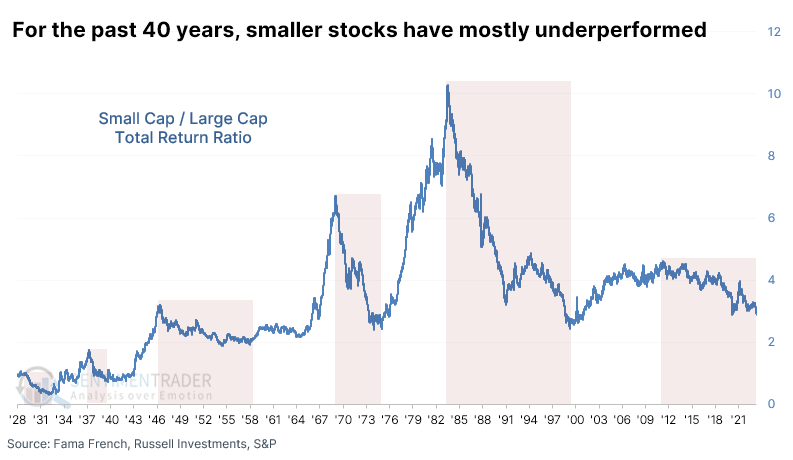
Small Cap stocks plunge to a new relative low:
The stock market this year has been characterized by some sectors and factors plunging while others take up the slack. One of the former is Small Cap stocks, which just hit a new multi-year low relative to Large Caps. Similar behavior proved to be a major warning for stocks in general only once in nearly 100 years.
|
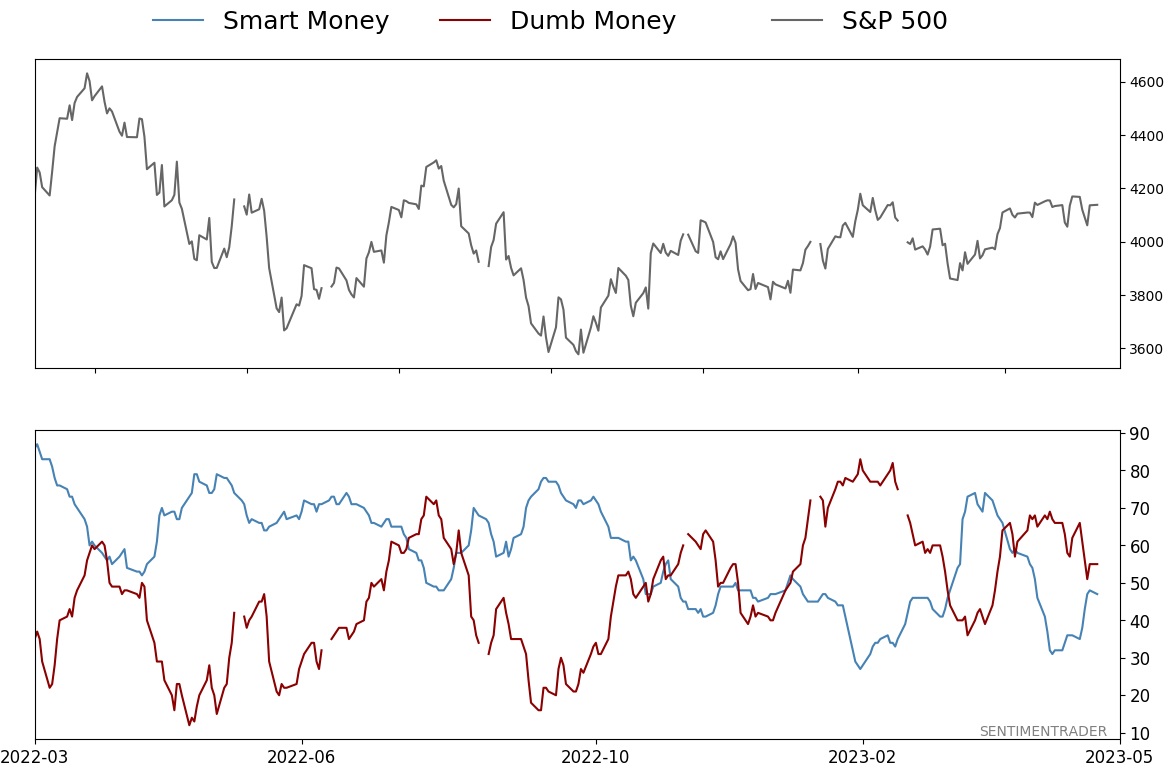
Smart / Dumb Money Confidence
|
Smart Money Confidence: 47%
Dumb Money Confidence: 55%
|
|
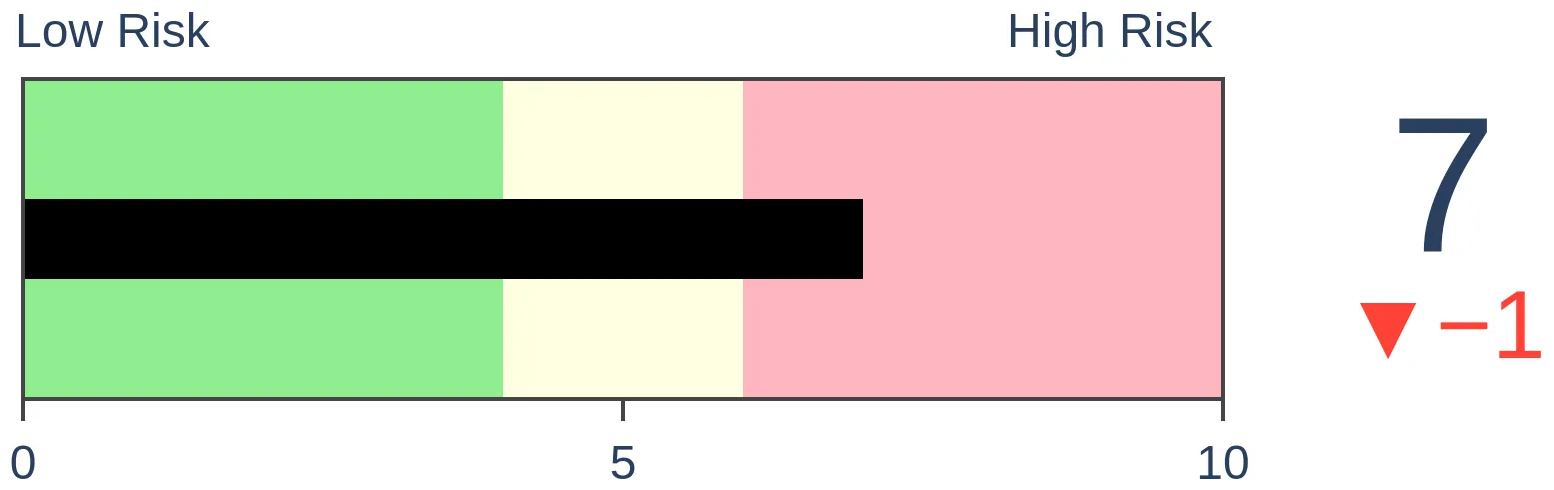
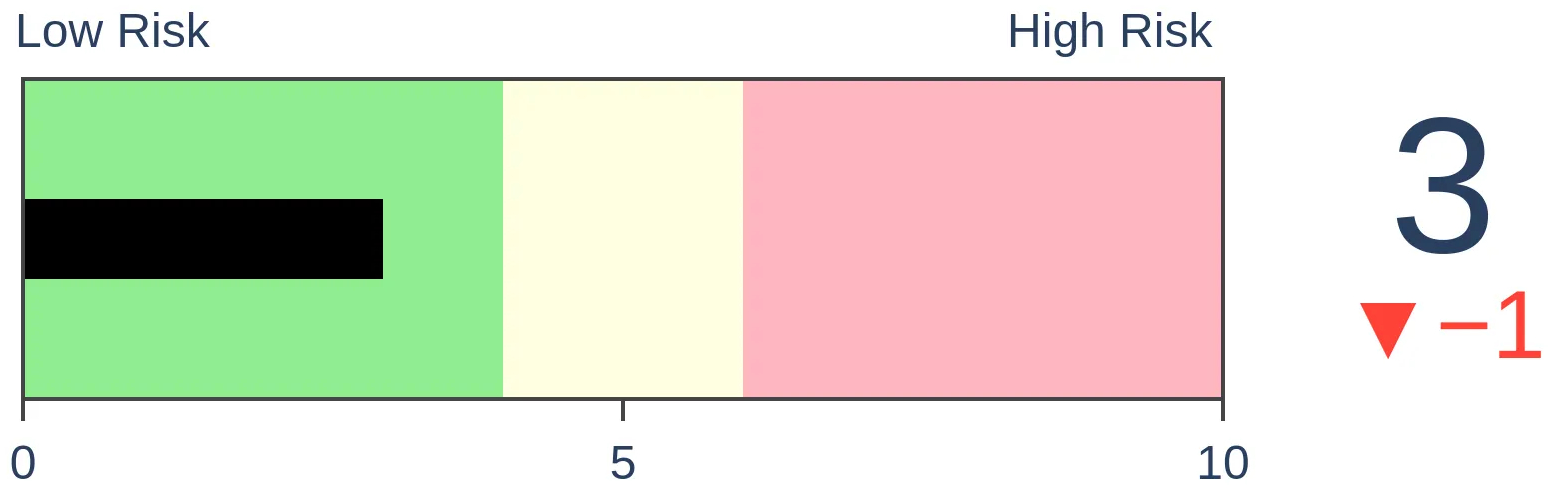
Risk Levels
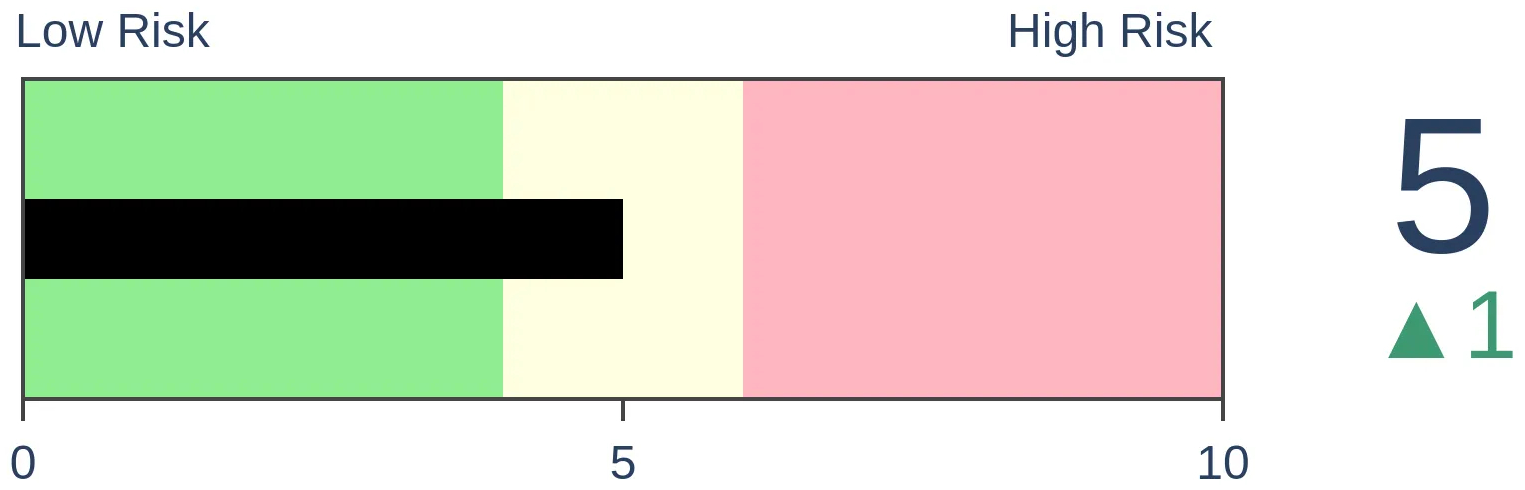
Stocks Short-Term
|
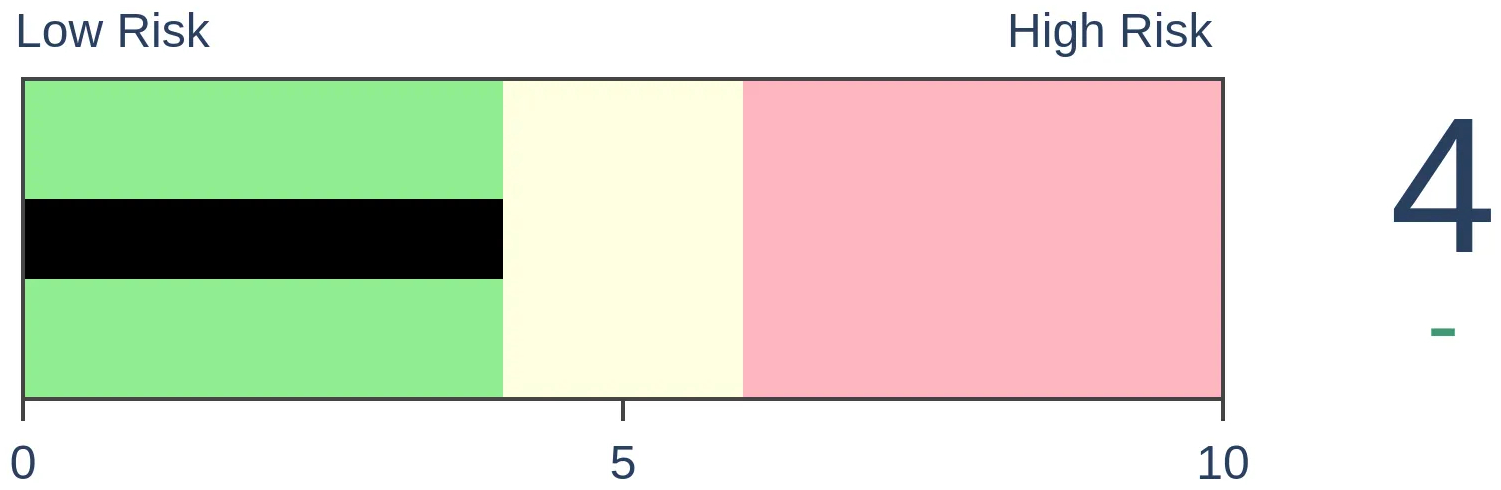
Stocks Medium-Term

|
|
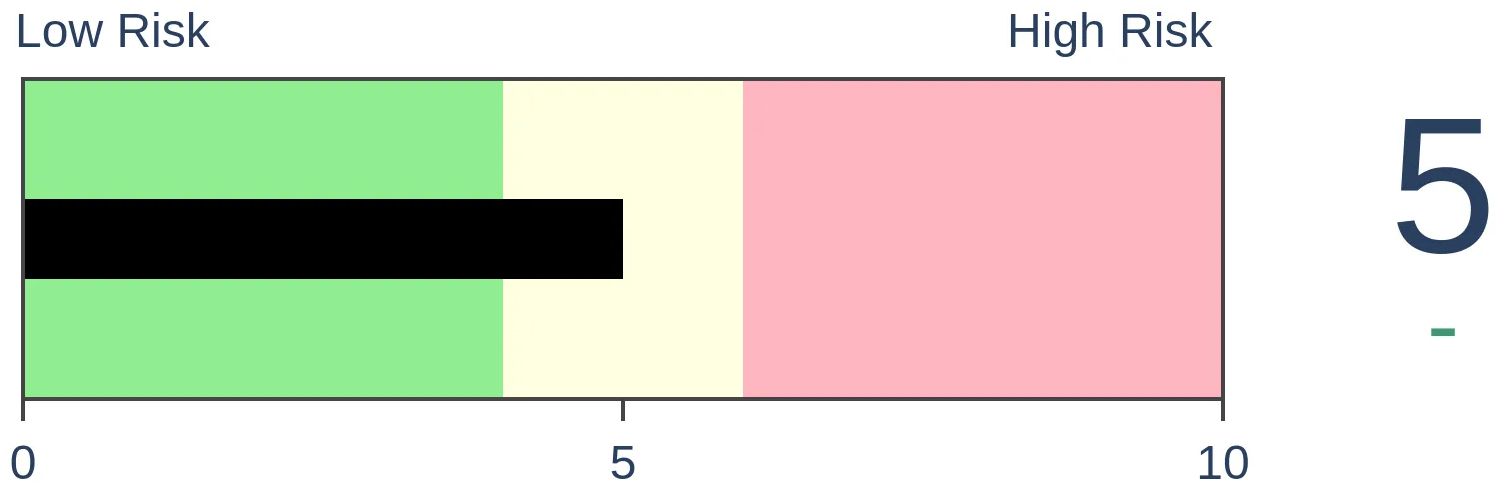
Bonds
|
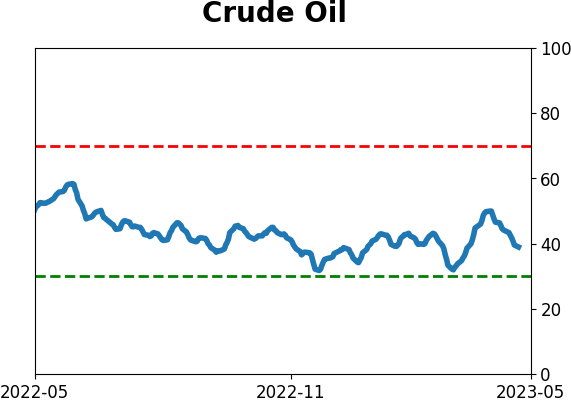
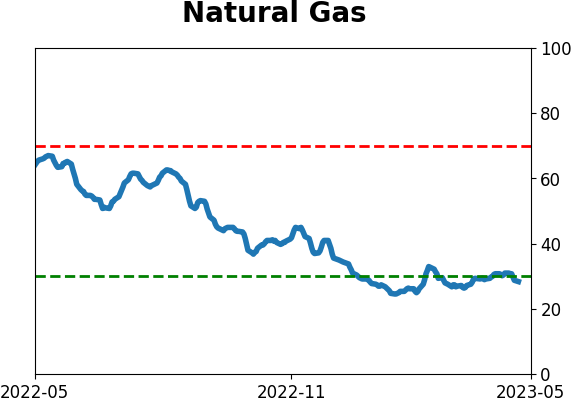
Crude Oil
|
|
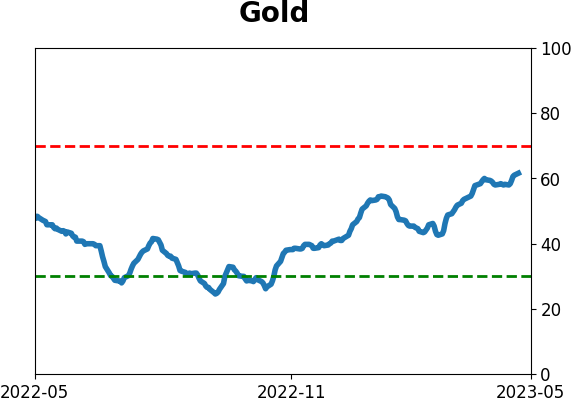
Gold
|
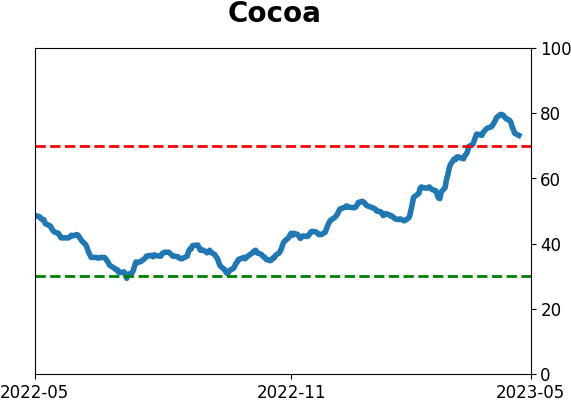
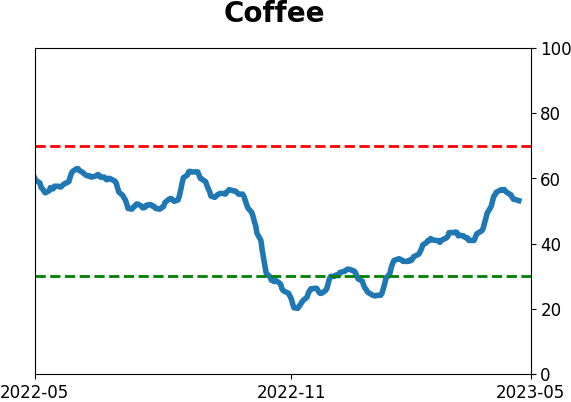
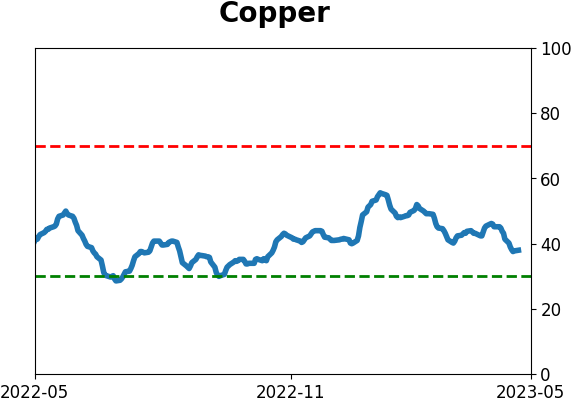
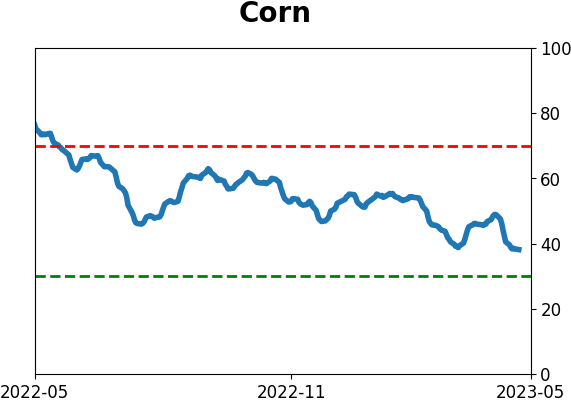
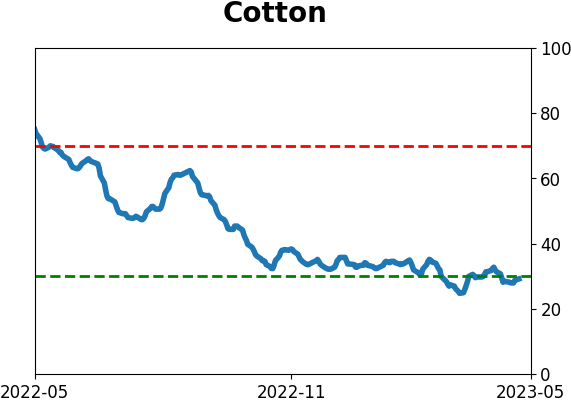
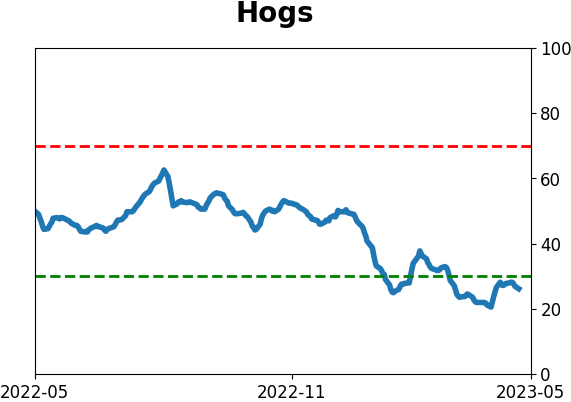
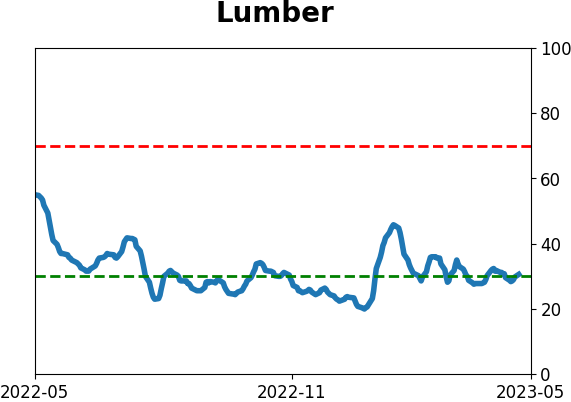
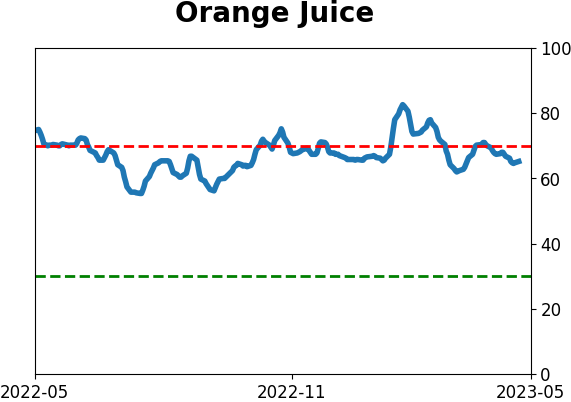
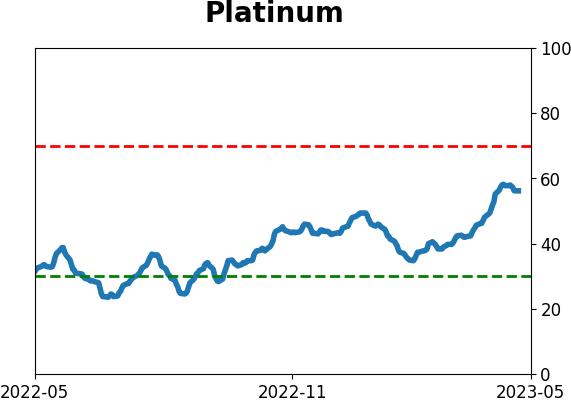
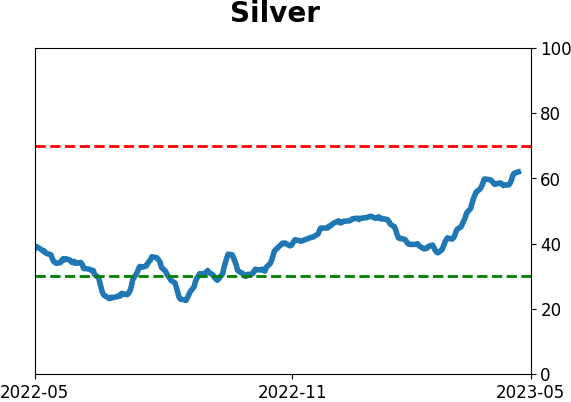
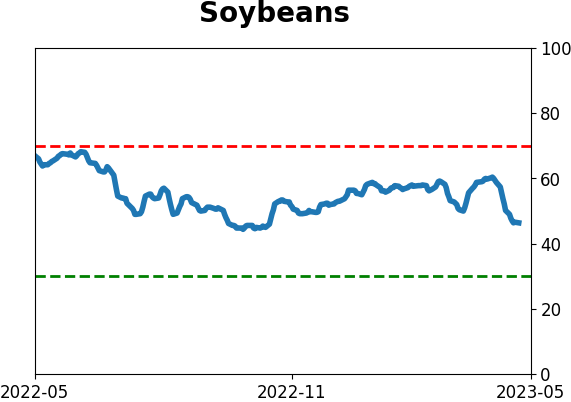
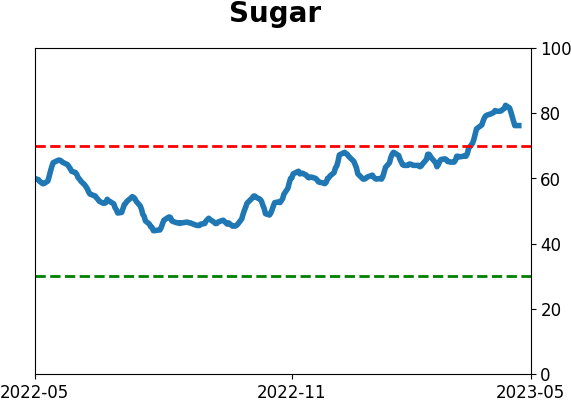
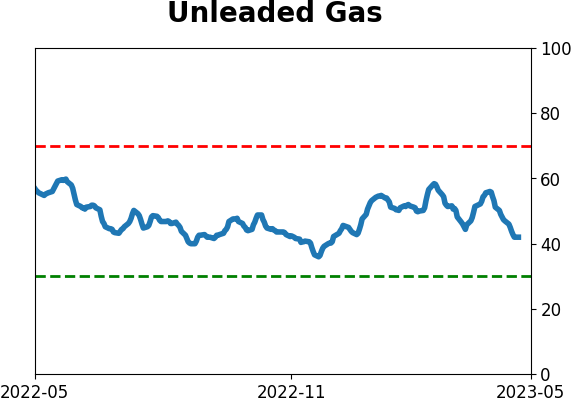
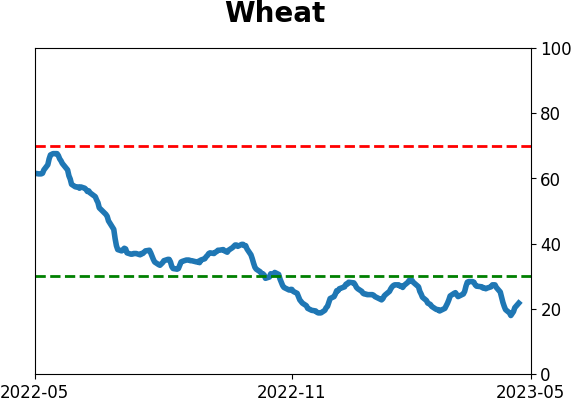
Agriculture
|
|
Research
By Jason Goepfert
BOTTOM LINE
The stock market this year has been characterized by some sectors and factors plunging while others take up the slack. One of the former is Small Cap stocks, which just hit a new multi-year low relative to Large Caps. Similar behavior proved to be a major warning for stocks in general only once in nearly 100 years.
FORECAST / TIMEFRAME
None
|
Key points:
- A ratio of Small Cap to Large Cap stocks has tumbled to a multi-year low
- Going back nearly 100 years, a new relatively low in this ratio preceded a major S&P 500 decline only once
- After similar behavior, Large Cap stocks tended to hold up better
Small stocks have not been a good place to hide
It's been a tough few years for small stocks relative to their bigger brothers. And it's only getting worse.
The ratio between the total return in Small Cap stocks recently fell to a multi-year low relative to Large Cap stocks. With the tumble over the last couple of months, the ratio is back down to where it was during the pandemic panic.
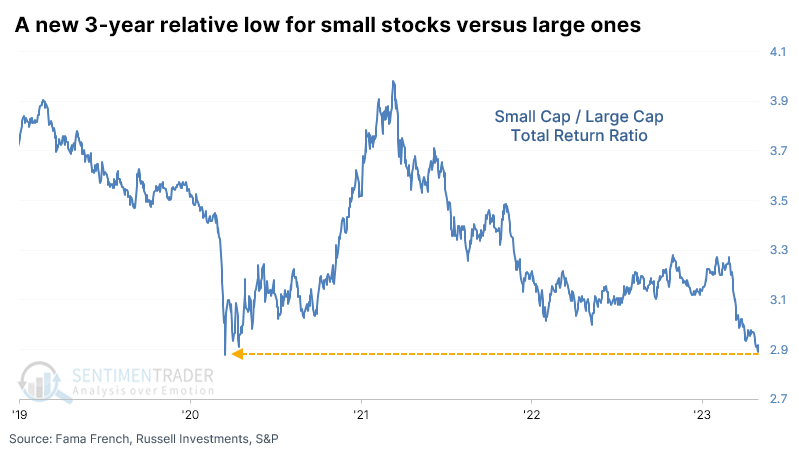
This isn't a new phenomenon. For most of the last 40 years, smaller stocks have suffered (relatively). Before the early 1980s, it was the opposite. While the ratio went through some downturns, the overall trend from 1928-1982 favored smaller stocks over large ones. Since then, larger stocks have mostly outperformed.
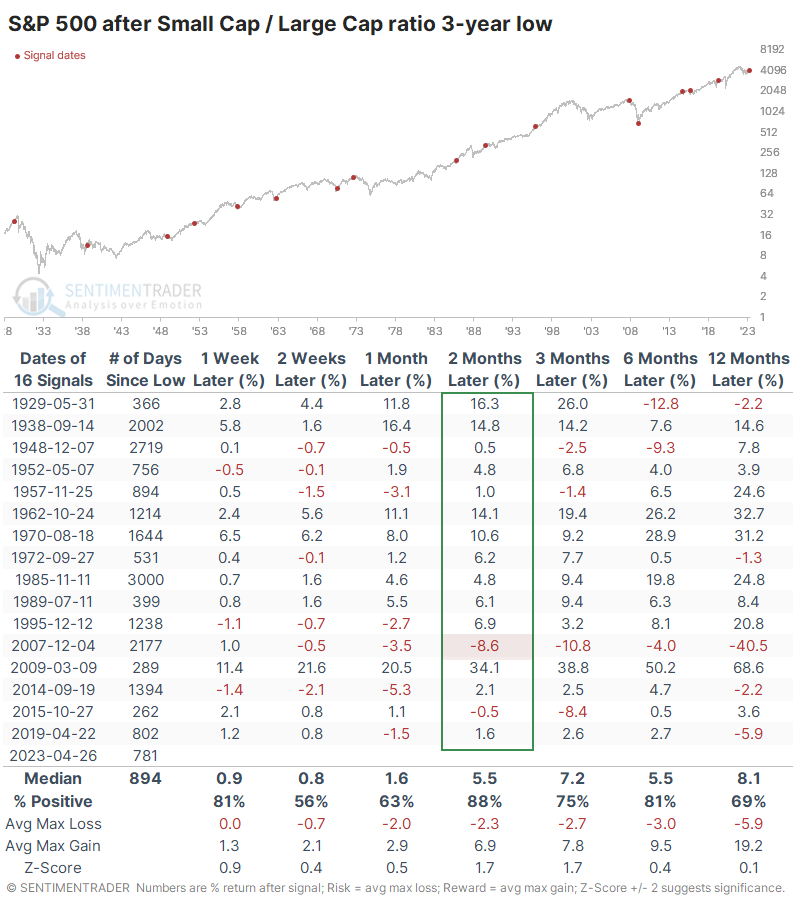
Using a new relative low as a sell signal
When small stocks hit a new relative low, it's assumed to be a bad sign for stocks overall. Small Cap stocks are considered a bellwether for the domestic economy and investors' risk appetite.
But if we use this as a sell signal for the most benchmarked equity index in the world, it wasn't very good. Over the next two months, there was essentially only a single date when it worked. Ahead of the 2008 financial crisis, small stocks fell to a new relative low against large stocks, which was a great sign to exit the market. It was also essentially the only successful sell signal up to a year later, though a few signals went on to losses afterward.
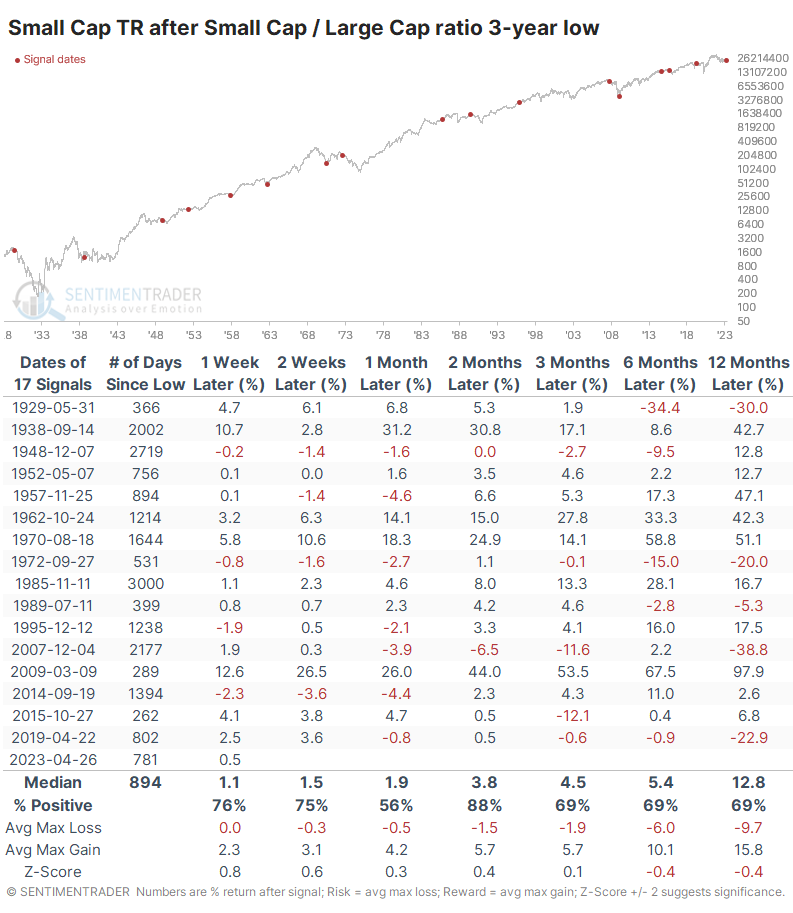
For Small Cap stocks, it proved to be a non-worry, at least for a while. Two months later, the total return on Small Caps was positive after 15 of 17 signals, though over the next year, they suffered four declines greater than -20%.
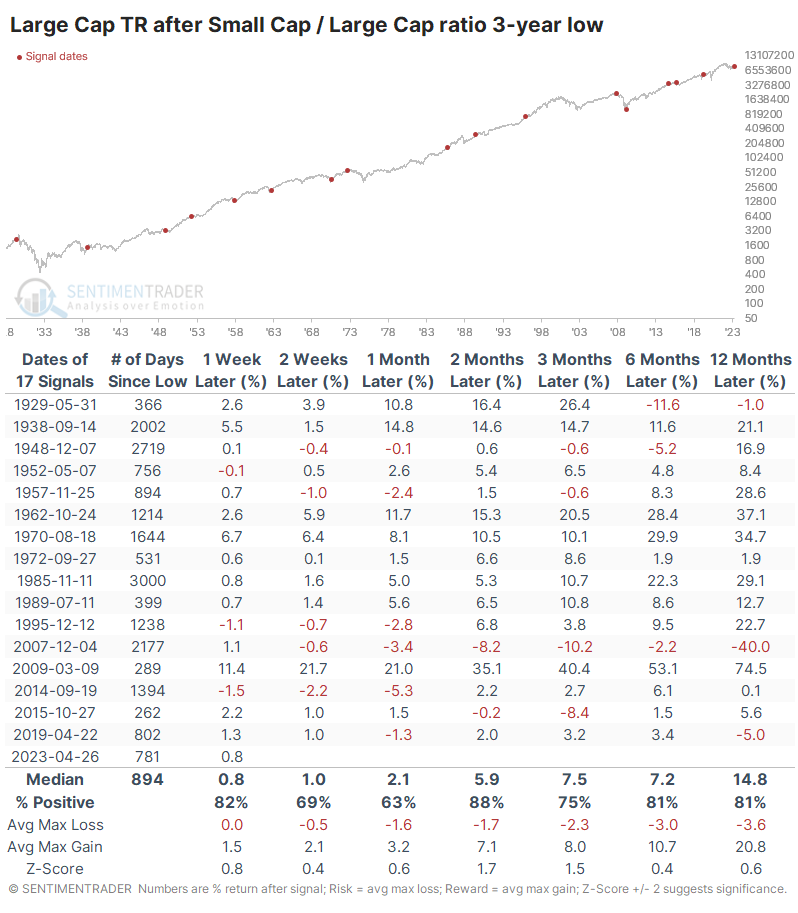
Large Cap stocks held up significantly better. Across most time frames, their total return outpaced that of Small Caps, with less risk and greater potential reward. Over the next year, there was only a single loss greater than -5%.
What the research tells us...
Unlike 2022, when pretty much everything moved lower in lockstep, this year has seen more variation among markets and sectors. The overall stock market has held up despite some parts plunging as others take up the slack. After a year like 2022, it's natural to focus on the negatives and see a boogeyman around every corner. While a relative lag in the performance of Small Cap stocks proved to be a valid warning sign in 2007, that was essentially the only time in nearly 100 years when it worked as a warning.
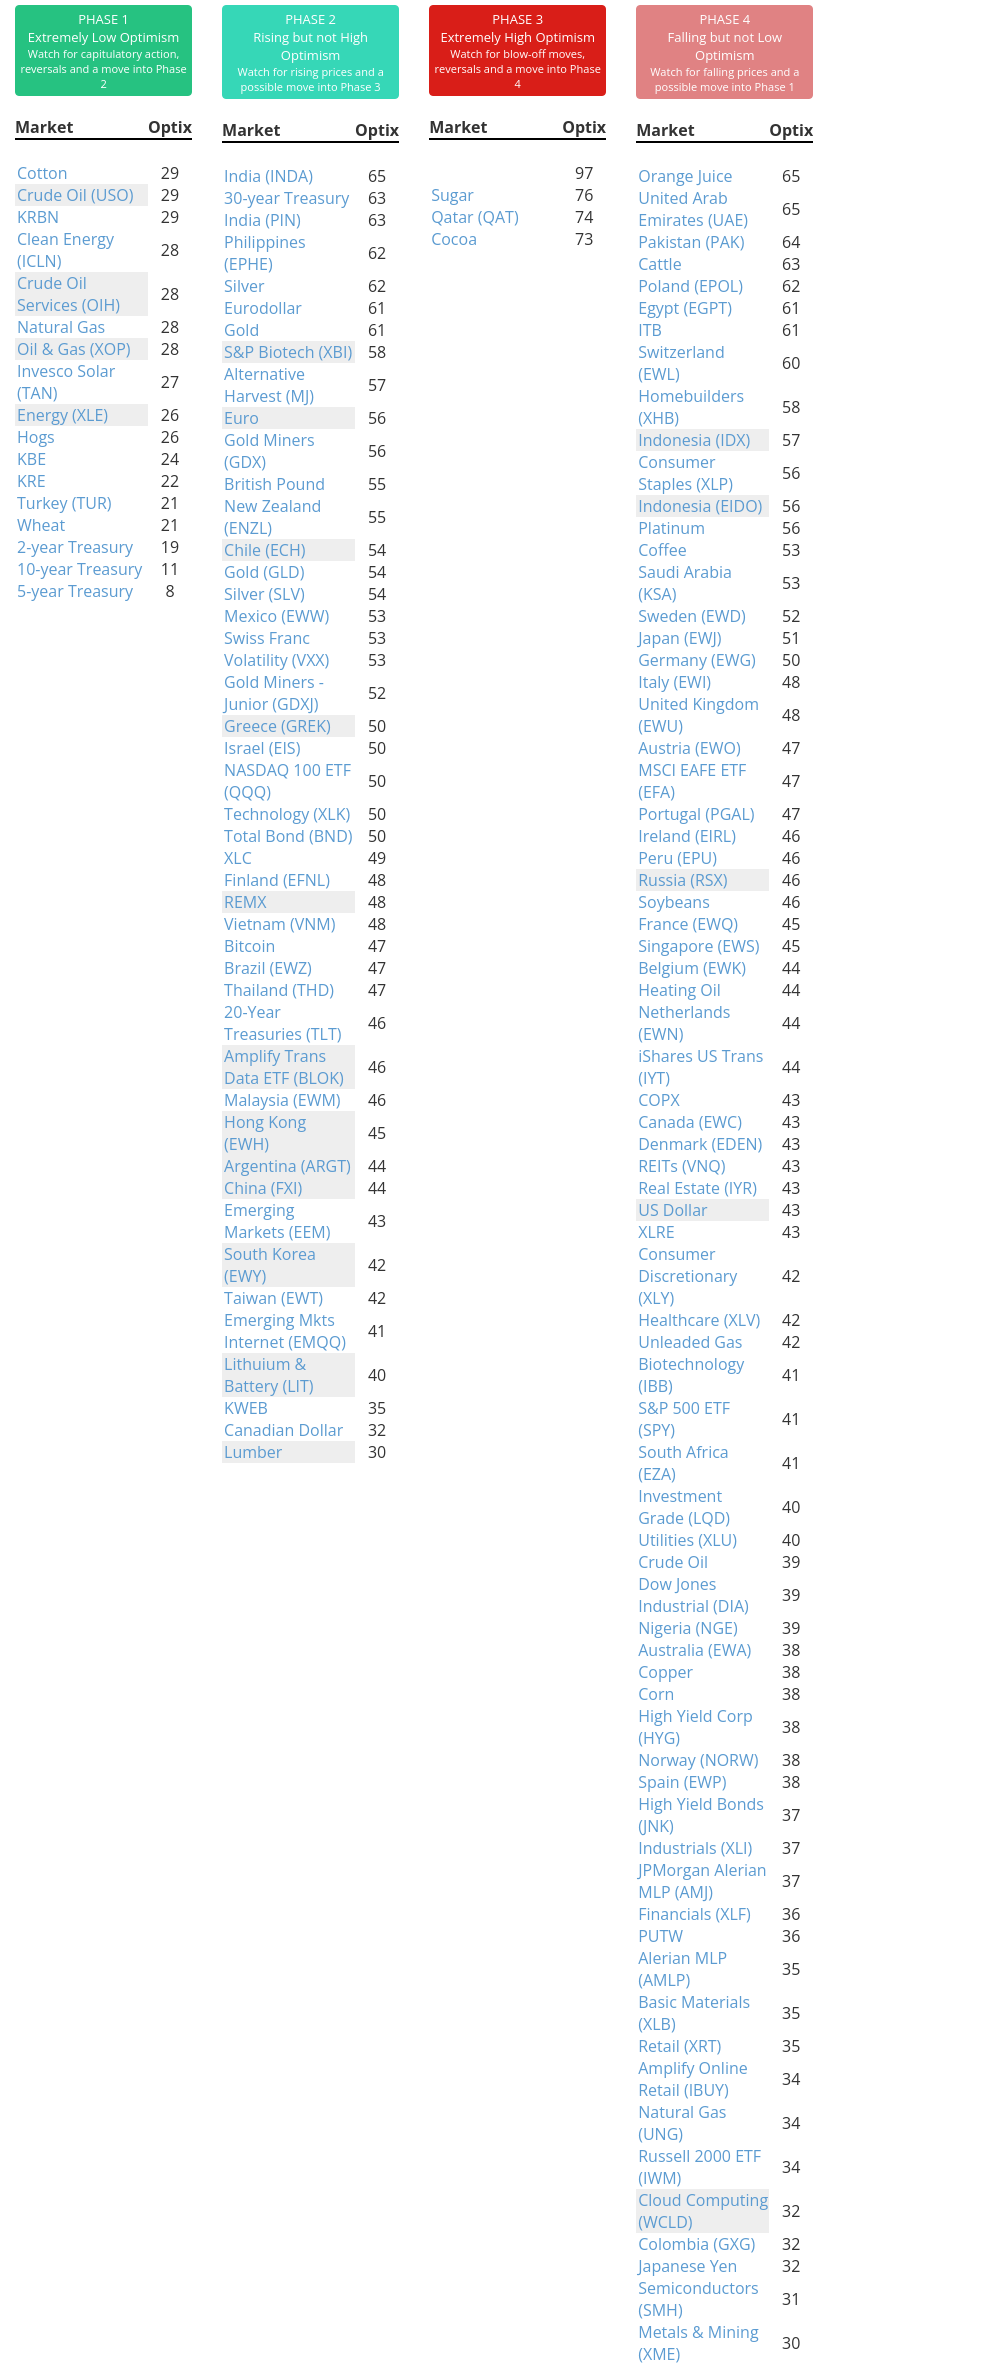
Indicators at Extremes
Phase Table
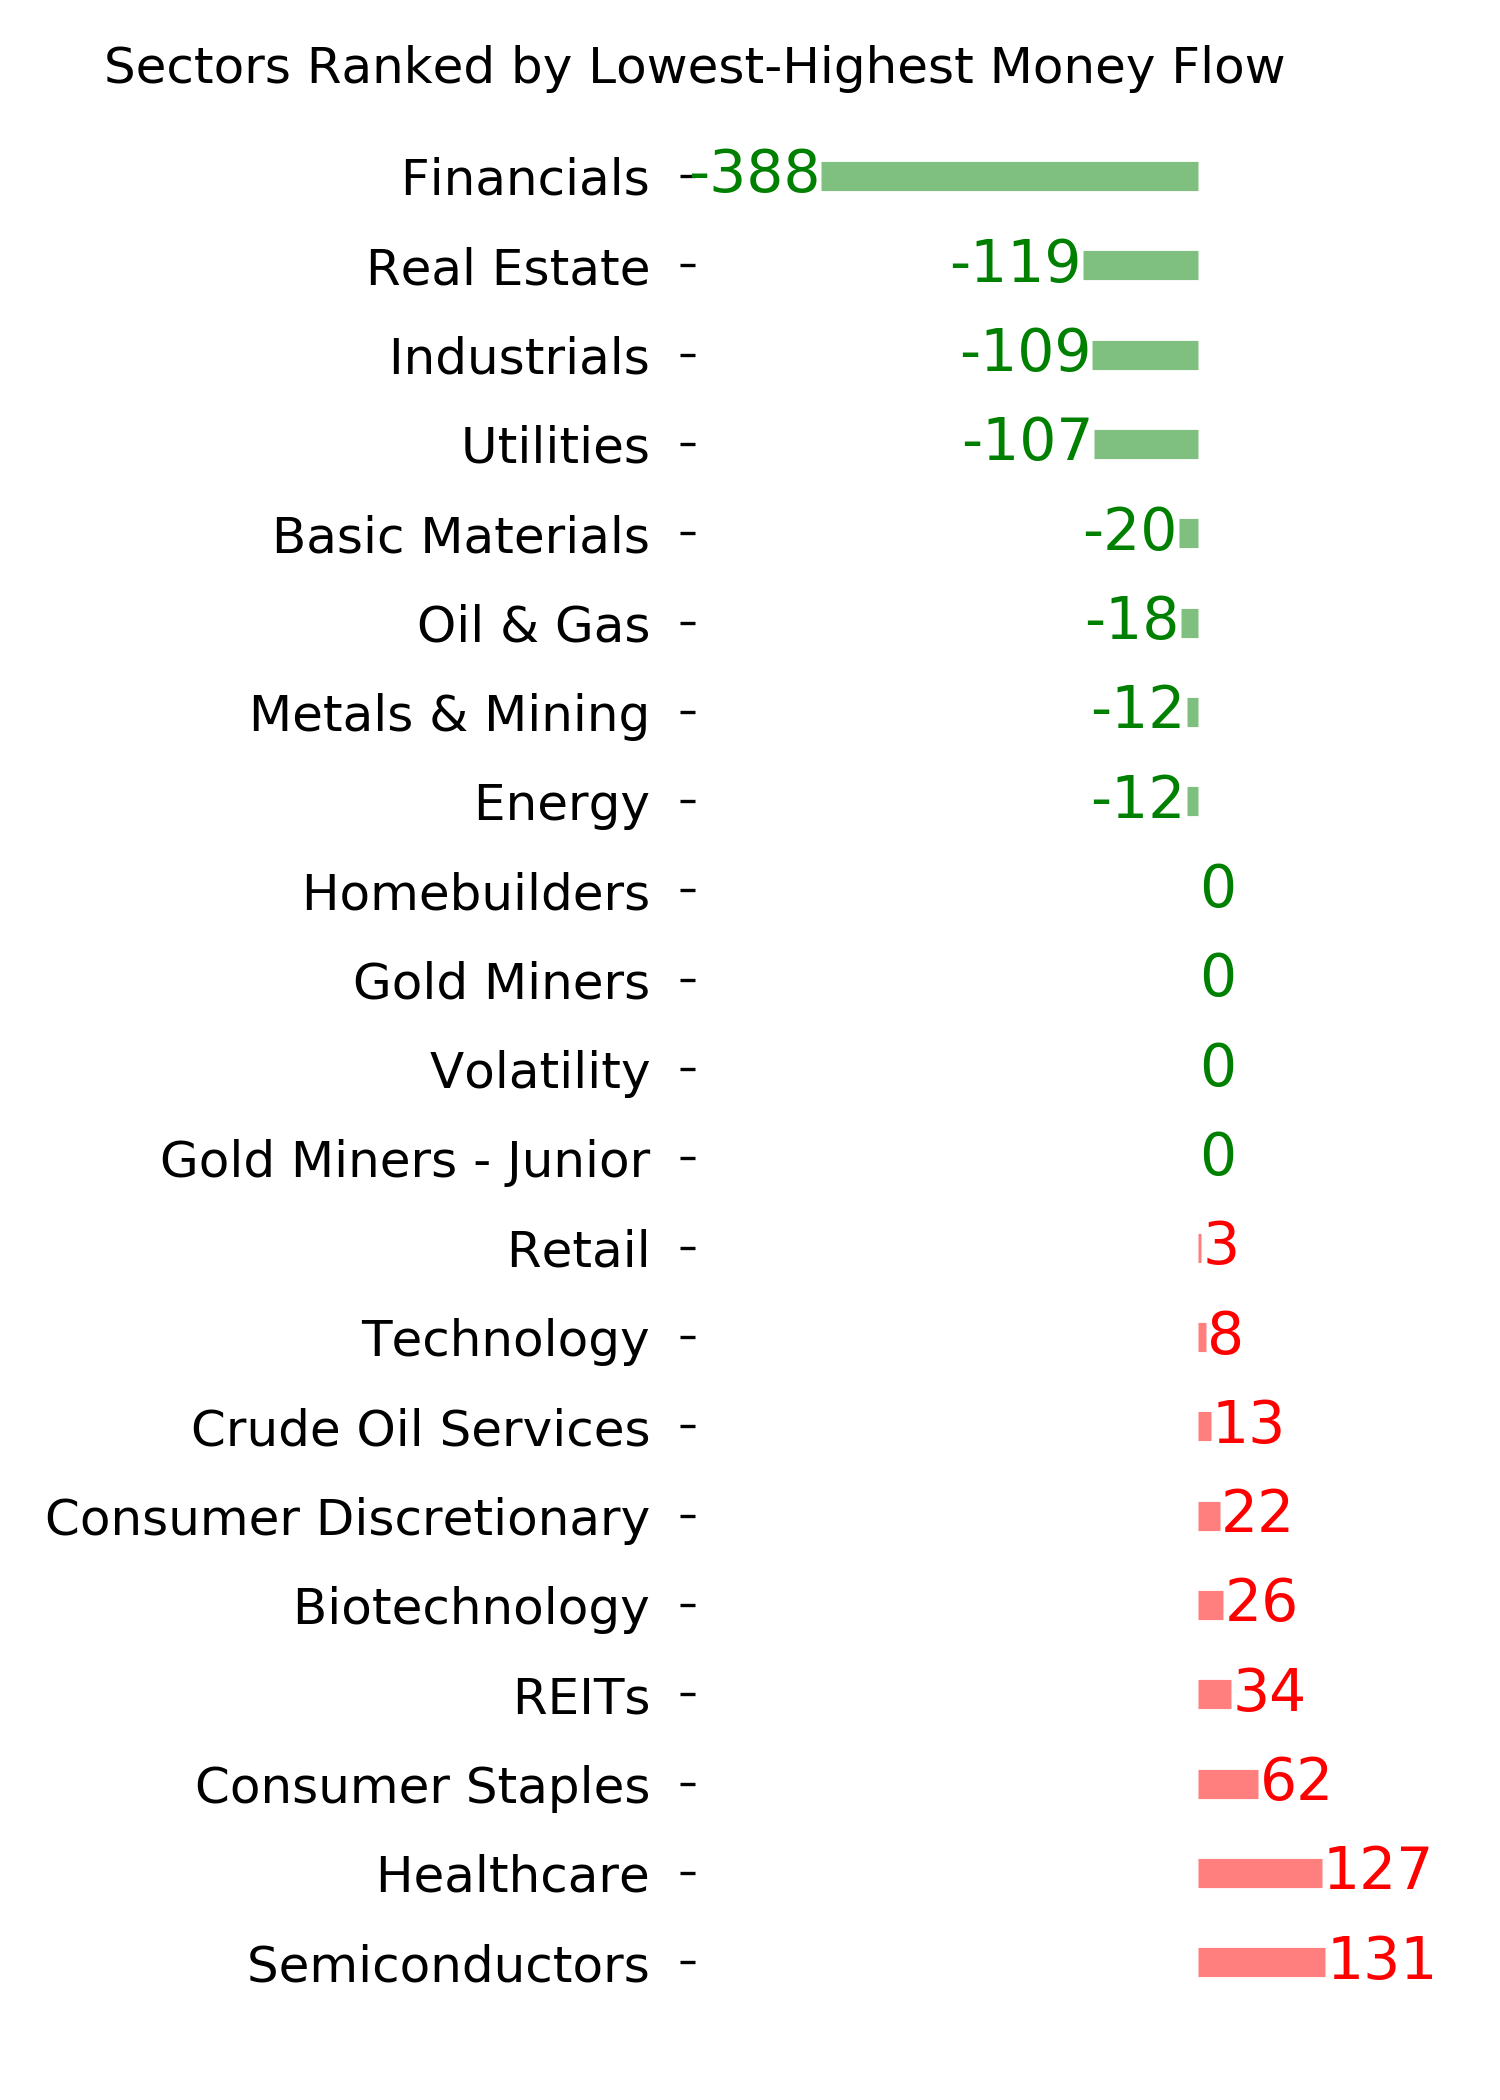
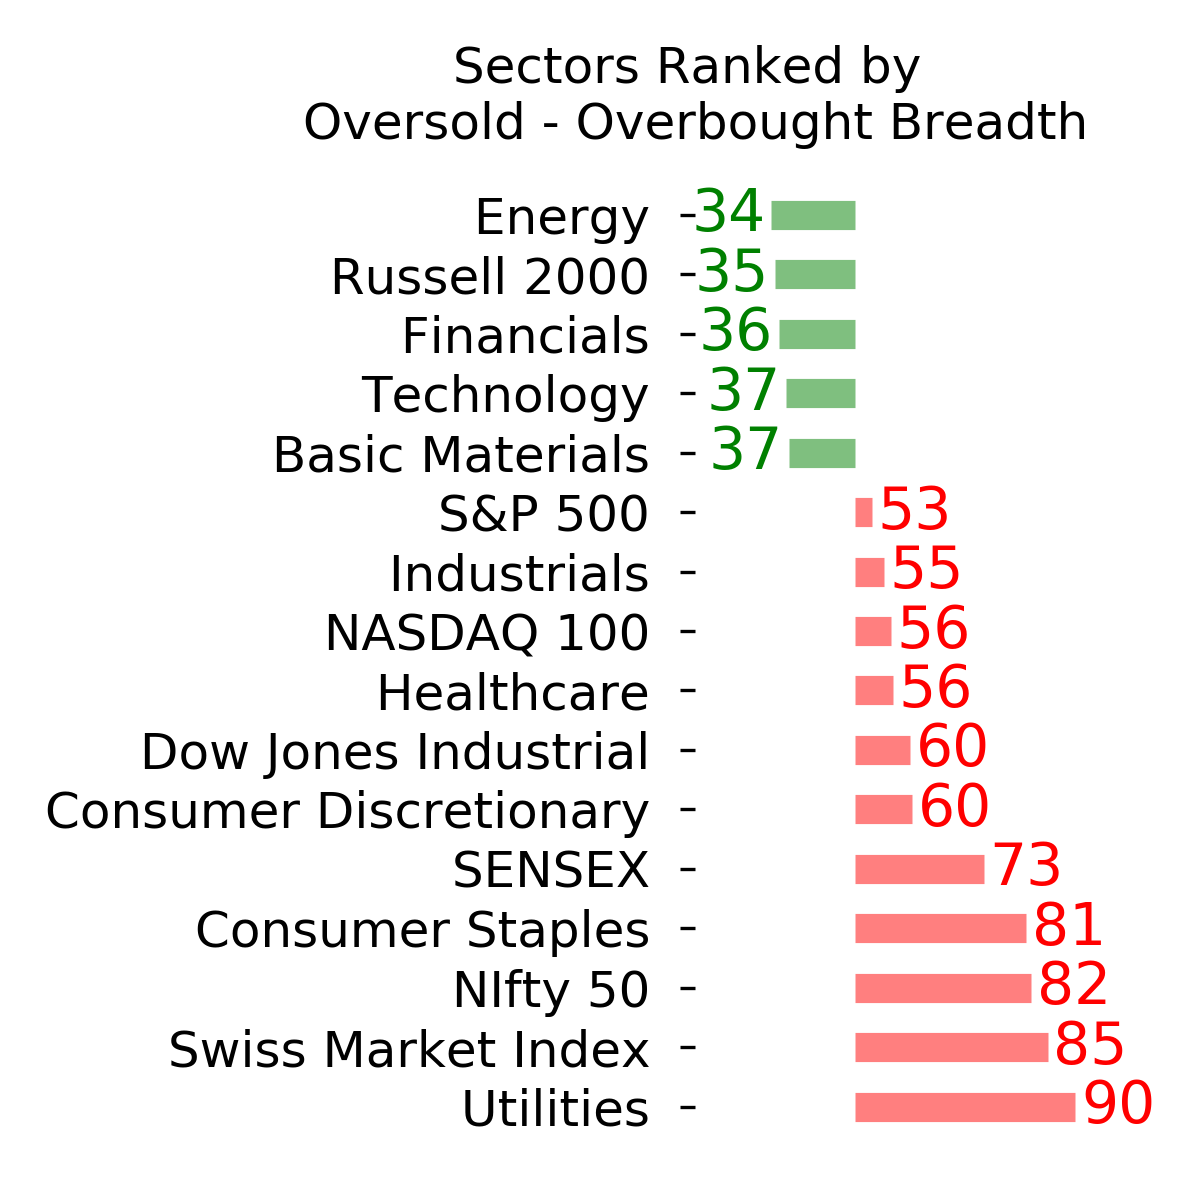
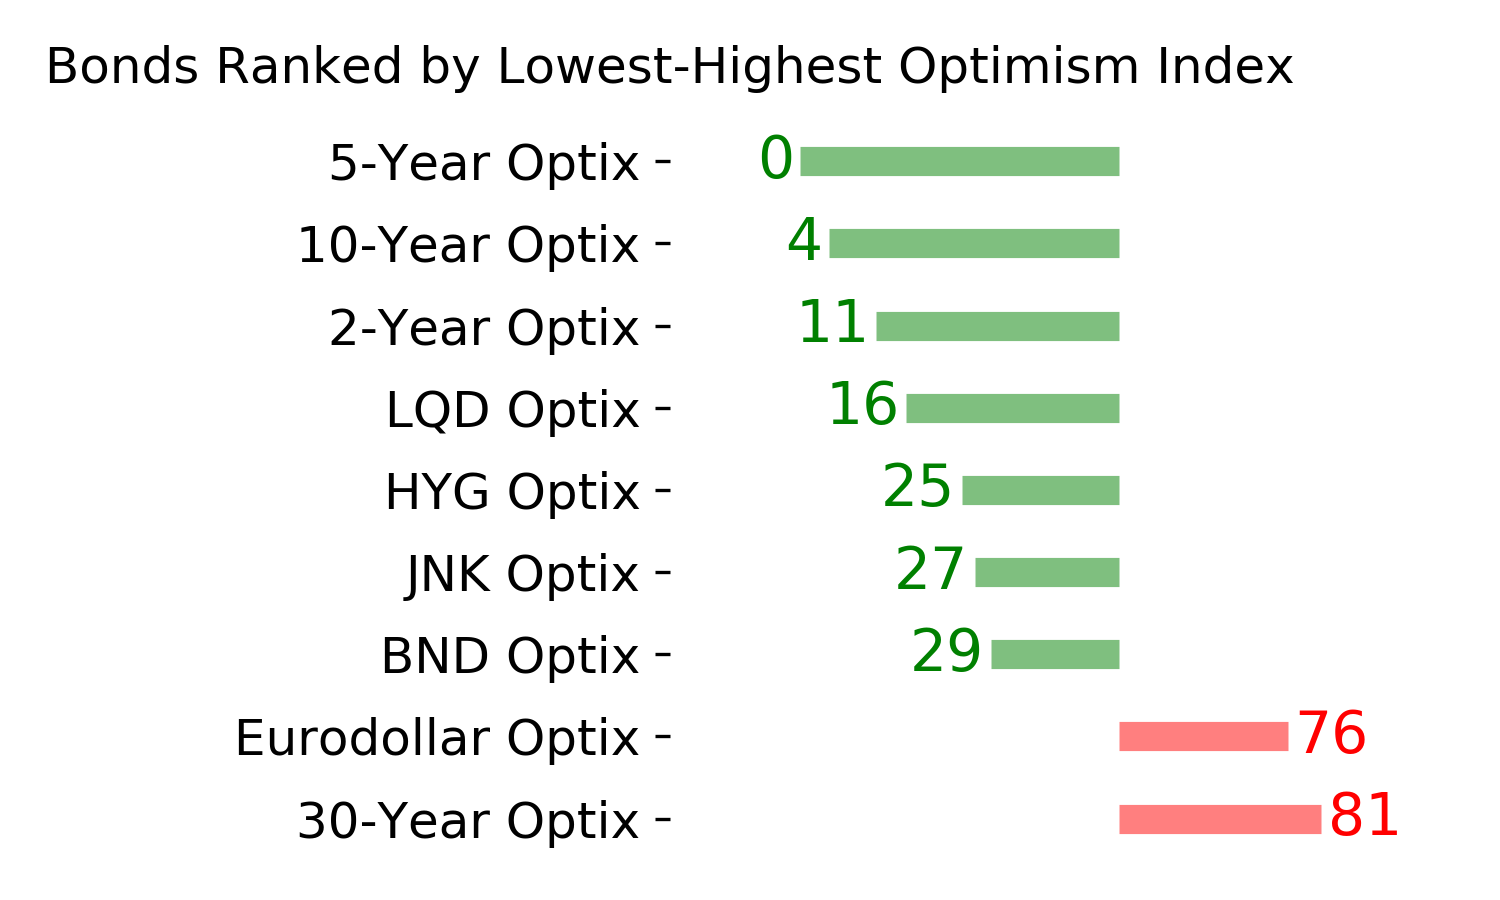
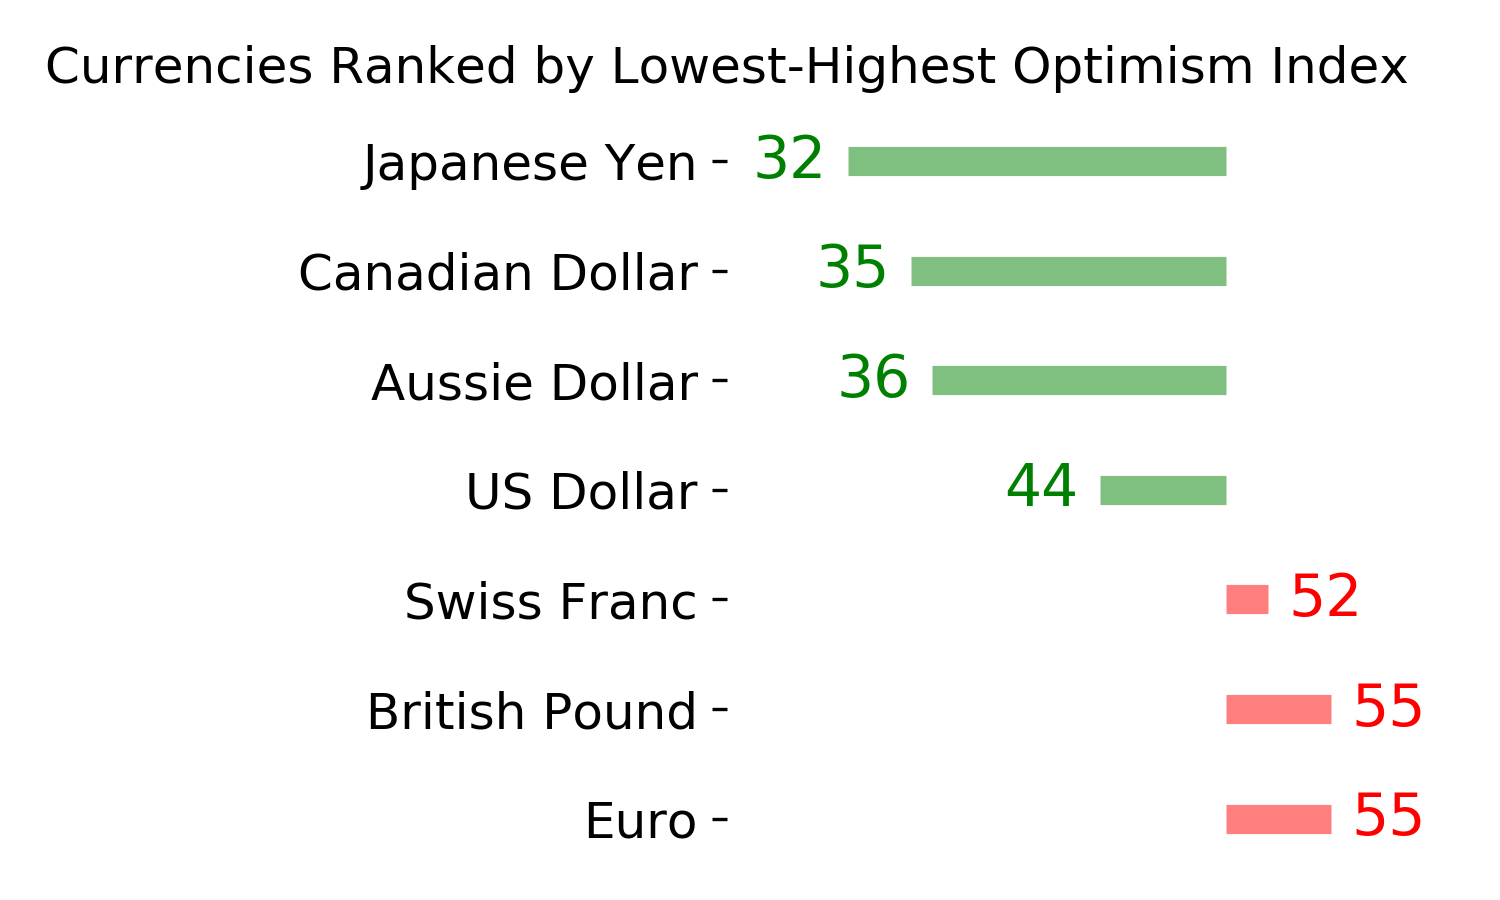
Ranks
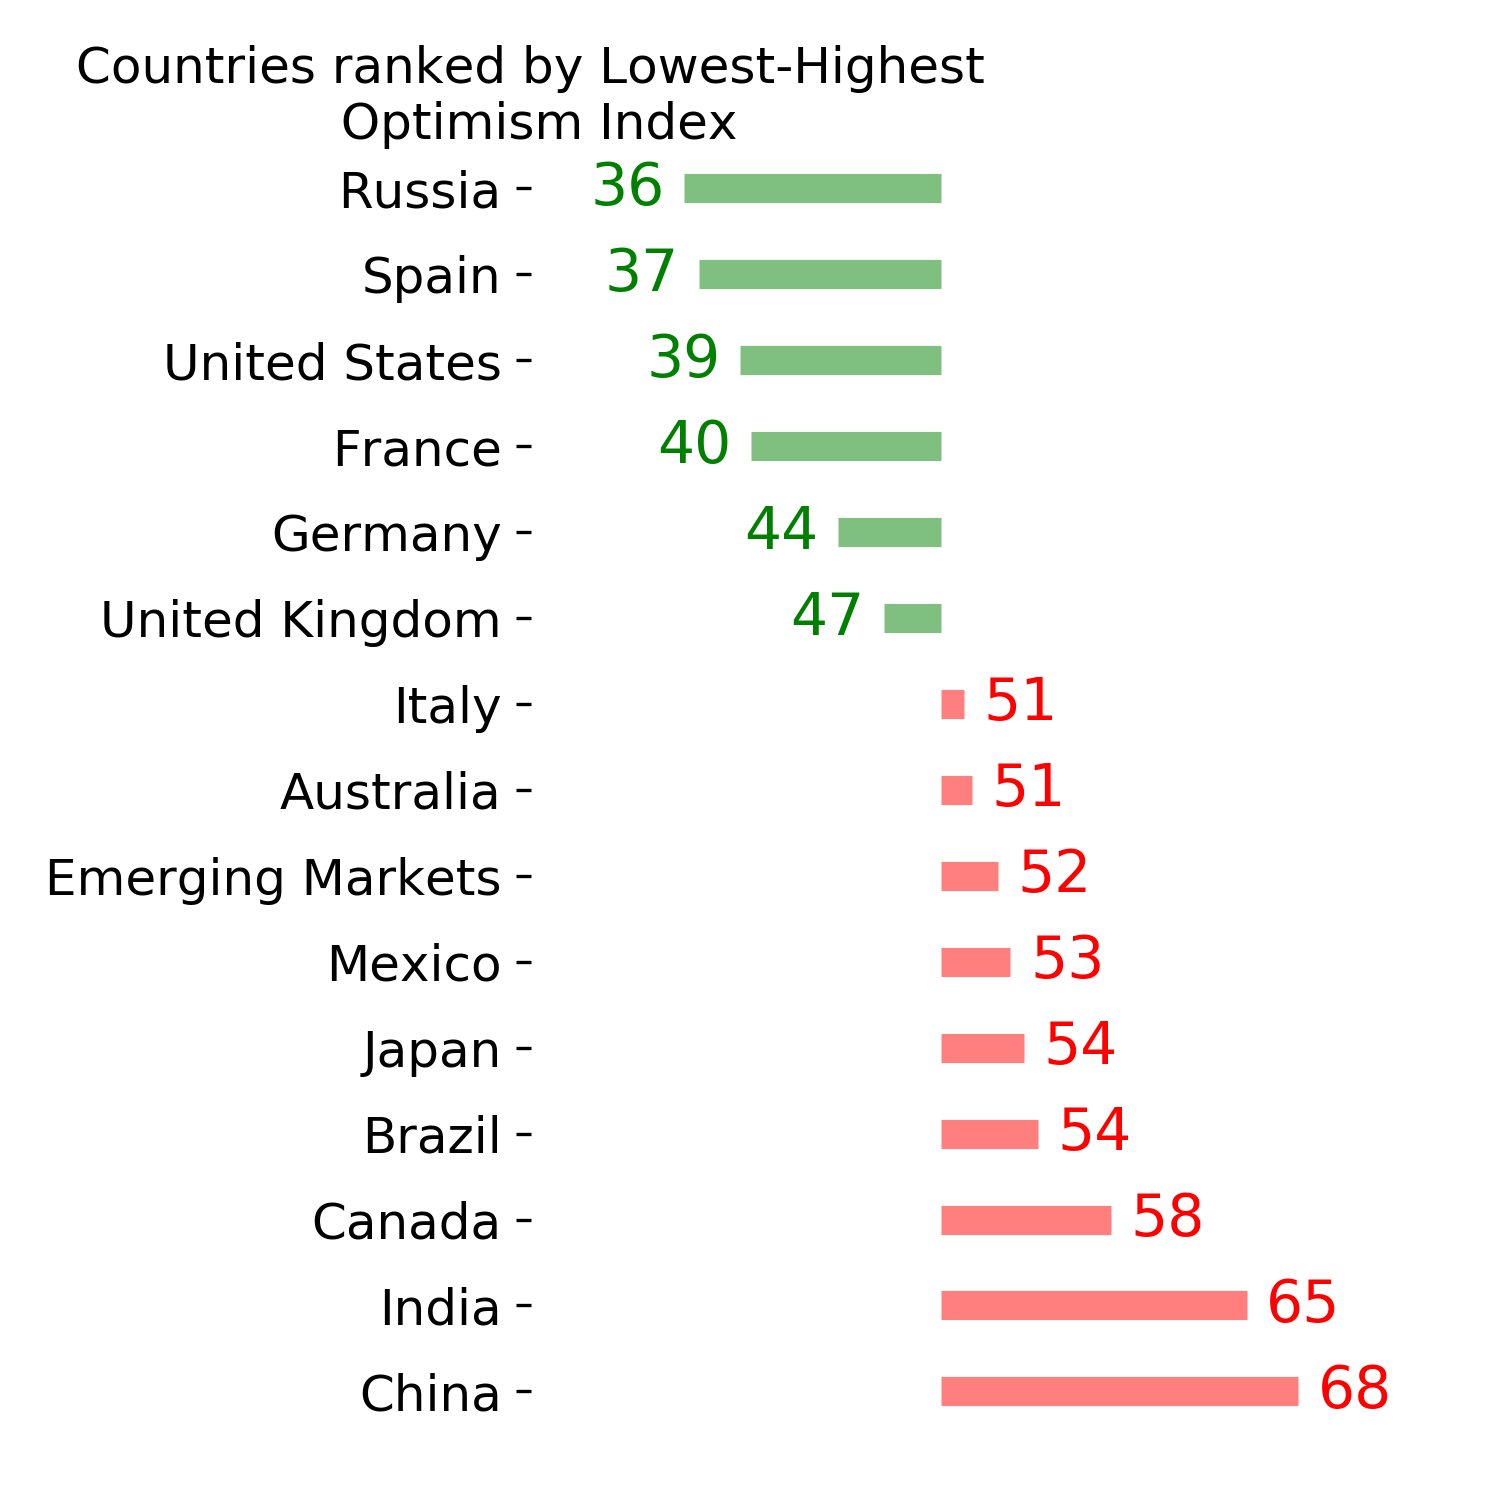
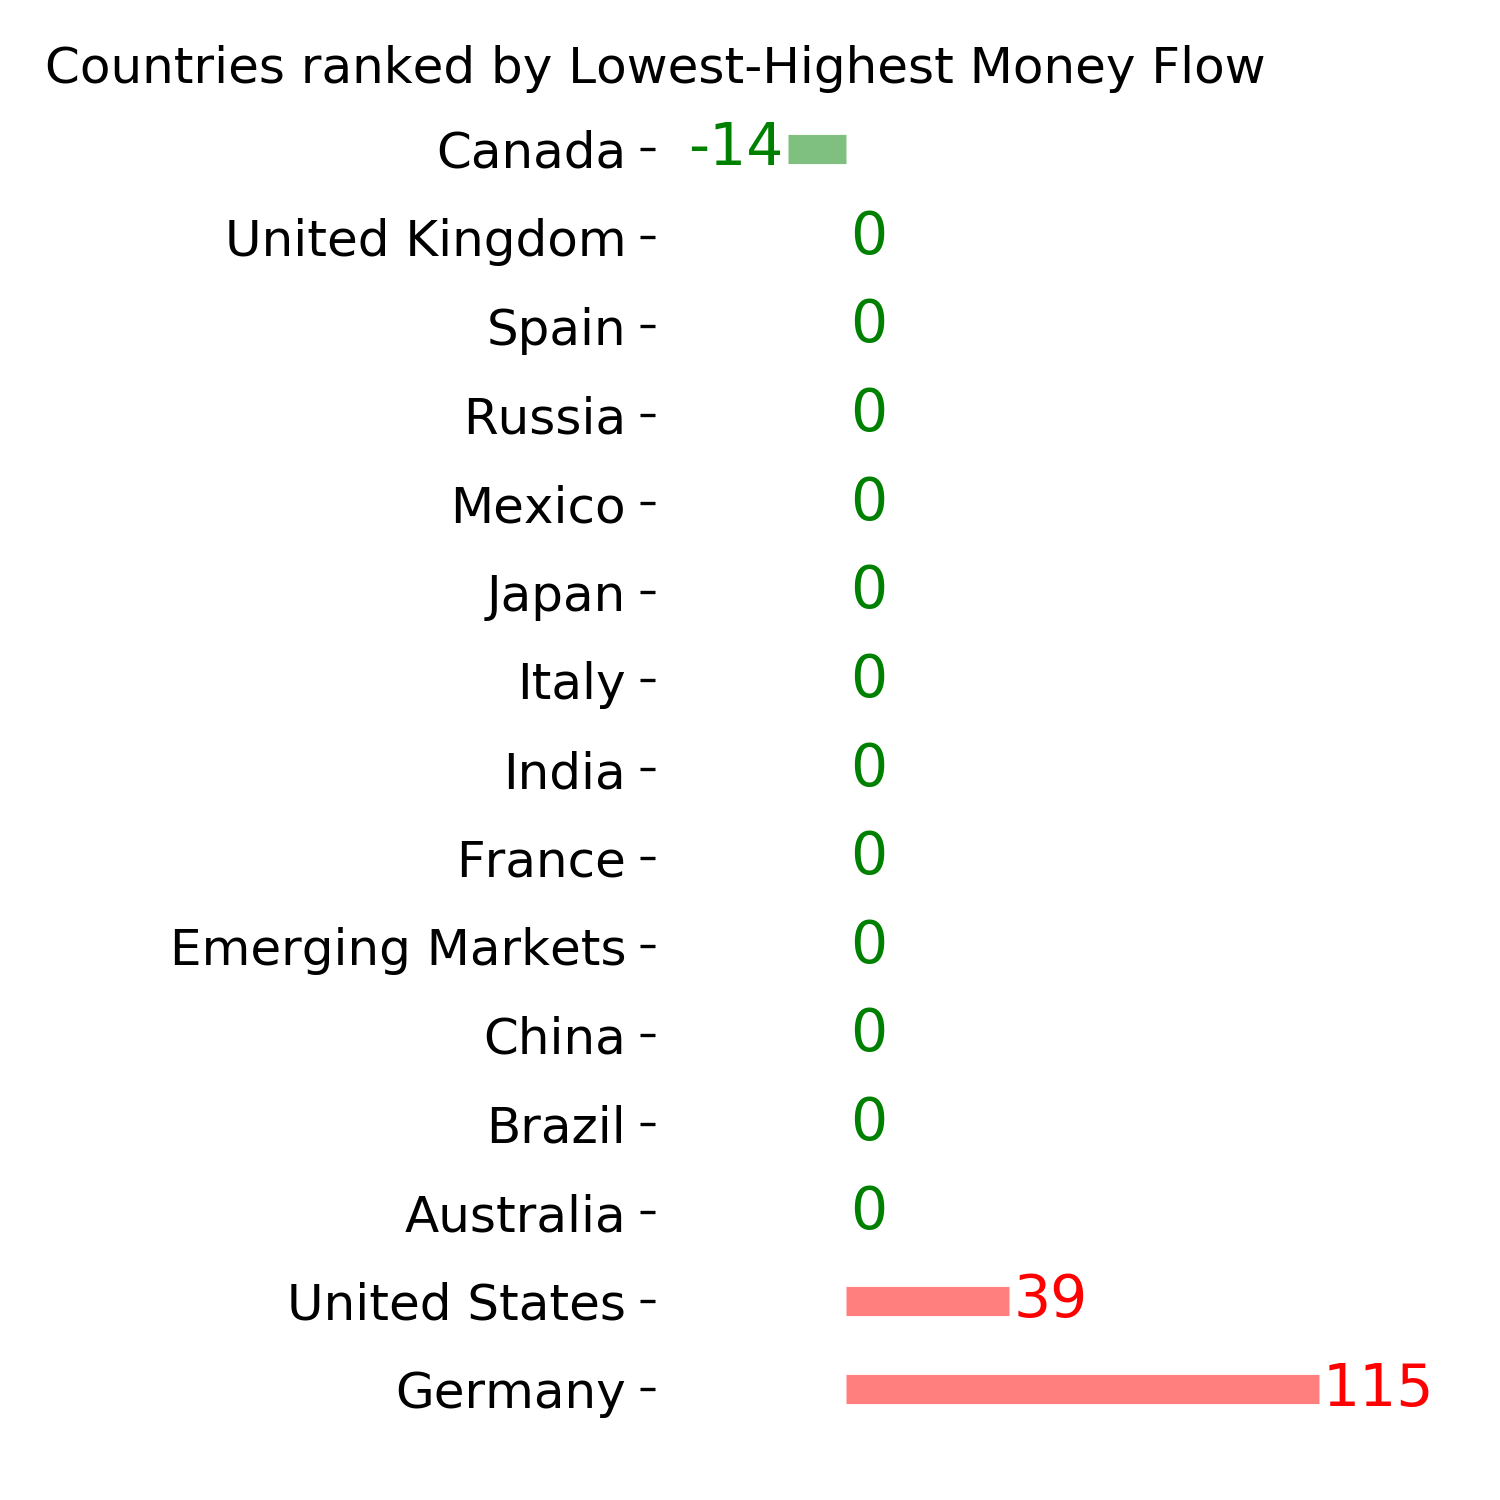
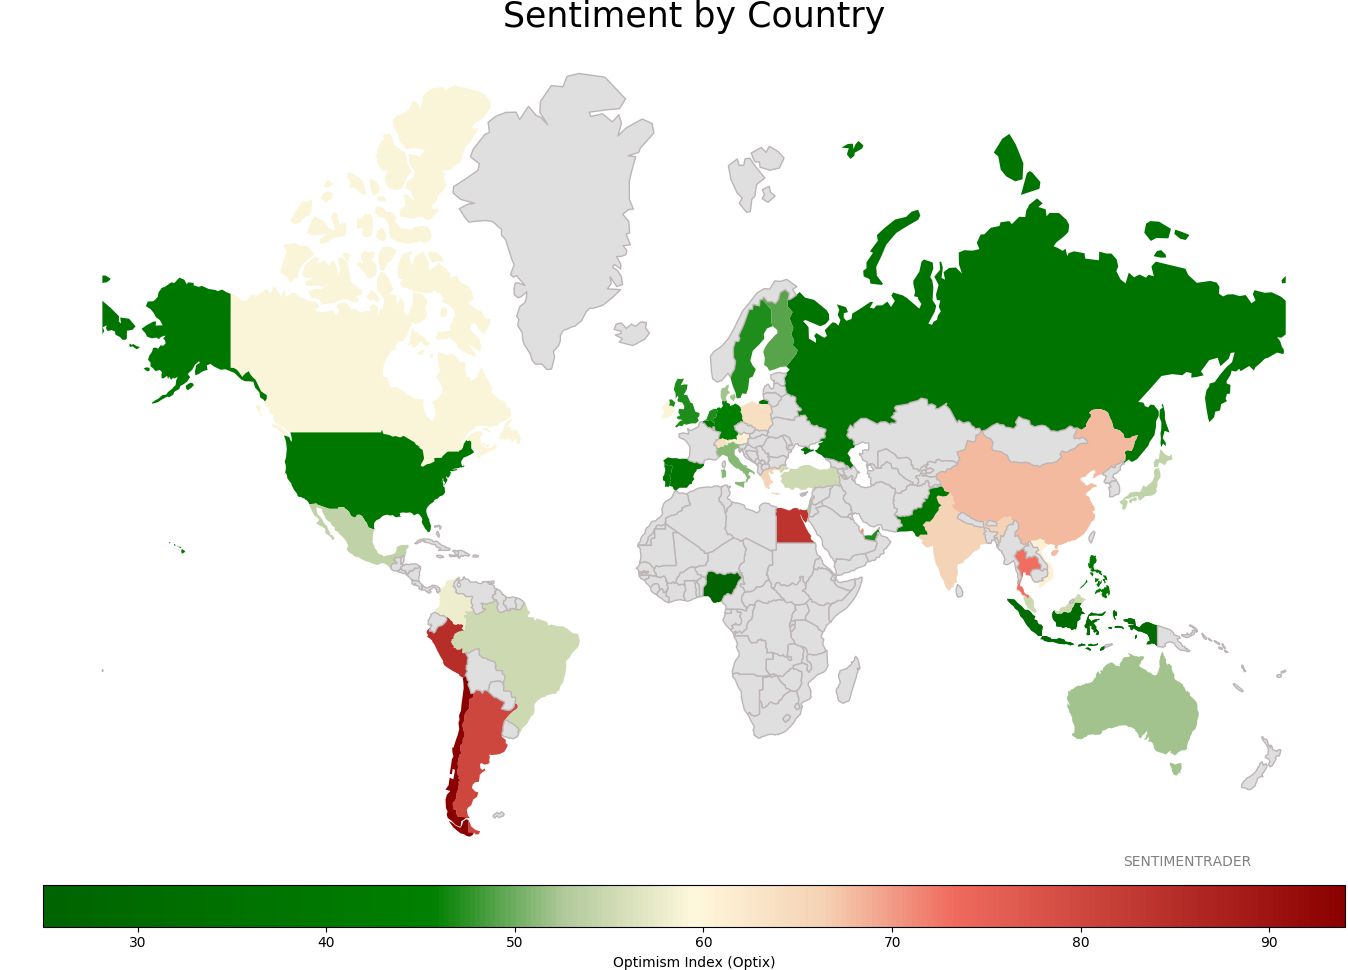
Sentiment Around The World
Optimism Index Thumbnails
|
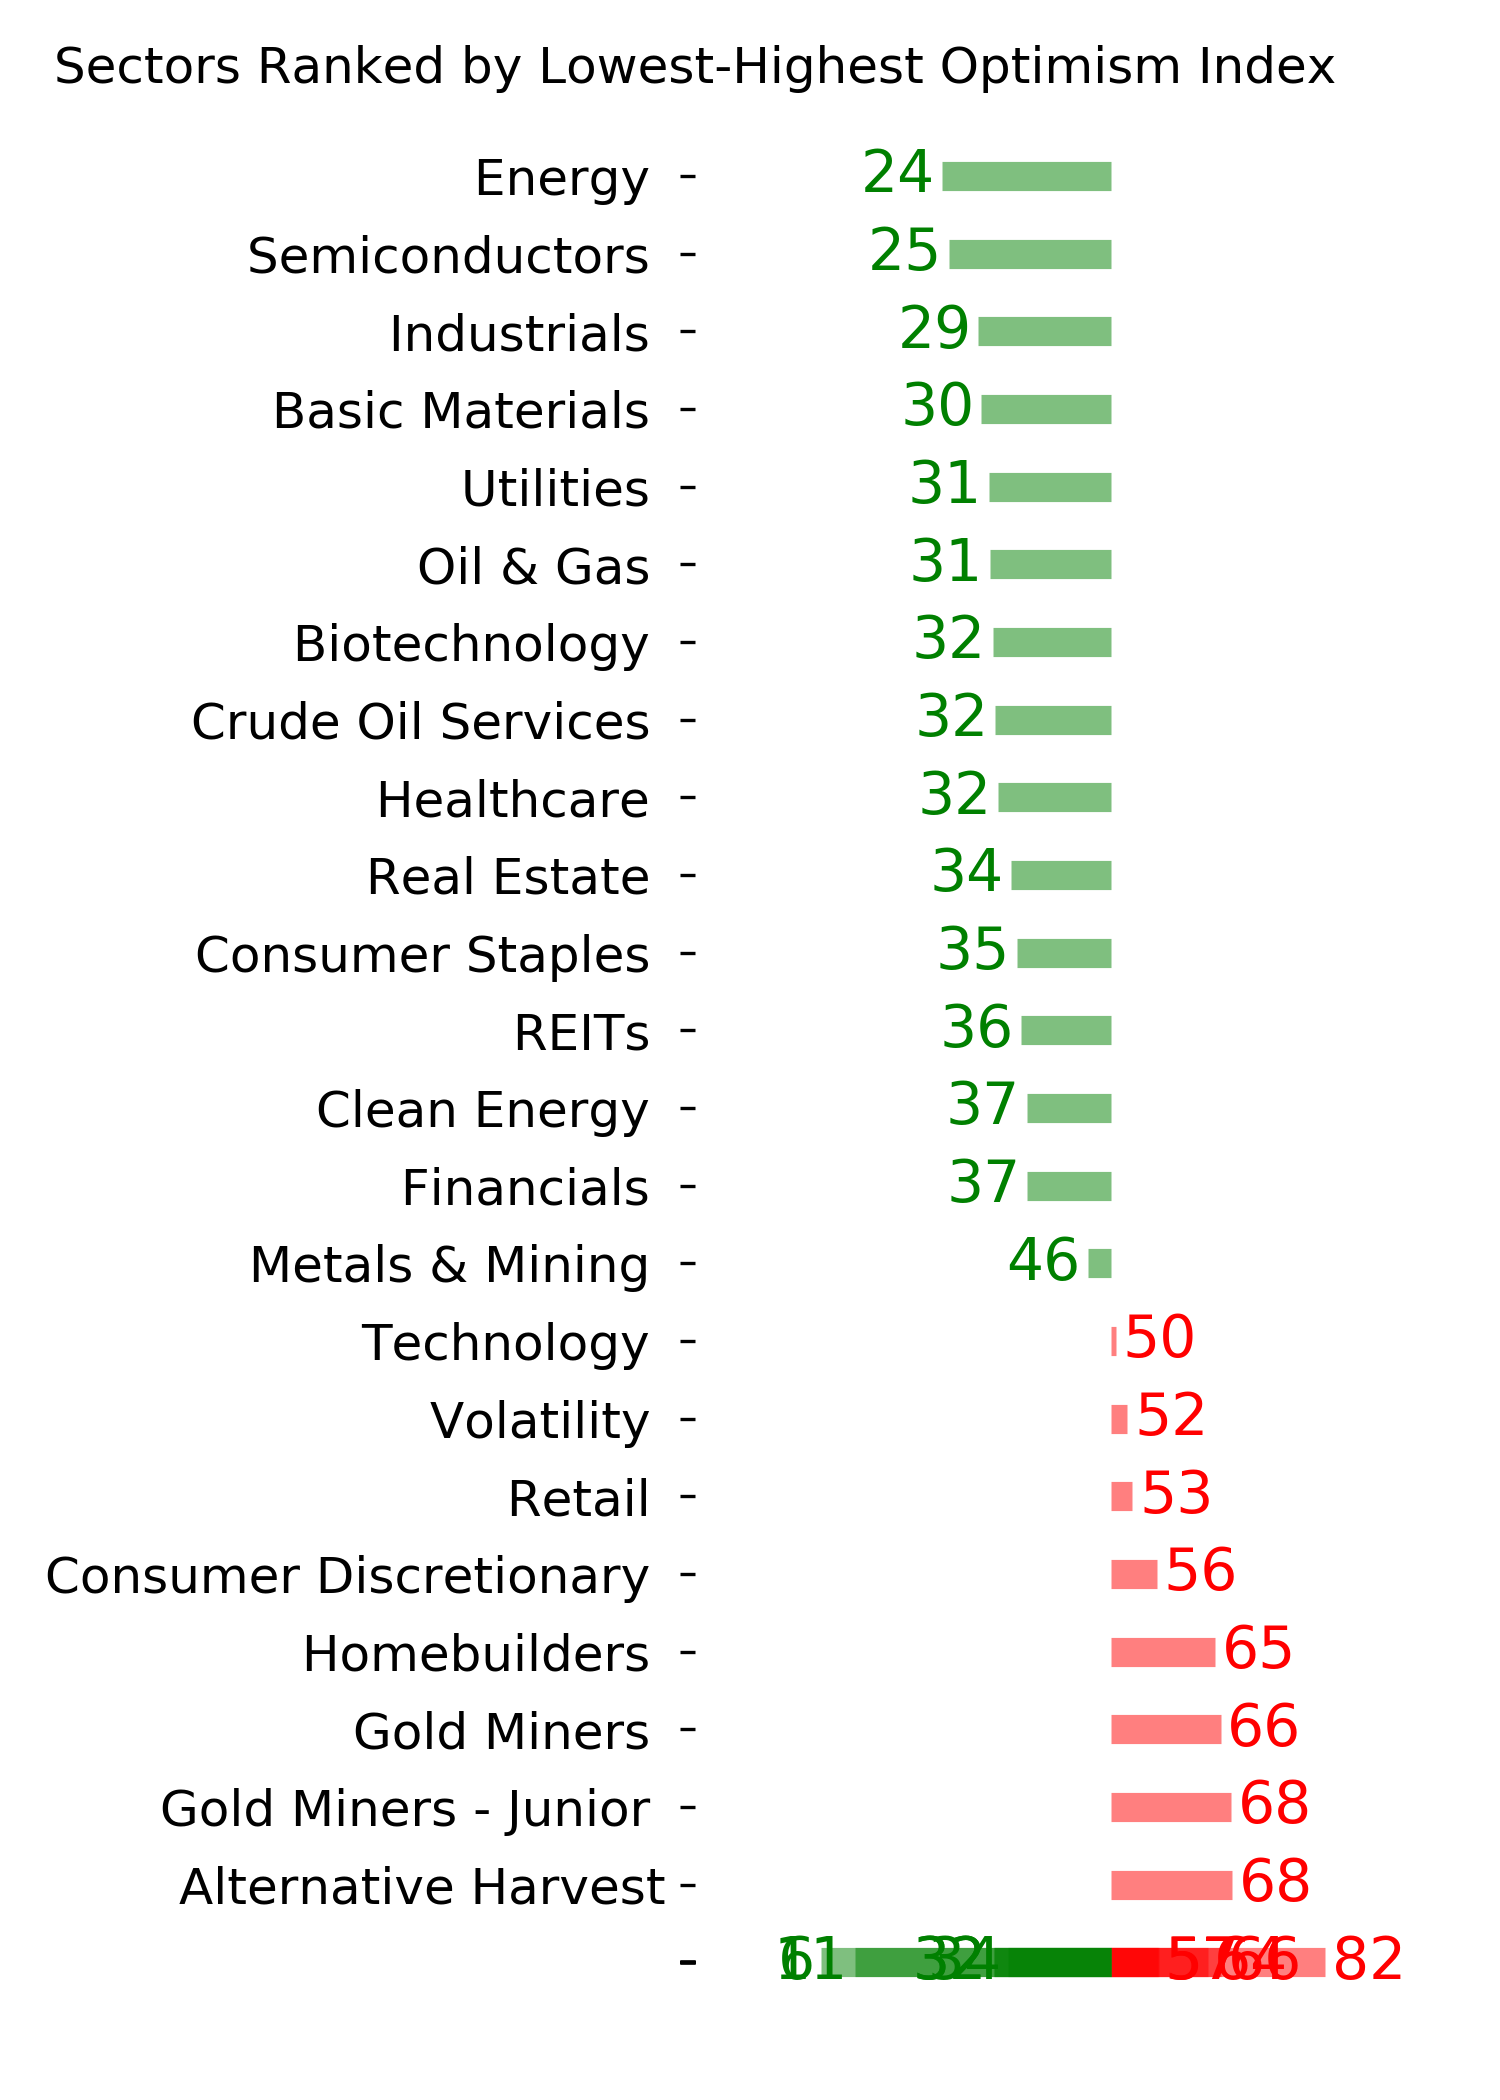
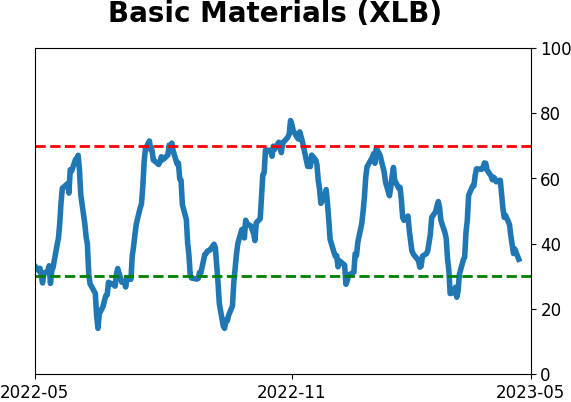
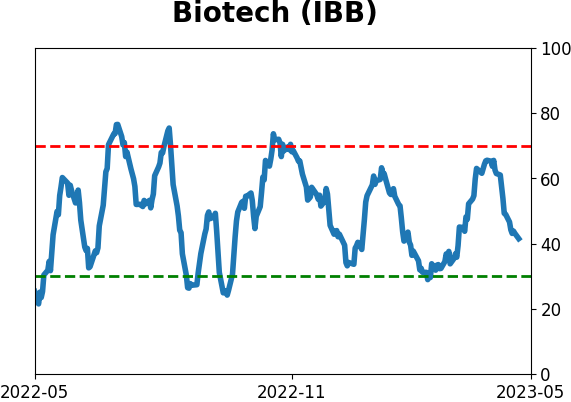
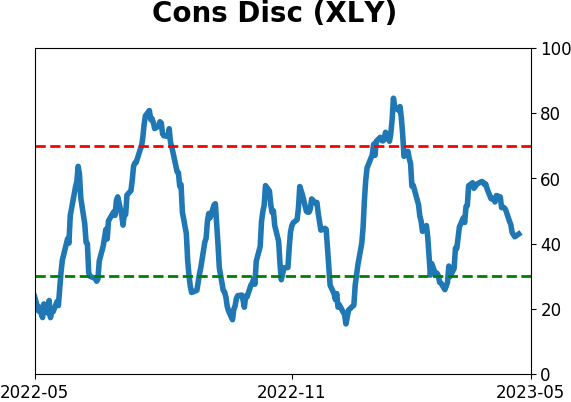
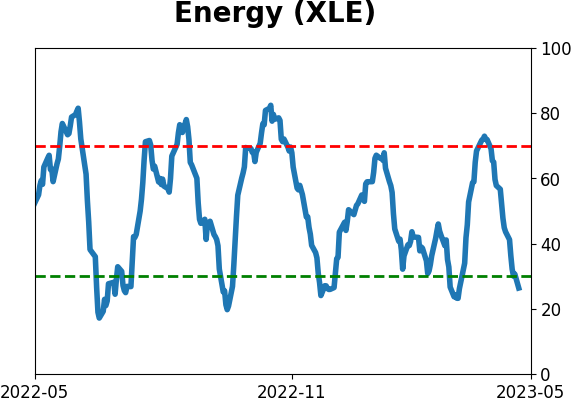
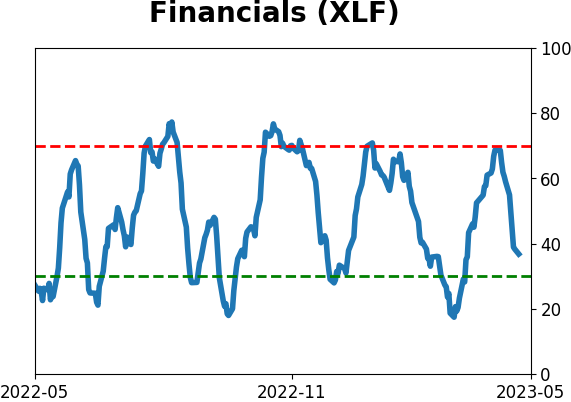
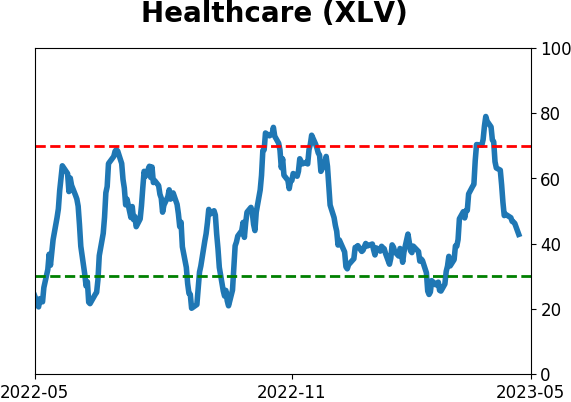
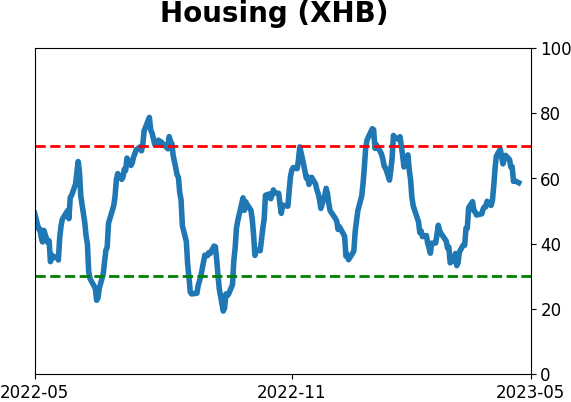
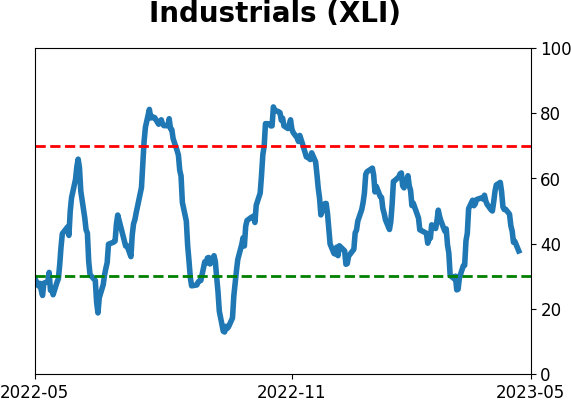
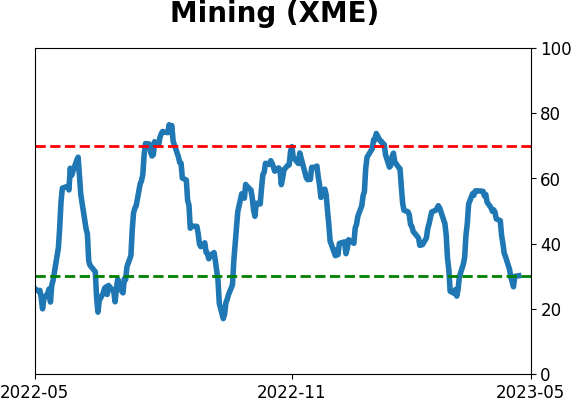
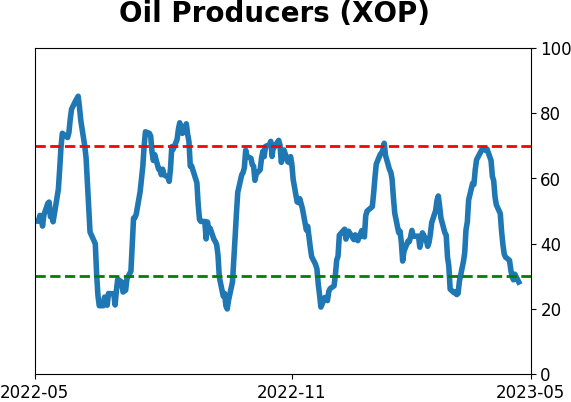
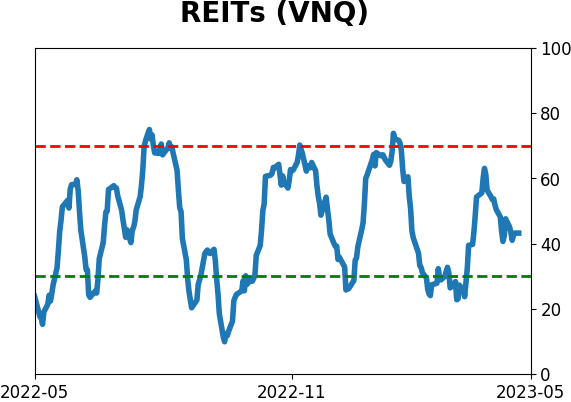
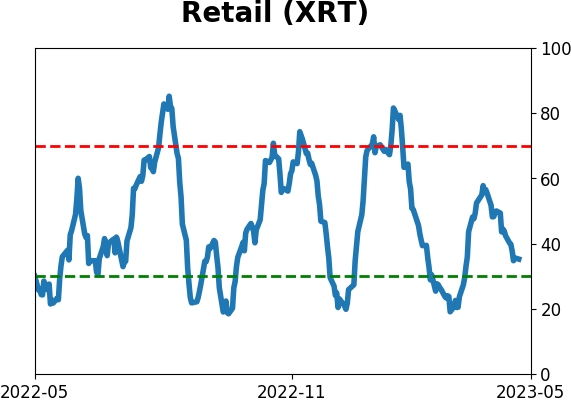
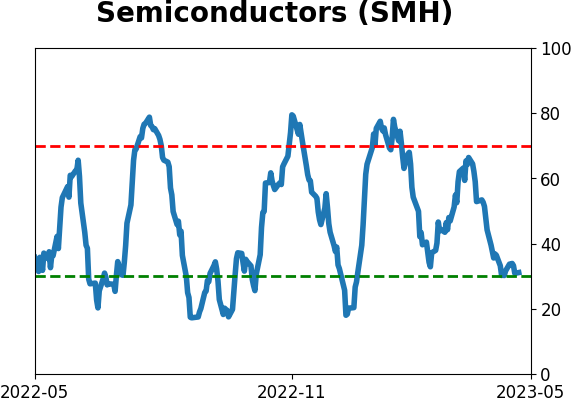
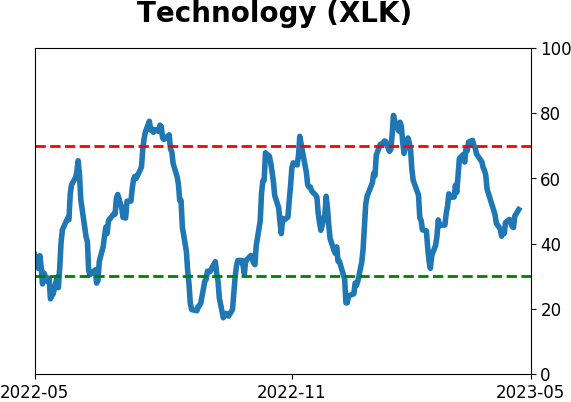
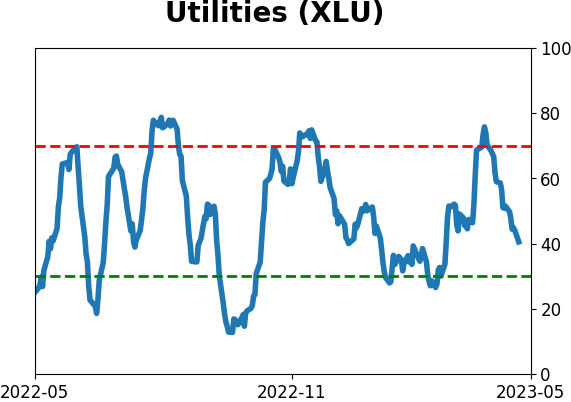
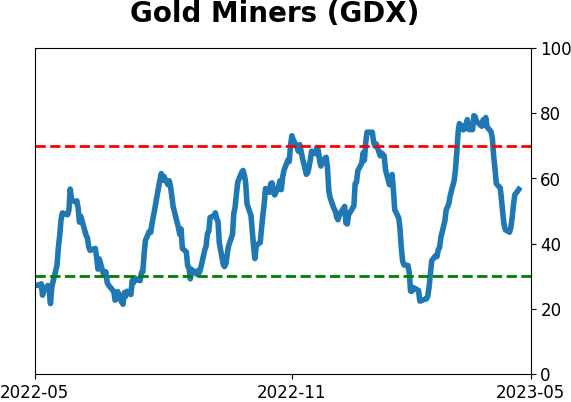
Sector ETF's - 10-Day Moving Average
|
|
|
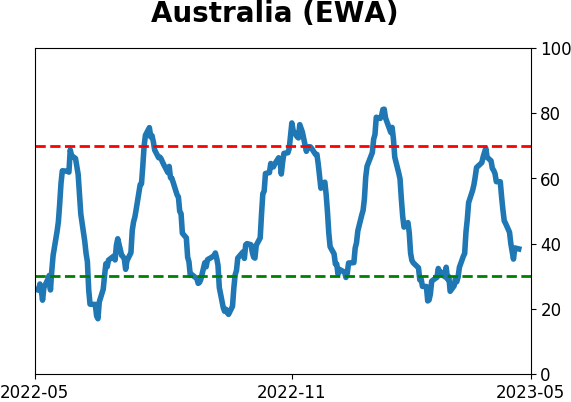
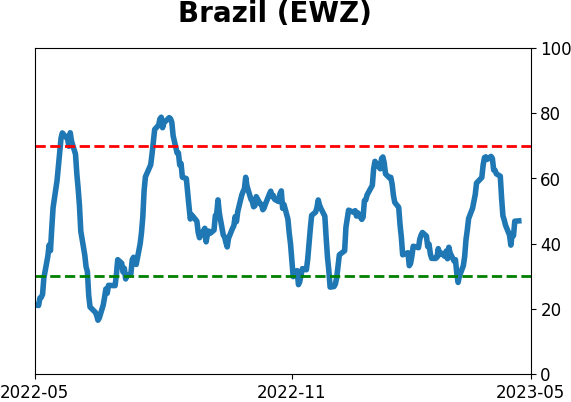
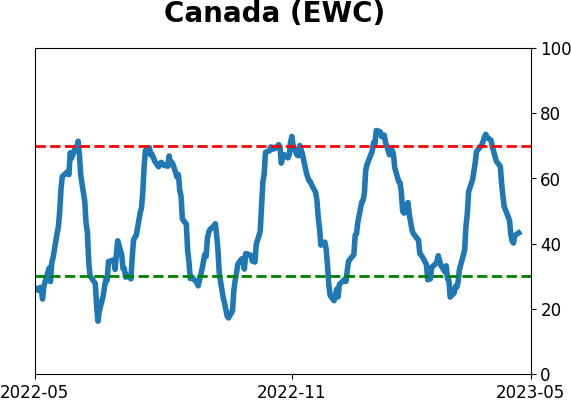
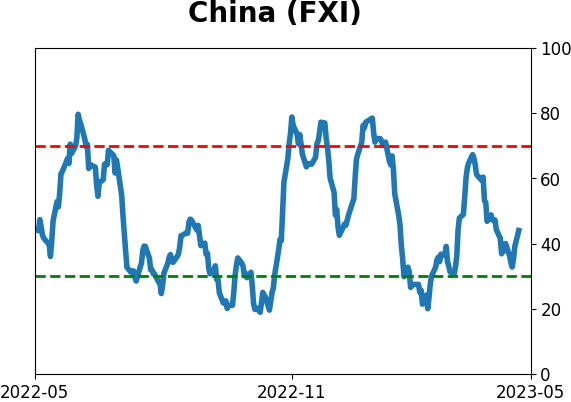
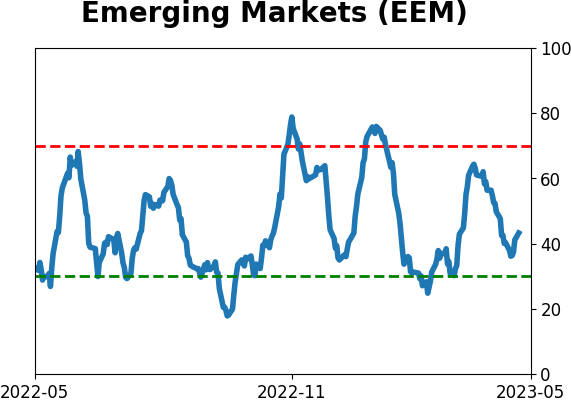
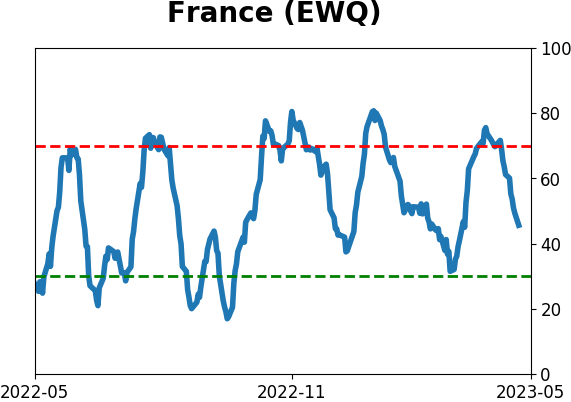
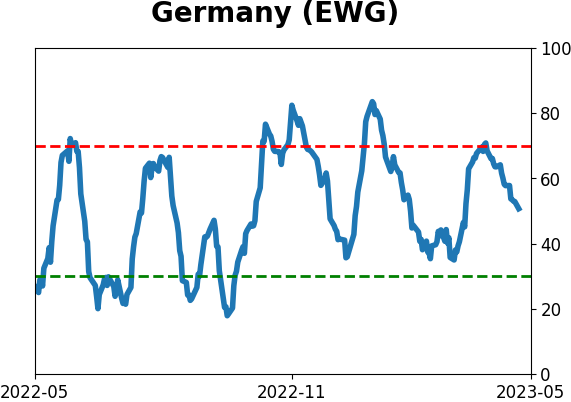
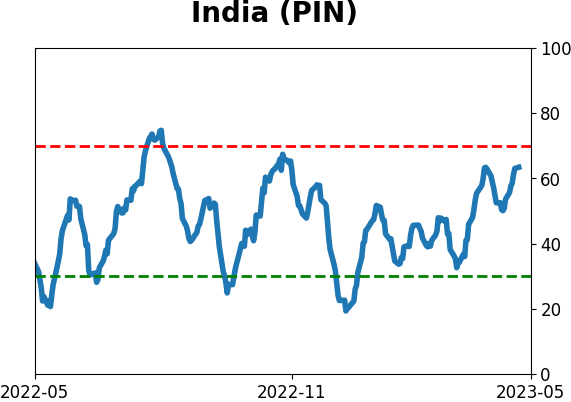
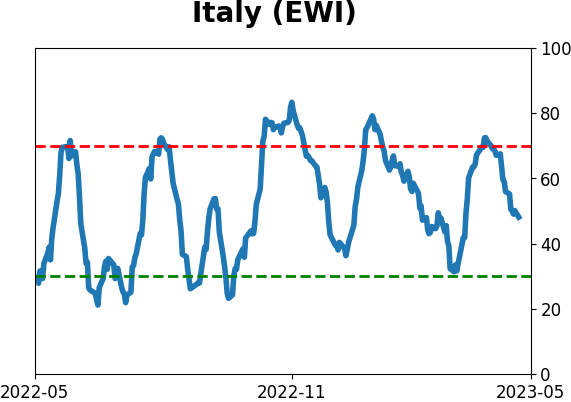
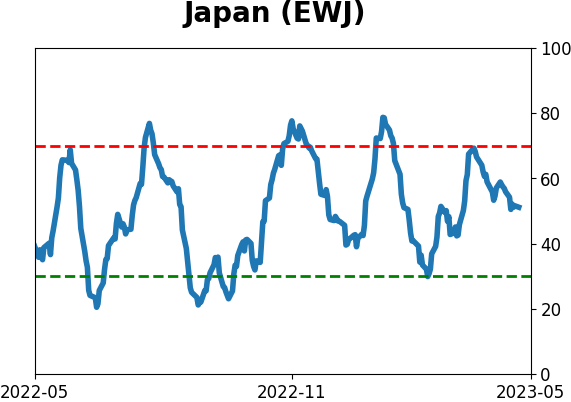
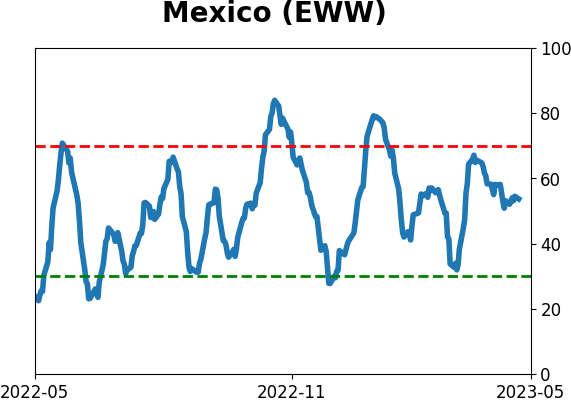
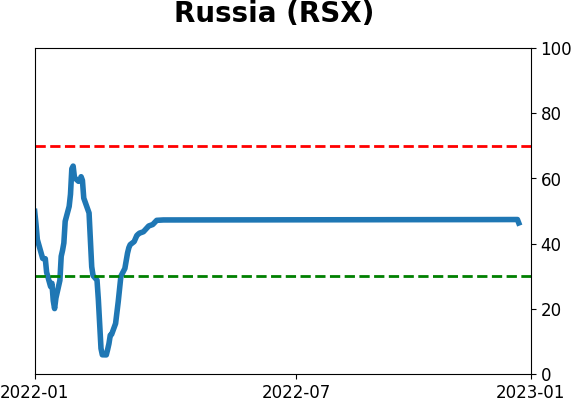
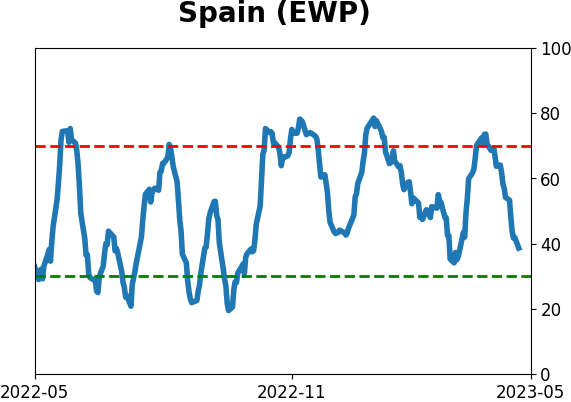
Country ETF's - 10-Day Moving Average
|
|
|
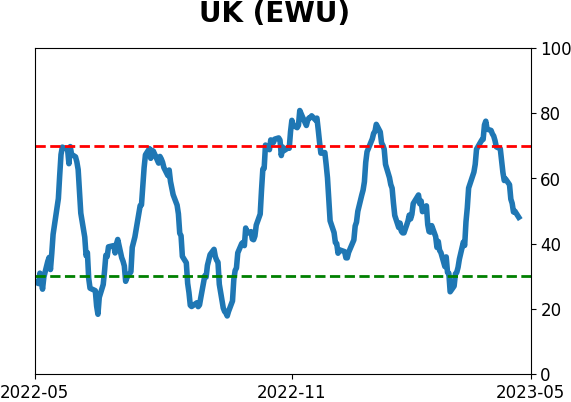
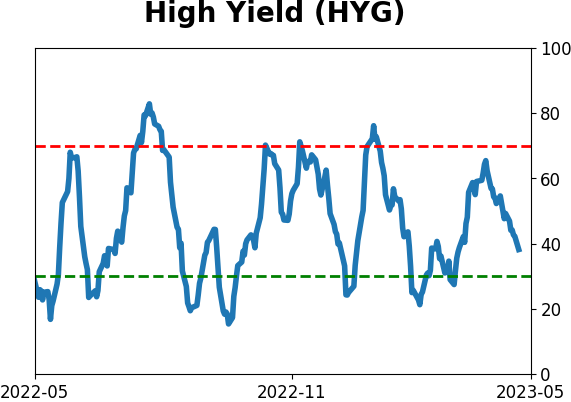
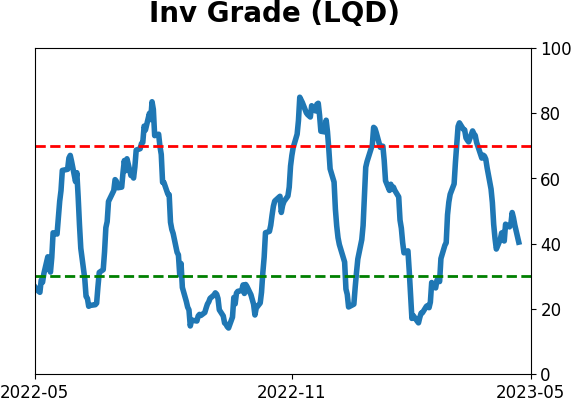
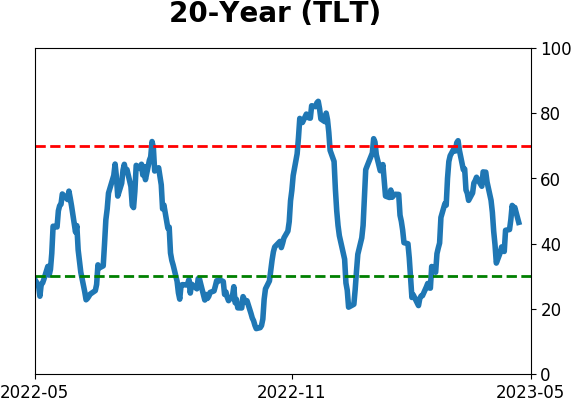
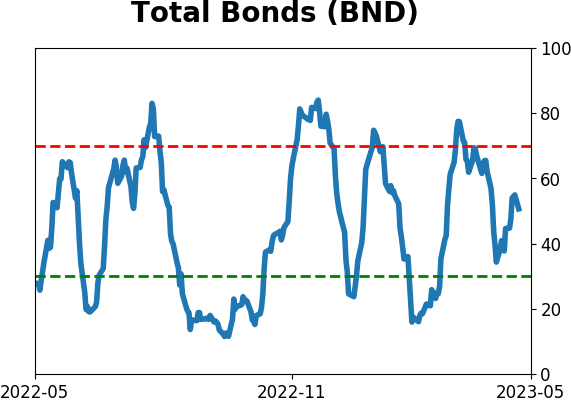
Bond ETF's - 10-Day Moving Average
|
|
|
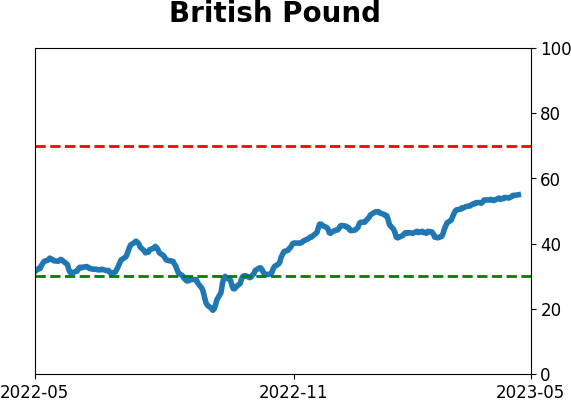
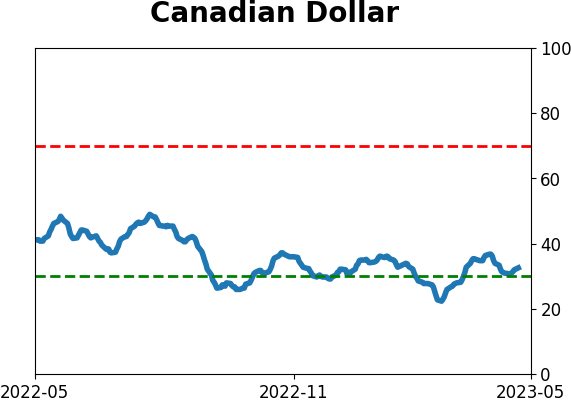
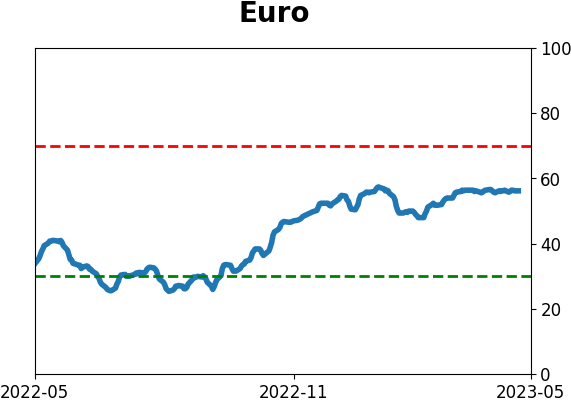
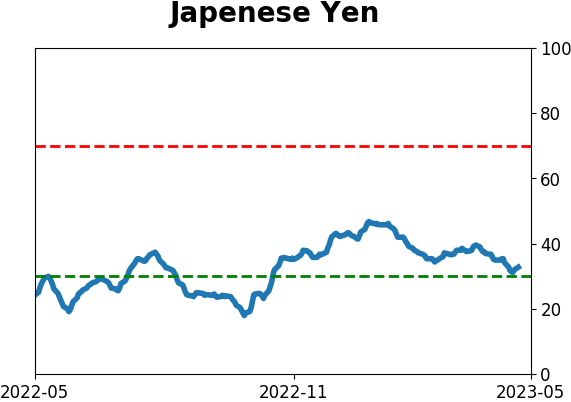
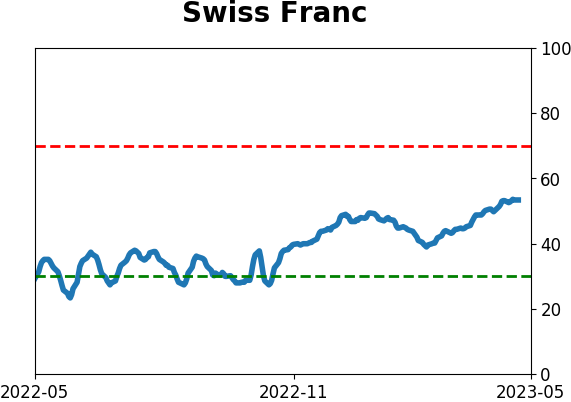
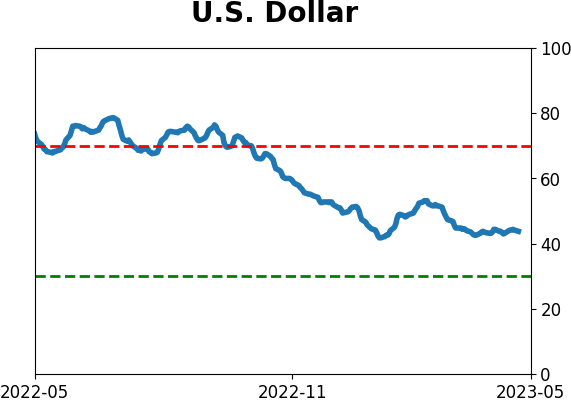
Currency ETF's - 5-Day Moving Average
|
|
|
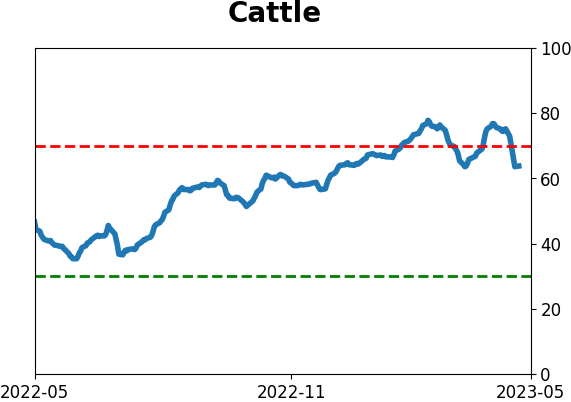
Commodity ETF's - 5-Day Moving Average
|
|