Headlines
|
|
From the most hated market to the most loved:
After three years of sliding stocks and despondent investors, Chinese stocks are showing strong signs of life. The Hang Seng has rallied for 10 straight days, its best streak in 6 years. More and more stocks are rallying, improving short- and long-term trends. This type of behavior has tended to end bear markets.
|
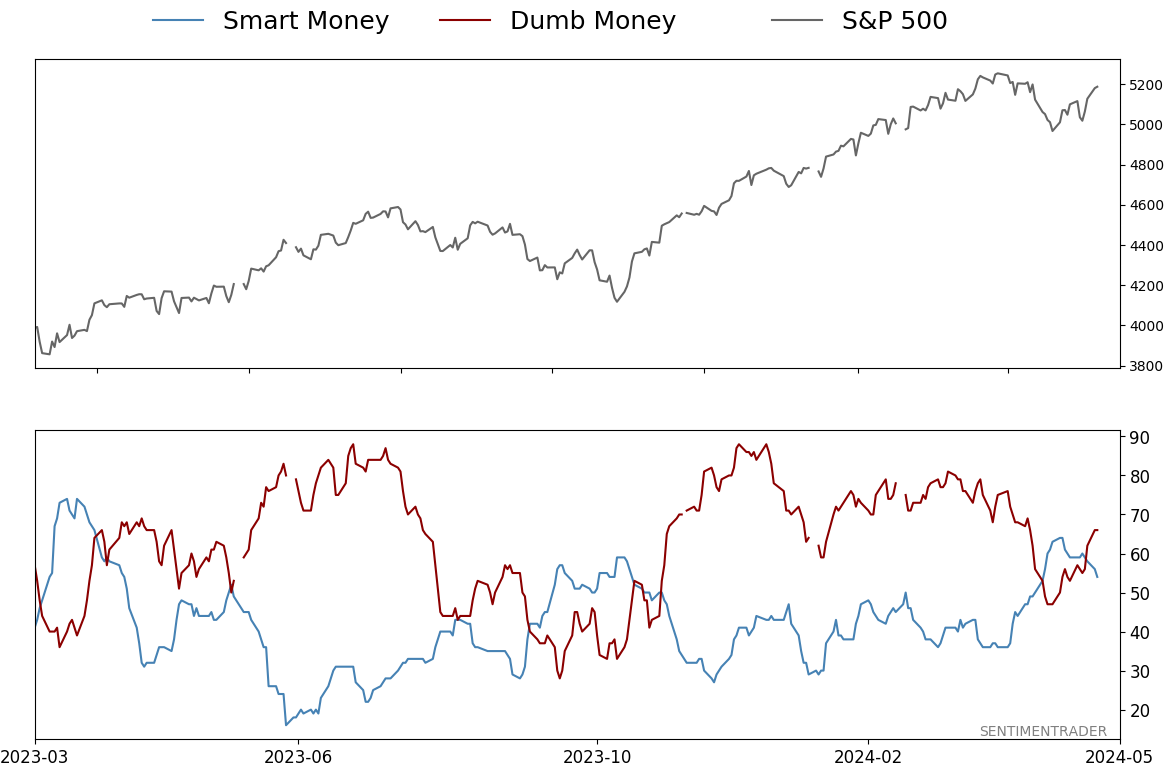
Smart / Dumb Money Confidence
|
Smart Money Confidence: 54%
Dumb Money Confidence: 66%
|
|
Risk Levels
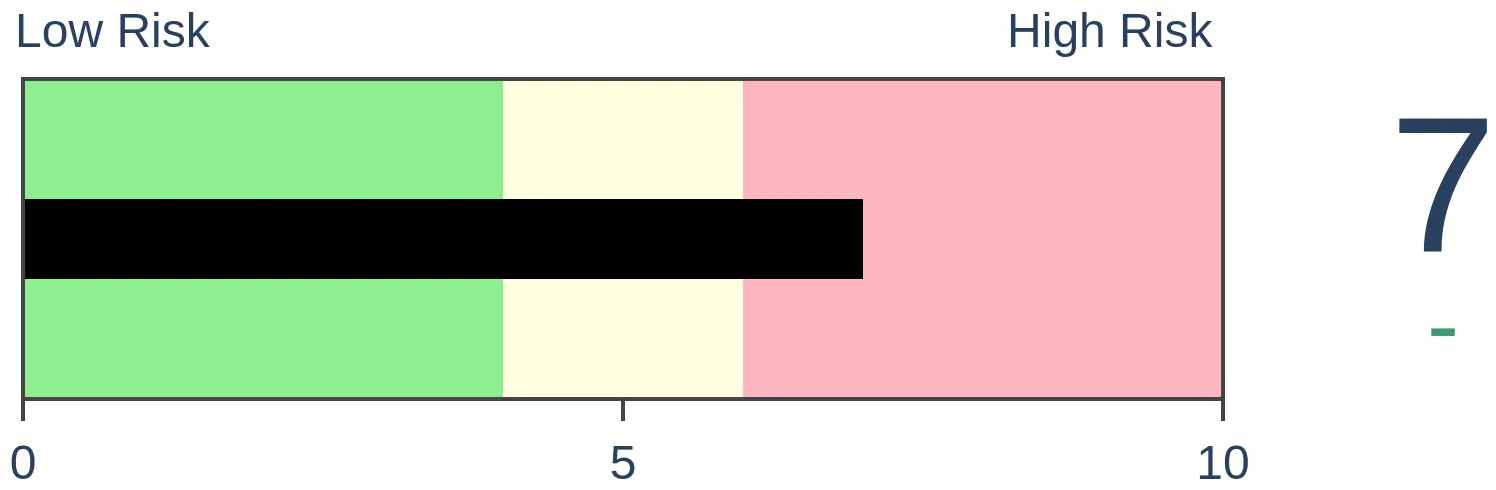
Stocks Short-Term
|
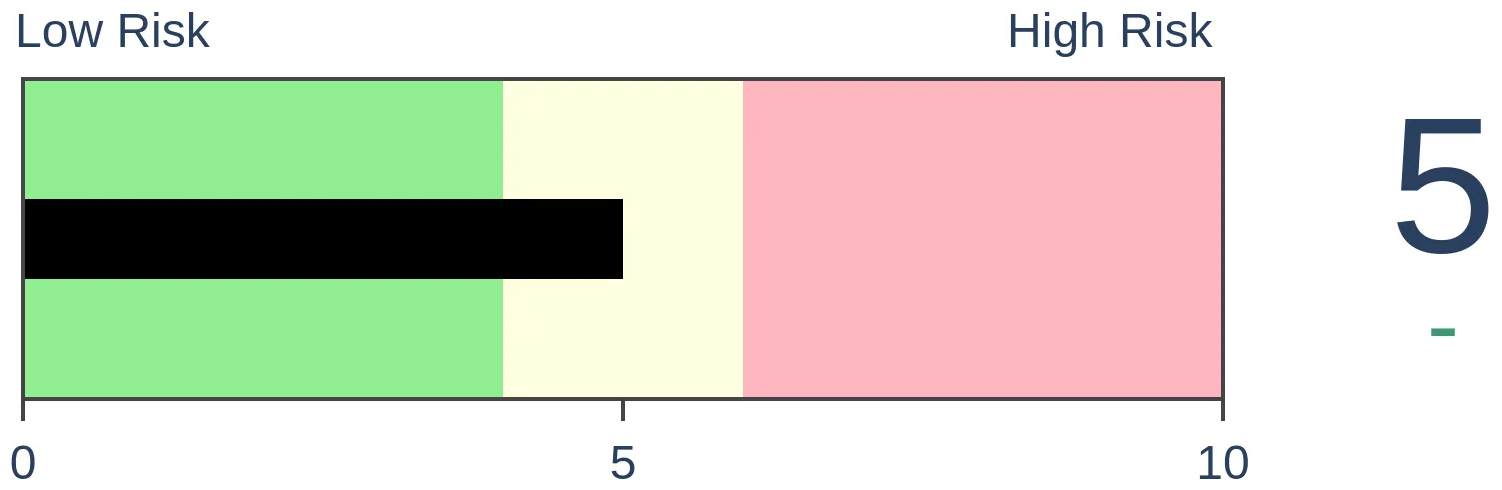
Stocks Medium-Term
|
|
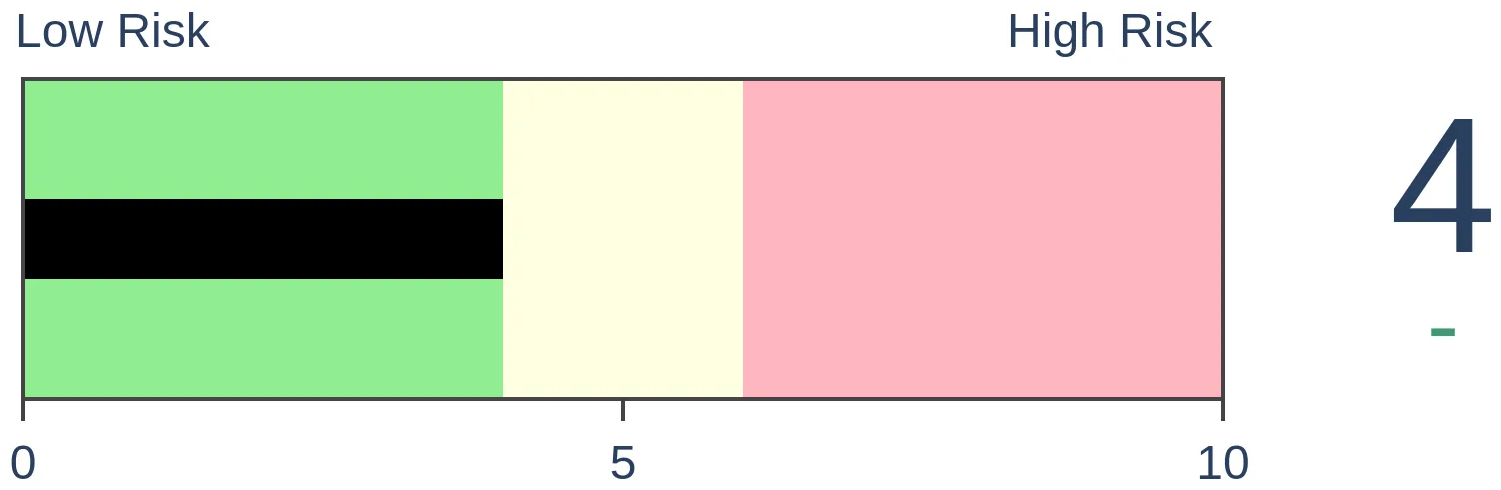
Bonds
|
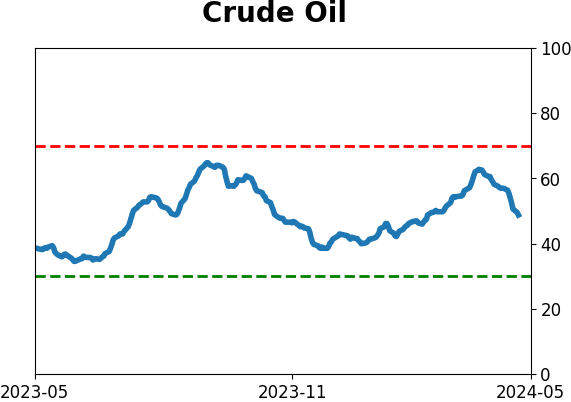
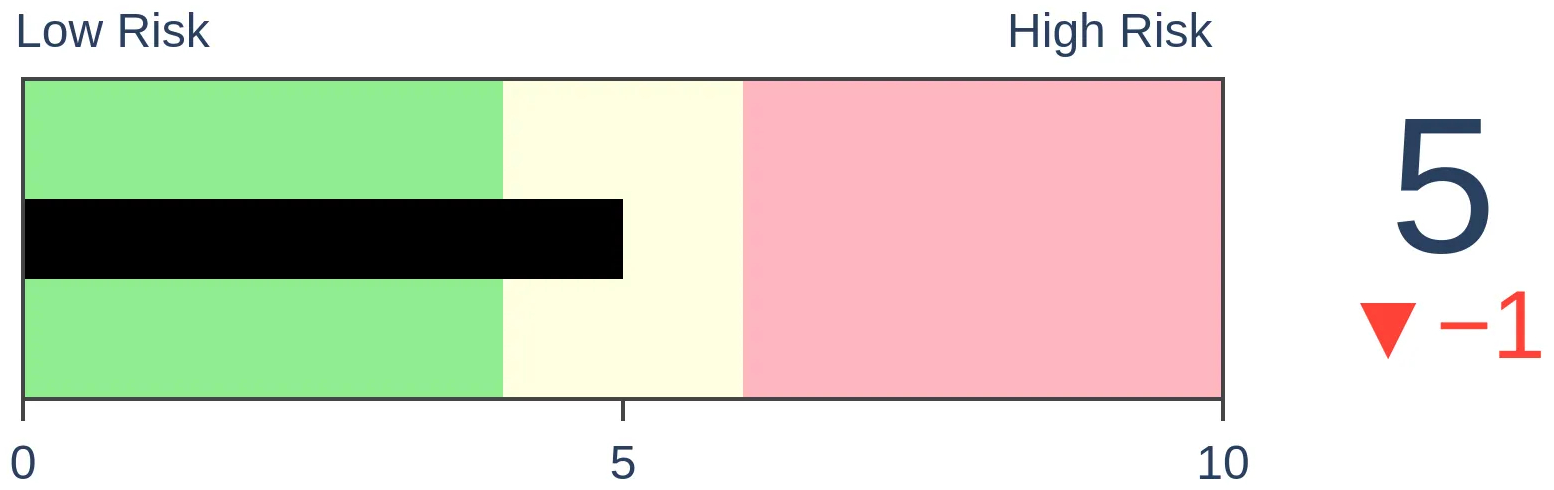
Crude Oil
|
|
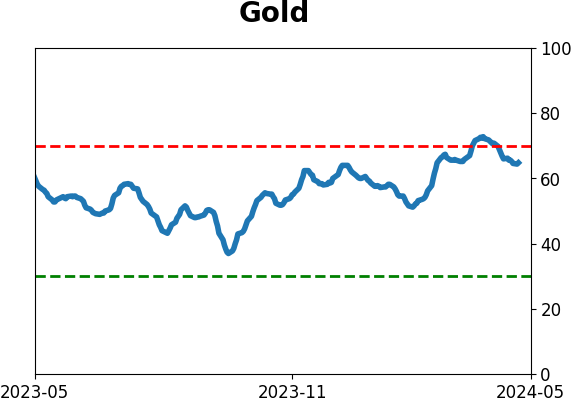
Gold
|
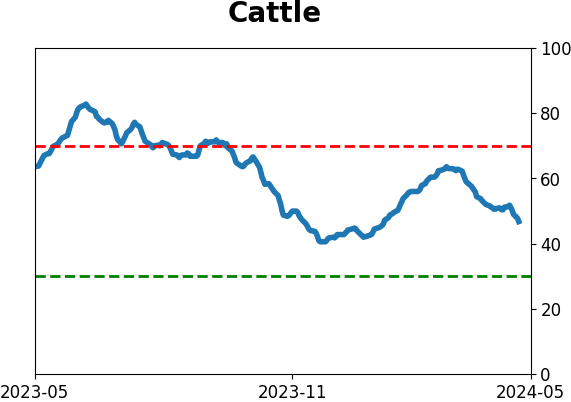
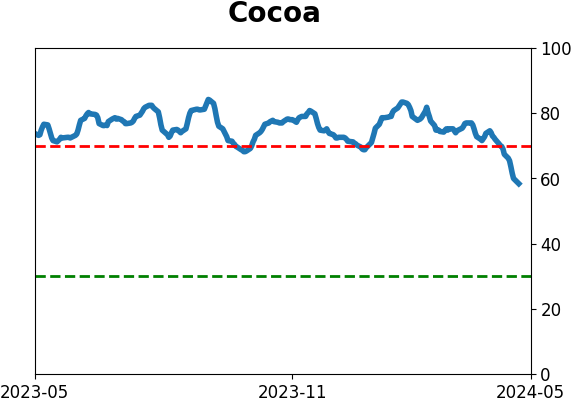
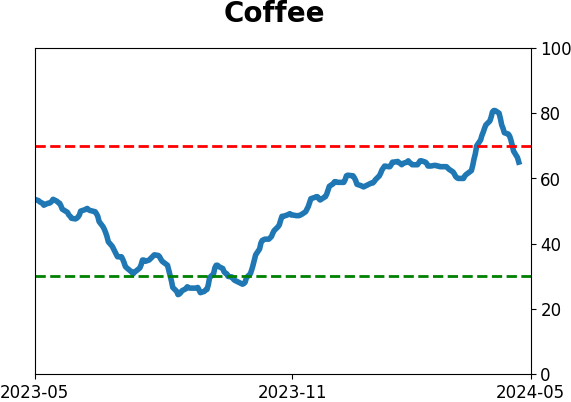
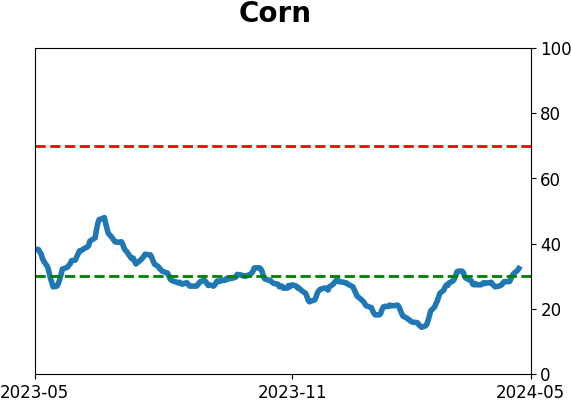
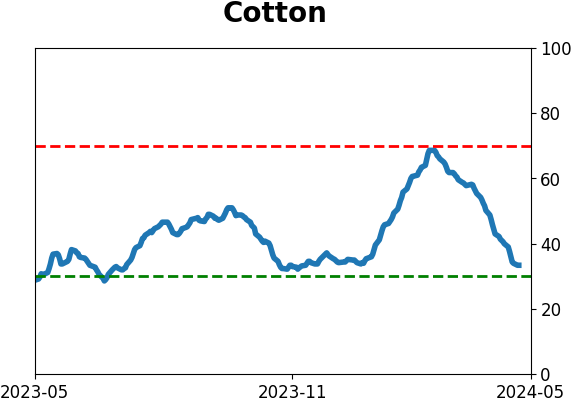
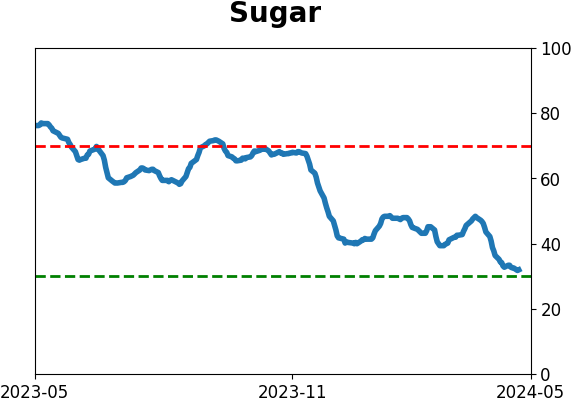
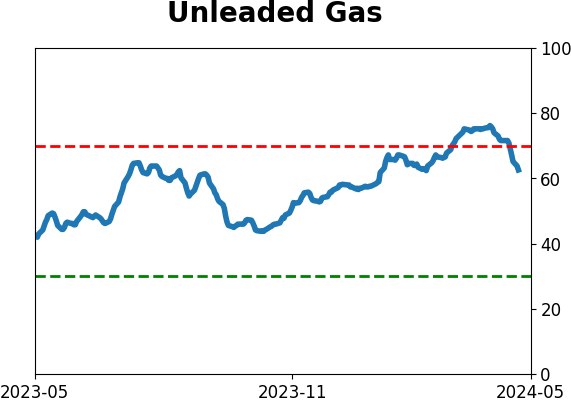
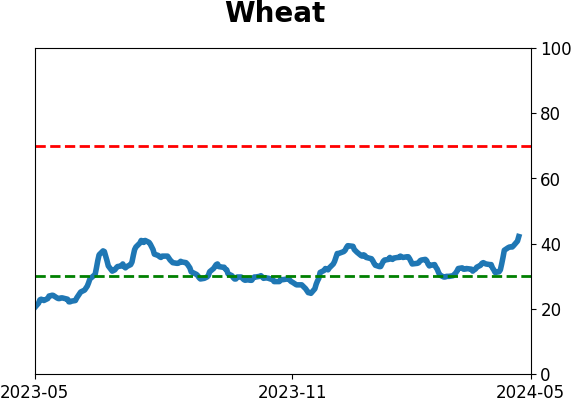
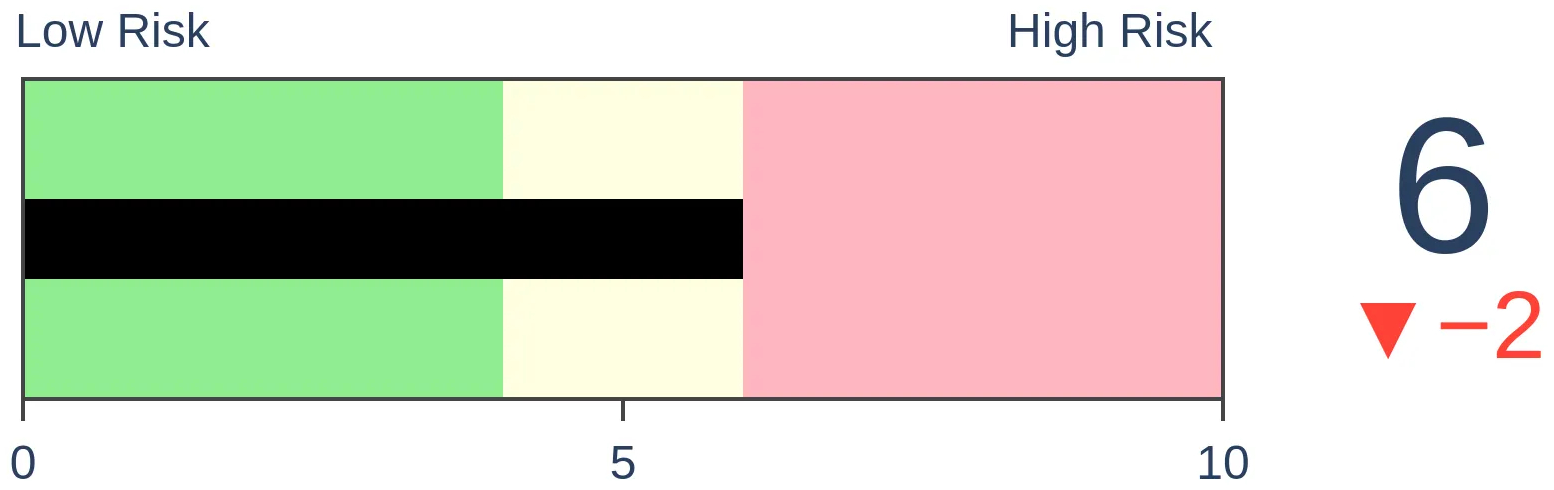
Agriculture

|
|
Research
By Jason Goepfert
BOTTOM LINE
After three years of sliding stocks and despondent investors, Chinese stocks are showing strong signs of life. The Hang Seng has rallied for 10 straight days, its best streak in 6 years. More and more stocks are rallying, improving short- and long-term trends. This type of behavior has tended to end bear markets.
FORECAST / TIMEFRAME
None
|
Key points:
- The Hang Seng has rallied 10 days in a row, its strongest showing in a half-decade
- More and more stocks are powering the index, with a strong breadth thrust and recovering long-term uptrends
- Similar behavior tended to act as bear-killers, triggering after drawdowns and preceding lasting gains
The world's hottest market
After months and months of false starts and some of the worst pessimism we've seen in any market in decades, Chinese stocks are getting some positive attention. As recently as February, we noted how this was the most hated market in the world.
There are different markets, indexes, and exchanges when it comes to "China," but for these purposes, we'll look at Hong Kong, specifically the Hang Seng index. The index has been mired in one of its more pernicious drawdowns in 50 years but is showing some signs that buying interest is genuine, a stark change from the past three years.
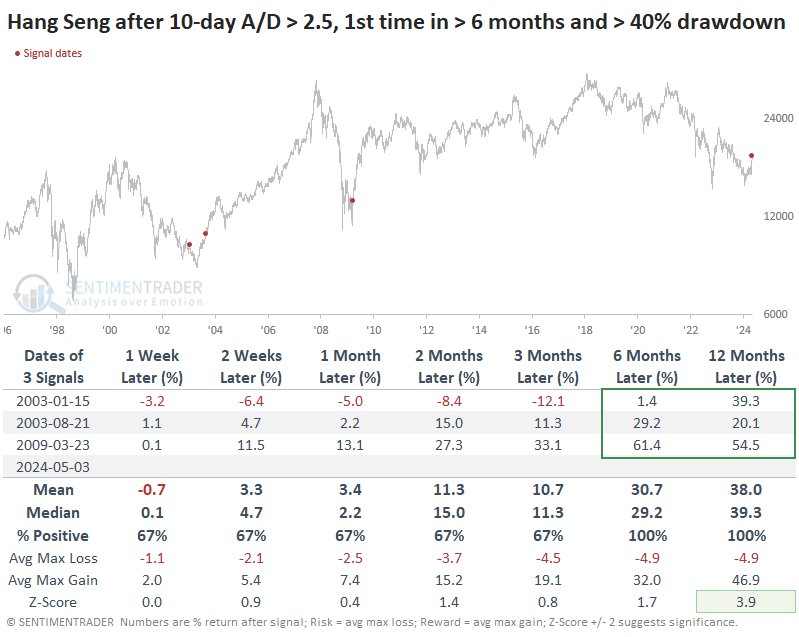
For the first time in six years, buyers have pushed the Hang Seng higher for the tenth consecutive session.
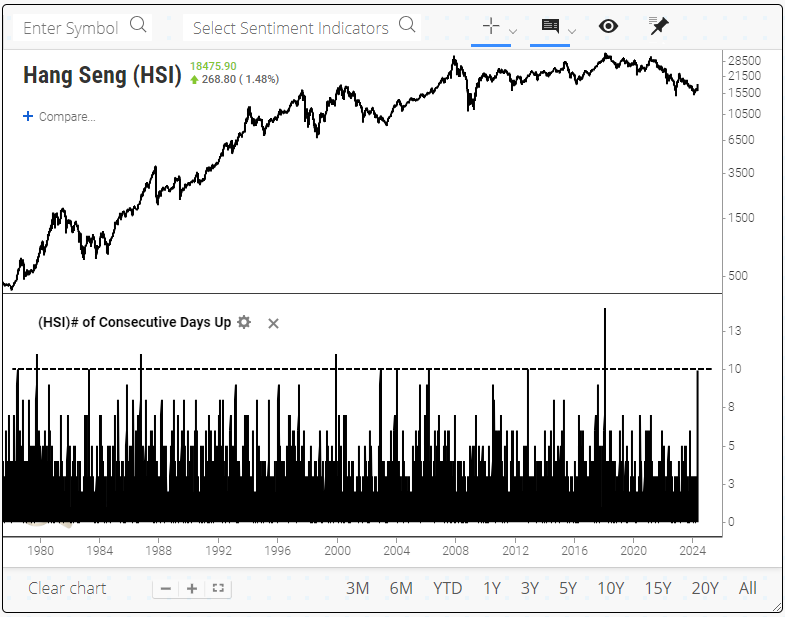
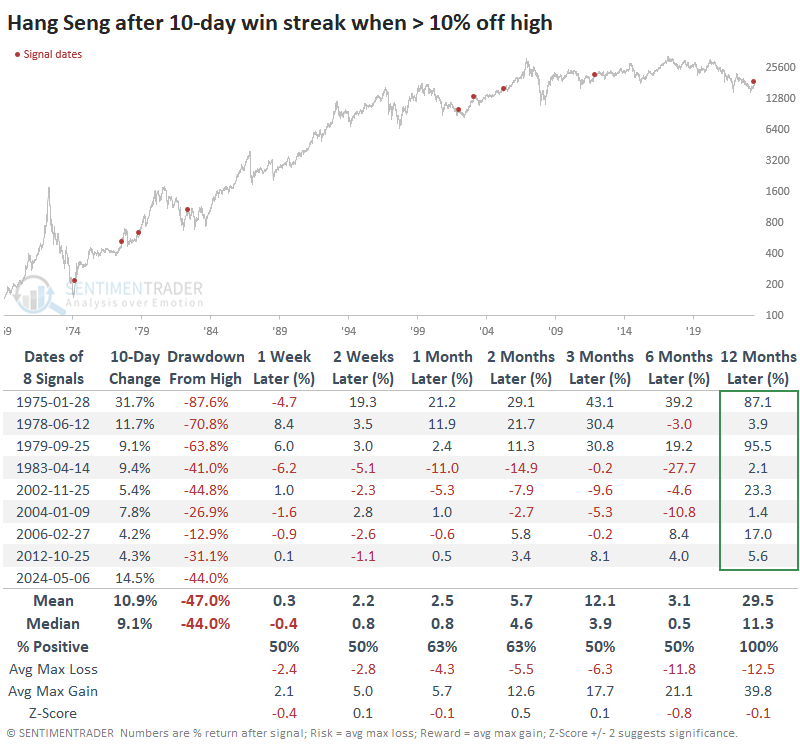
It has been rare to see this level of commitment, even during protracted bull markets. When it comes after the index had suffered at least a corrective phase, then short-term returns were mixed, but long-term returns were positive in each case.
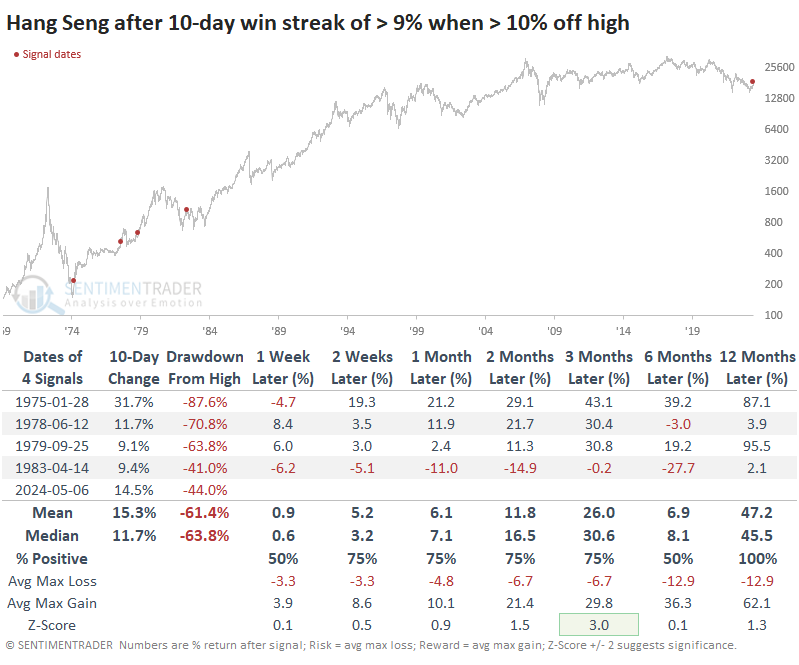
If we look at the most impressive streaks after the worst drawdowns, the sample size necessarily contracts uncomfortably, but the results improved.
More and more stocks are powering the rally
The 10-day win streak occurred as more than 2.5 stocks advanced for every one that declined. The index hasn't seen that level of overwhelming buying interest since 2017.
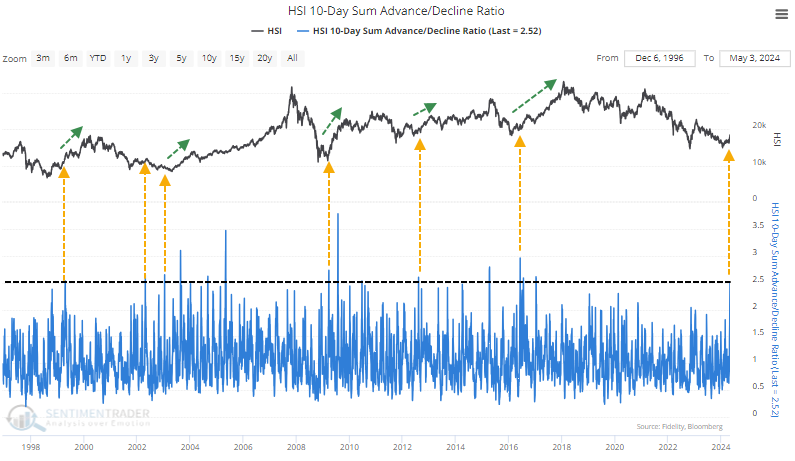
If we look at the most similar situations, there were only three precedents when this buying impulse was triggered after a long drought and significant drawdown. One led to a temporary lower low, then triggered again, ending the bear market. The other signal in 2009 was a sign the bear market was over.
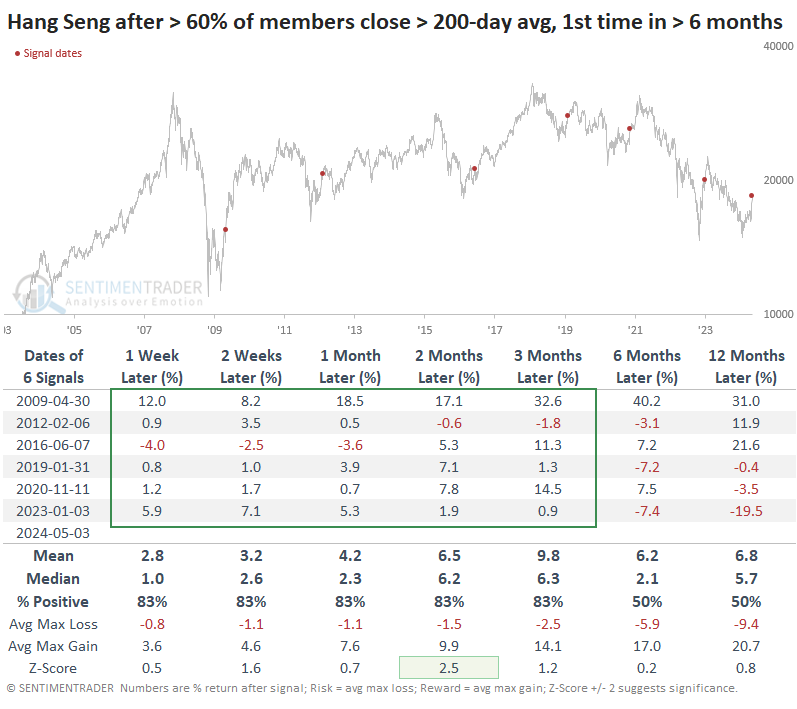
The recovery hasn't just been in short-term trends. For the first time in months, more than 60% of stocks in the Hang Seng have closed above their 200-day moving average.
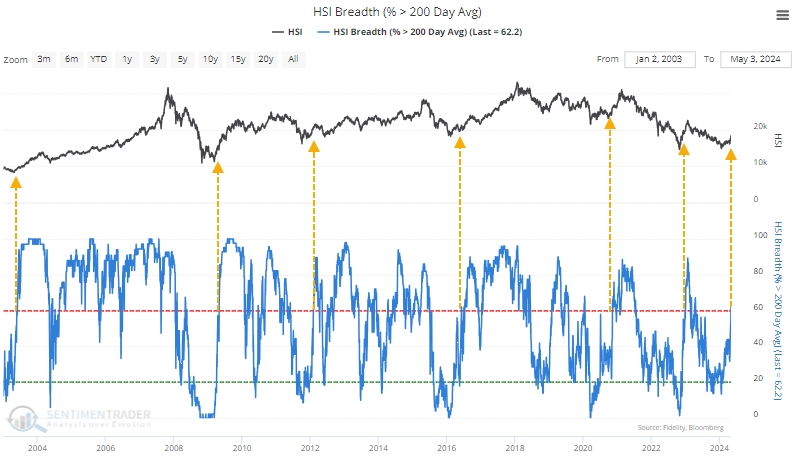
Strong markets see this figure climb - and hold - above 60%, so we'll have to see how it unfolds. However, when we see this climb above 60% for the first time in at least six months, the index has a good record of adding to gains in the weeks and months ahead.
What the research tells us...
The classic opportunity for a contrarian investor is one that is cheap, hated, and in an uptrend. It's easy to find one of those conditions but quite a bit harder to find two. Finding all three is rare and usually happens only a few times a year.
It's fair to say that China and the Hang Seng index, in particular, meet all those conditions. It's historically and relatively cheap, it was among the world's most hated a couple of short months ago, and is currently enjoying a buying thrust that has tended to act as a bear-killer. Chinese stocks have a long and frustrating history of disappointing investors, which is part of the reason the opportunity exists in the first place. From a technical perspective, it doesn't get much clearer than this that buyers are returning from what had been a mass exodus.
Indicators at Extremes
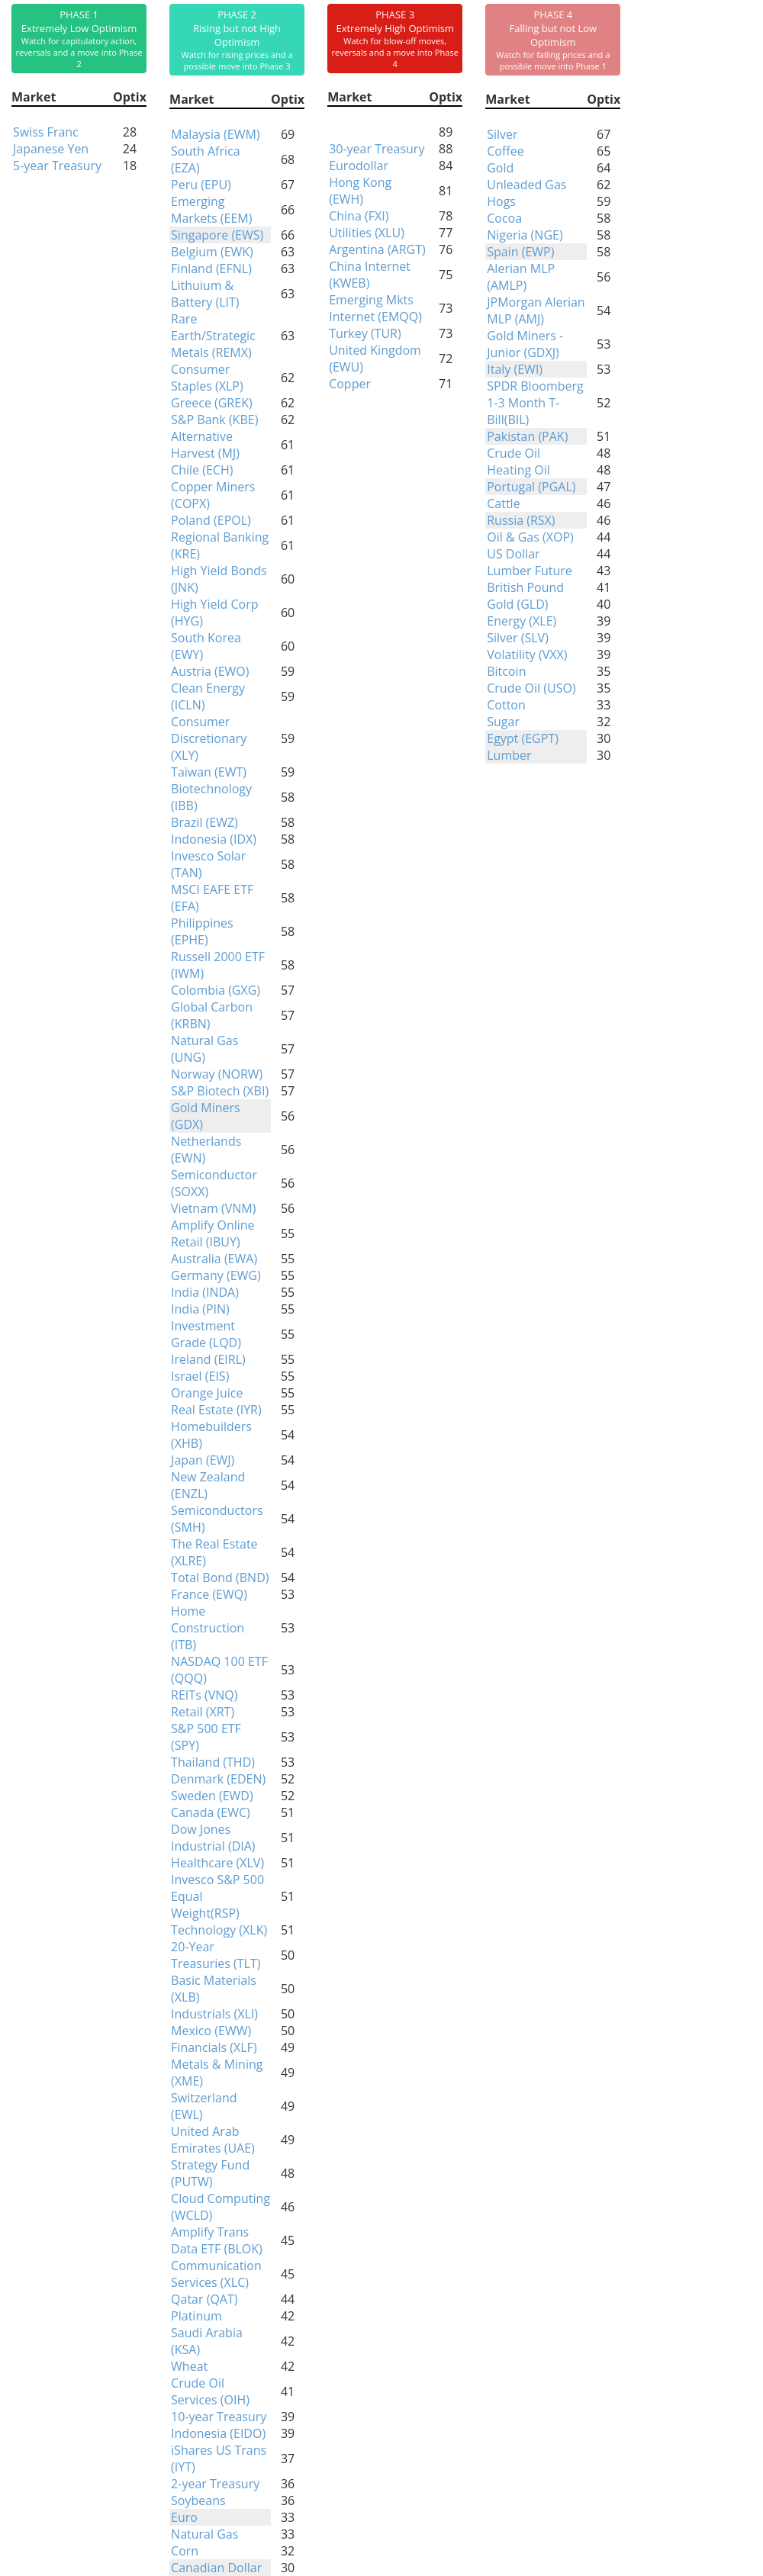
Phase Table
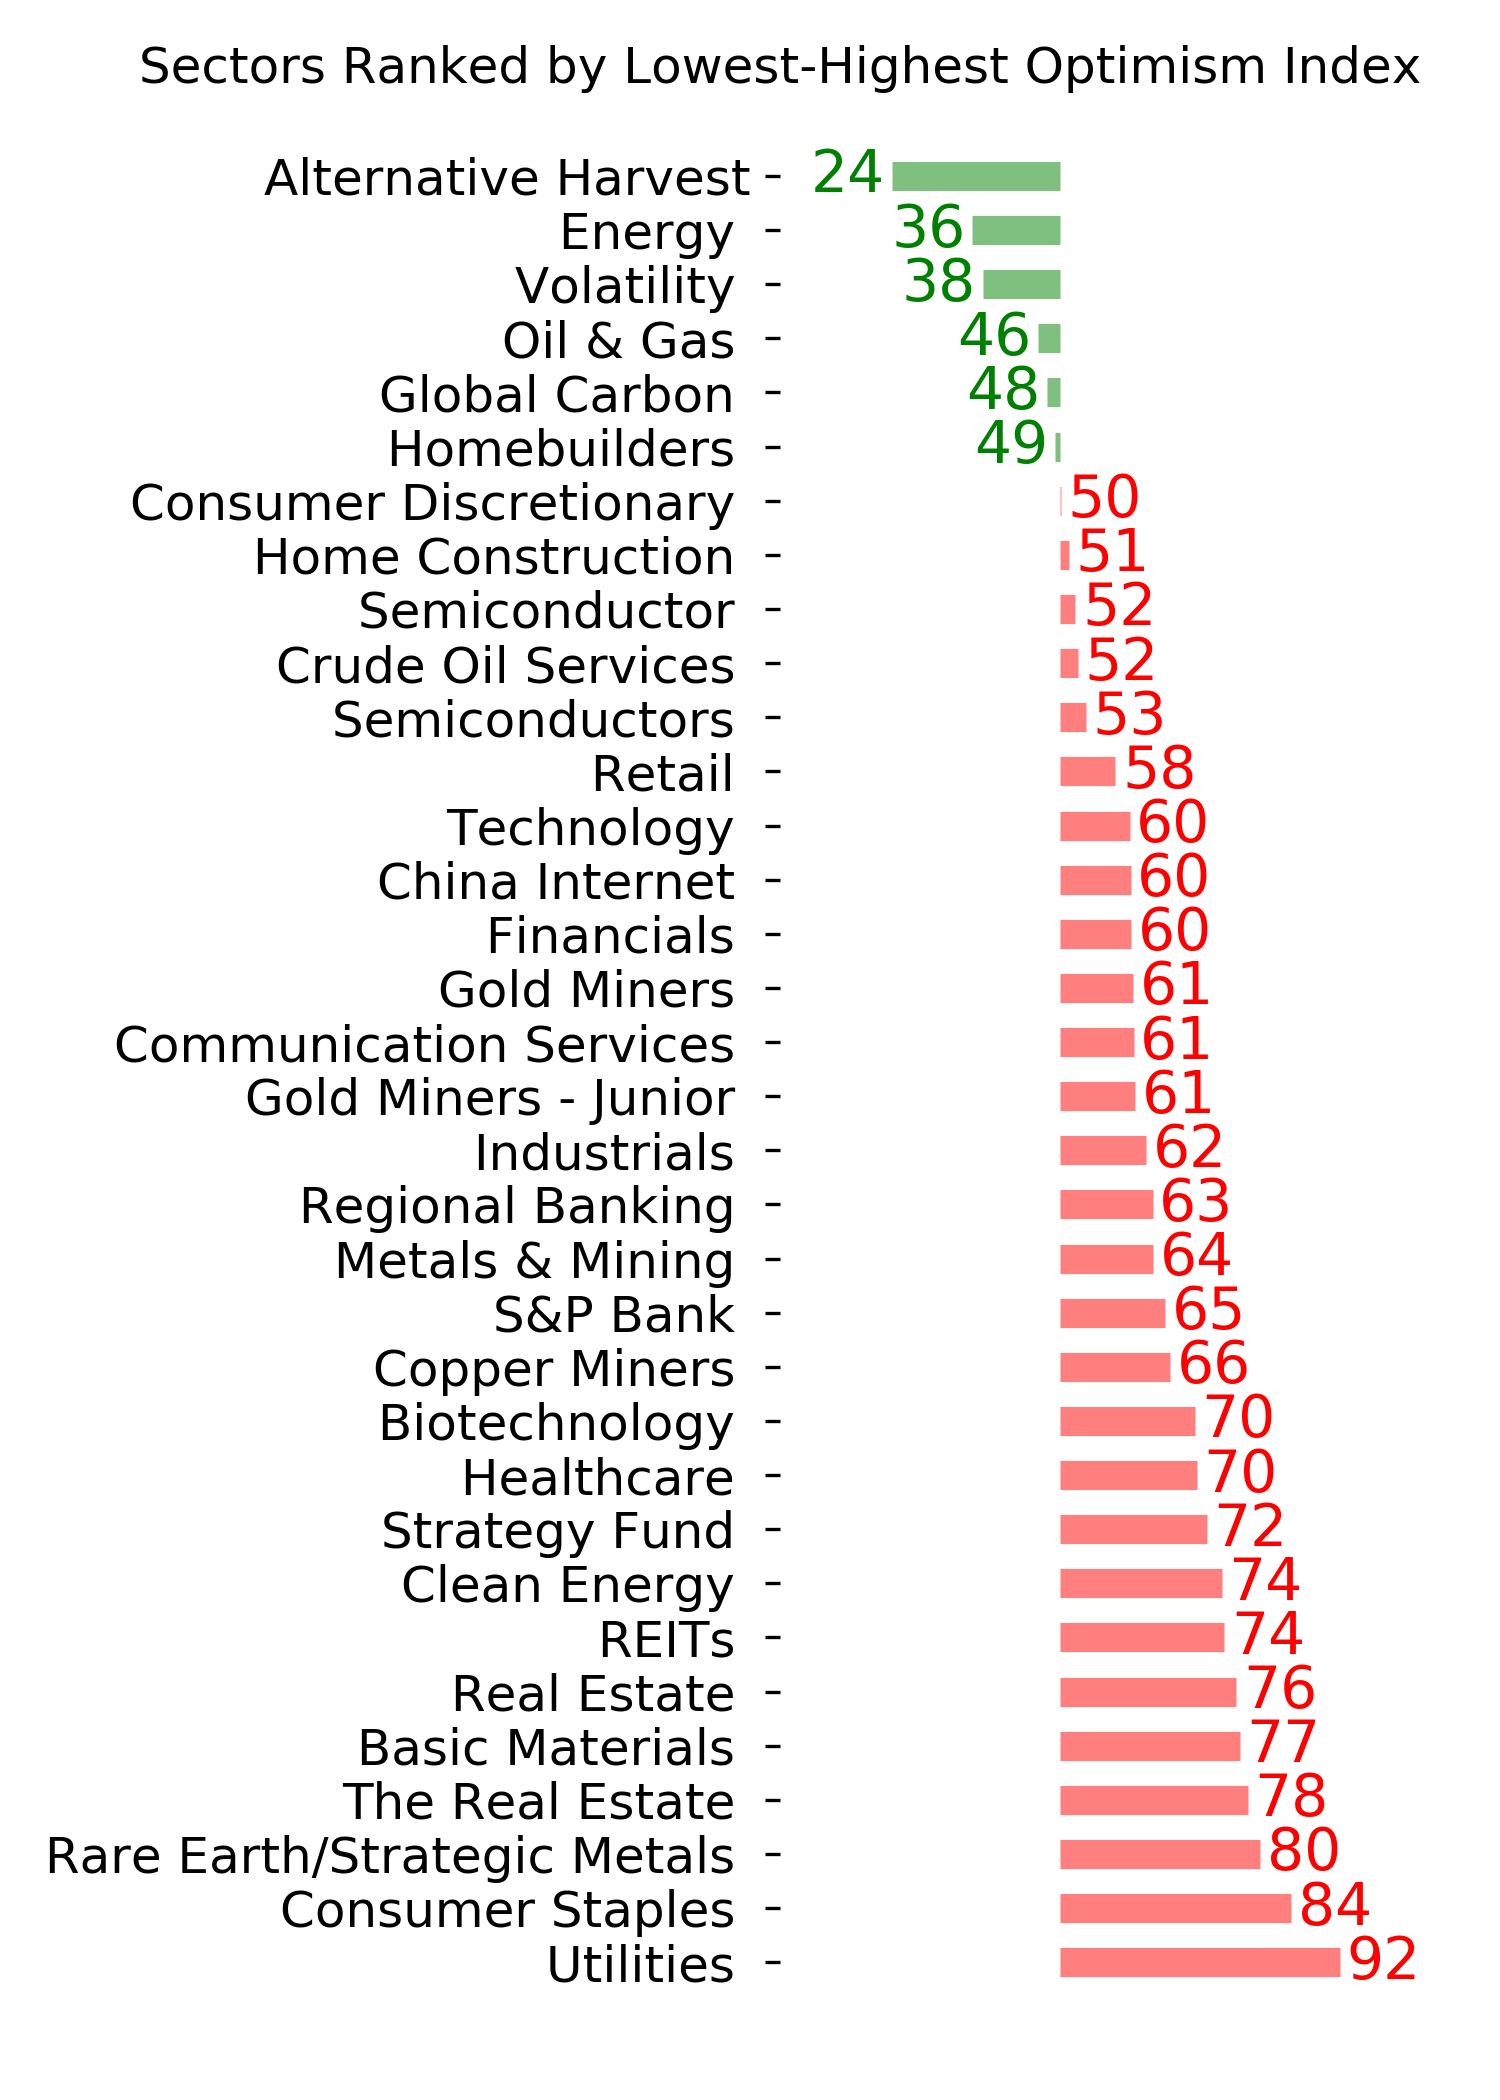
Ranks
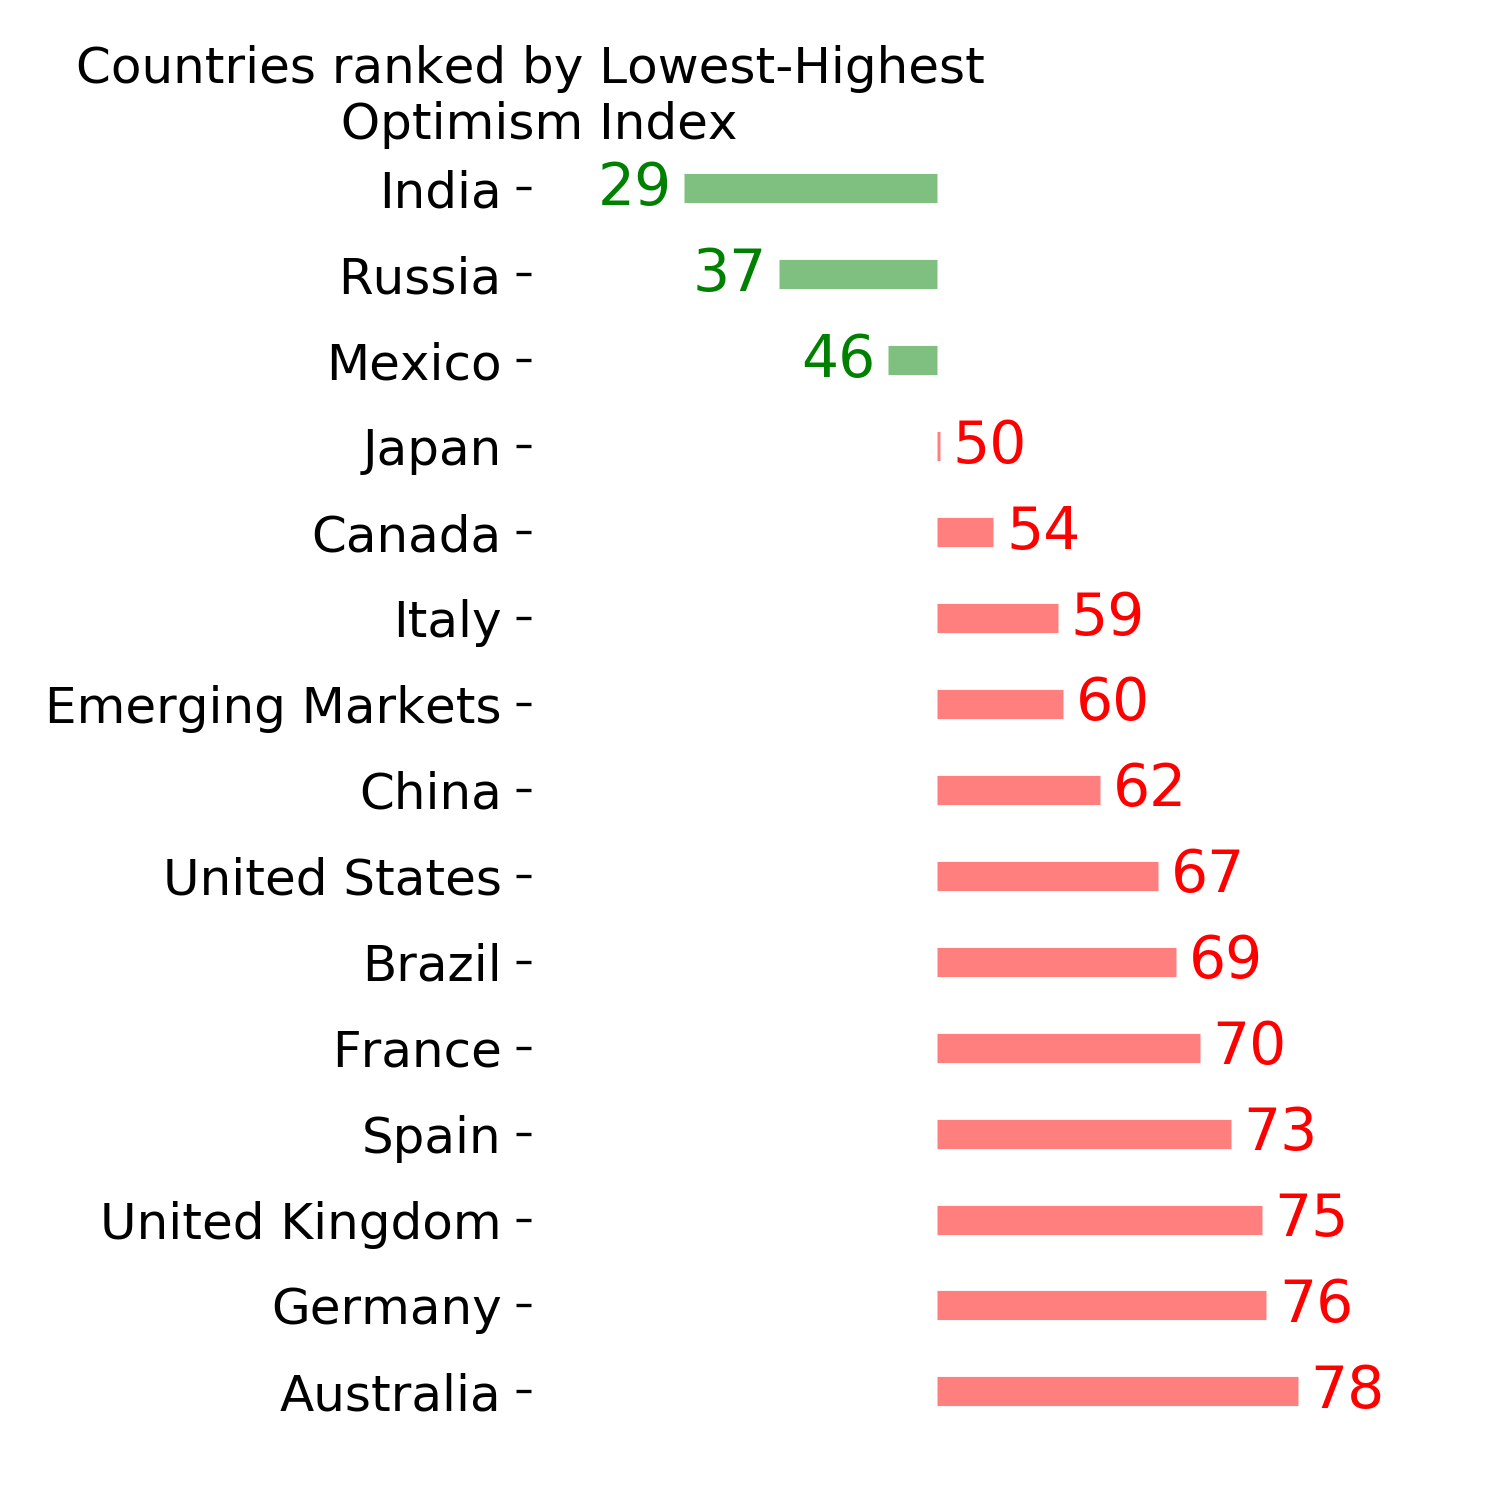
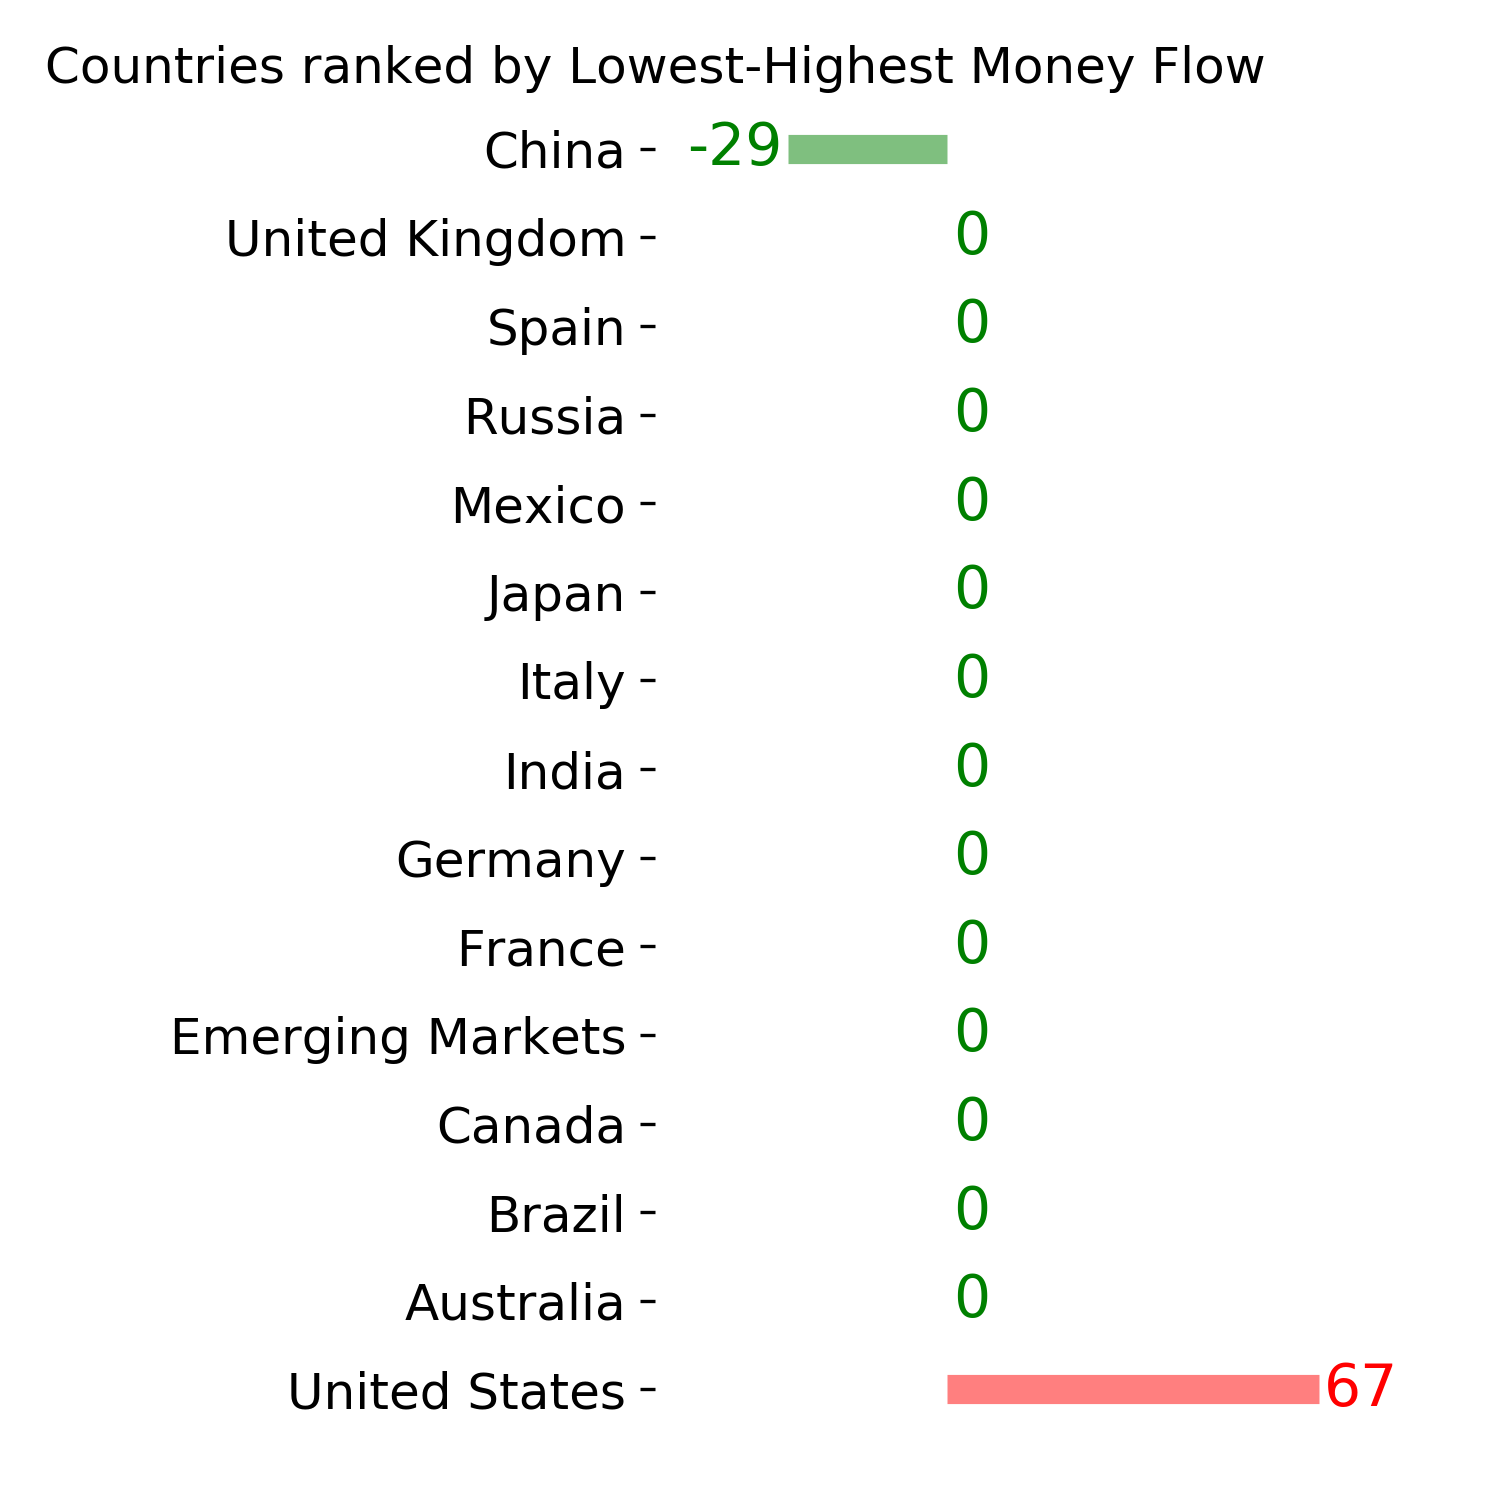
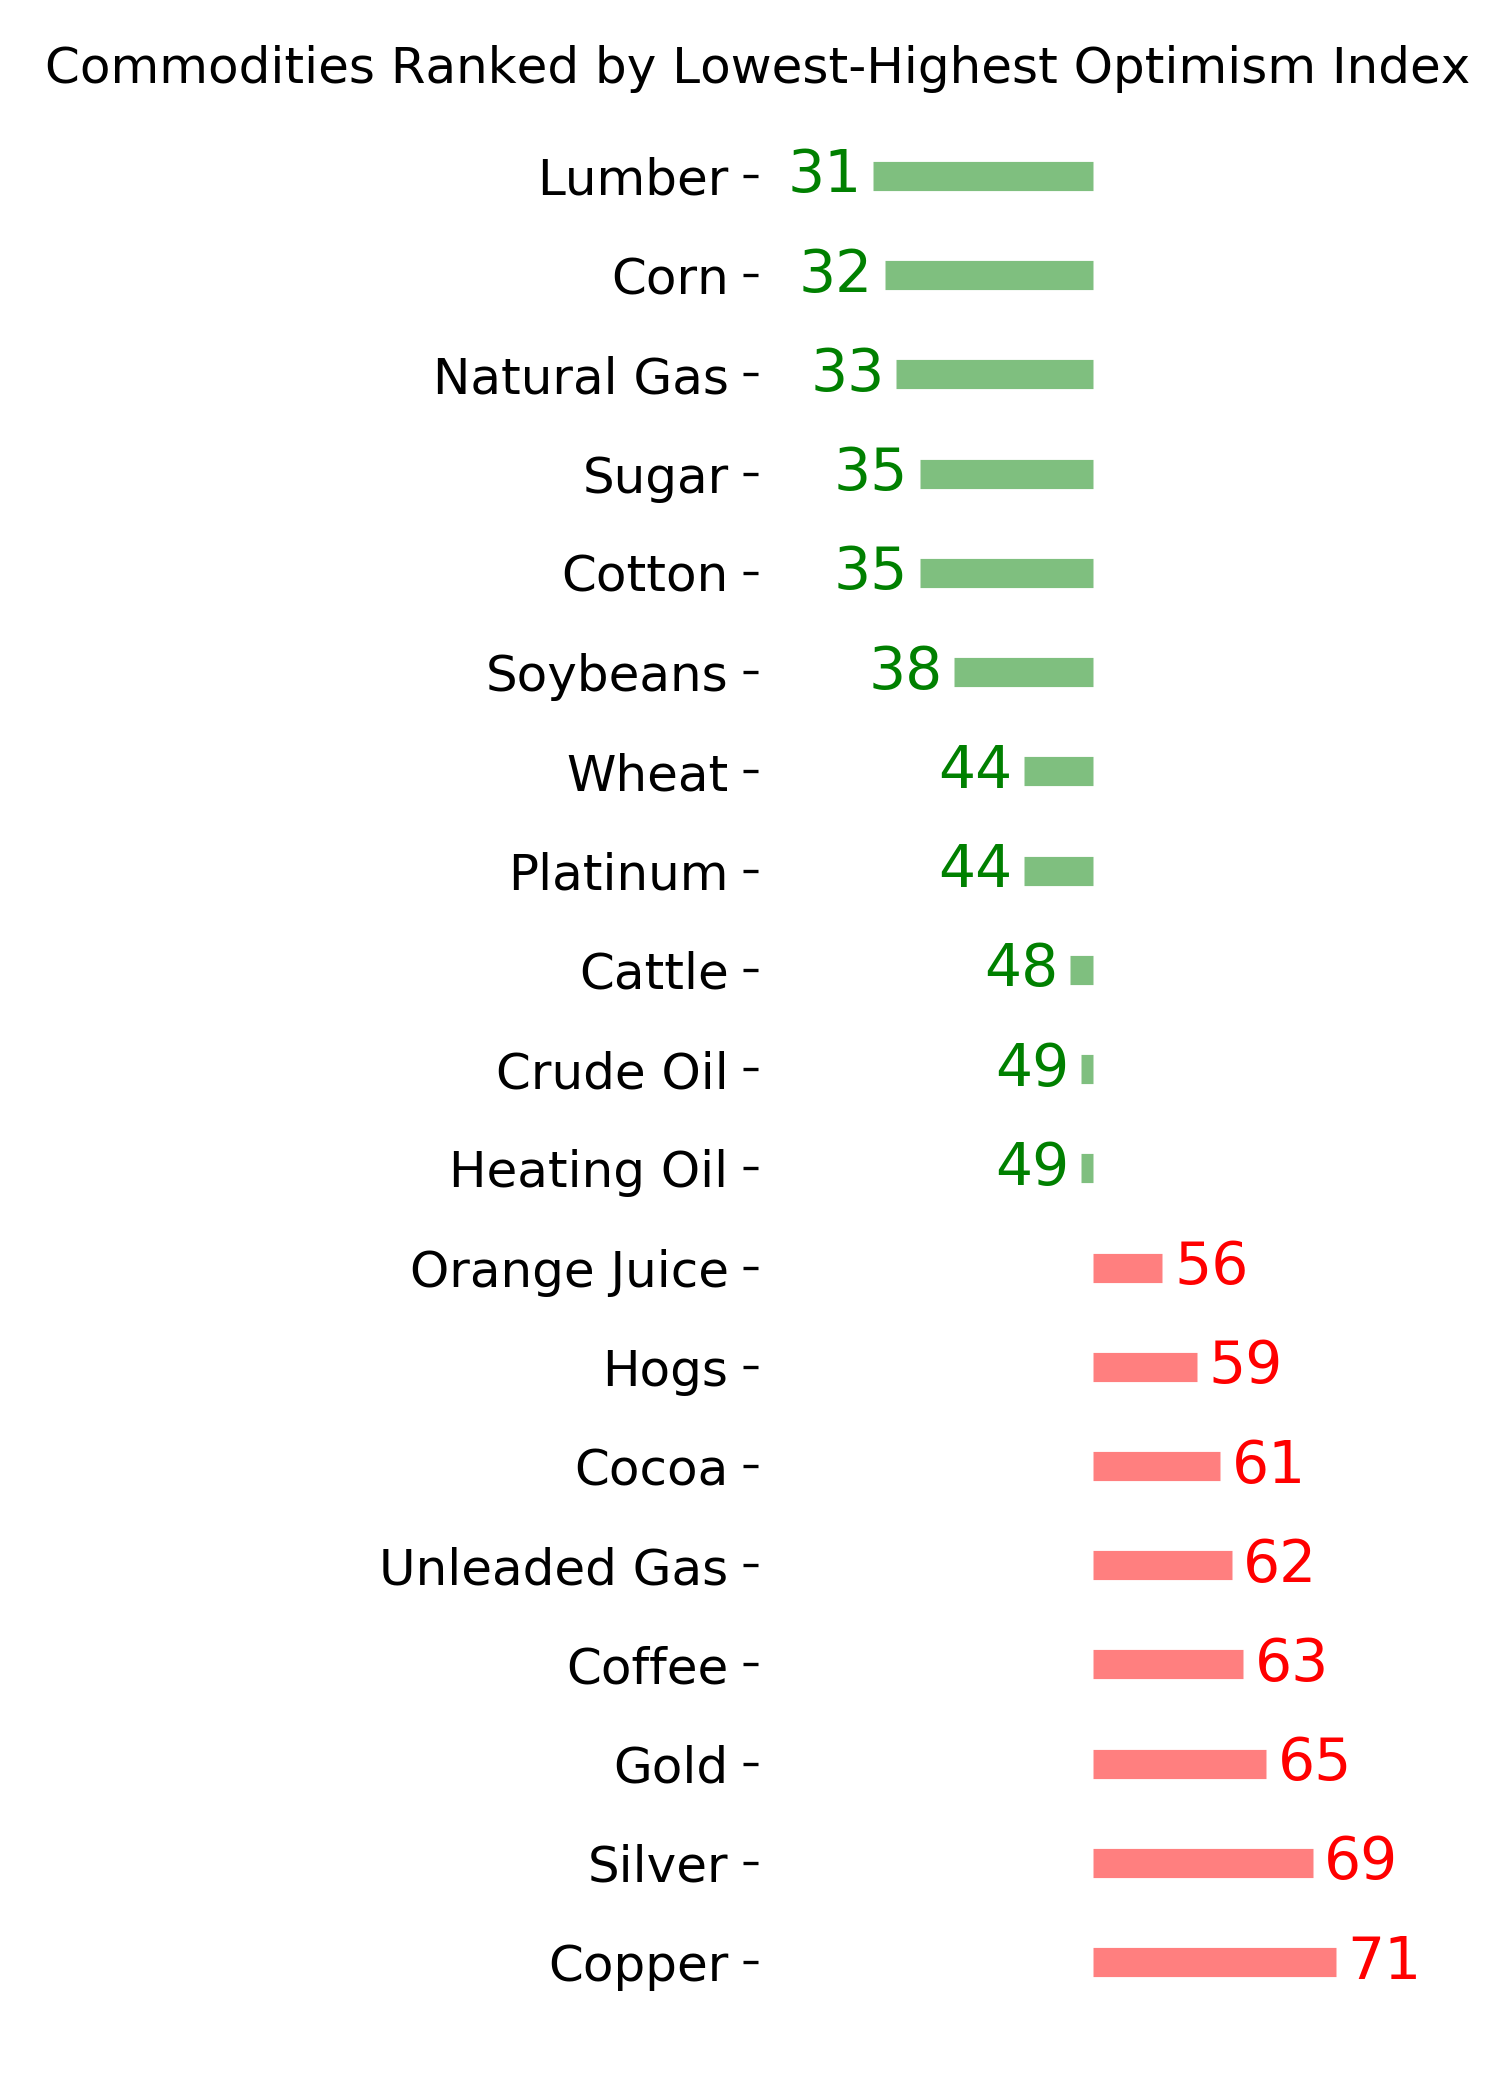
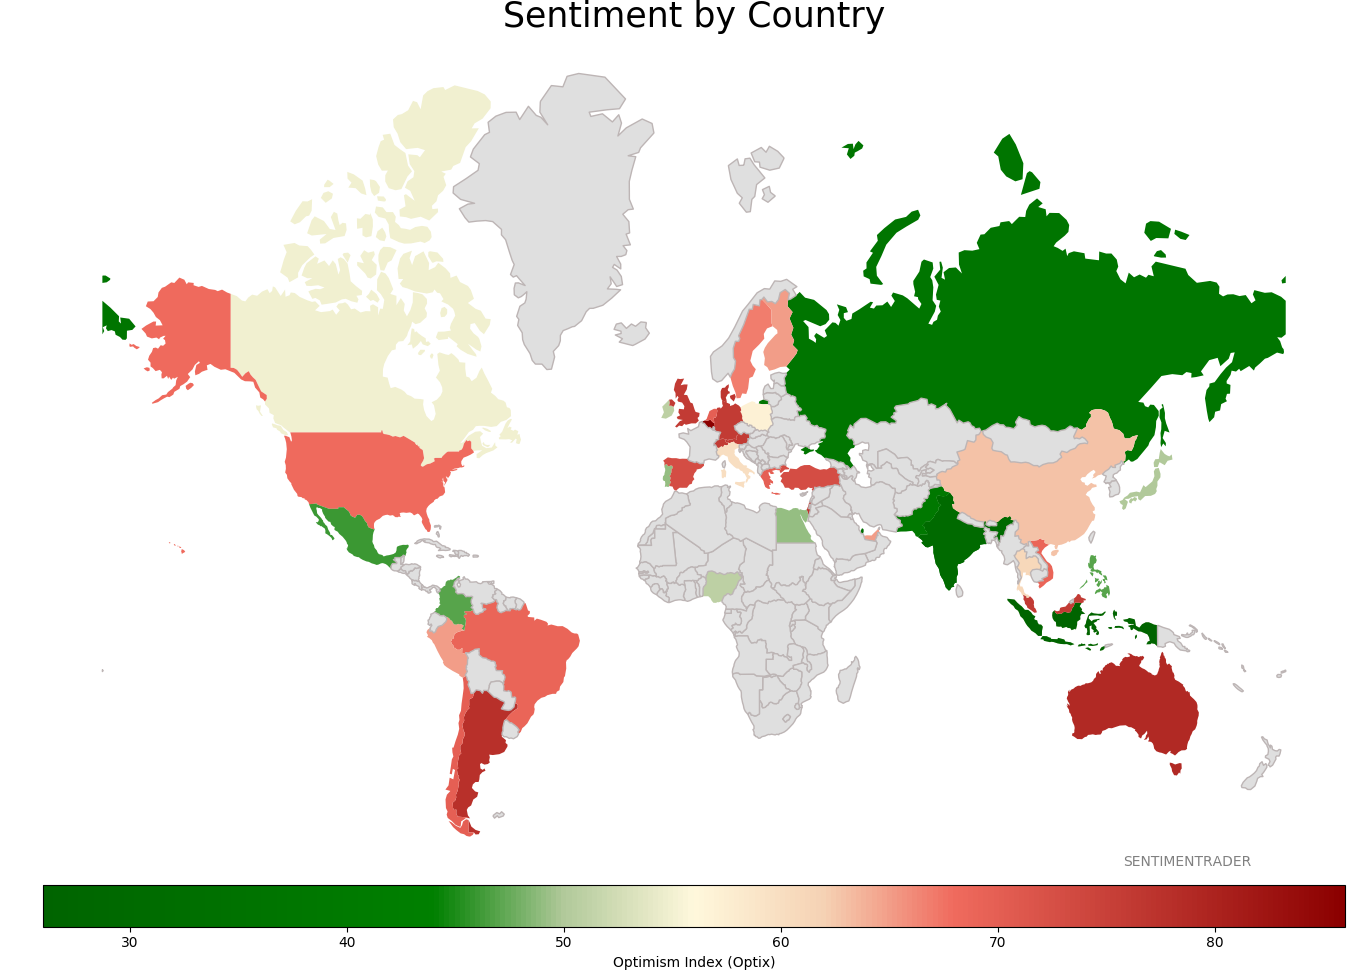
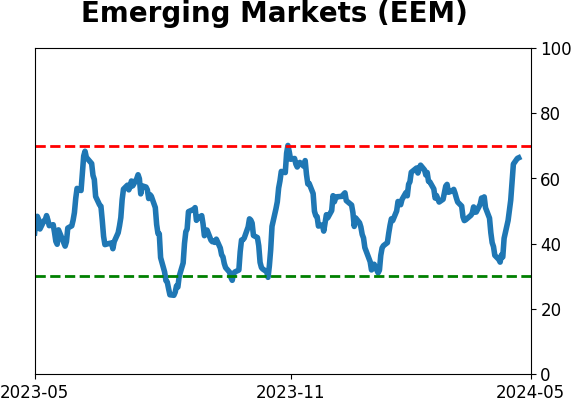
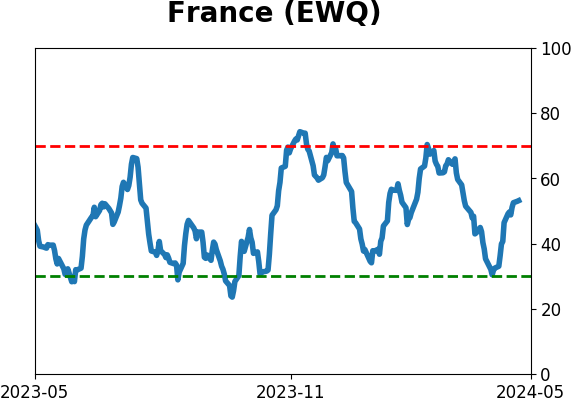
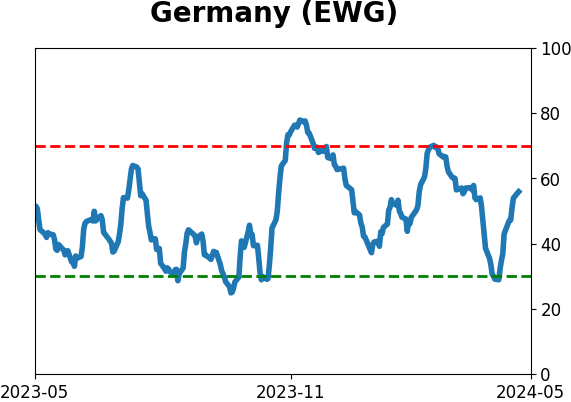
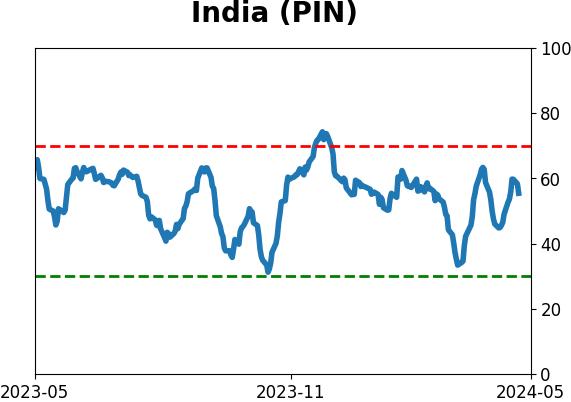
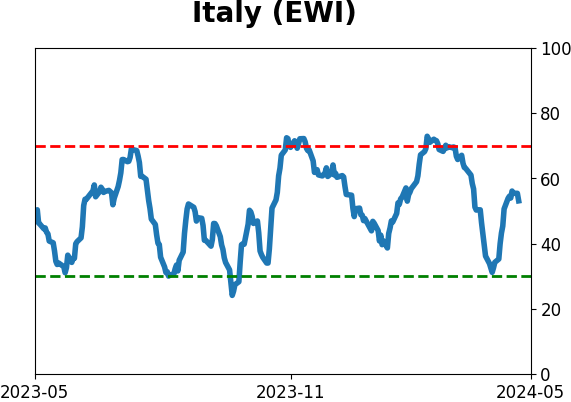
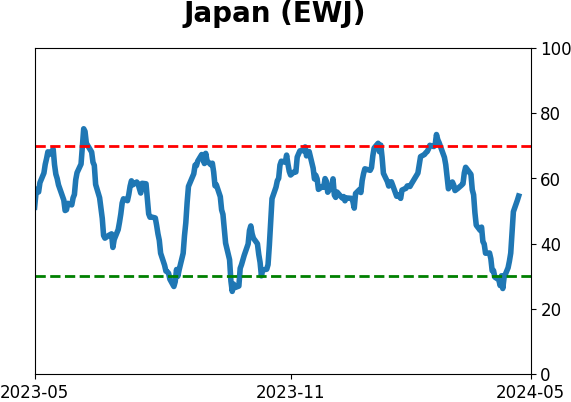
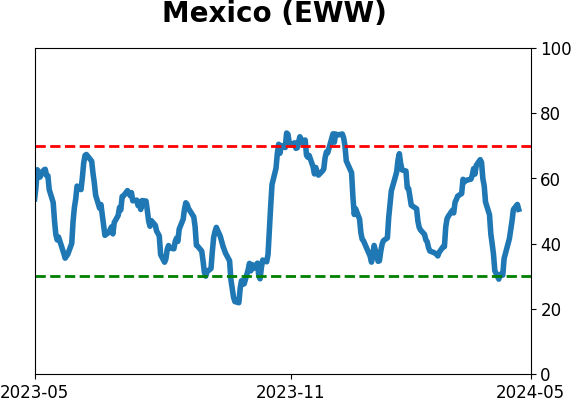
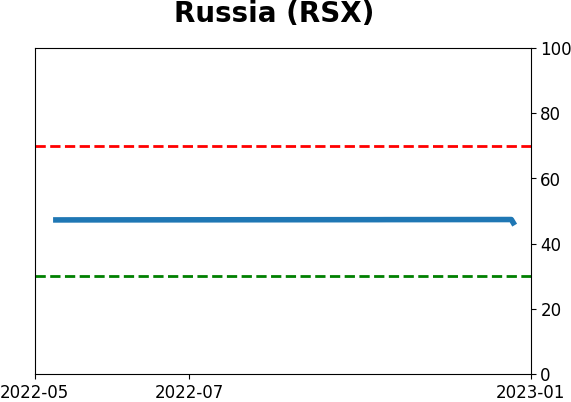
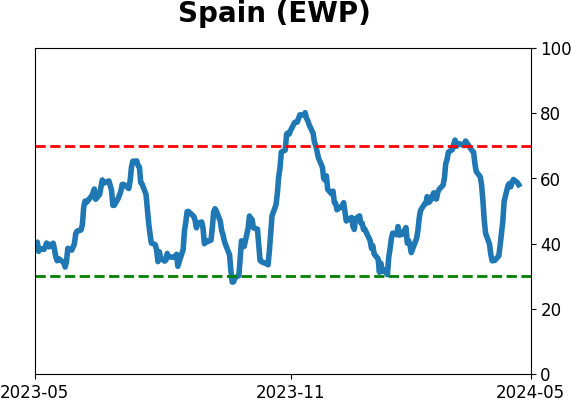
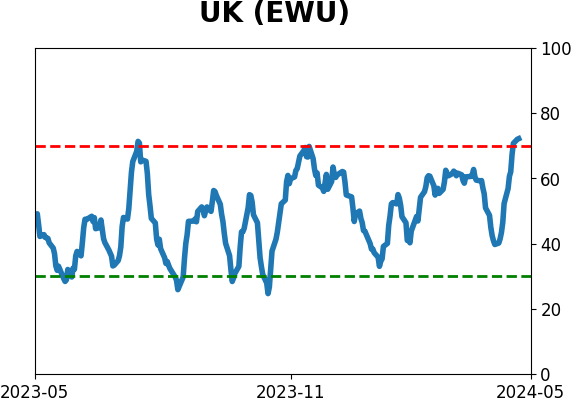
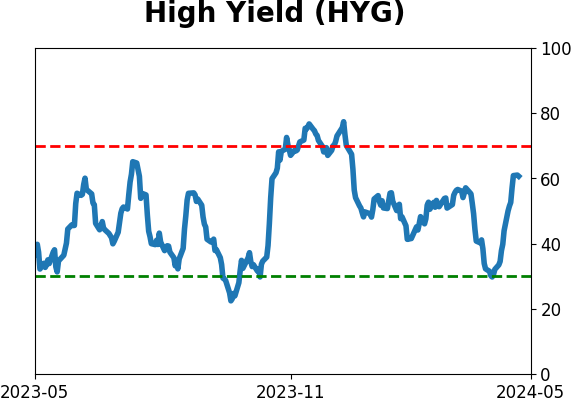
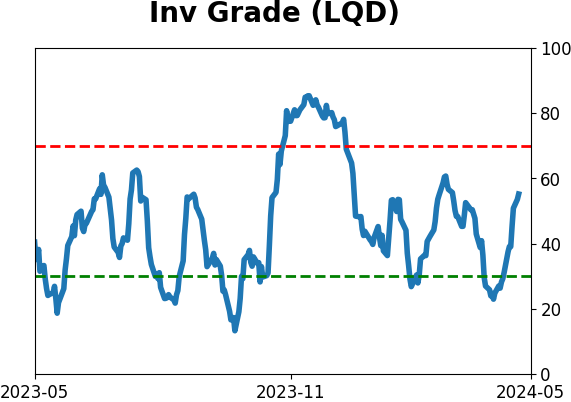
Sentiment Around The World
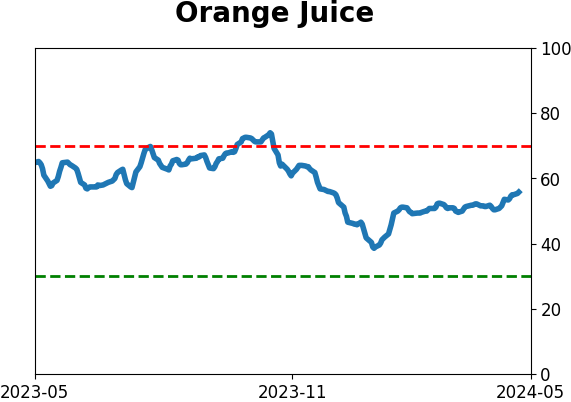
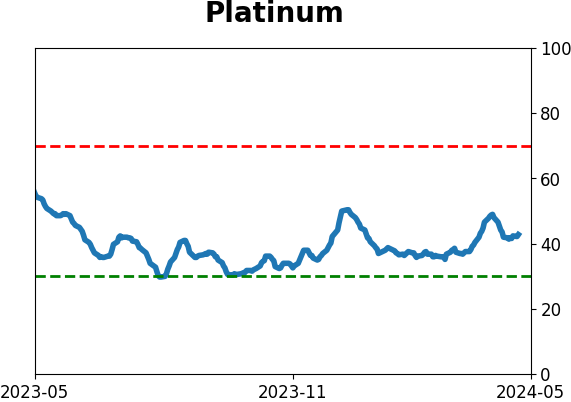
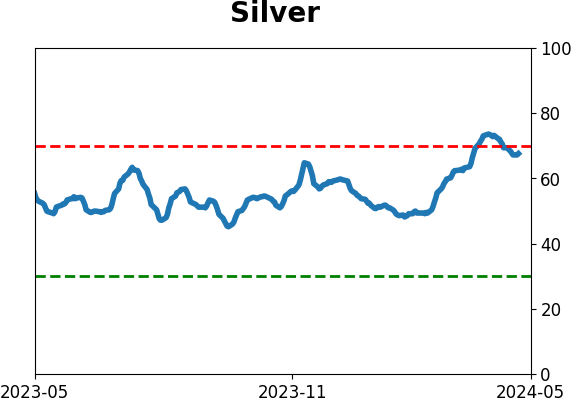
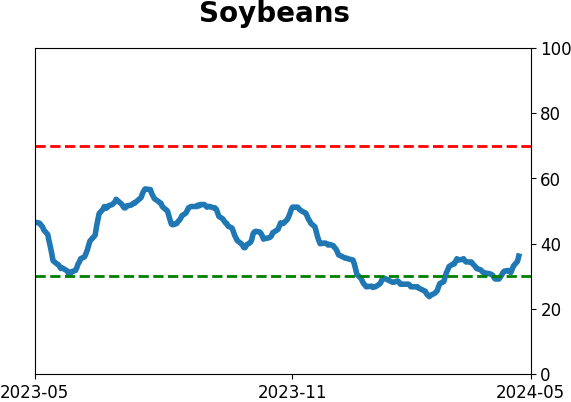
Optimism Index Thumbnails
|
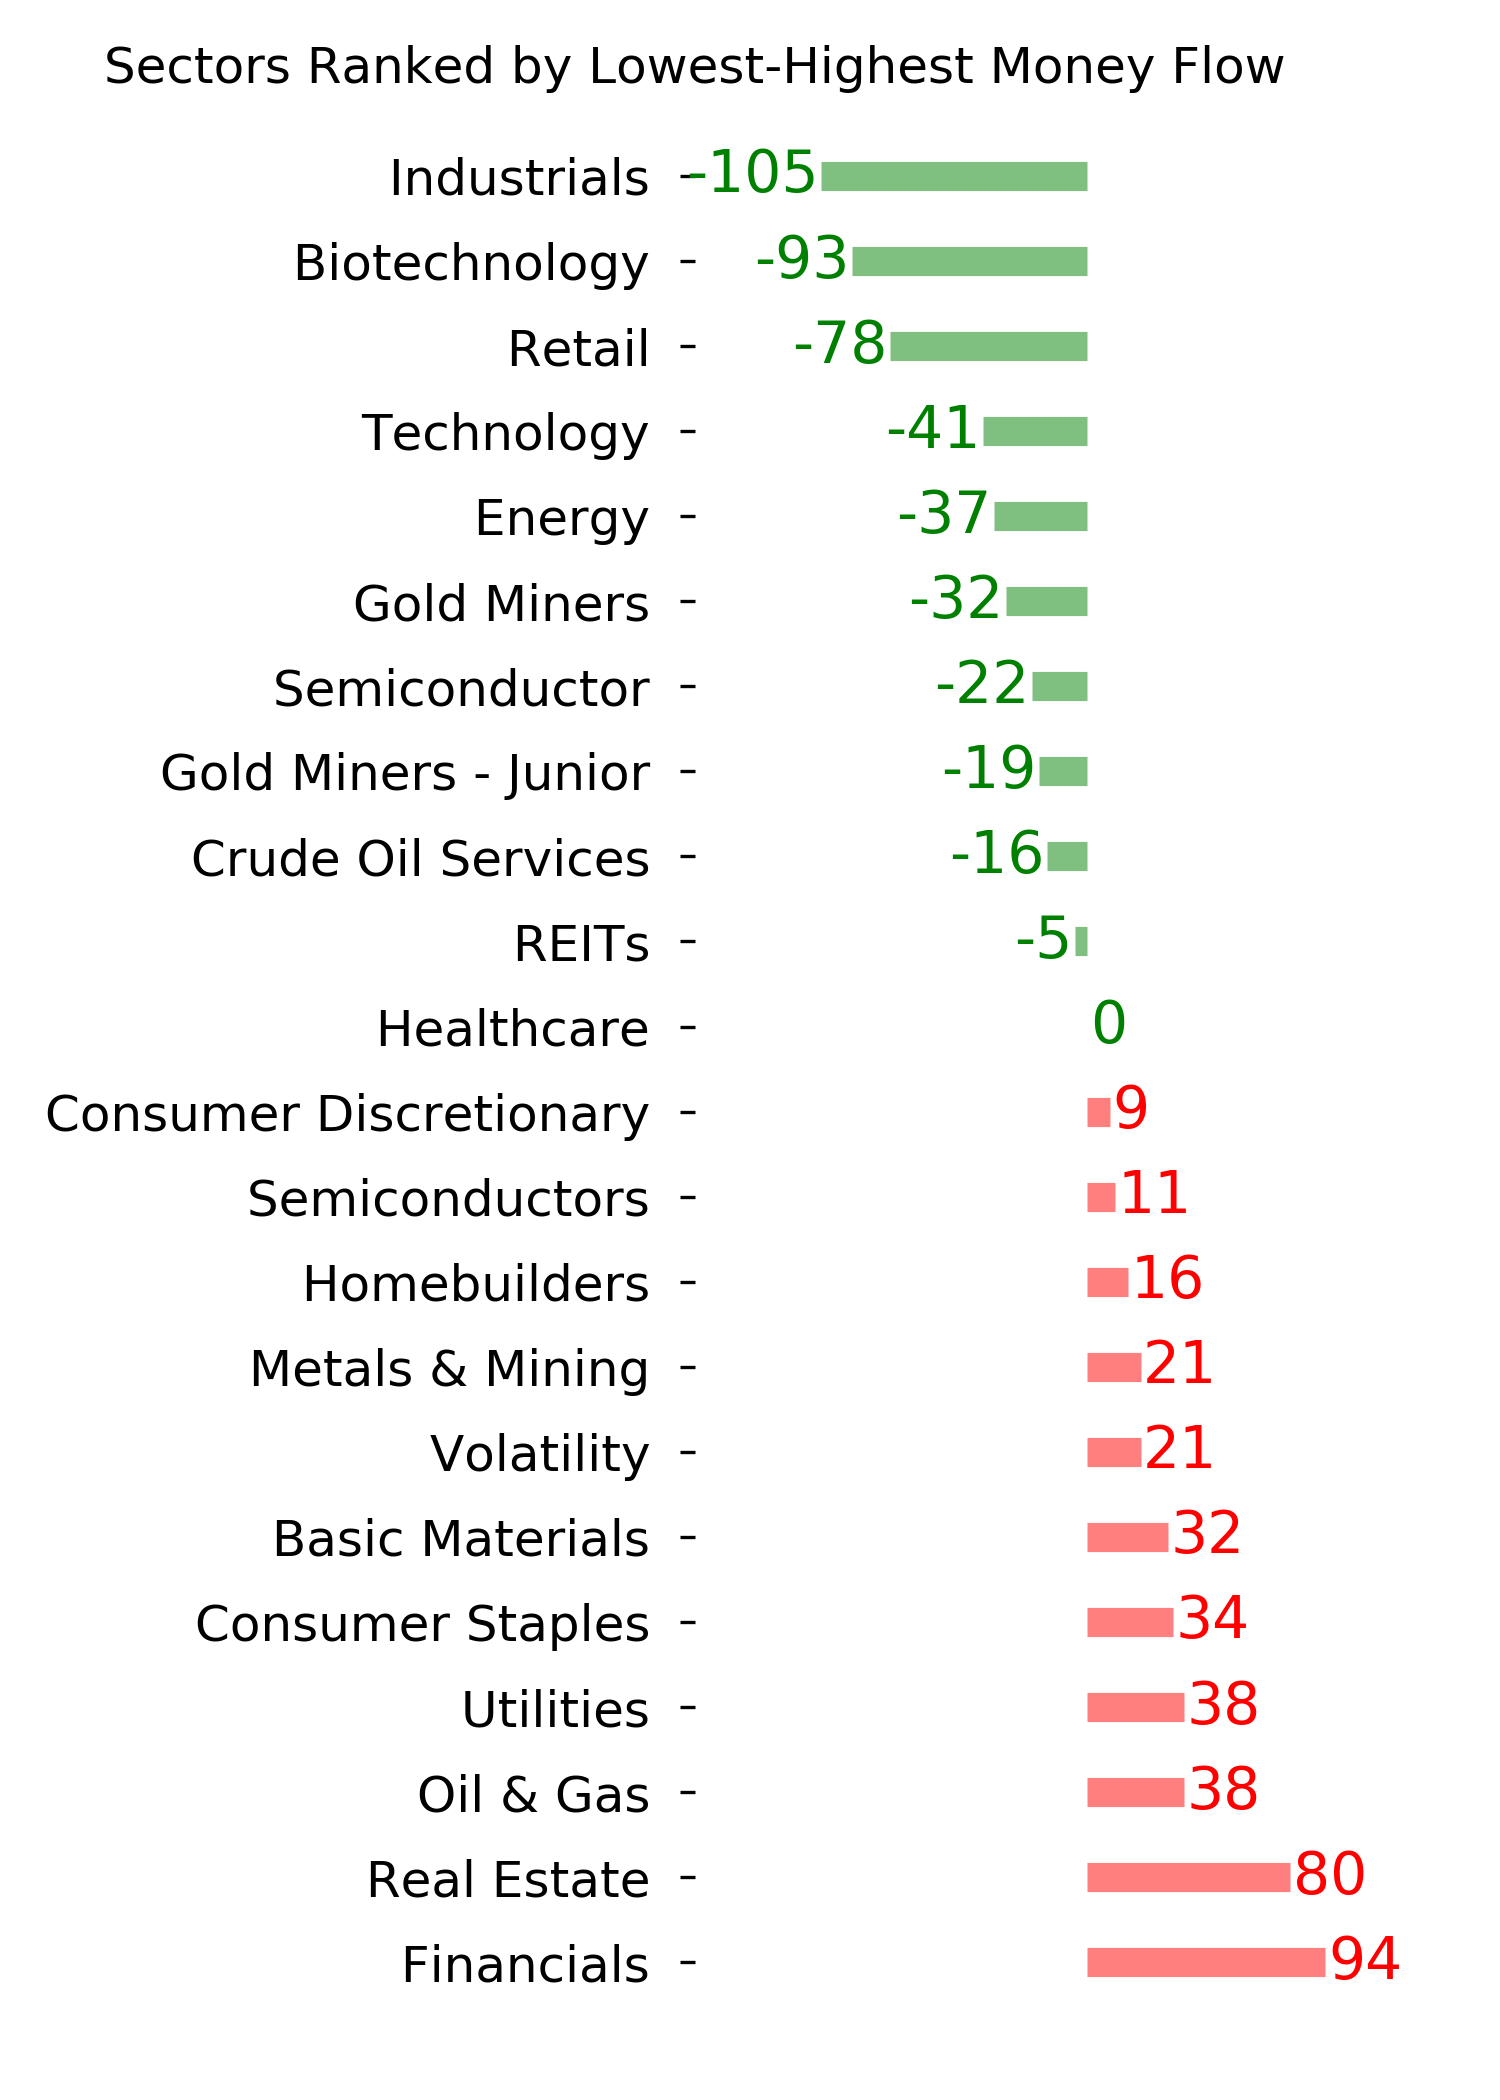
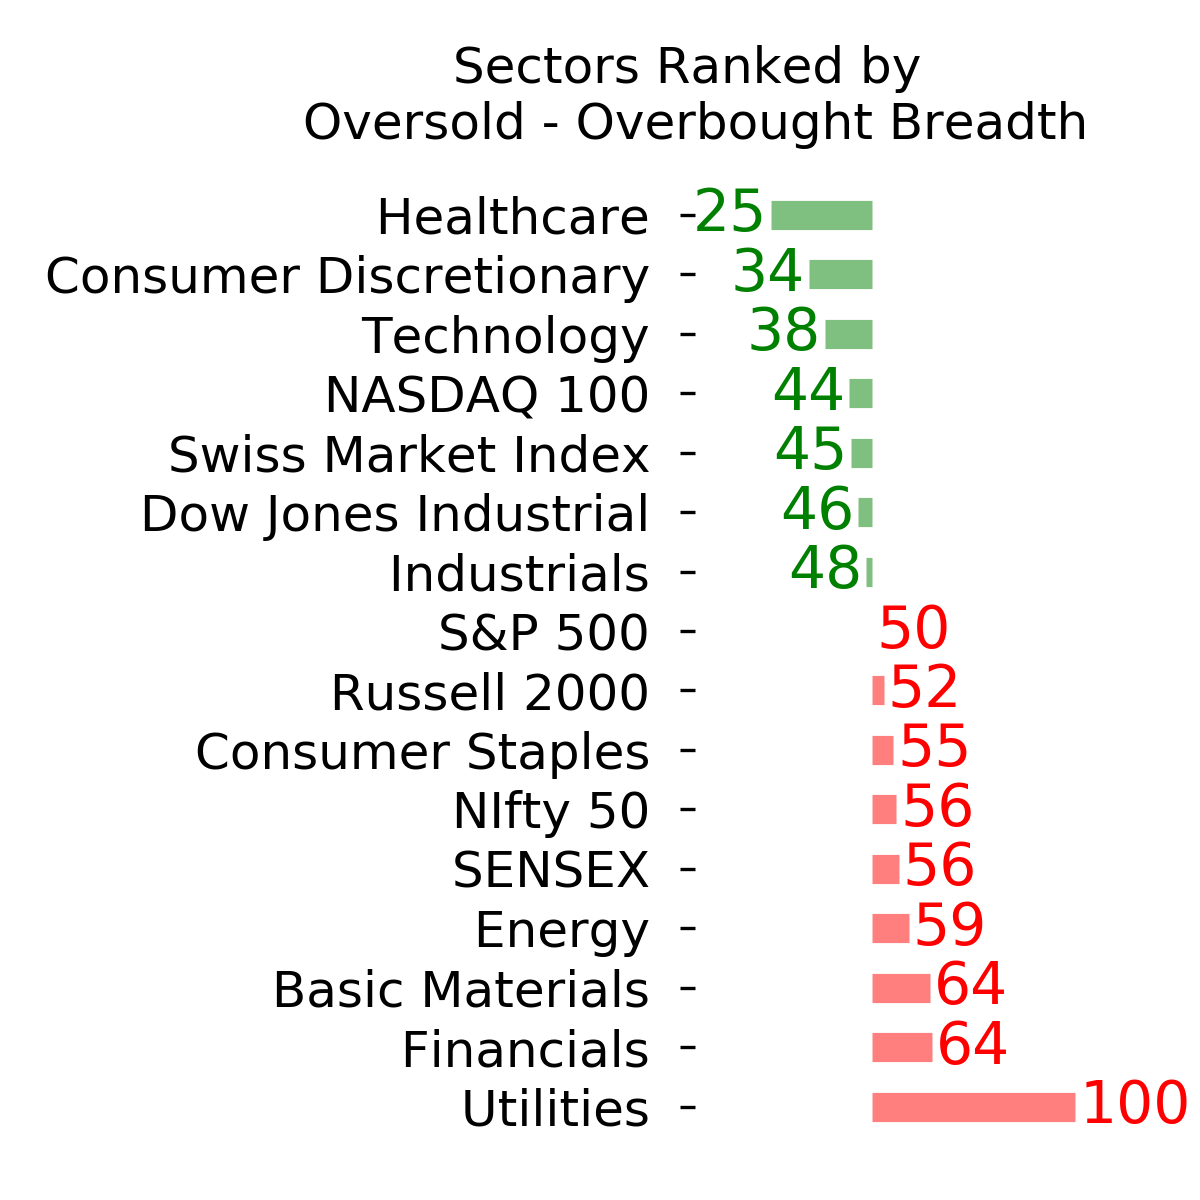
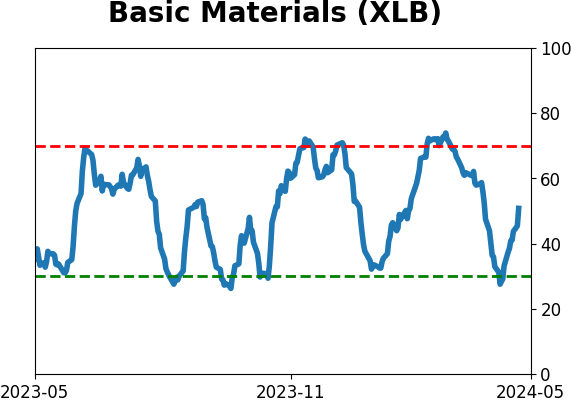
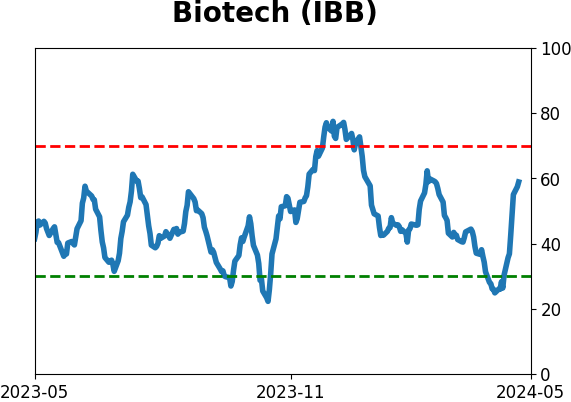
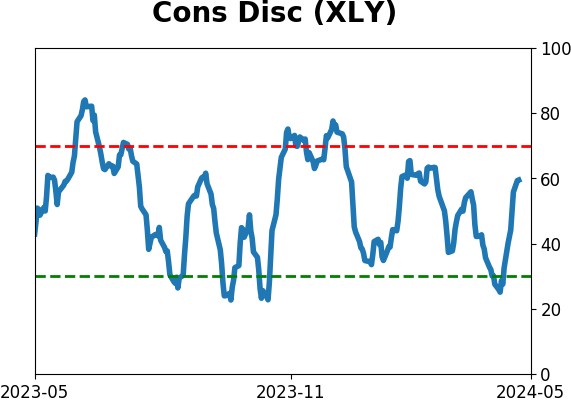
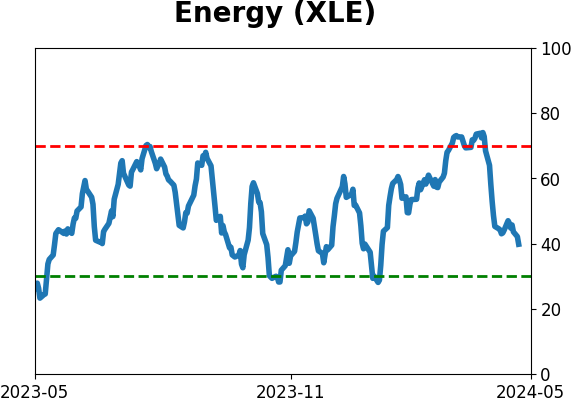
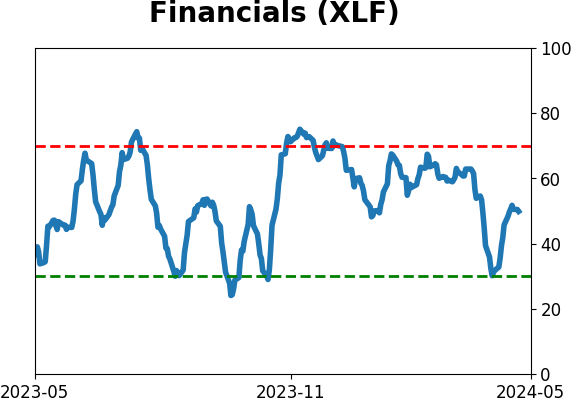
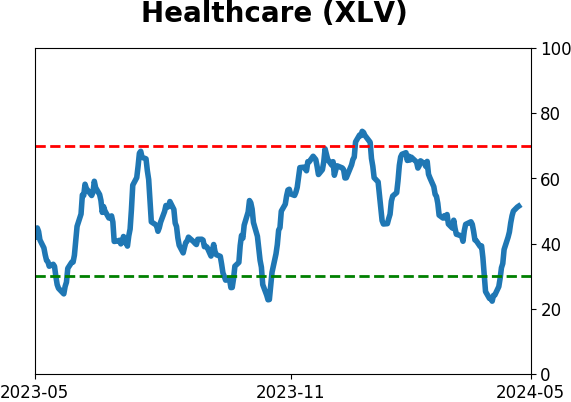
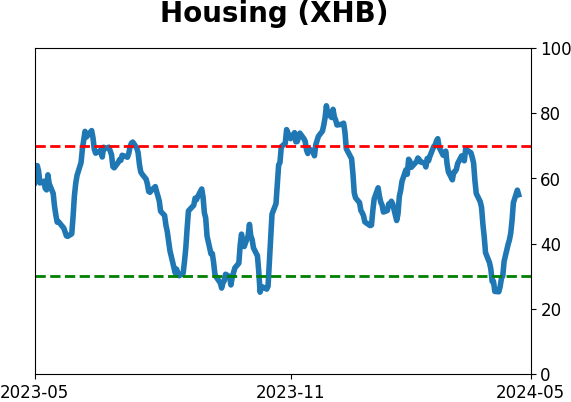
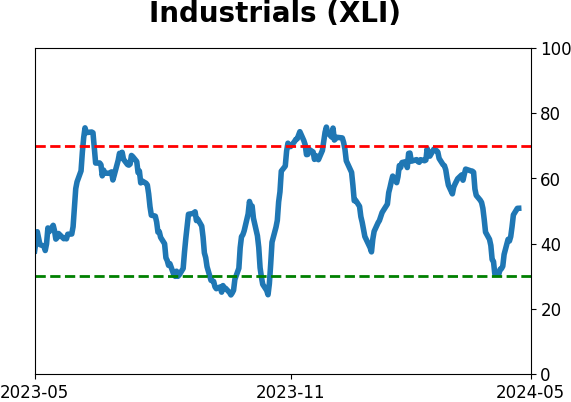
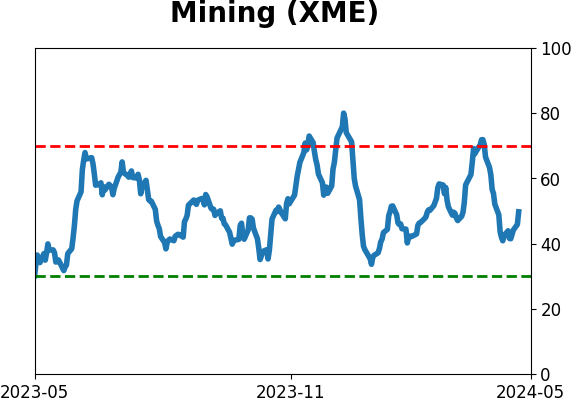
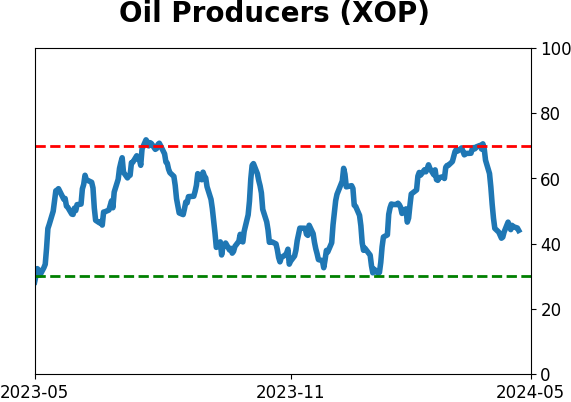
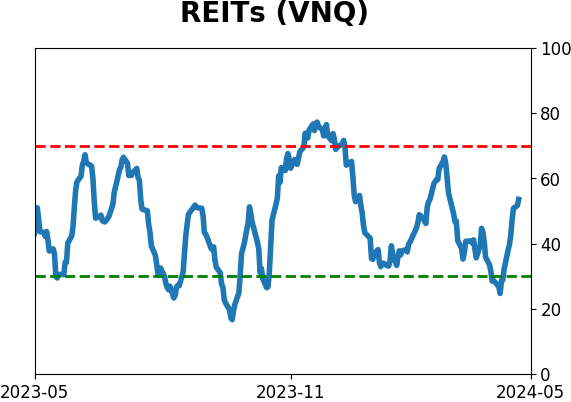
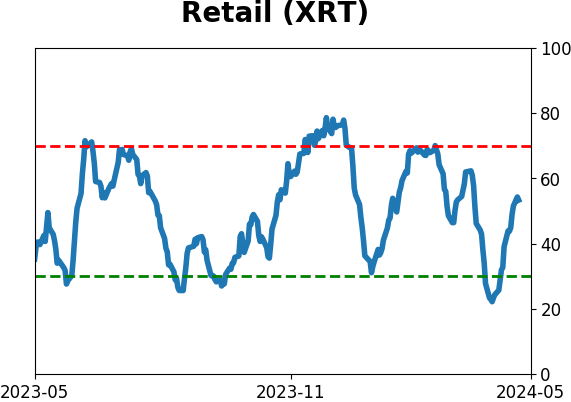
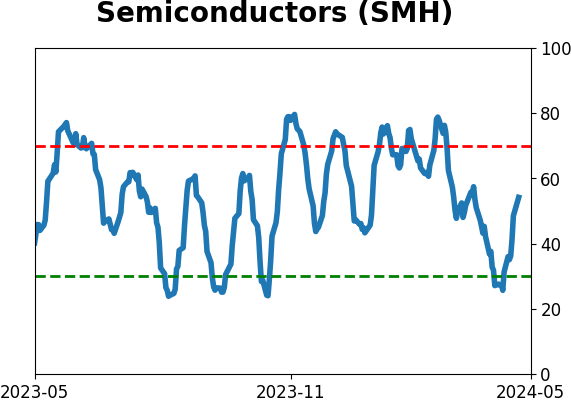
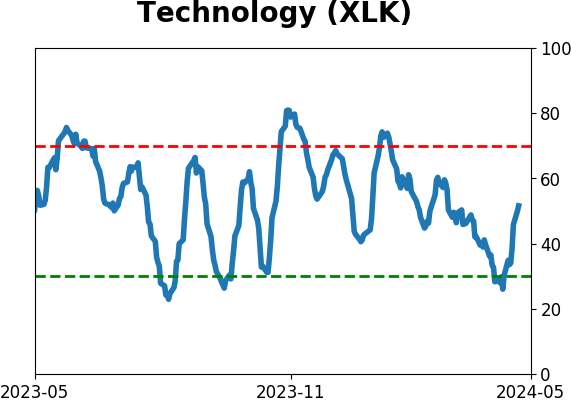
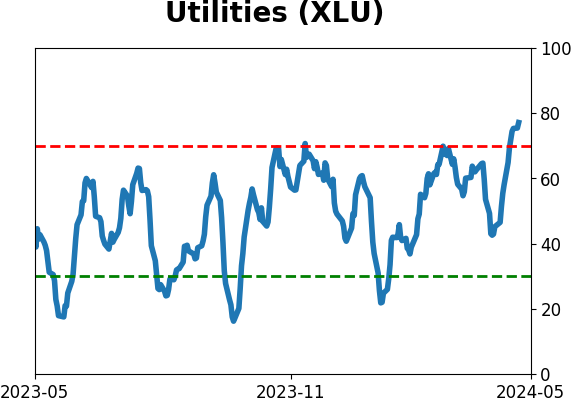
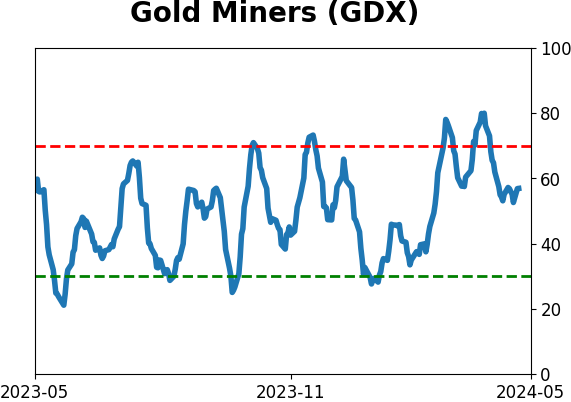
Sector ETF's - 10-Day Moving Average
|
|
|
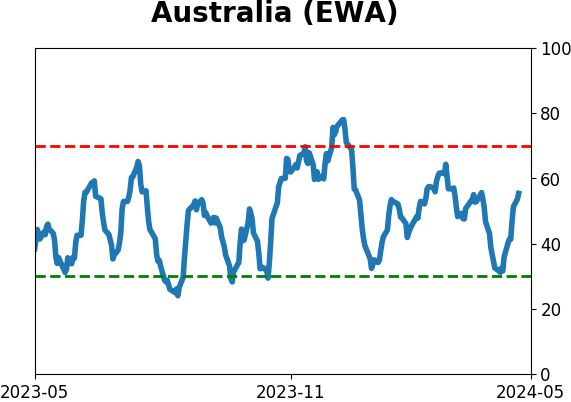
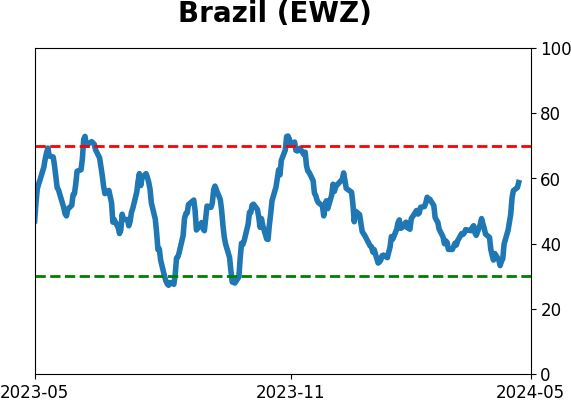
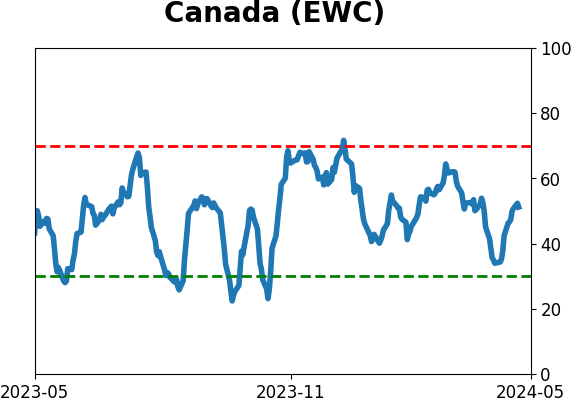
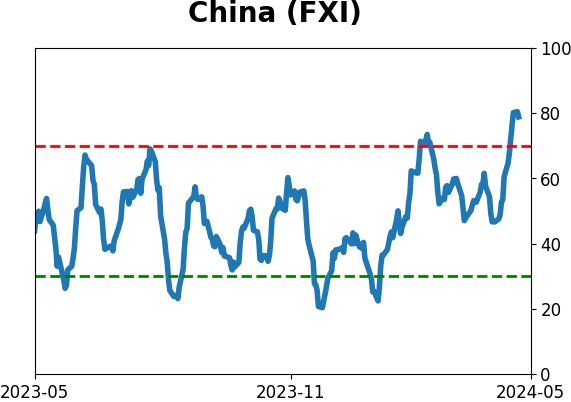
Country ETF's - 10-Day Moving Average
|
|
|
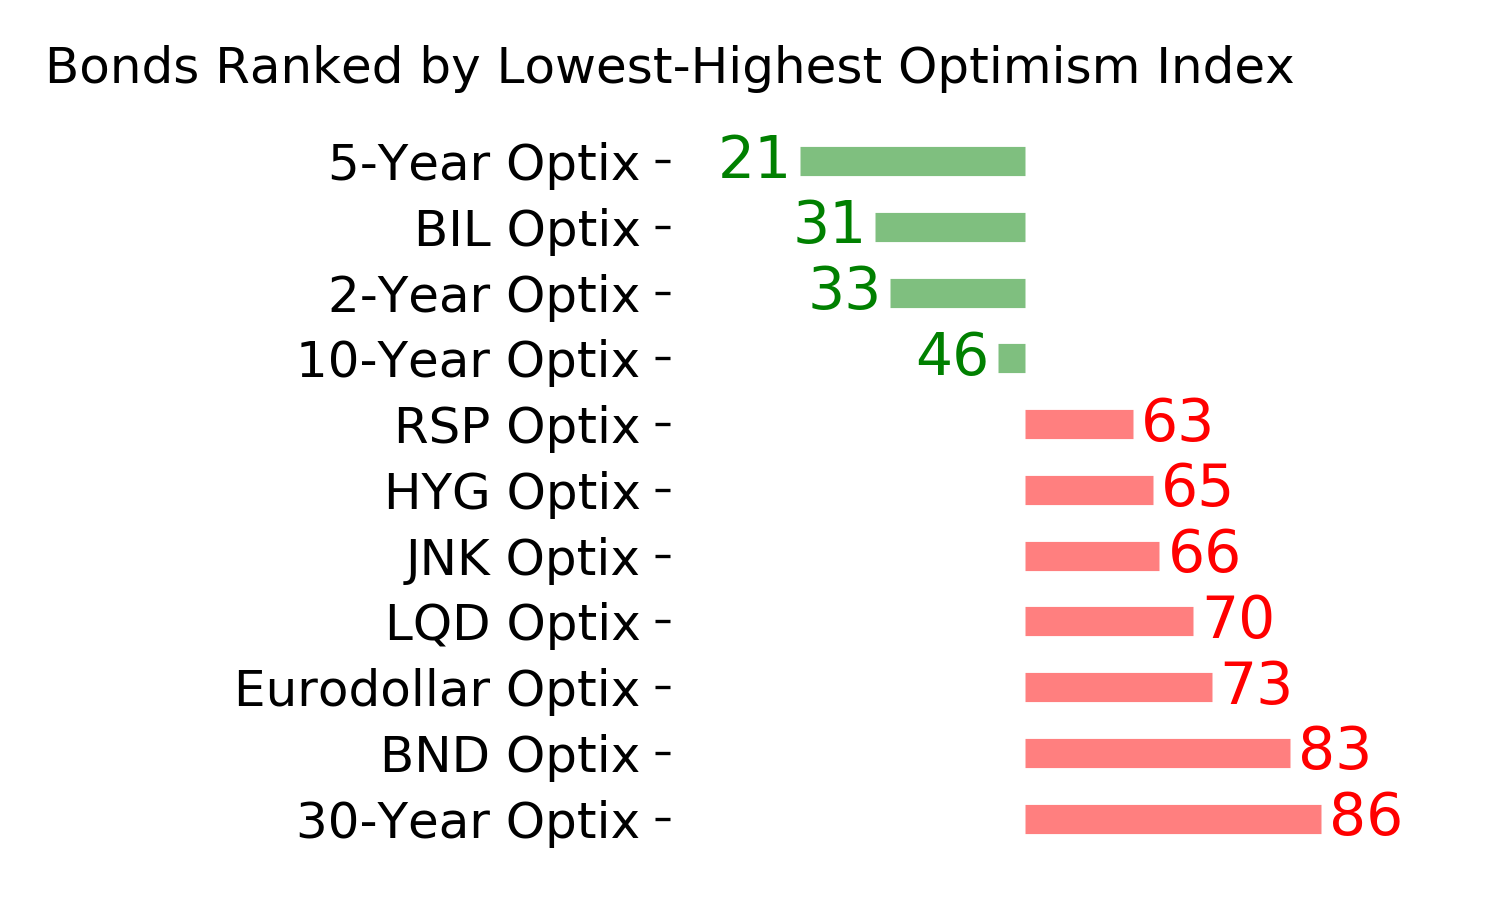
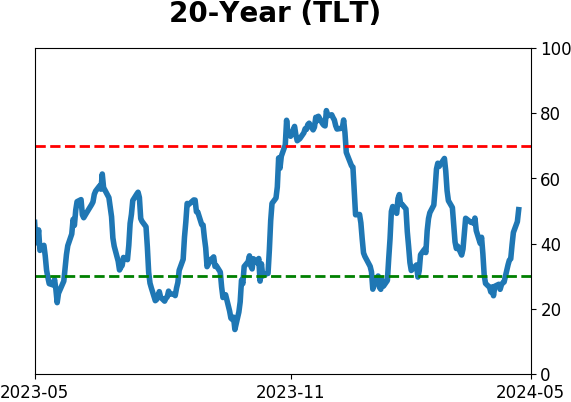
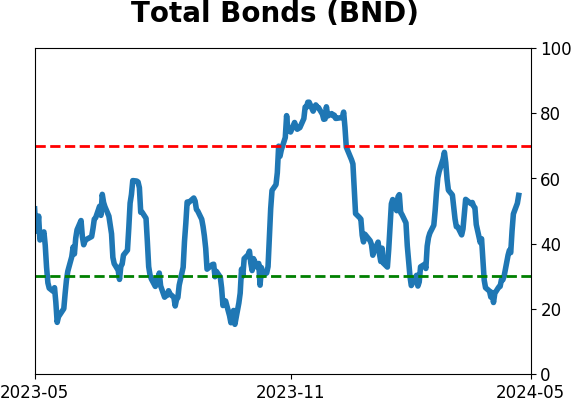
Bond ETF's - 10-Day Moving Average
|
|
|
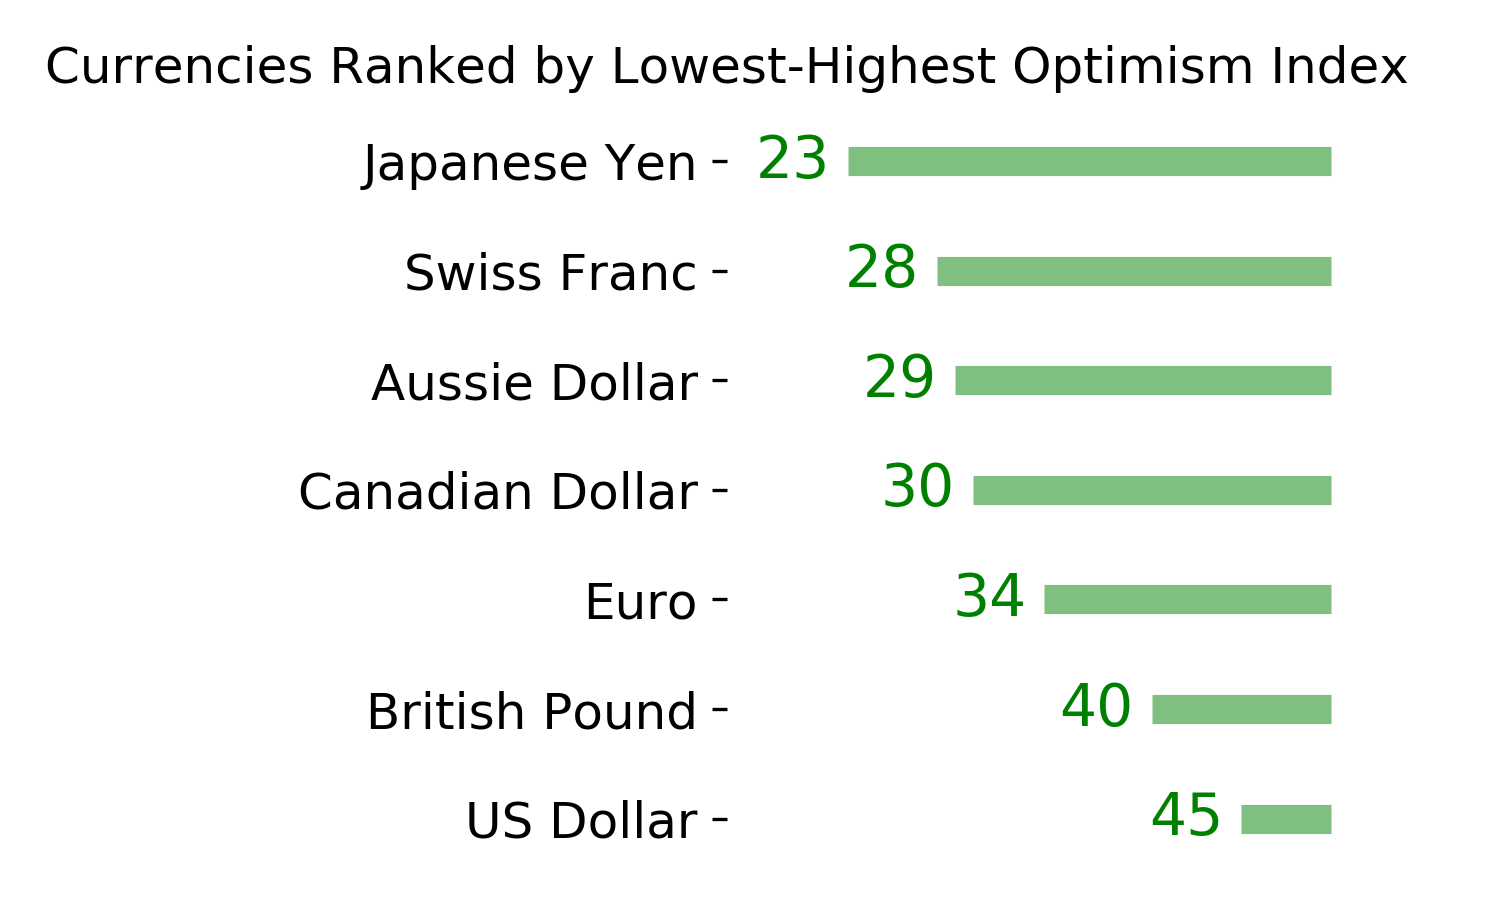
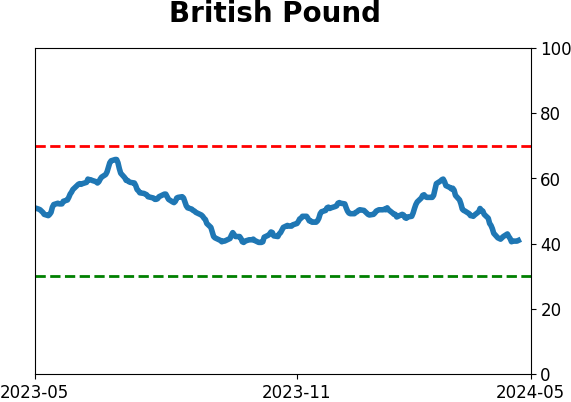
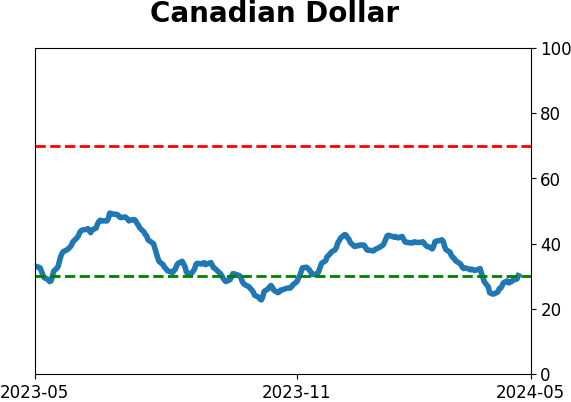
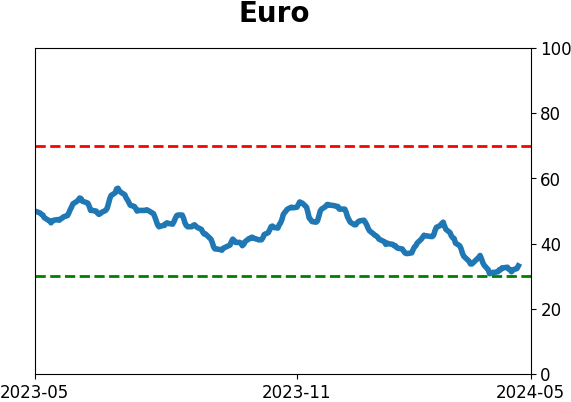
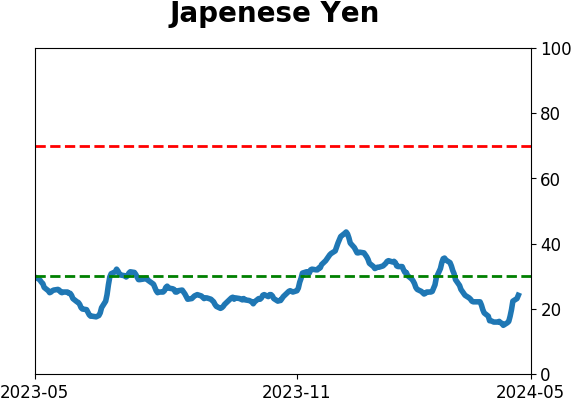
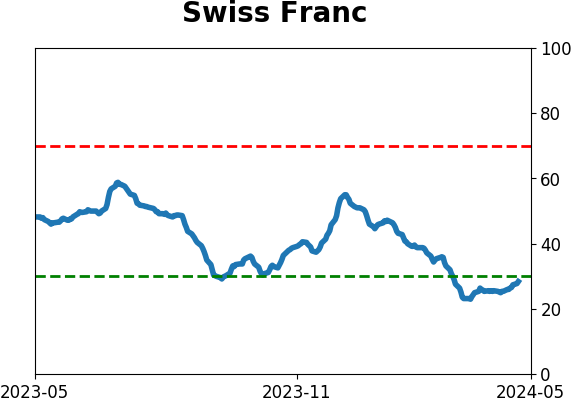
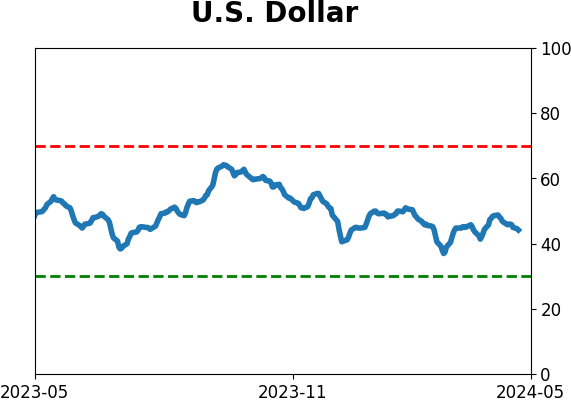
Currency ETF's - 5-Day Moving Average
|
|
|
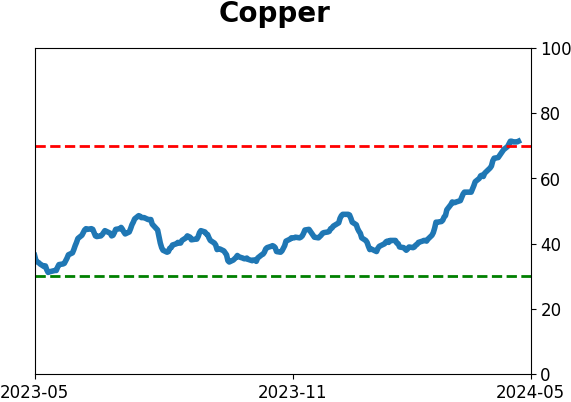
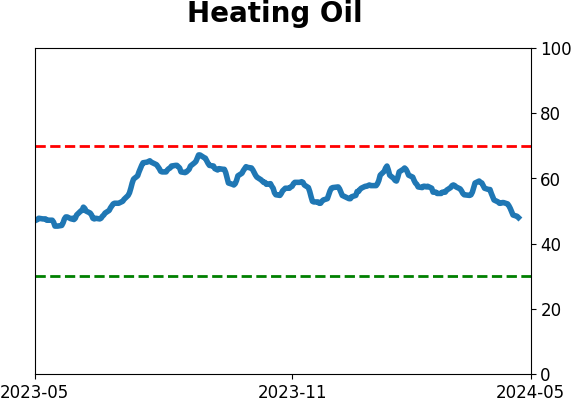
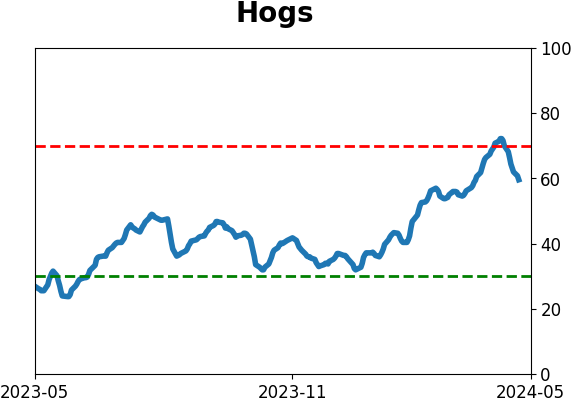
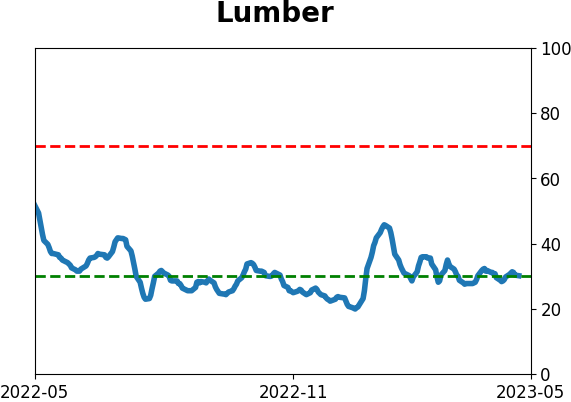
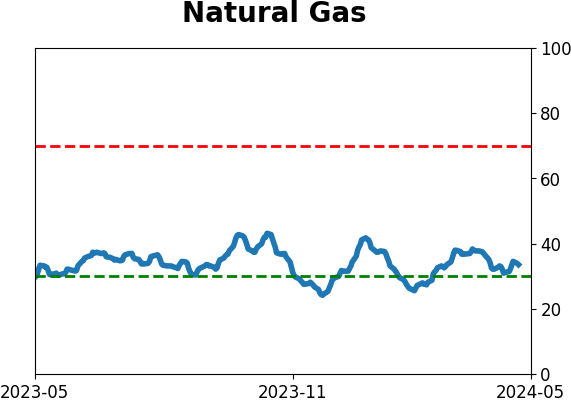
Commodity ETF's - 5-Day Moving Average
|
|