Headlines
|
|
Investors and consumers are nearly all-in:
The latest surveys of investors and consumers show historically high levels of optimism about the path of stocks. The majority of respondents expect stocks to rise, and that's a worry for contrarians. But coming out of drastic levels of pessimism, such high optimism has not been a worry long-term.
|
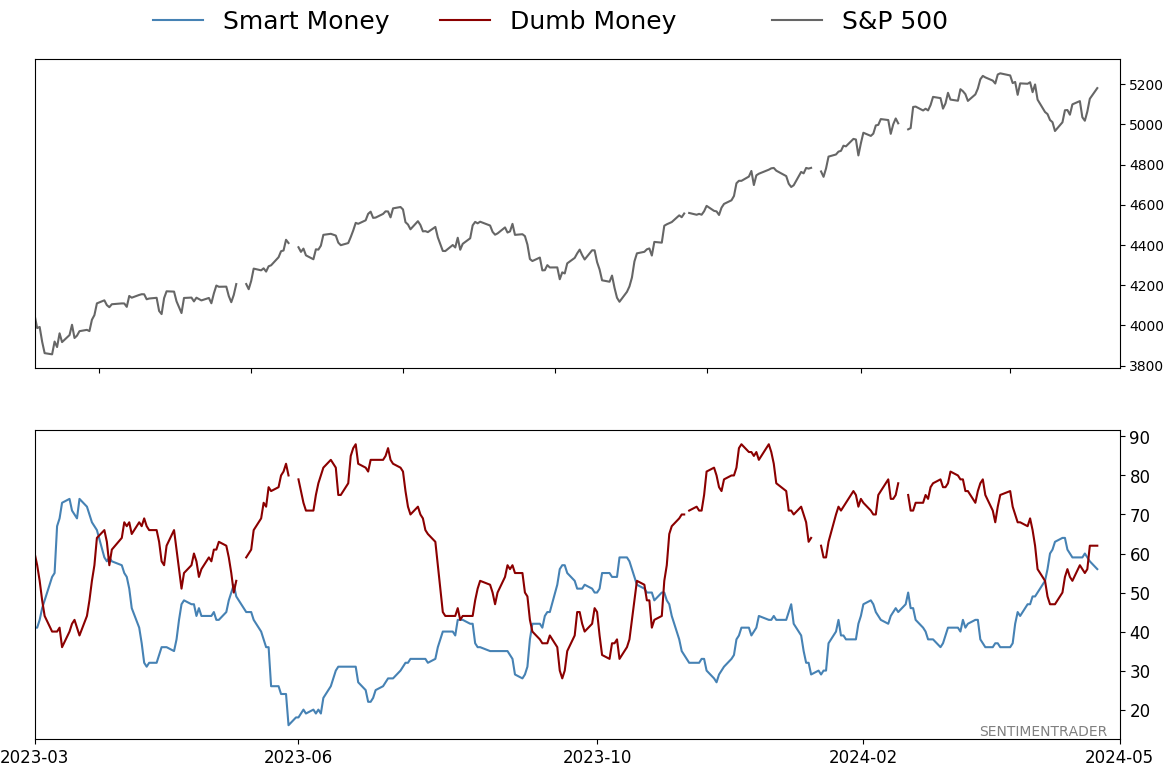
Smart / Dumb Money Confidence
|
Smart Money Confidence: 56%
Dumb Money Confidence: 62%
|
|
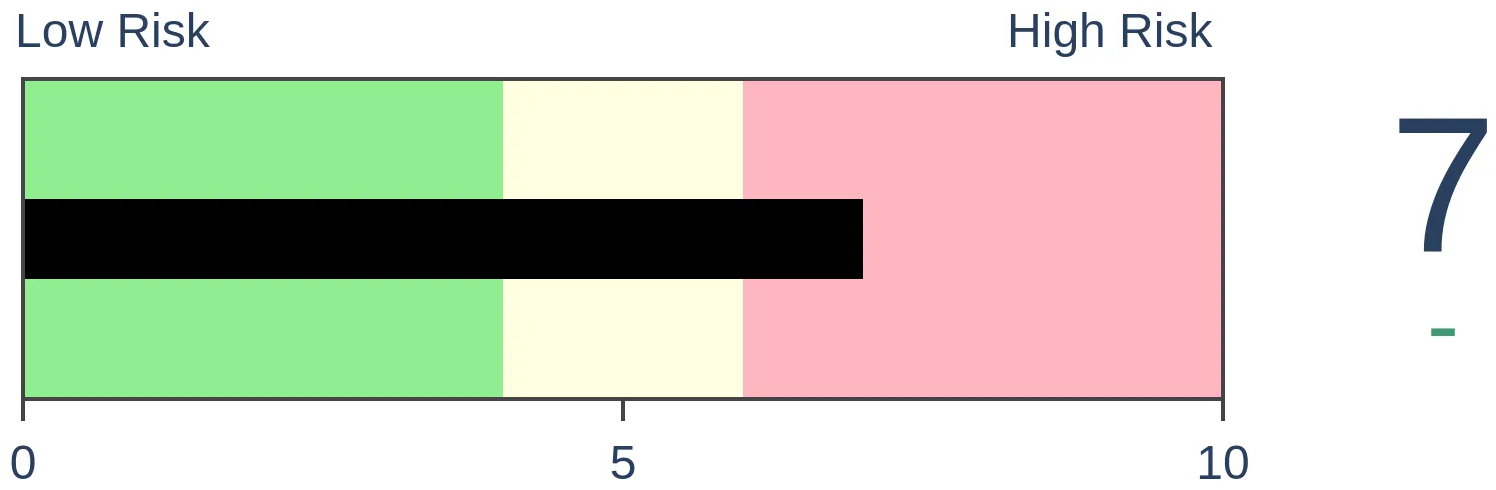
Risk Levels
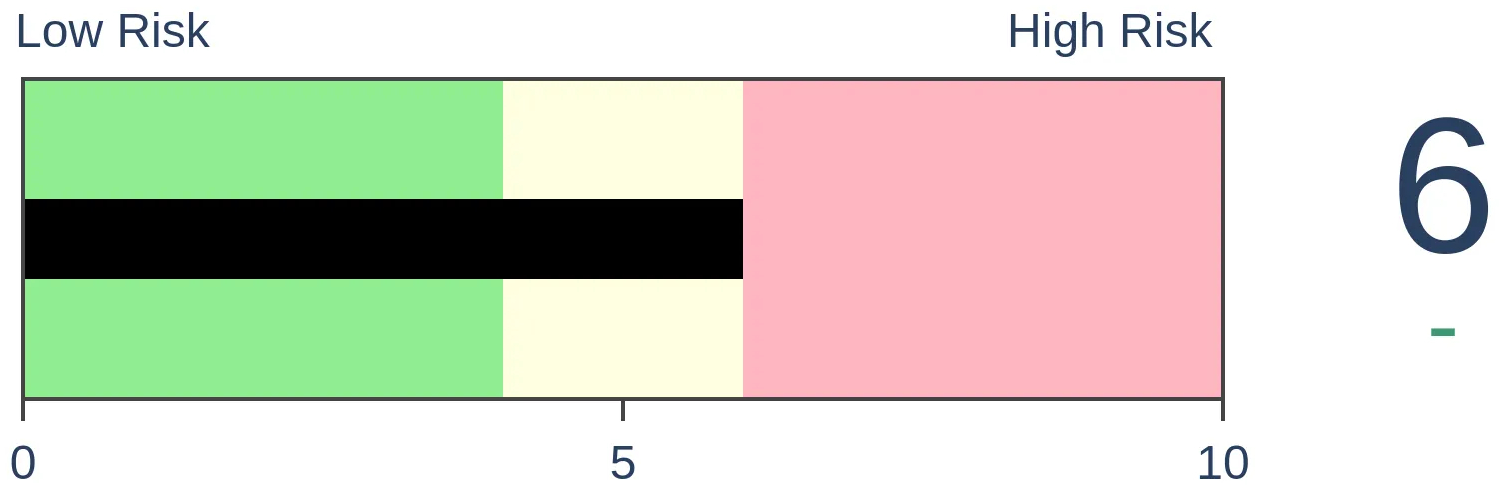
Stocks Short-Term
|
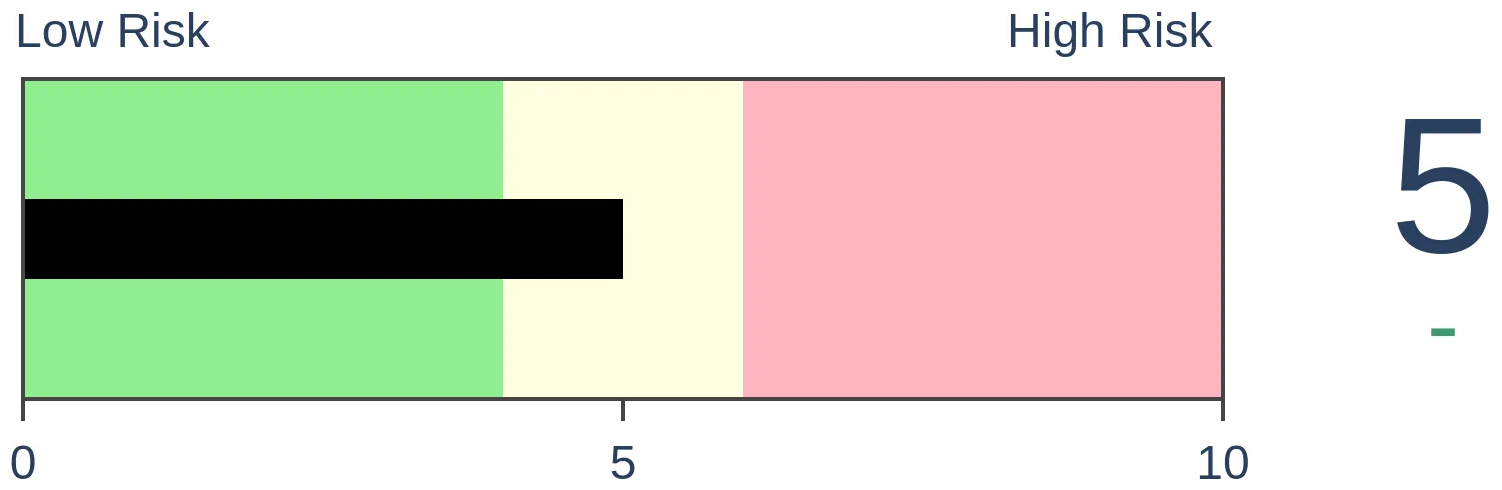
Stocks Medium-Term
|
|
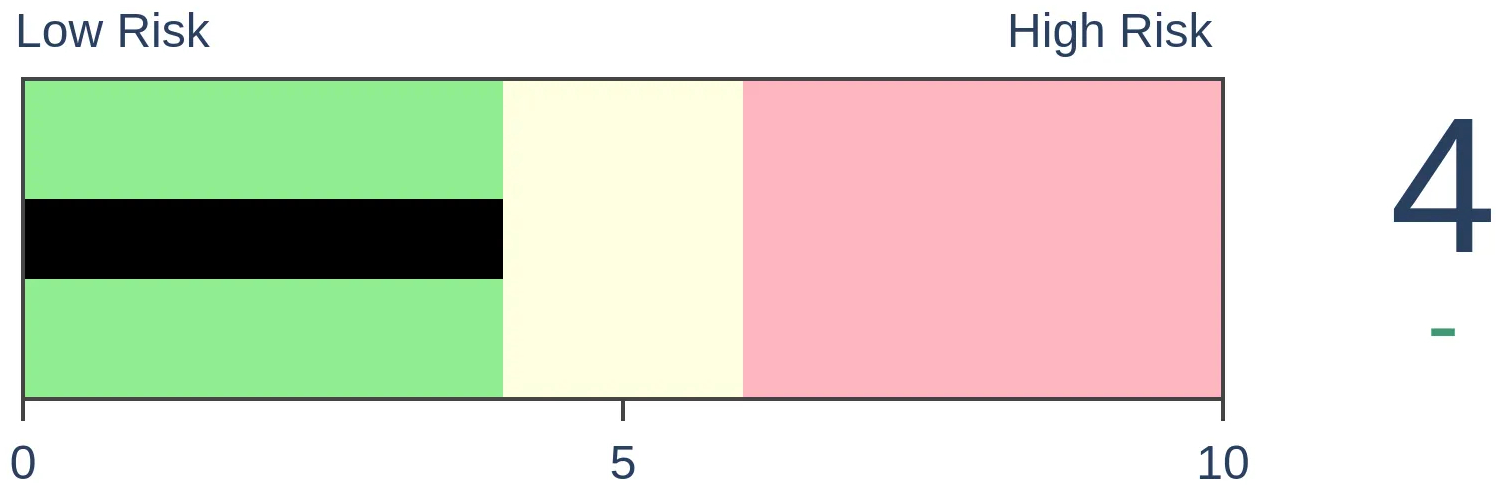
Bonds
|
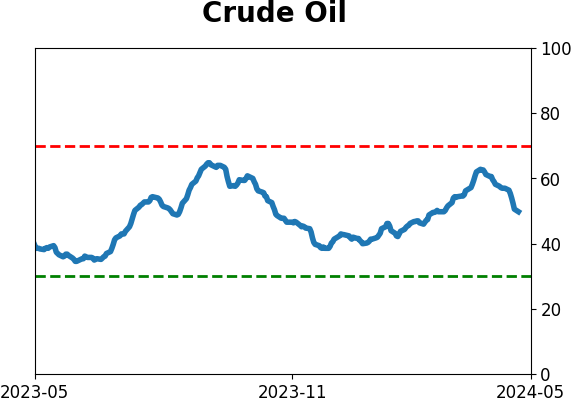
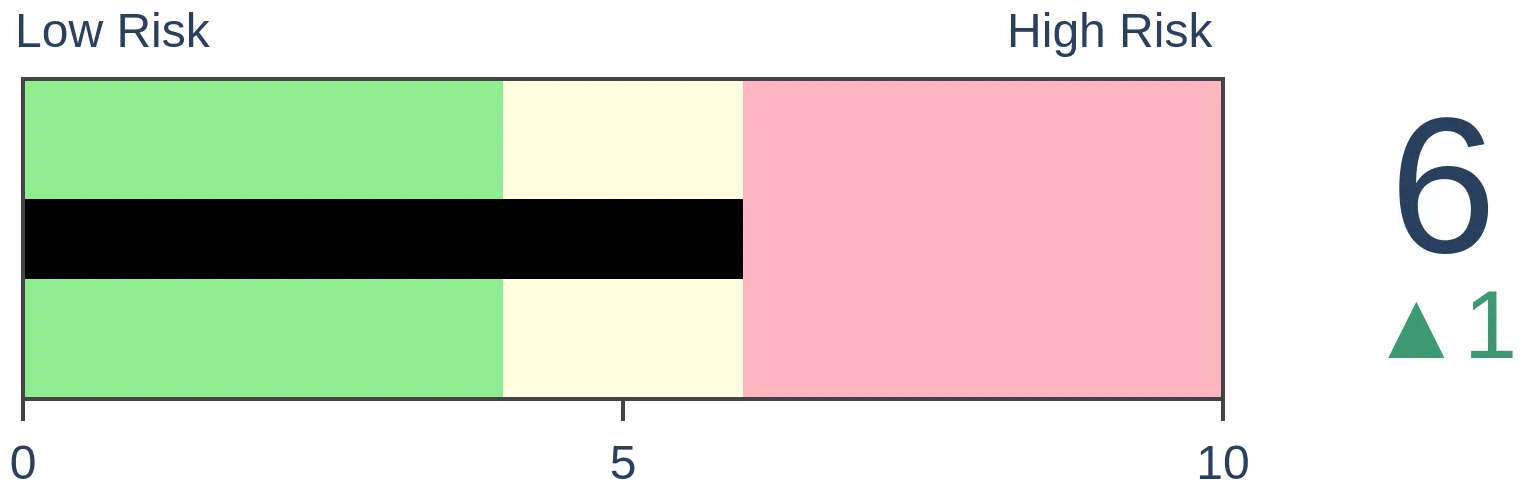
Crude Oil
|
|
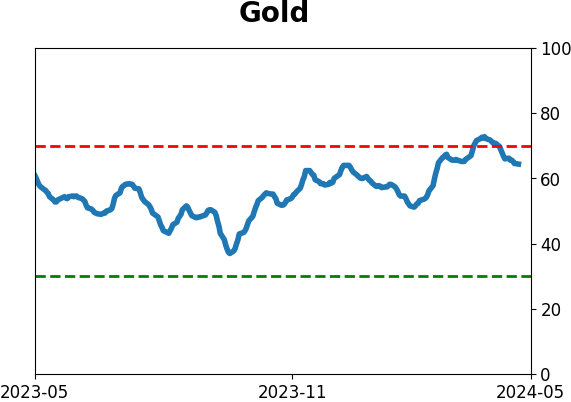
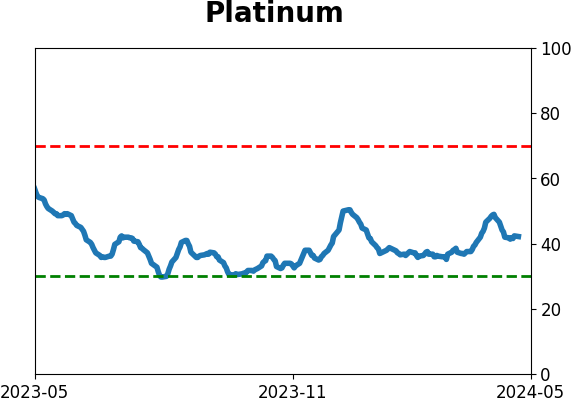
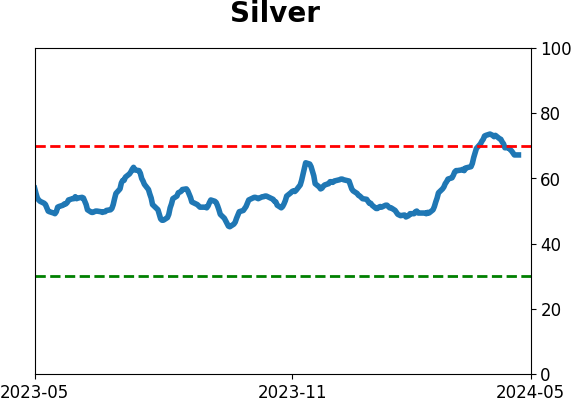
Gold
|
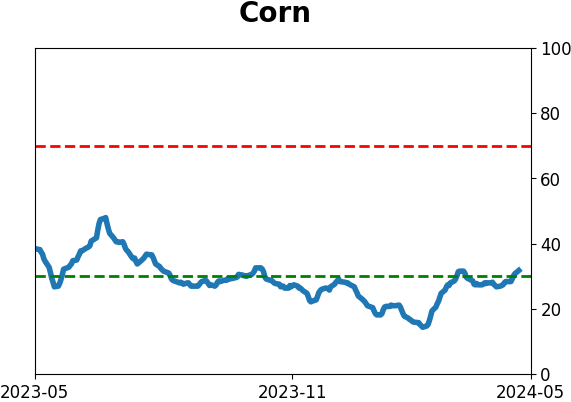
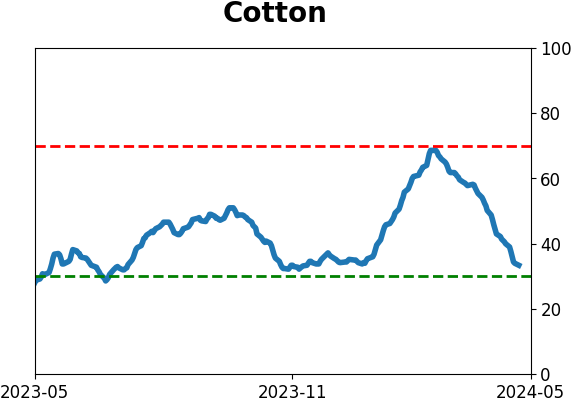
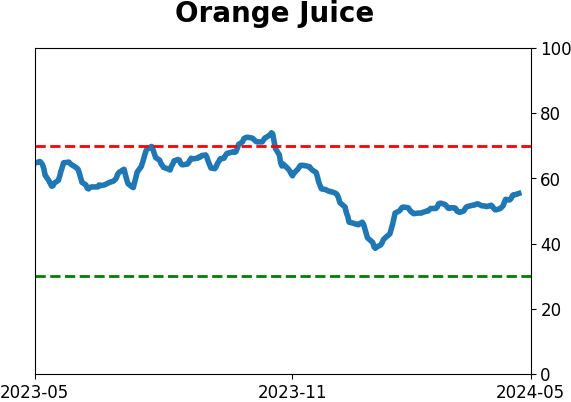
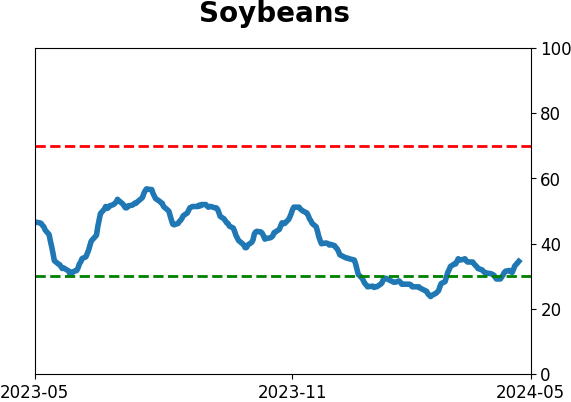
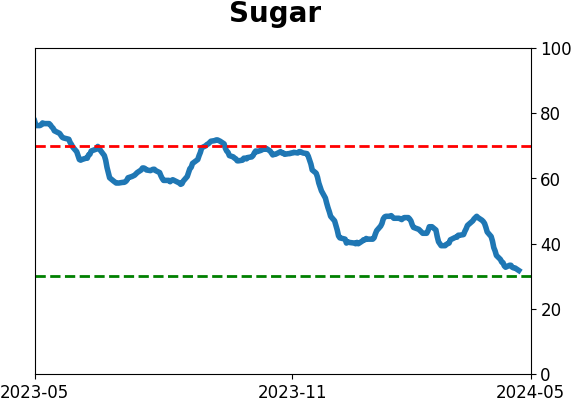
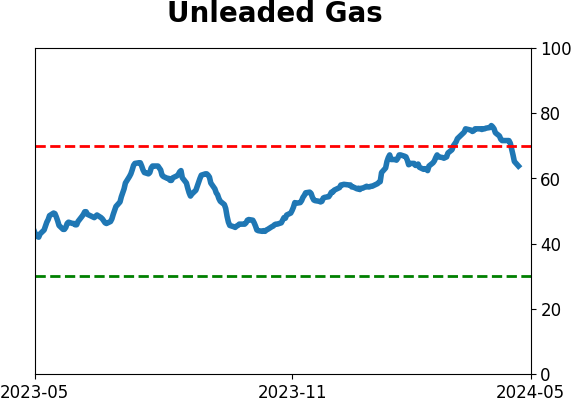
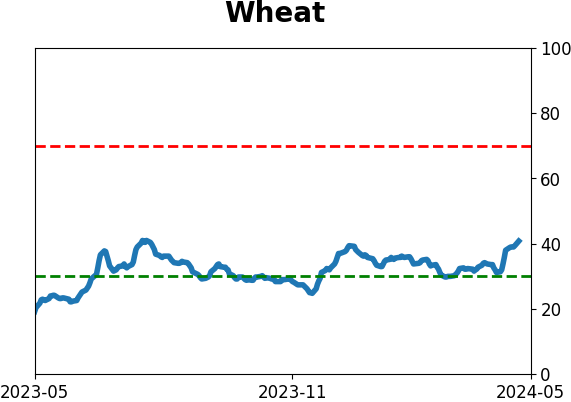
Agriculture

|
|
Research
By Jason Goepfert
BOTTOM LINE
The latest surveys of investors and consumers show historically high levels of optimism about the path of stocks. The majority of respondents expect stocks to rise, and that's a worry for contrarians. But coming out of drastic levels of pessimism, such high optimism has not been a worry long-term.
FORECAST / TIMEFRAME
None
|
Key points:
- Surveys are showing that U.S. investors and consumers have high expectations for stocks
- This comes on the heels of what had been historically depressed sentiment
- Similar cycles, while few, ended significant declines and preceded years of gains
Consumer-investors are feeling awfully good
After a brutal 2022, recovery in 2023, and a good start to 2024, optimism has returned among investors and has even spread more widely to general consumers in the U.S. Pretty much everyone is now aware of how strong stocks have been.
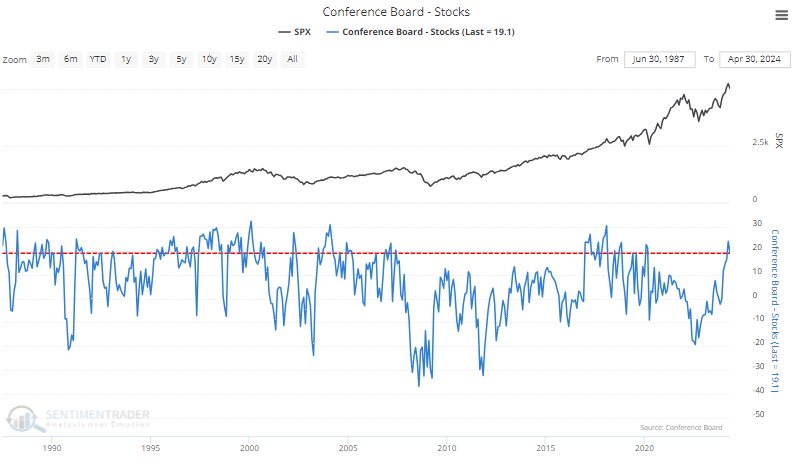
We saw that a month ago in a Conference Board survey of consumers. While the latest reading showed a dip in consumers' outlook for stocks over the next year, it's still high compared to the past 37 years.
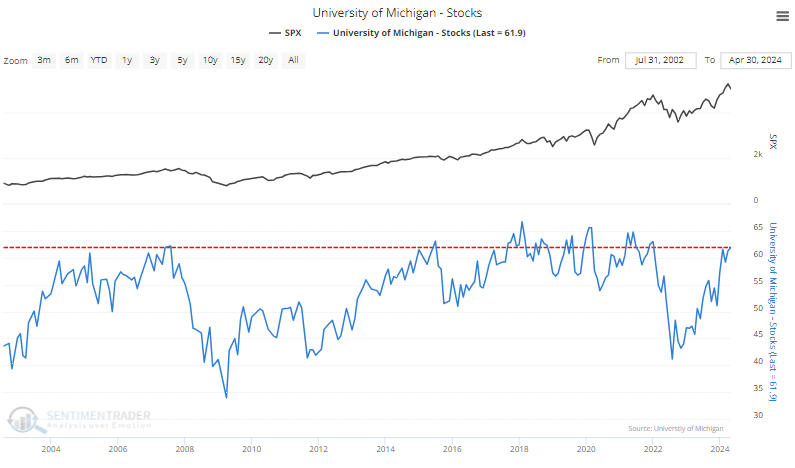
A single survey showing high optimism could just be a one-off random data point. But the latest survey from the University of Michigan shows similar sentiment.
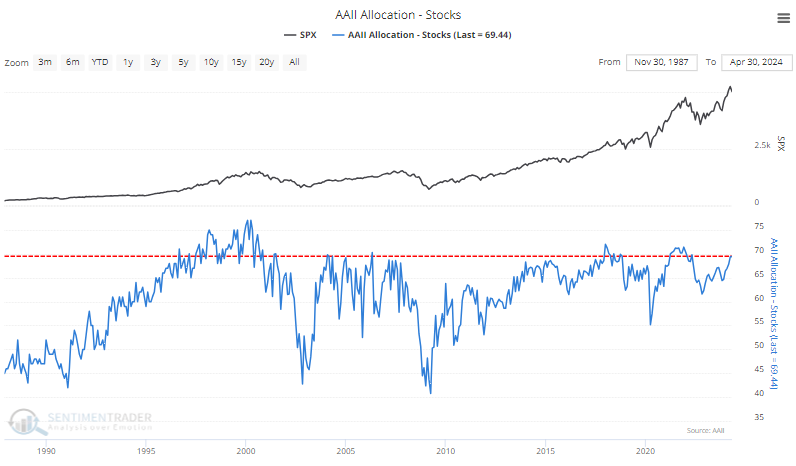
And the latest survey of individual investors from AAII showed another uptick in investors' allocation to stocks, now ranking among the highest since the dot-com bust.
Combining the three surveys shows that sentiment ranks among the highest in decades (especially the past two) as of the end of April.
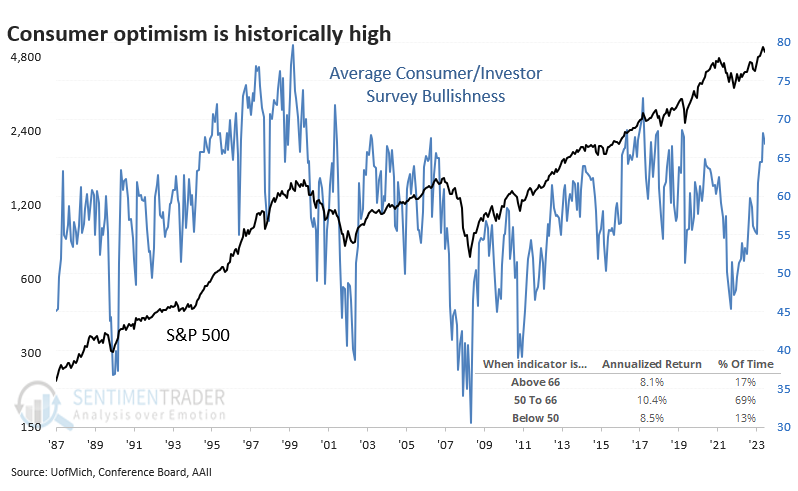
We can see from the chart that when sentiment has been low, the S&P 500's annualized returns have been +8.5%, versus +10.4% when it was neutral. And its returns were a bit worse, at +8.1%, when it was historically high. It's not a drastic difference.
Cycles from fear to greed
It can be helpful to add context to the current level of optimism about stocks' future returns, and that context is that sentiment emerged from woeful pessimism a couple of years ago. It has taken investors about 20 months to fully cycle from deep pessimism to high optimism.
The table below shows the other times sentiment cycled from extreme to extreme. As always, we have to be cautious about minuscule sample sizes, but it helps that the results were consistent.
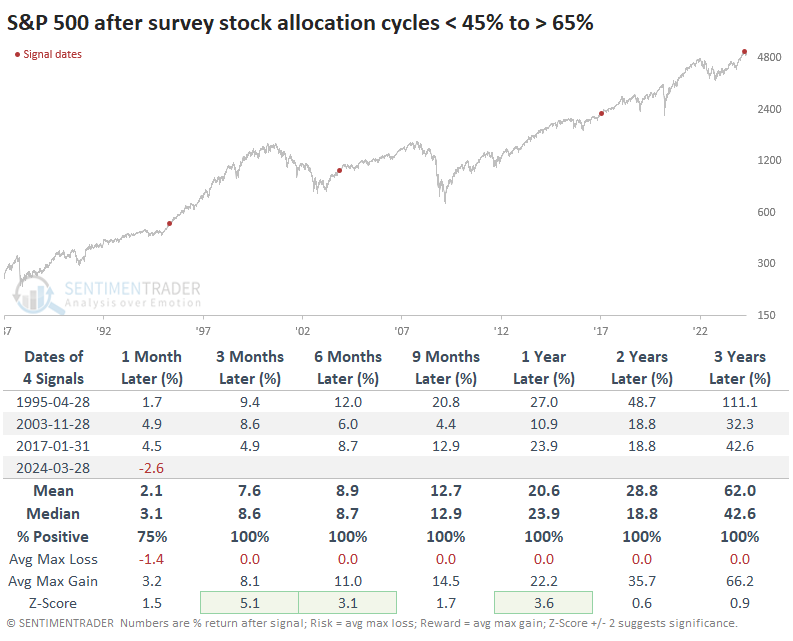
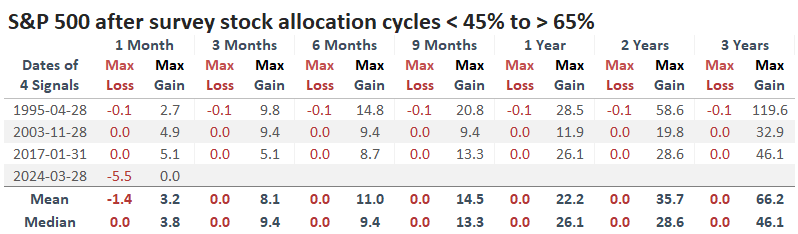
The consistency is especially acute when looking at the table of maximum gains and declines across time frames. This uses monthly closing prices, so intra-month drawdowns are not considered. After these cycles, there was a whole lot of reward and essentially no risk.
What the research tells us...
We've all been conditioned to buy fear and sell greed. After studying that phenomenon intensely for the past couple of decades, it's clear that it's not as simple as a pithy statement. Buying fear, yeah, that's a pretty successful methodology. But selling greed is...nuanced.
The U.S. stock market goes up over time. It's really as simple as that. So even when people get greedy, there are usually investors waiting in the wings willing to bid even higher for whatever shares are offered. Of course, things get truly out of hand once a decade or so, but that has typically come after many years of gains and greed. When we first enter greedy conditions after a prolonged bout of fear, it is even less likely that the greed will lead to losses soon.
Indicators at Extremes
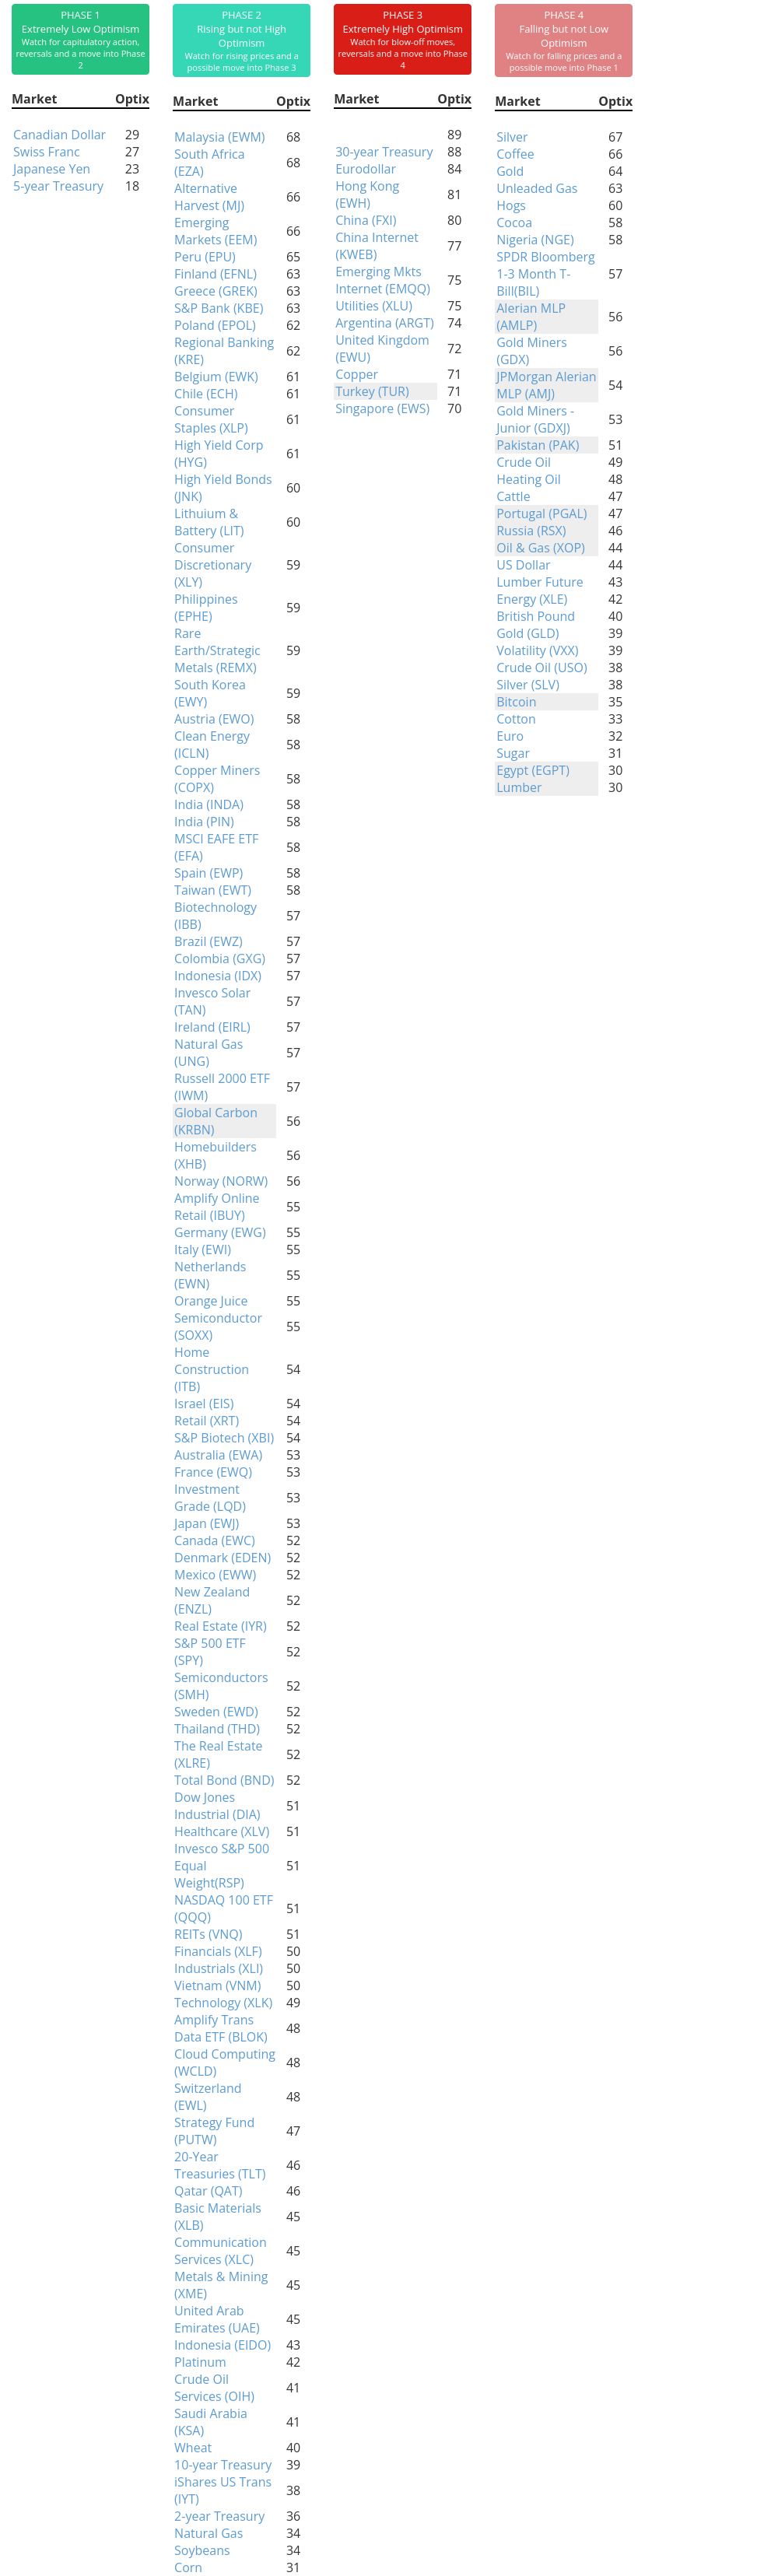
Phase Table
Ranks
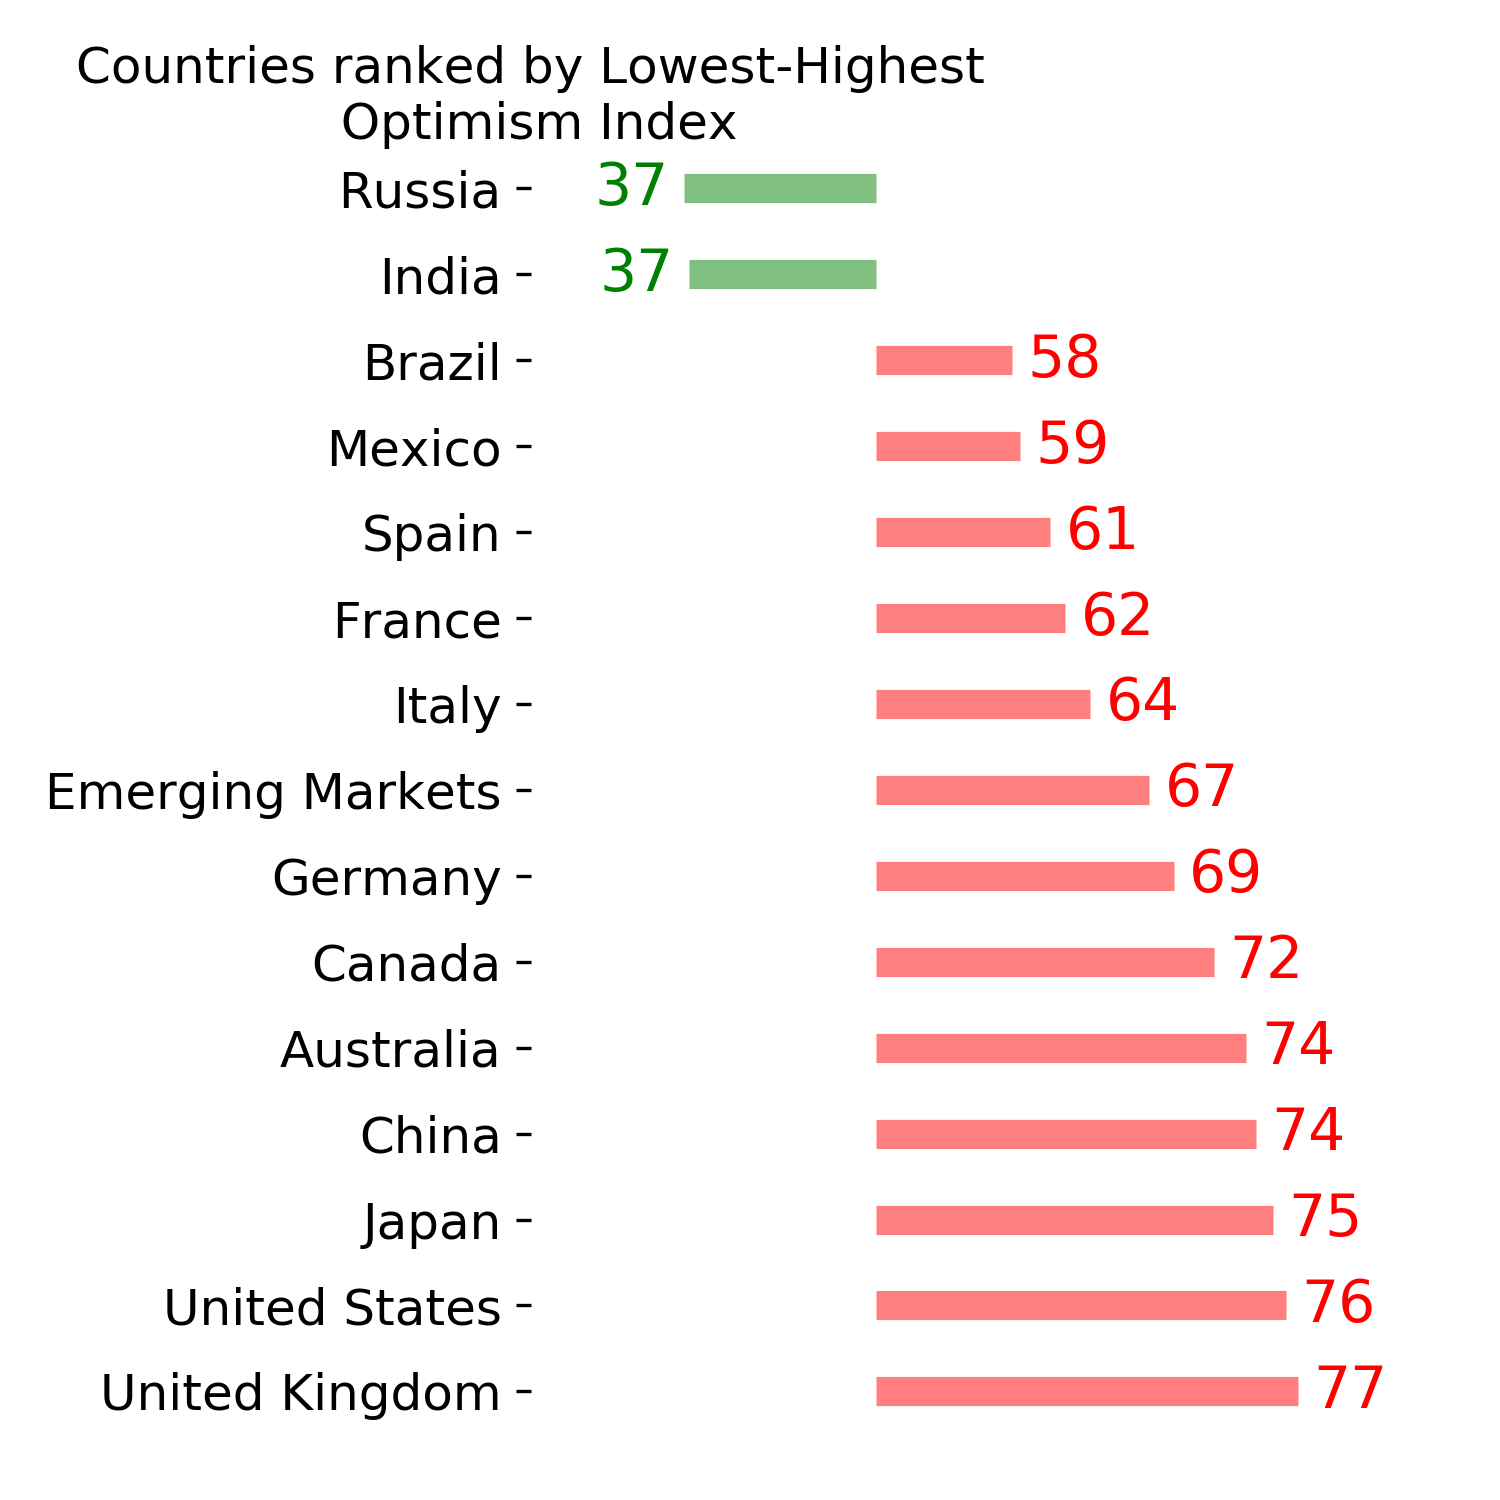
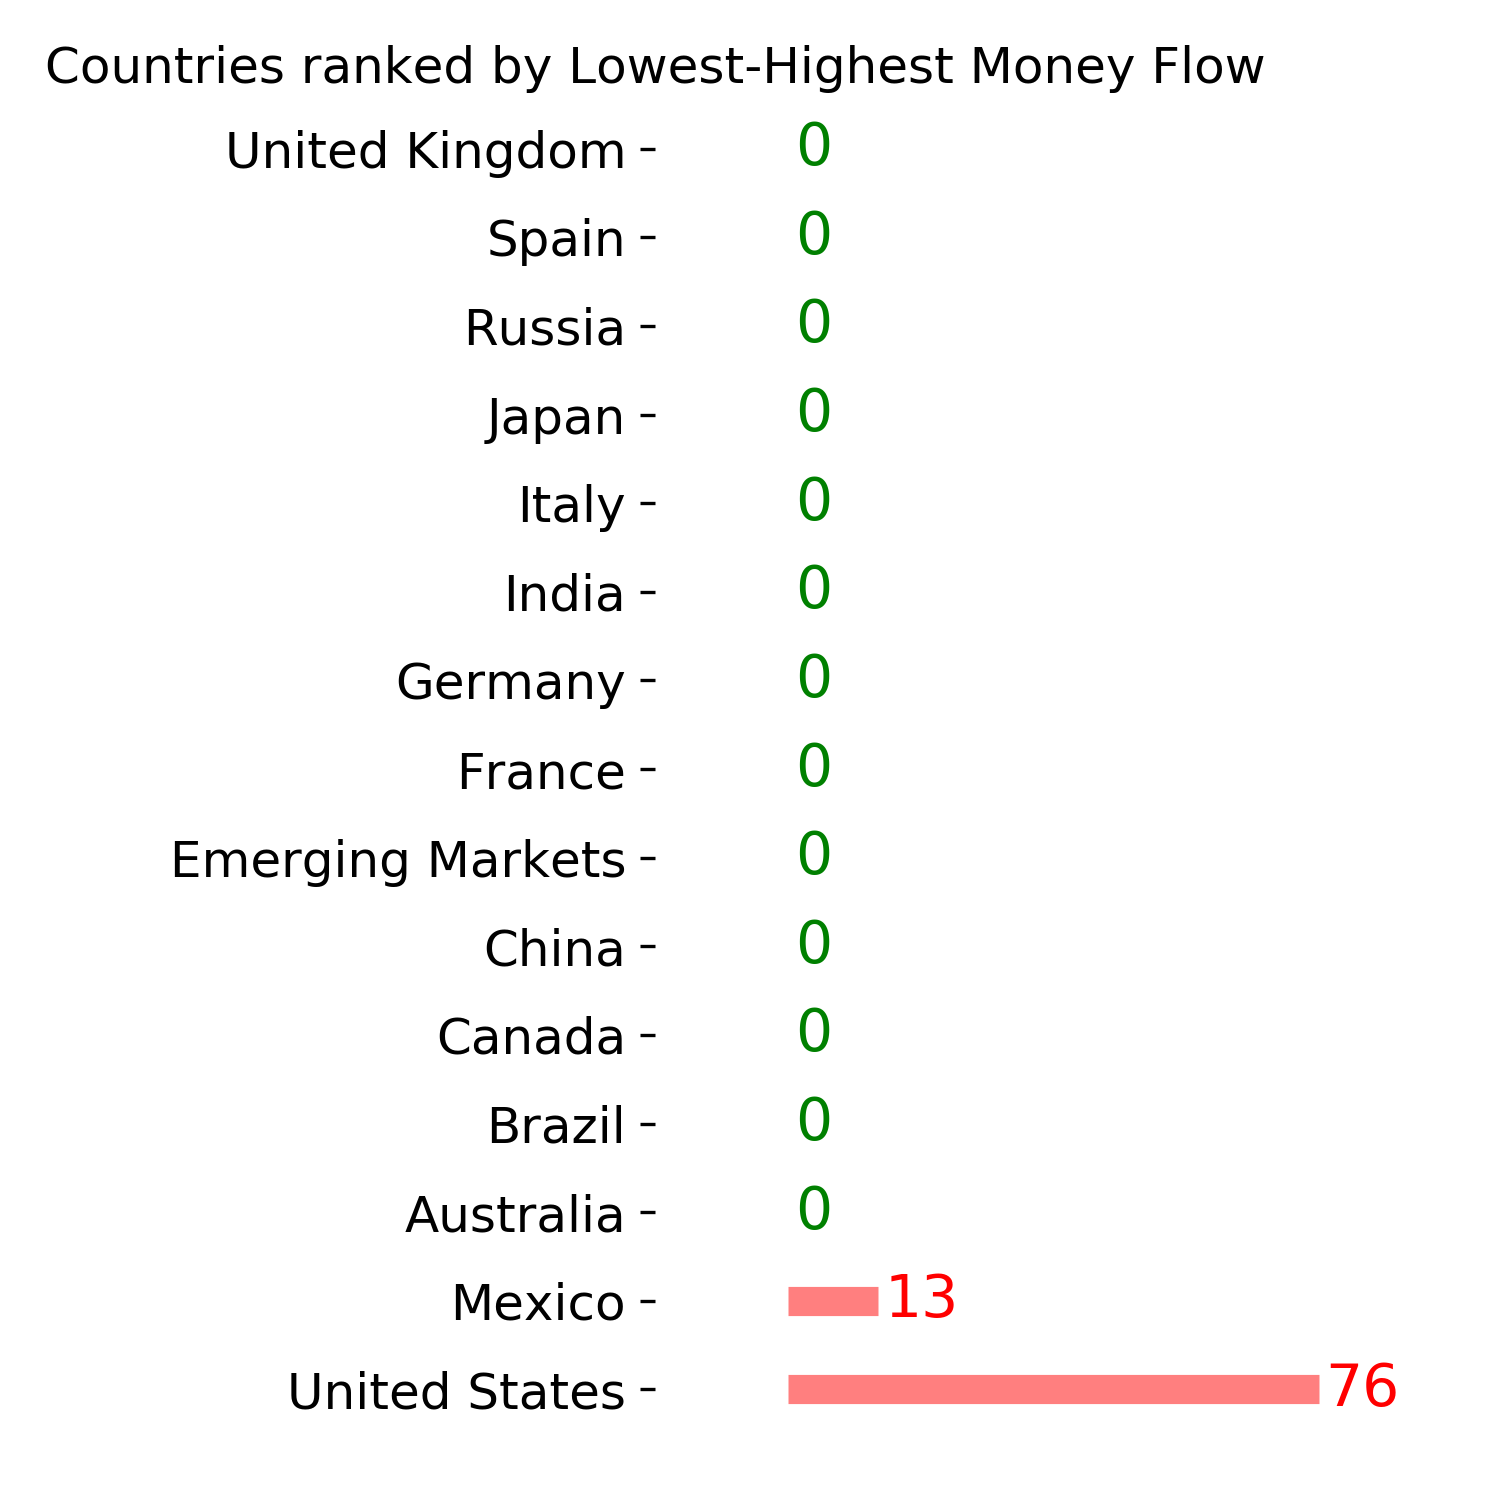
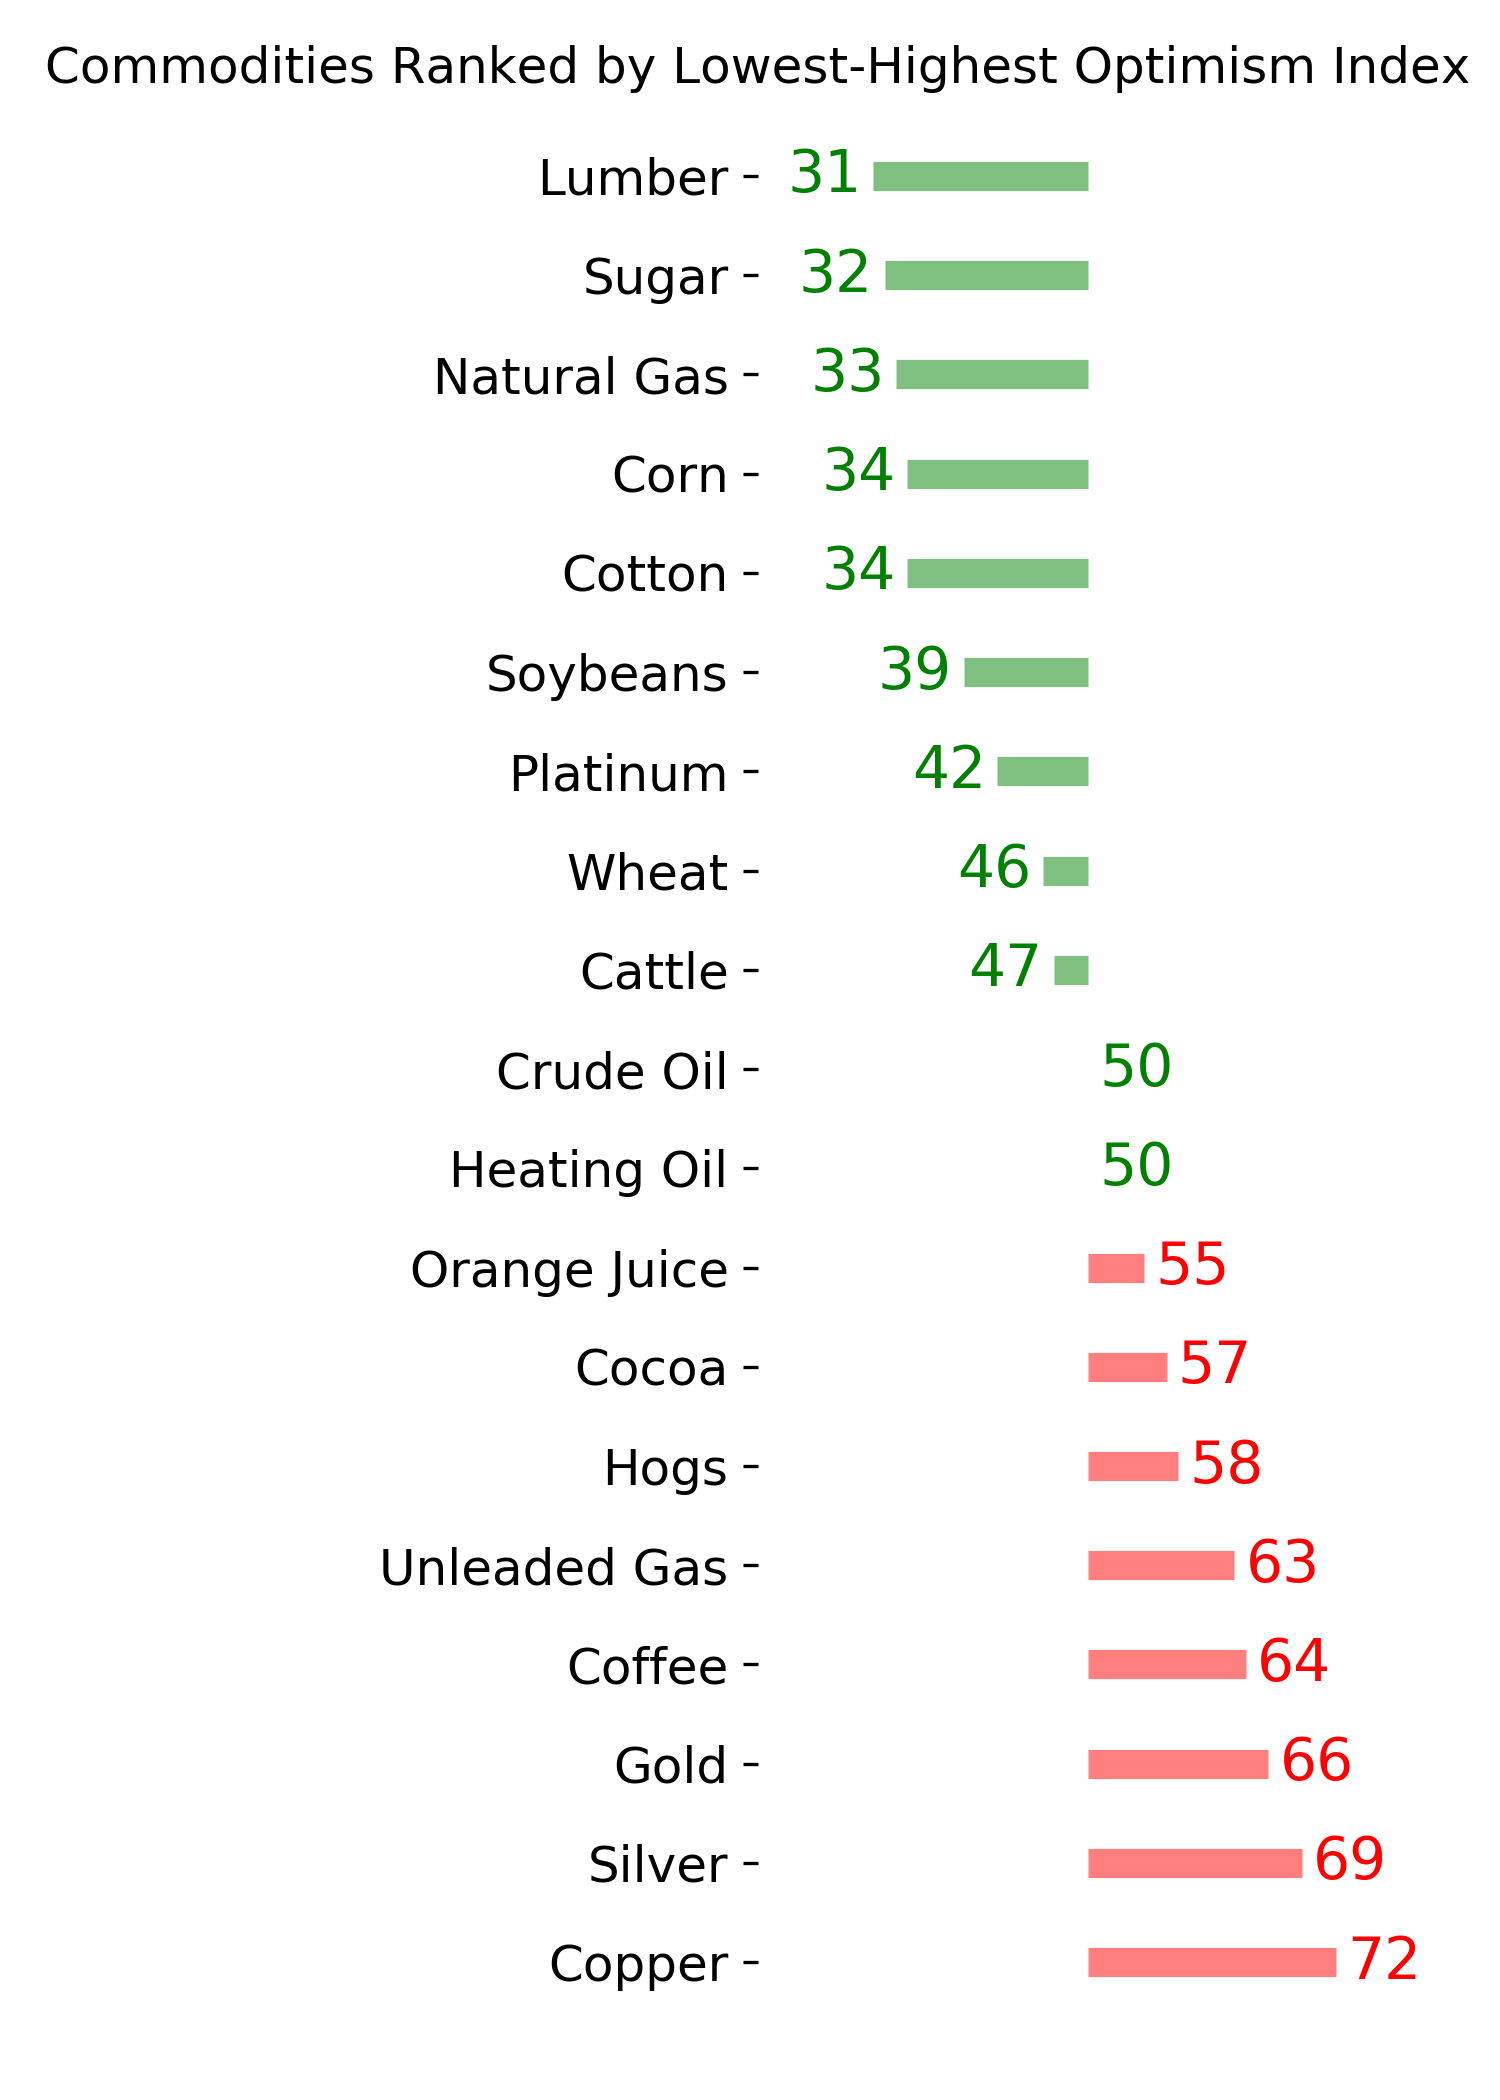
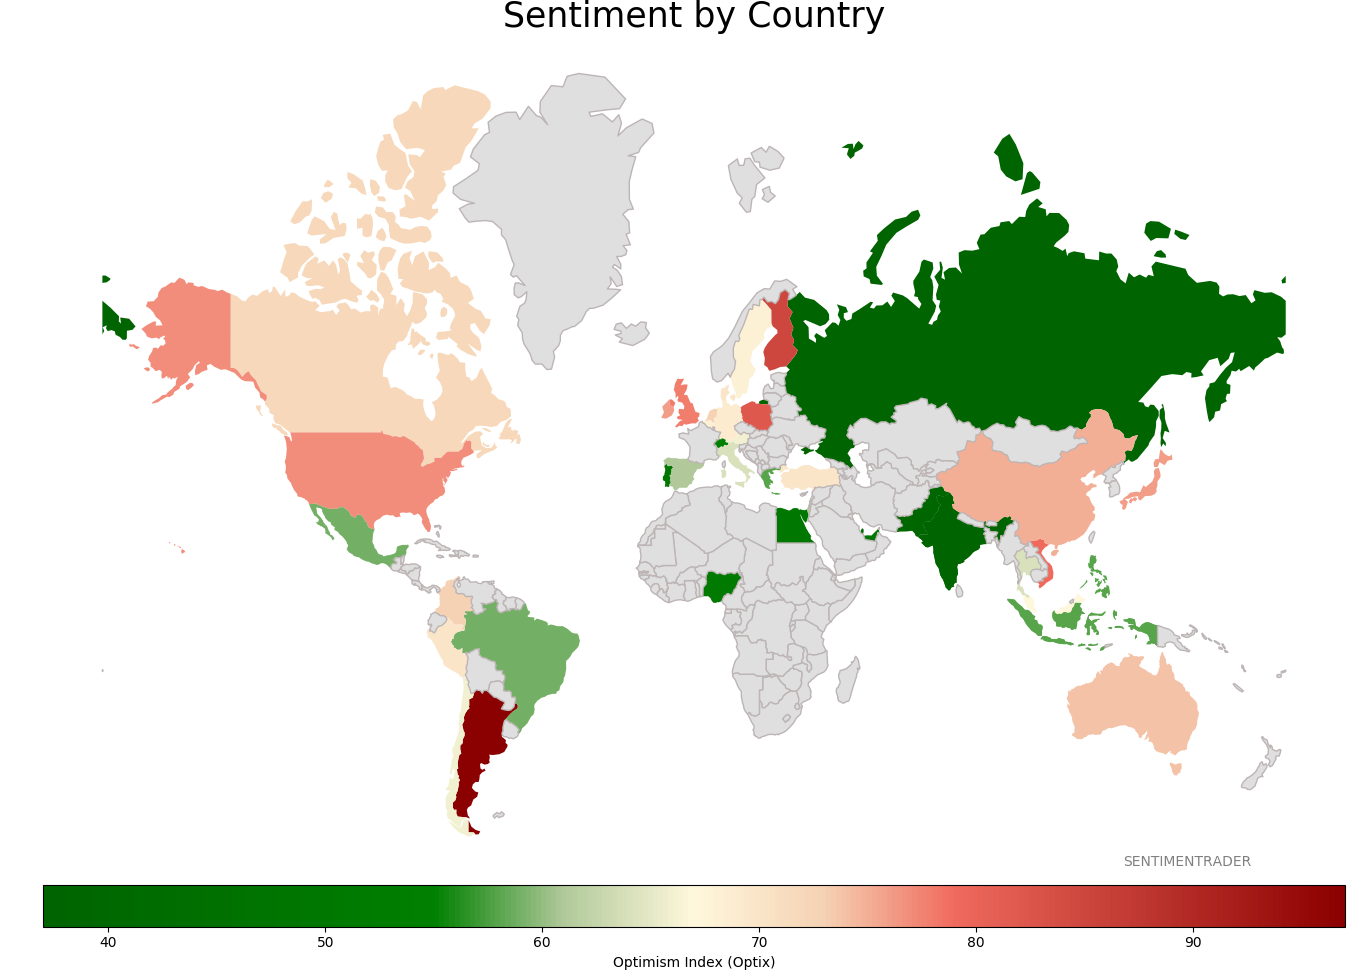
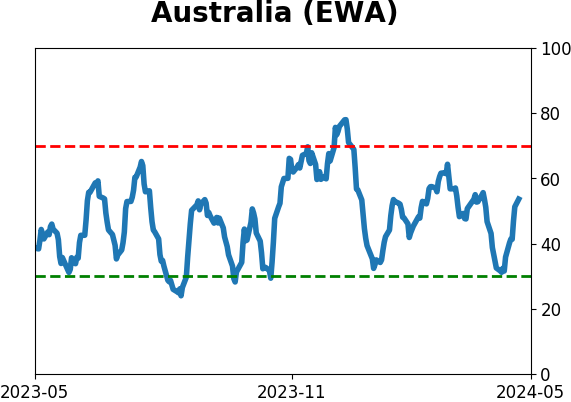
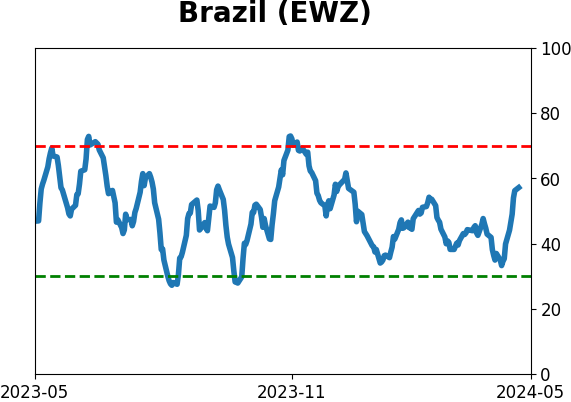
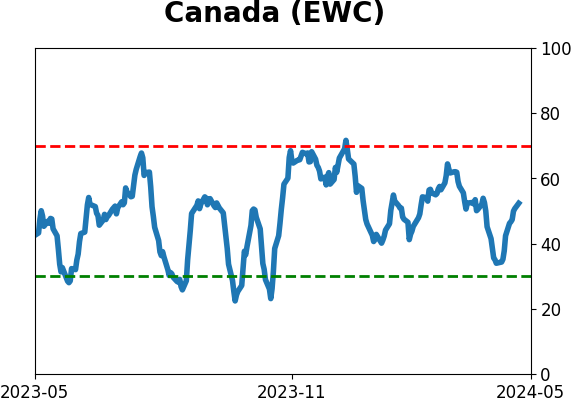
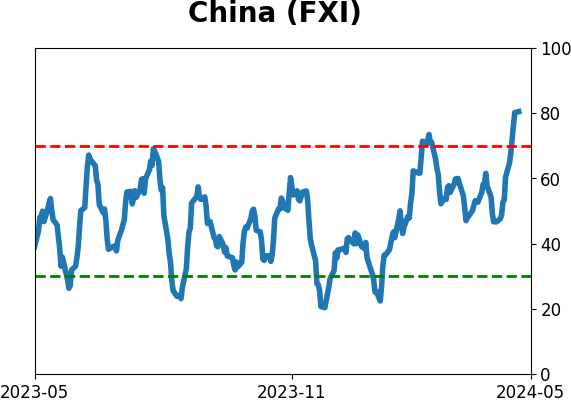
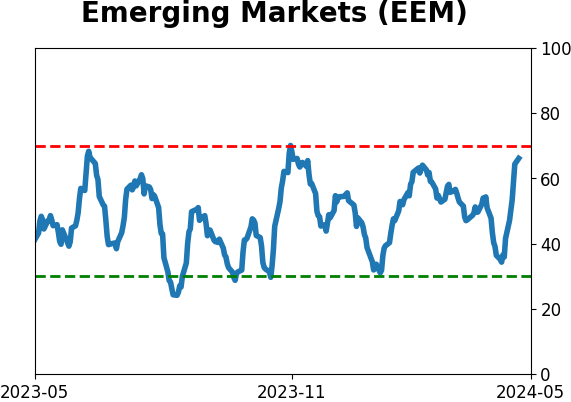
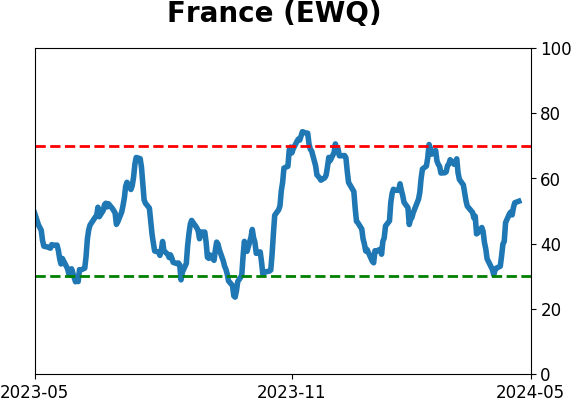
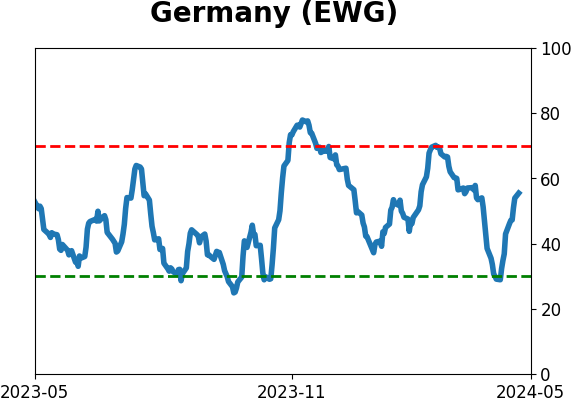
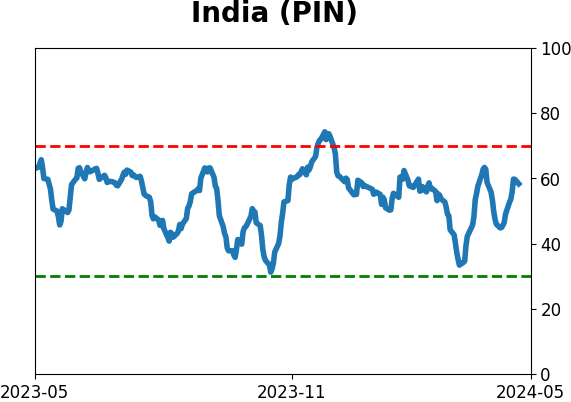
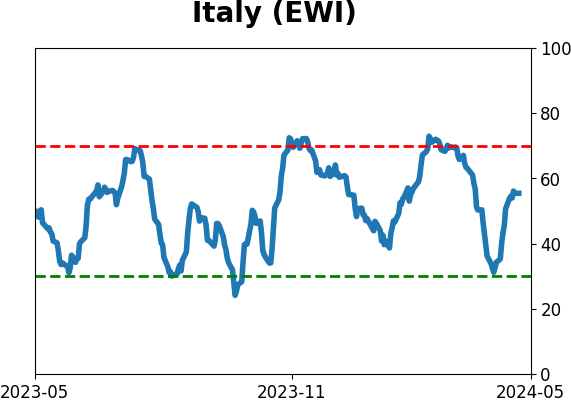
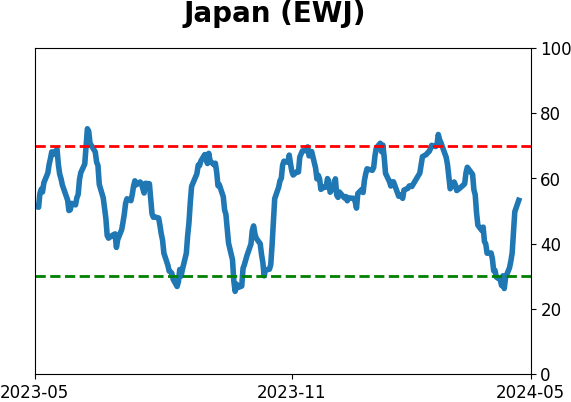
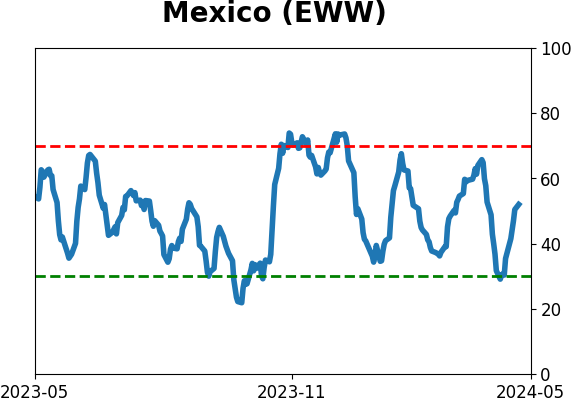
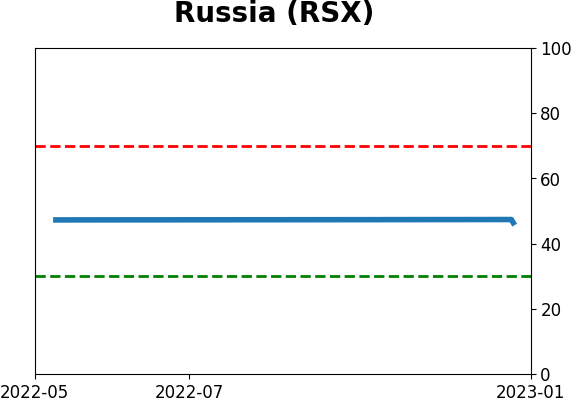
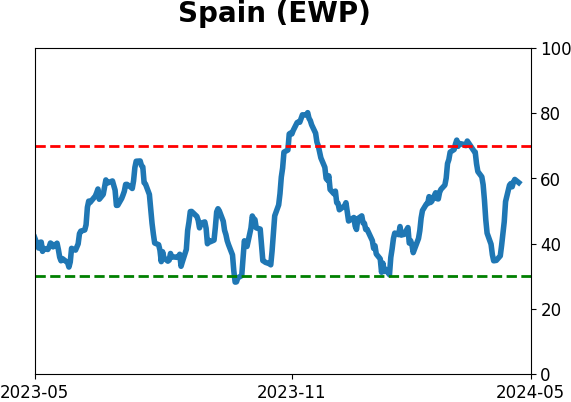
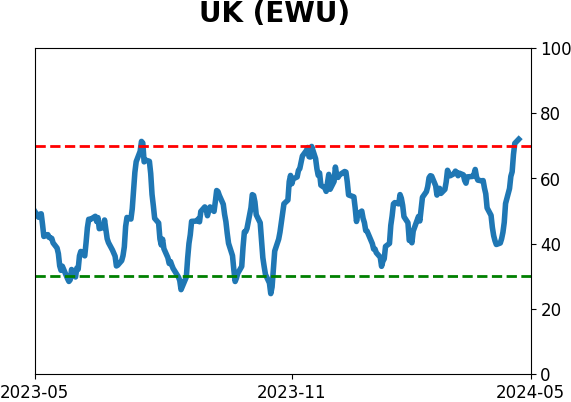
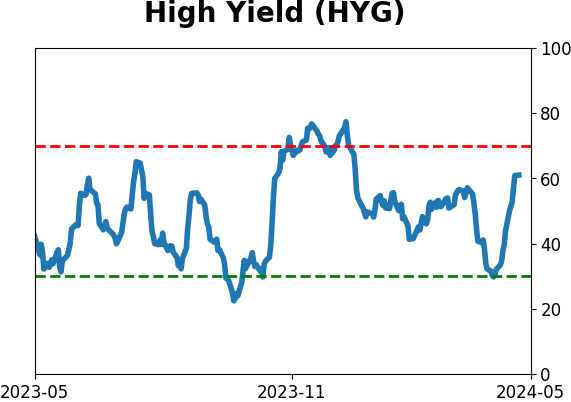
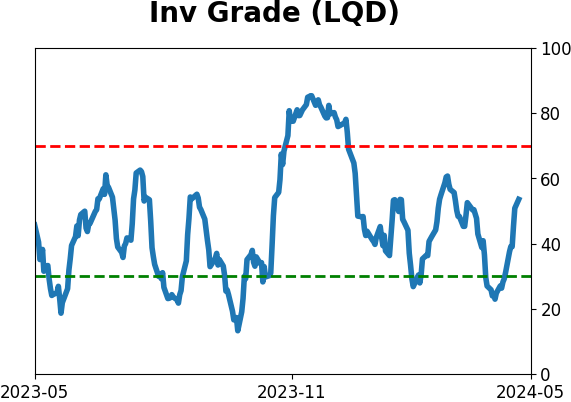
Sentiment Around The World
Optimism Index Thumbnails
|
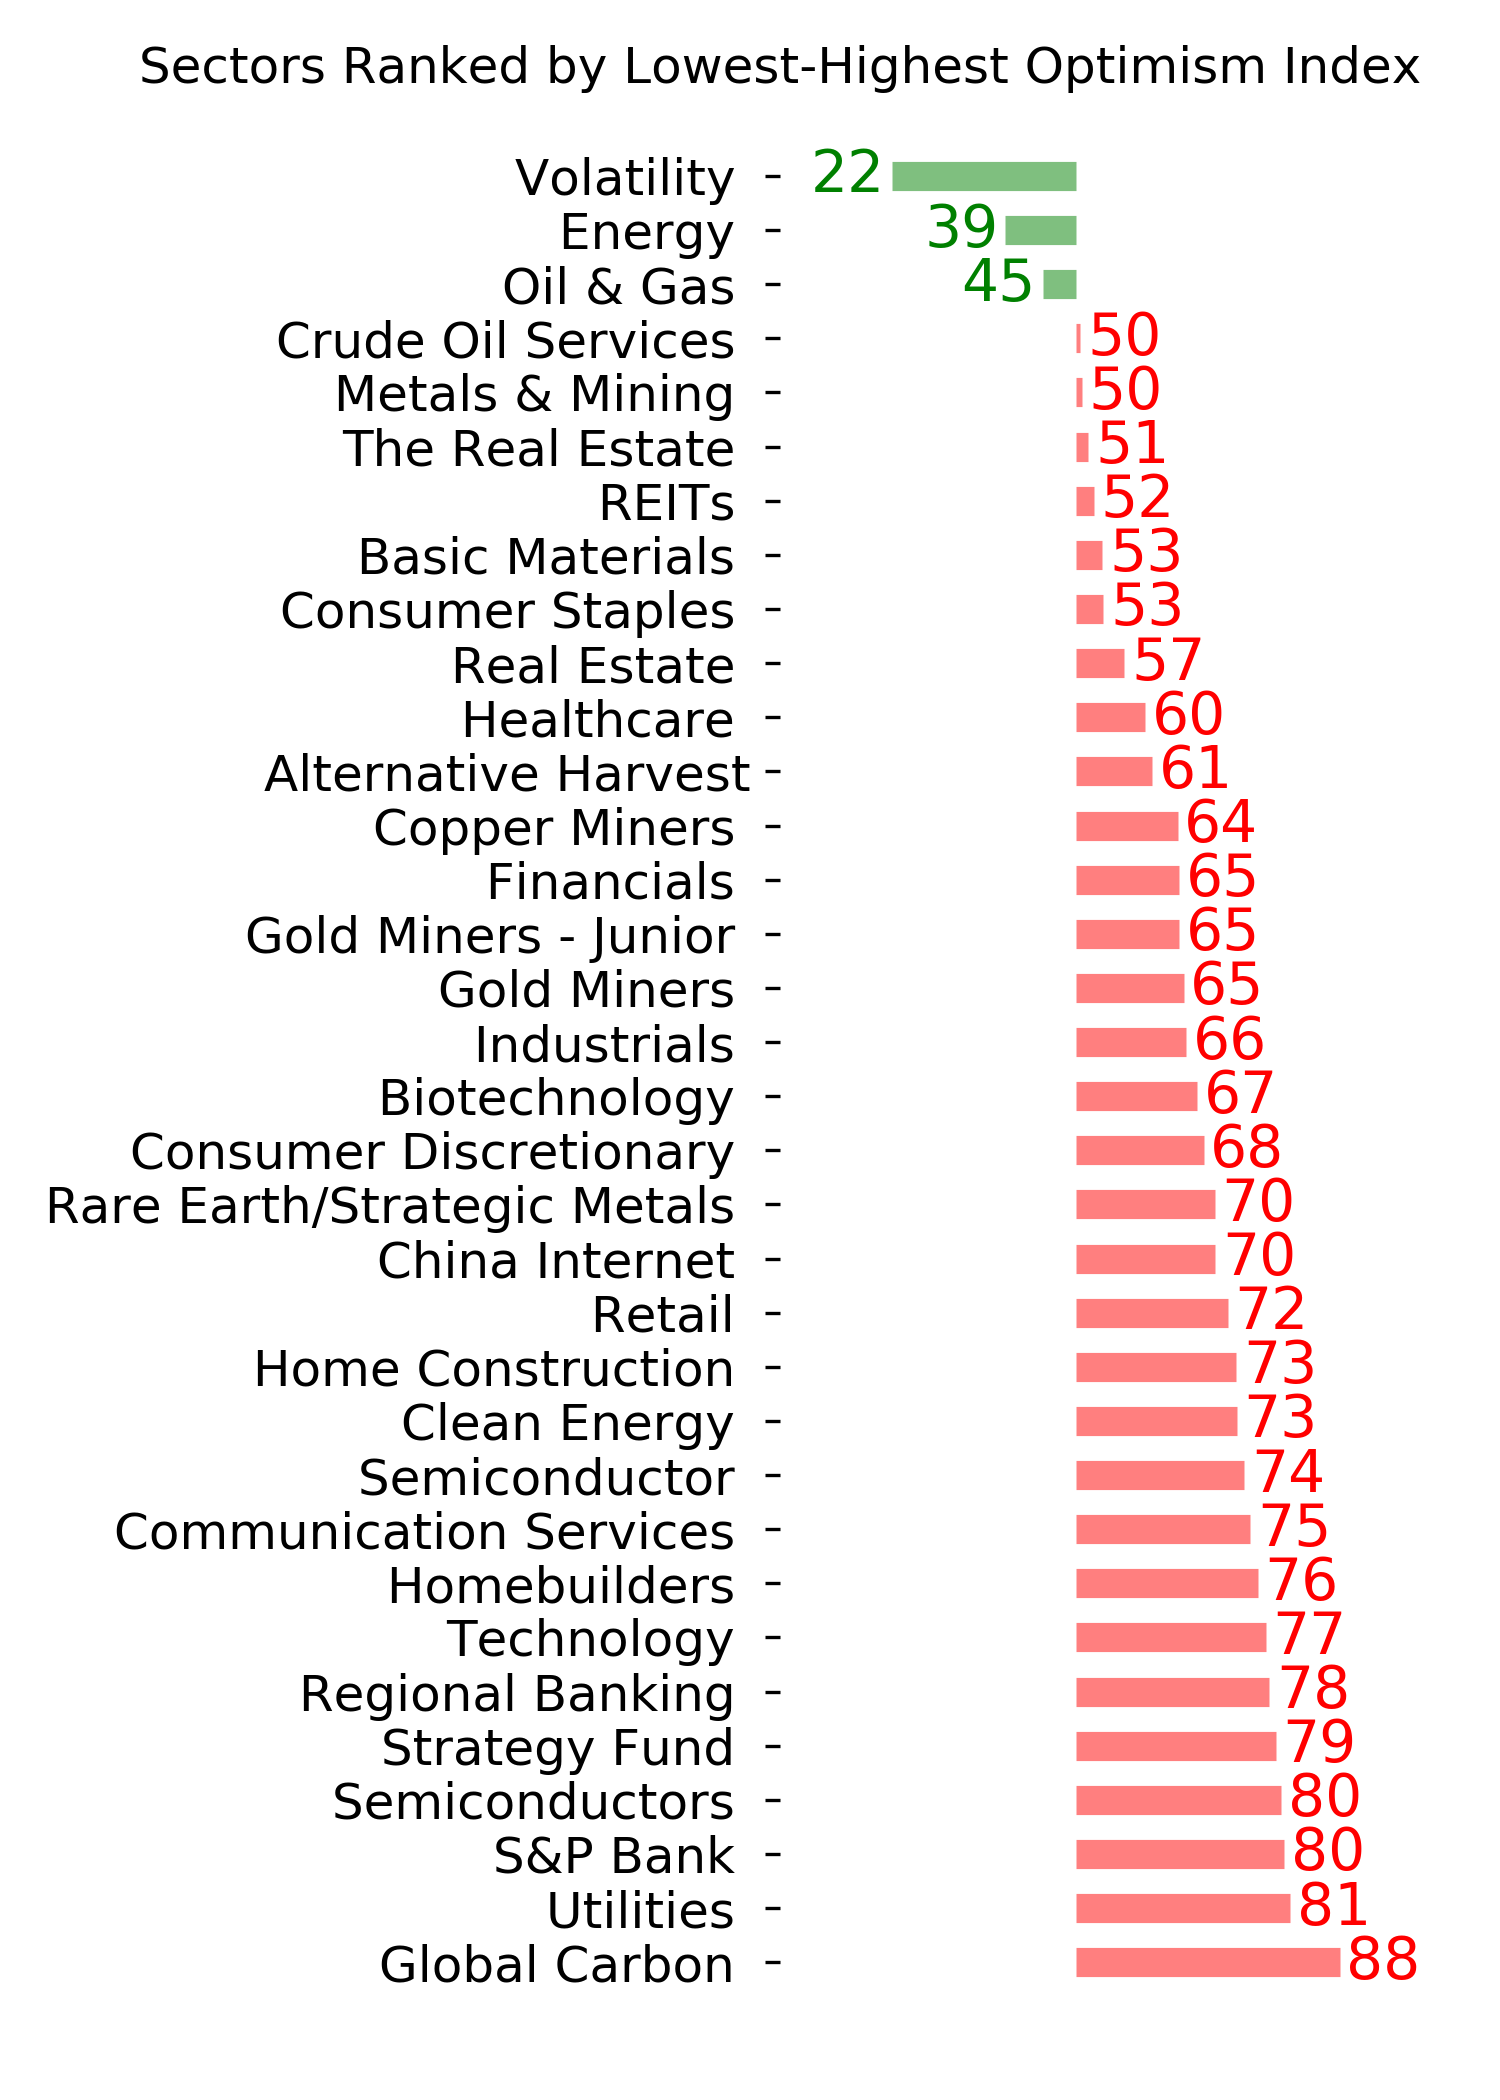
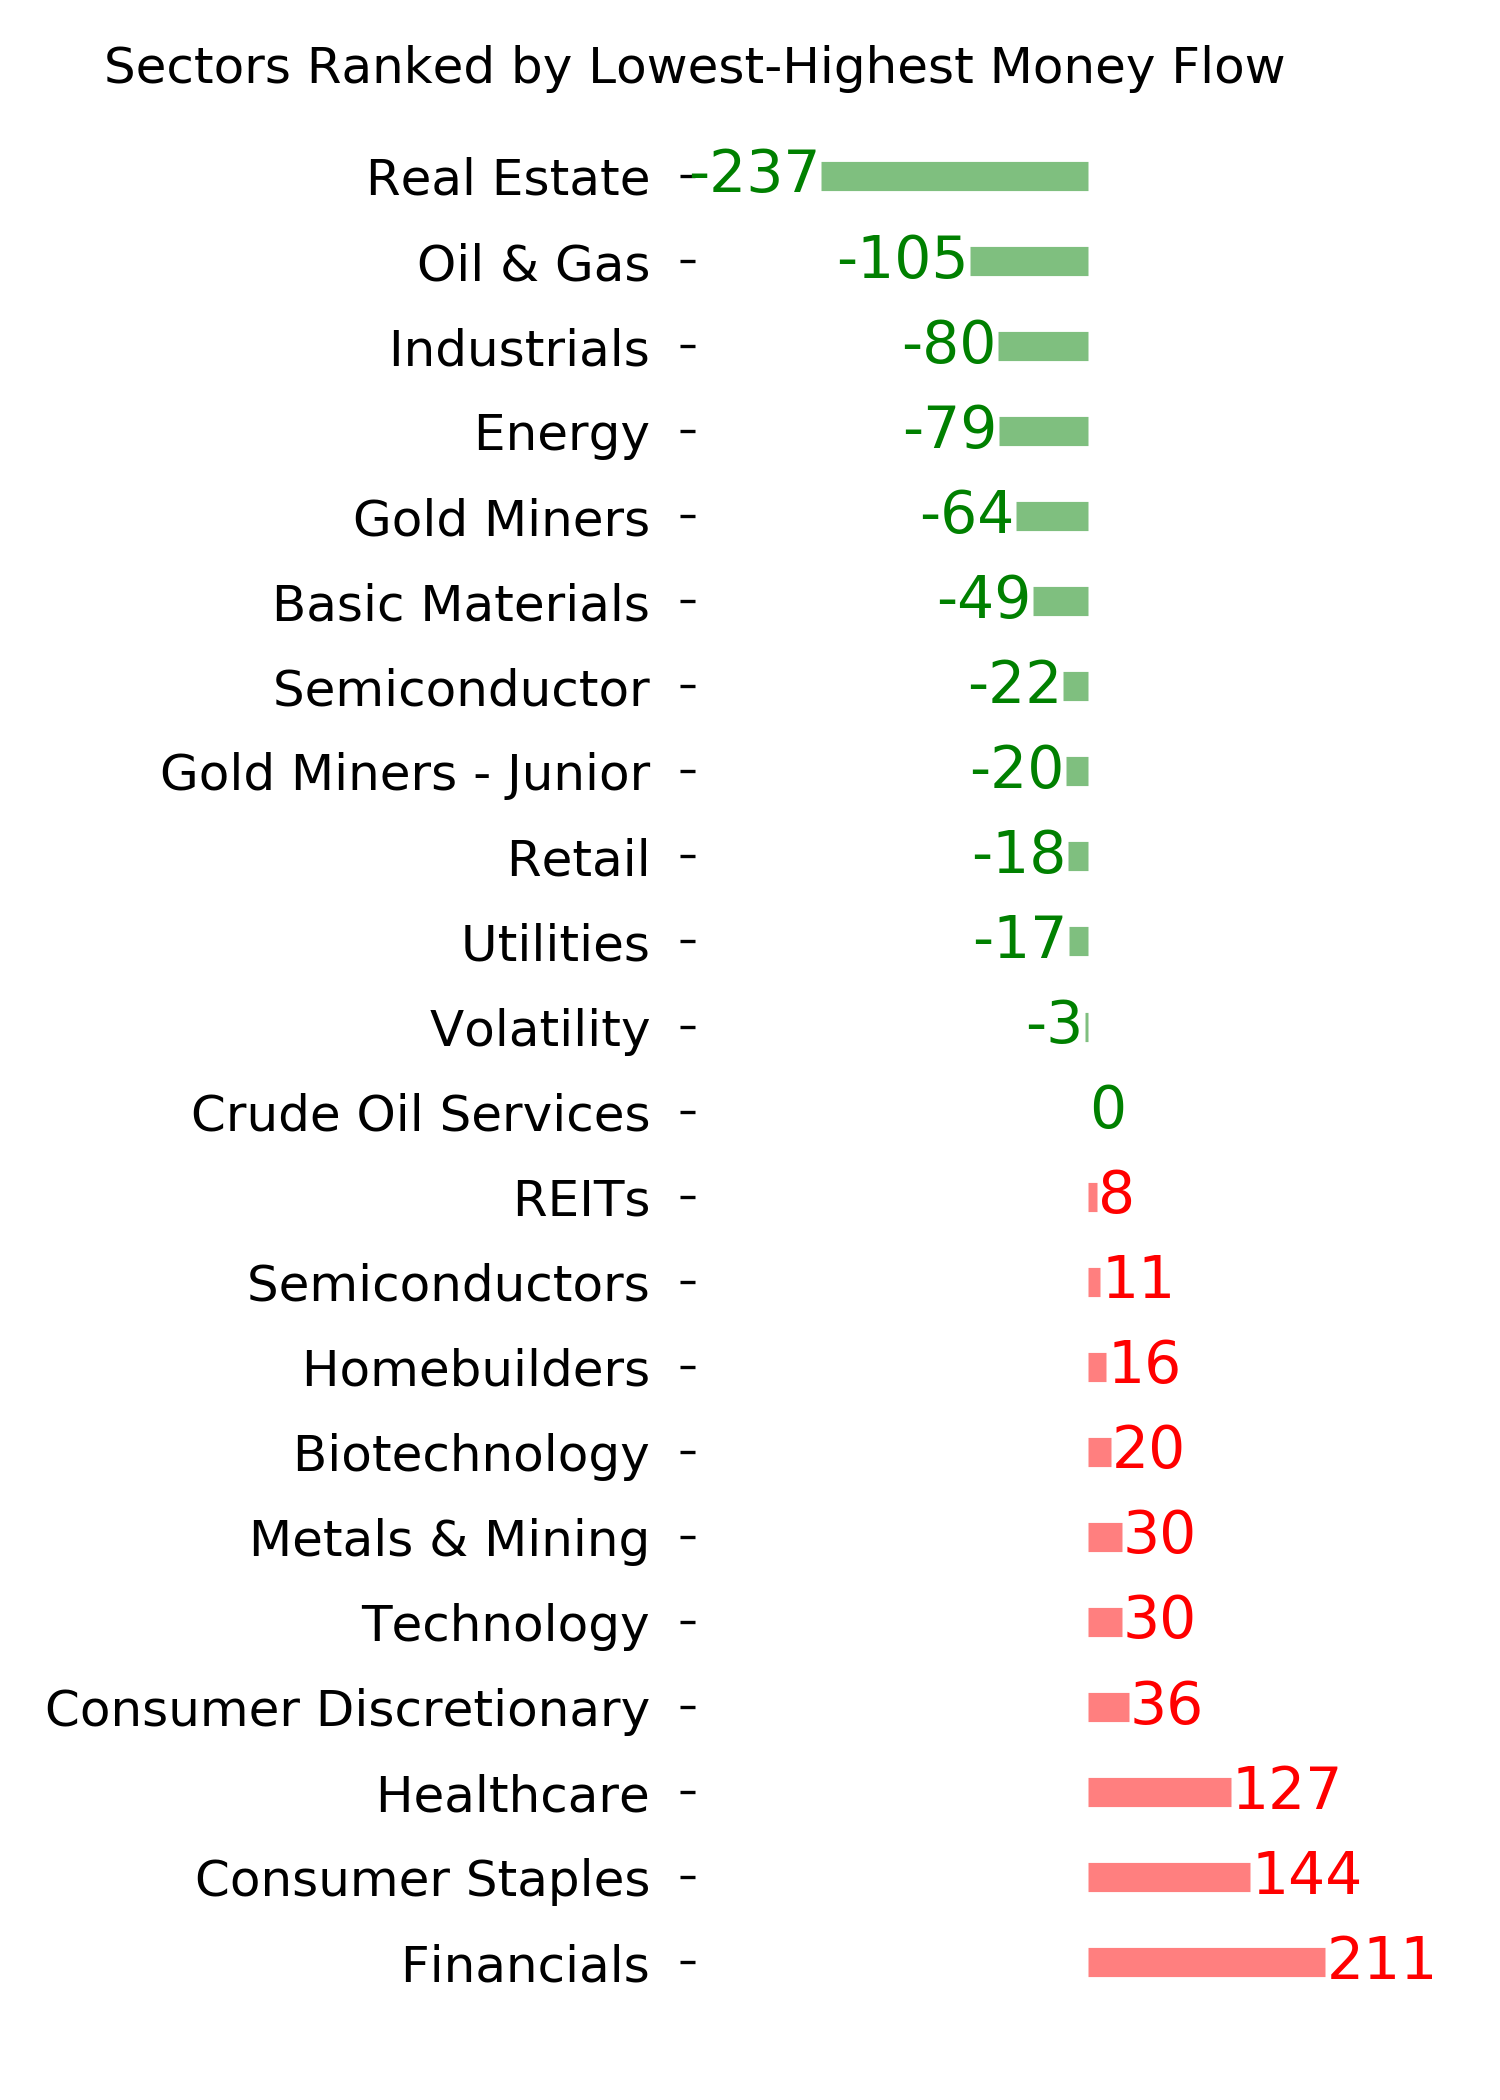
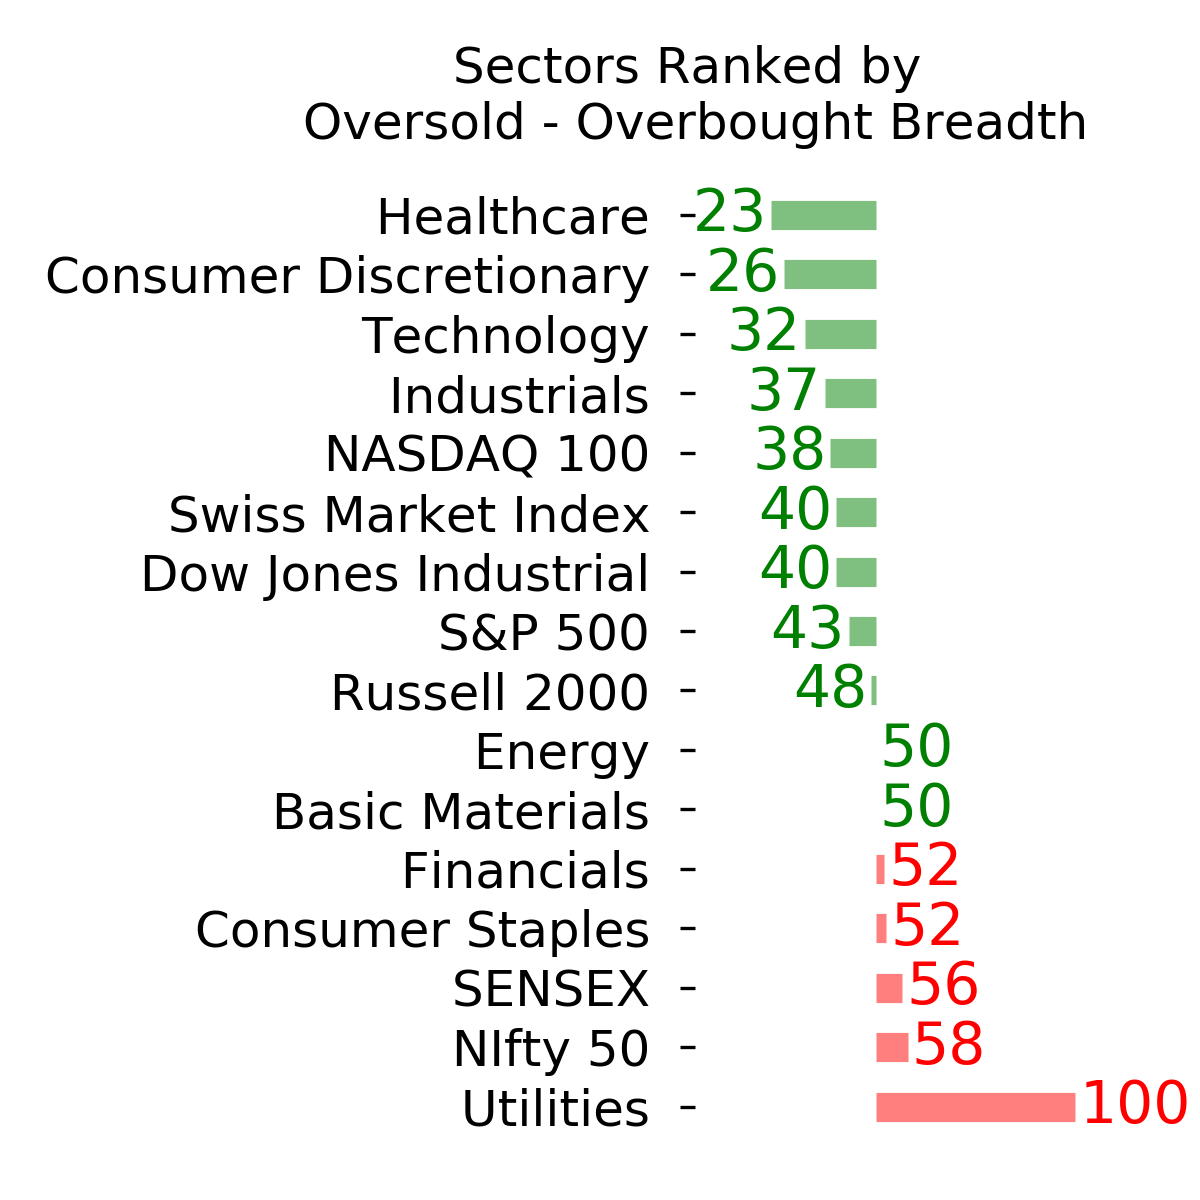
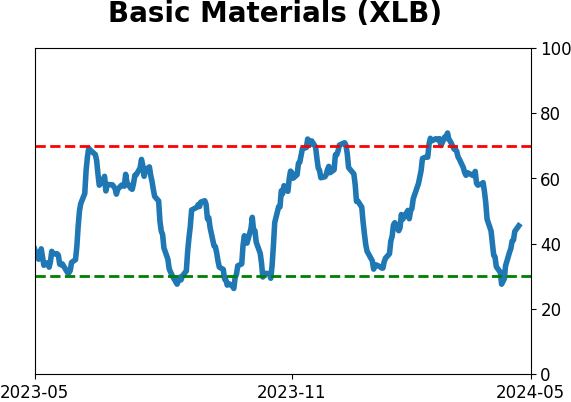
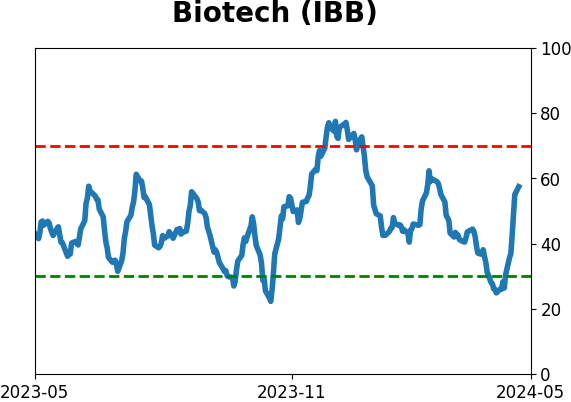
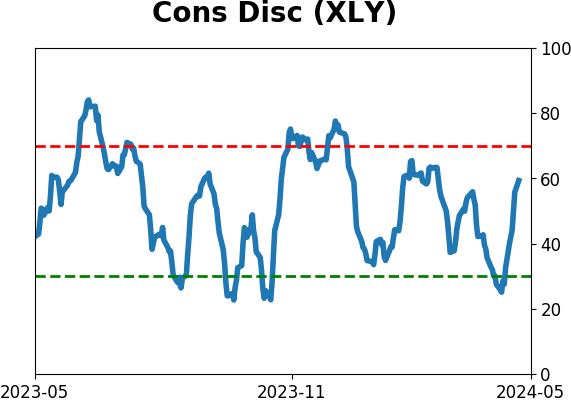
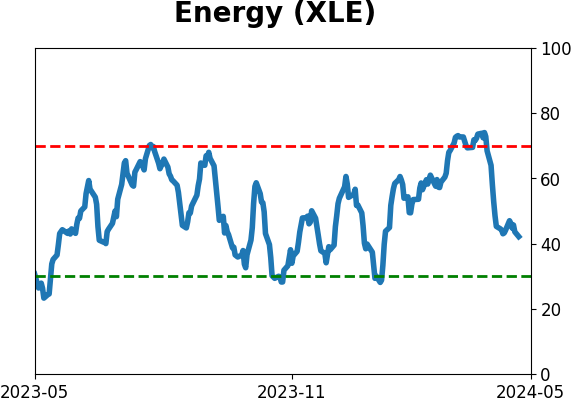
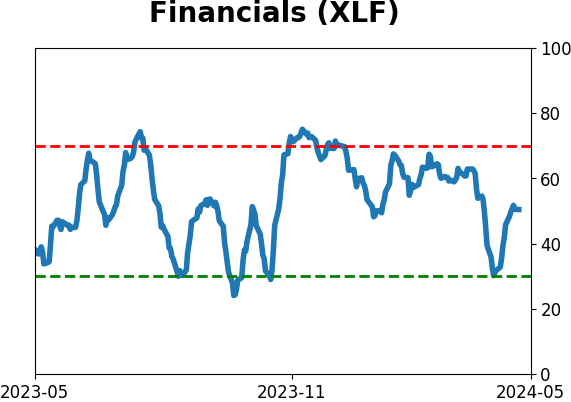
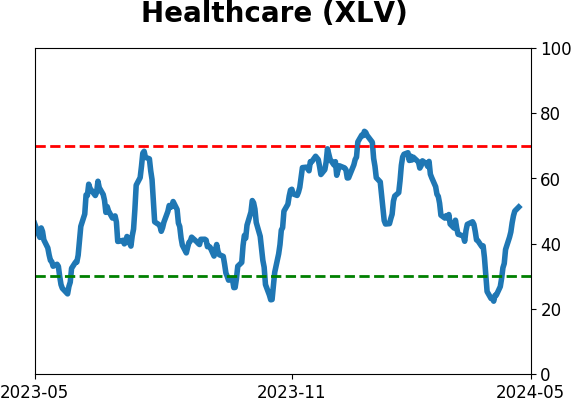
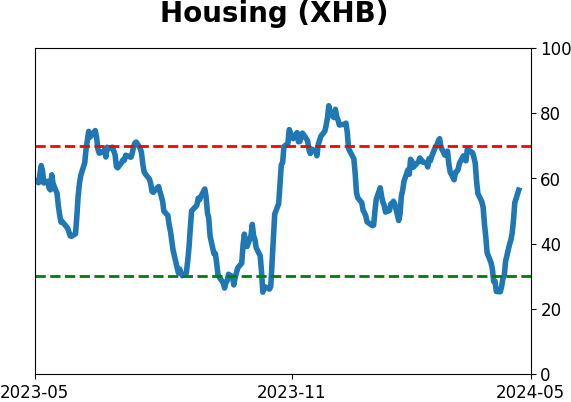
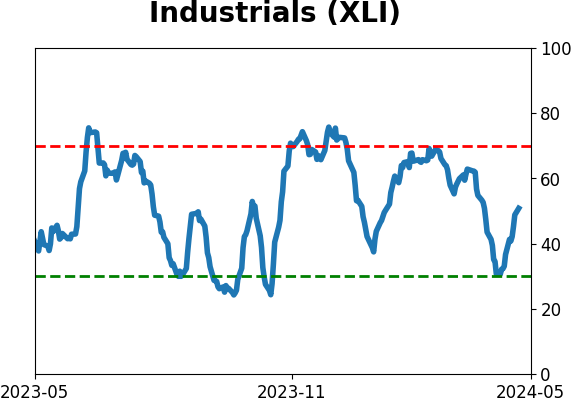
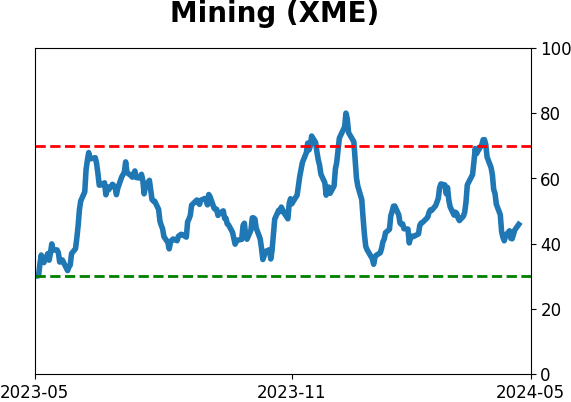
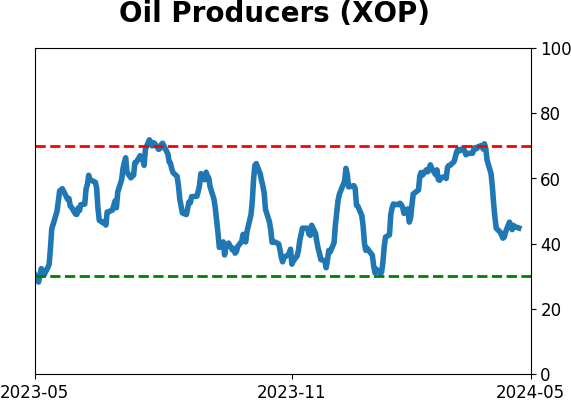
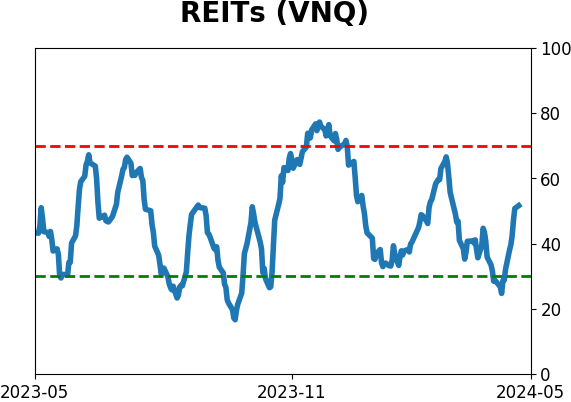
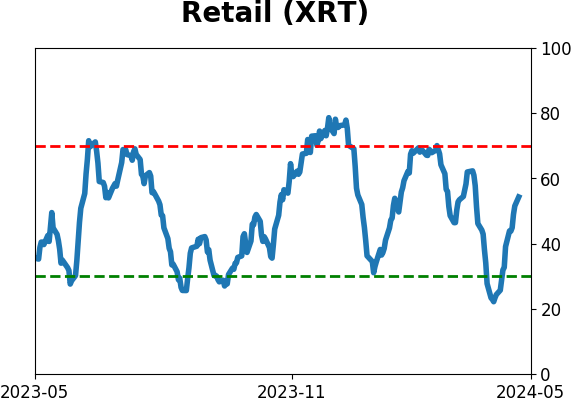
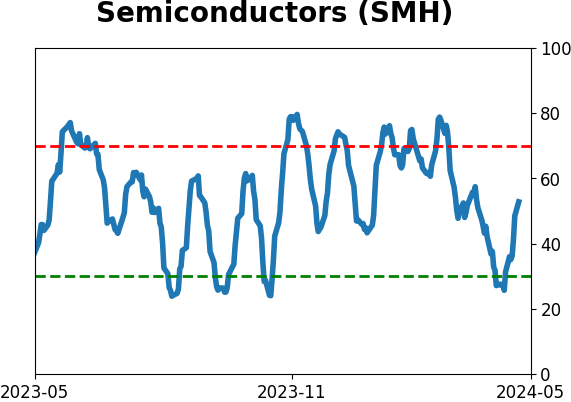
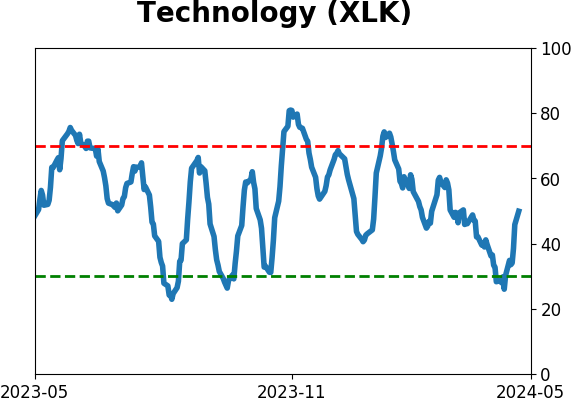
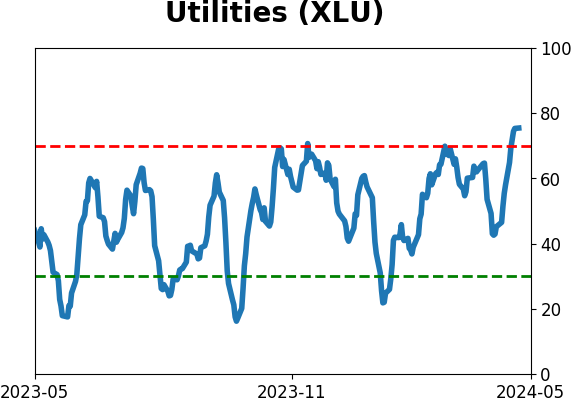
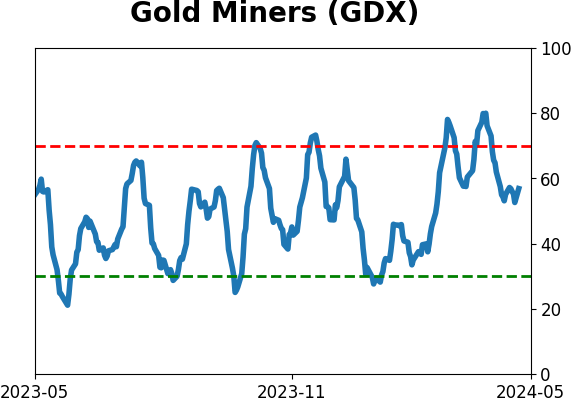
Sector ETF's - 10-Day Moving Average
|
|
|
Country ETF's - 10-Day Moving Average
|
|
|
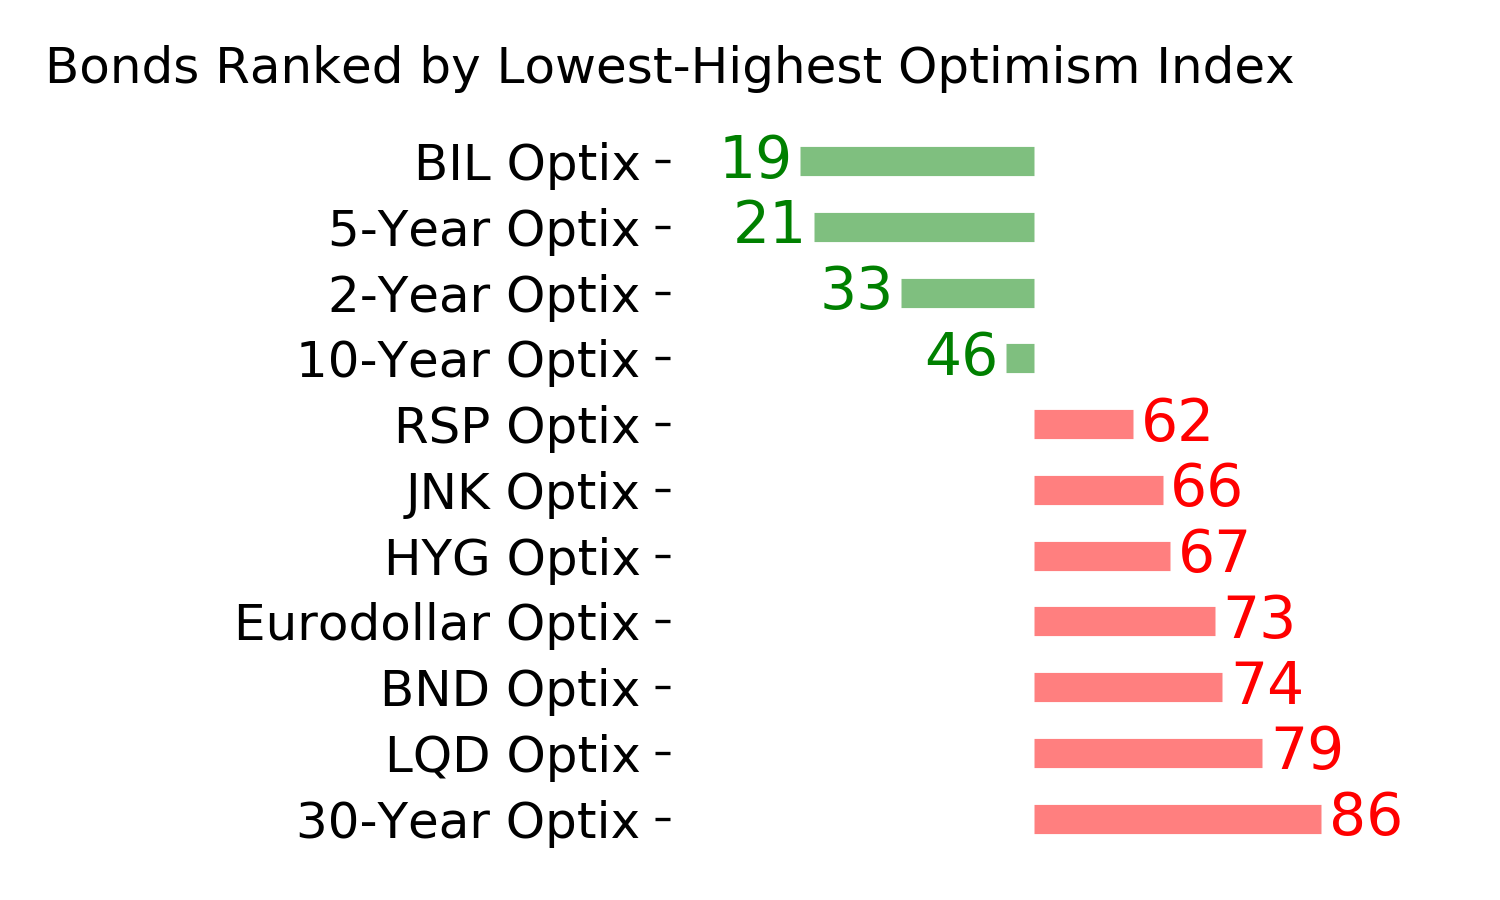
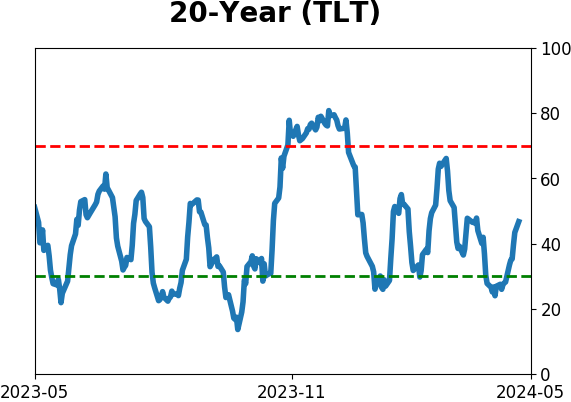
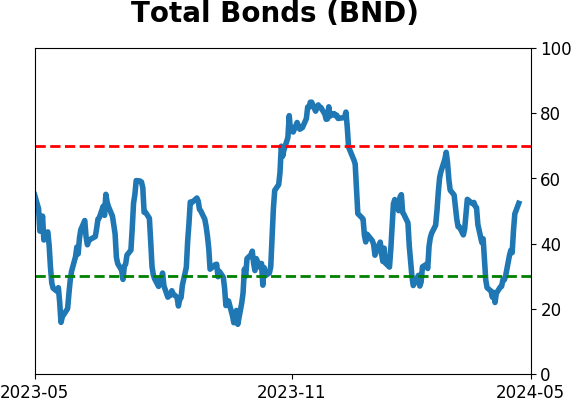
Bond ETF's - 10-Day Moving Average
|
|
|
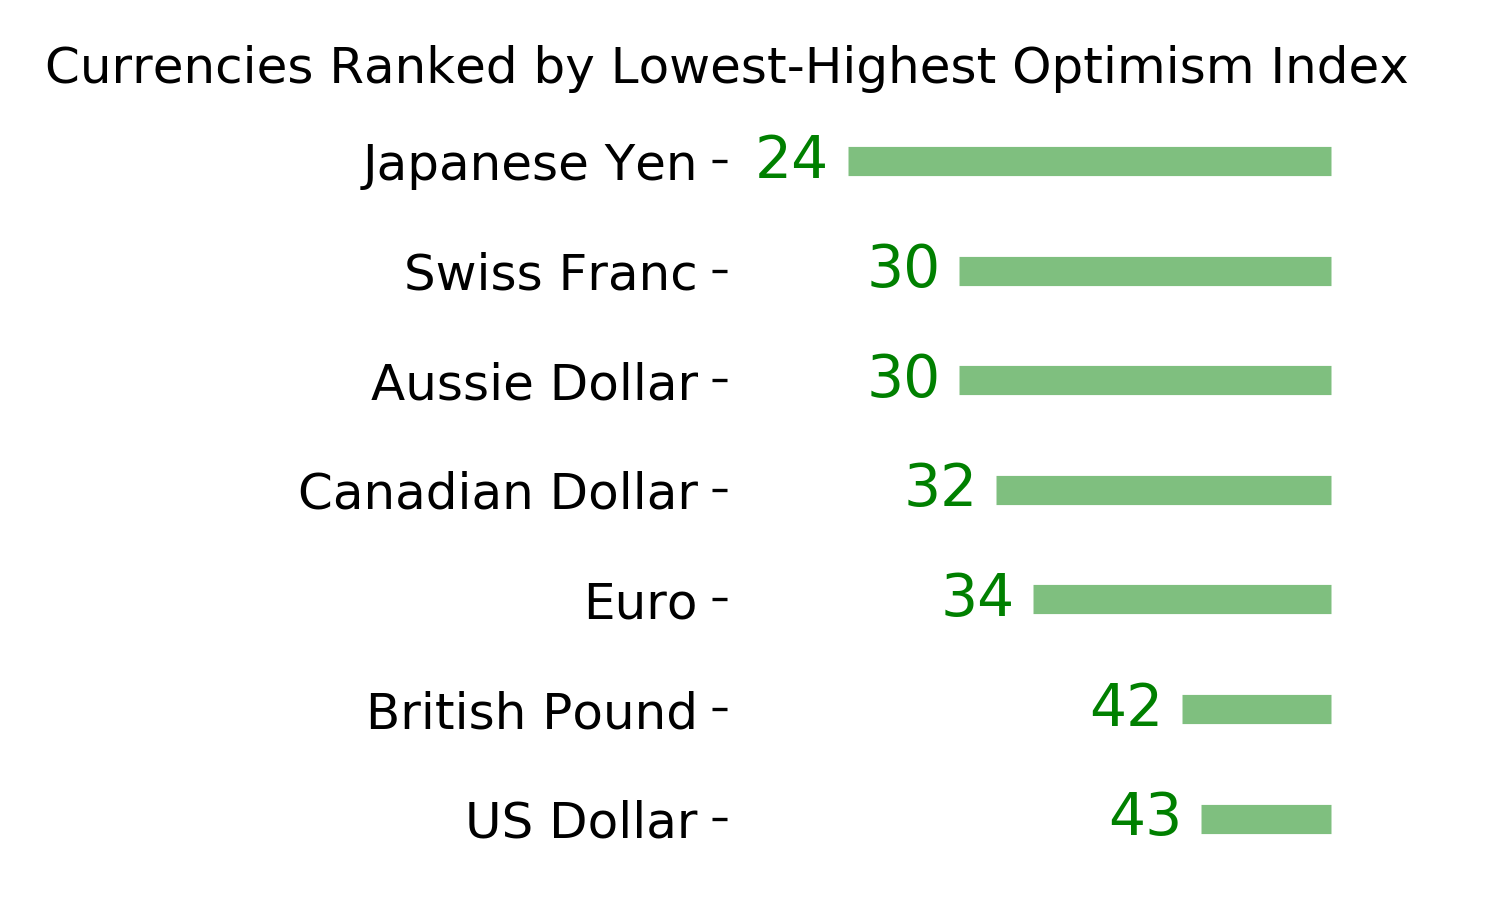
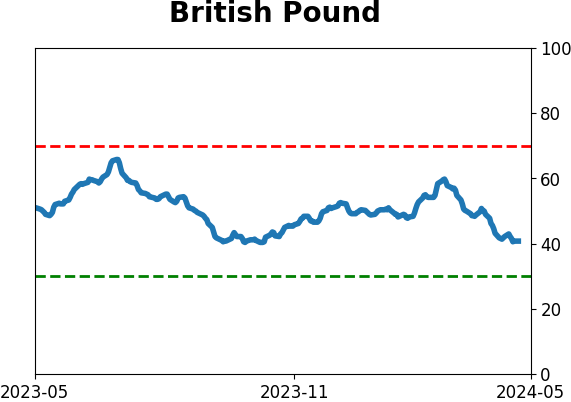
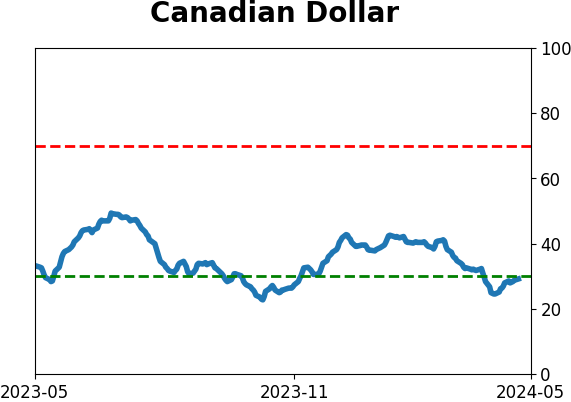
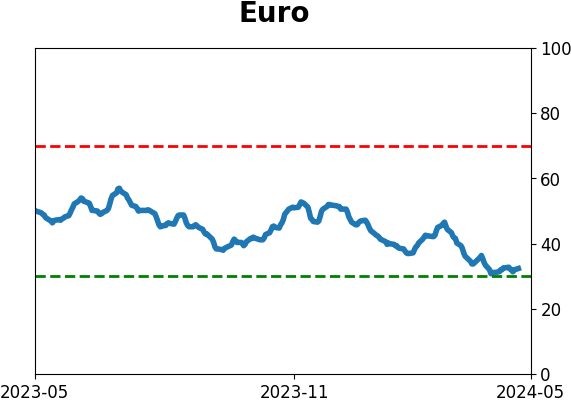
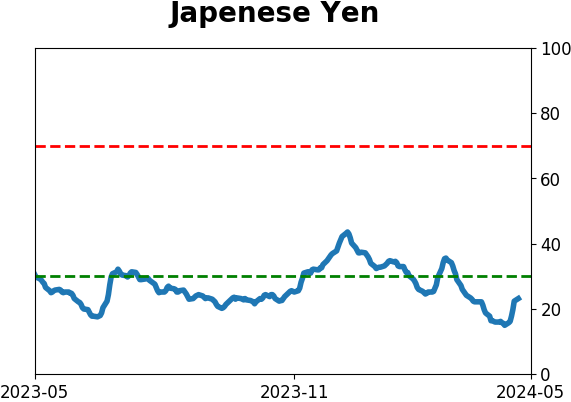
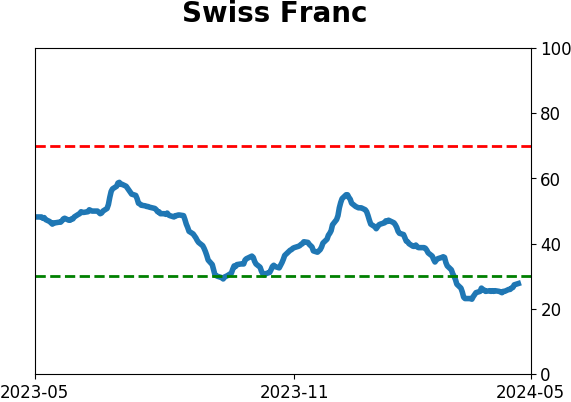
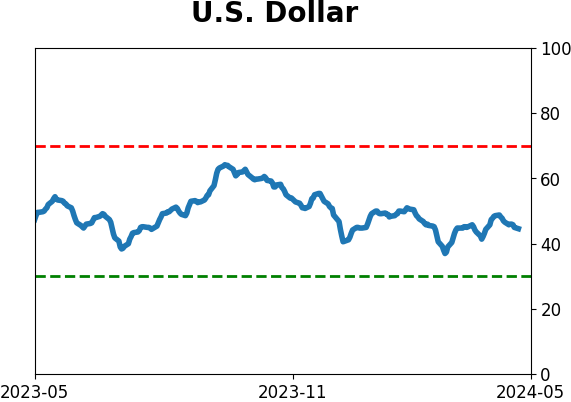
Currency ETF's - 5-Day Moving Average
|
|
|
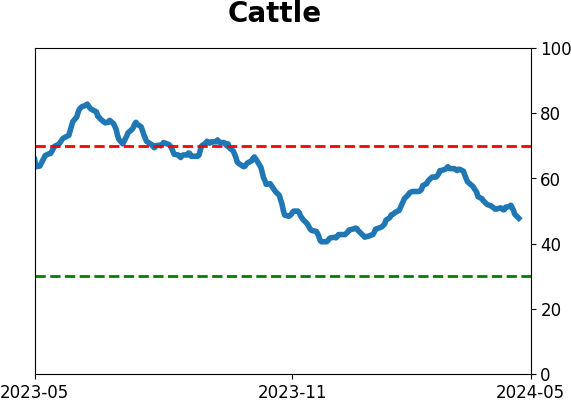
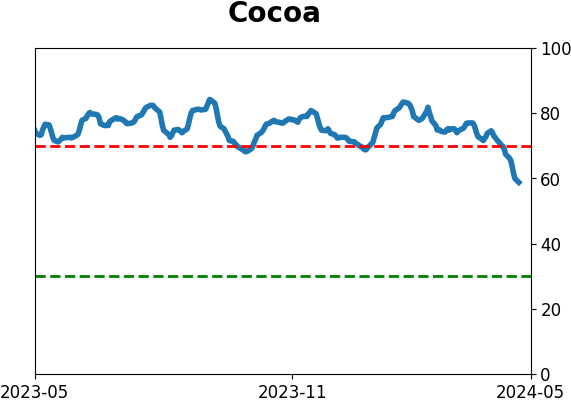
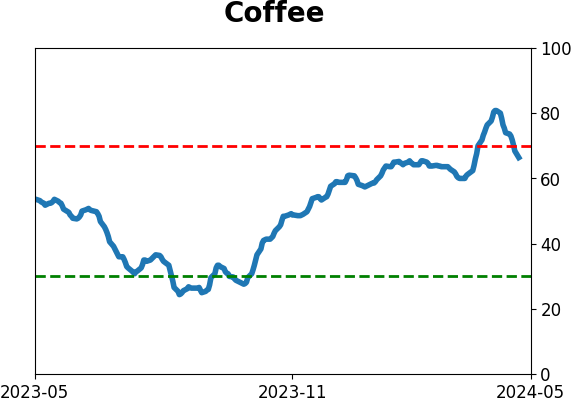
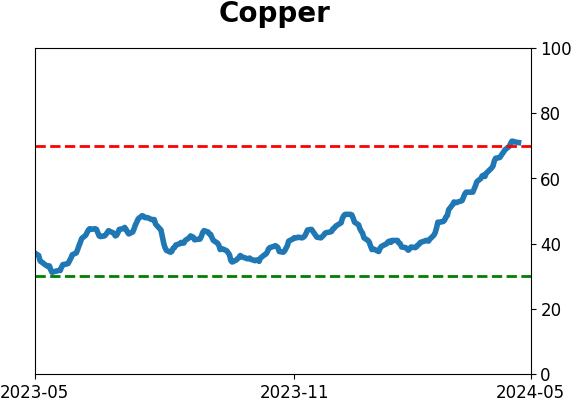
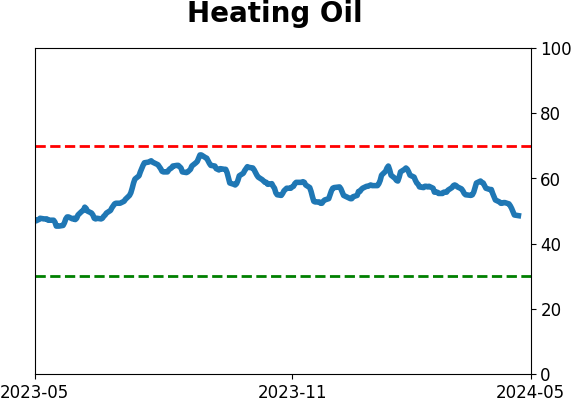
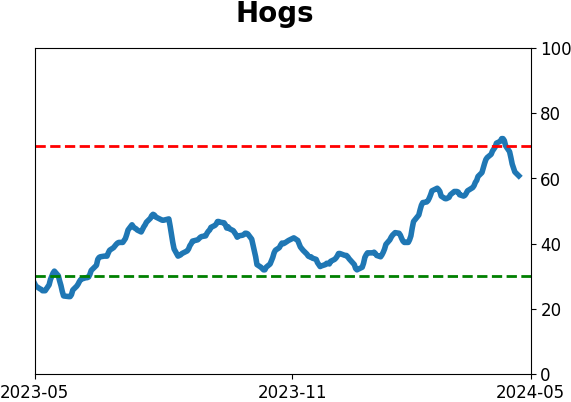
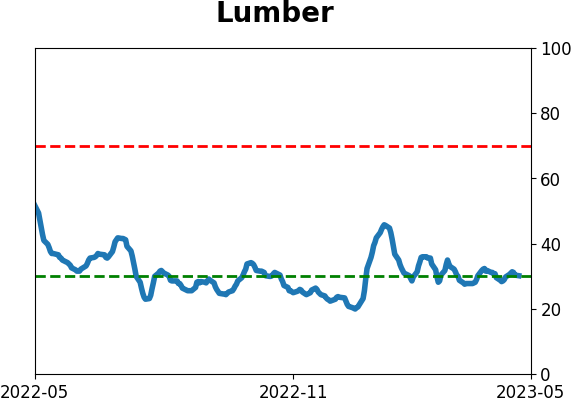
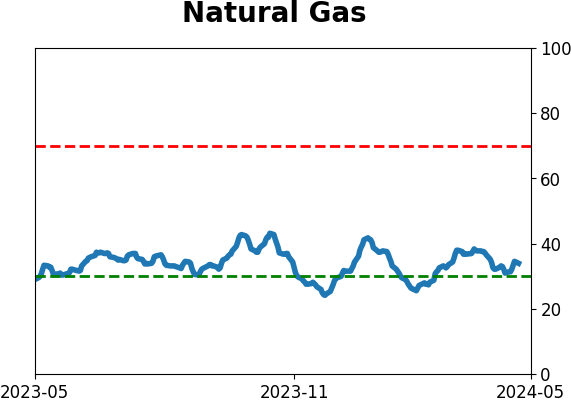
Commodity ETF's - 5-Day Moving Average
|
|