Headlines
|
|
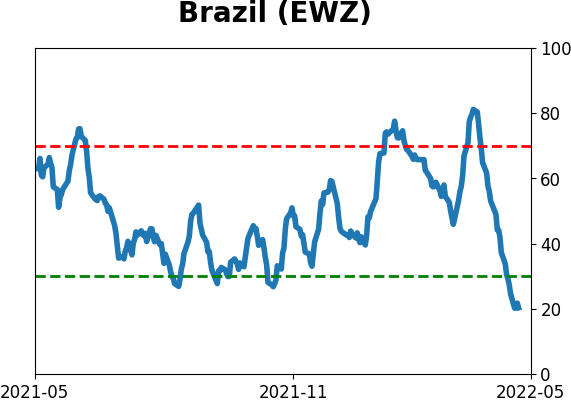
A full circle in Brazil:
Buyers couldn't get enough of Brazilian stocks this spring following a massive rebound from deeply oversold conditions. But there has been almost nothing but selling over the past month, and some shorter-term extremes are now popping up.
|
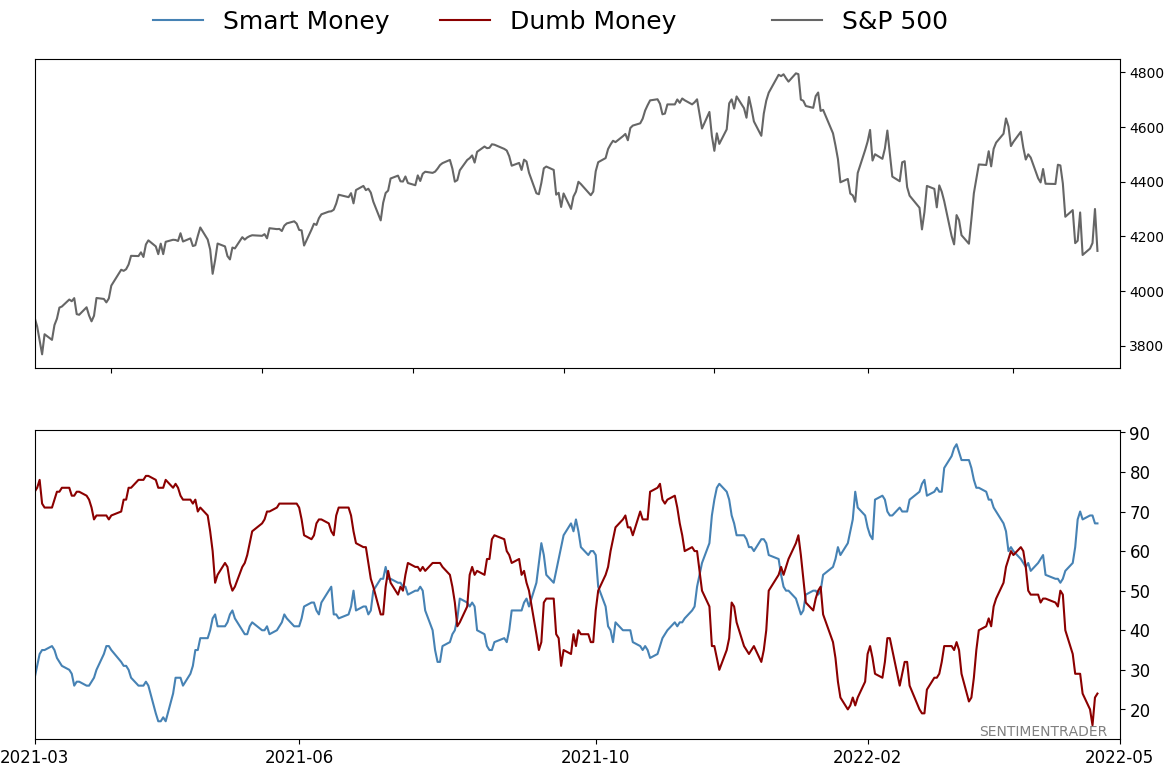
Smart / Dumb Money Confidence
|
Smart Money Confidence: 67%
Dumb Money Confidence: 24%
|
|
Risk Levels
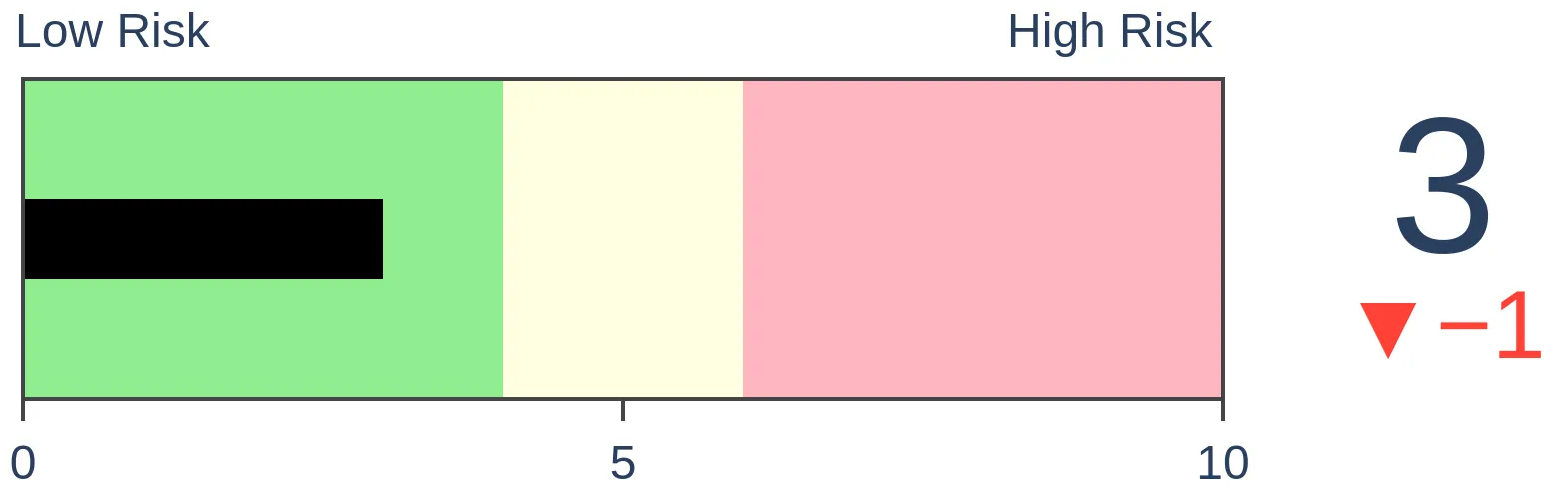
Stocks Short-Term
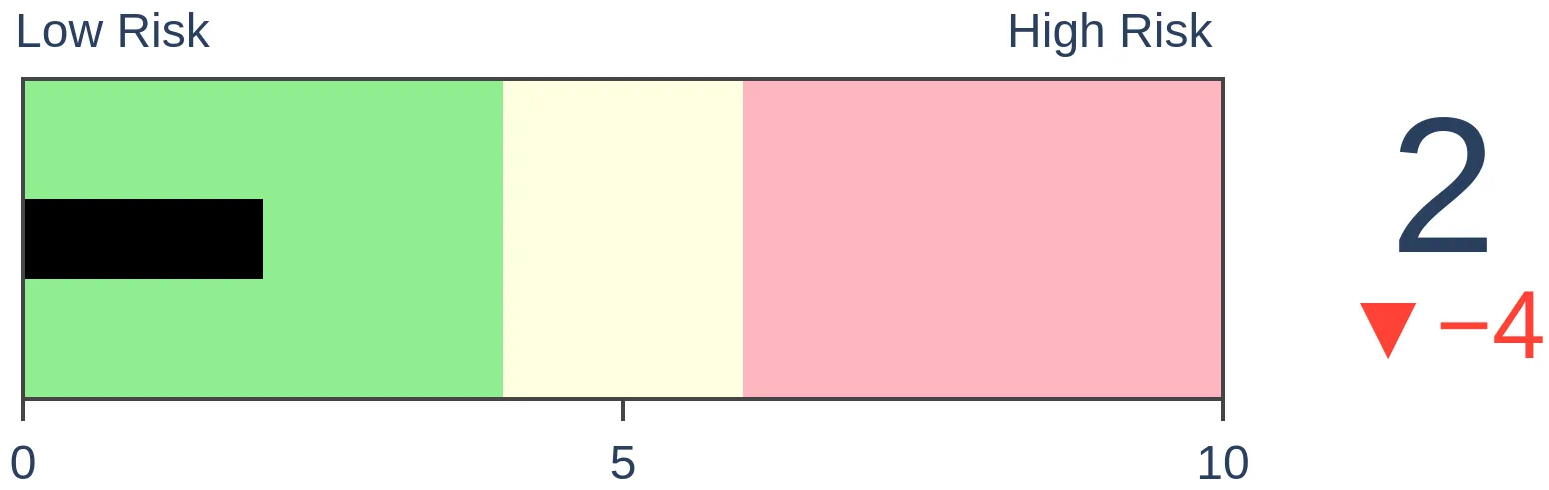
|
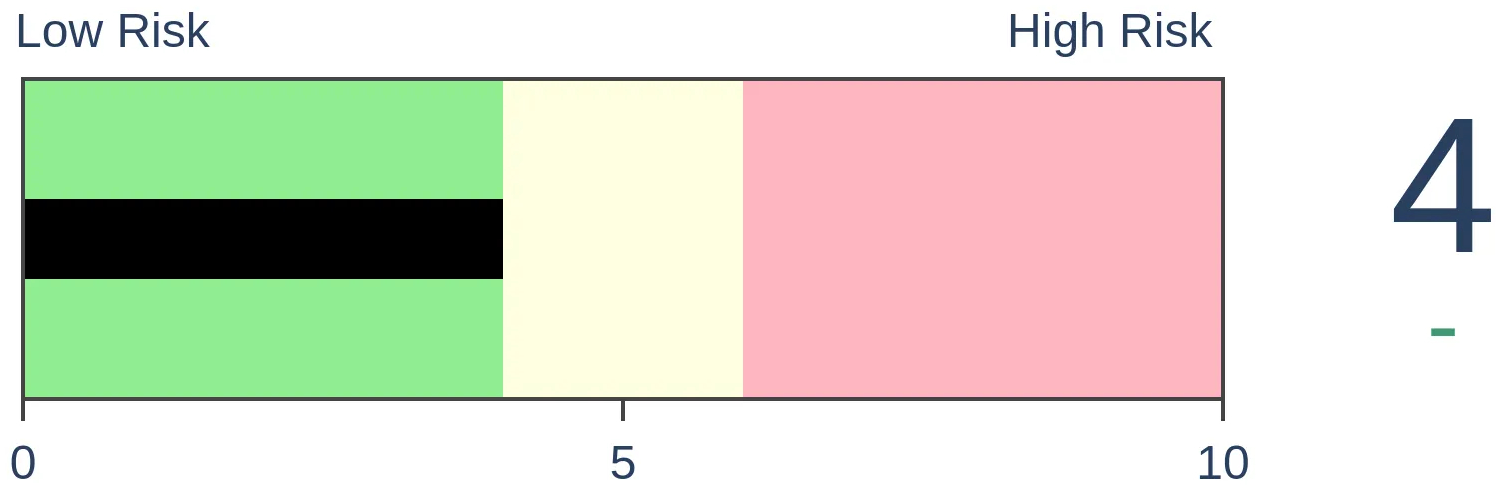
Stocks Medium-Term
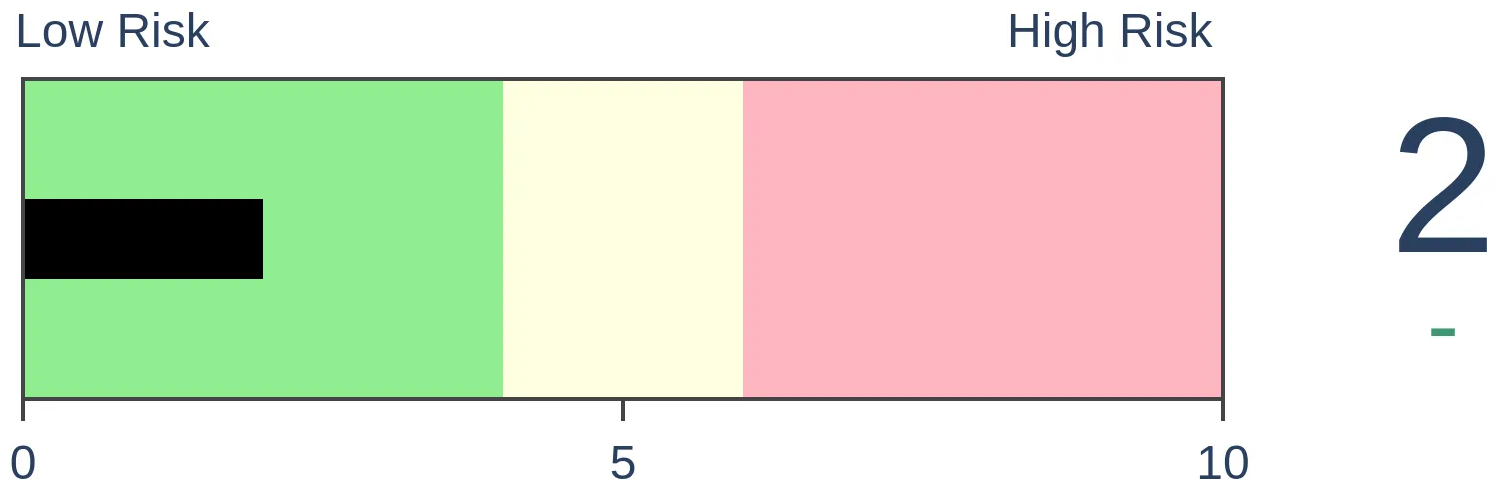
|
|
Bonds
|
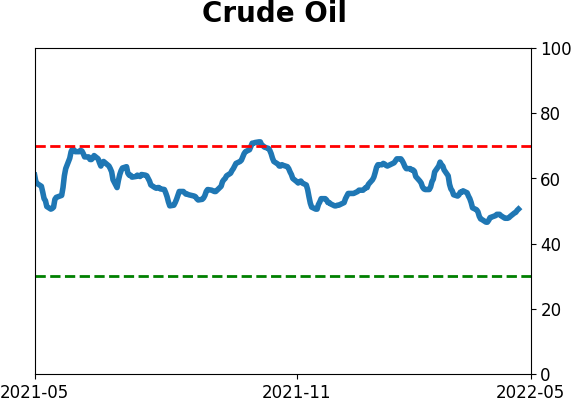
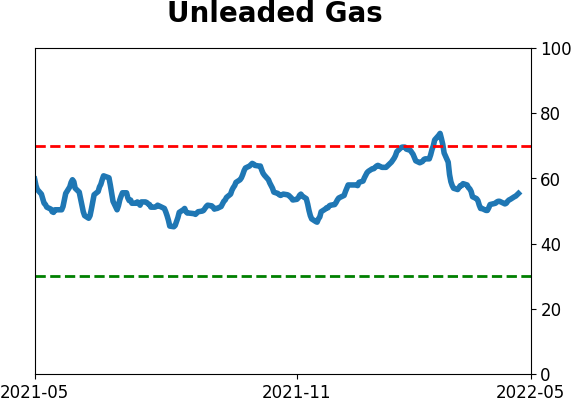
Crude Oil
|
|
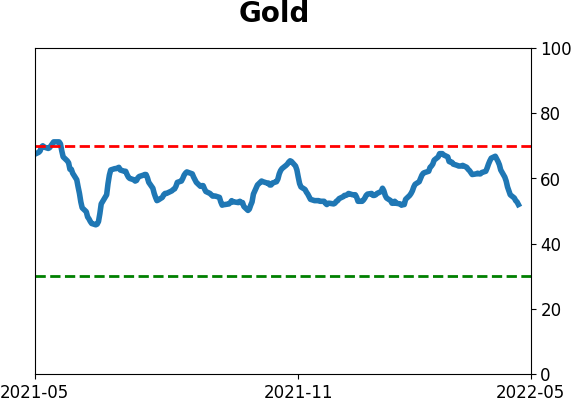
Gold

|
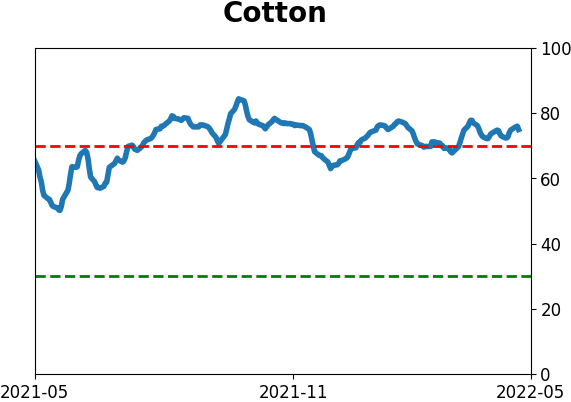
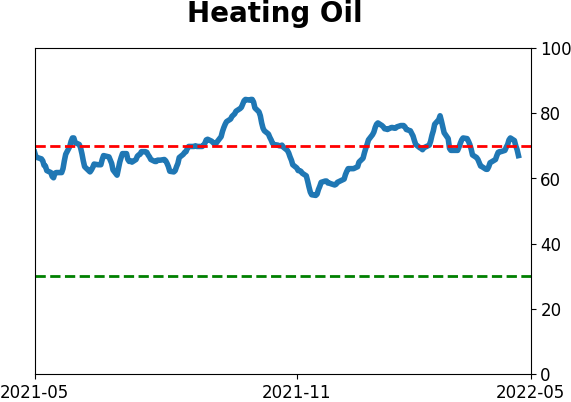
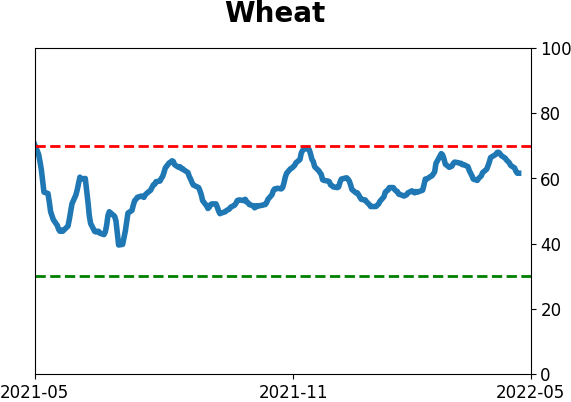
Agriculture

|
|
Research
By Jason Goepfert
BOTTOM LINE
Buyers couldn't get enough of Brazilian stocks this spring following a massive rebound from deeply oversold conditions. But there has been almost nothing but selling over the past month, and some shorter-term extremes are now popping up.
FORECAST / TIMEFRAME
None
|
Key points:
- Stocks in Brazil's Ibovespa have seen extreme selling pressure over the past month
- The selling has been enough to trigger extremes in the A/D Line and McClellan Oscillator
- Negative and deteriorating longer-term indicators remain a concern
Brazilian stocks register some short-term extremes
Last October, investors were selling Brazilian stocks to a historic degree. Then through the first couple of months of this year, the Ibovespa recorded impressive momentum and turned many of the long-term internal metrics.
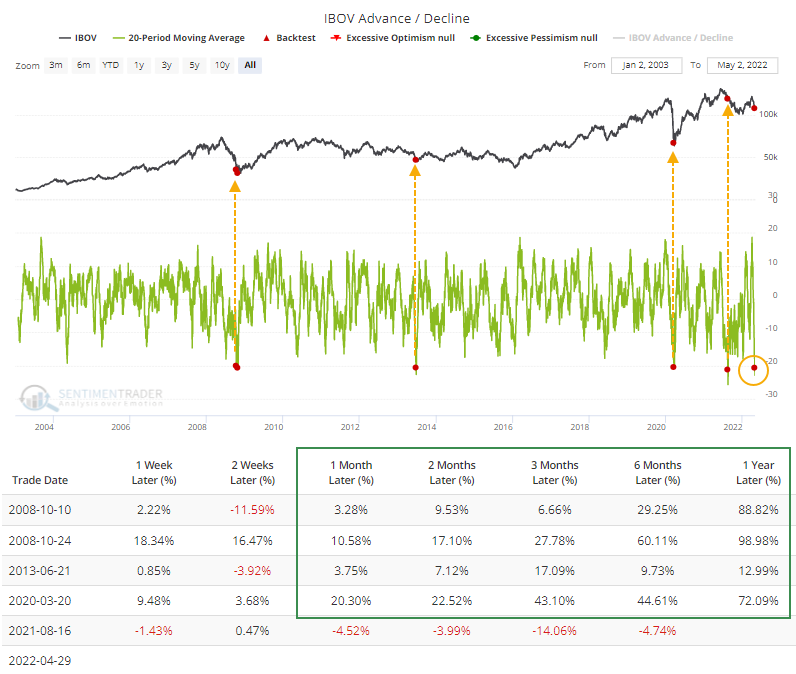
That market skyrocketed into early April, but it's been in a freefall ever since. Over the past 20 sessions, an average of more than 20 more stocks have declined than advanced, one of the lowest readings in 20 years. The Backtest Engine shows that the others led to excellent returns three distinct times and a horrible loss once.
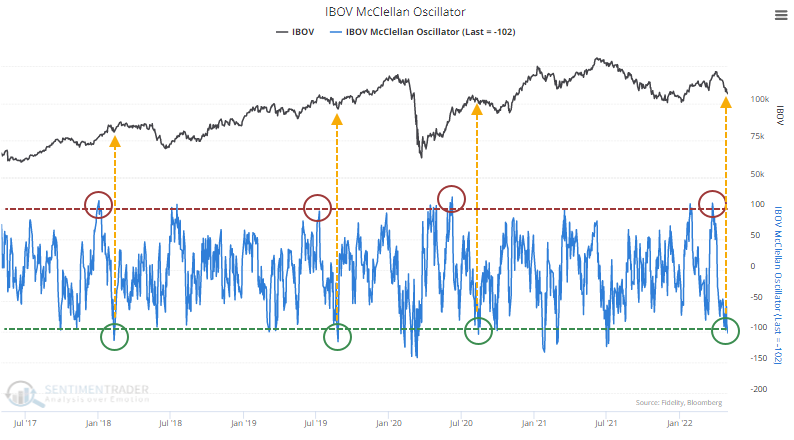
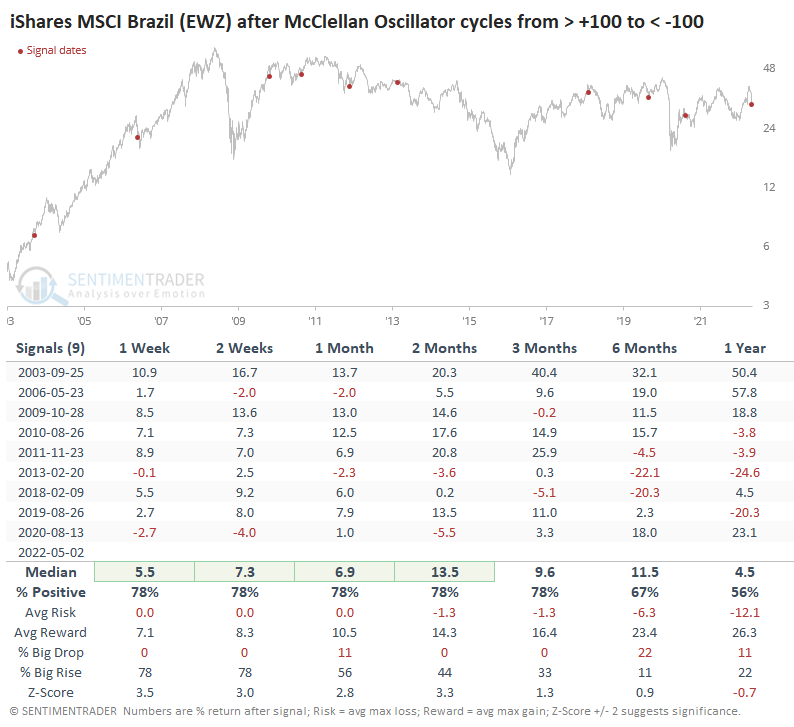
Over the past few weeks, the selling pressure pushed the McClellan Oscillator for the Ibovespa from above +100 to below -100. This is its third round-trip in the past five years, with the others mostly leading to positive returns over the medium-term.
Over the past 20 years, returns were good up to two months later. The EWZ fund (priced in U.S. dollars) tended to rebound in the weeks ahead, with all of the signals showing a positive return at some point between 2-8 weeks later.
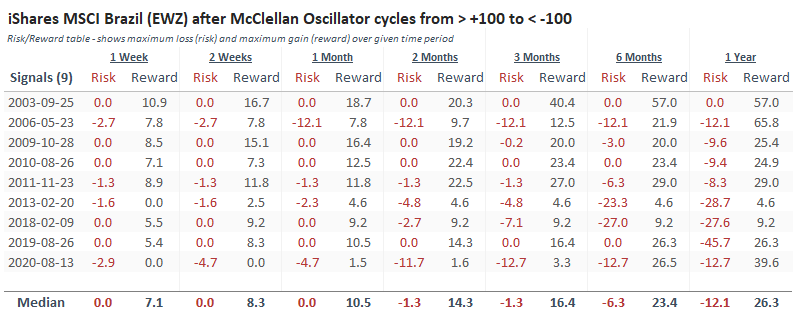
The Risk/Reward Table shows that the former tended to be limited, with only three of the signals showing more than -3% risk at any point within the next two months. All but one of the signals showed a gain of more than +4.6% within the next couple of months.
What the research tells us...
It's not a great sign that Brazilian stocks suffered selling pressure as soon as 60% of them rose above their 200-day moving average; that's what happens in unhealthy markets. It's also unhealthy that the Ibovespa's McClellan Summation Index is below zero and declining. Those longer-term measures put a brake on becoming too bullish about a market that hasn't been able to hold upside momentum. The shorter-term extremes we're seeing now are a good test to see if Brazil really has turned the corner after the persistent decline into last fall.
Indicators at Extremes
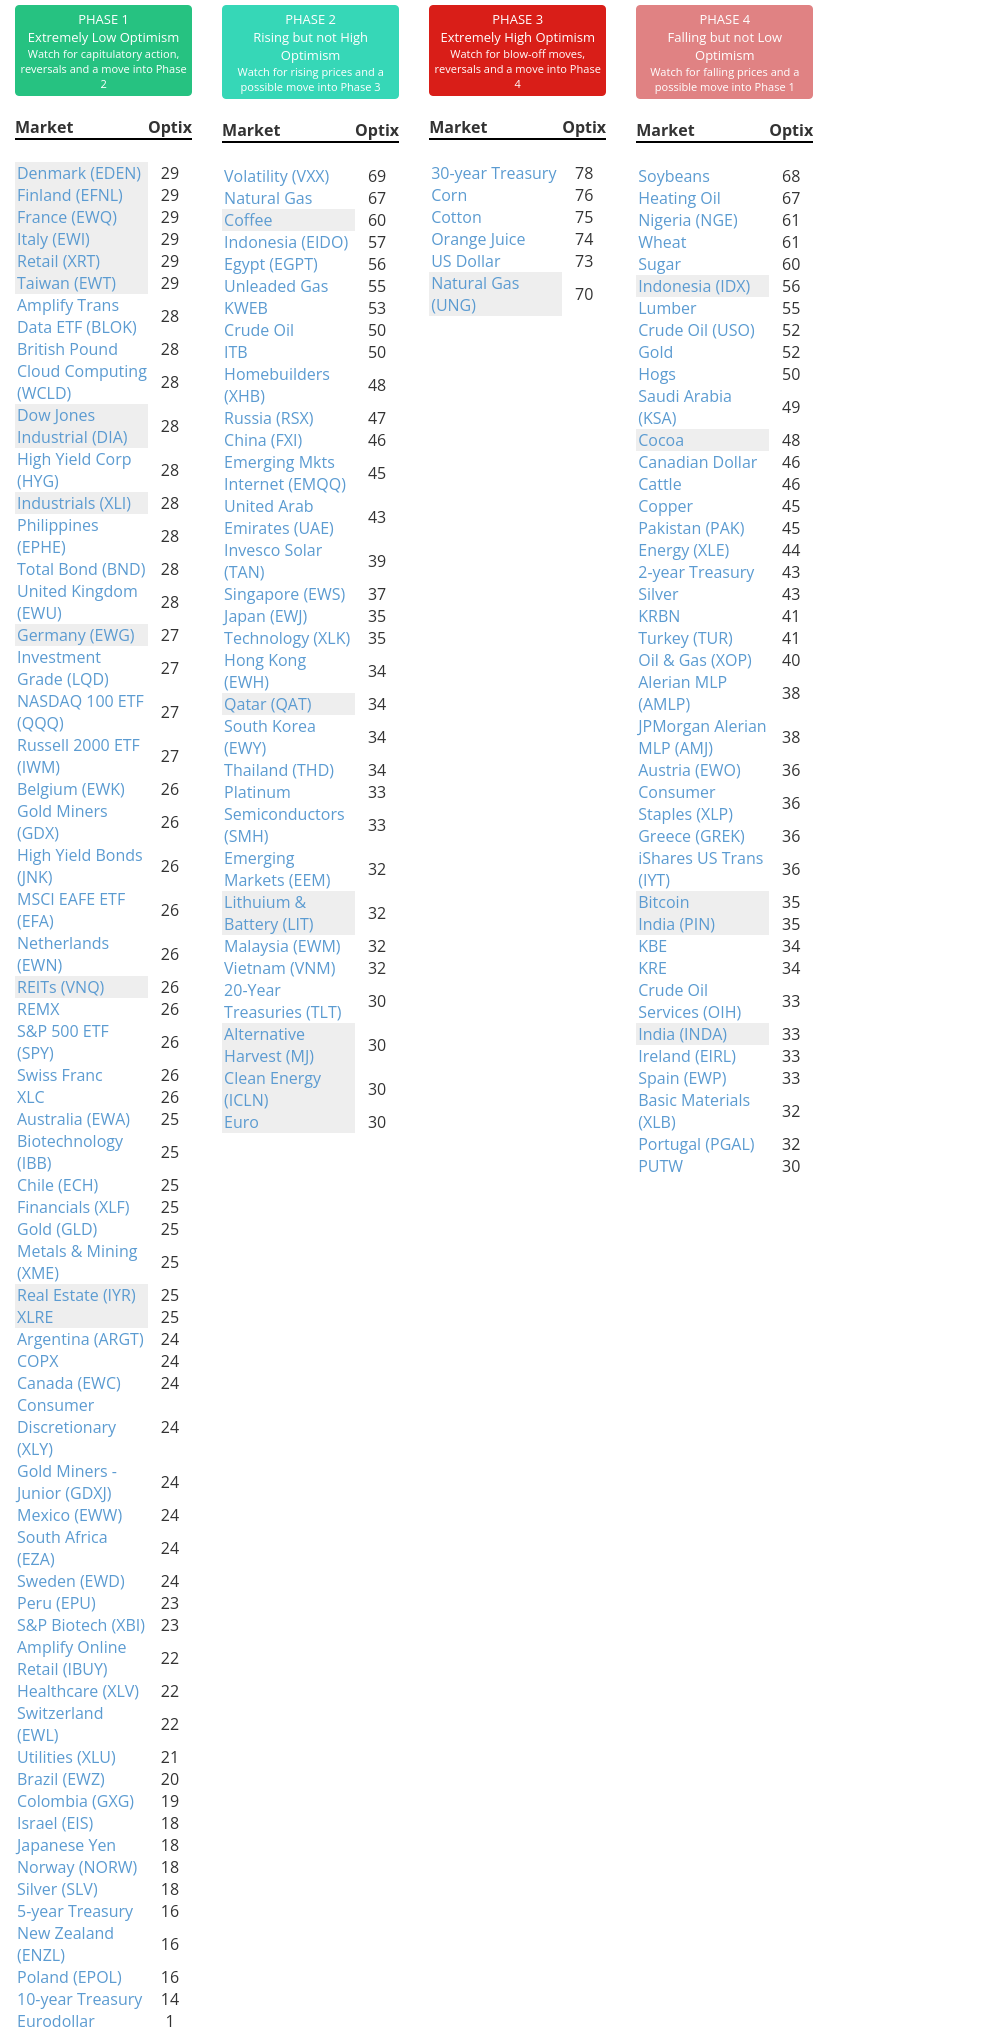
Phase Table
Ranks
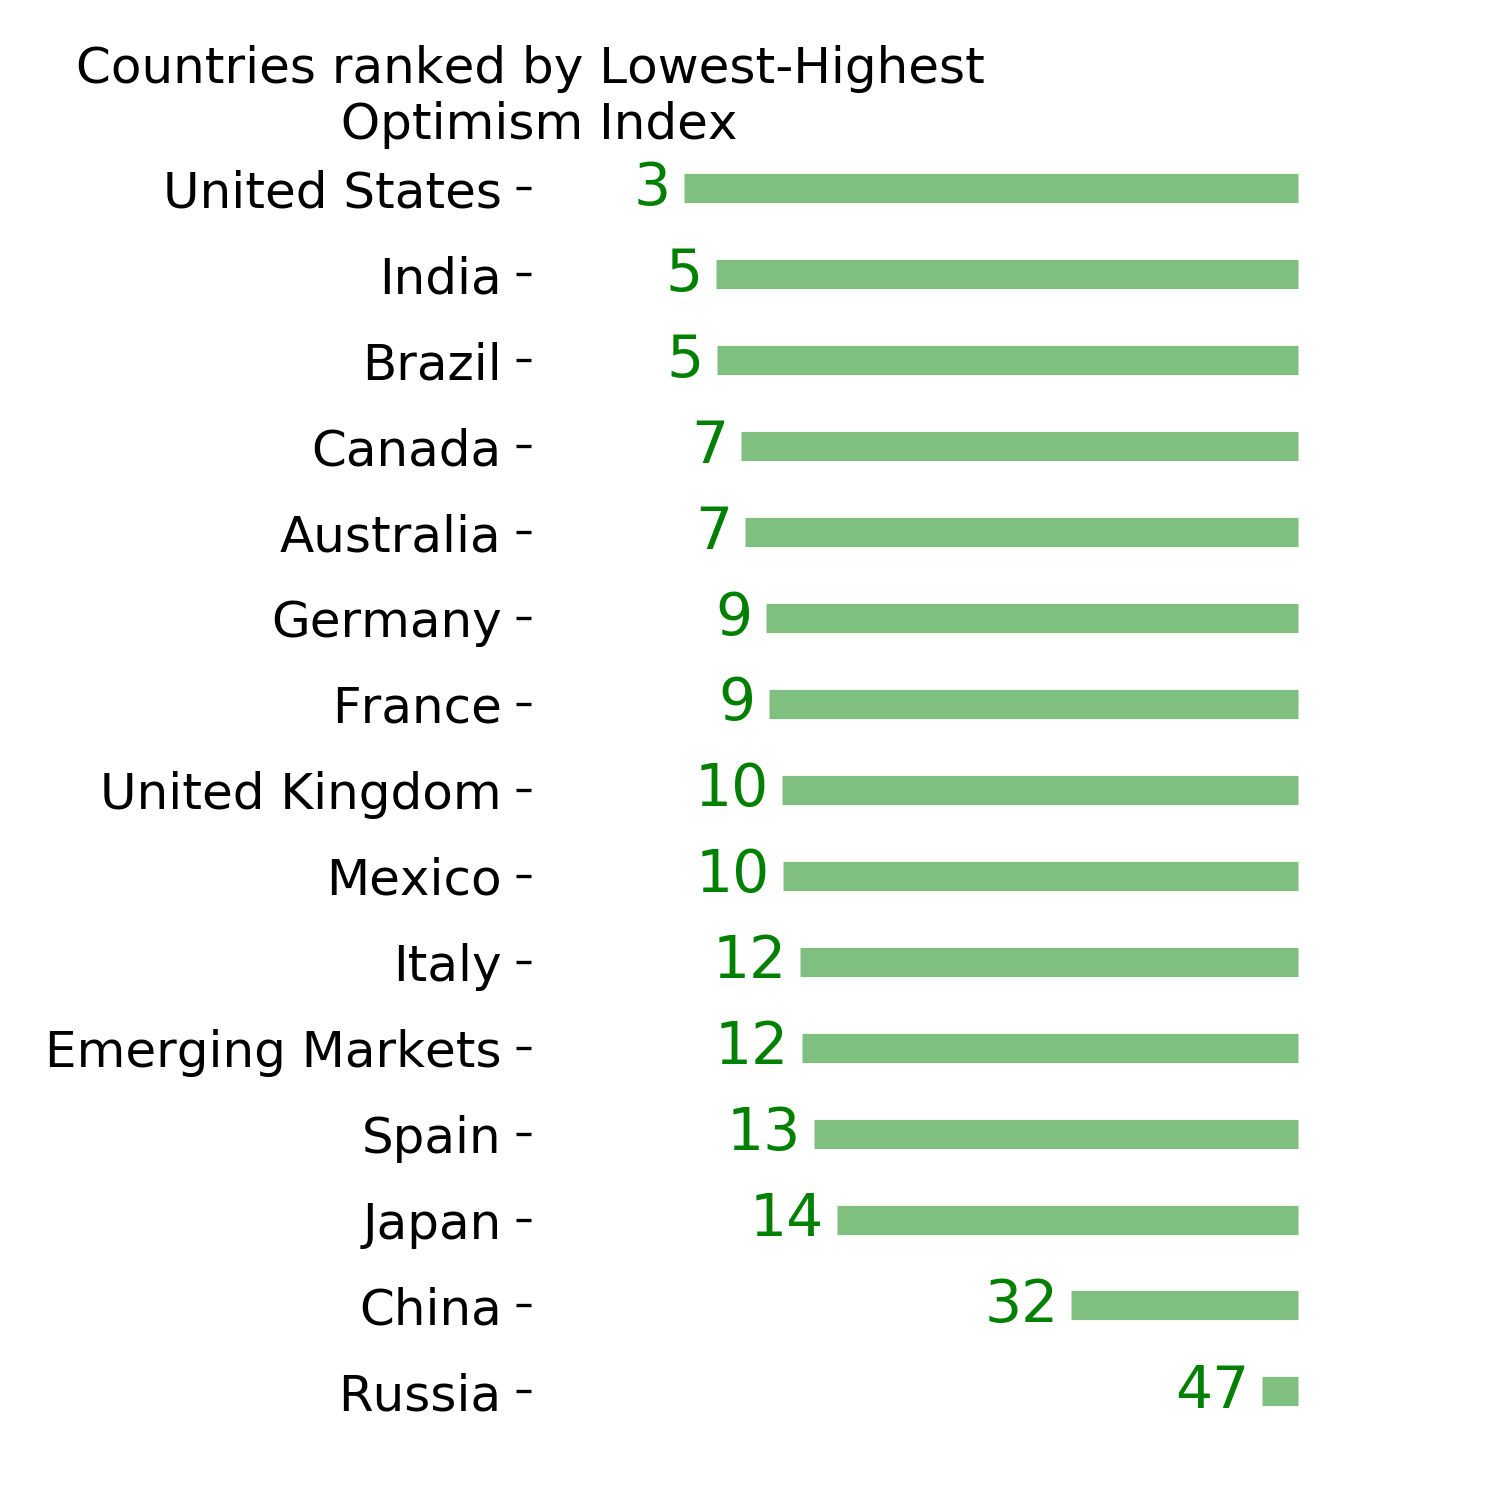
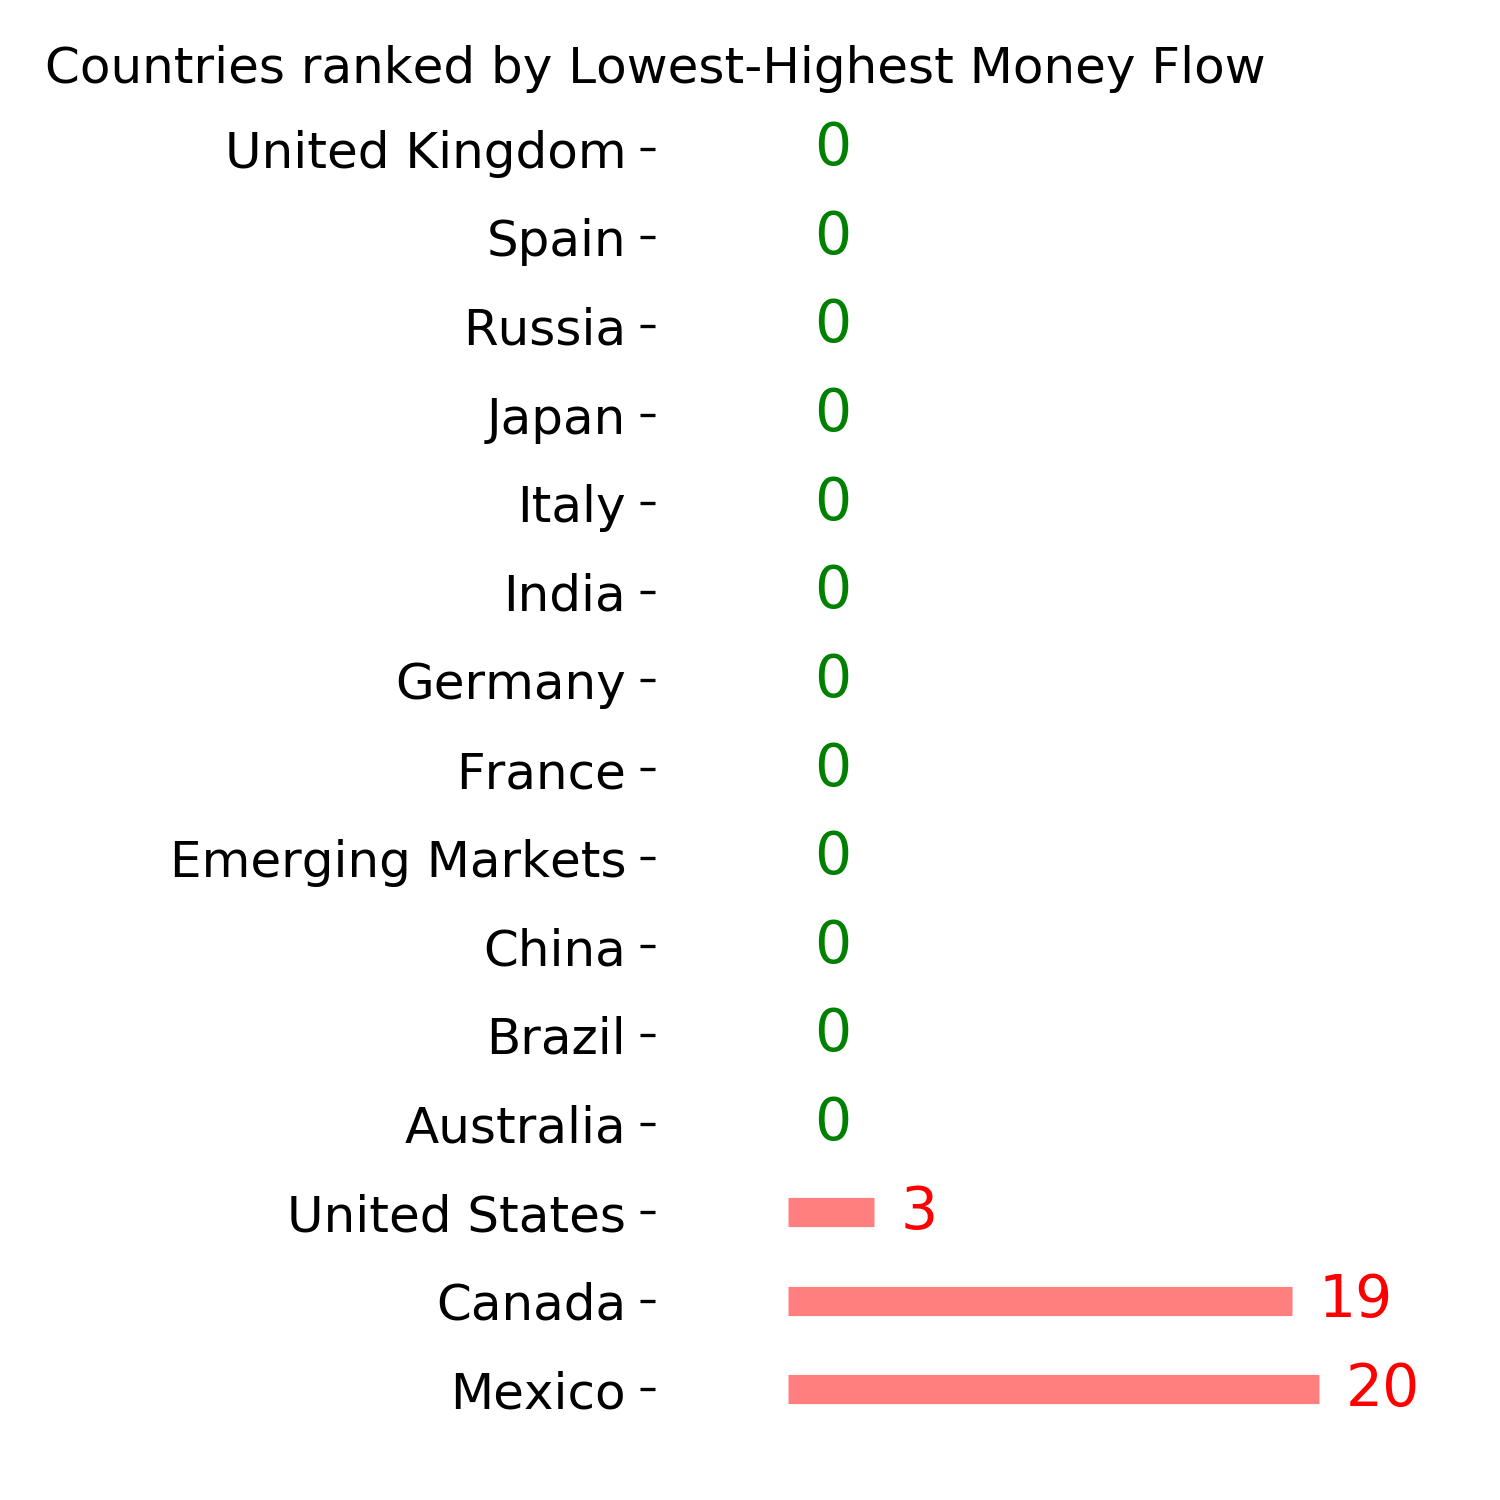
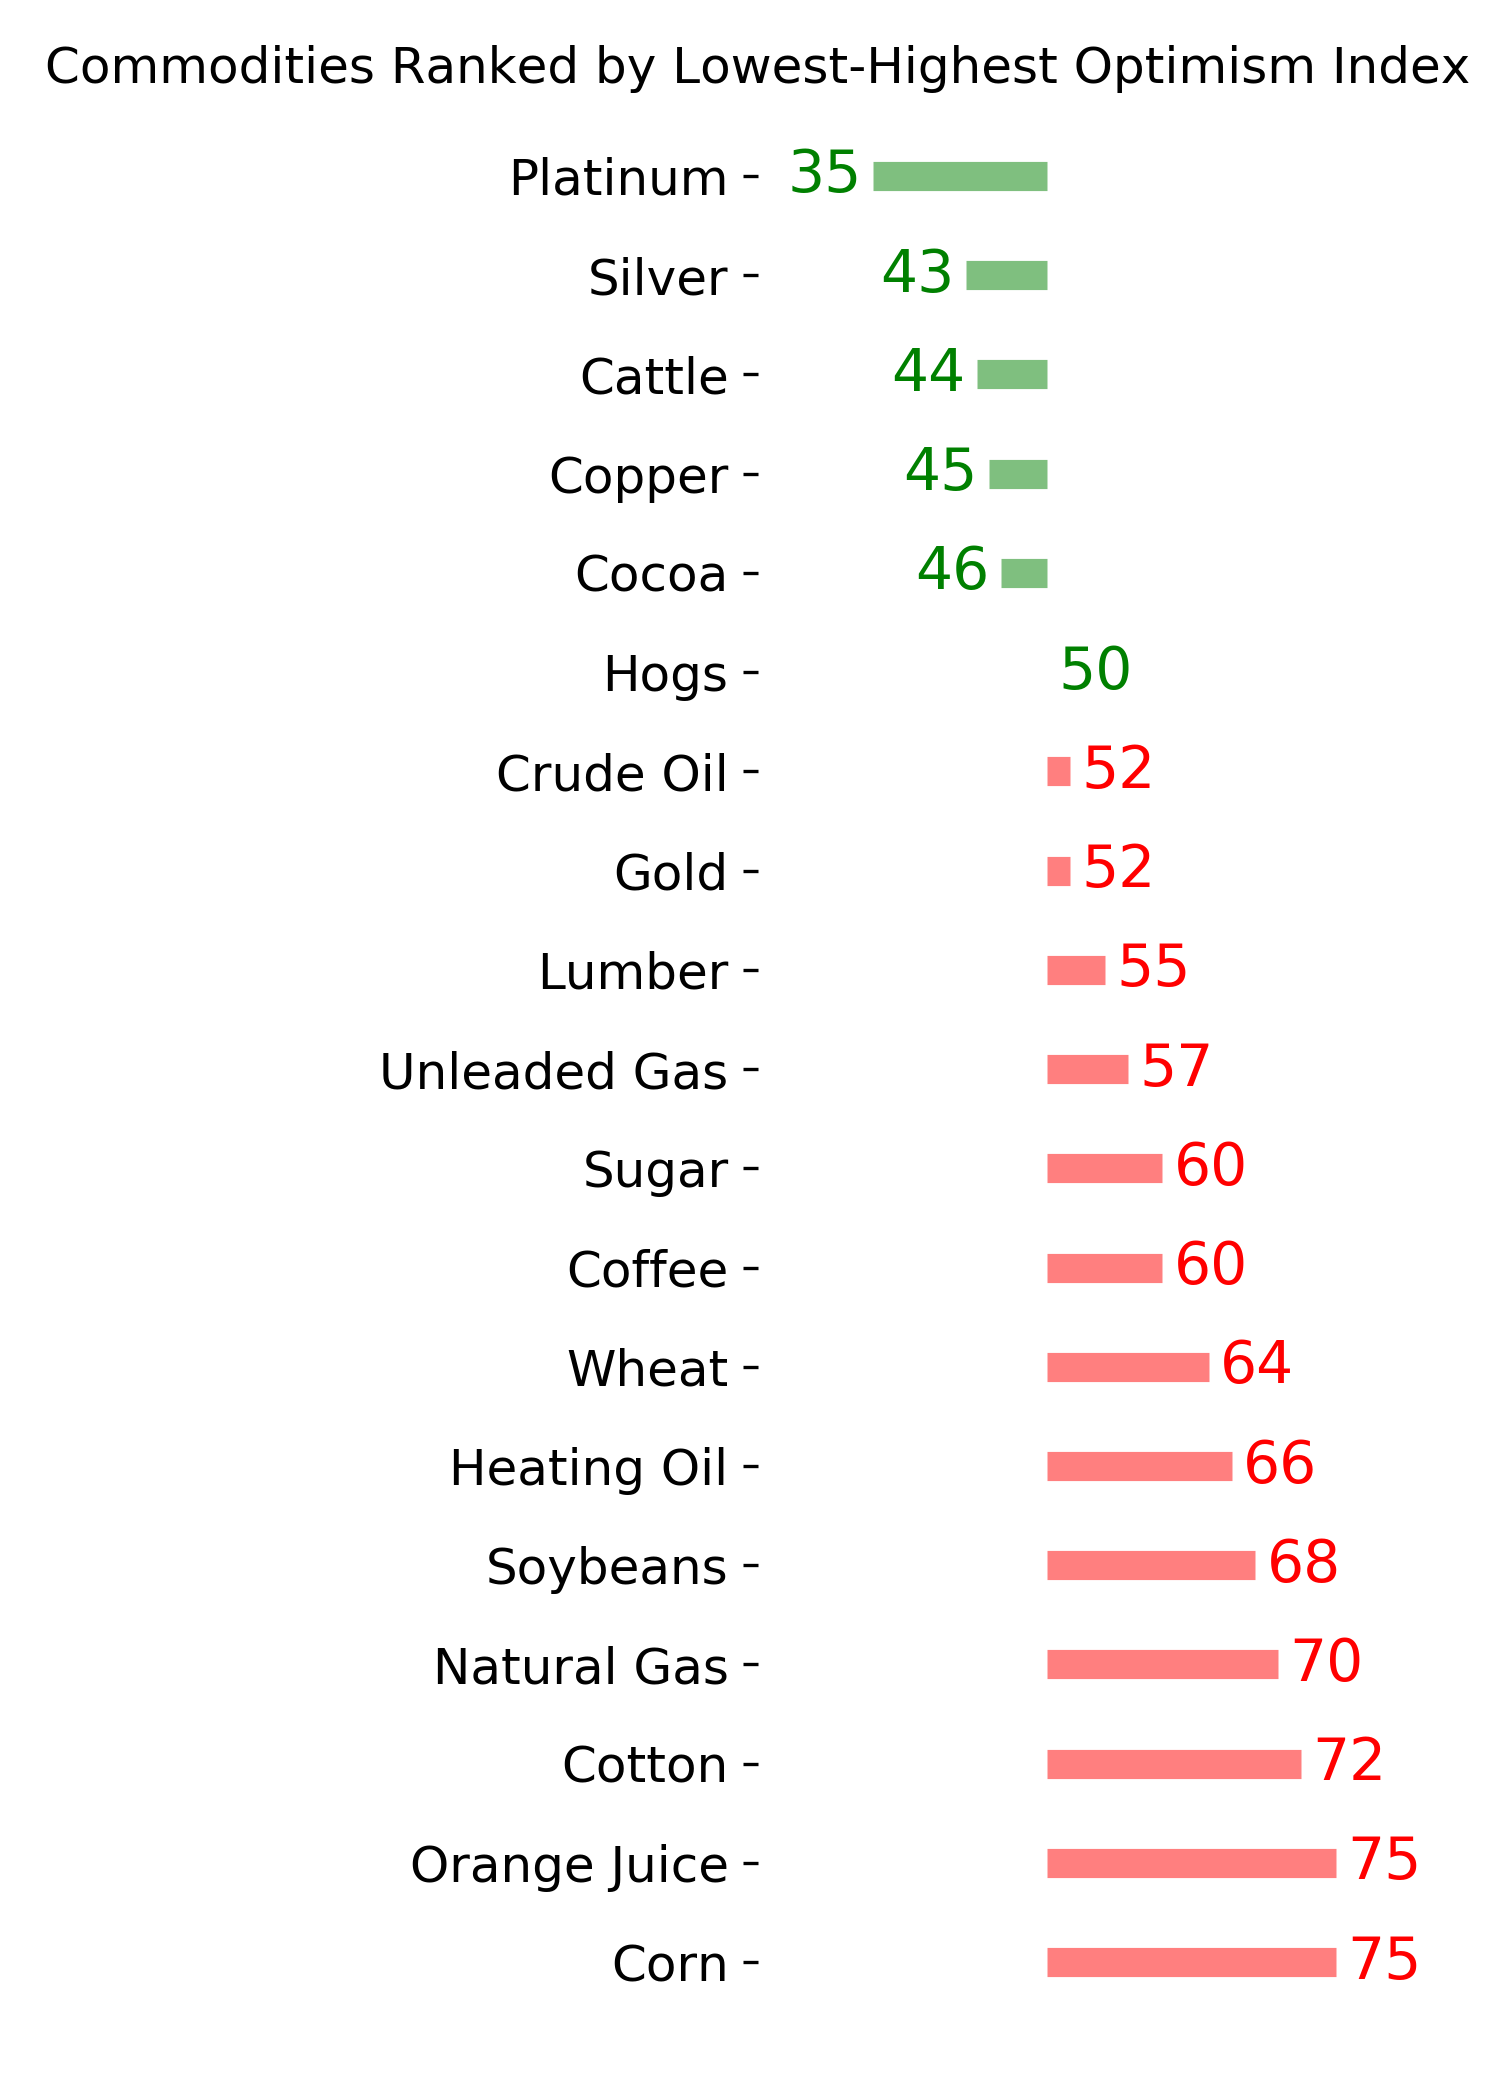
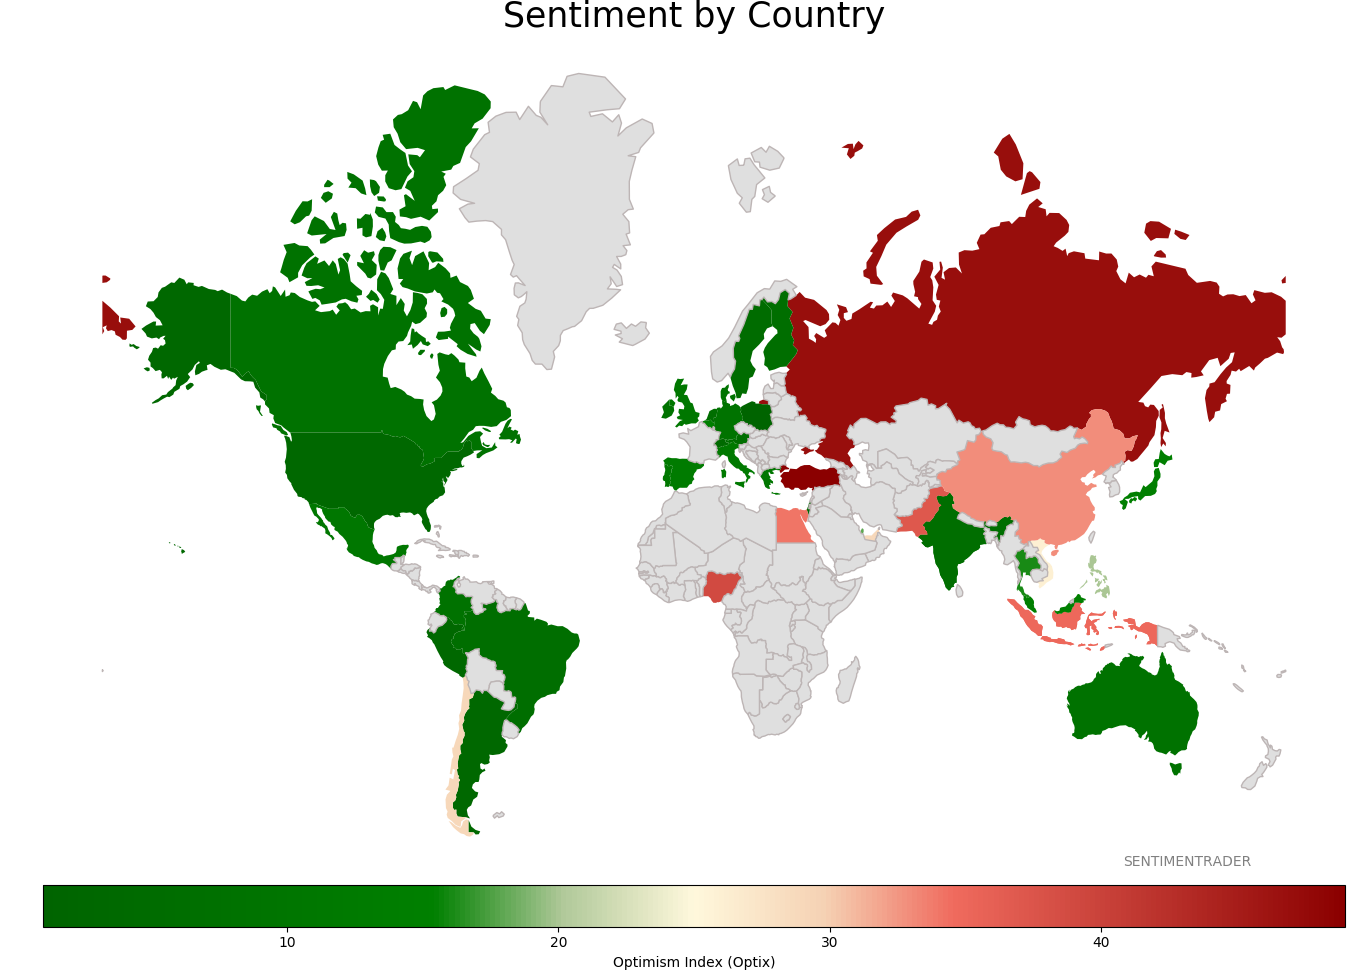
Sentiment Around The World
Optimism Index Thumbnails
|
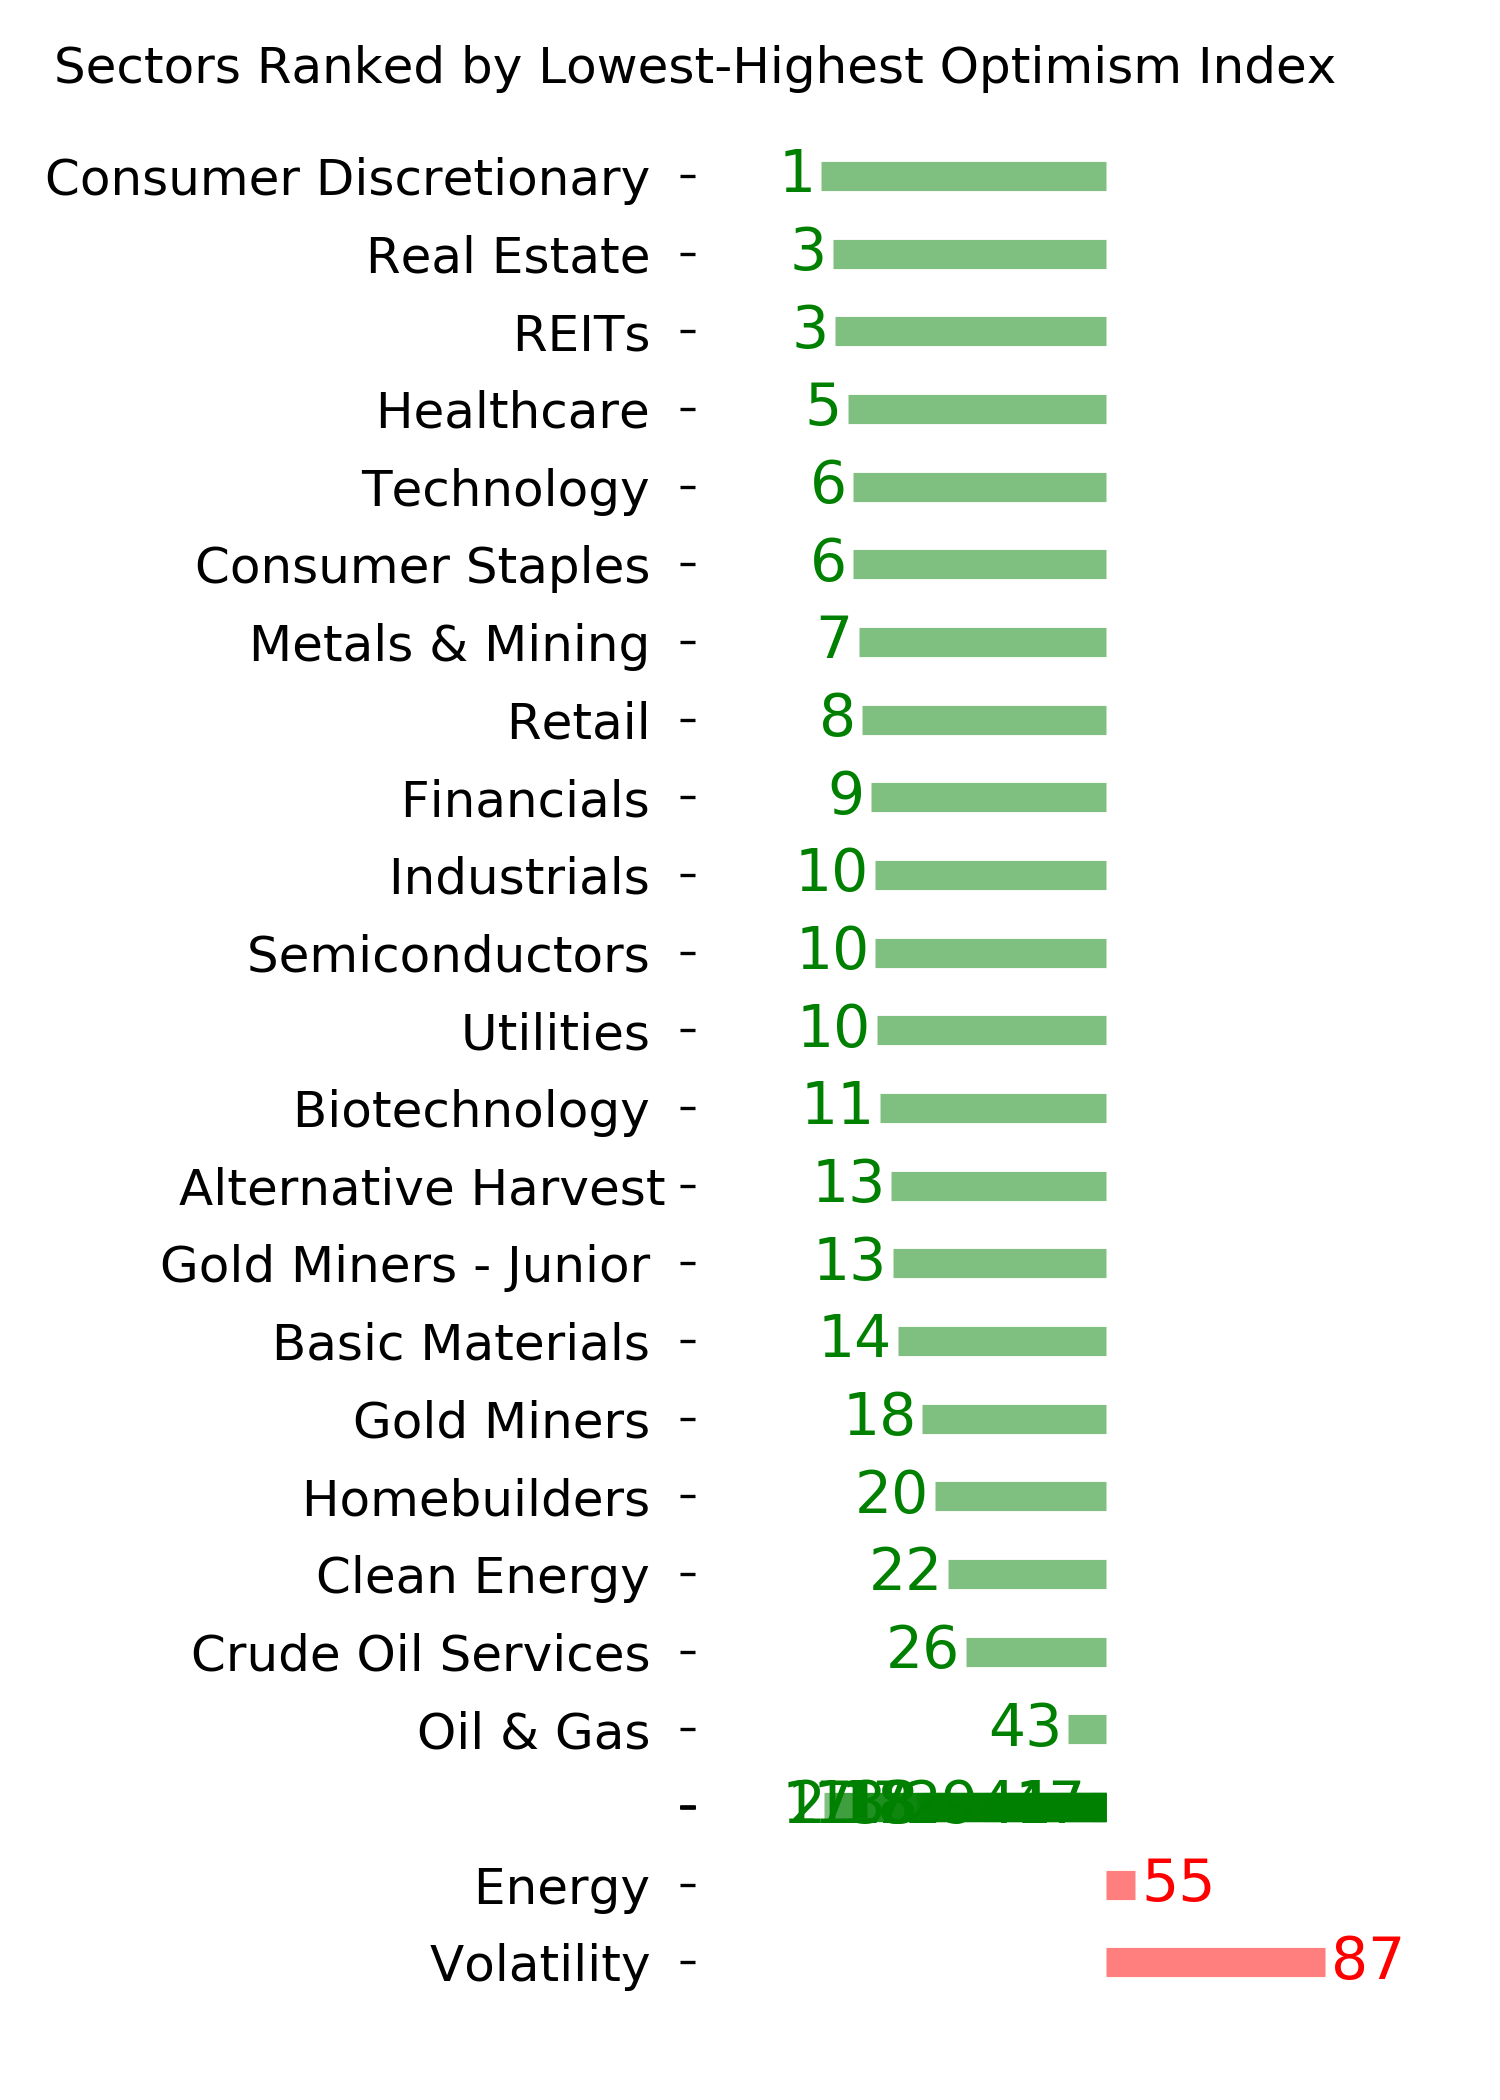
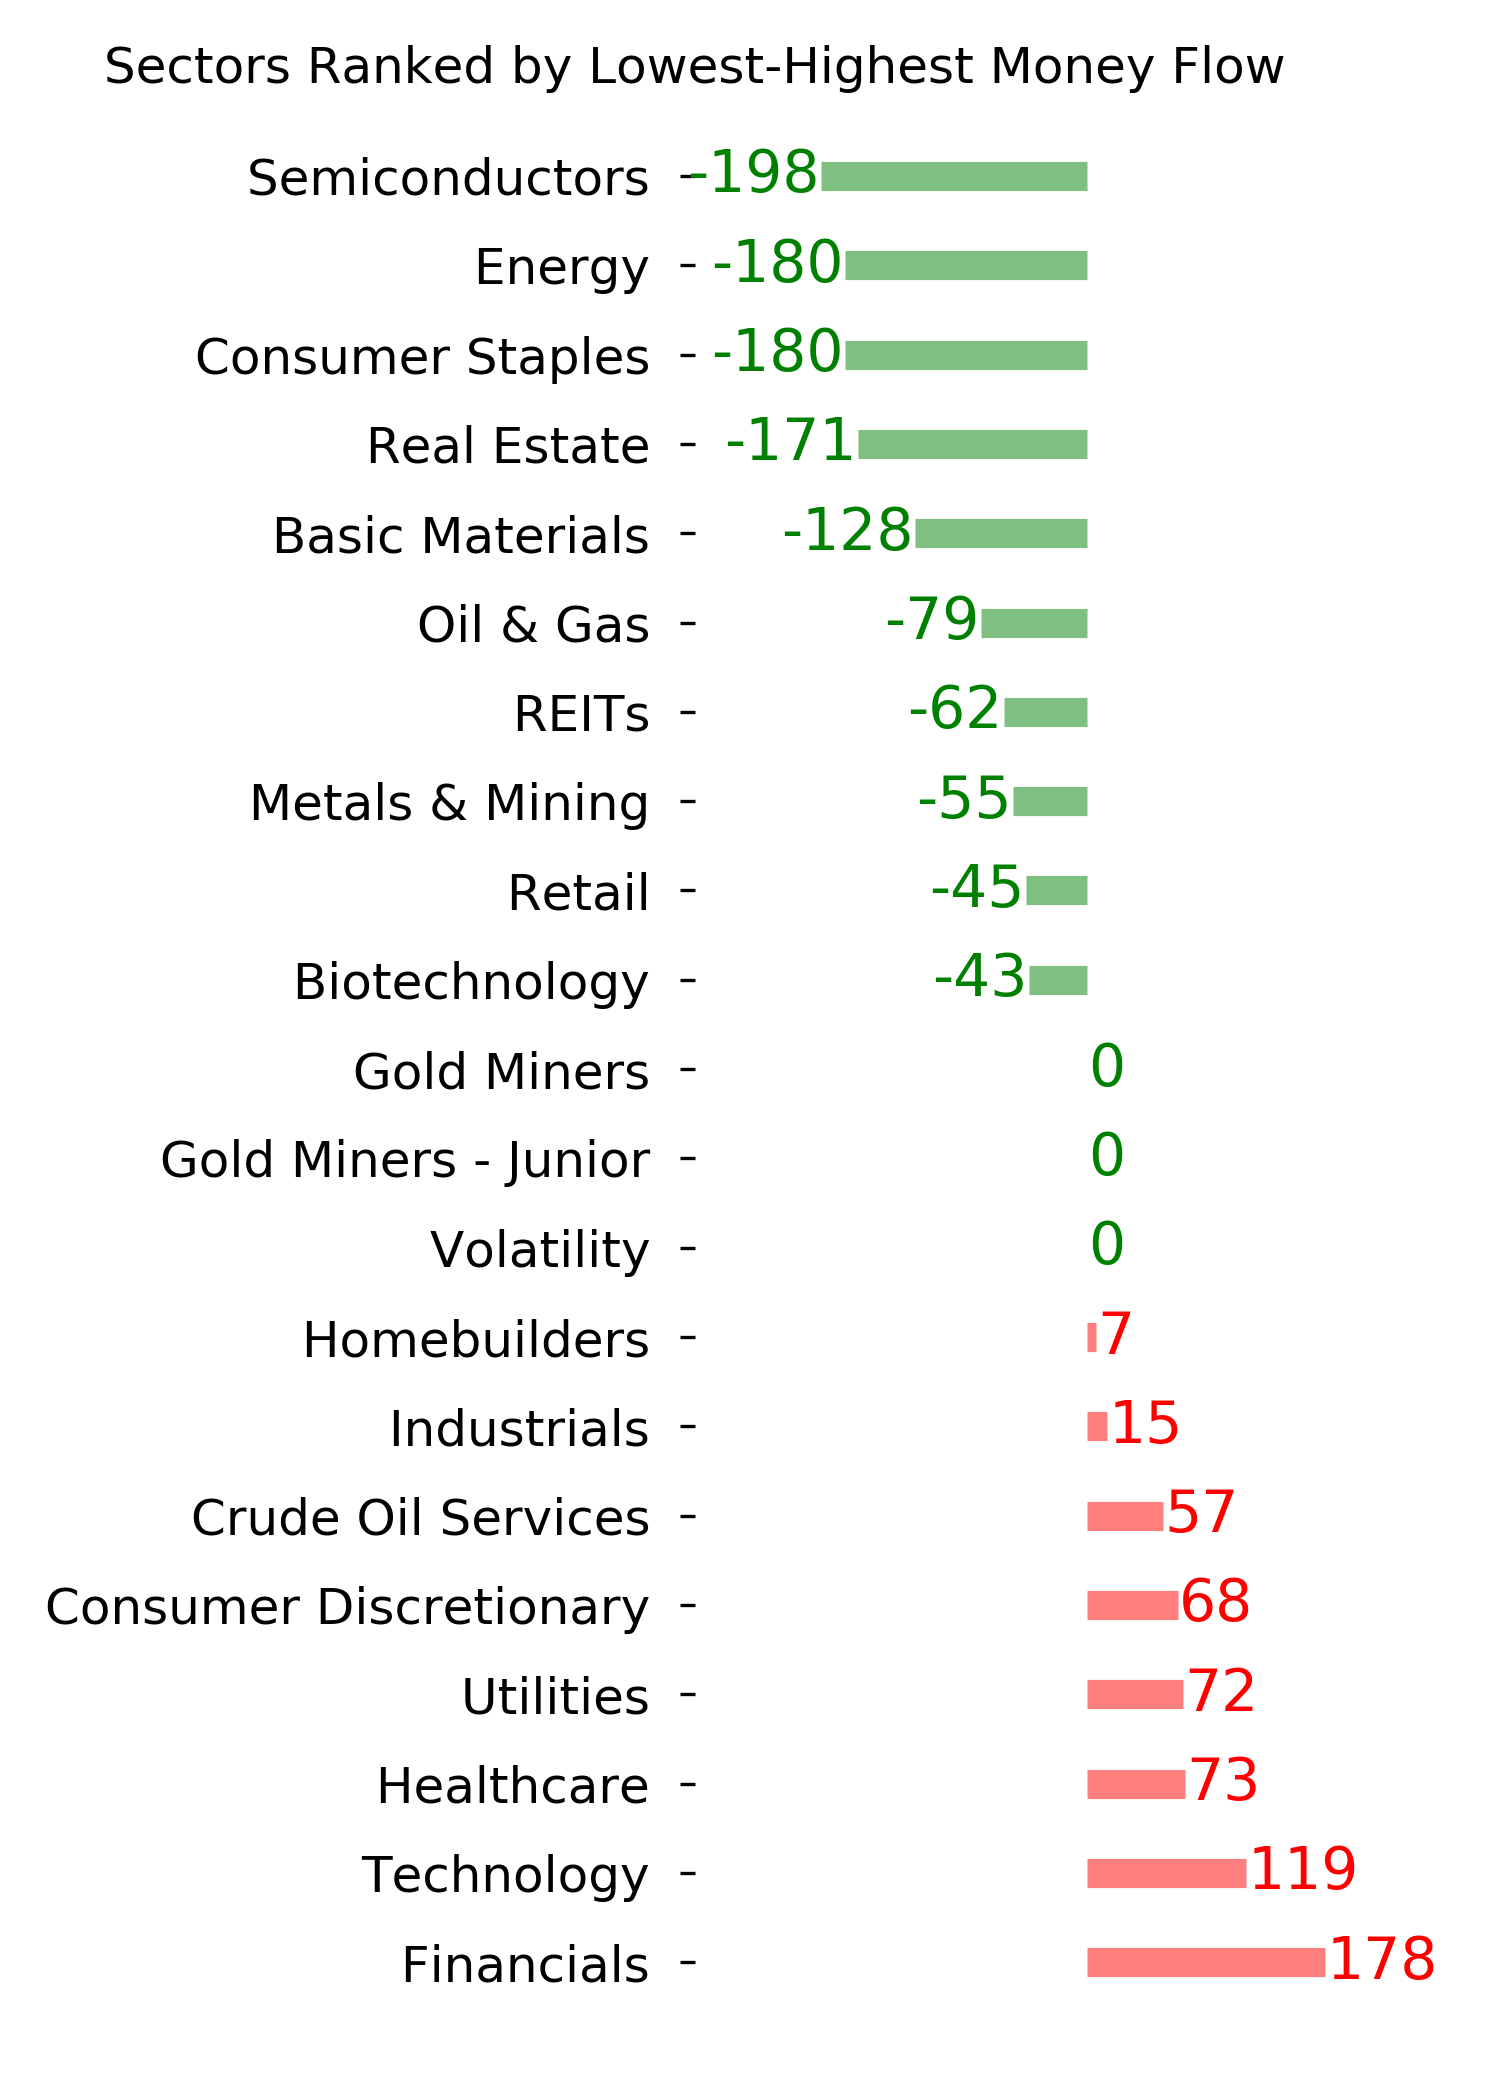
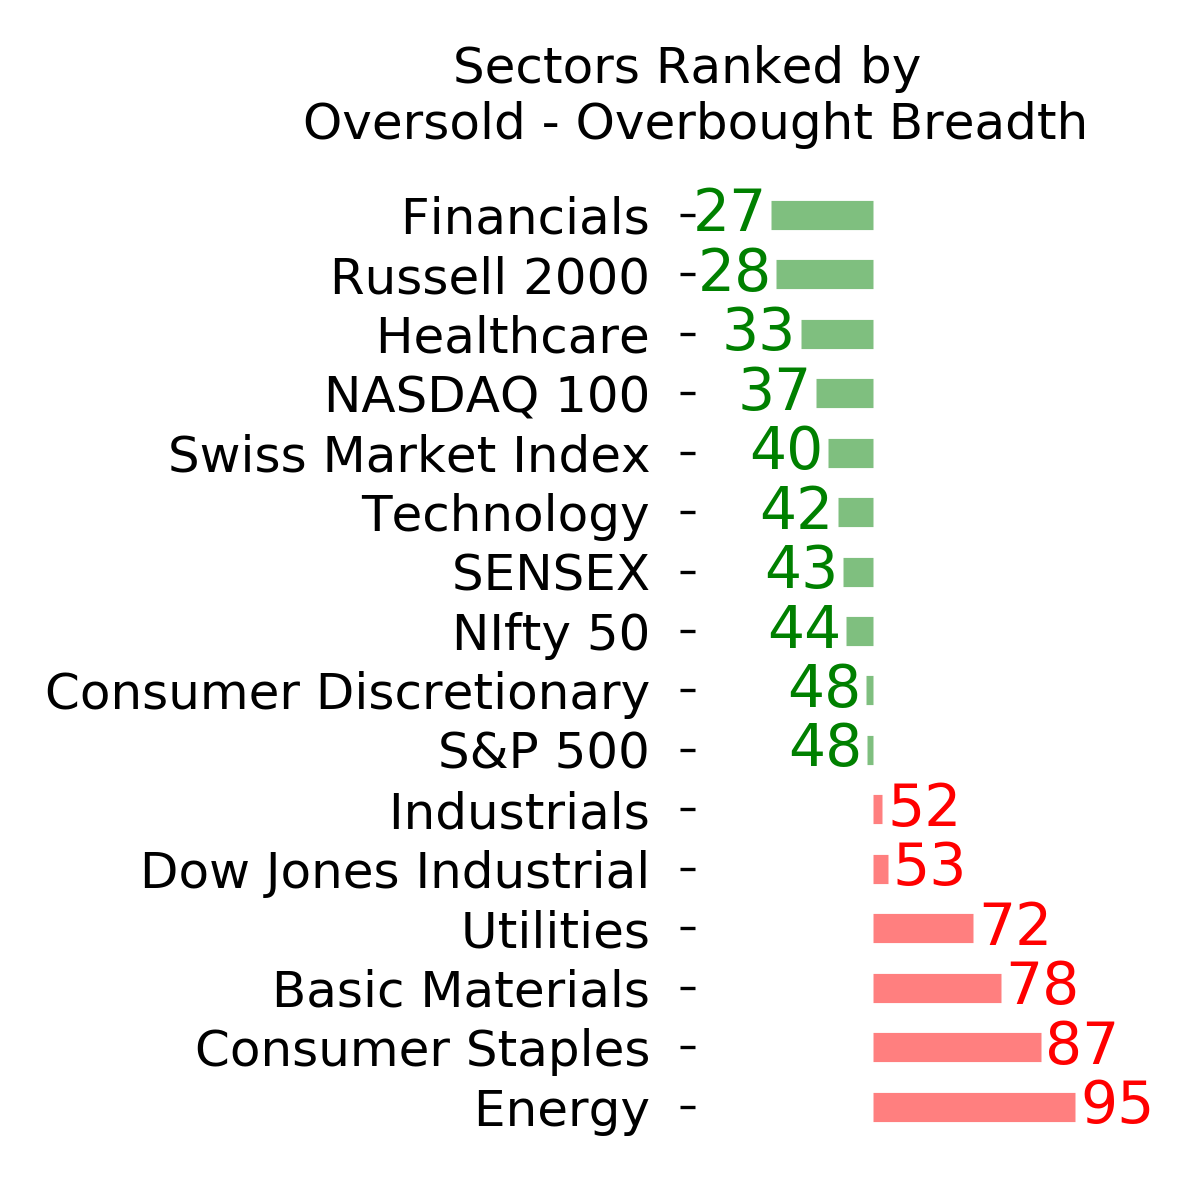
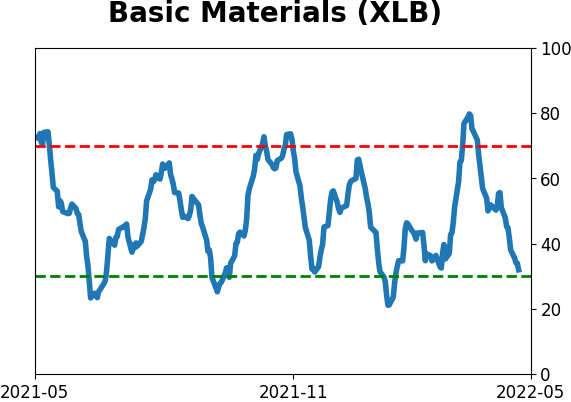
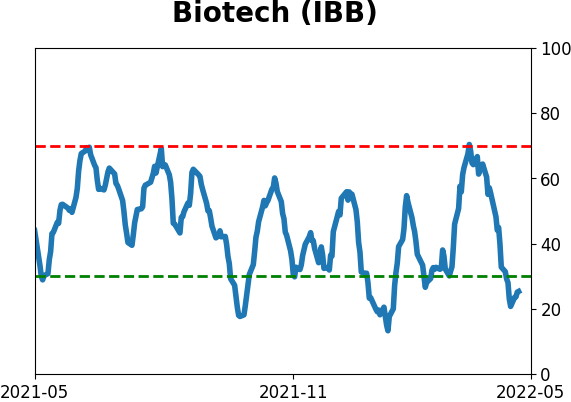
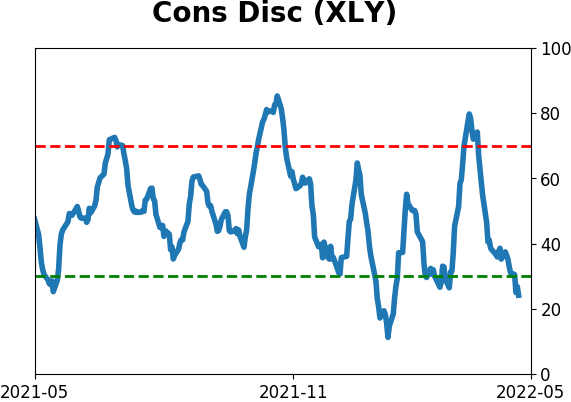
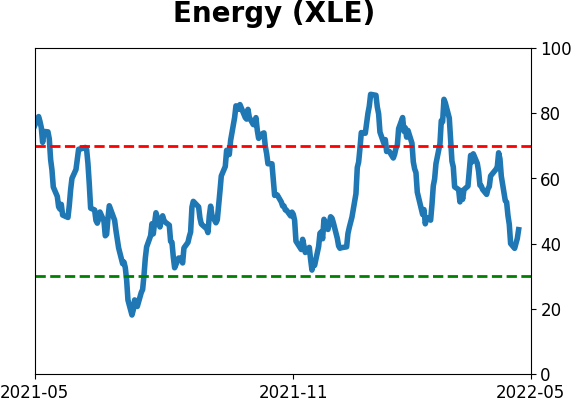
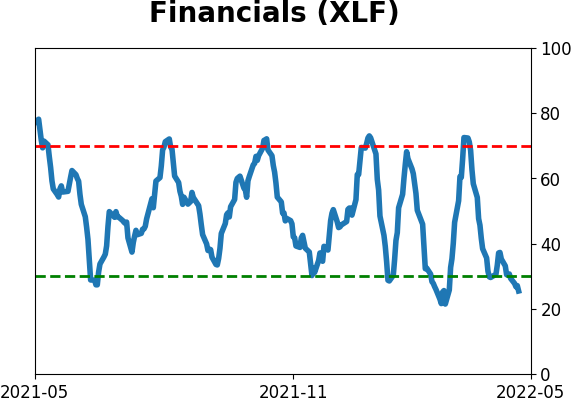
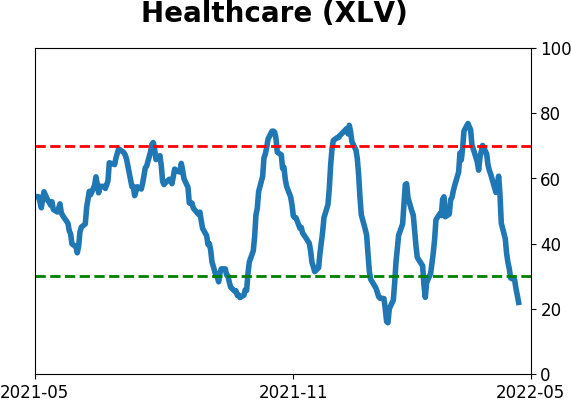
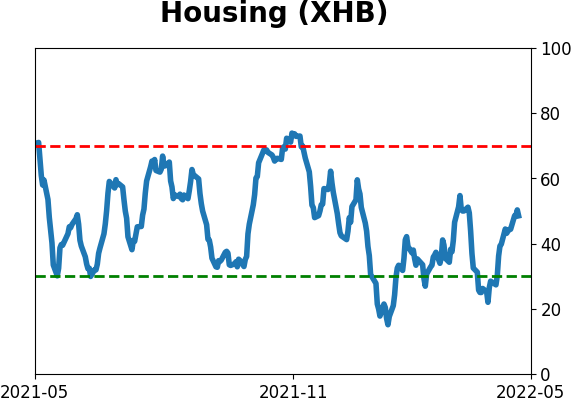
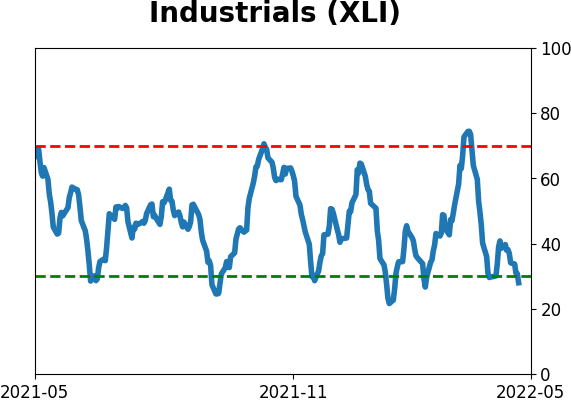
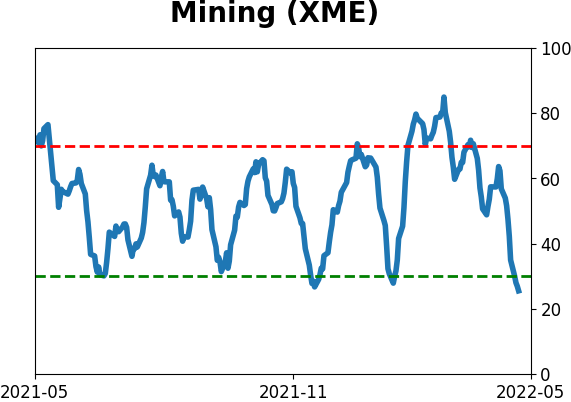
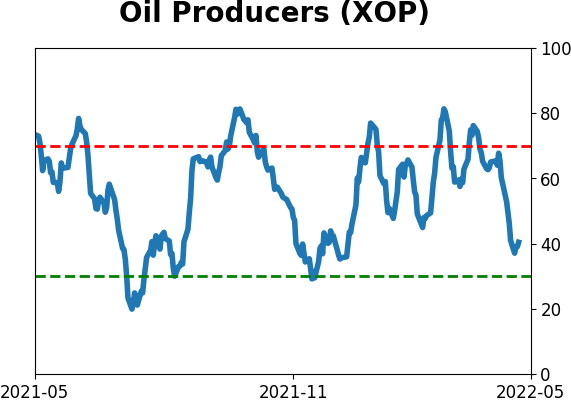
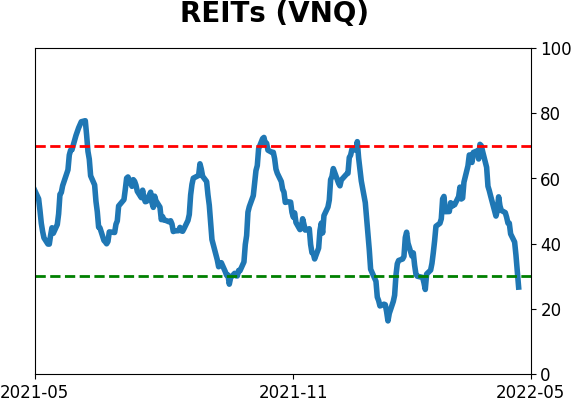
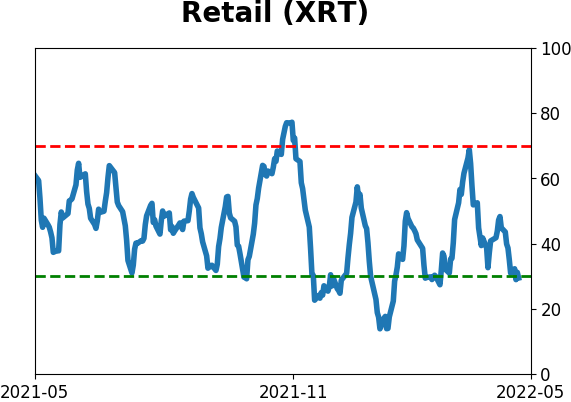
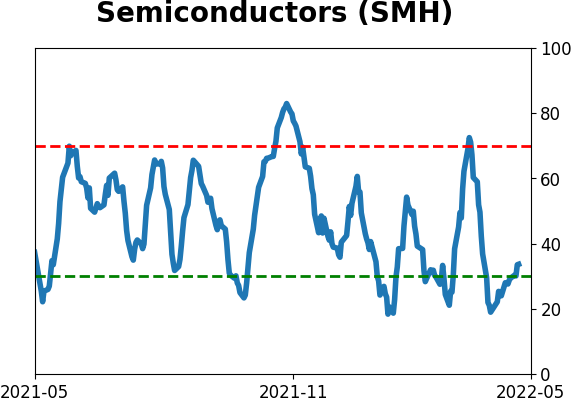
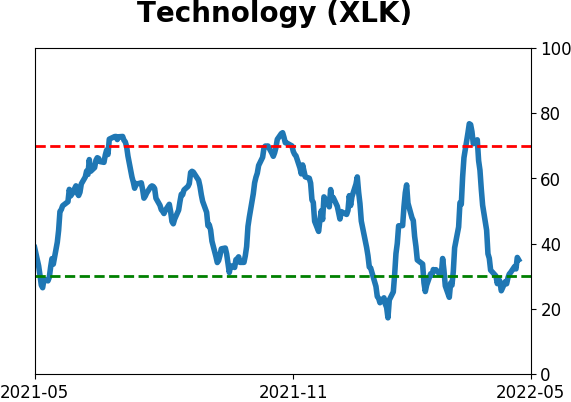
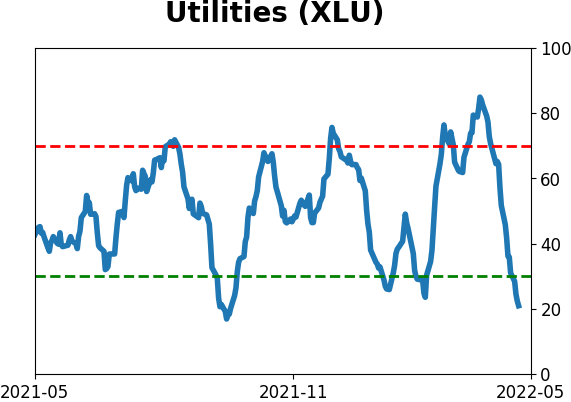
Sector ETF's - 10-Day Moving Average
|
|
|
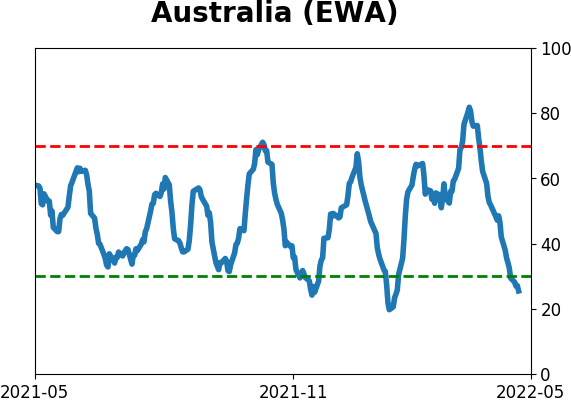
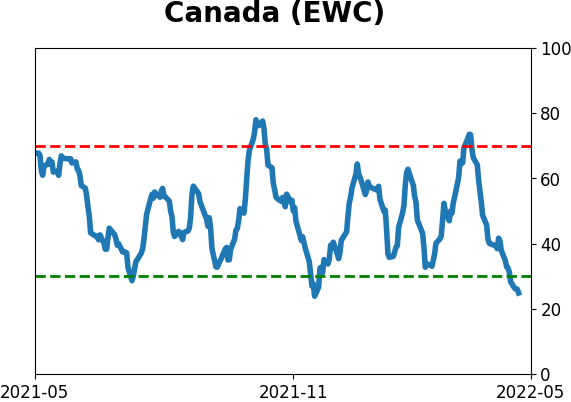
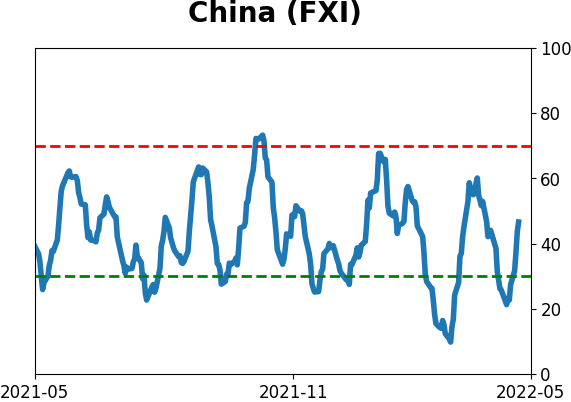
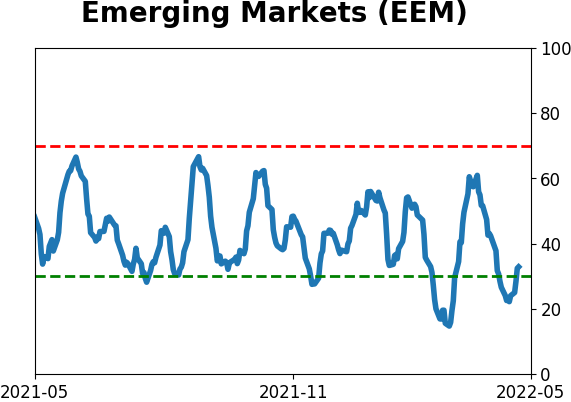
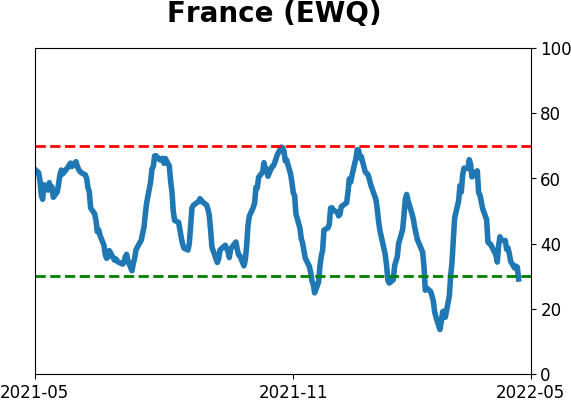
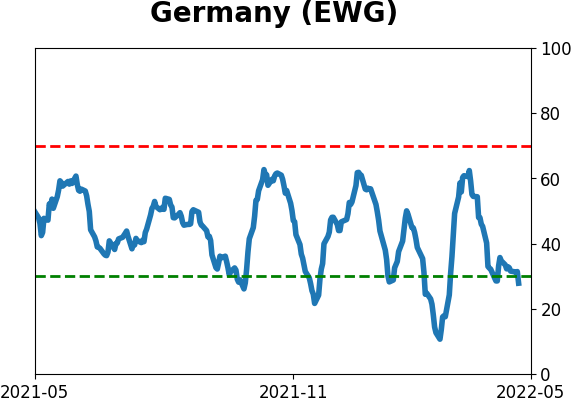
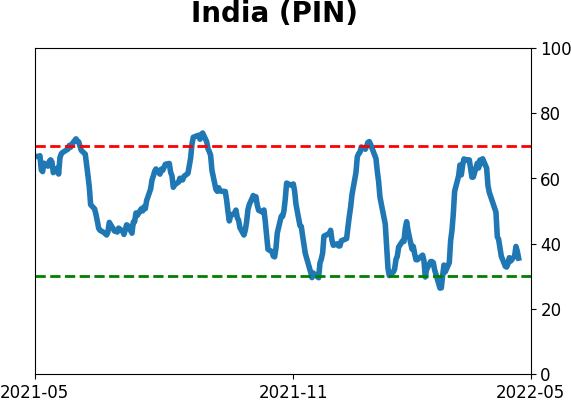
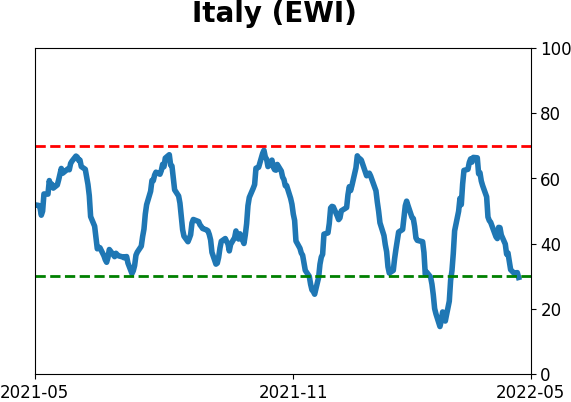
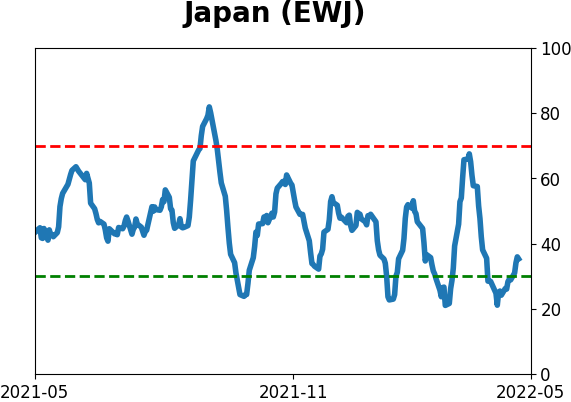
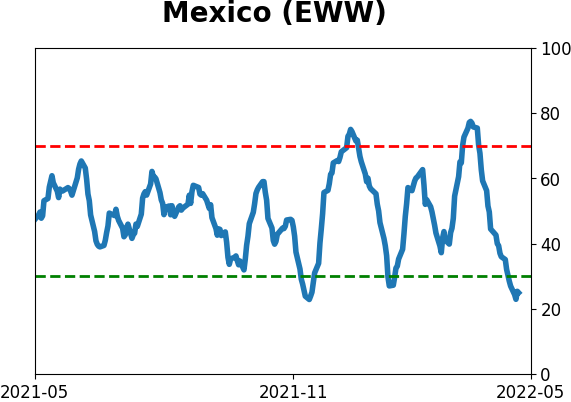
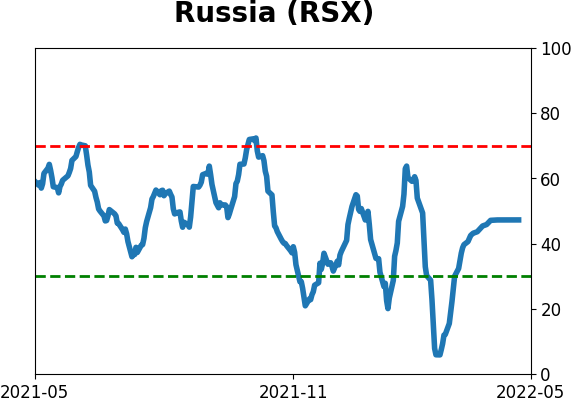
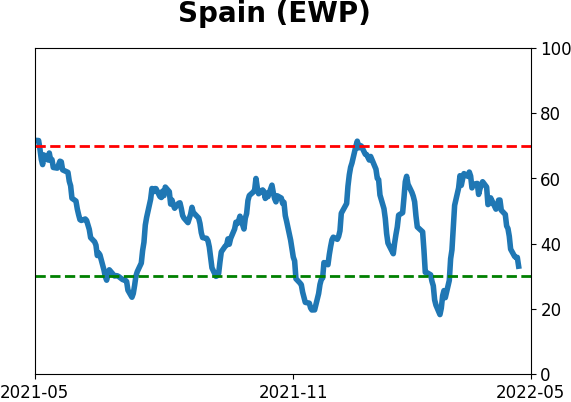
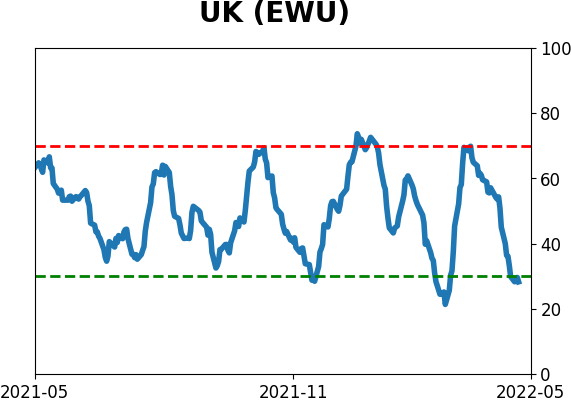
Country ETF's - 10-Day Moving Average
|
|
|
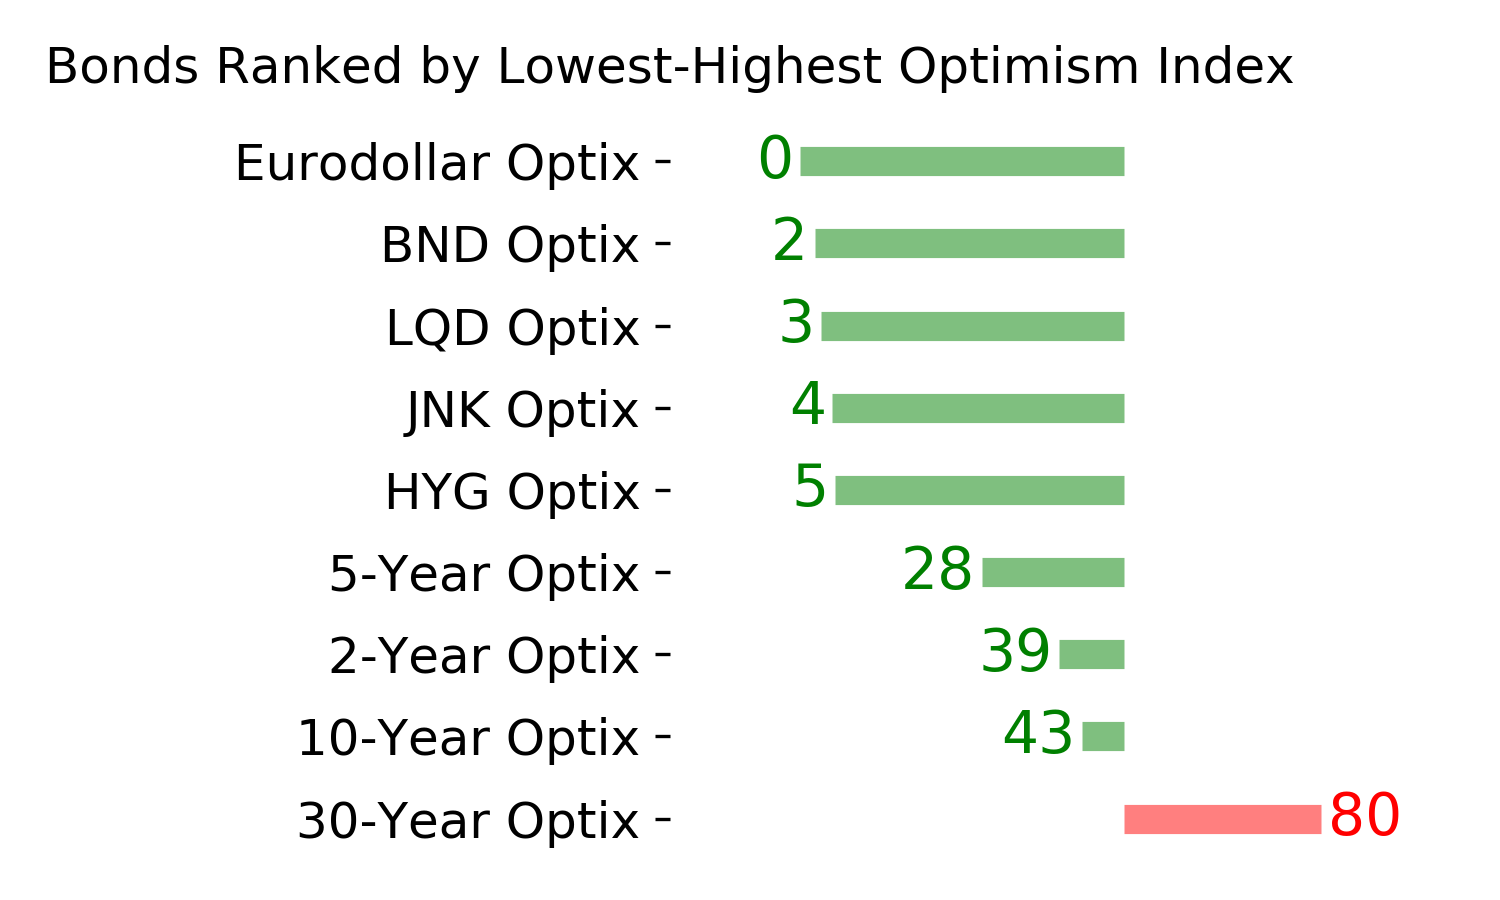
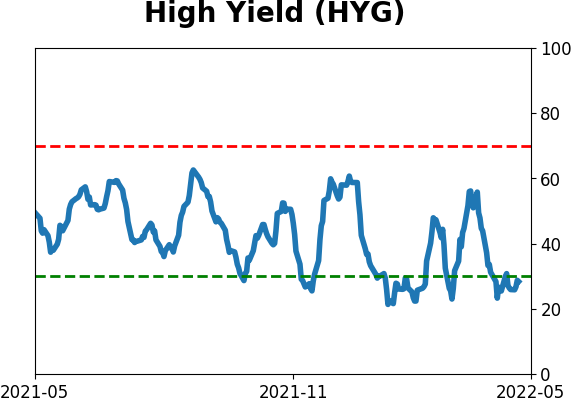
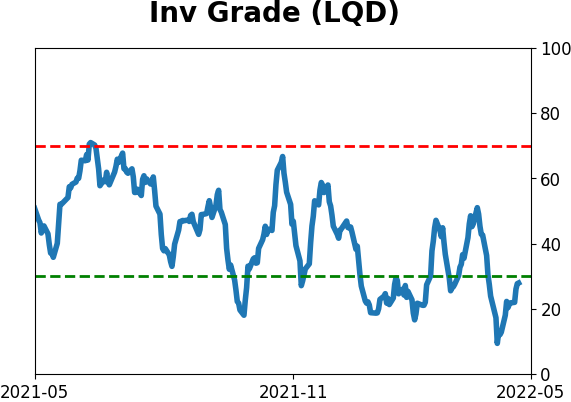
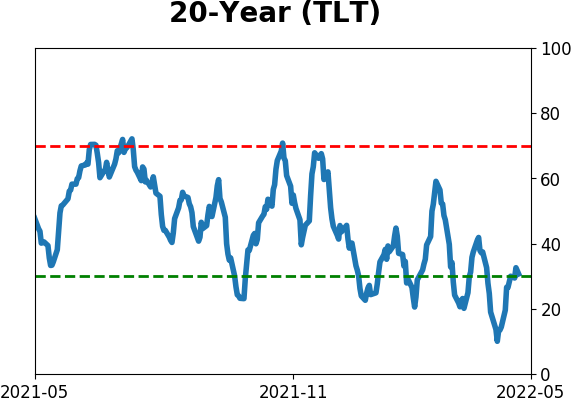
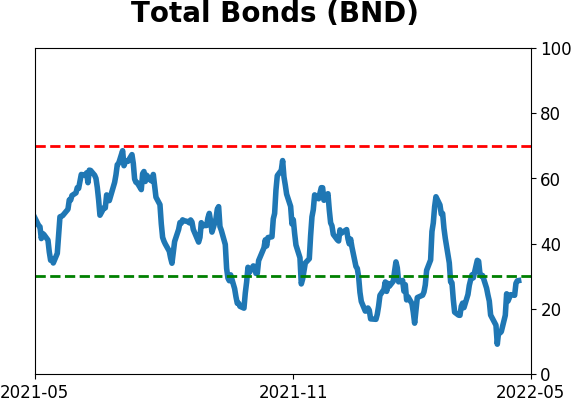
Bond ETF's - 10-Day Moving Average
|
|
|
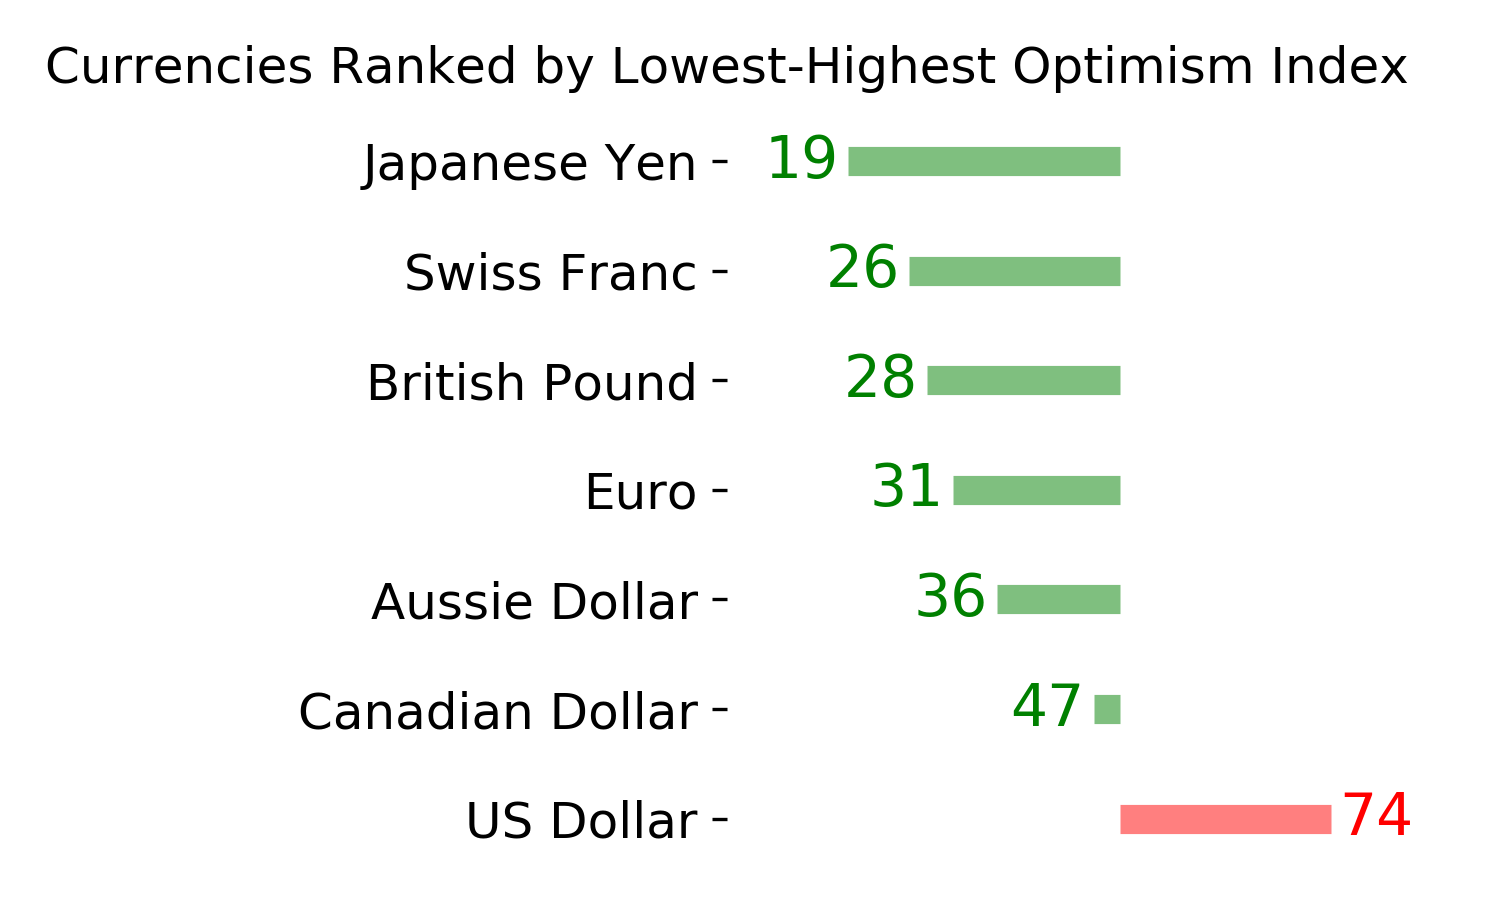
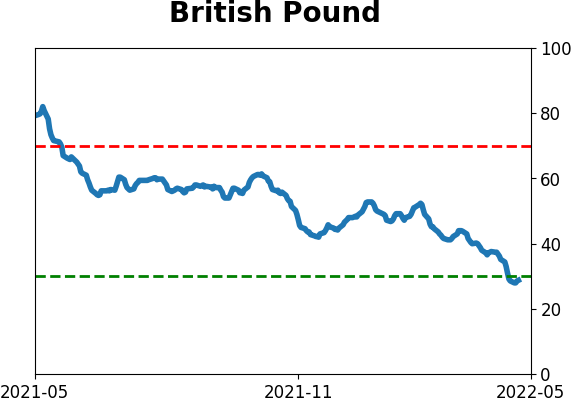
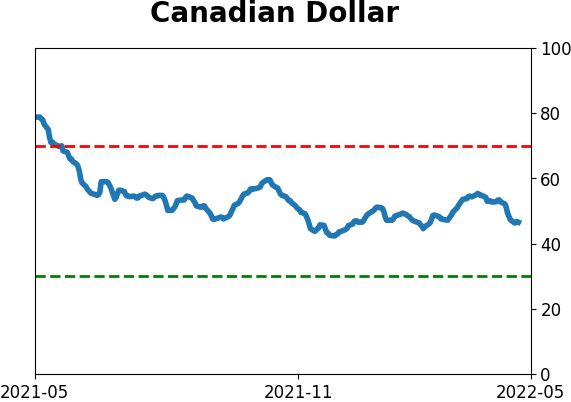
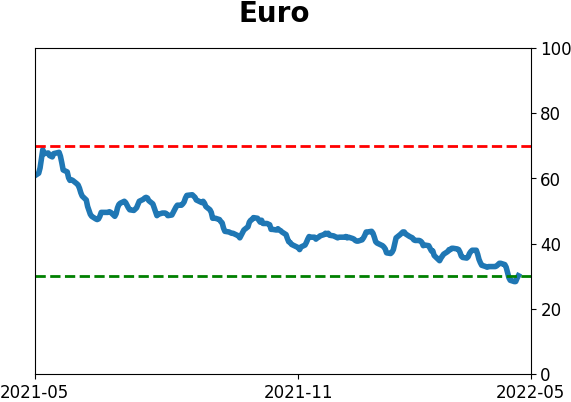
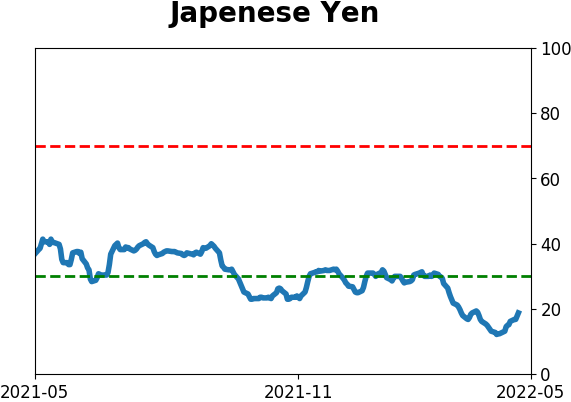
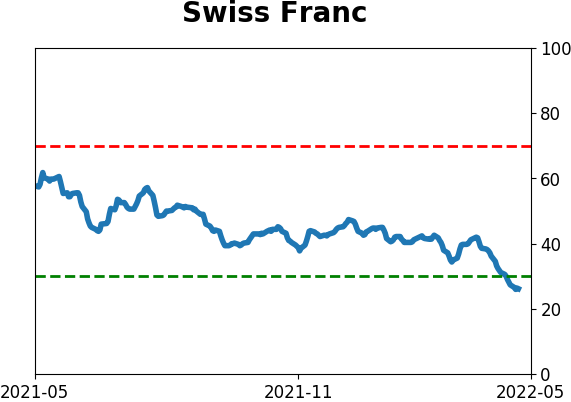
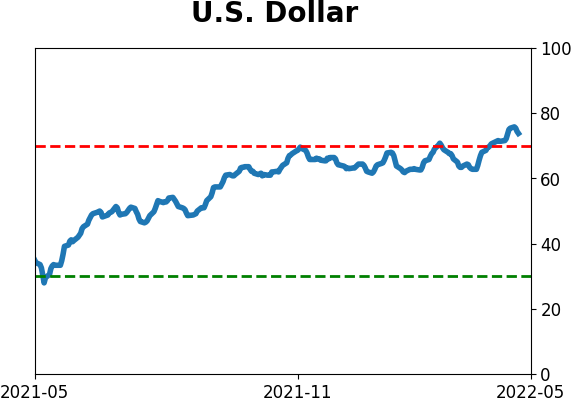
Currency ETF's - 5-Day Moving Average
|
|
|
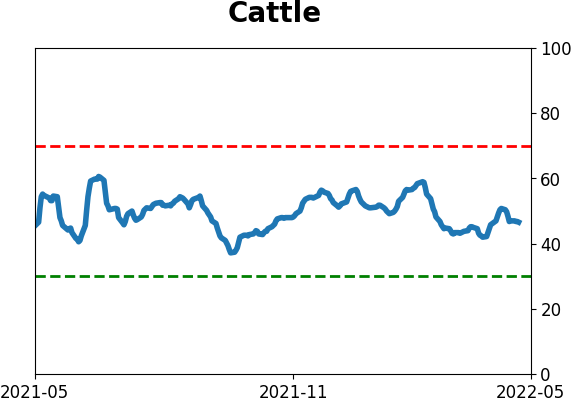
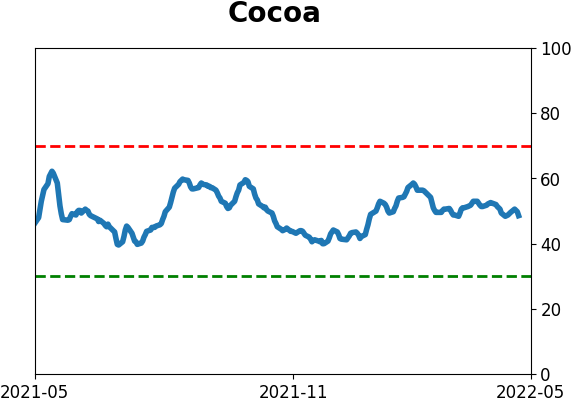
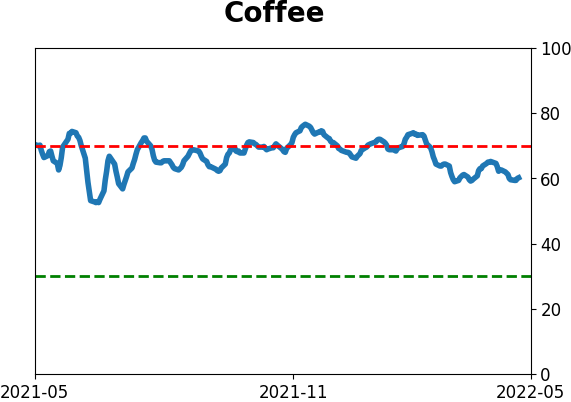
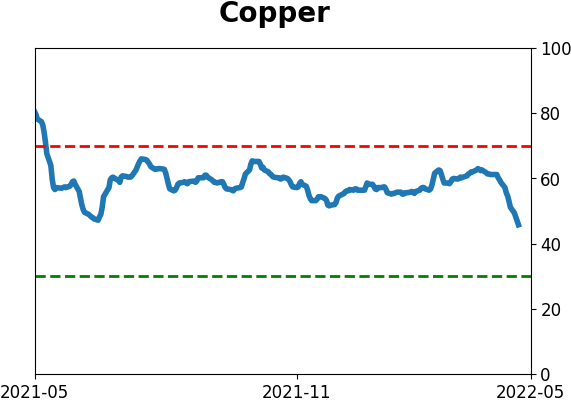
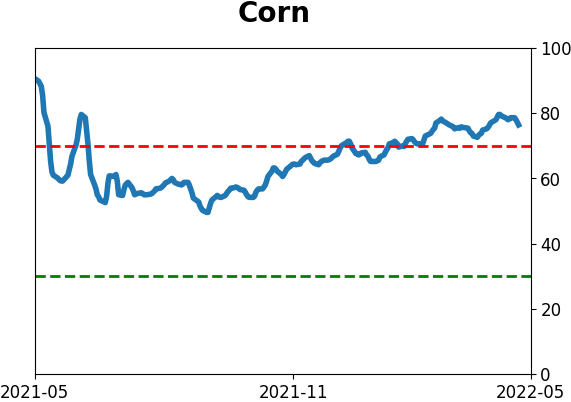
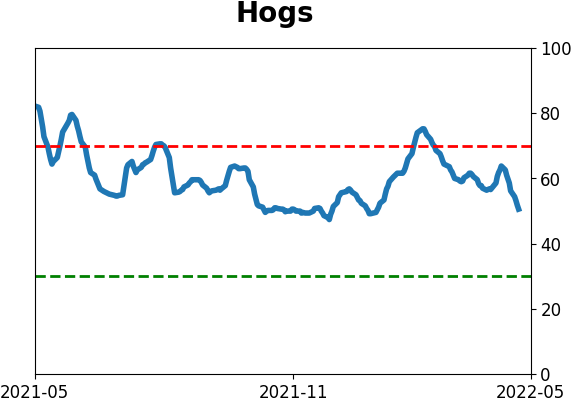
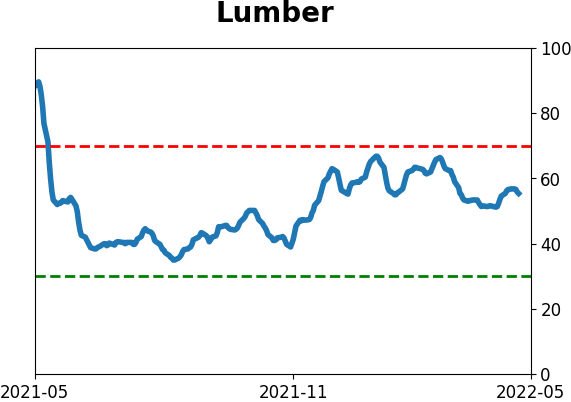
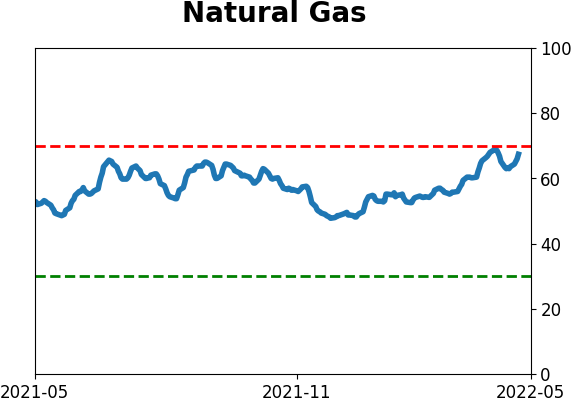
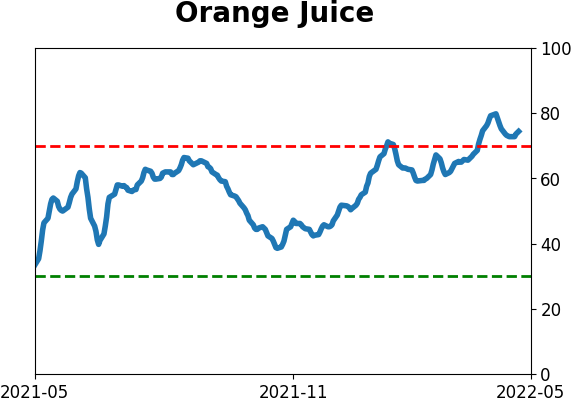
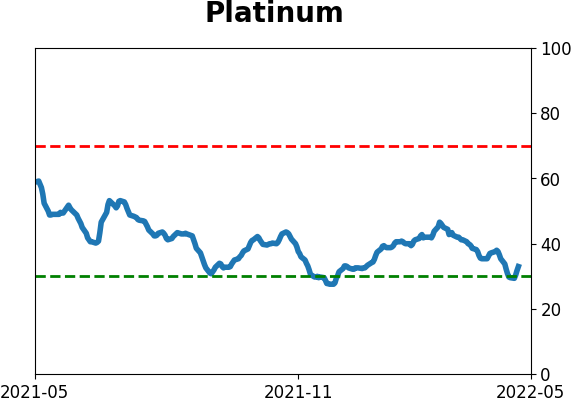
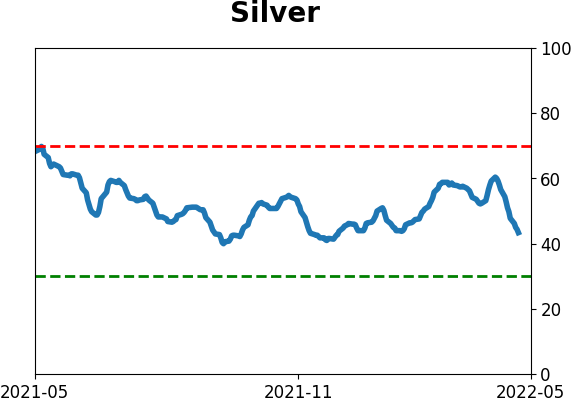
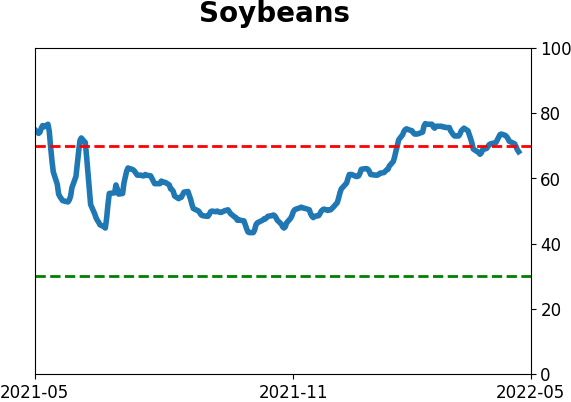
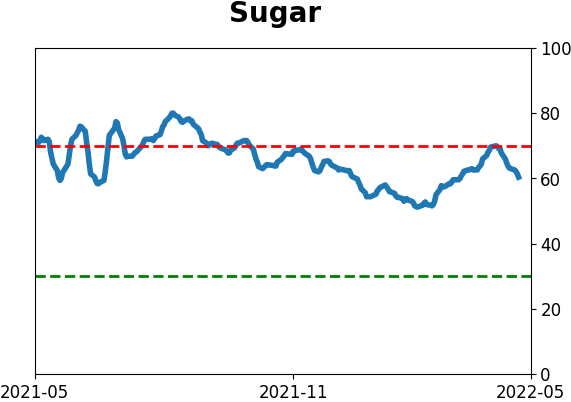
Commodity ETF's - 5-Day Moving Average
|
|