Headlines
|
|
The worrying trend in Financials:
After severe selling in recent weeks, fewer than 5% of Financials are holding above their 50-day averages and fewer than 40% above their 200-day averages. Similar deterioration in trends in this sector preceded poor returns for Financials and the broader stock market.
|
Smart / Dumb Money Confidence
|
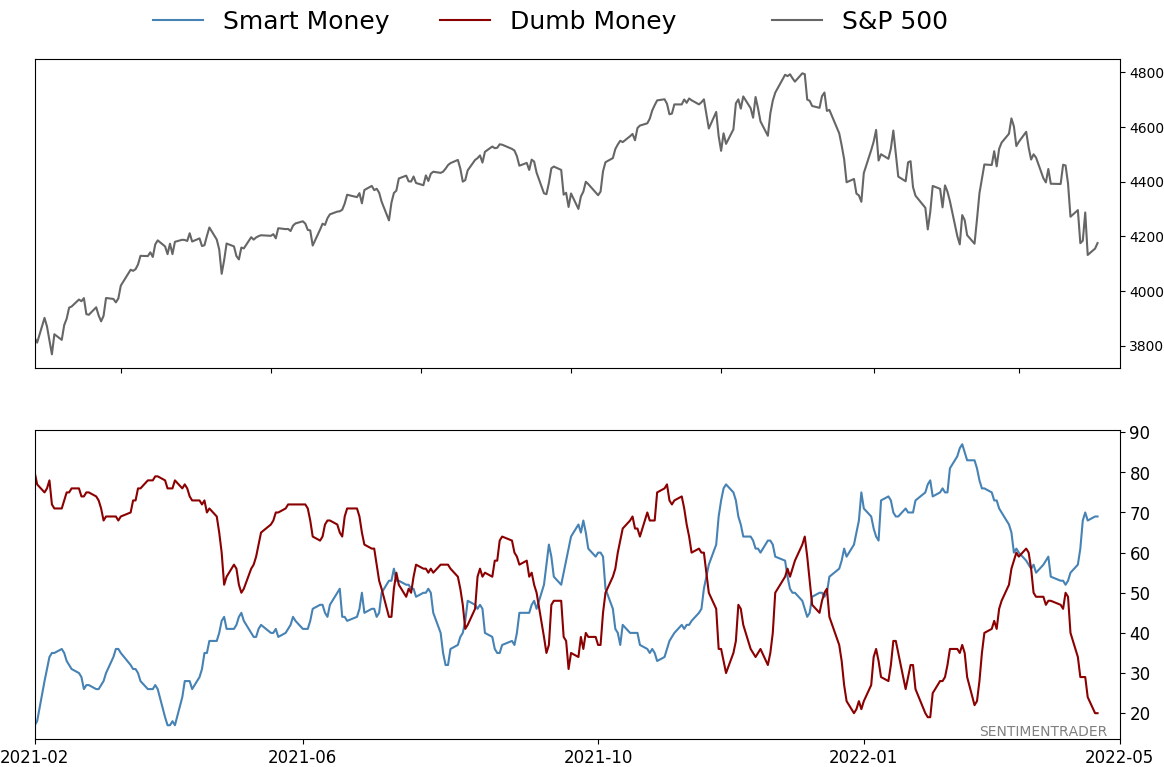
Smart Money Confidence: 69%
Dumb Money Confidence: 20%
|
|
Risk Levels
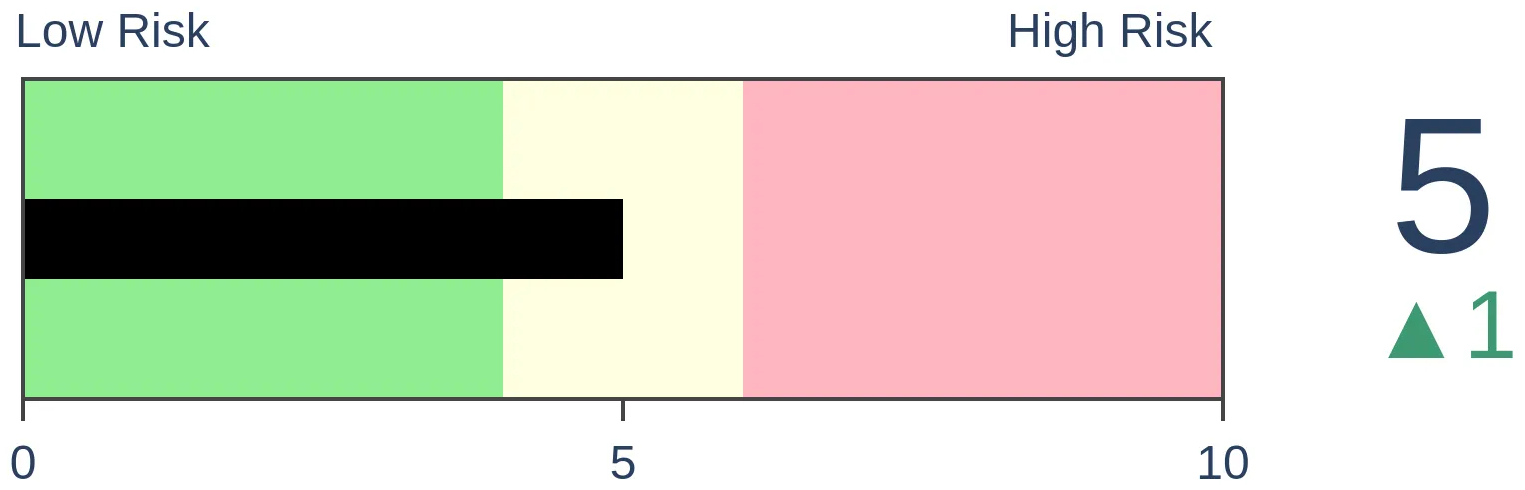
Stocks Short-Term
|
Stocks Medium-Term
|
|
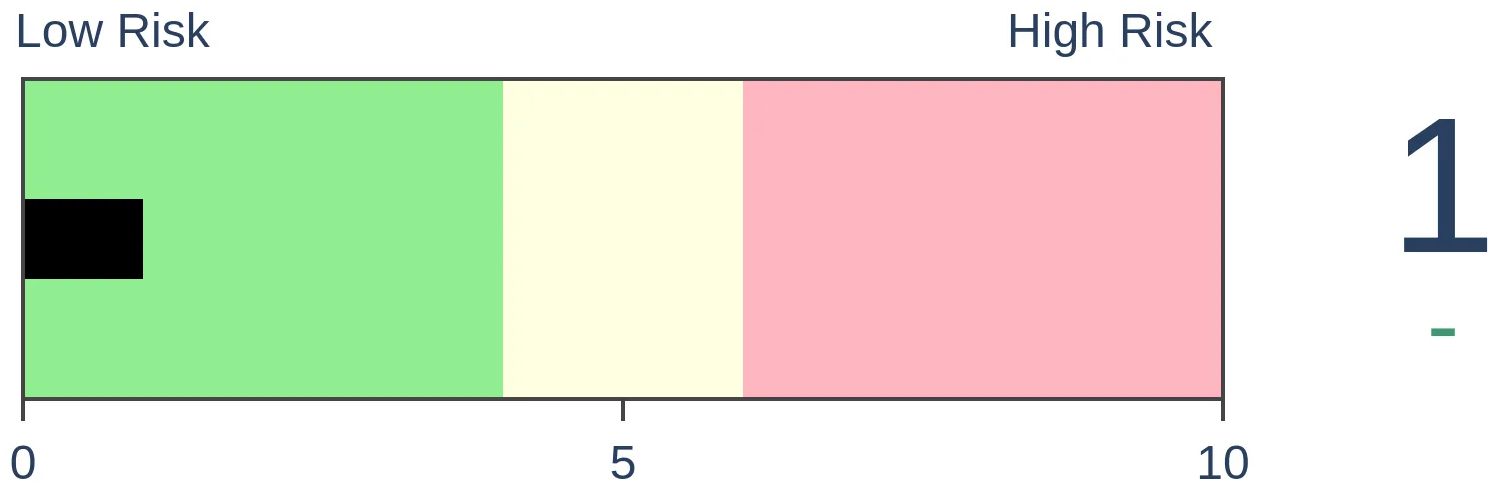
Bonds
|
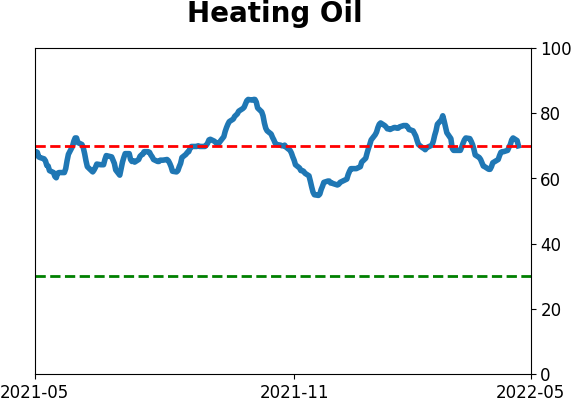
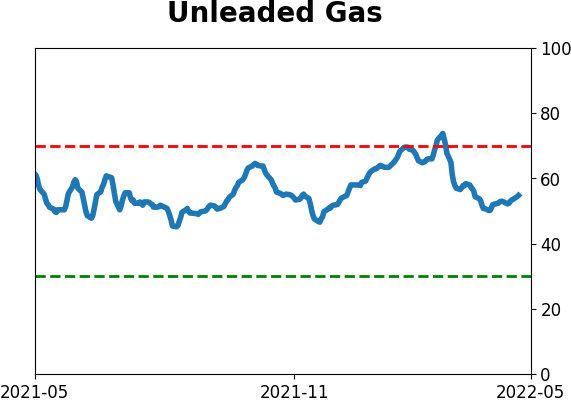
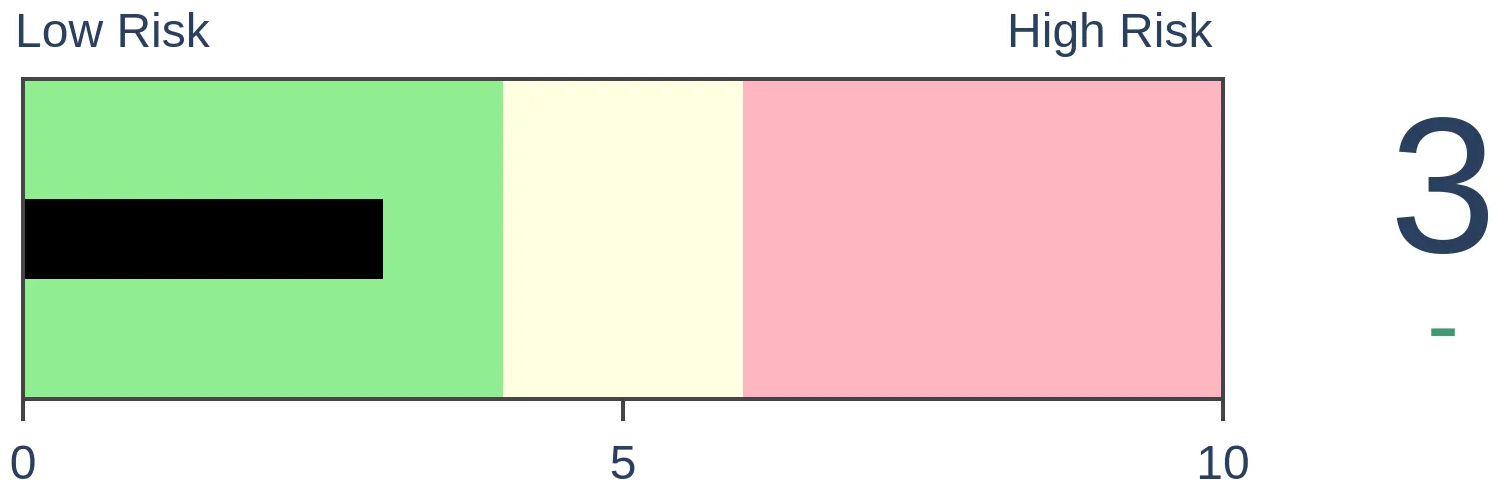
Crude Oil
|
|
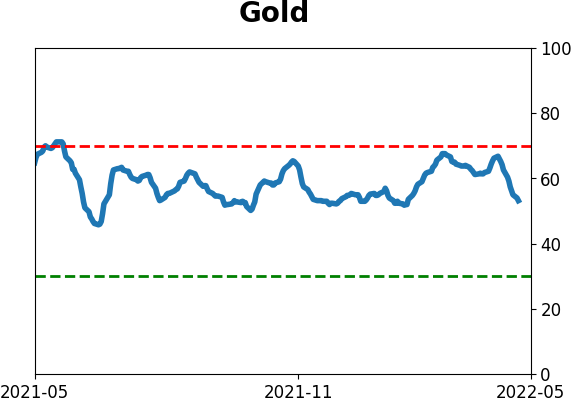
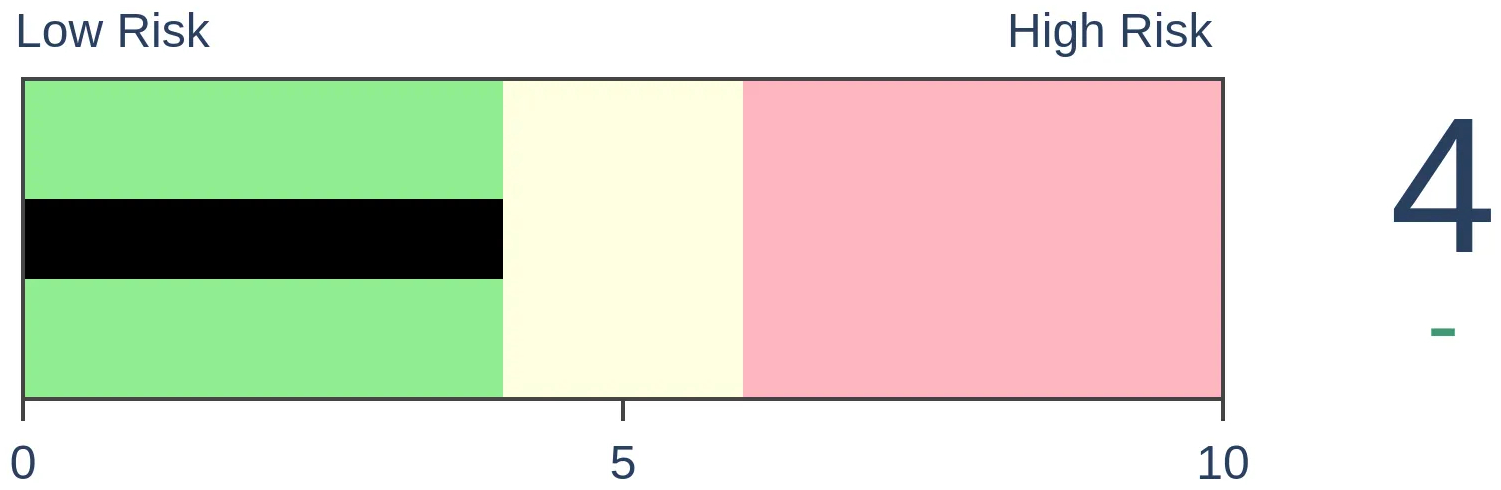
Gold

|
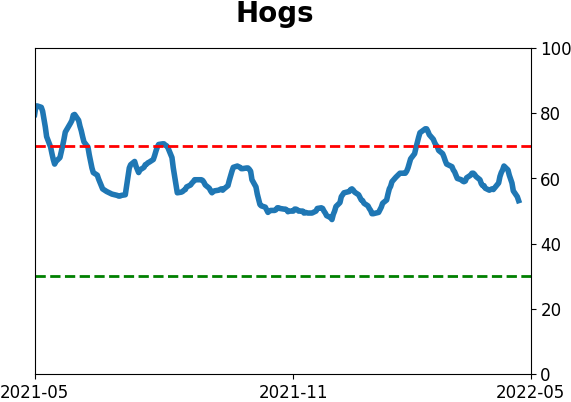
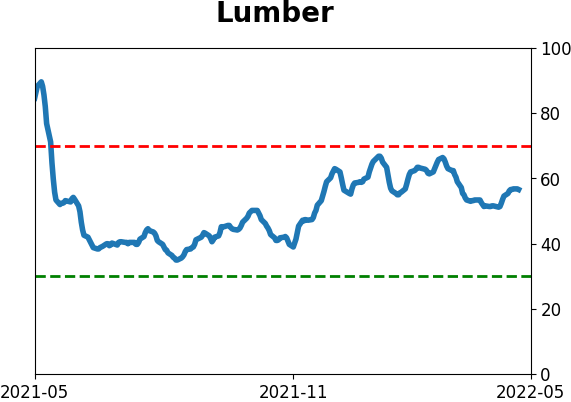
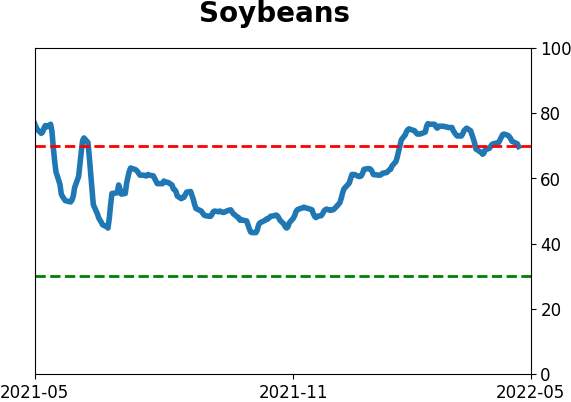
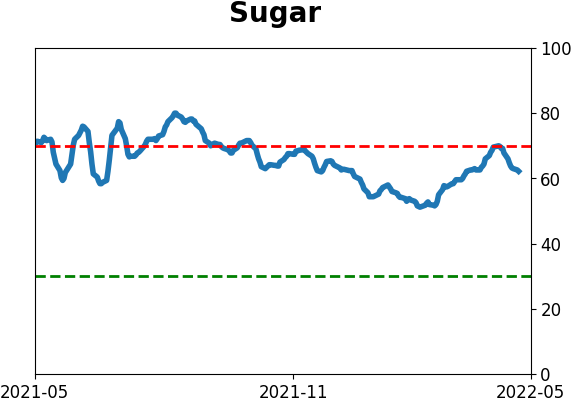
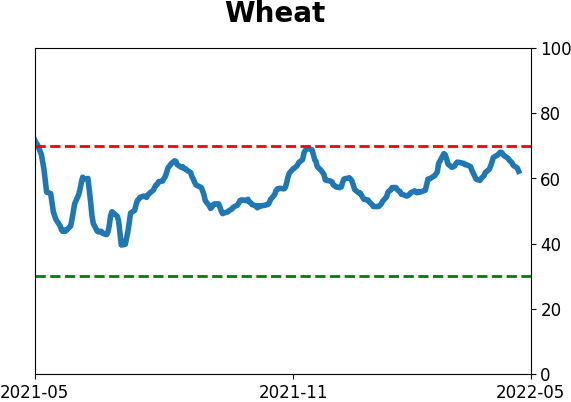
Agriculture

|
|
Research
By Jason Goepfert
BOTTOM LINE
After severe selling in recent weeks, fewer than 5% of Financials are holding above their 50-day averages and fewer than 40% above their 200-day averages. Similar deterioration in trends in this sector preceded poor returns for Financials and the broader stock market.
FORECAST / TIMEFRAME
None
|
Key points:
- Fewer than 5% of Financials are trading above their 50-day averages
- Fewer than 40% are holding above their 200-day averages, a worrying decline in long-term trends
- Similar combinations have preceded poor returns in the sector and the broader market
A vital sector is seeing souring trends
For anyone other than the most current generation of investors, trouble in Financial sector stocks sends a shiver down the spine. The meltdown in 2008 leaves the kind of scar that never fully heals. It seems hard for U.S. citizens to imagine now, but there was a daily worry about whether we would even be able to withdraw our own funds from banks the next day.
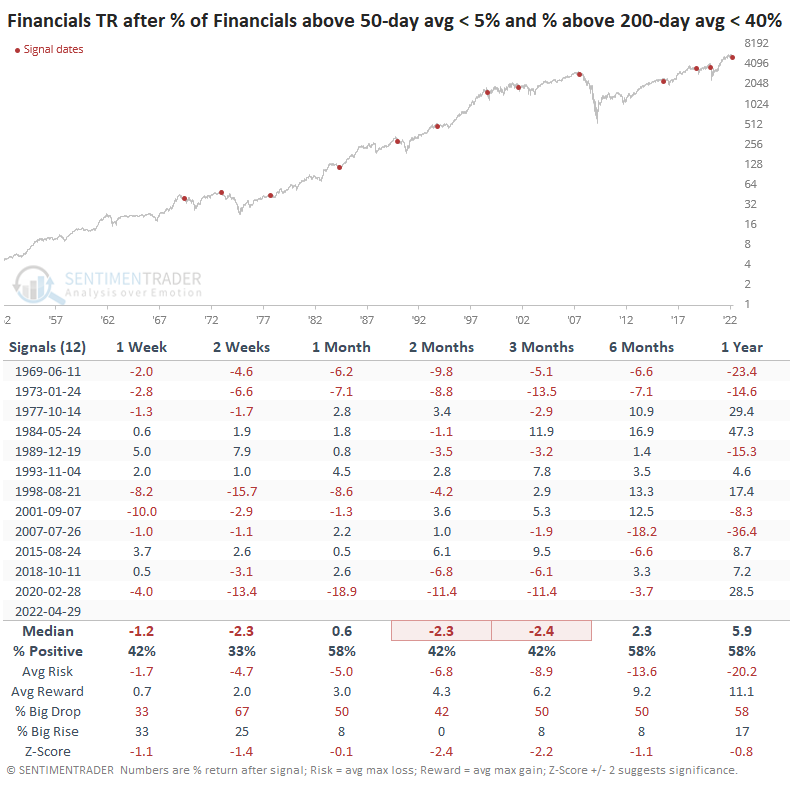
For investors in these stocks, the past few weeks have not been fun. It's hard to find a Financial that's even trading above its 50-day average. The percentage of stocks in the sector trading above their 50-day moving average just fell below 5% after diverging from index prices for much of the past year.
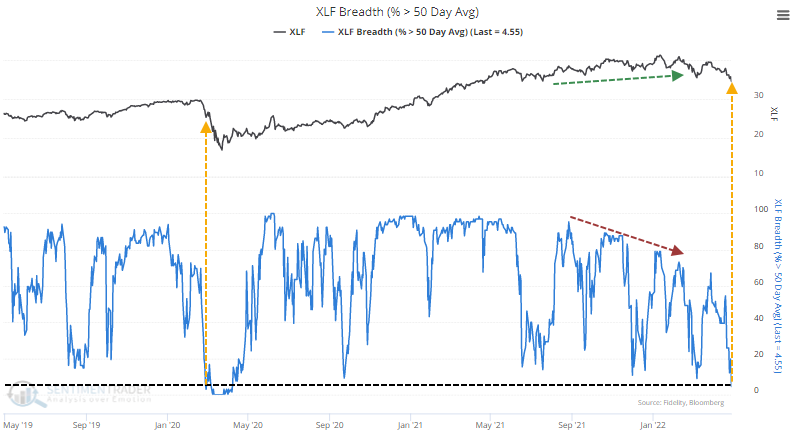
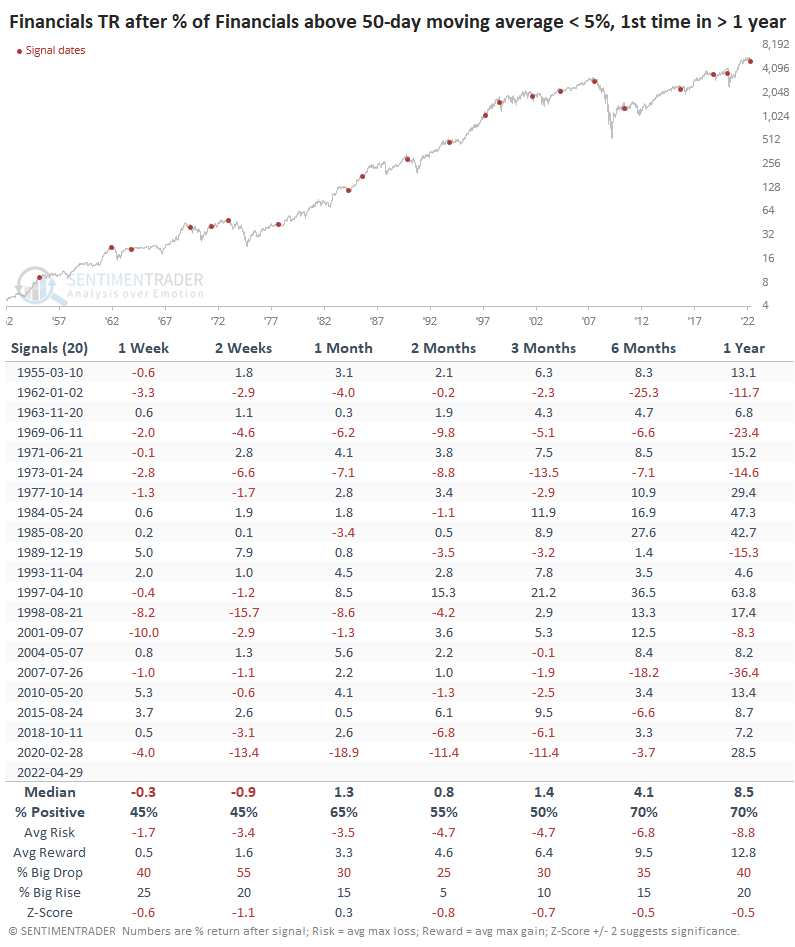
The total return in these stocks after fewer than 5% of them were trading above their 50-day average was not great. Across almost all time frames, returns were below random. Even including dividends, returns were about flat up to two months later, risk was about equal to reward, and there was a larger probability of a big drop than a big rise. This is unusual to see for a total return index over such a long time frame.
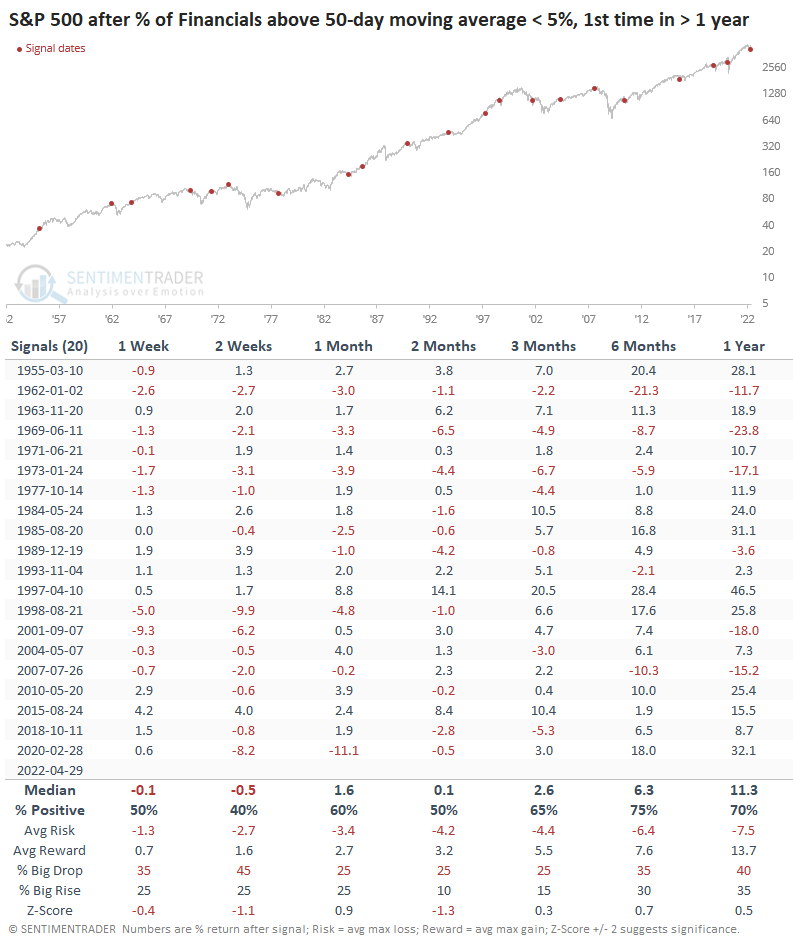
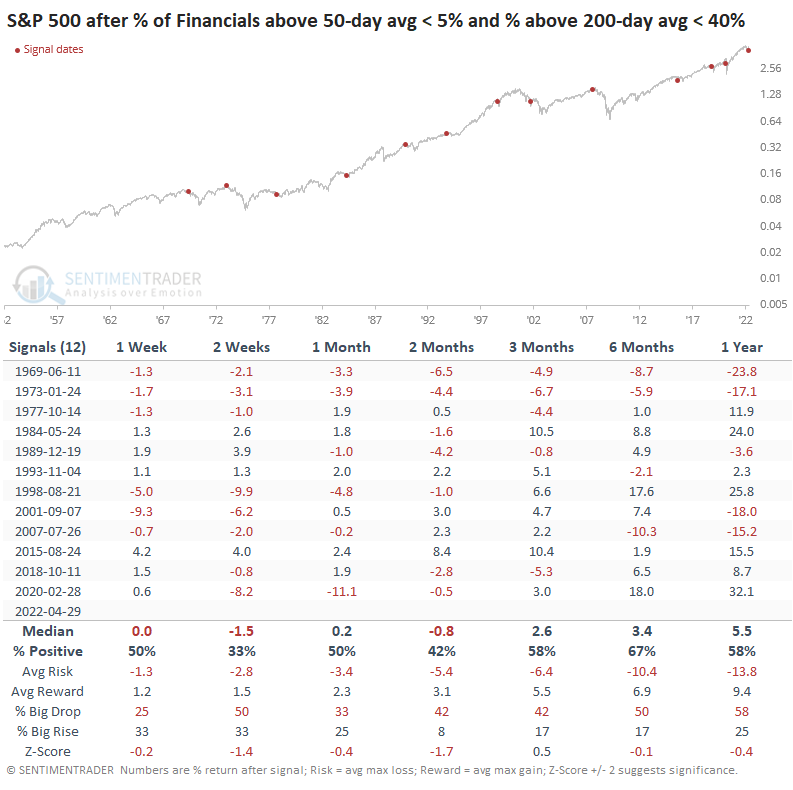
For the S&P 500 (price only, not total return), it was mostly a drag over the shorter-term, and didn't have much of an impact past two months.
Long-term trends are poor
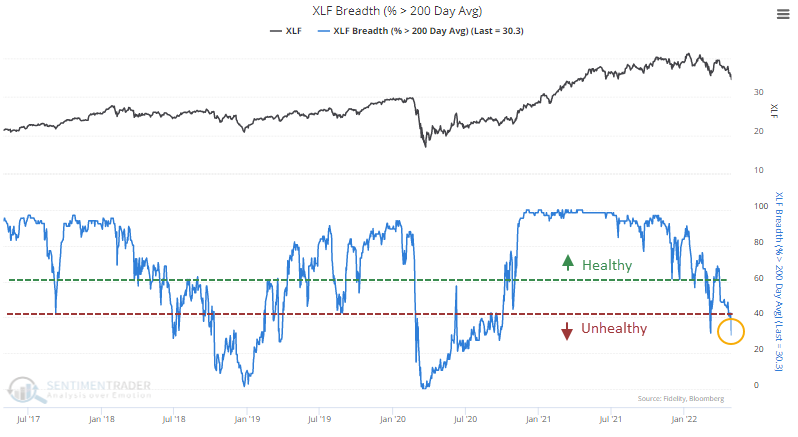
During healthy markets, the percentage of stocks in an index or sector that are trading above their long-term 200-day moving averages tends to stay above 60%. Dips below 40% tend to bring in buyers almost immediately.
During unhealthy markets, we usually see the opposite - fewer than 40% of stocks tend to hover above their averages, and rallies above 60% tend to bring in sellers. For Financials, that's what we've been seeing, with the percentage of members above their 200-day average falling below 40%. The recent spike above 60% was sold immediately.
When we look at the signals above but filter it to include only those dates when fewer than 40% of Financials were holding above their 200-day average at the time, returns deteriorated further. It gets more difficult to rely on the precedents as the sample size gets smaller, but over the next two to three months, most of the returns were negative. The sector avoided a negative return over that time frame only three times.
Again, this behavior tended to drag on the broader market, and returns in the S&P were mostly below random.
What the research tells us...
Equity investors do not want to see trouble in Financials. Traders tend to sell these stocks and ask questions later because a single over-leveraged client can bring down an entire institution. With coincident and severe declines among a broad array of stocks and bonds, there is almost assuredly a large client somewhere that has blown up or is about to. With investors avoiding stocks in this sector to the degree that they are now, it's a worrying sign for all of us.
Indicators at Extremes
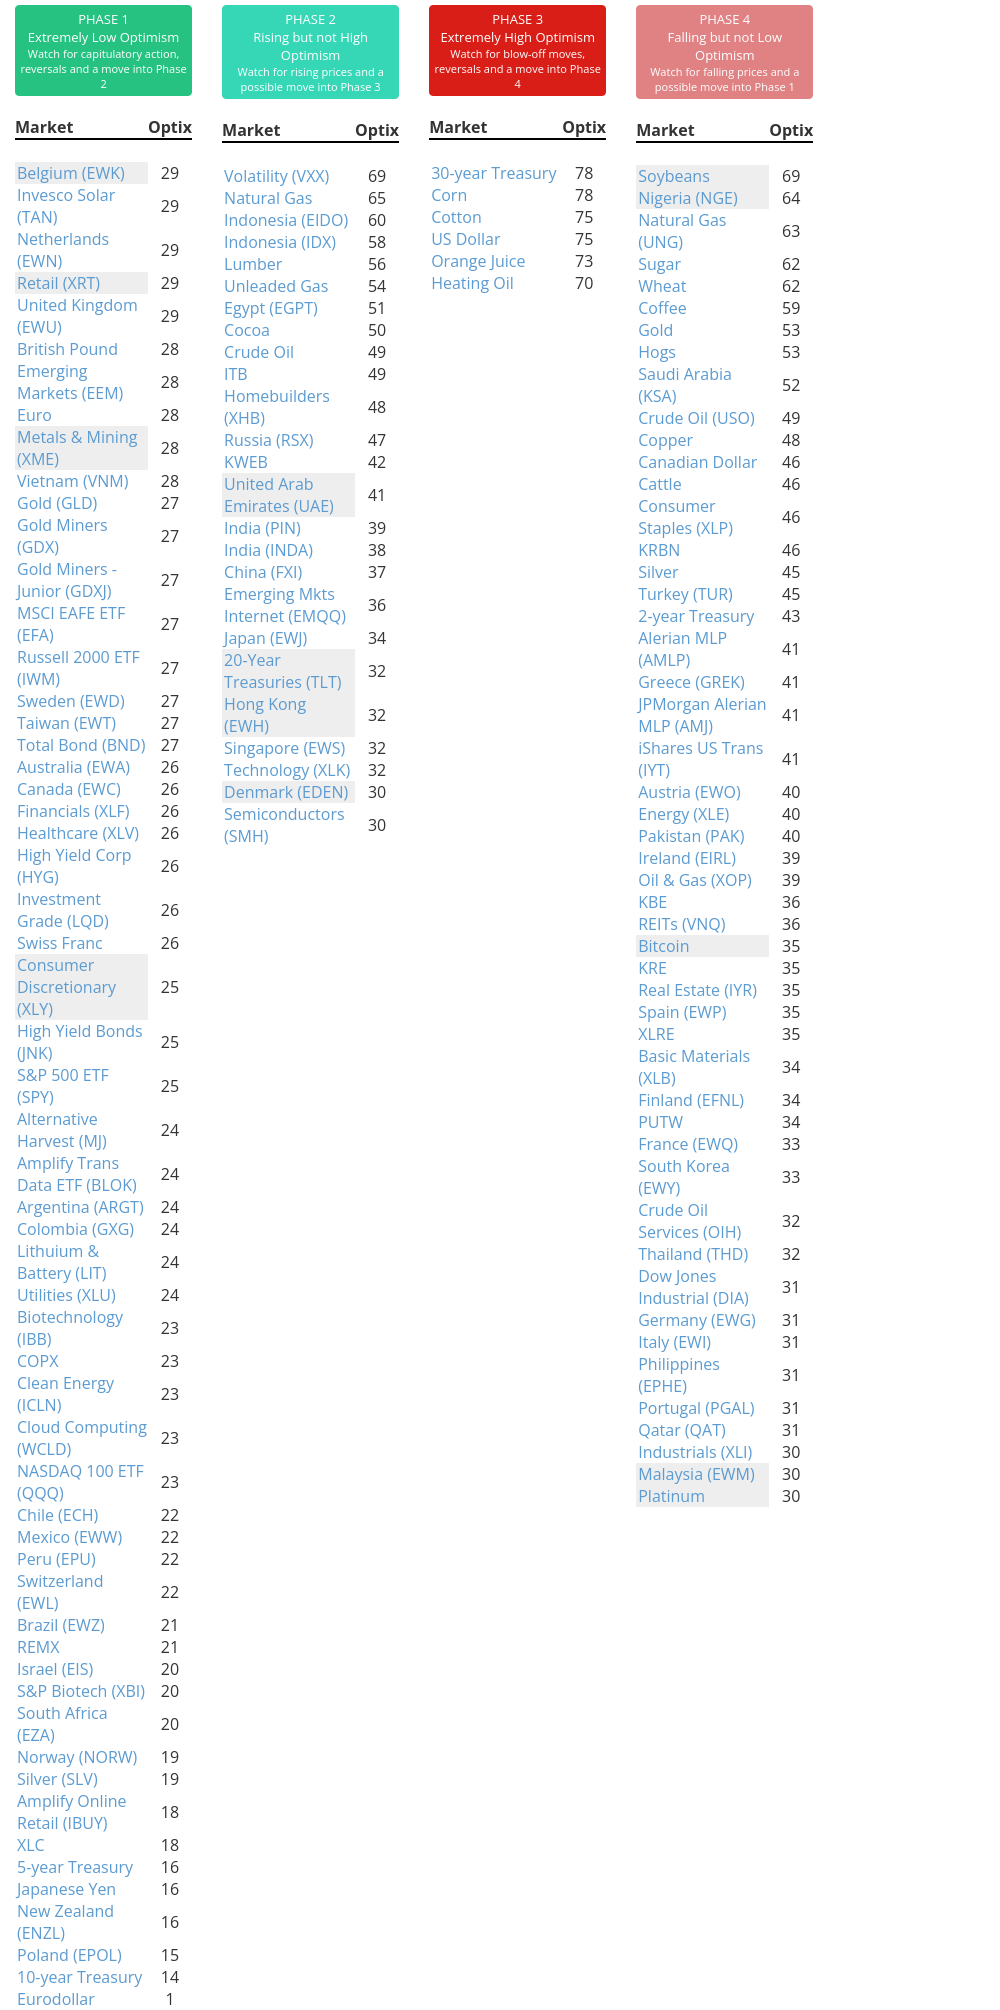
Phase Table
Ranks
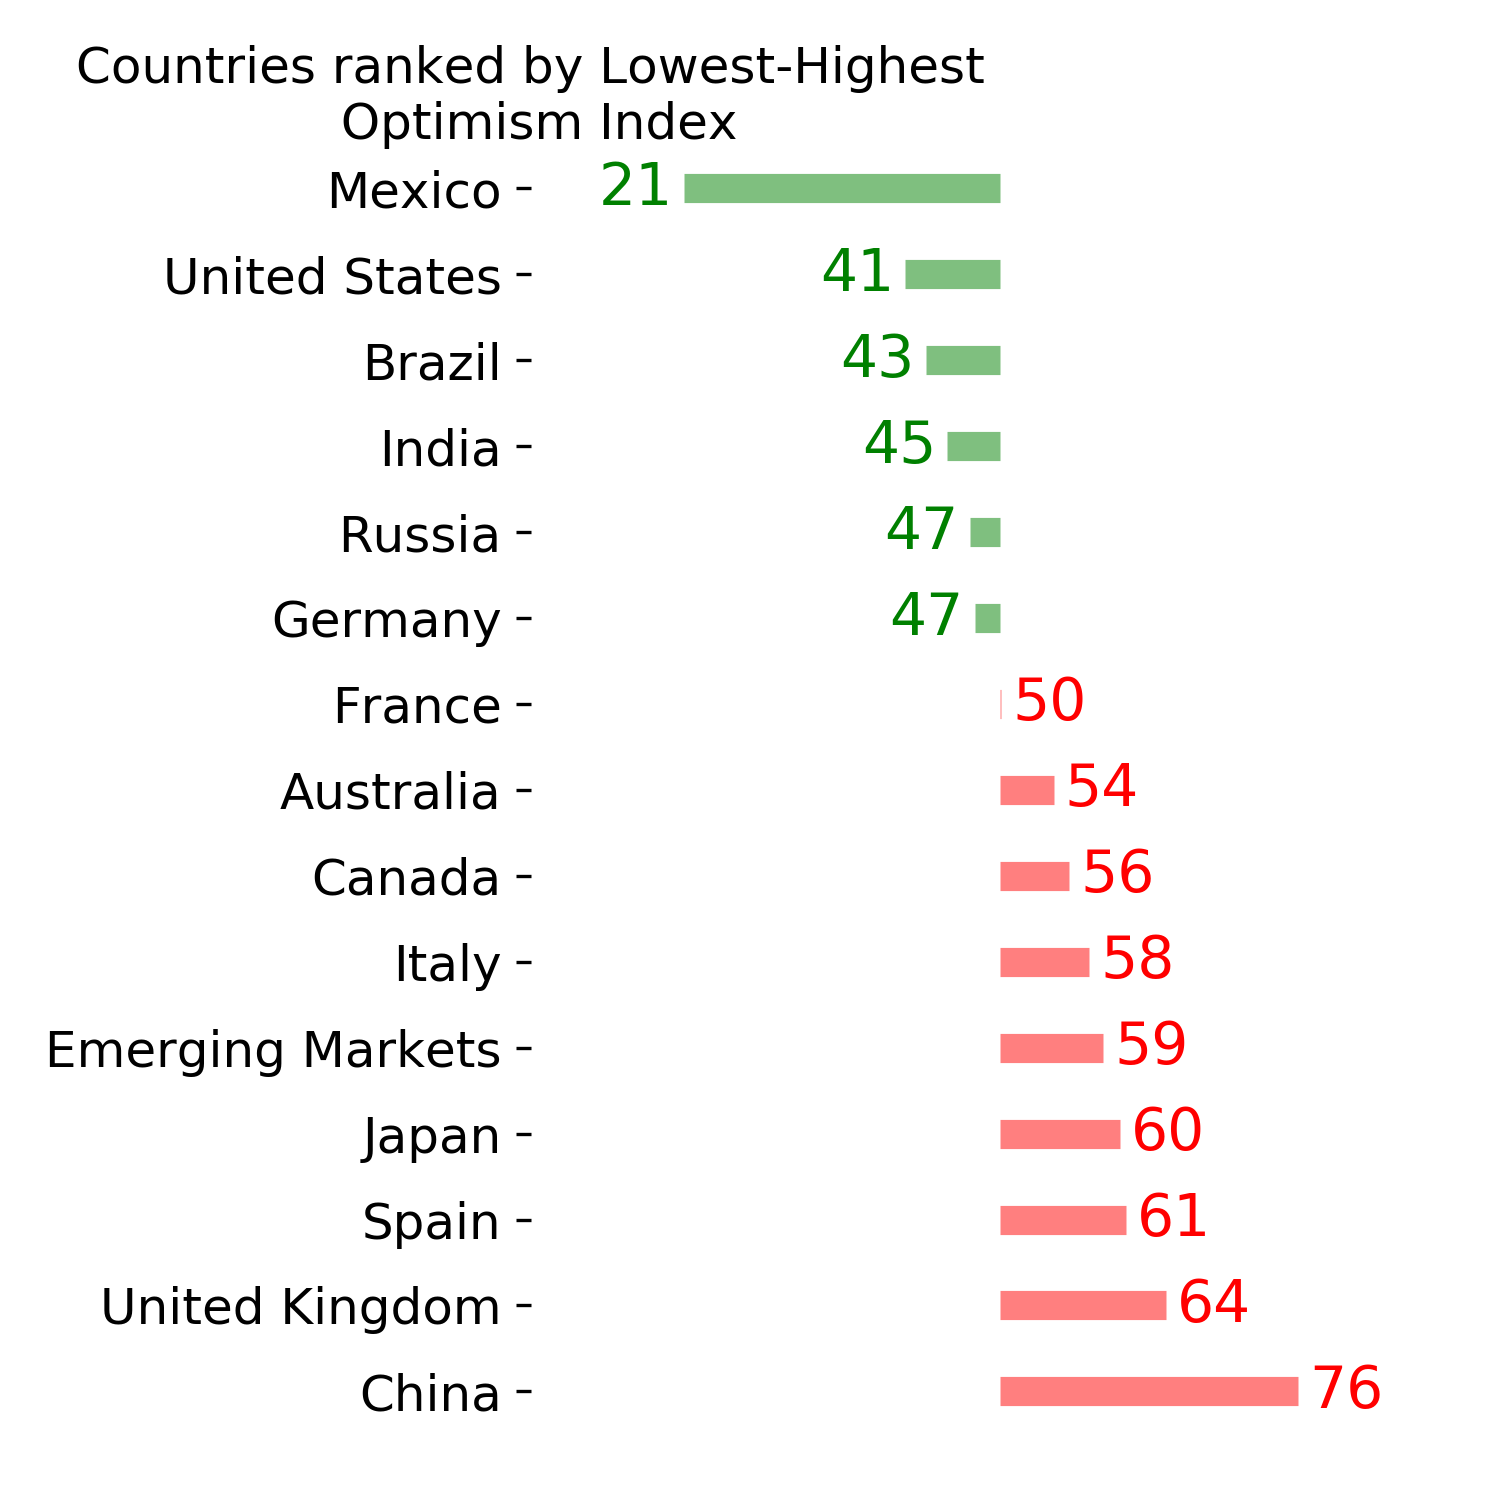
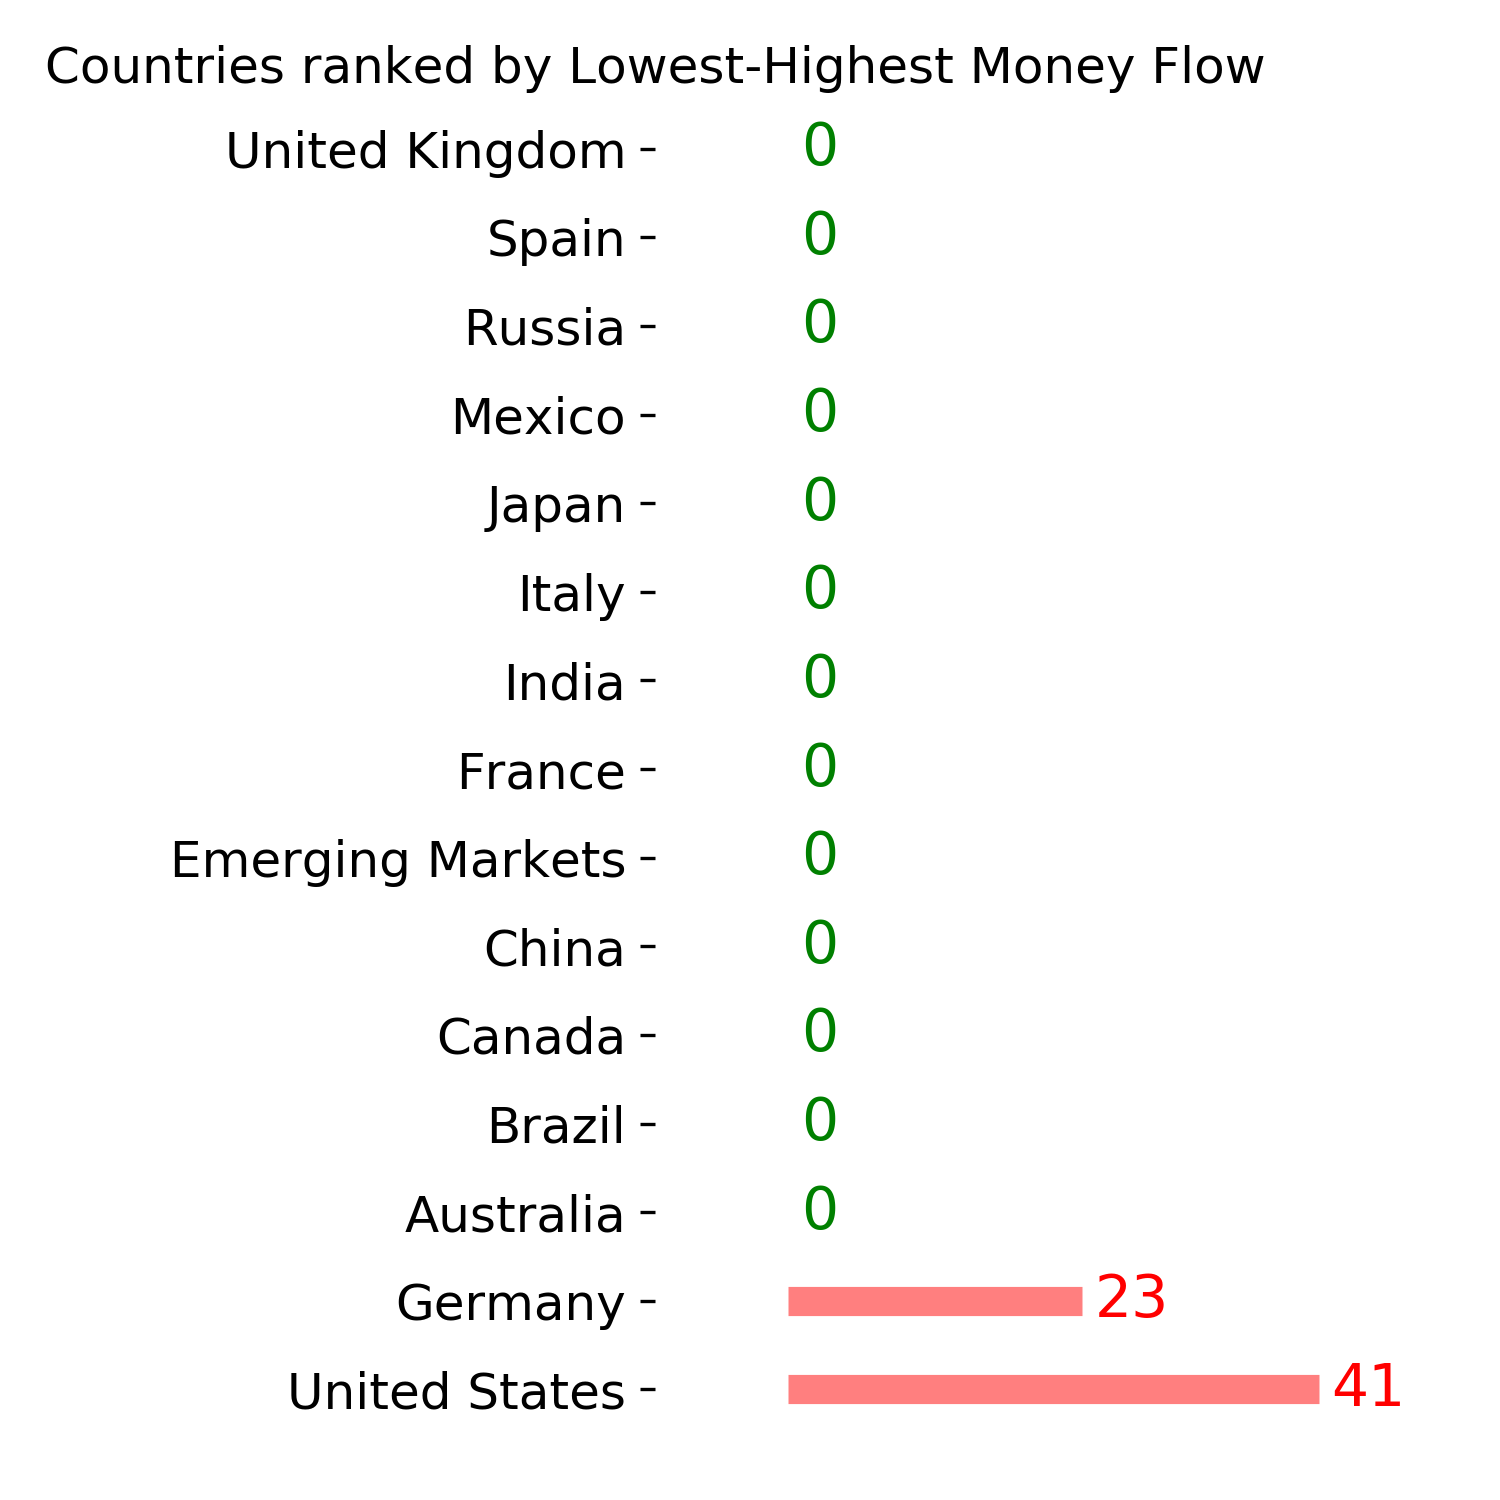
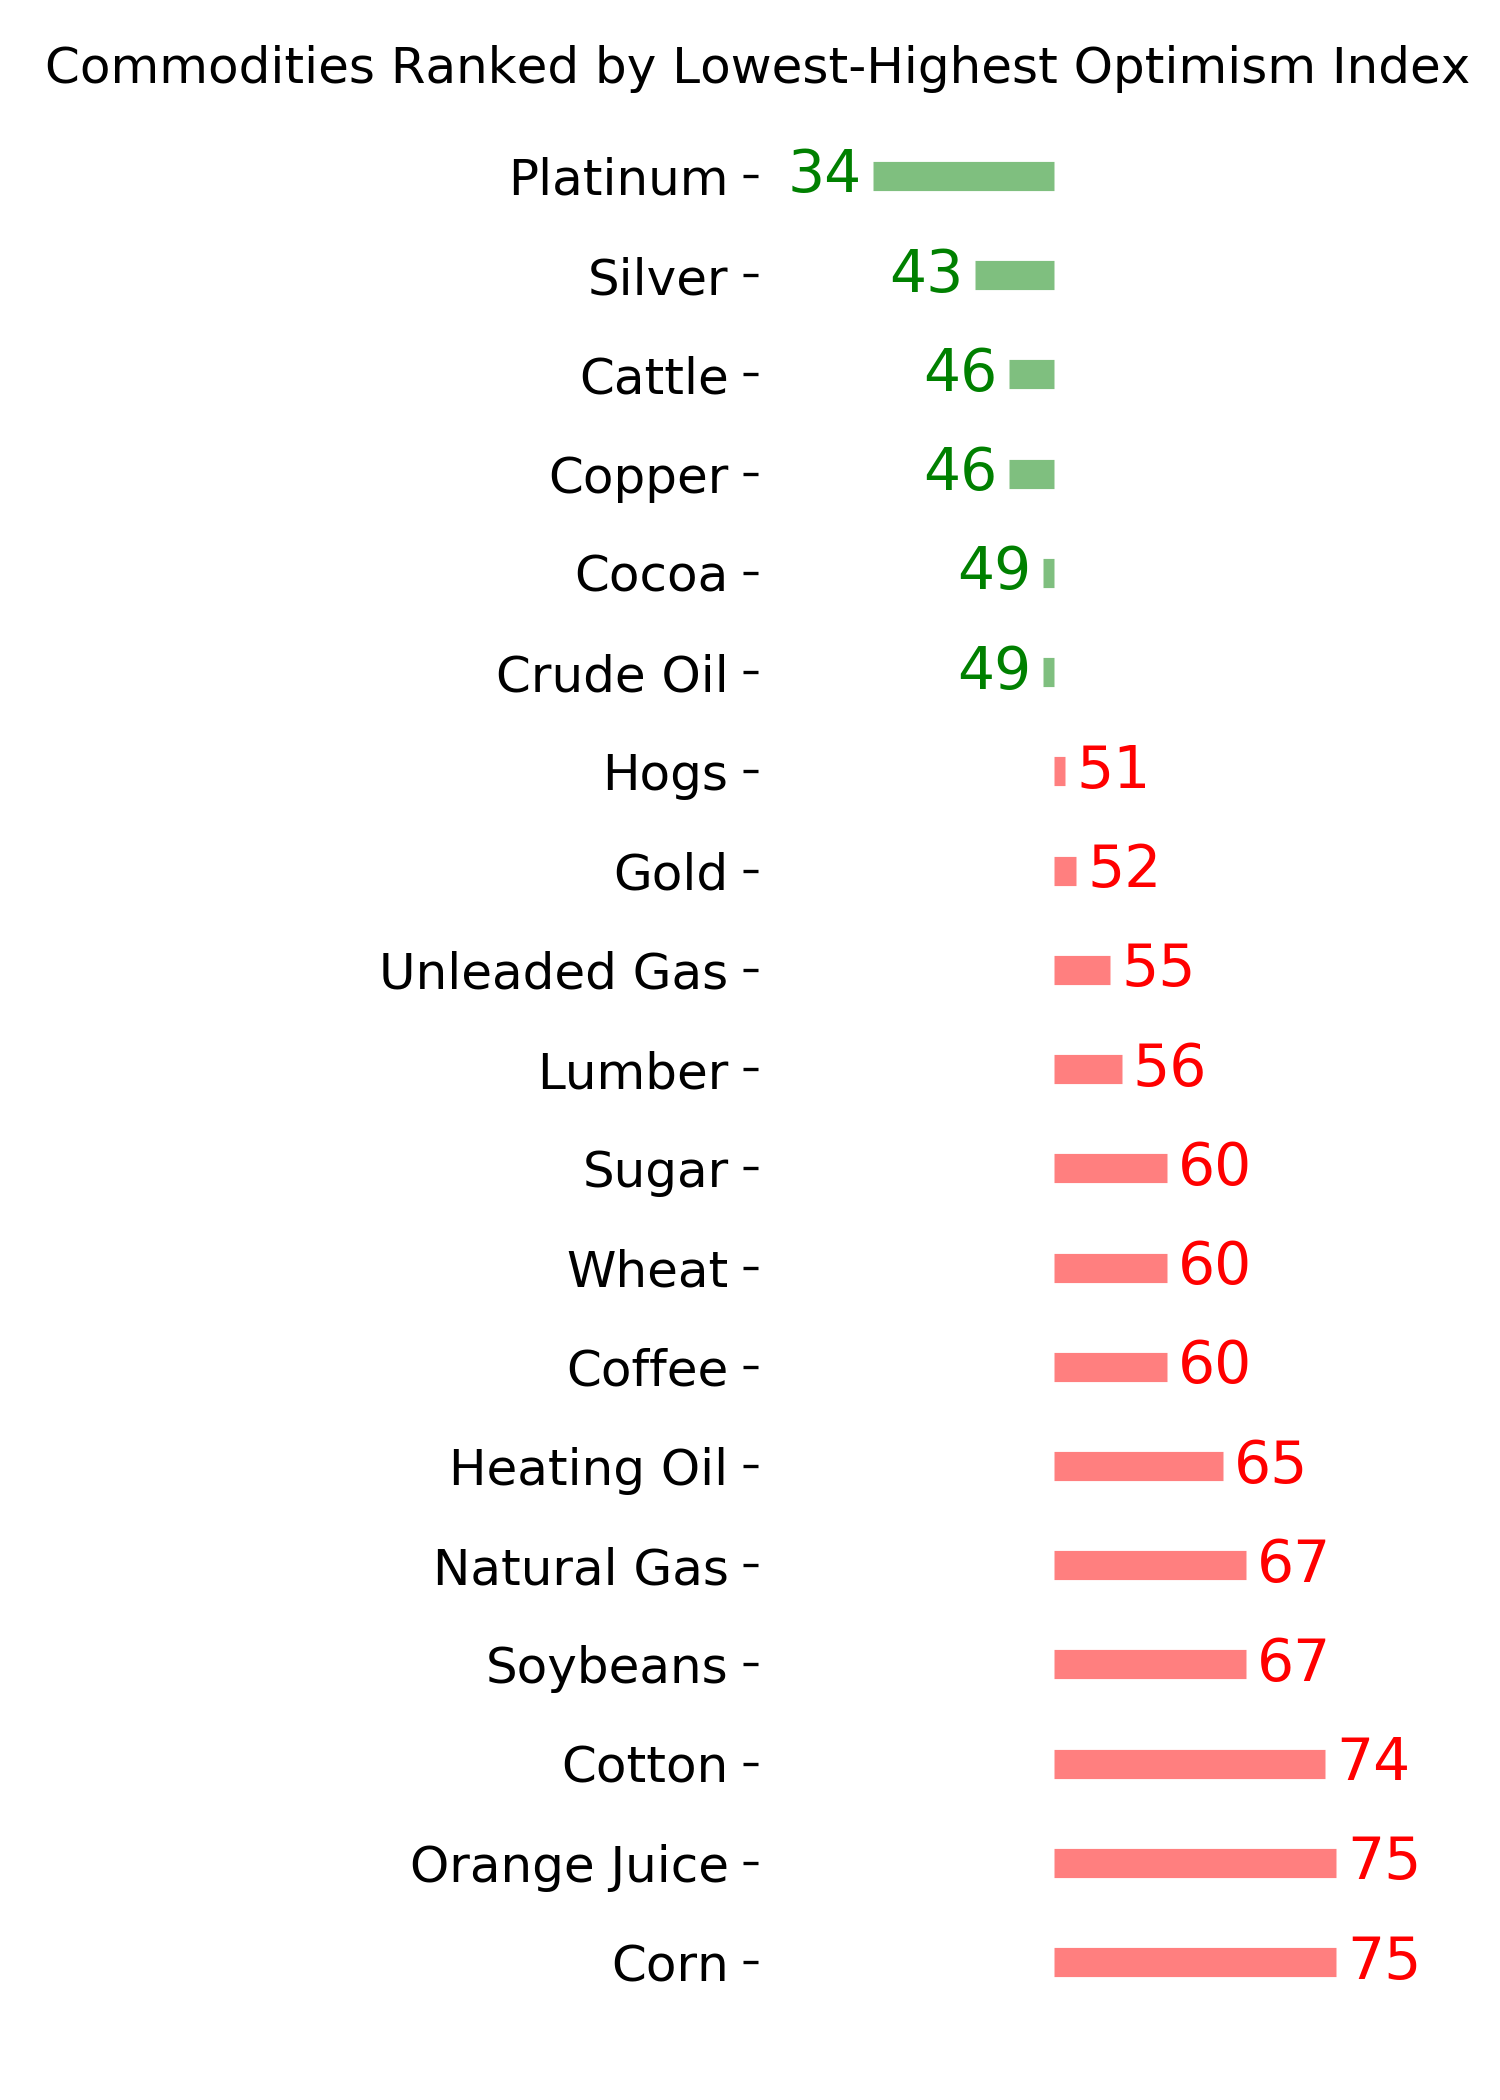
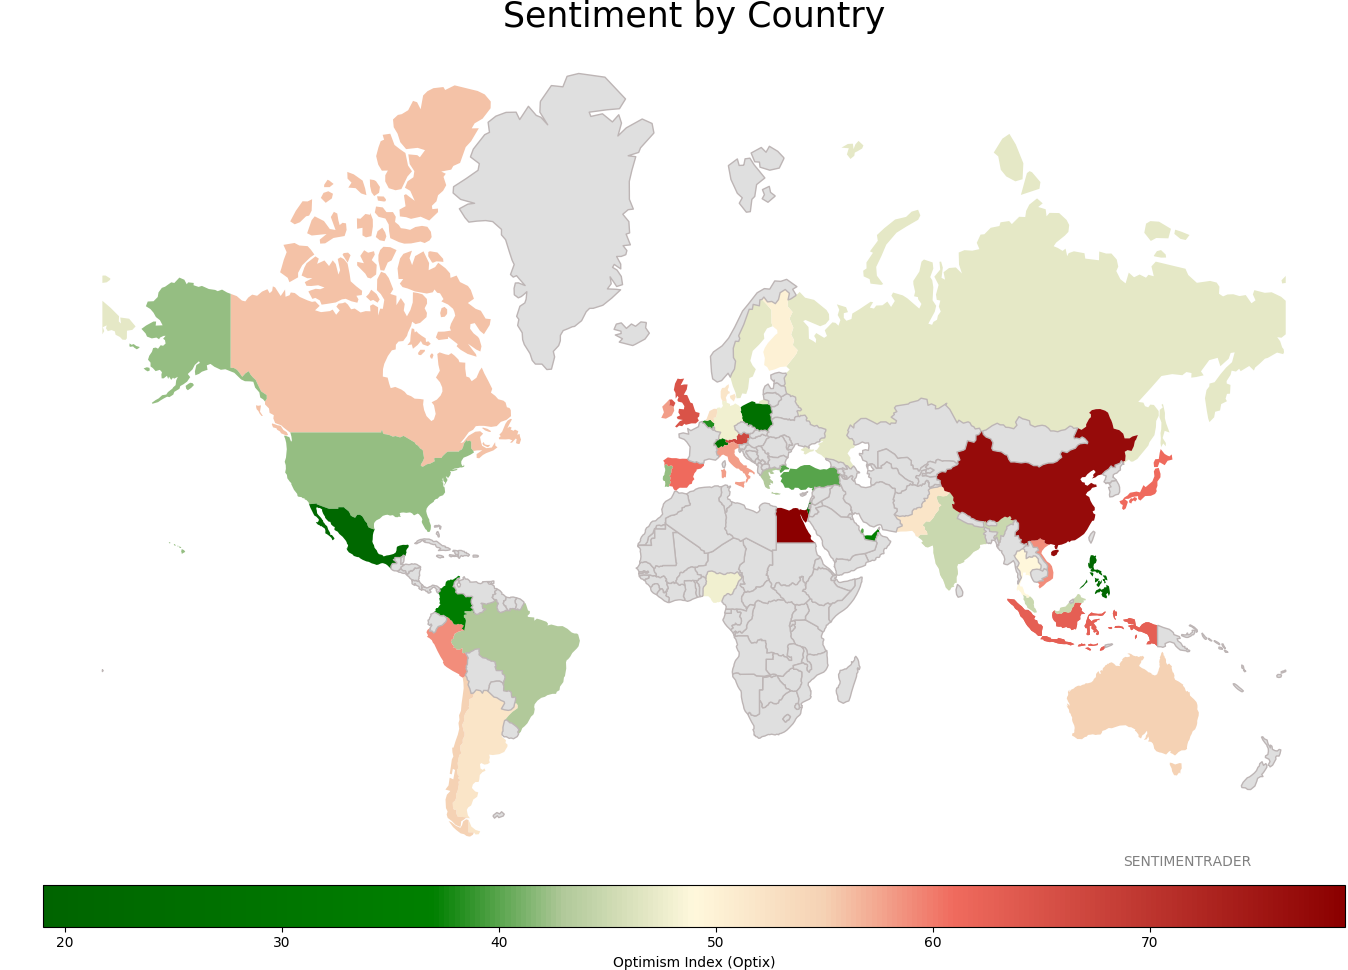
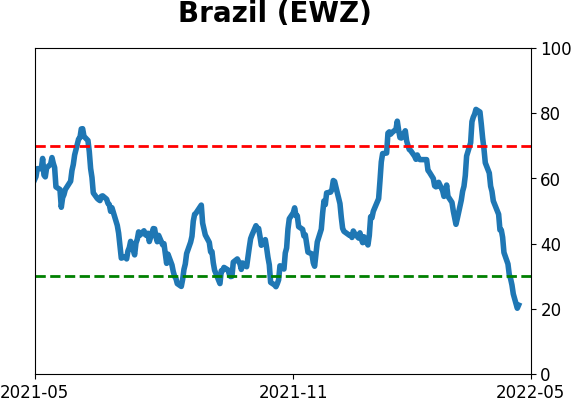
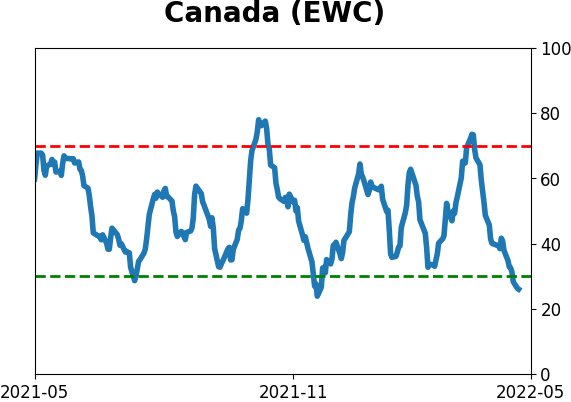
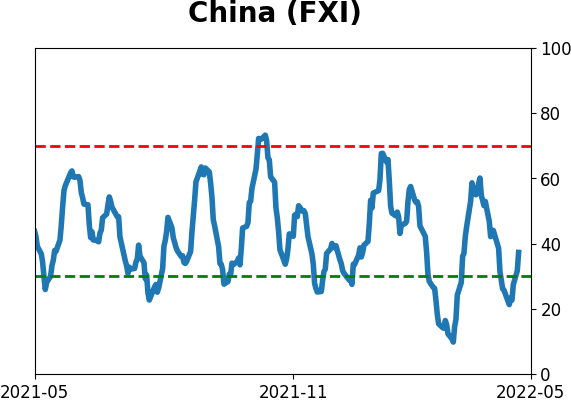
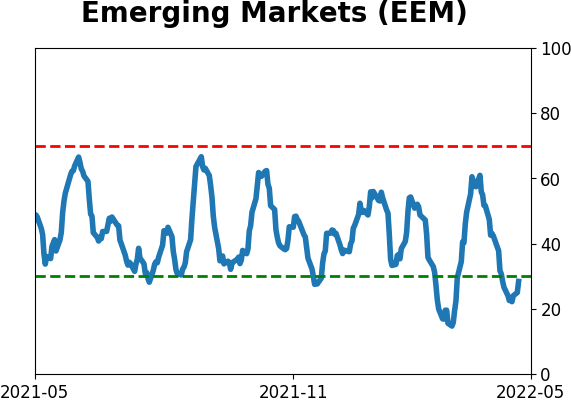
Sentiment Around The World
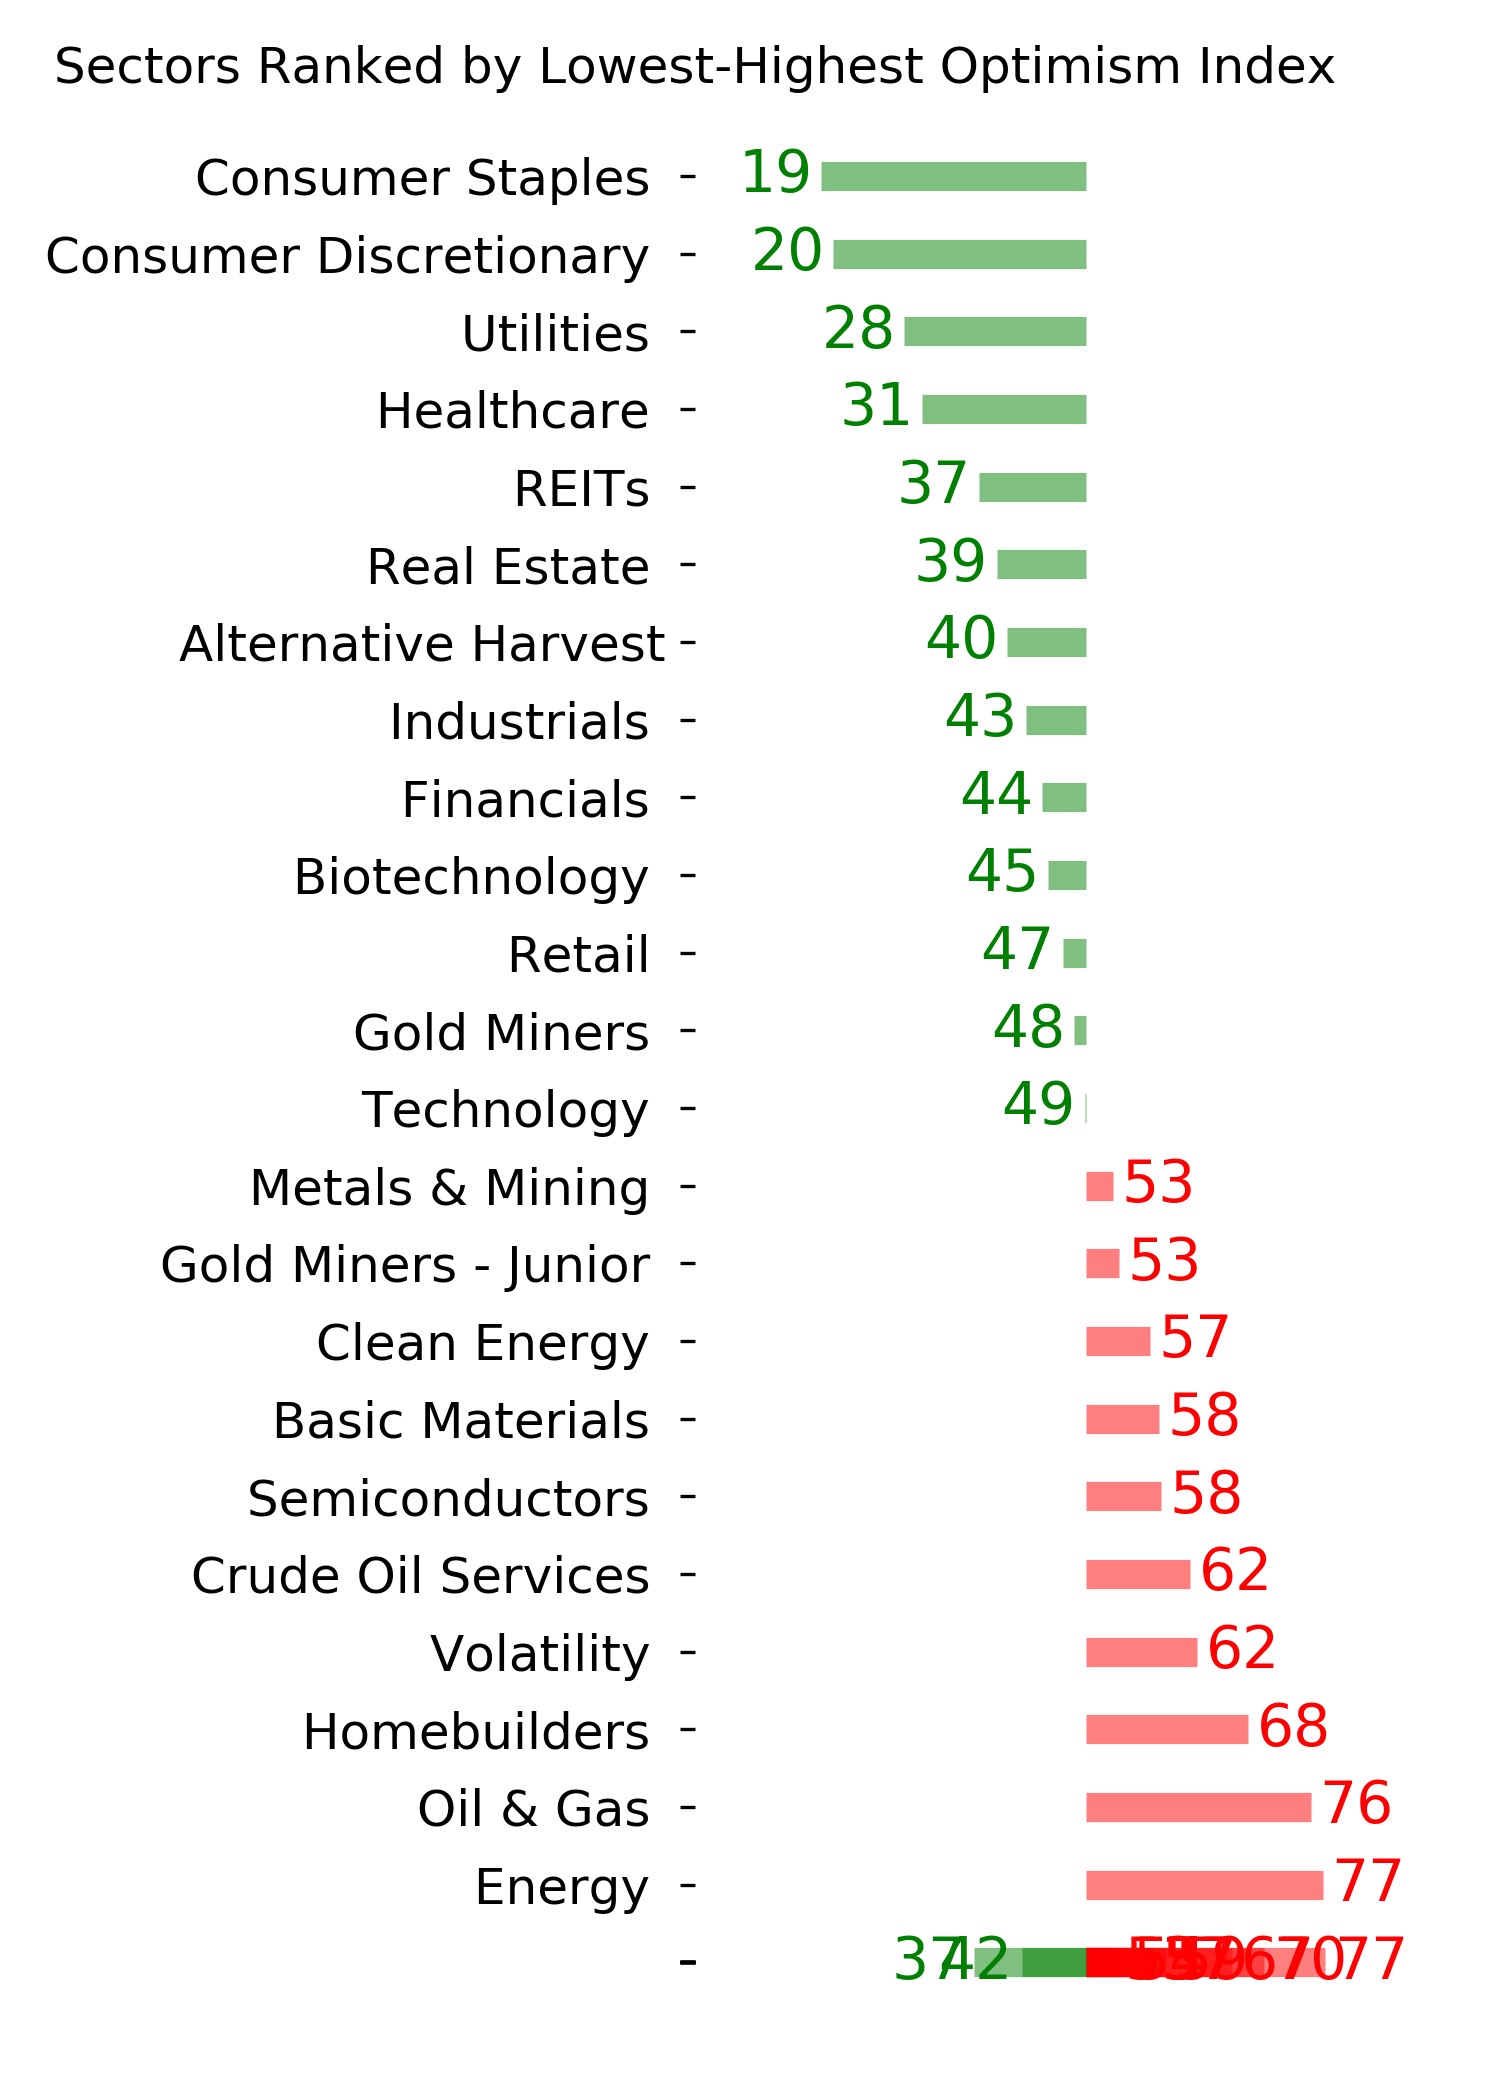
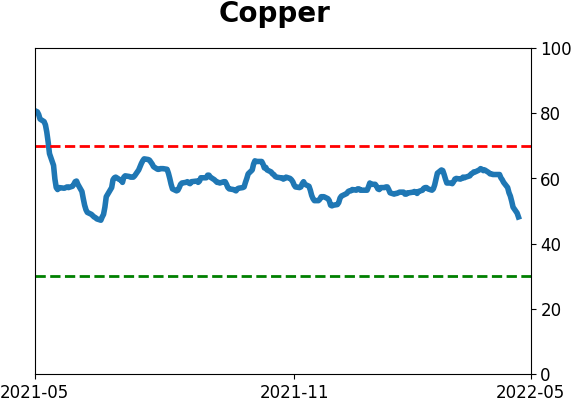
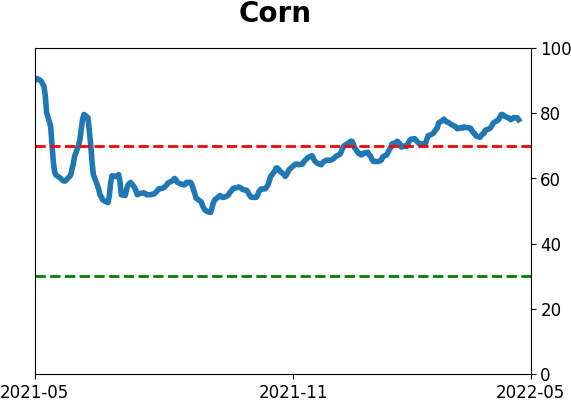
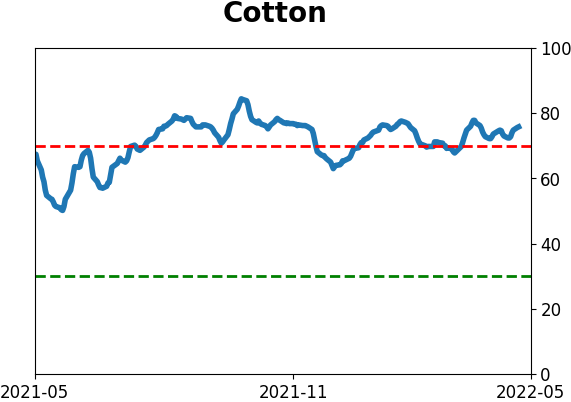
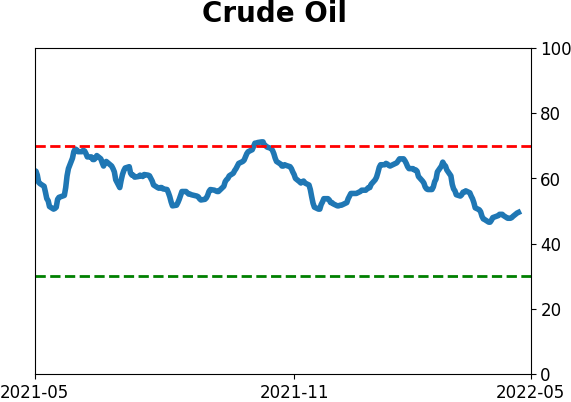
Optimism Index Thumbnails
|
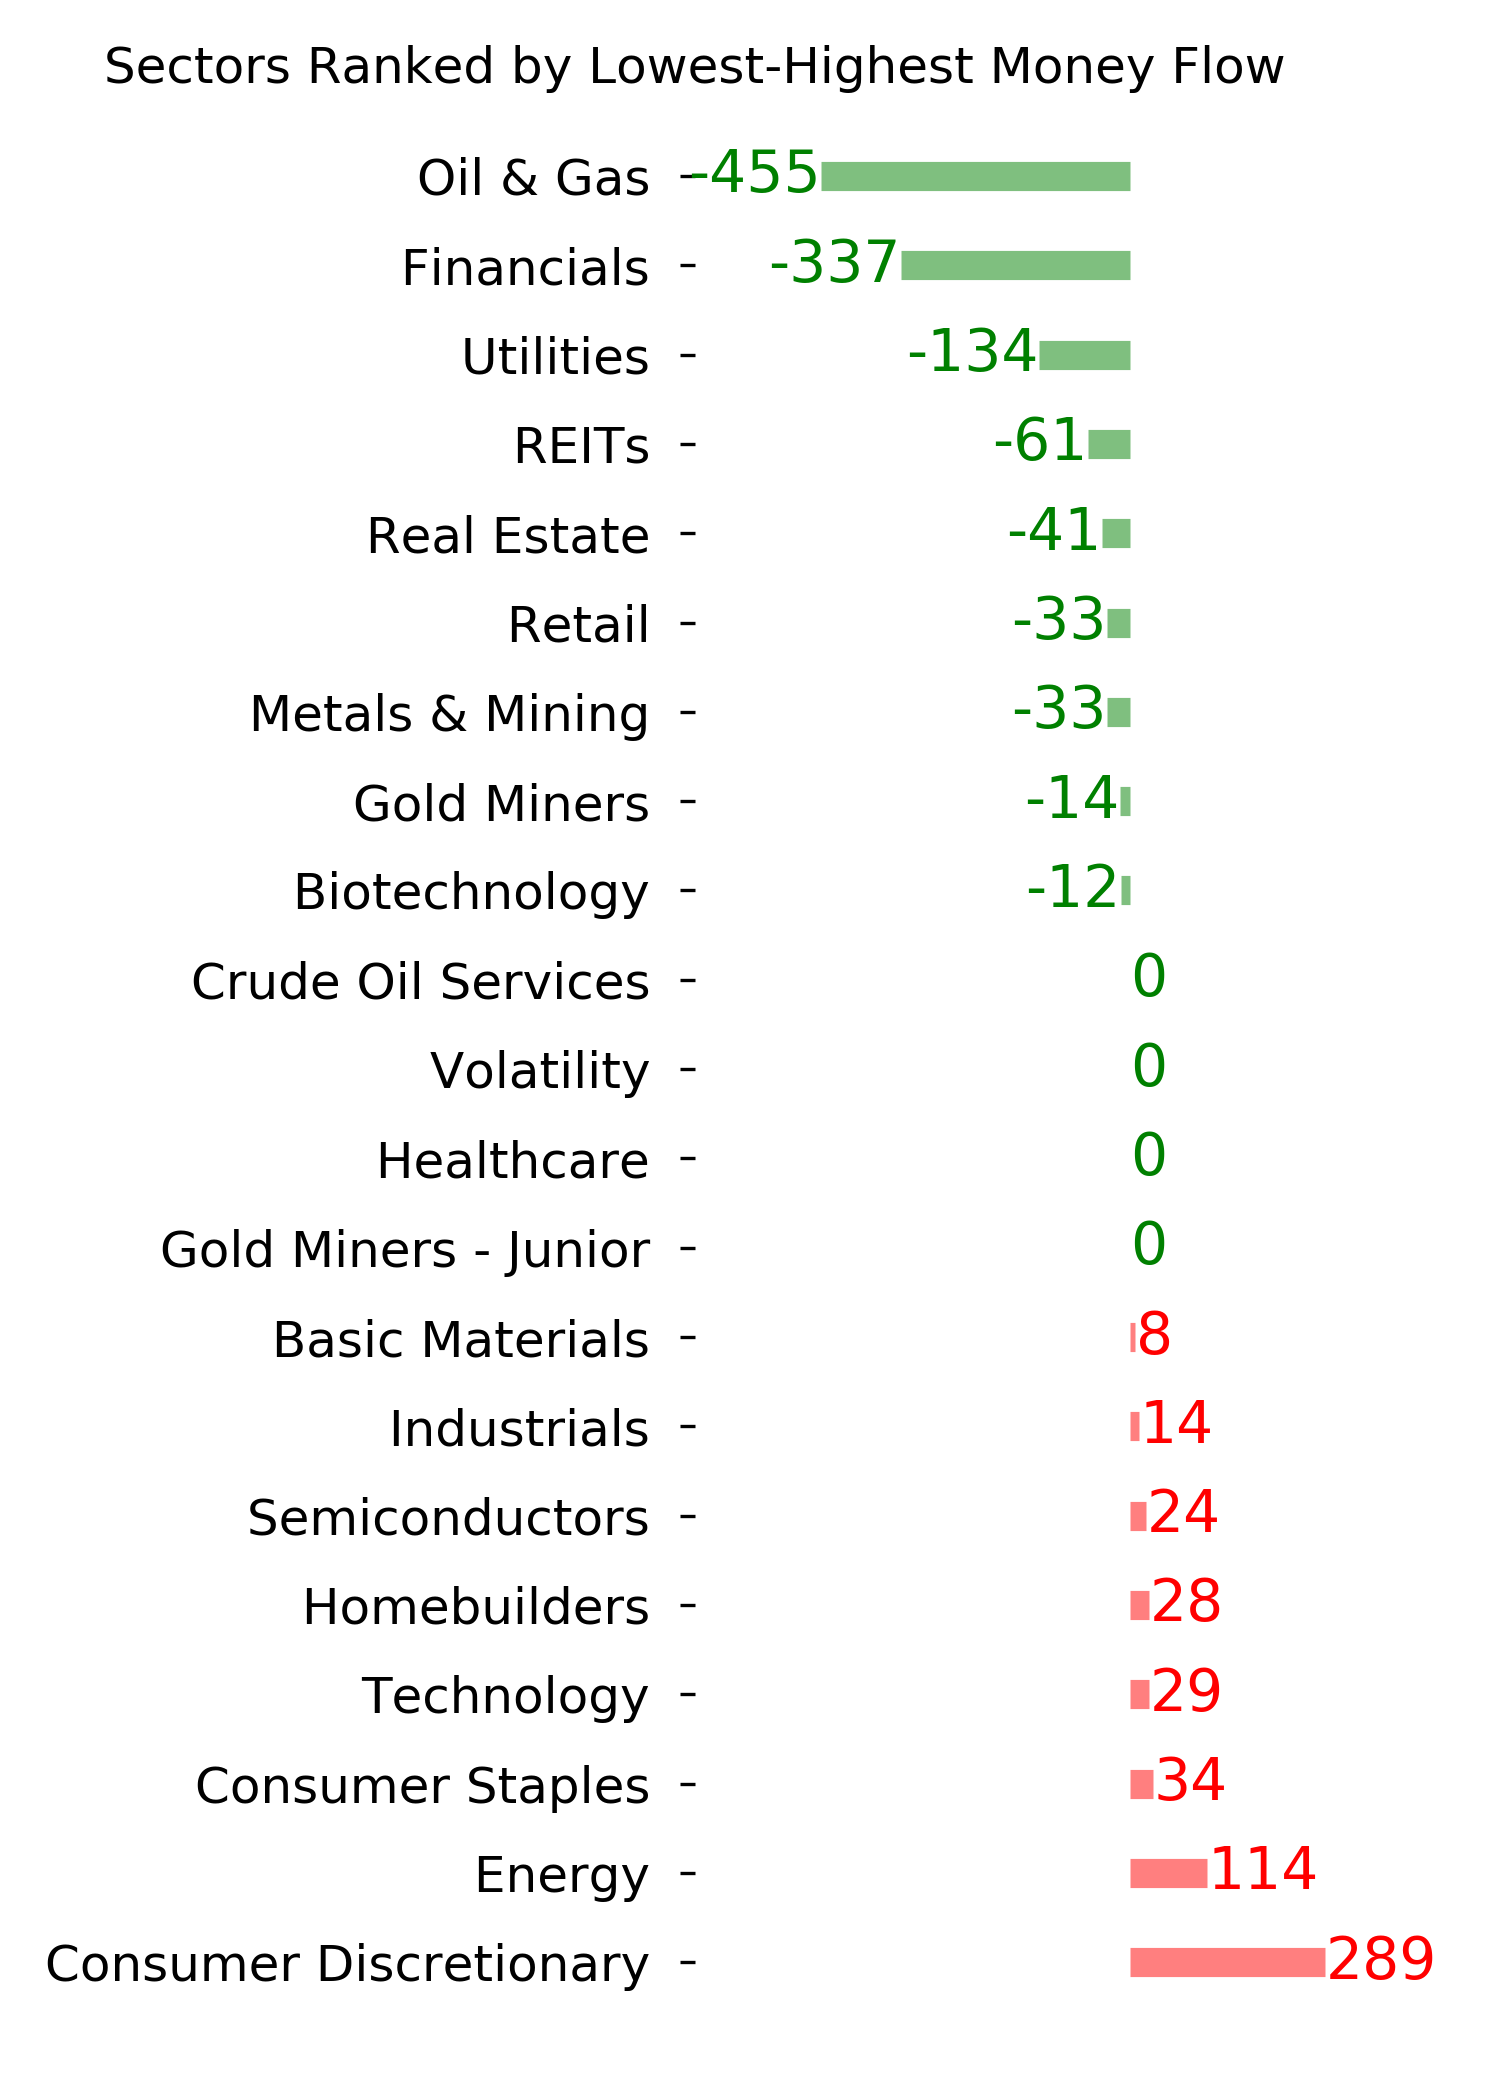
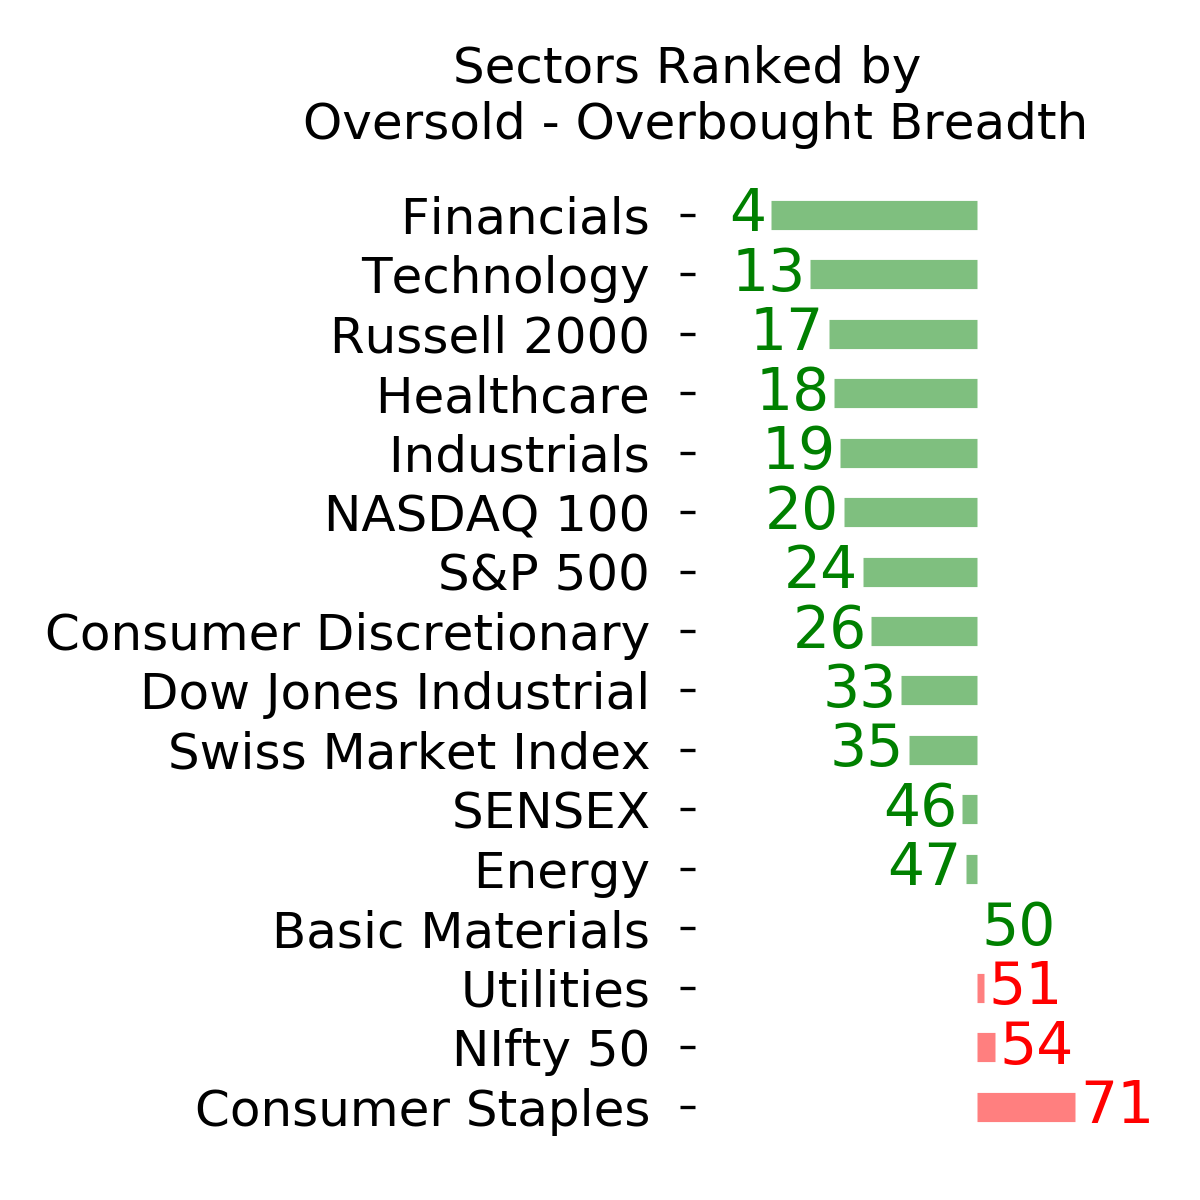
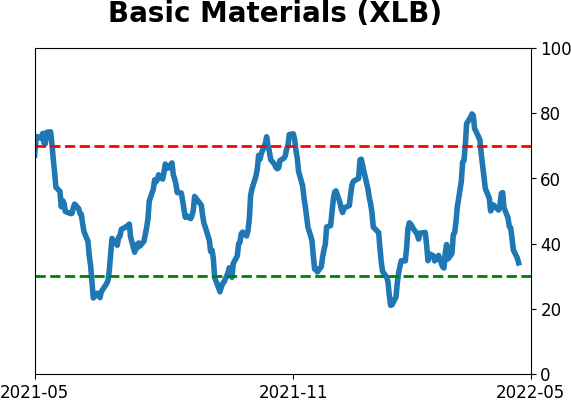
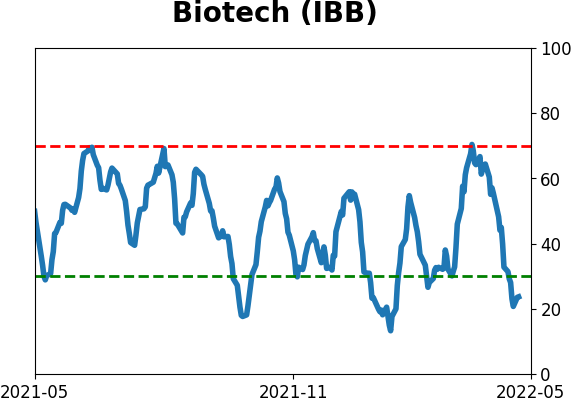
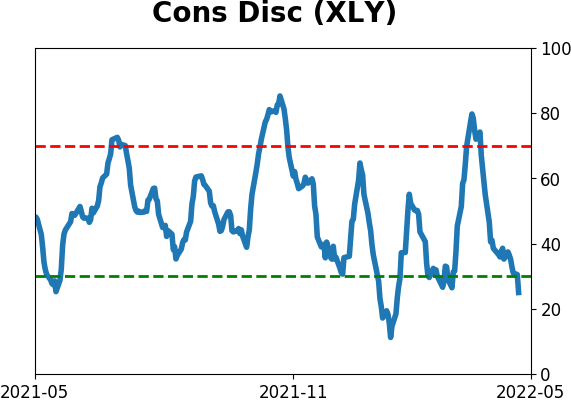
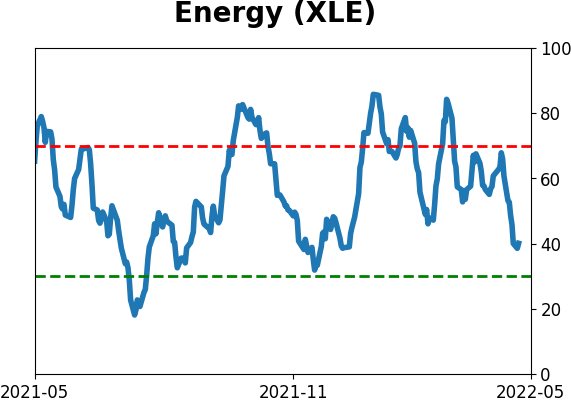
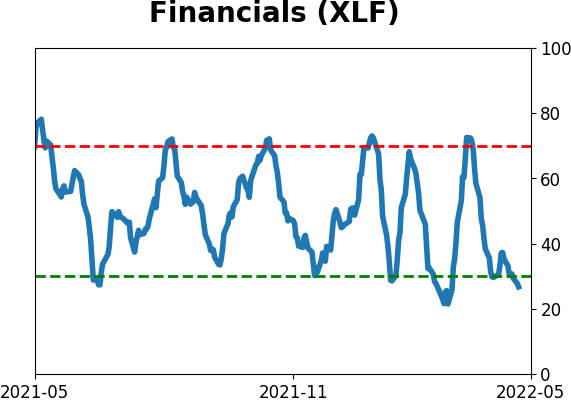
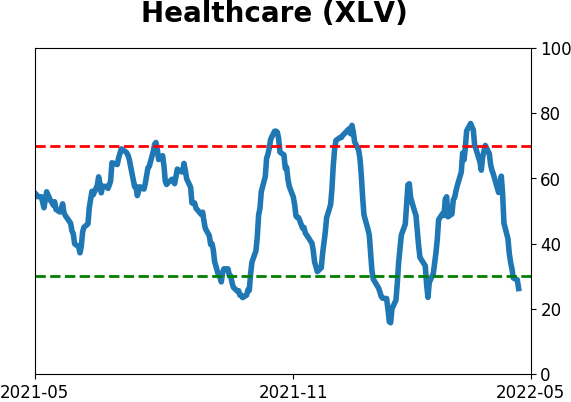
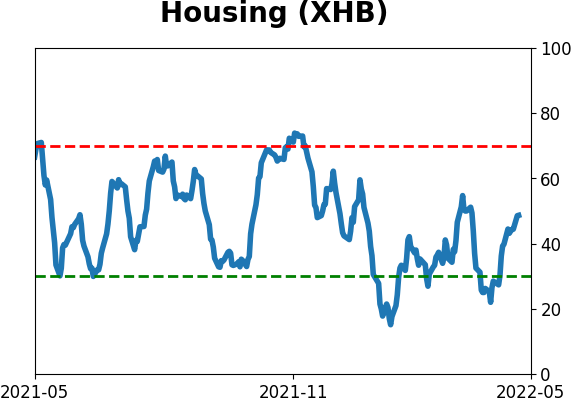
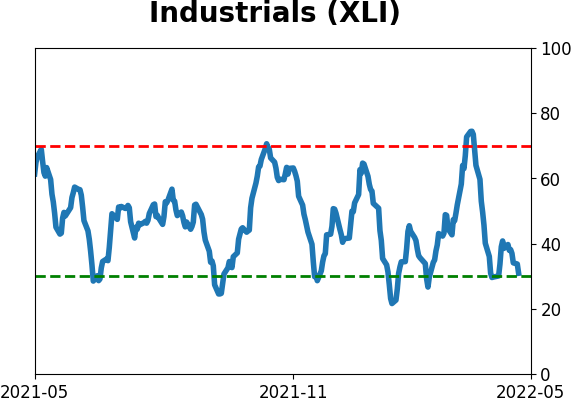
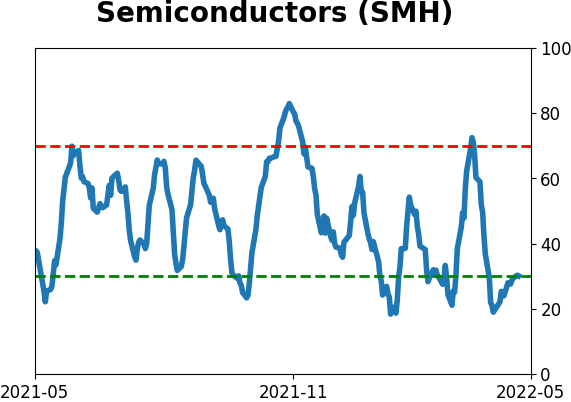
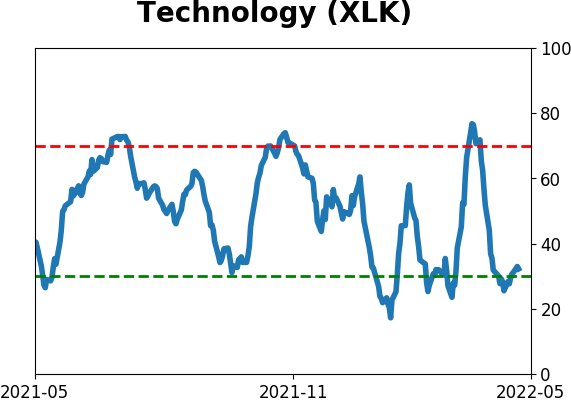
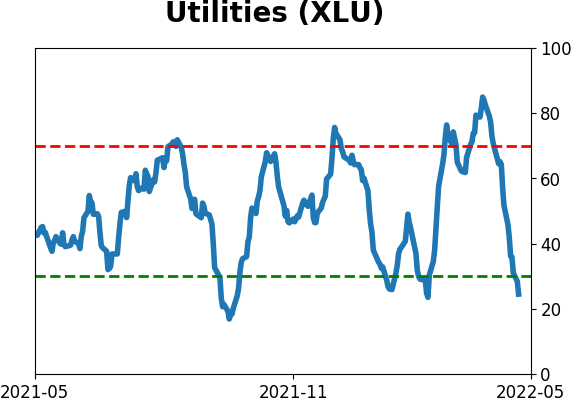
Sector ETF's - 10-Day Moving Average
|
|
|
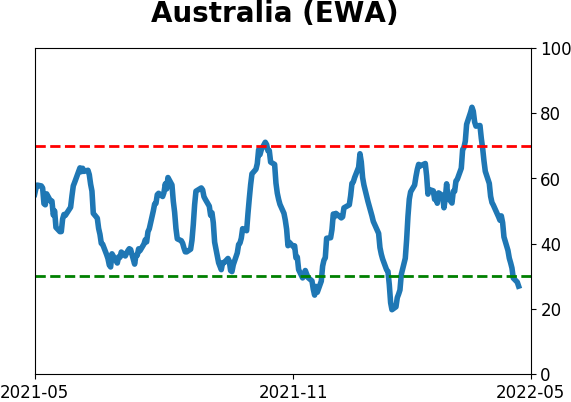
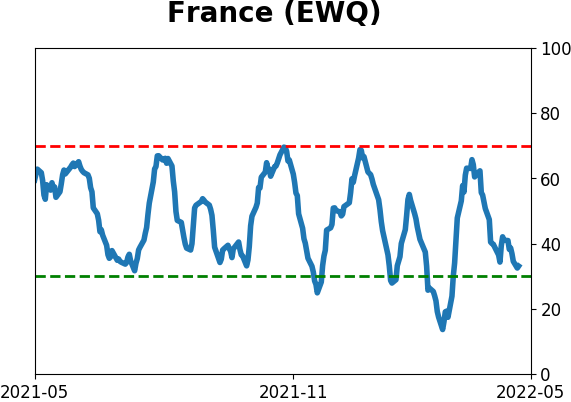
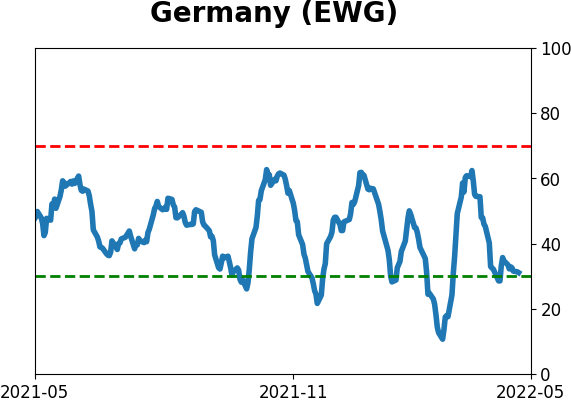
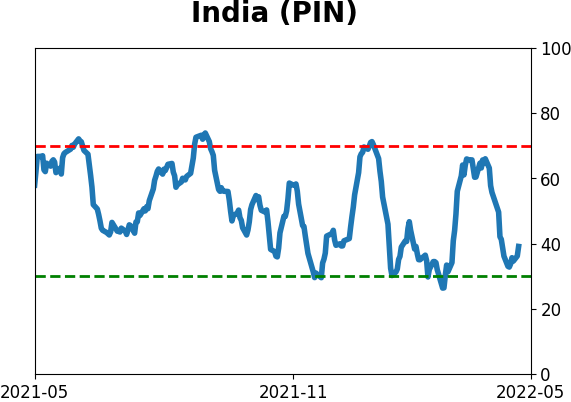
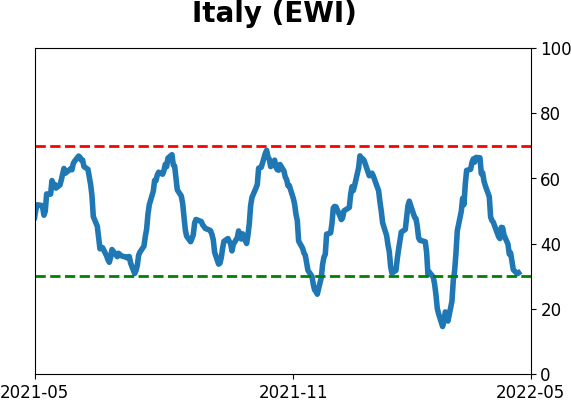
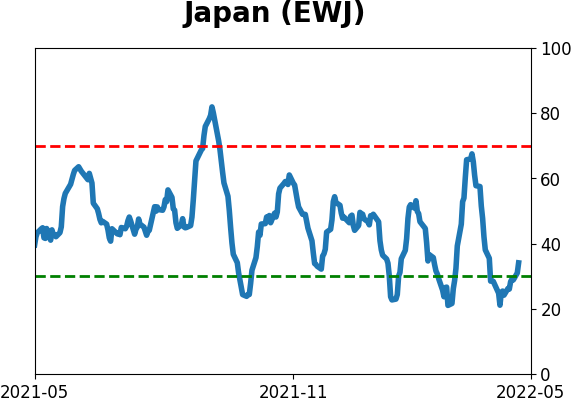
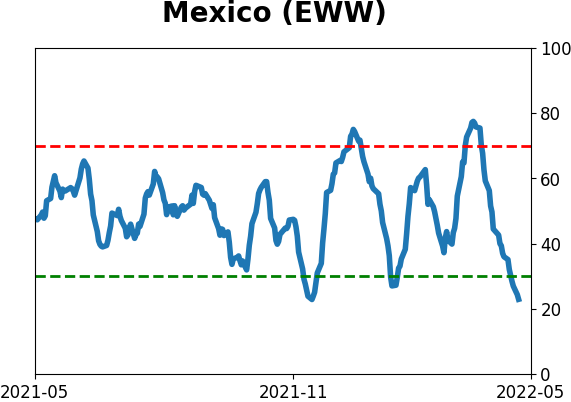
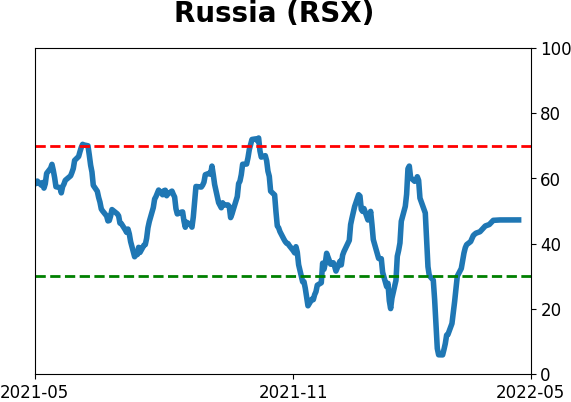
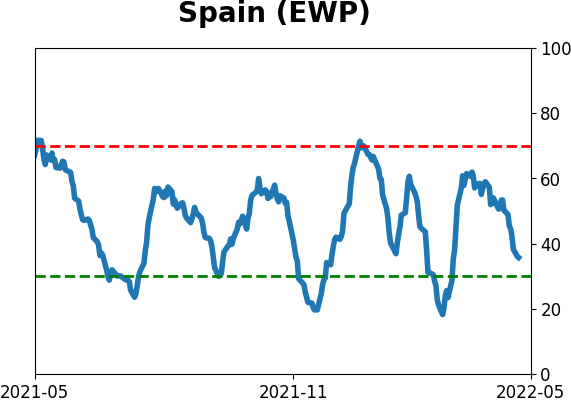
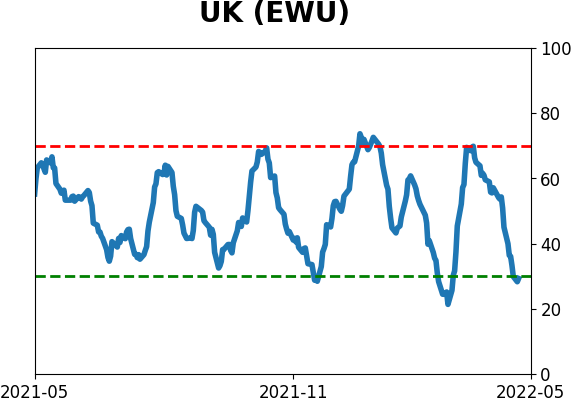
Country ETF's - 10-Day Moving Average
|
|
|
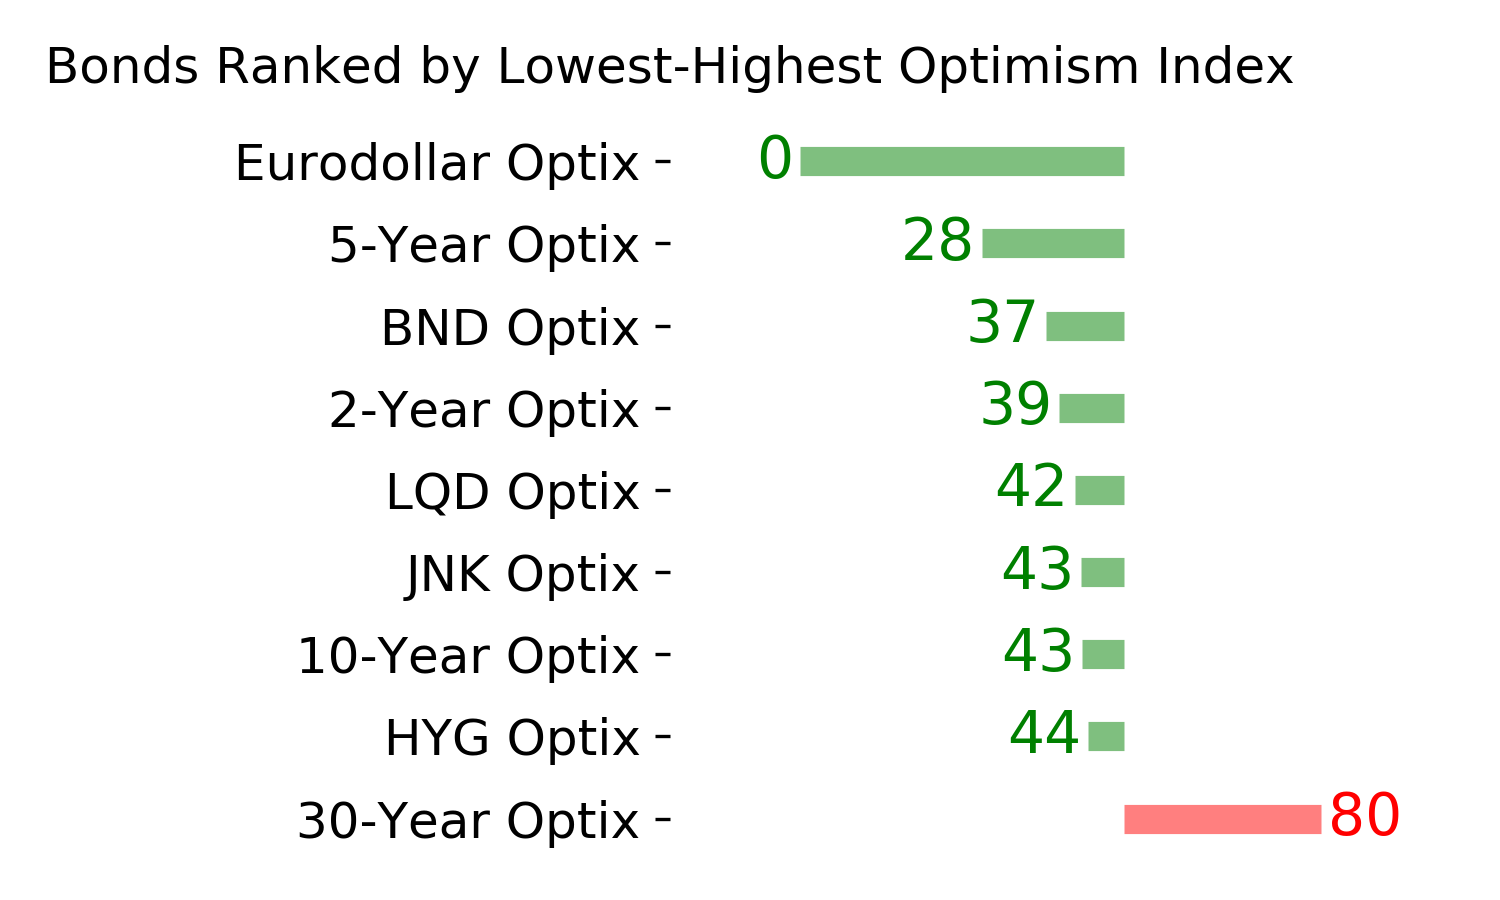
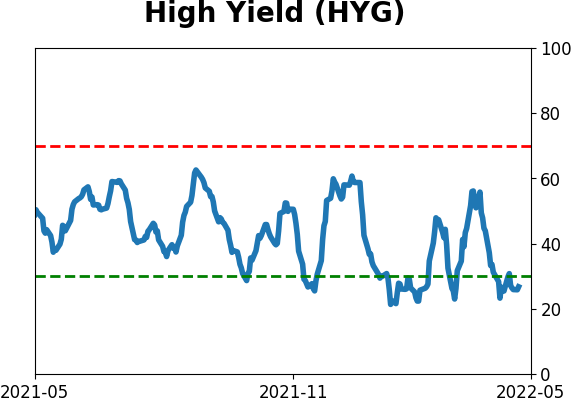
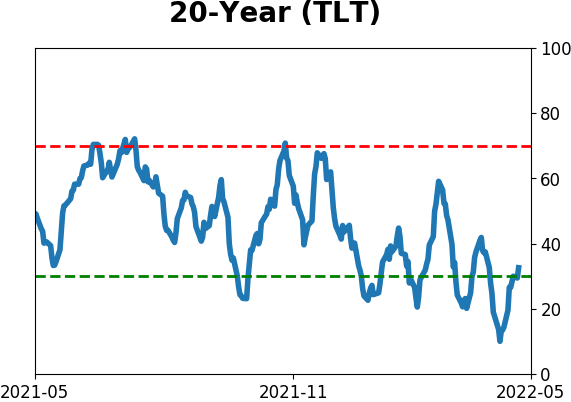
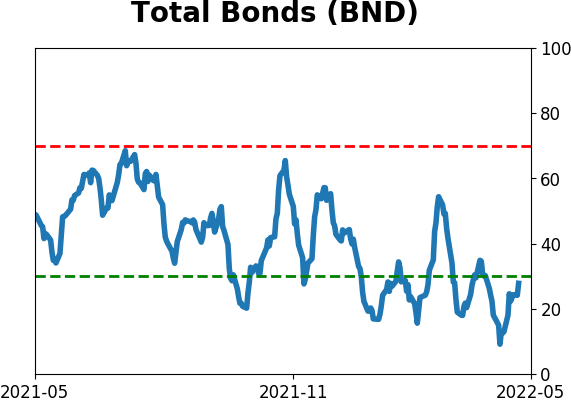
Bond ETF's - 10-Day Moving Average
|
|
|
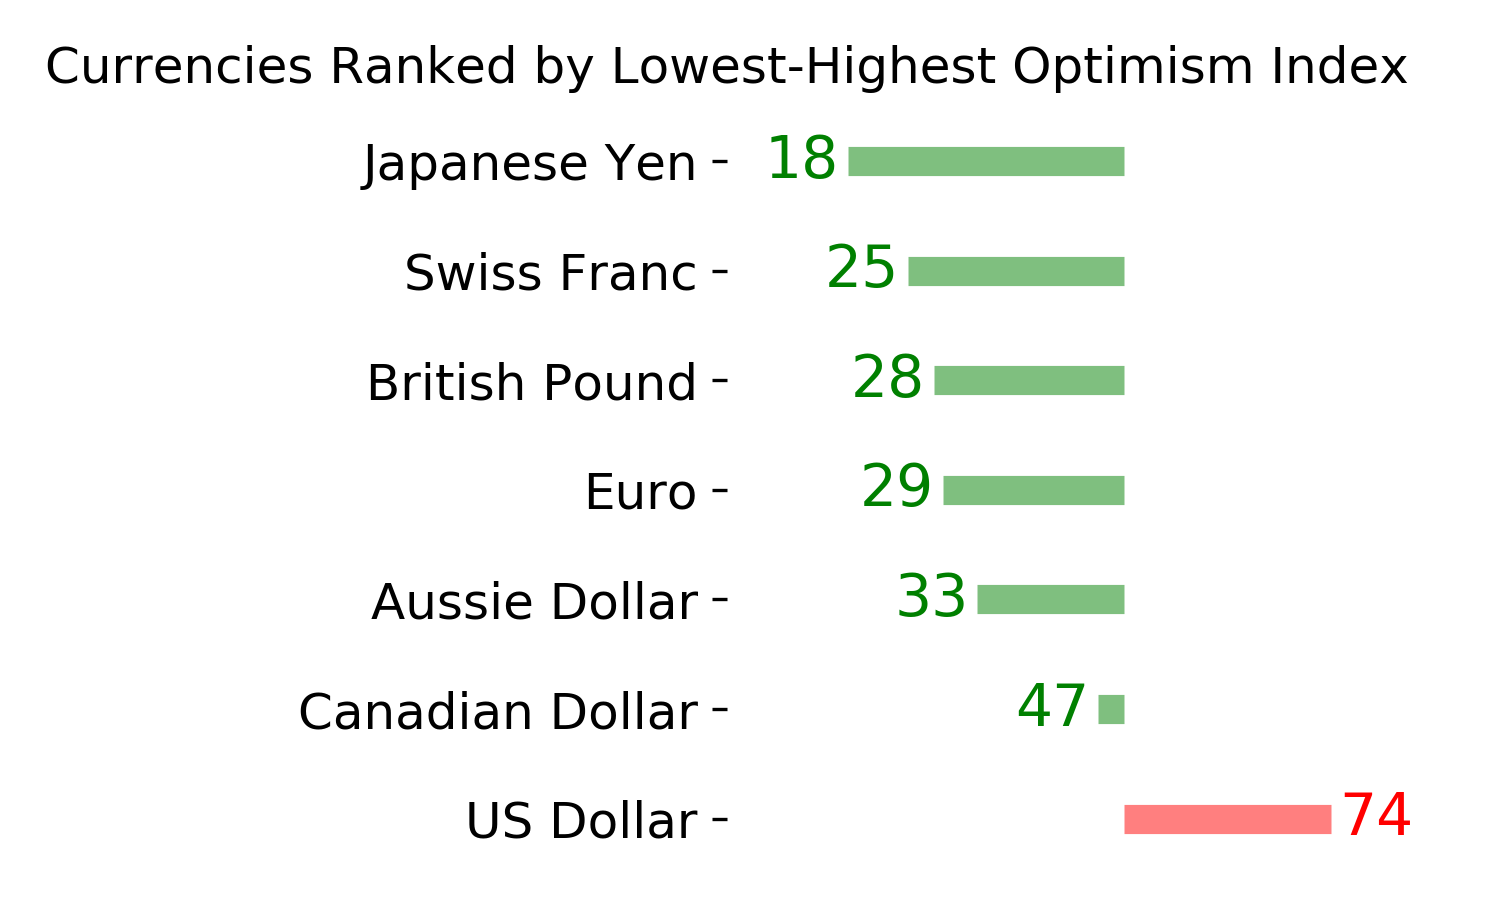
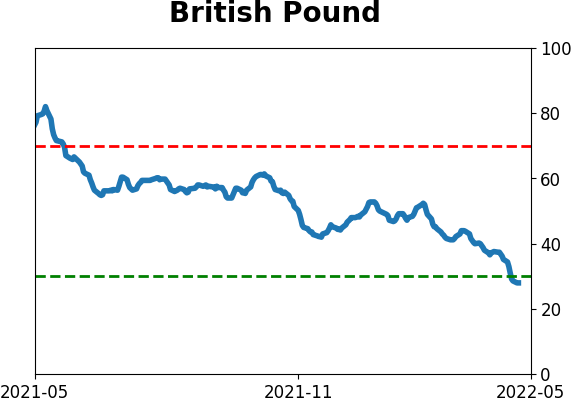
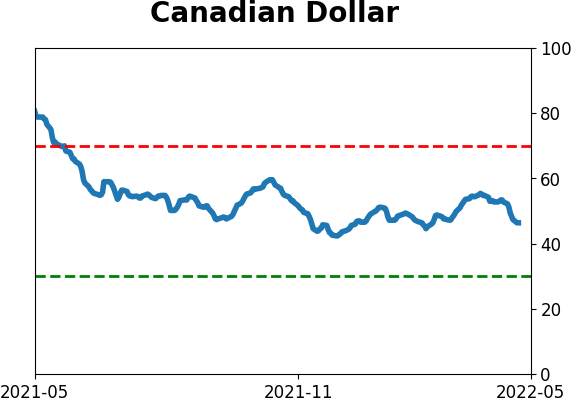
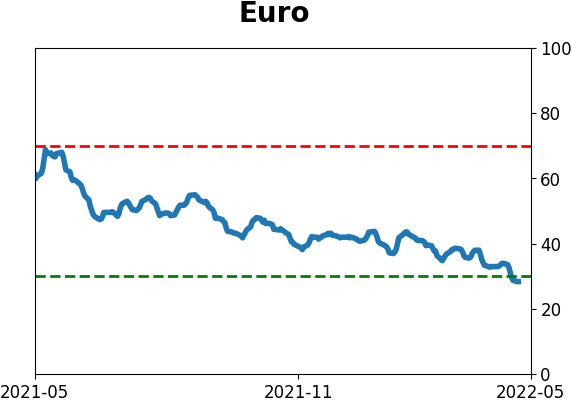
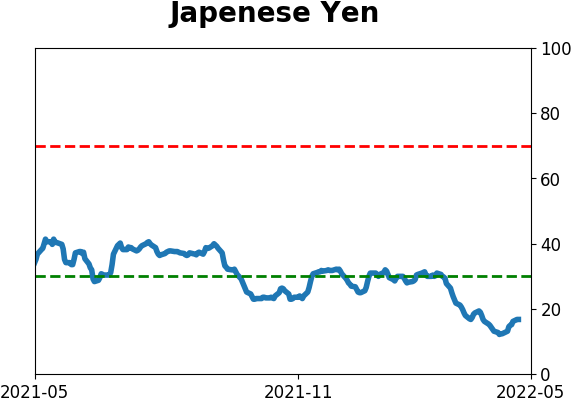
Currency ETF's - 5-Day Moving Average
|
|
|
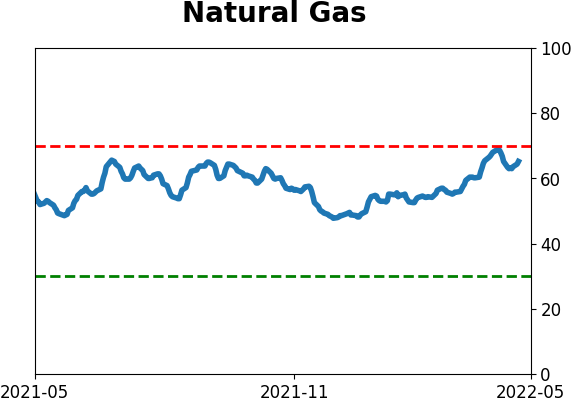
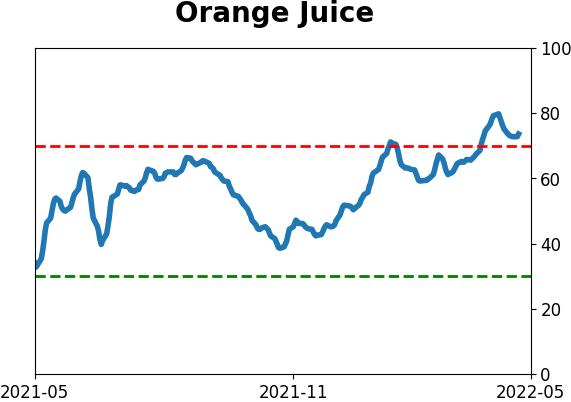
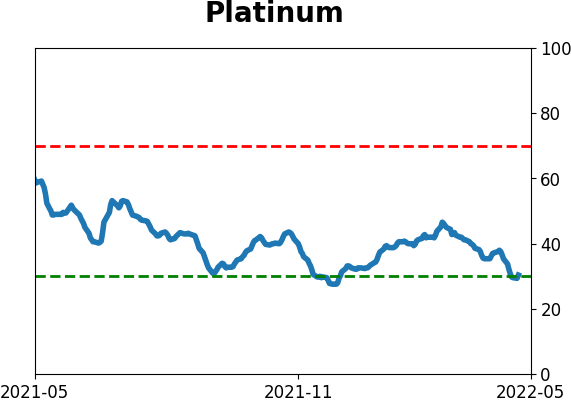
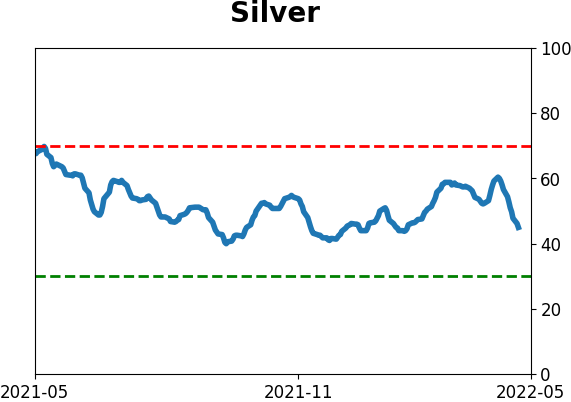
Commodity ETF's - 5-Day Moving Average
|
|