Headlines
|
|
What the Record Run in Transports Meant for Stocks:
The Dow Jones Transportation Average has suffered no weekly losses for the past 13 weeks, a 120-year record. It has tended to be a better signal for Industrial stocks than Transportation stocks going forward.
Bottom Line:
See the Outlook & Allocations page for more details on these summaries STOCKS: Weak sell
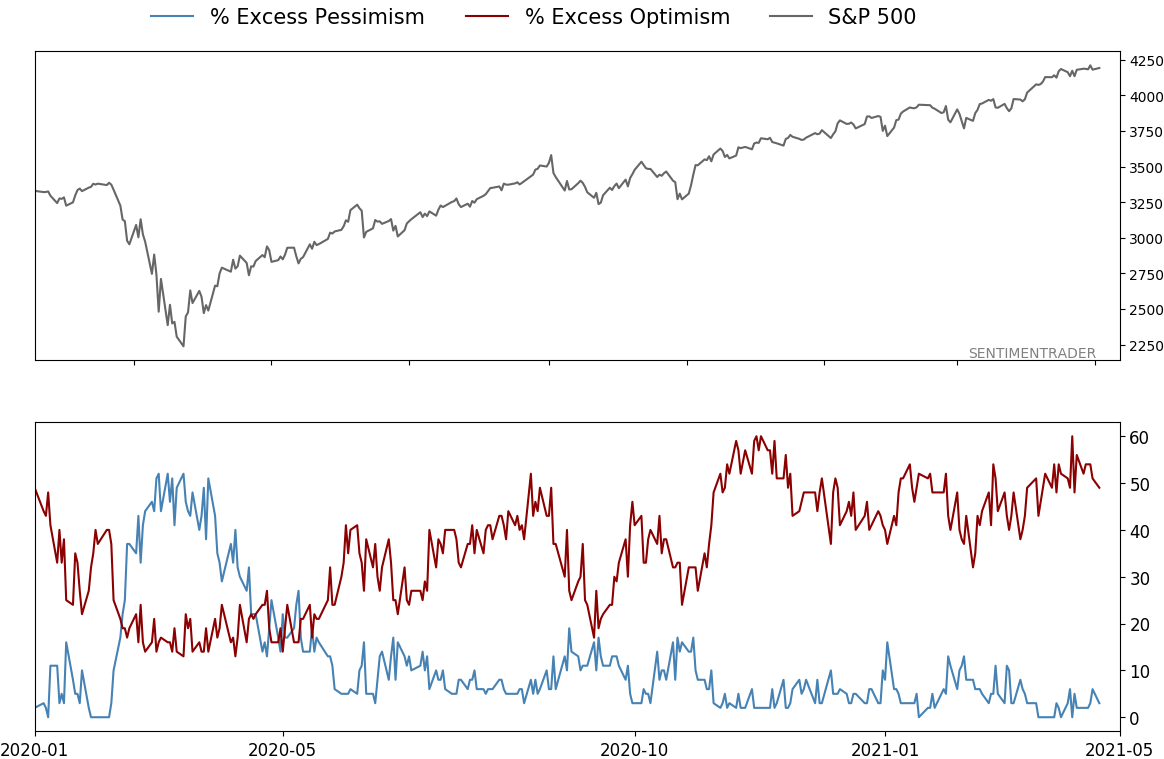
The extreme speculation registered in January and February is starting to get wrung out. Internal dynamics have mostly held up, so a return to neutral sentiment conditions would improve the forward risk/reward profile substantially. We're still a ways off from that. BONDS: Weak buy
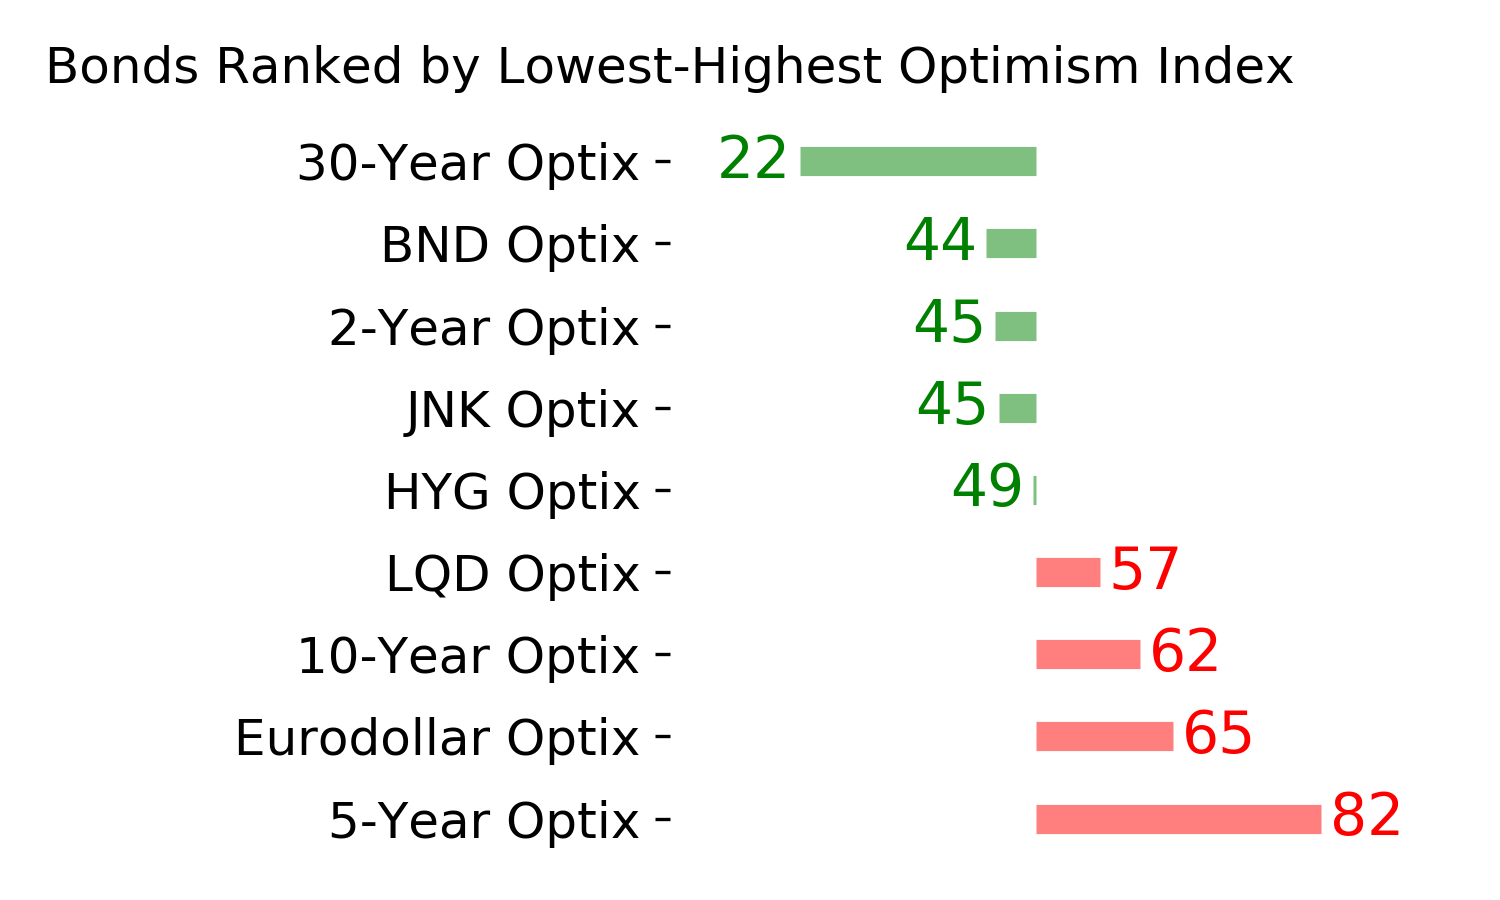
Various parts of the market have been hit in recent weeks, with mild oversold conditions. The Bond Optimism Index is now about as low as it gets during healthy bond market environments. Fixed income isn't responding well, so that needs to be monitored in case it's transitioning to a longer-term negative market environment. GOLD: Weak buy
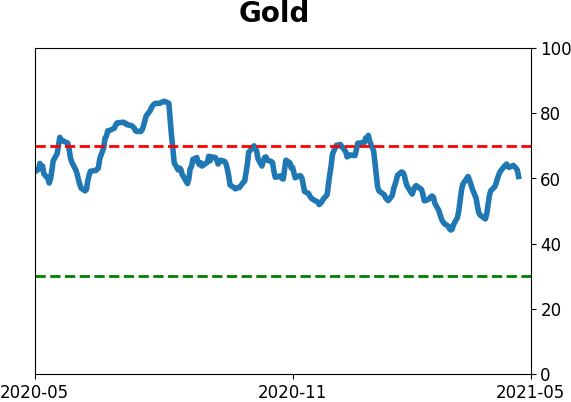
A dollar trying to rebound from a severe short position has weighed on gold and miners. The types of signals they've given in recent weeks, within the context of their recent surge, have usually resulted in higher prices over a medium- to long-term time frame. Like bonds, gold and miners aren't responding very well, and this needs to be monitored.
|
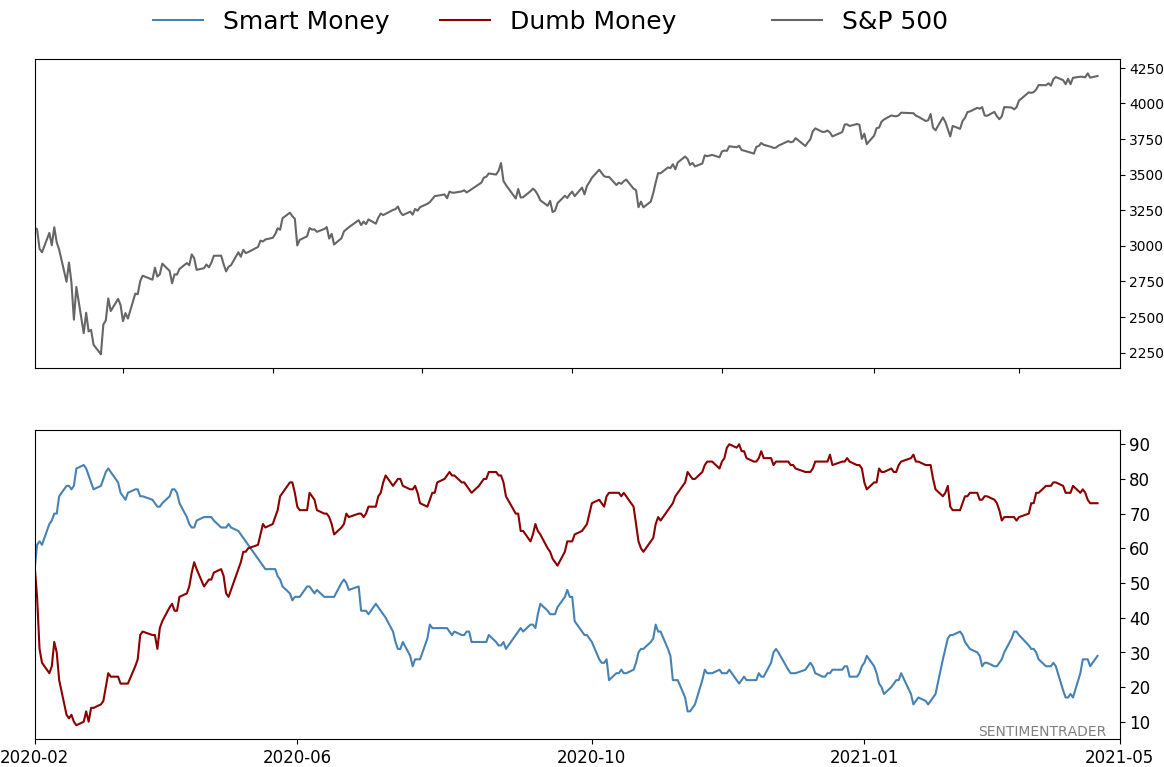
Smart / Dumb Money Confidence
|
Smart Money Confidence: 29%
Dumb Money Confidence: 73%
|
|
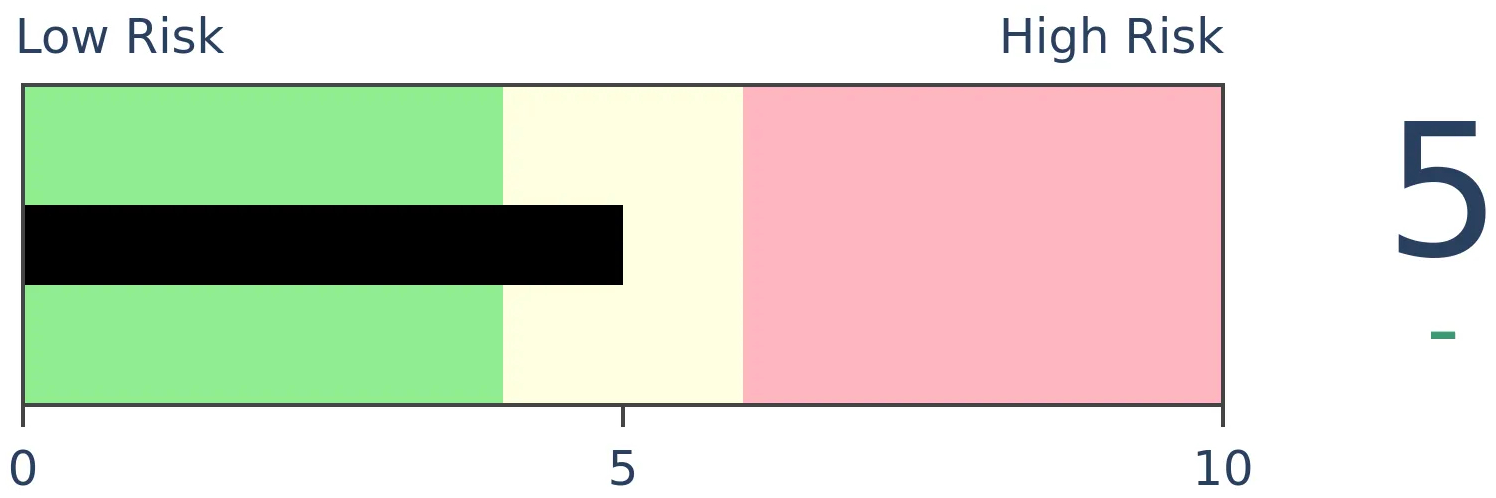
Risk Levels
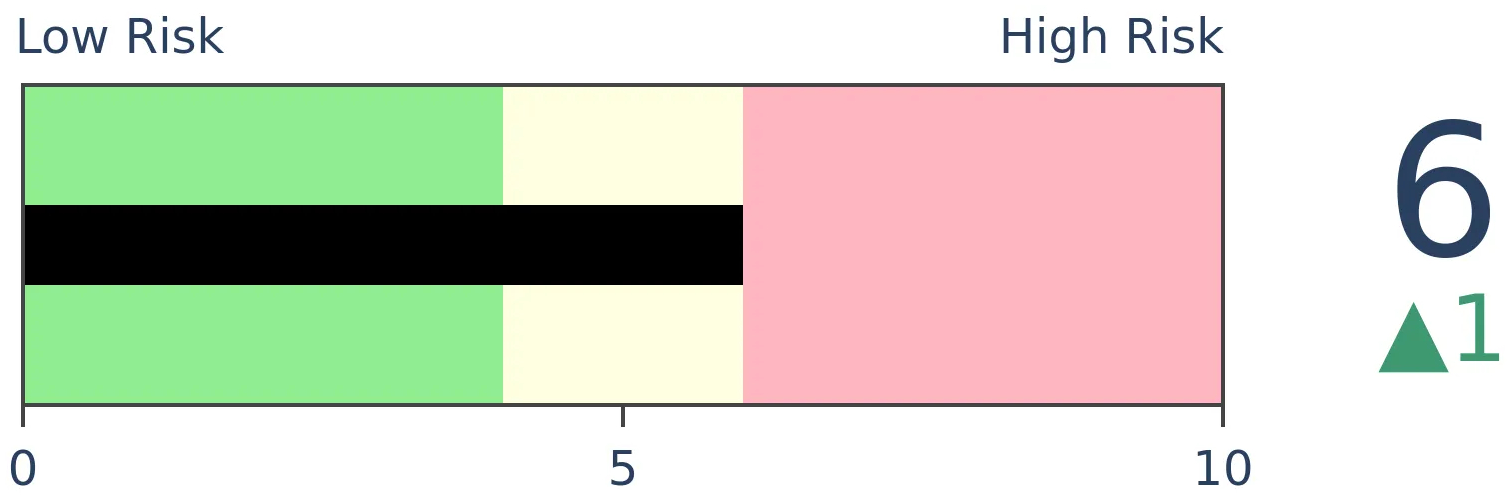
Stocks Short-Term
|
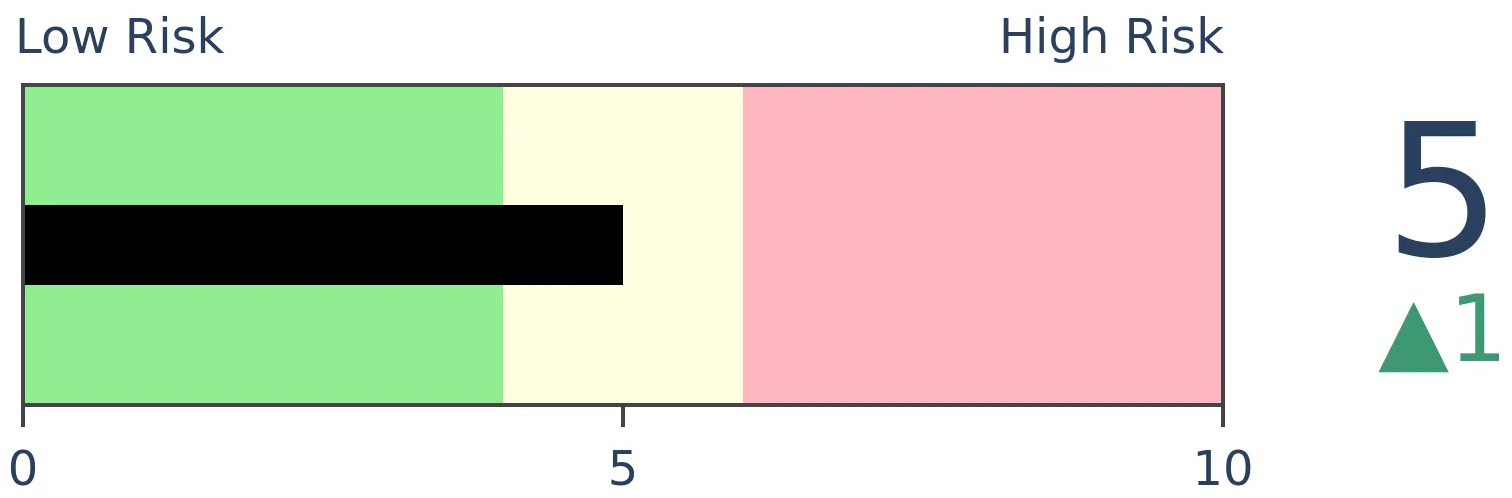
Stocks Medium-Term
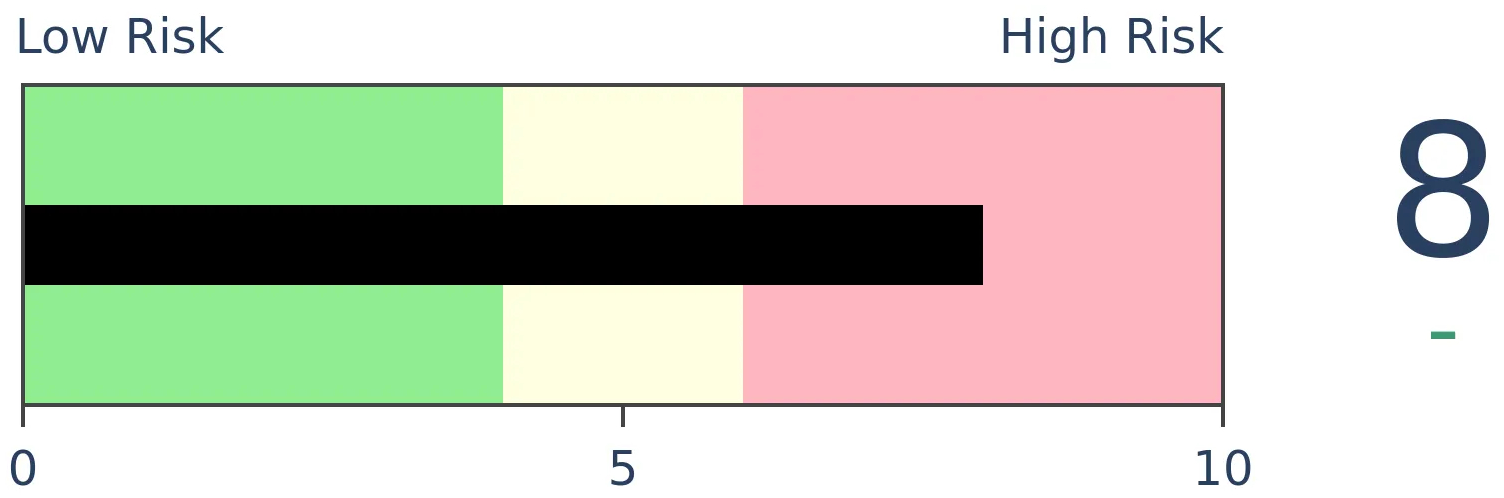
|
|
Bonds
|
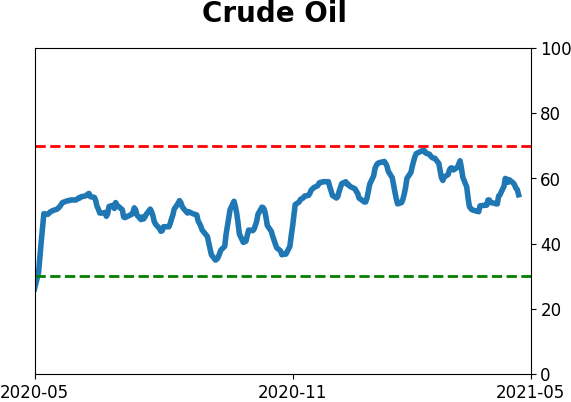
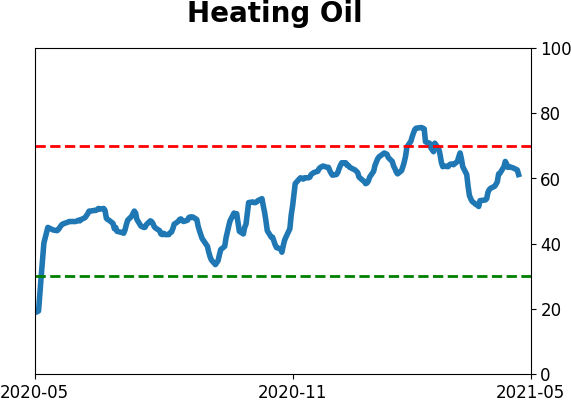
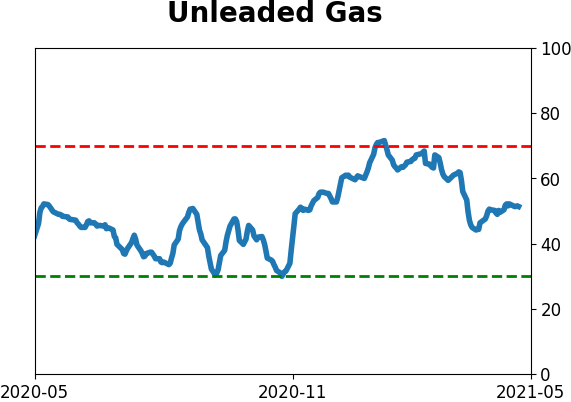
Crude Oil

|
|
Gold
|
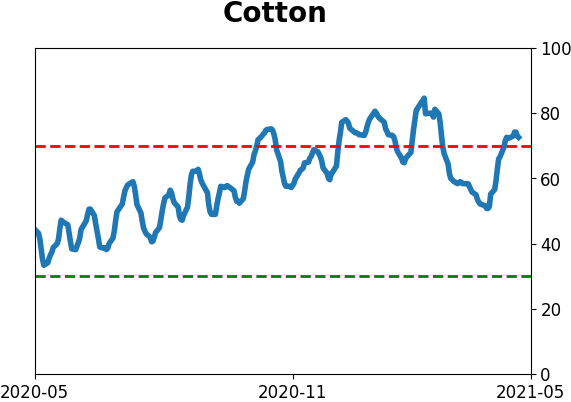
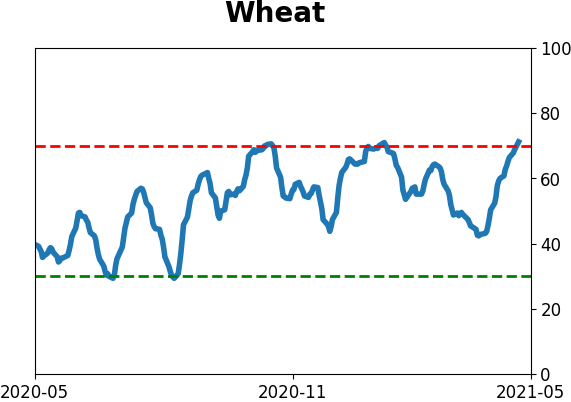
Agriculture
|
|
Research
BOTTOM LINE
The Dow Jones Transportation Average has suffered no weekly losses for the past 13 weeks, a 120-year record. It has tended to be a better signal for Industrial stocks than Transportation stocks going forward.
FORECAST / TIMEFRAME
None
|
Even in a market that can't seem to go down for more than a couple of days, one index stands out. Among all major indexes and sectors, few can match the persistence of stocks that haul stuff.
A RECORD STREAK WITH NO LOSSES
The Dow Jones Transportation Average just completed its 13th straight week with a gain. None of them were tremendous, but the persistence is incredible.
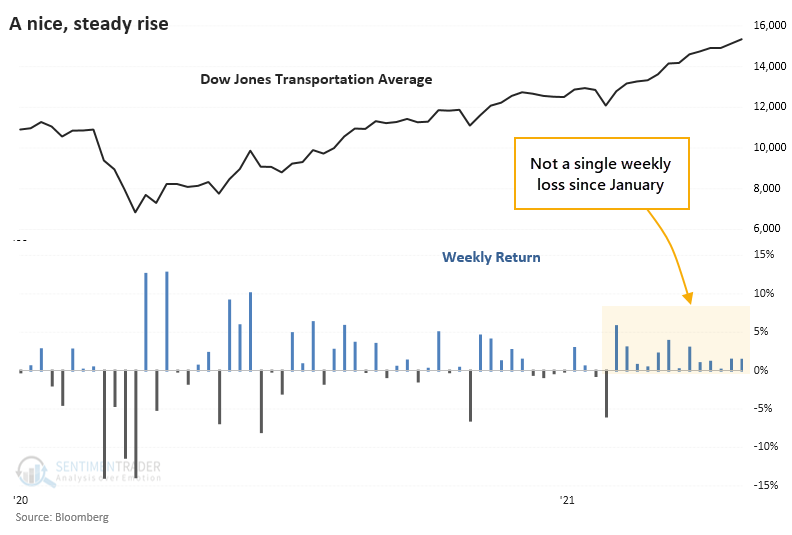
The Transports set a 122-year record for weekly persistence a couple of weeks ago. Last week just added to the gains.
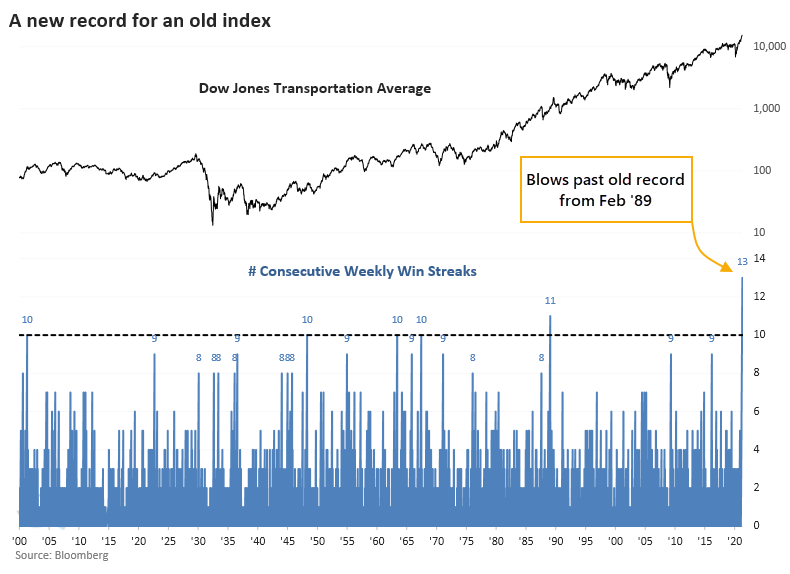
There weren't many streaks of 10 weeks of gains or longer, only 5 others when the index was trading at a 52-week high. So we're dealing with a tiny sample size and all the challenges it brings with it if trying to form any conclusion.
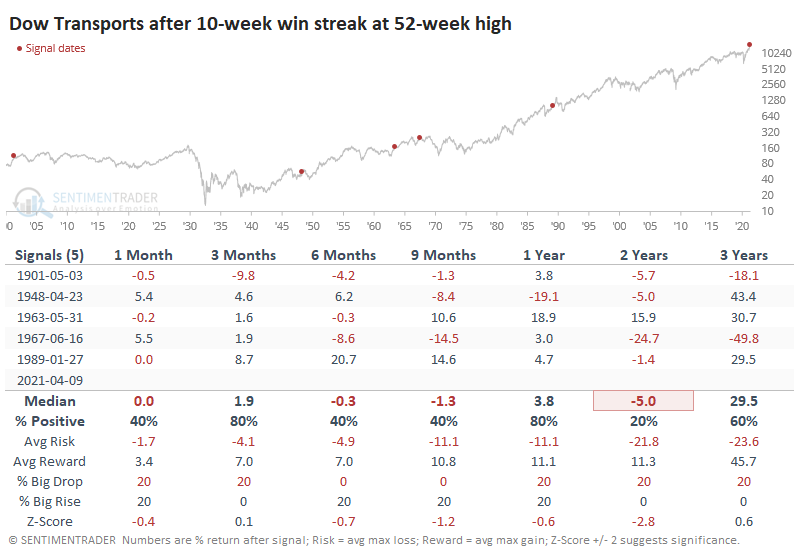
WHAT LONG STREAKS MEANT FOR FUTURE RETURNS
The handful of times Transports managed to do this, forward returns were sketchy over the next 6-24 months. Only 1 out of the 5 other signals managed to show a profit even 2 years later.
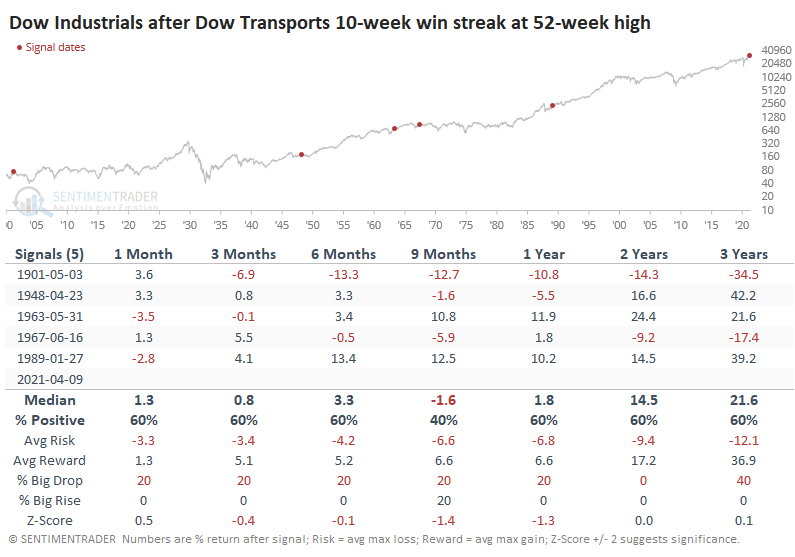
Presumably, such a run in stocks that should benefit from a strong economy should also be good for Industrial stocks. Indeed, the Dow Industrials performed better than Transports did after these signals.
In terms of sectors and factors, Industrials were not the strongest performers.
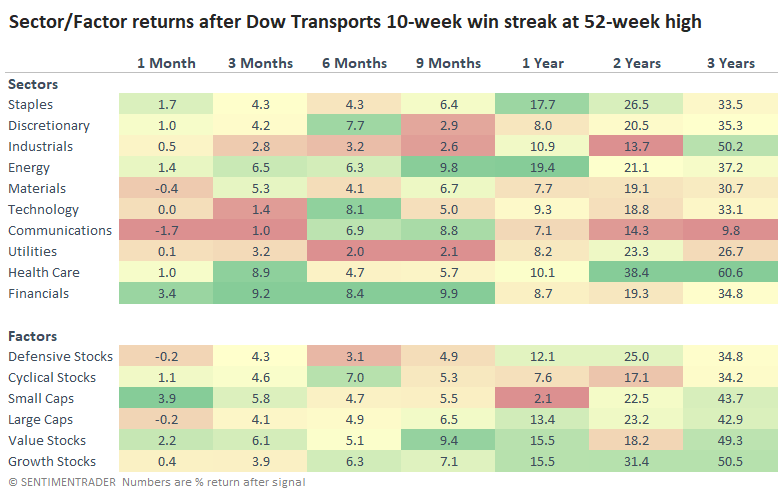
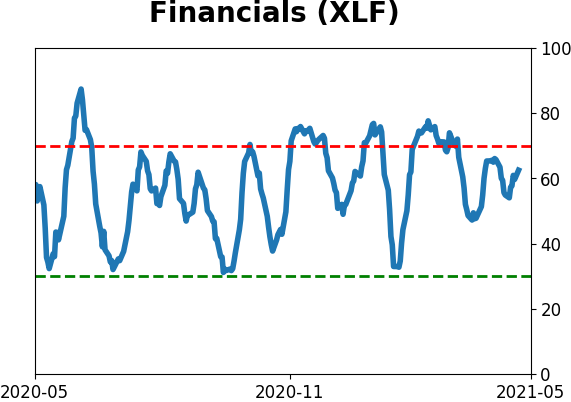
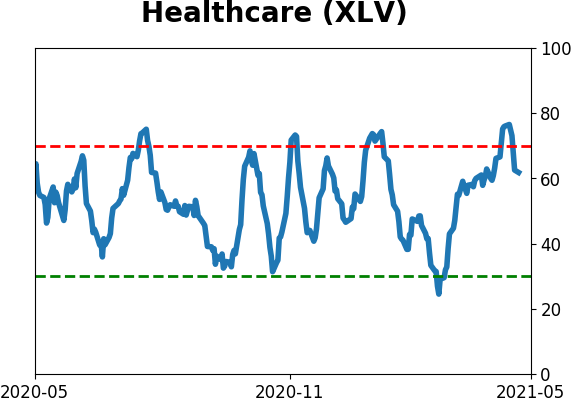
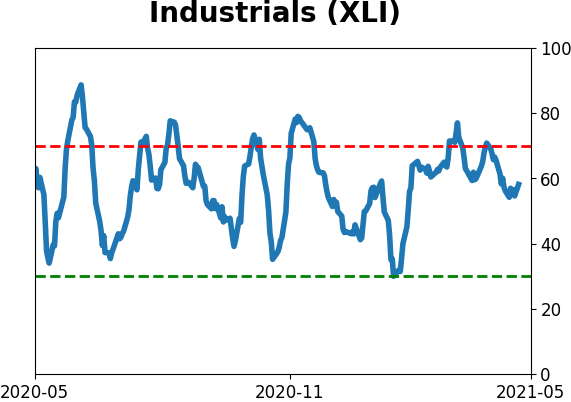
Health Care and Financial stocks had the best returns overall, followed by Staples and Energy. The laggards were Communications, Utilities, and Industrials.
Among factors, Growth stocks tended to show the strongest returns across time frames, though Value wasn't too far behind on most of them or even exceeded the returns on shorter time frames. The other factors also see-sawed on performance depending on the time frame, with Defensive and Large-Cap stocks doing best over the next 1-2 years.
It's tough to put too much weight on something that's happened only a handful of times in 120 years. Perhaps the biggest takeaway would be that Transports seem unlikely to continue to run like this much longer and would likely underperform other indexes and sectors. For the months ahead, it should be a relatively good sign for Value stocks.
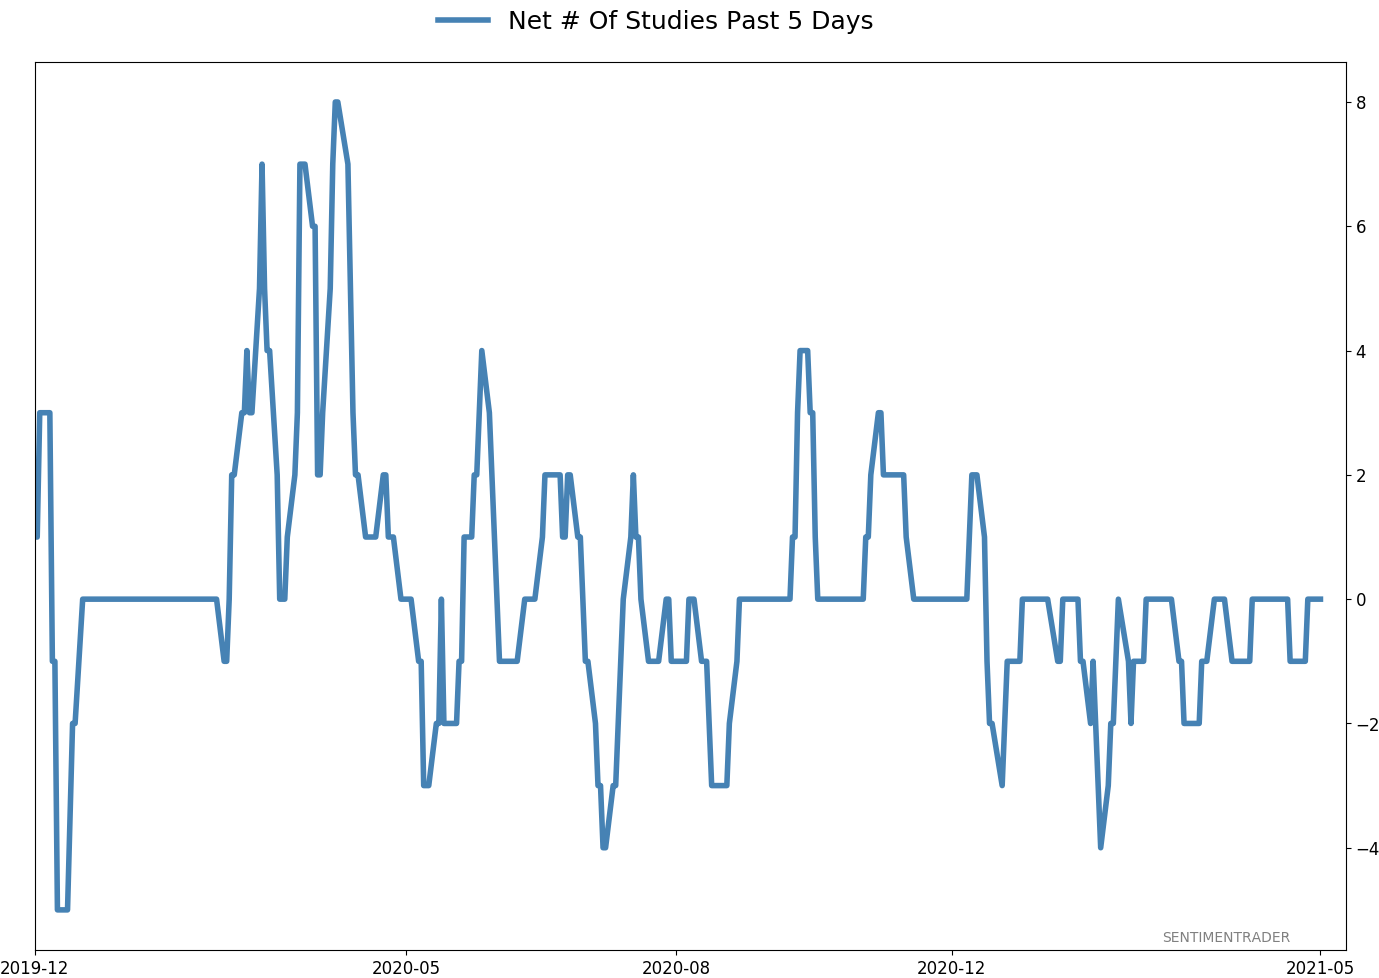
Active Studies
| Time Frame | Bullish | Bearish | | Short-Term | 0 | 0 | | Medium-Term | 0 | 11 | | Long-Term | 11 | 4 |
|
Indicators at Extremes
Portfolio
| Position | Description | Weight % | Added / Reduced | Date | | Stocks | RSP | 0.0 | Reduced 4.9% | 2021-04-22 | | Bonds | 30.0% BND, 8.8% SCHP | 37.9 | Added 15.1% | 2021-02-18 | | Commodities | GCC | 2.5 | Reduced 2.1%
| 2020-09-04 | | Precious Metals | GDX | 9.8 | Added 0.1% | 2021-02-18 | | Special Situations | 4.3% XLE, 2.2% PSCE | 6.5 | Reduced 5.6% | 2021-04-22 | | Cash | | 43.3 | | |
|
Updates (Changes made today are underlined)
I've made no adjustments for months, as the situation remained essentially stuck - energy was doing what it should, sentiment in the broader market was ridiculously stretched but with no major warning signs, and sentiment toward gold and bonds appeared overdone on the pessimistic side. Those conditions have started to reverse a bit, so I further reduced my risk. There are still no major warning signs, but I'm getting increasingly uncomfortable and would prefer to sit safely in cash and wait for better risk/reward opportunities. RETURN YTD: 7.5% 2020: 8.1%, 2019: 12.6%, 2018: 0.6%, 2017: 3.8%, 2016: 17.1%, 2015: 9.2%, 2014: 14.5%, 2013: 2.2%, 2012: 10.8%, 2011: 16.5%, 2010: 15.3%, 2009: 23.9%, 2008: 16.2%, 2007: 7.8%
|
|
Phase Table
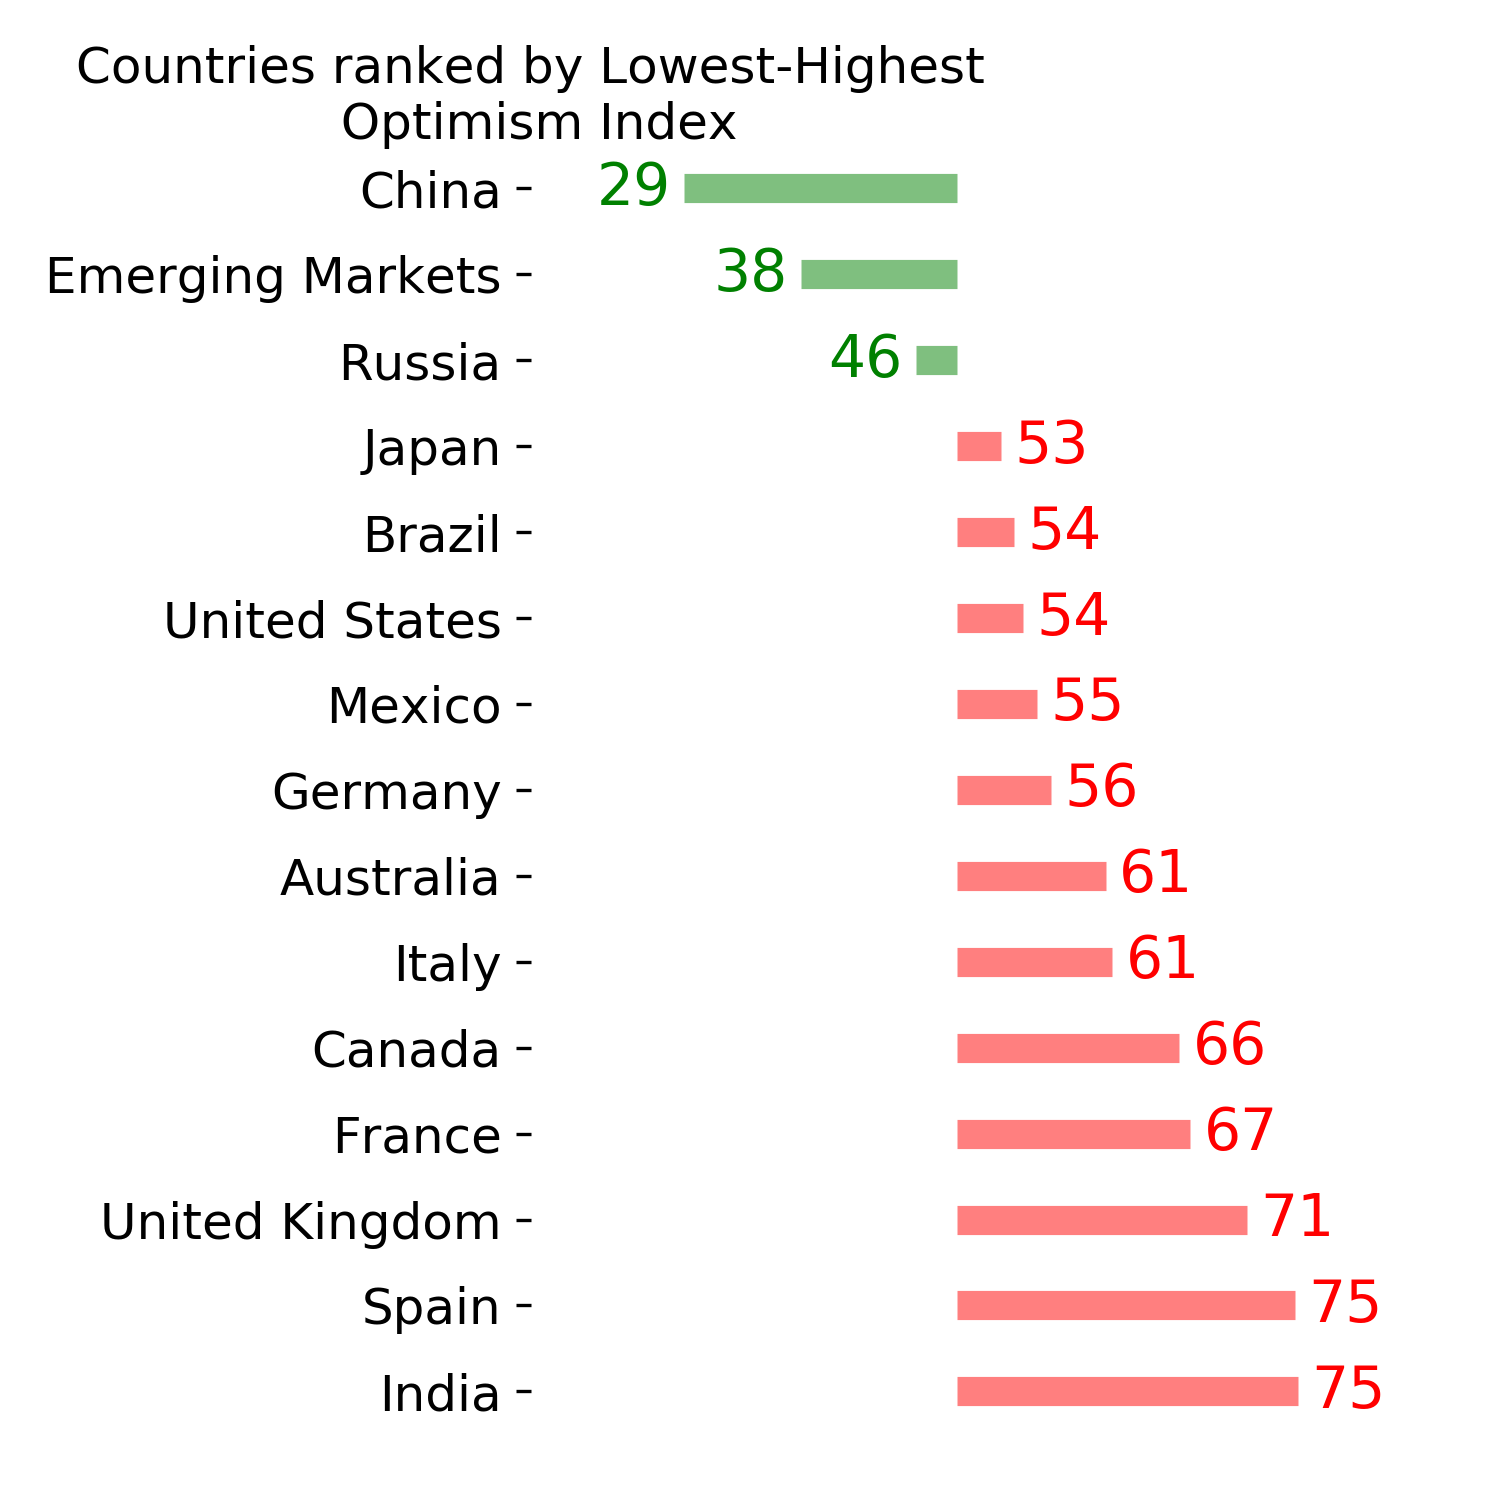
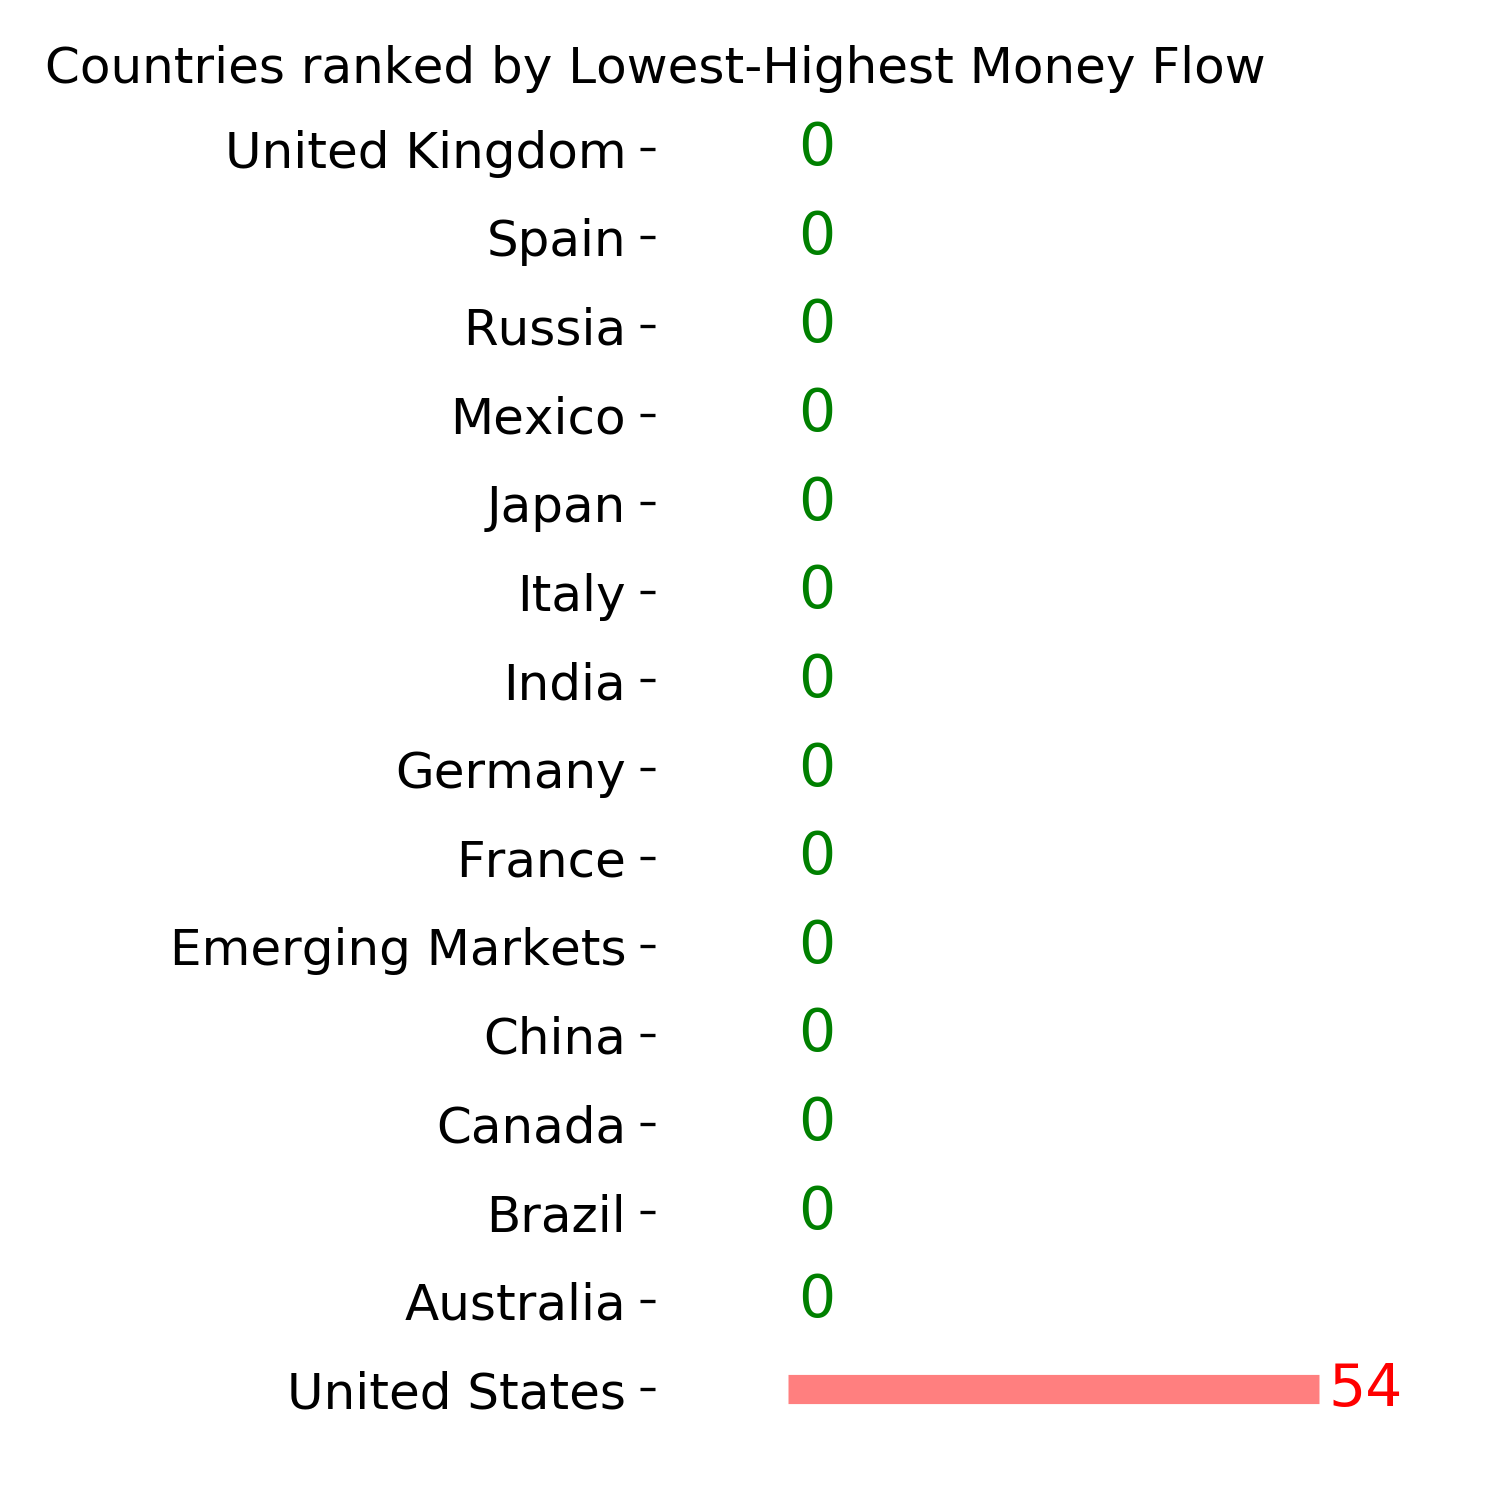
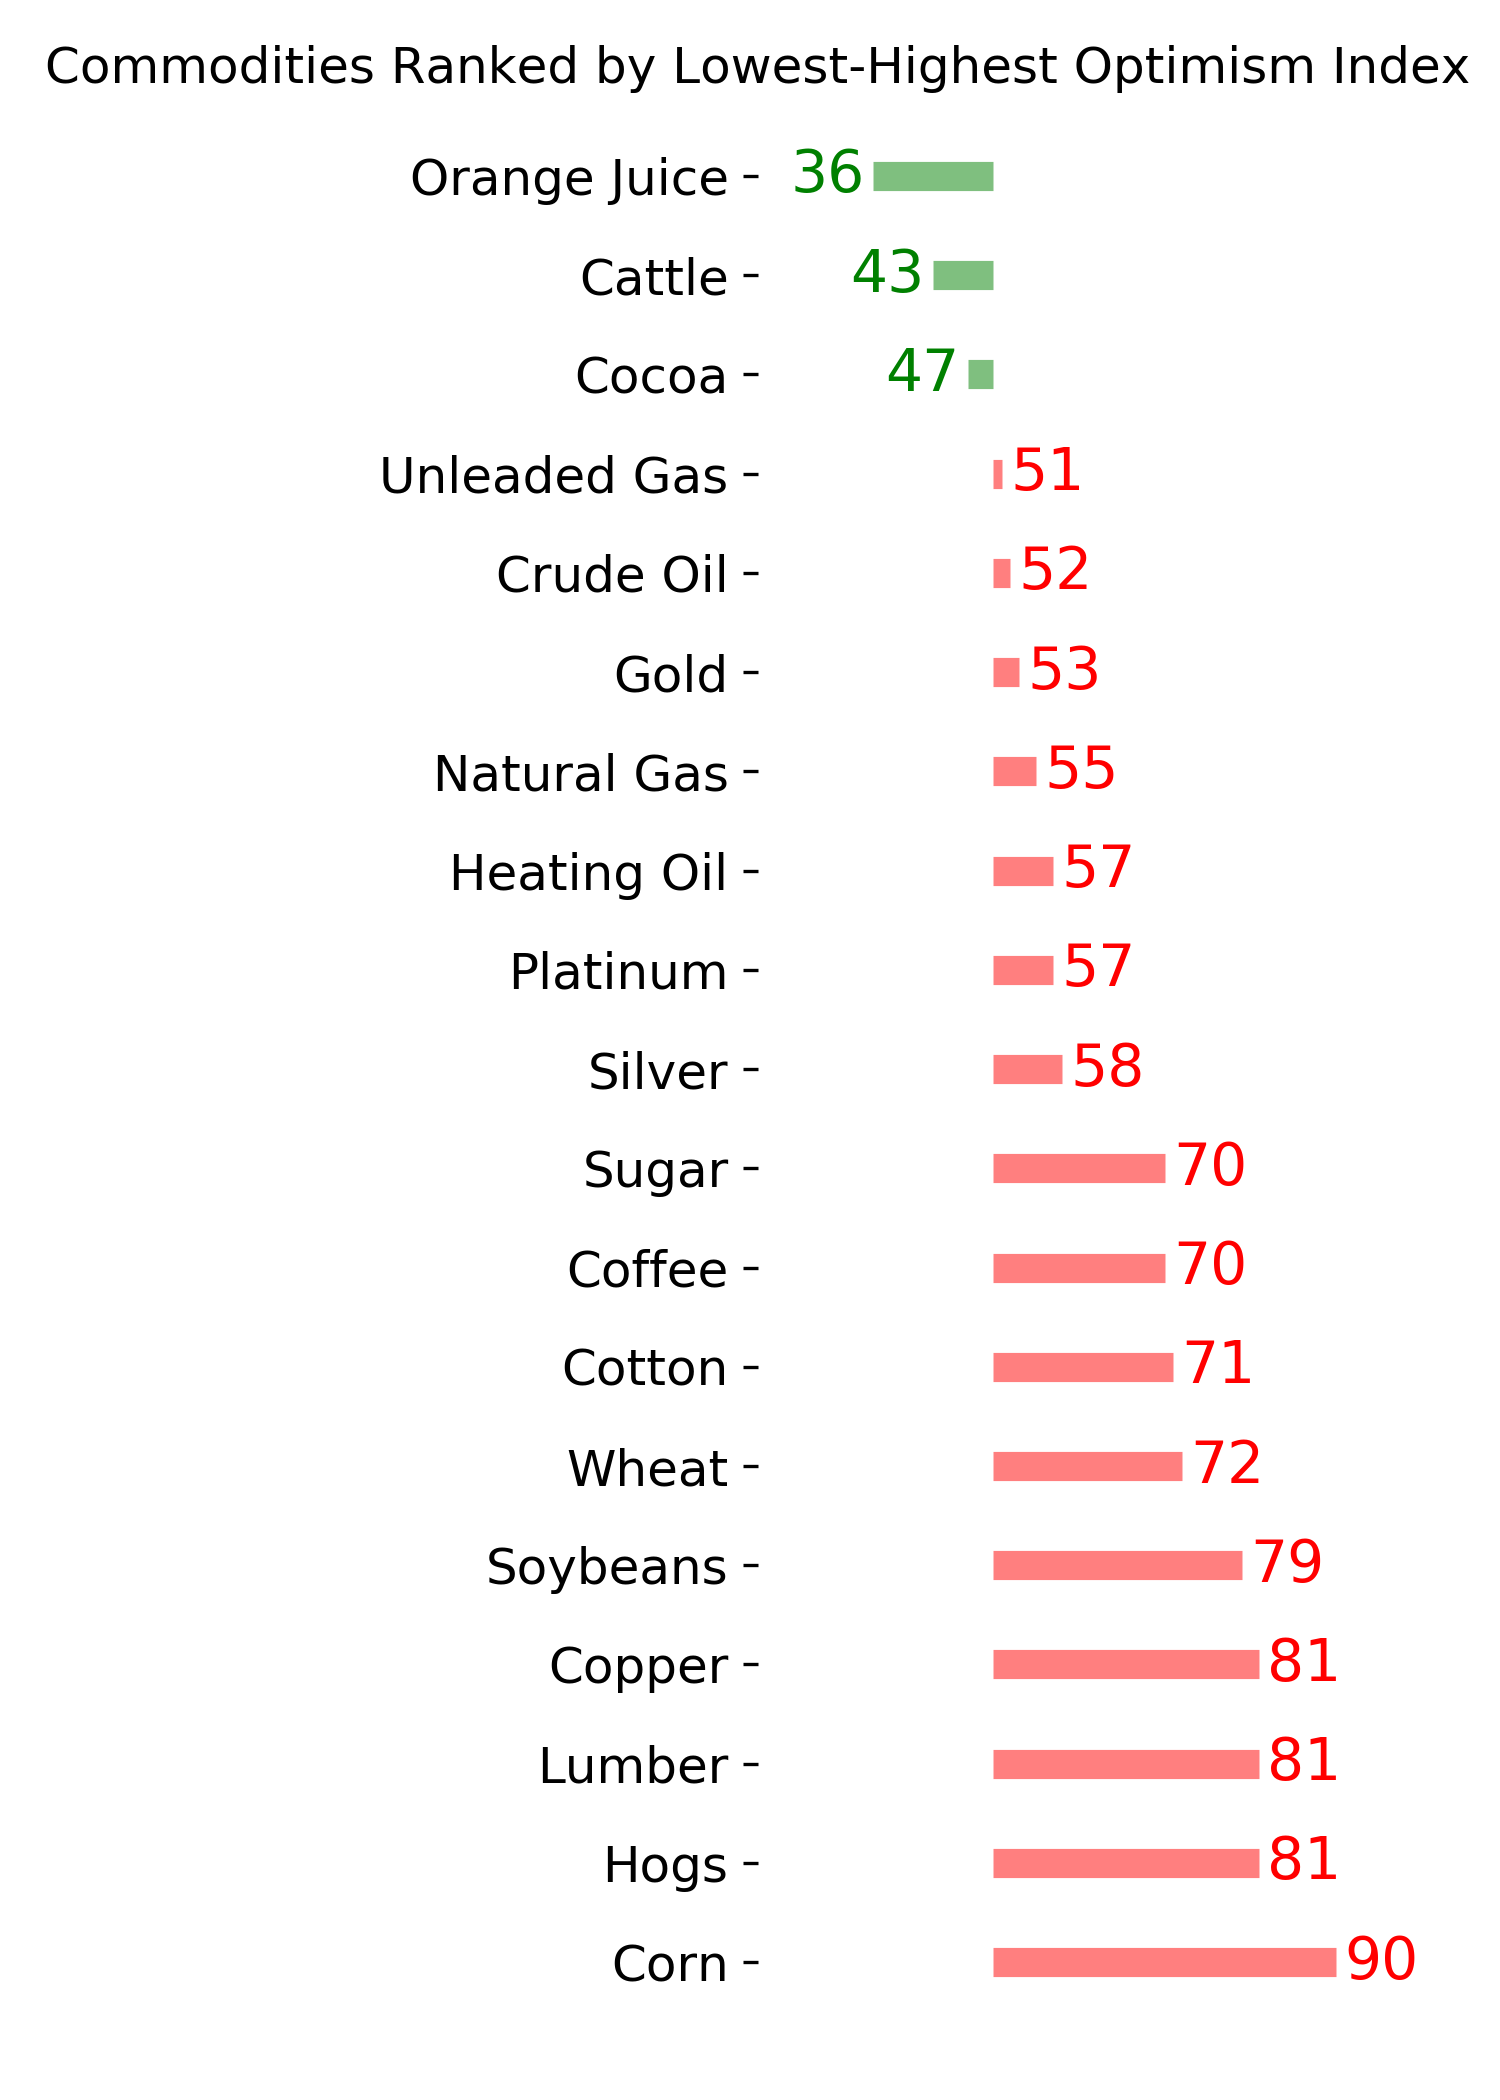
Ranks
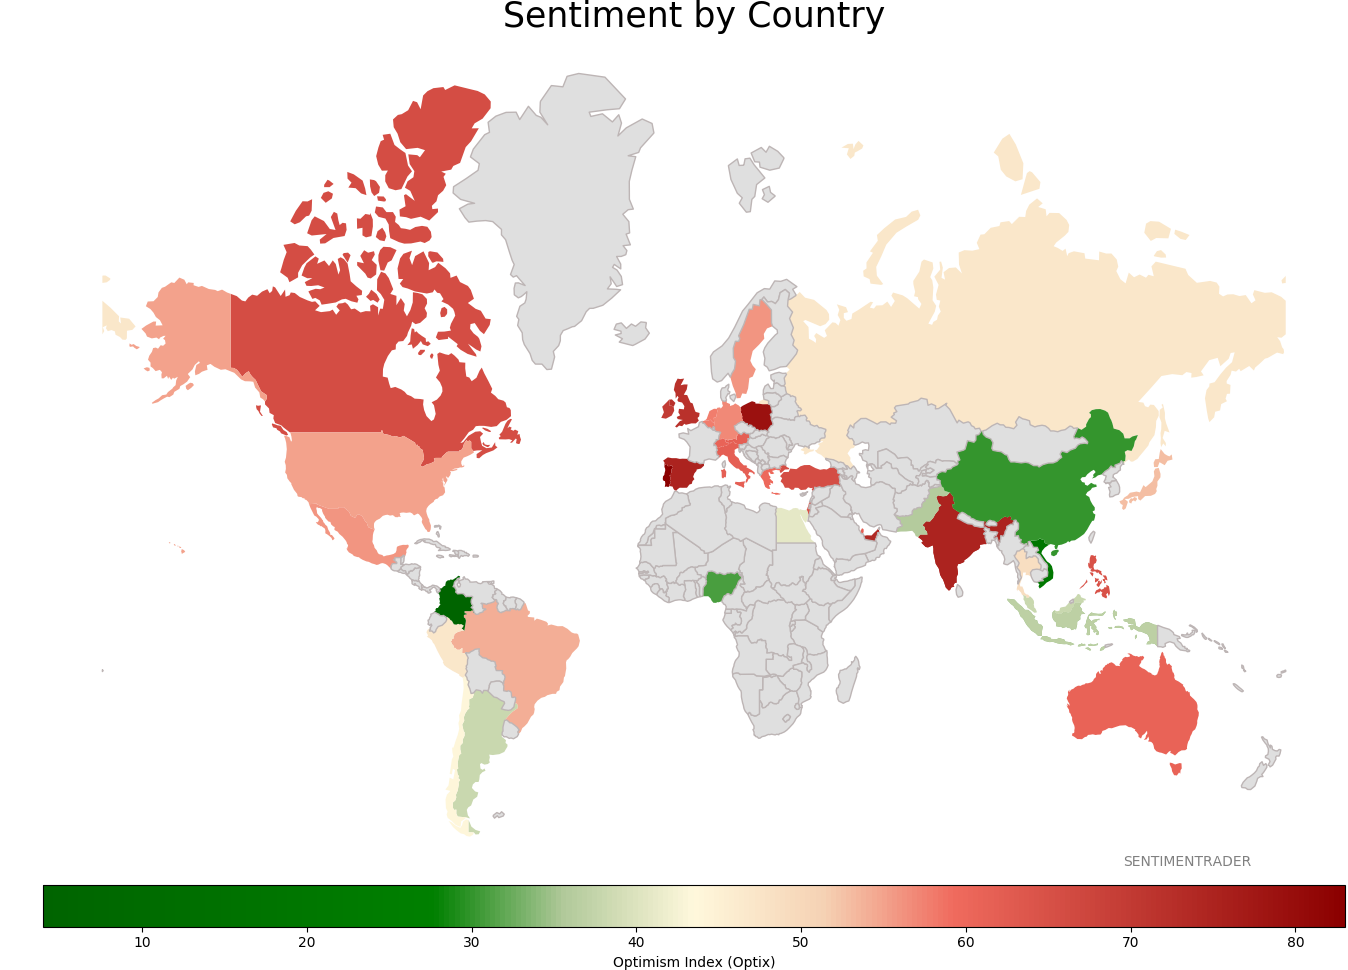
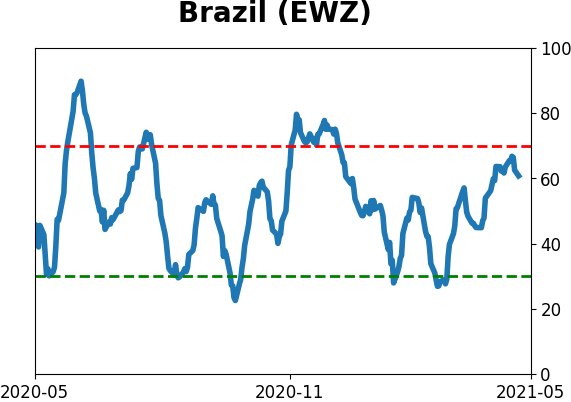
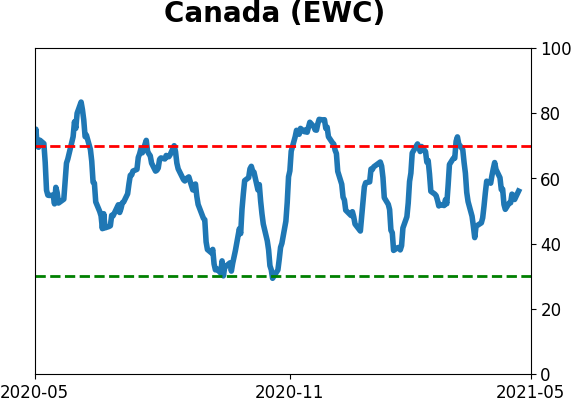
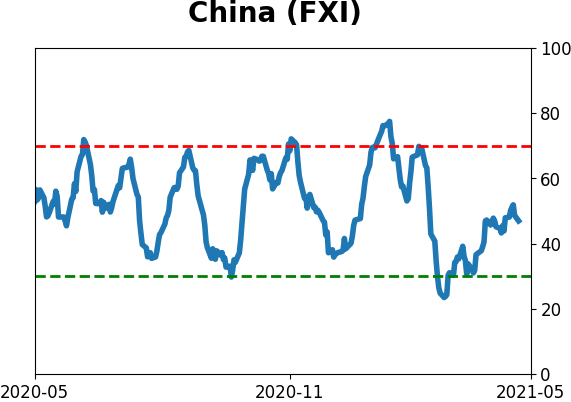
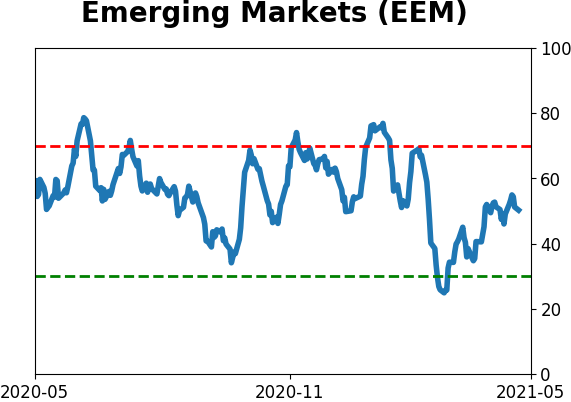
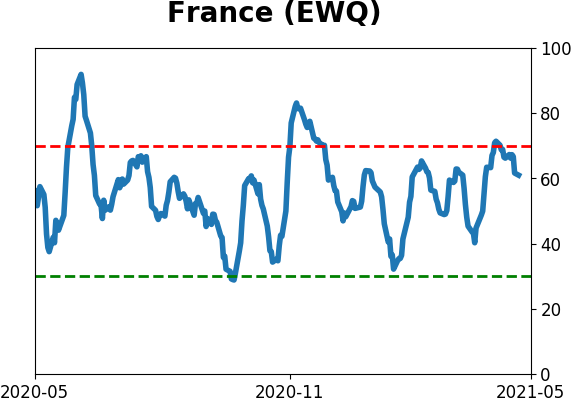
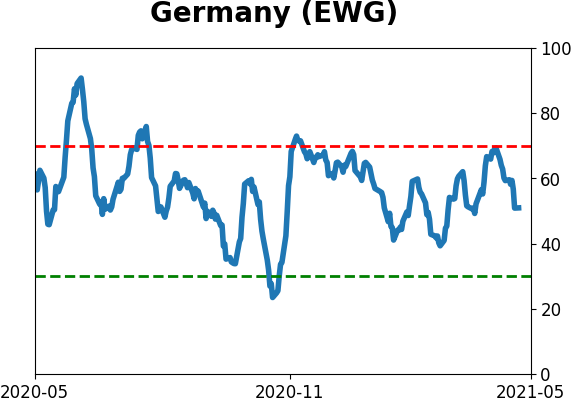
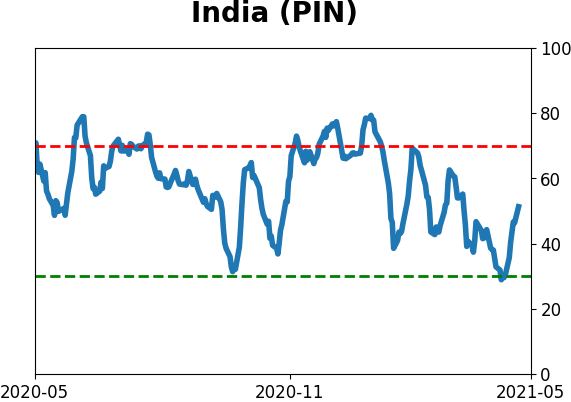
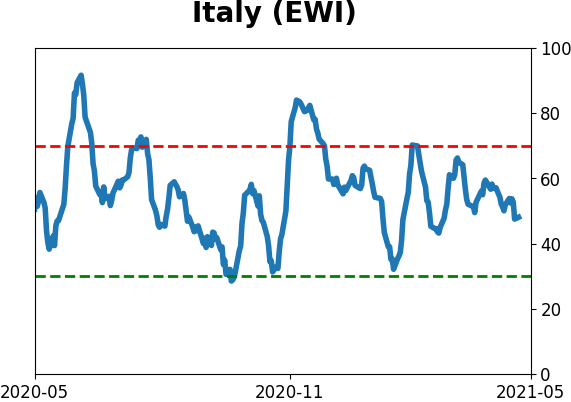
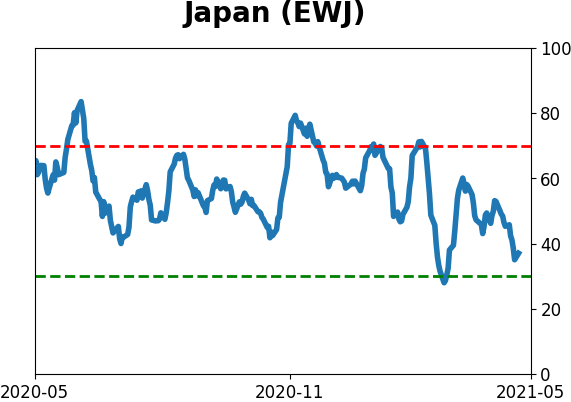
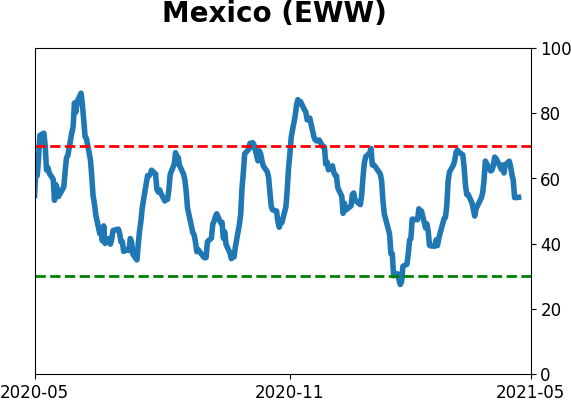
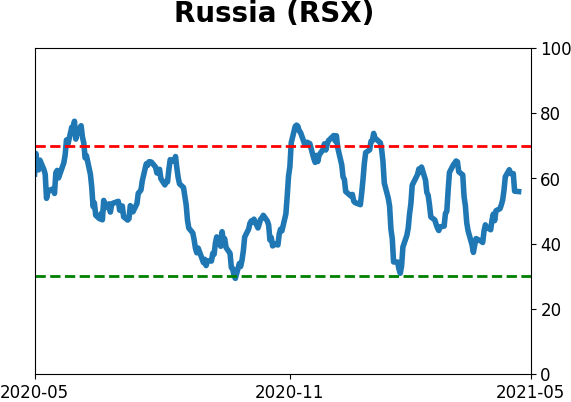
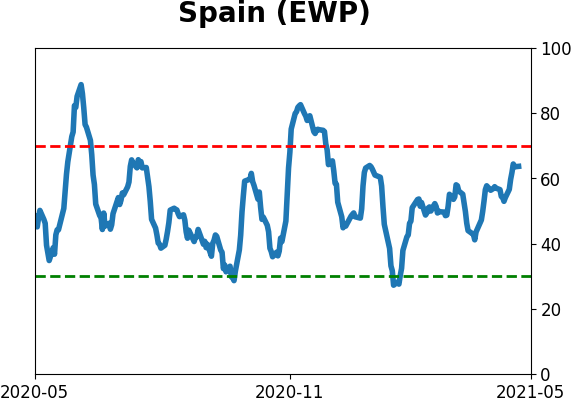
Sentiment Around The World
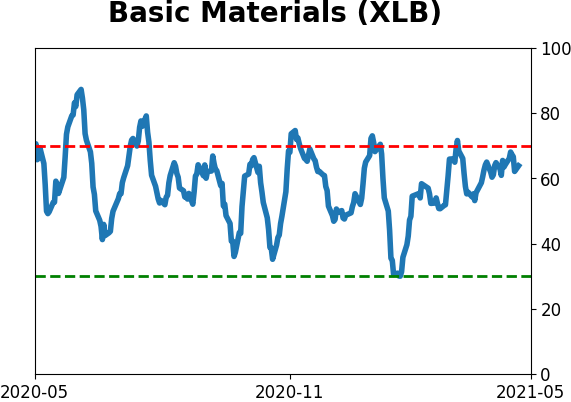
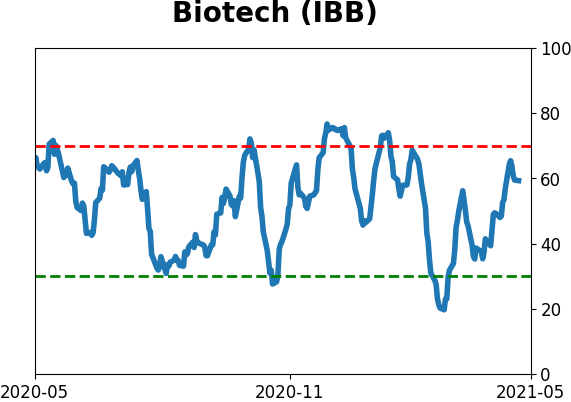
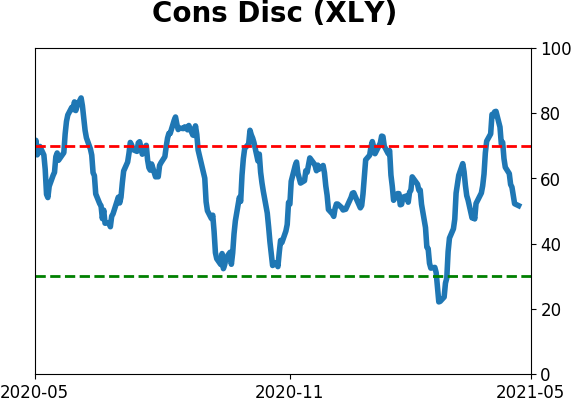
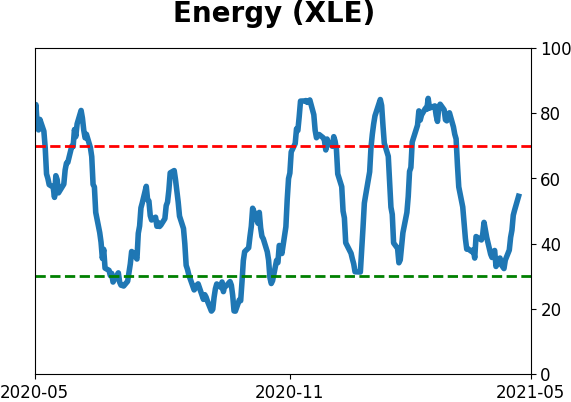
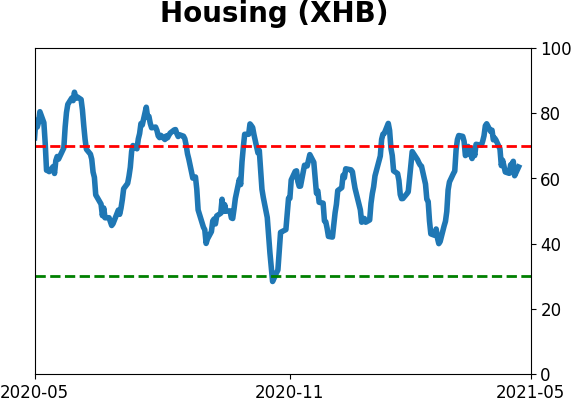
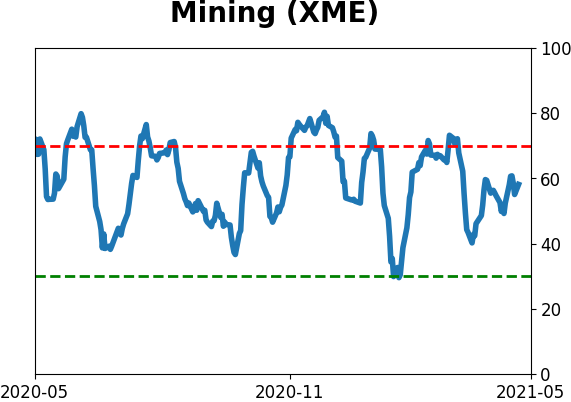
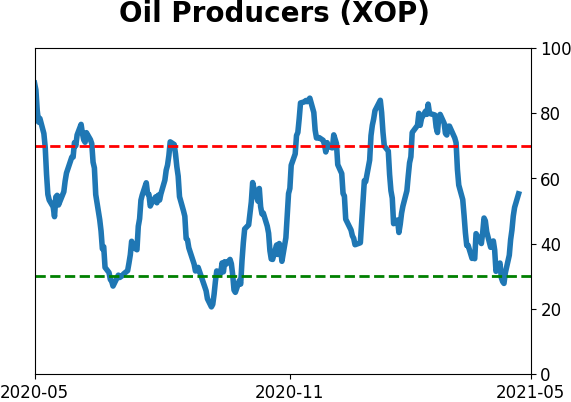
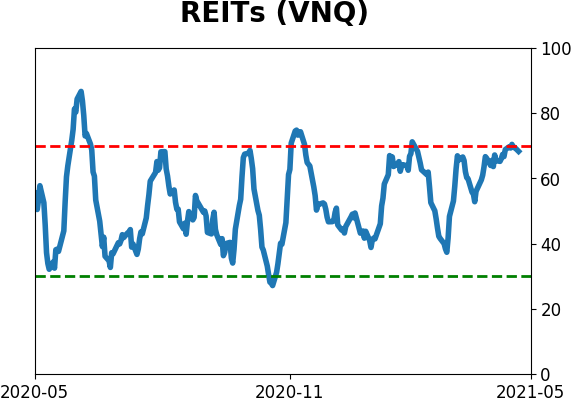
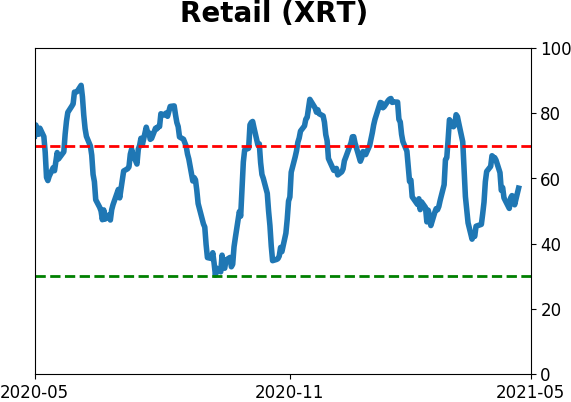
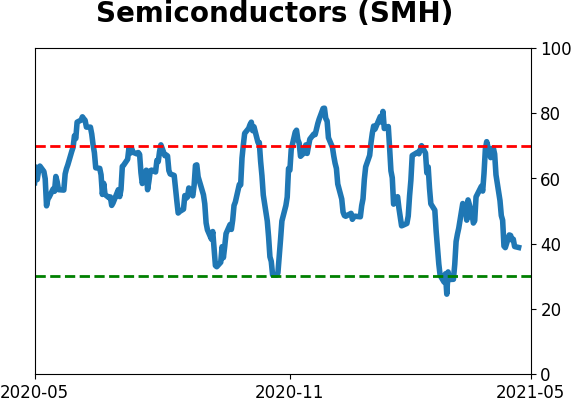
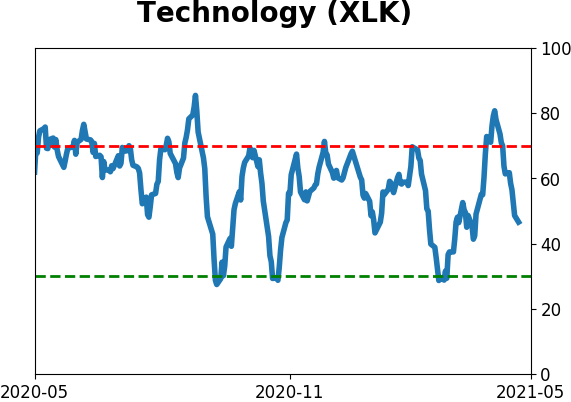
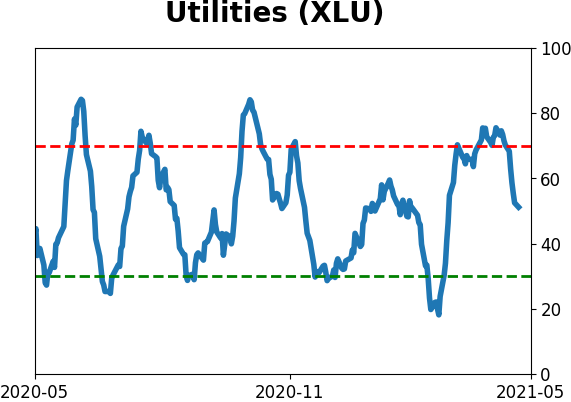
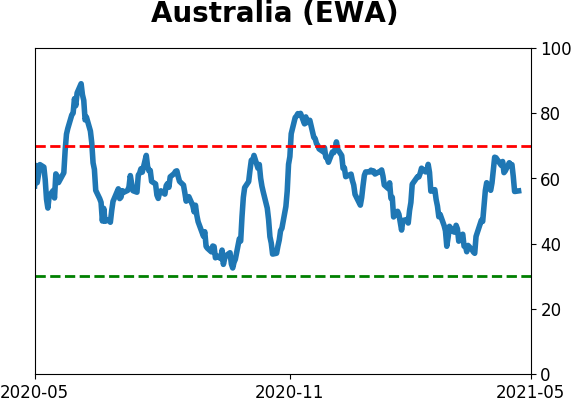
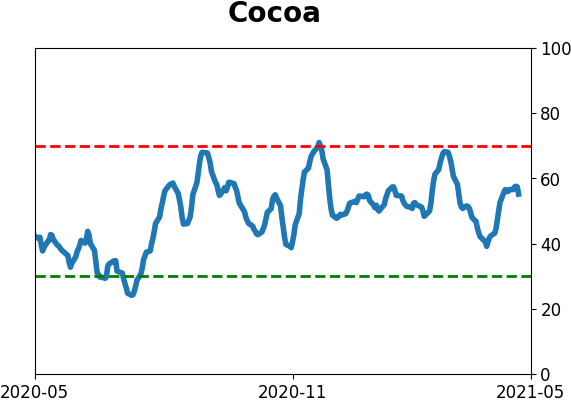
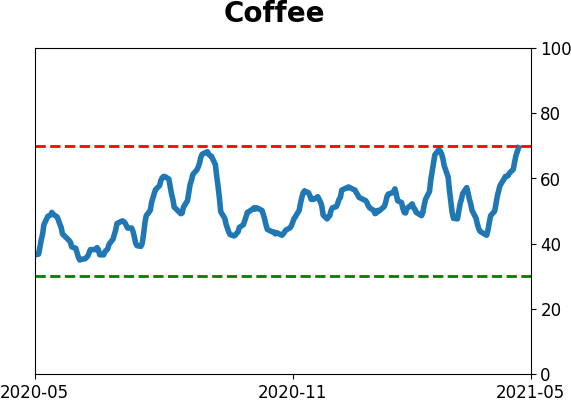
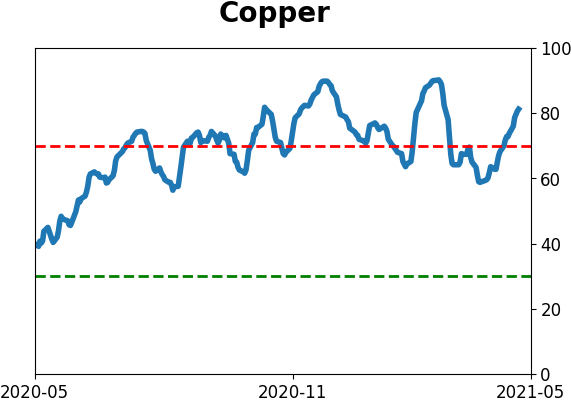
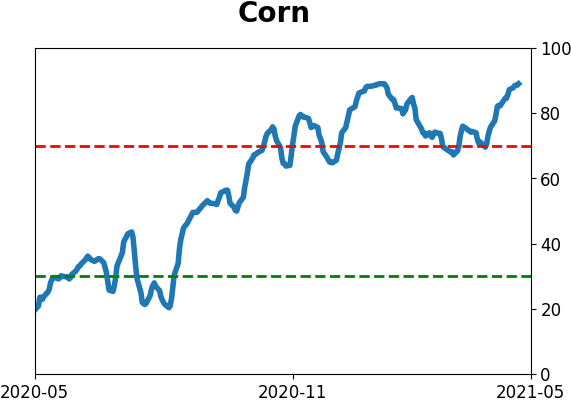
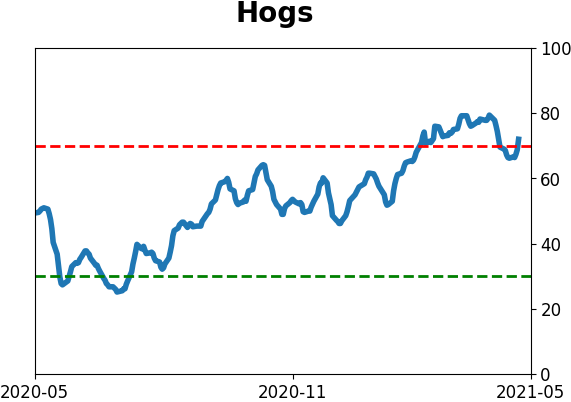
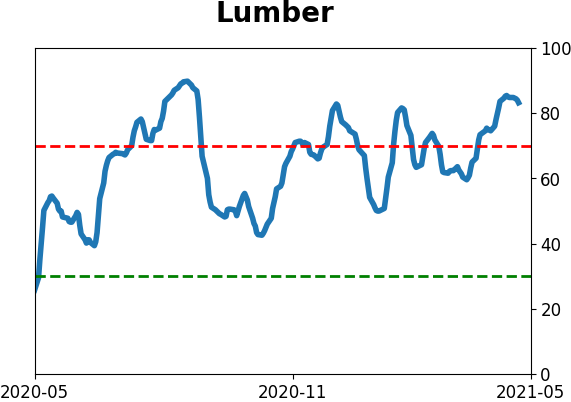
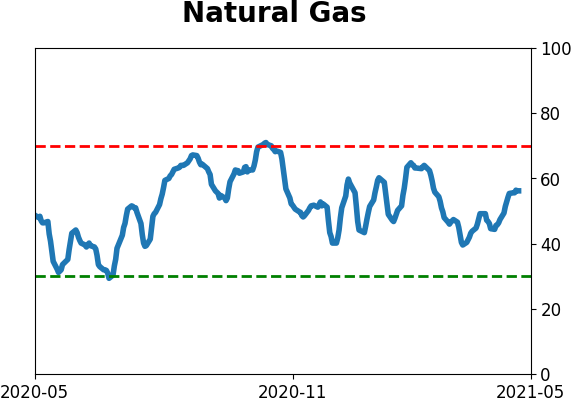
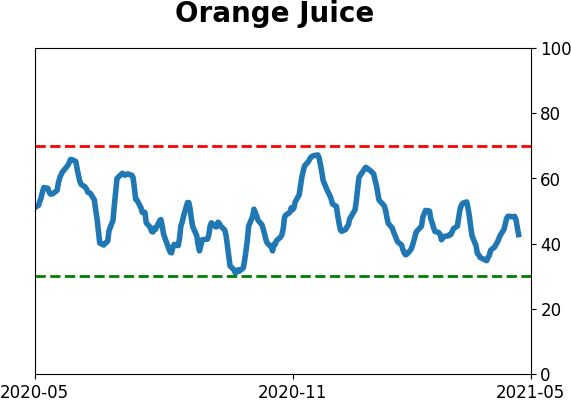
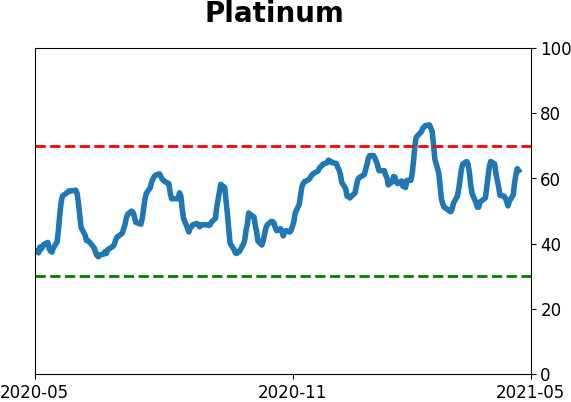
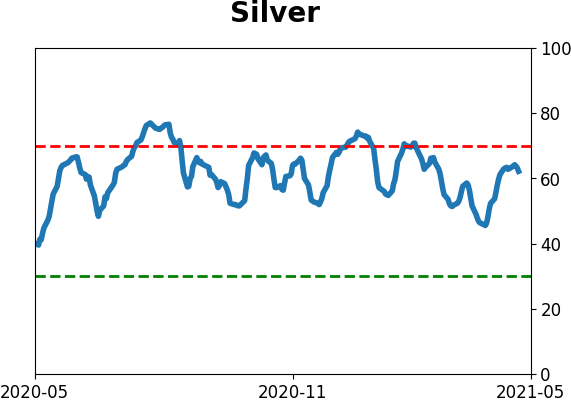
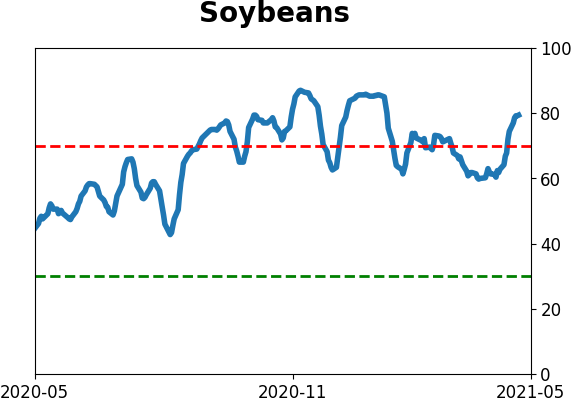
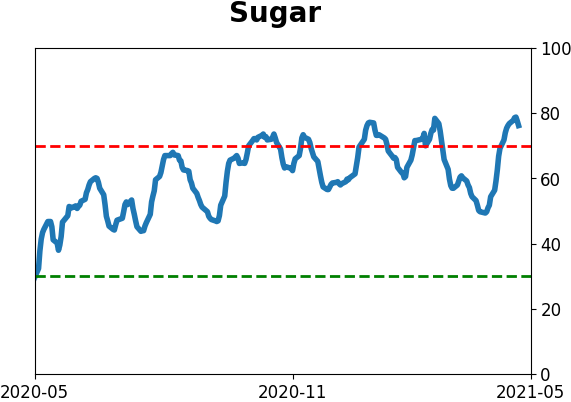
Optimism Index Thumbnails
|
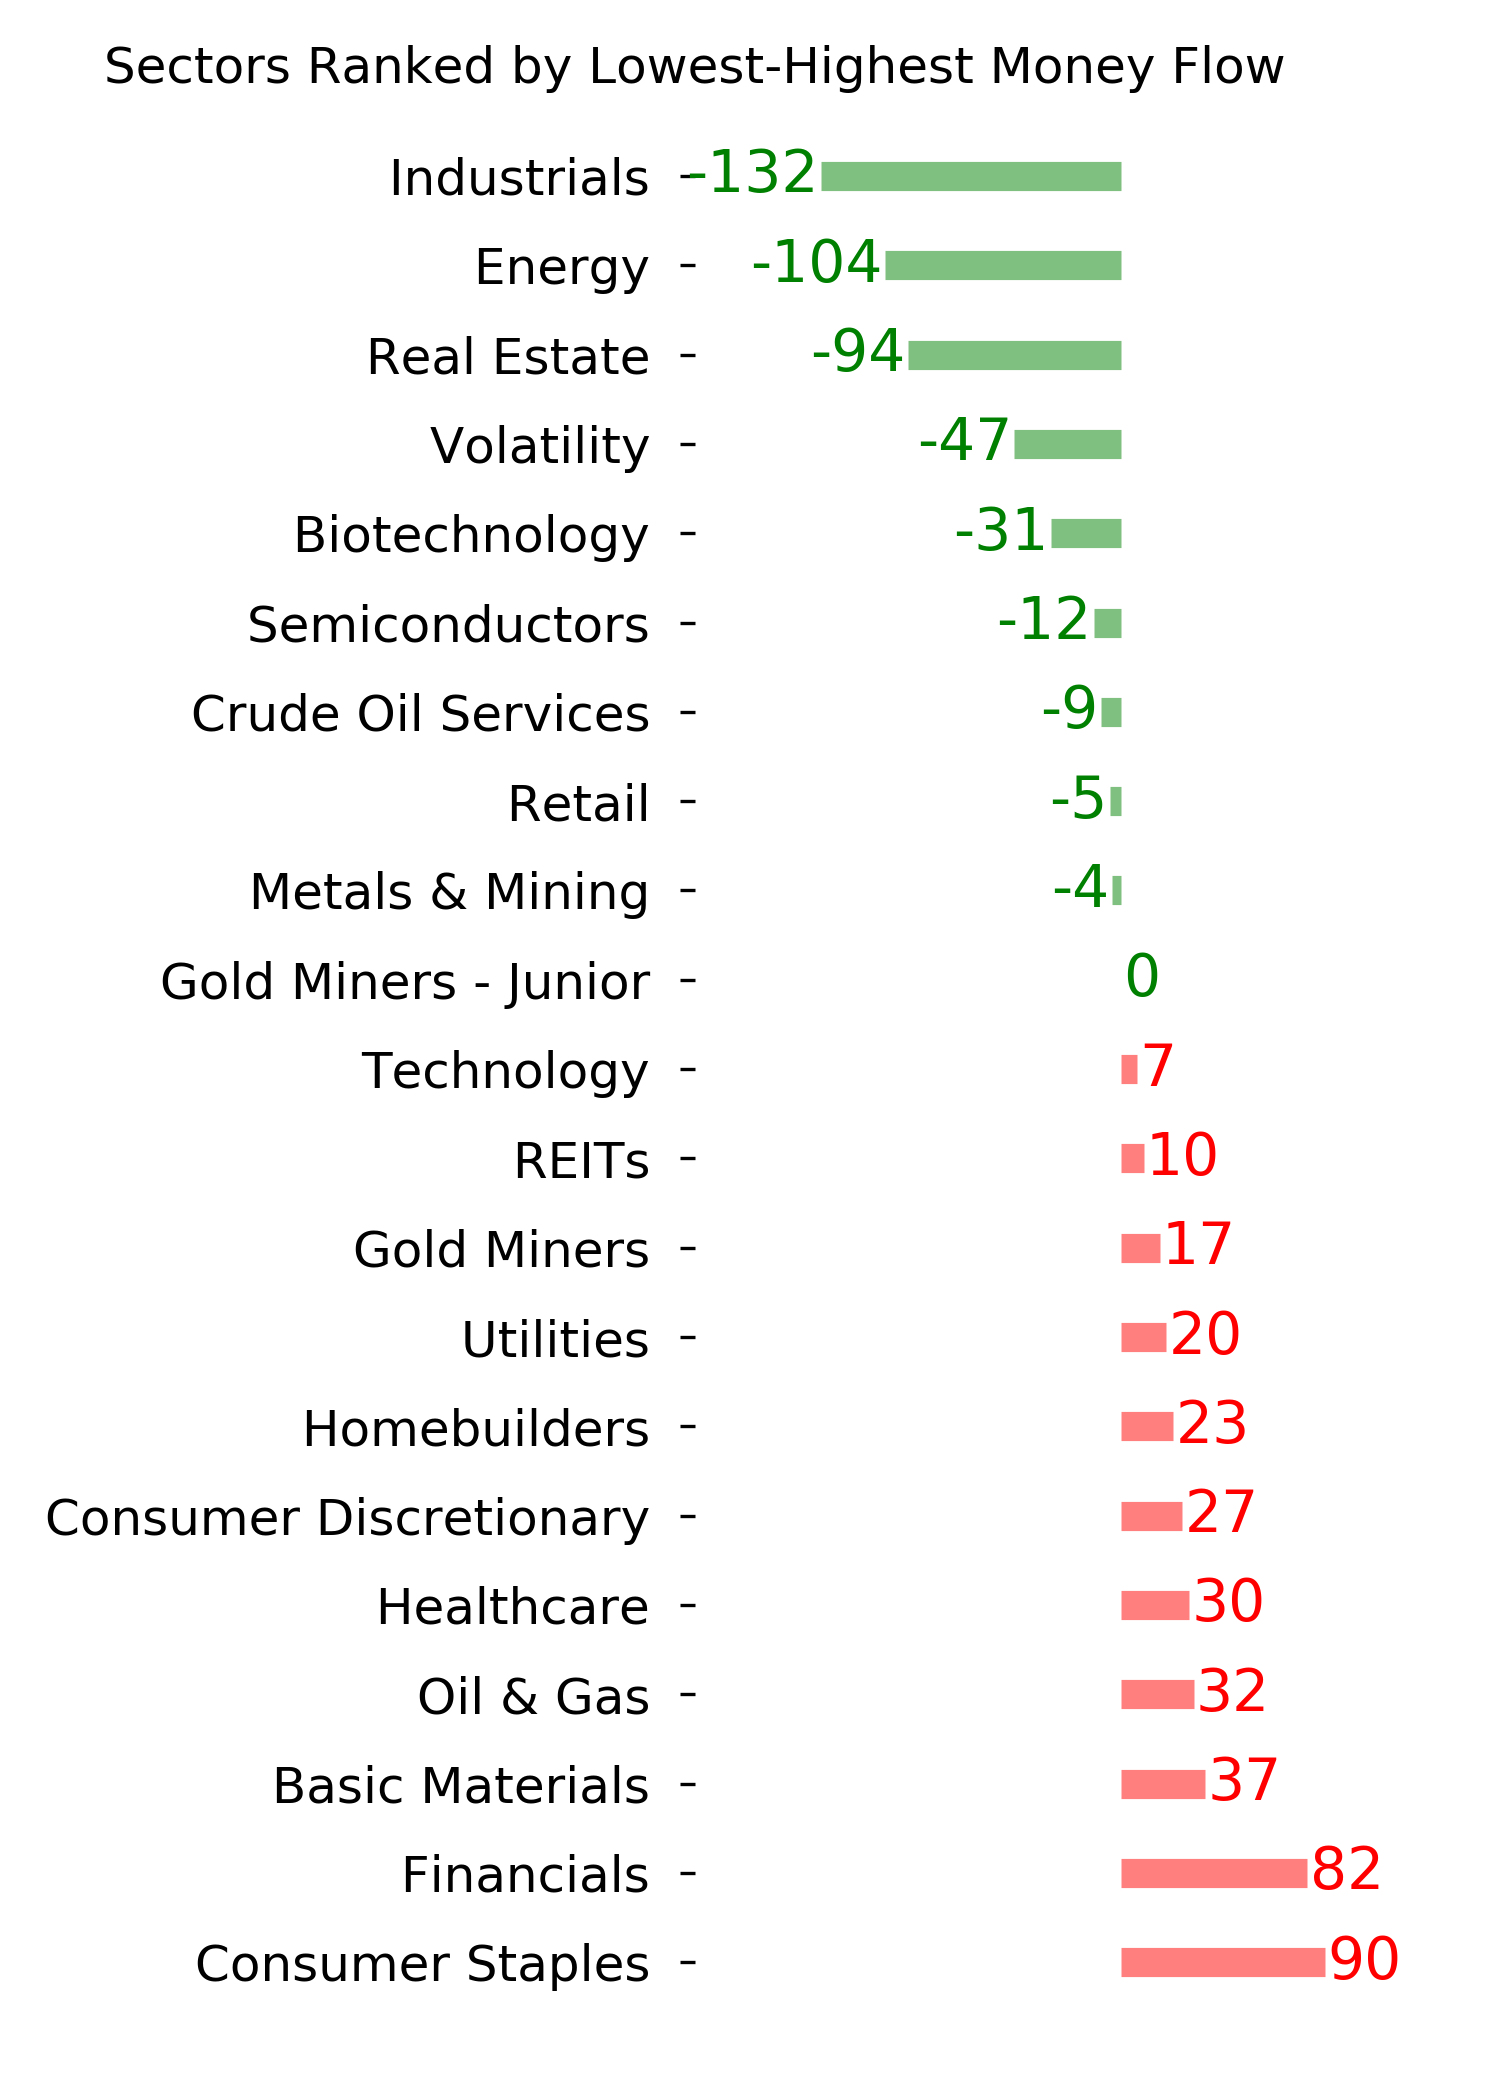
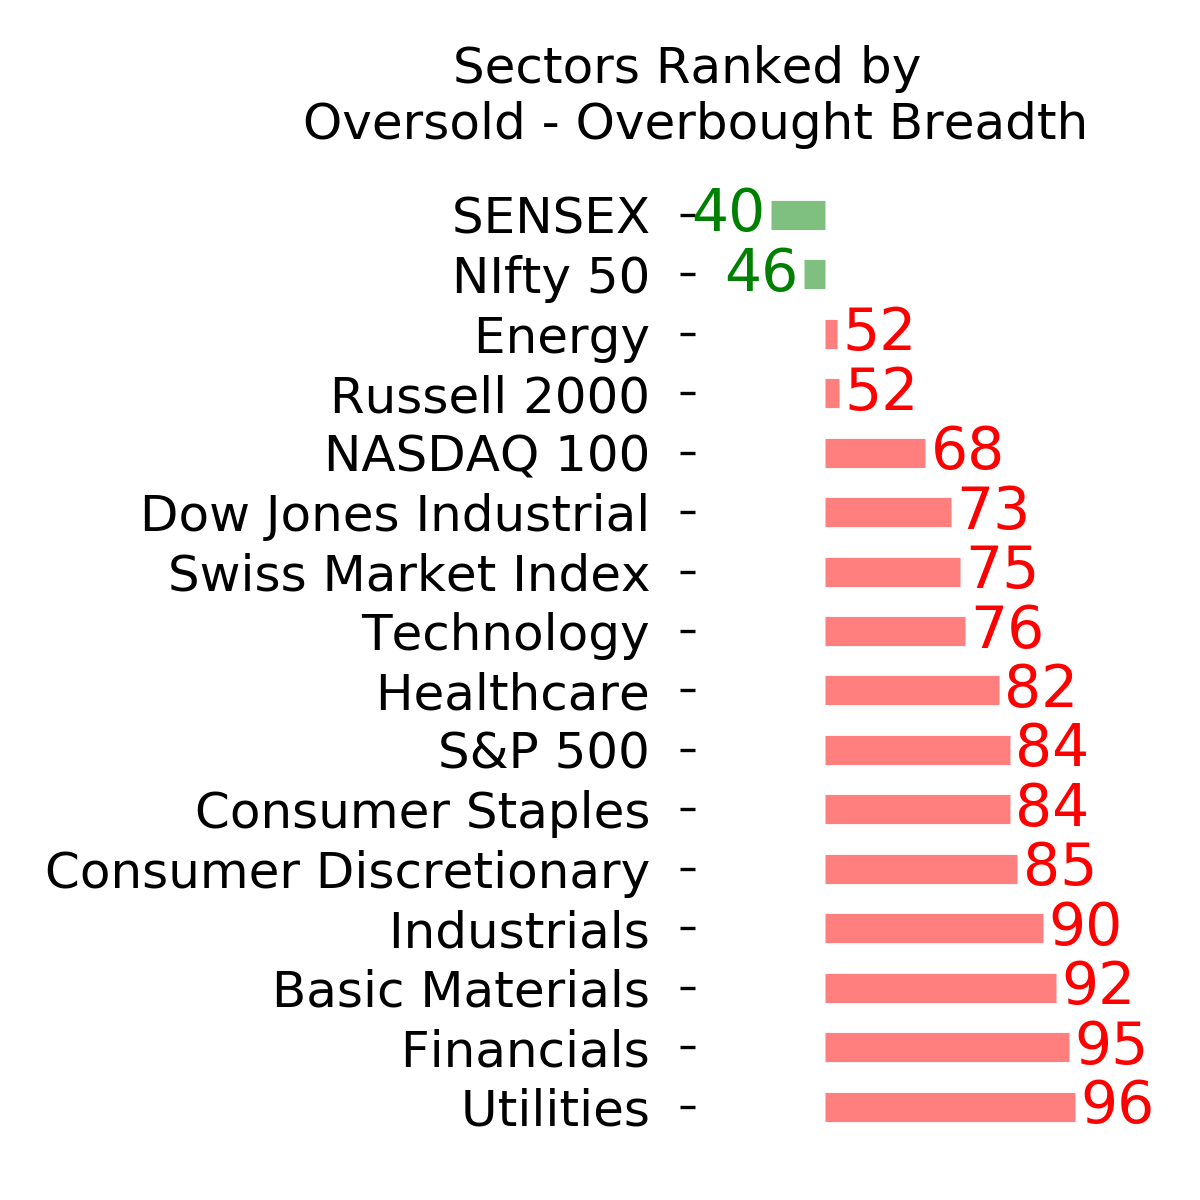
Sector ETF's - 10-Day Moving Average
|
|
|
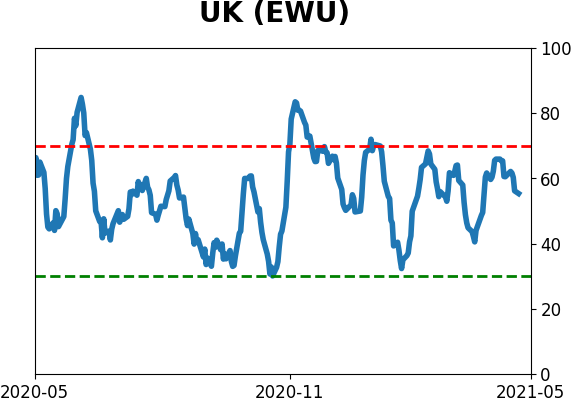
Country ETF's - 10-Day Moving Average
|
|
|
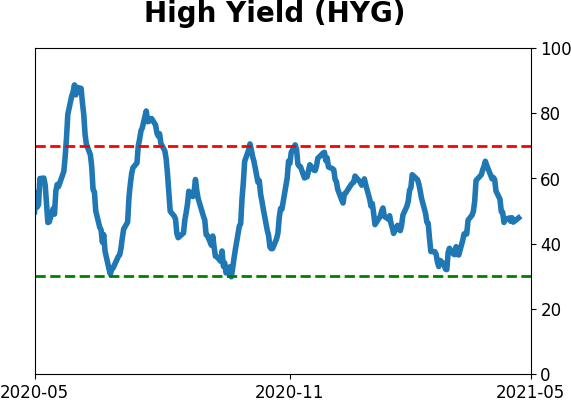
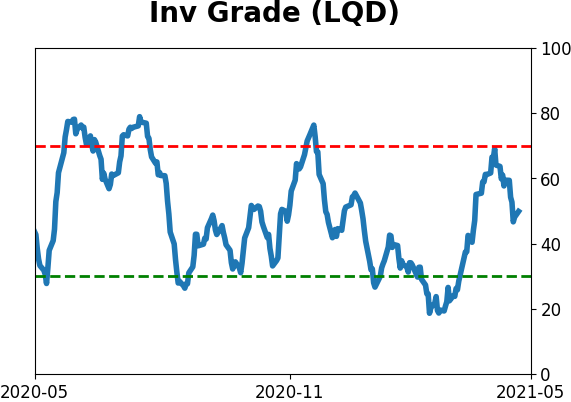
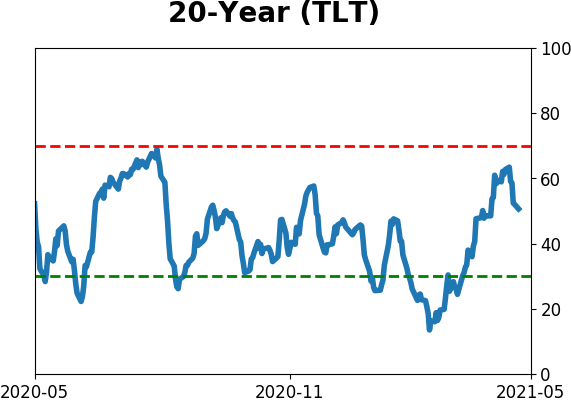
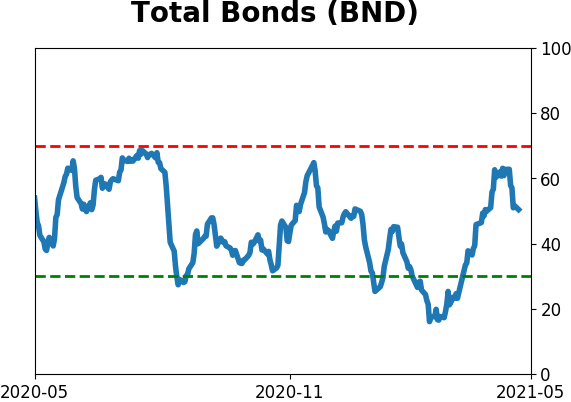
Bond ETF's - 10-Day Moving Average
|
|
|
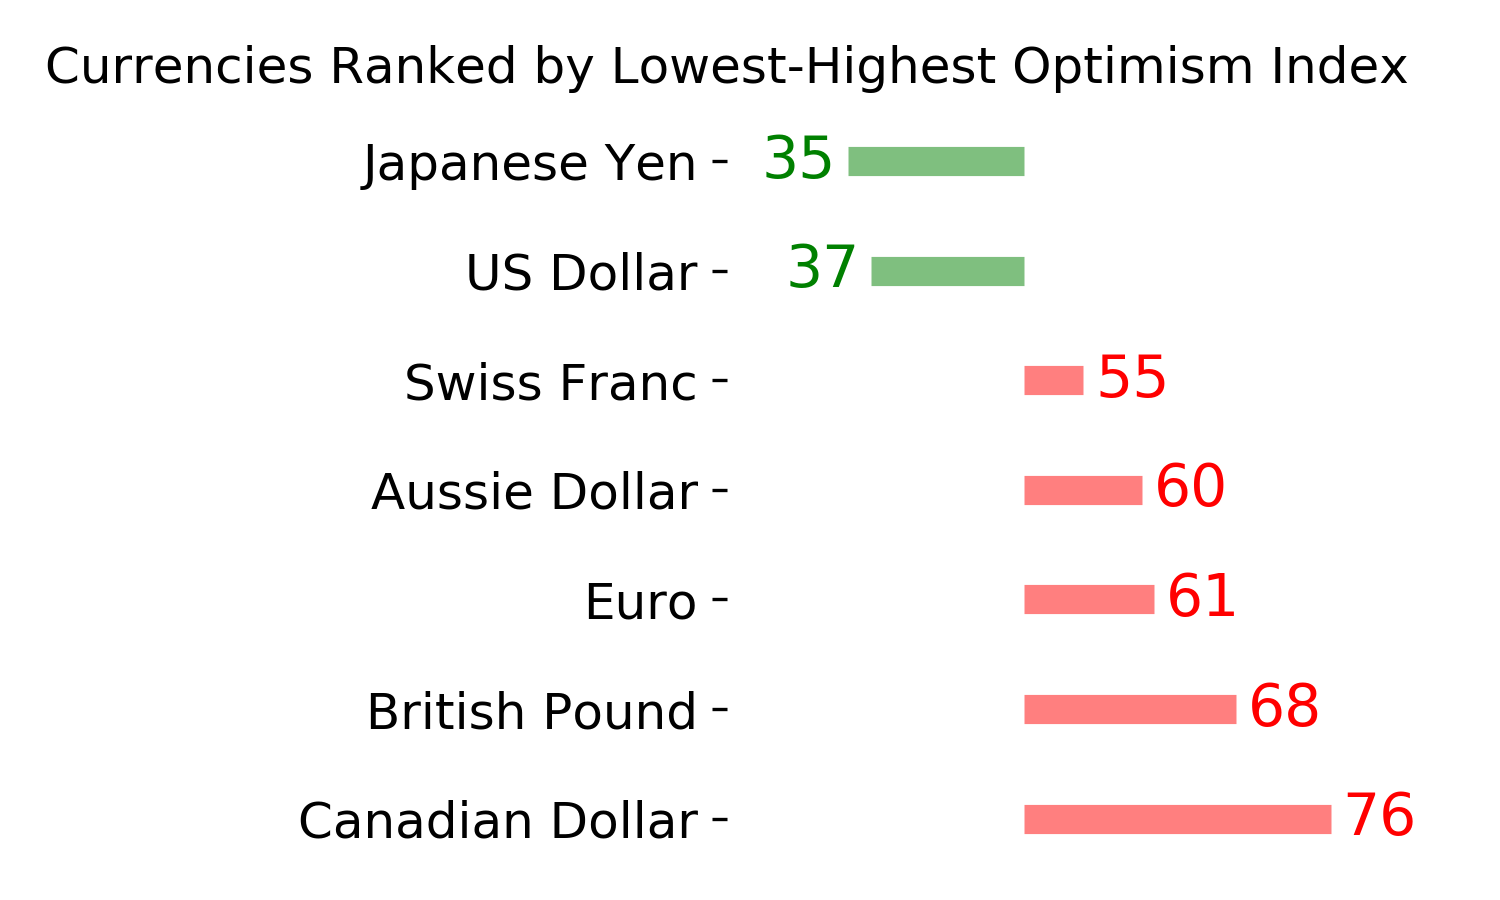
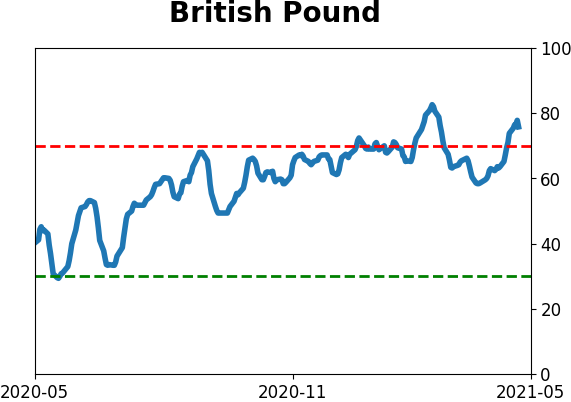
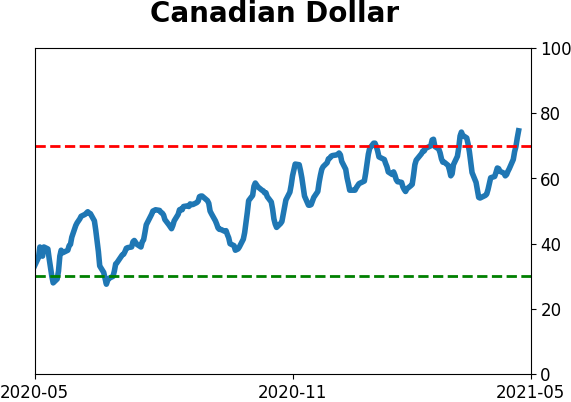
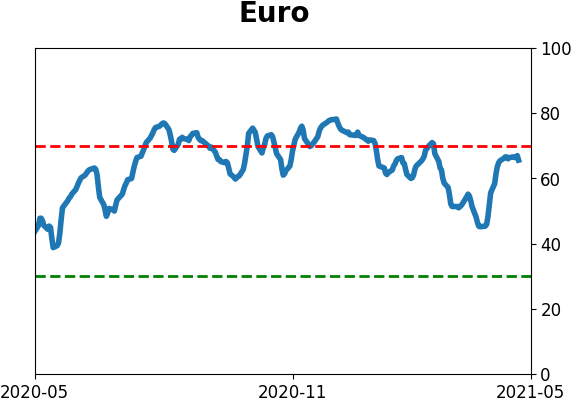
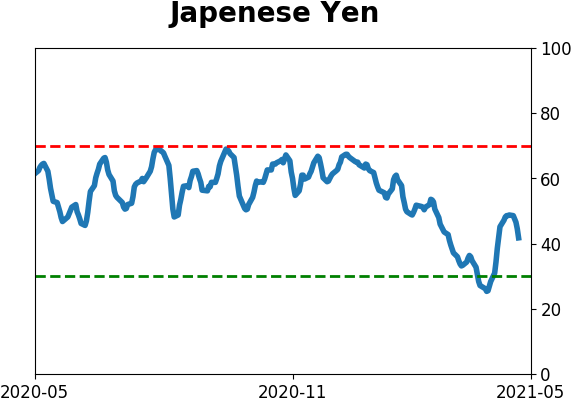
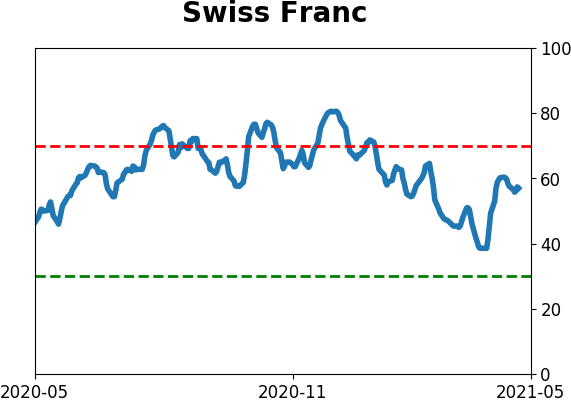
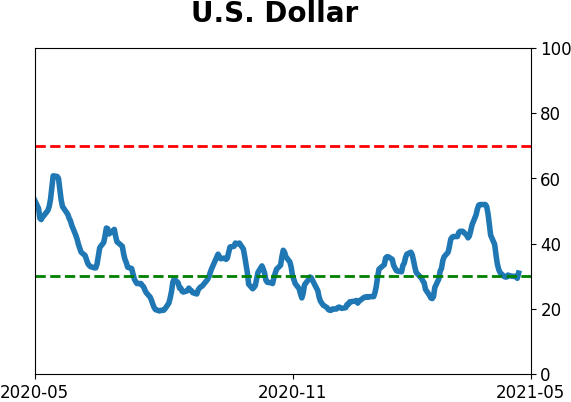
Currency ETF's - 5-Day Moving Average
|
|
|
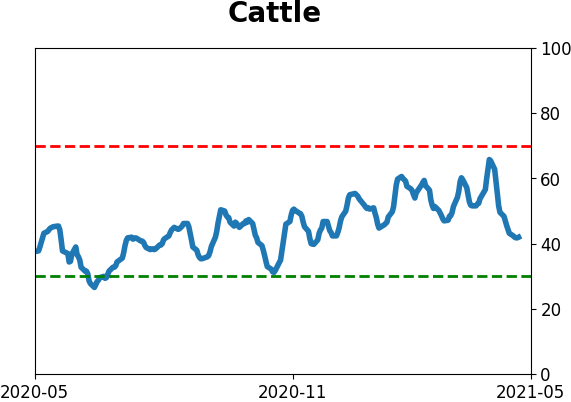
Commodity ETF's - 5-Day Moving Average
|
|