Headlines
|
|
The S&P 500 winning streak ends (and why that's NOT a bad thing):
April just ended the S&P 500 Index's five-month winning streak. So, is the party over? History has some clear suggestions on the topic. We examine the implications herein.
|
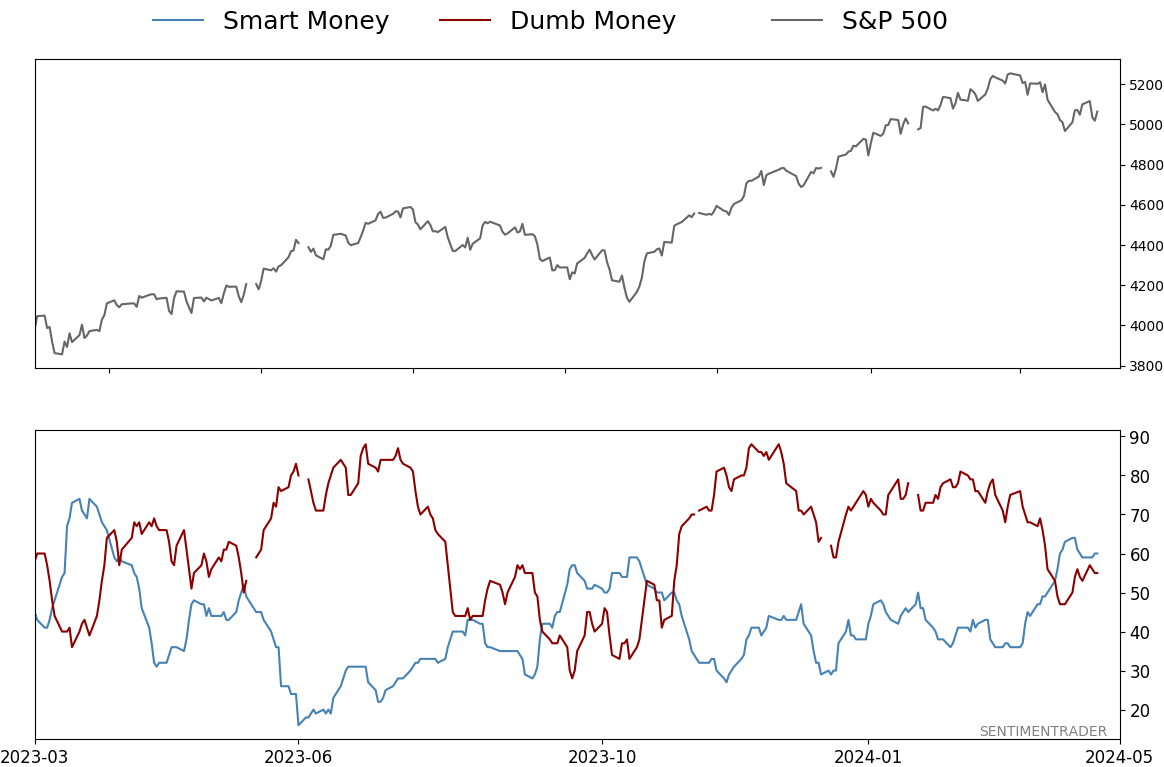
Smart / Dumb Money Confidence
|
Smart Money Confidence: 60%
Dumb Money Confidence: 55%
|
|
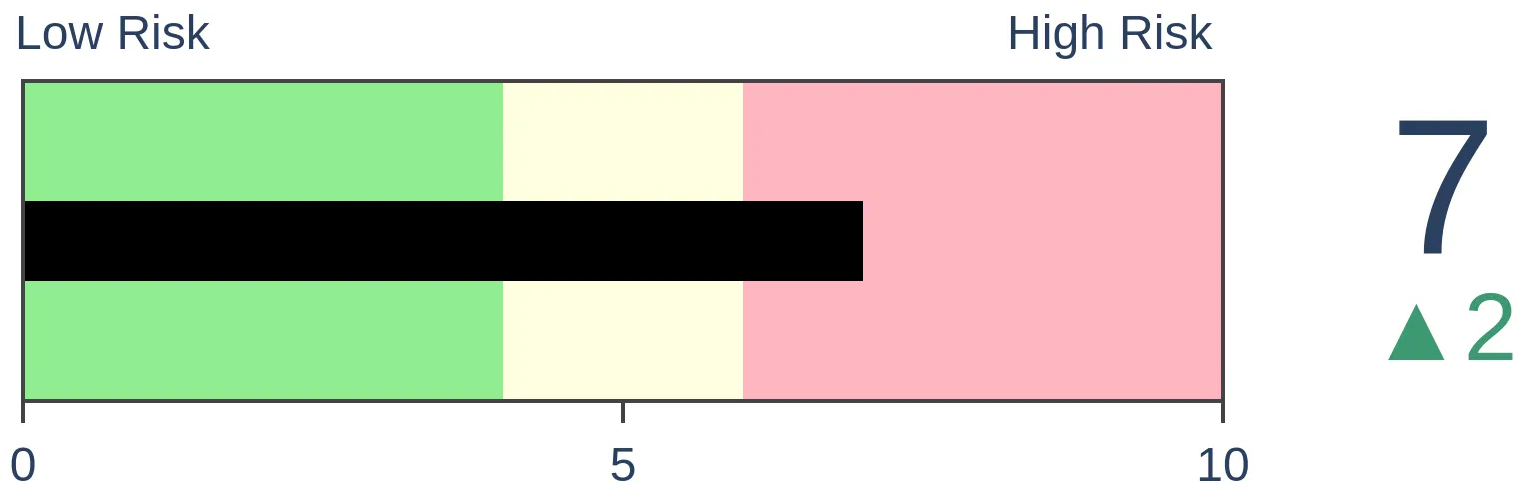
Risk Levels
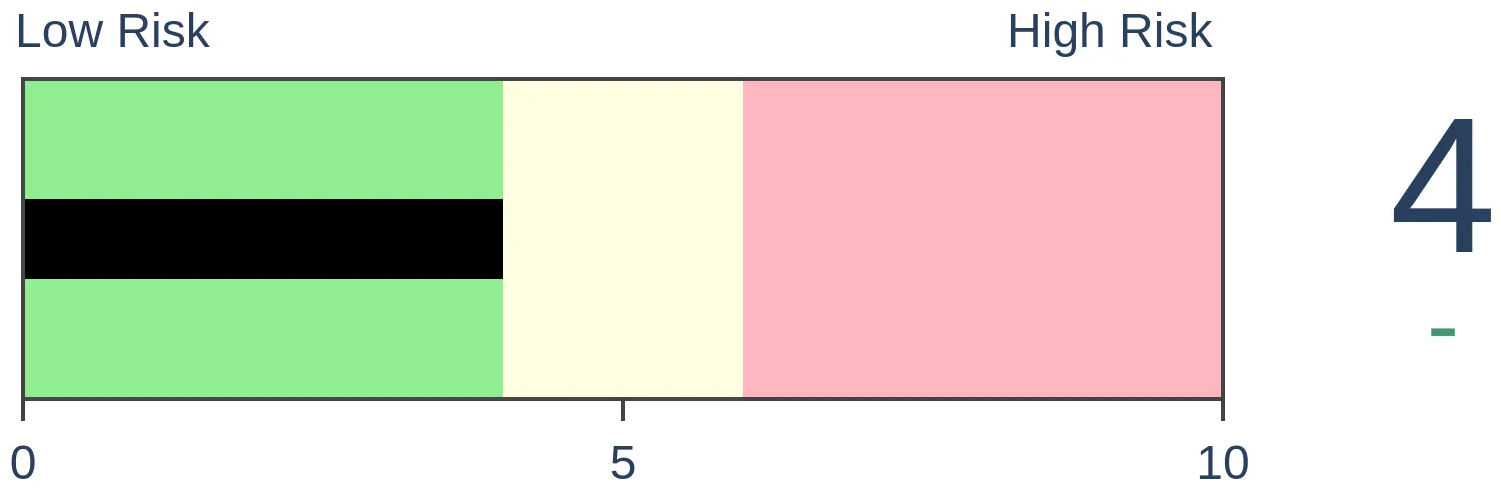
Stocks Short-Term
|
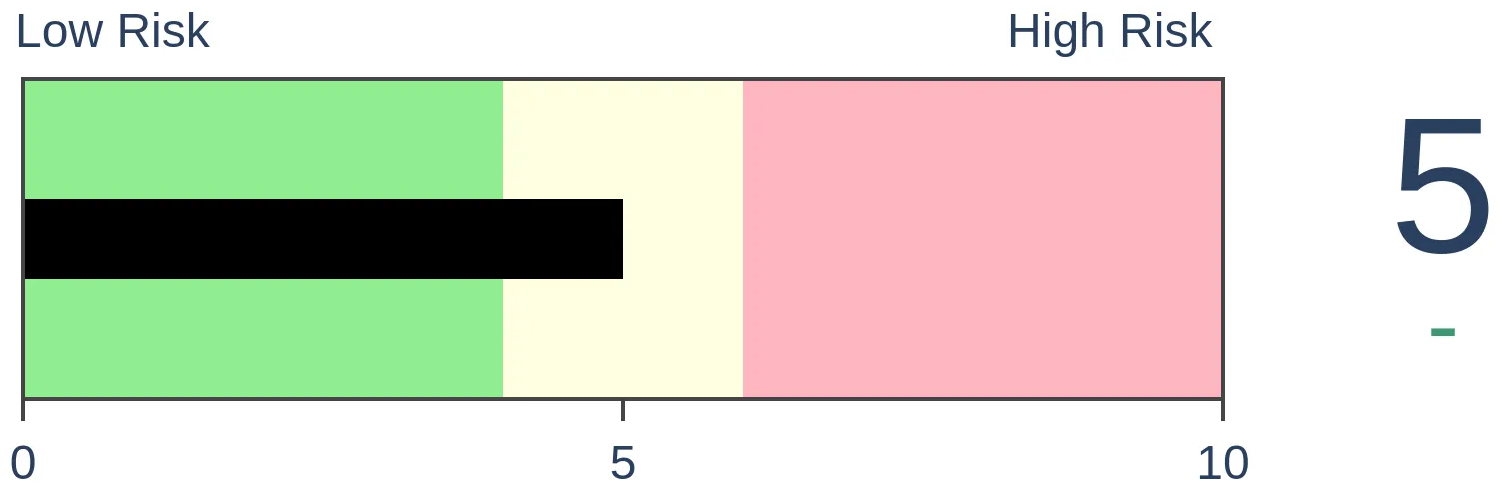
Stocks Medium-Term

|
|
Bonds

|
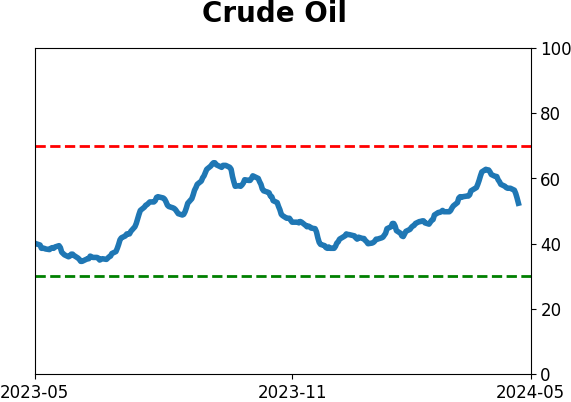
Crude Oil
|
|
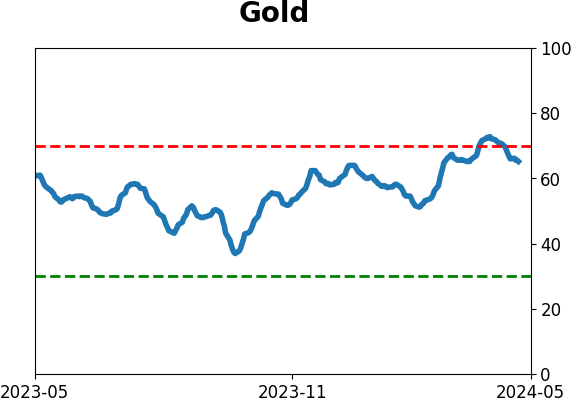
Gold
|
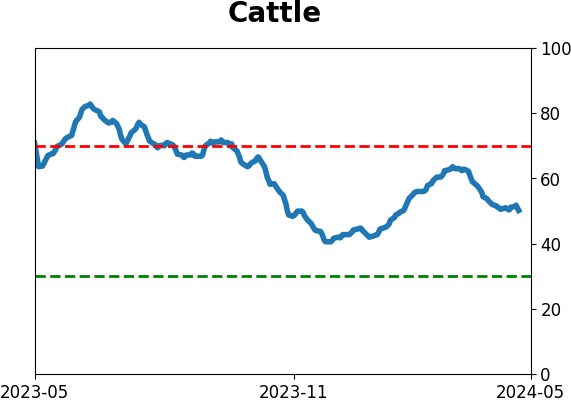
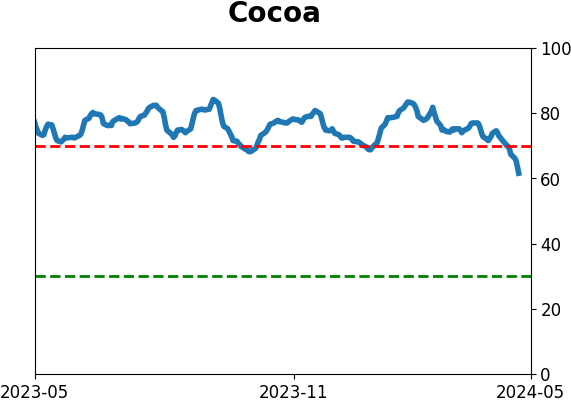
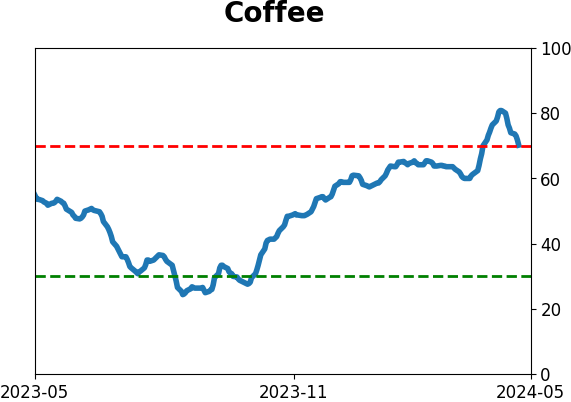
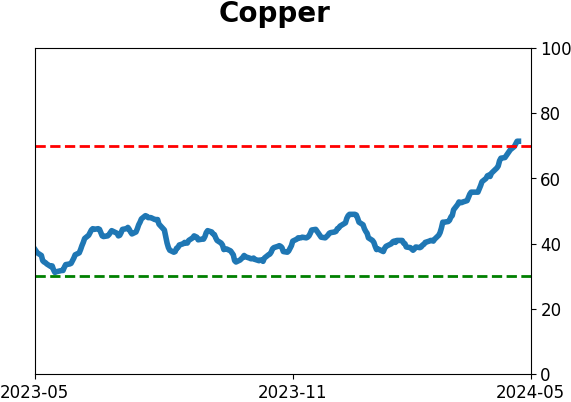
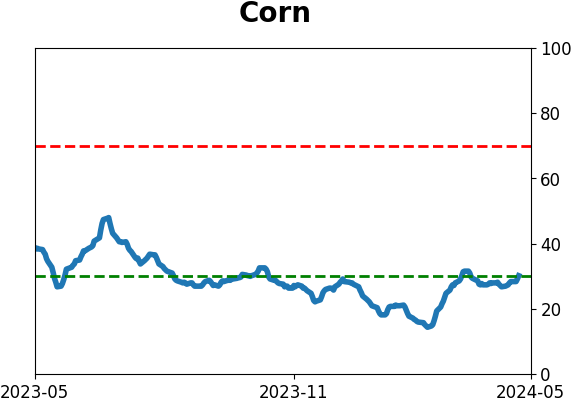
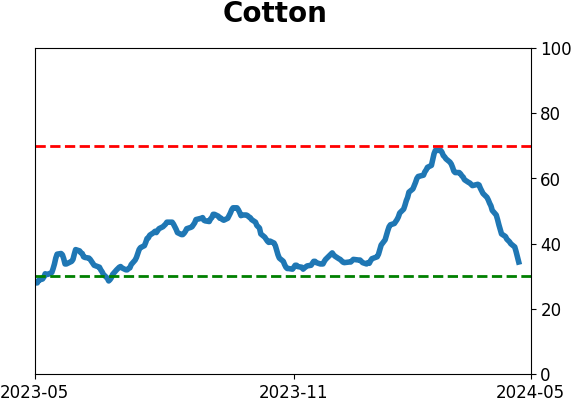
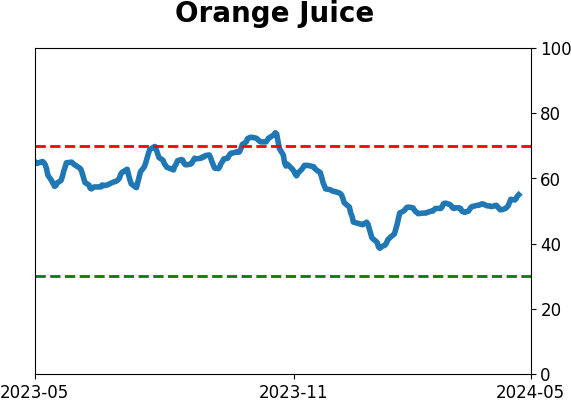
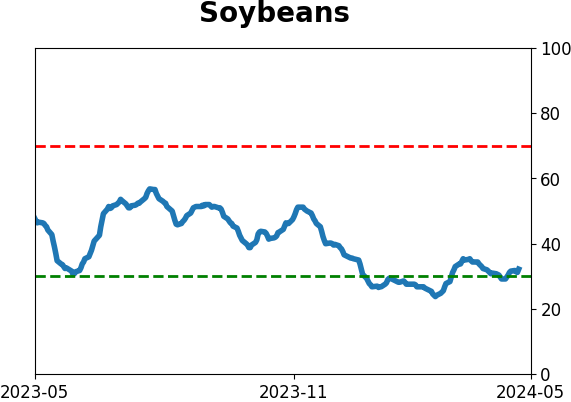
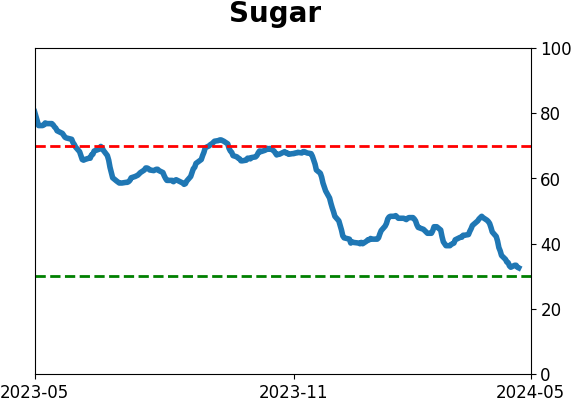
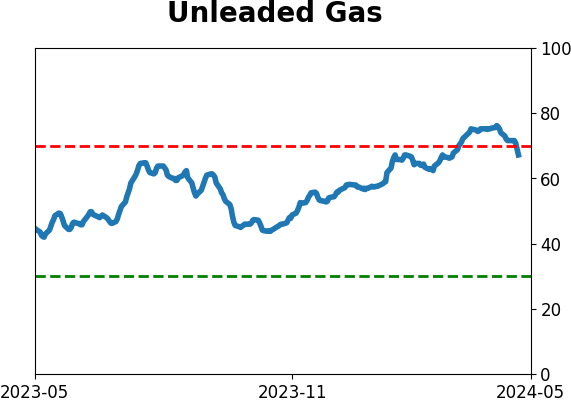
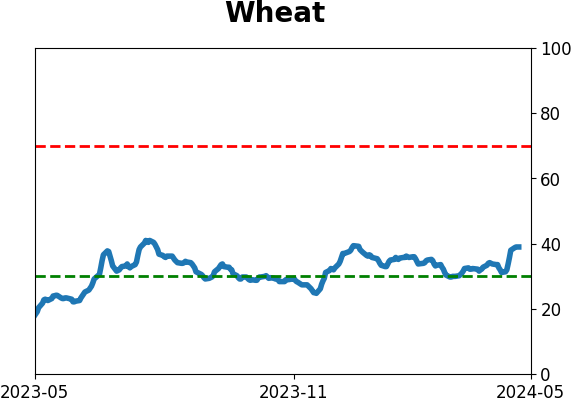
Agriculture

|
|
Research
By Jay Kaeppel
BOTTOM LINE
April just ended the S&P 500 Index's five-month winning streak. So, is the party over? History has some clear suggestions on the topic. We examine the implications herein.
FORECAST / TIMEFRAME
None
|
Key points
- The S&P 500 Index registered a five-month winning streak at the end of March 2024
- That winning streak ended at the end of April 2024
- History suggests a strong probability of more action to the upside in the months ahead
S&P 500 five-month winning streak ends
The S&P 500 Index closed higher every month from November 2023 through March 2024. A five-month winning streak tends to be bullish for stocks in the future (especially if the five-month gain is 25% or more). But with April closing with a monthly loss, the latest streak is over. On the face of it, this sounds like a bad thing. But if we take a closer look, history suggests something else.
The test
We will run the following test using monthly closing price data for the S&P 500 going back to 1920.
- A signal occurs when the S&P 500 closes a monthly lower after registering five or more consecutive higher monthly closes
- After a signal, we will buy and hold the S&P 500 for six months
To clarify, no signal occurs while a monthly winning streak remains active. The signal only occurs after the S&P 500 registers a down month after five or more up months.
The results
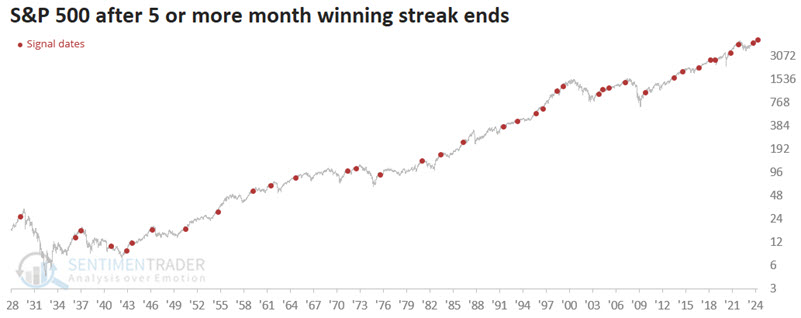
The chart below highlights each signal date since the 1920s with a red dot.
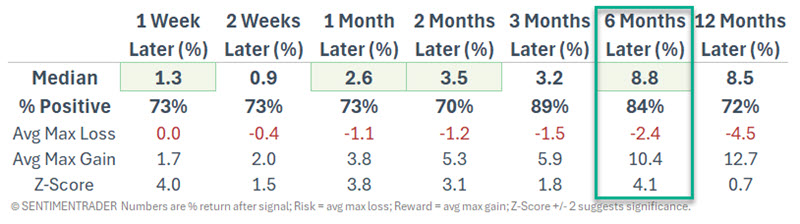
The table below displays a summary of SPX performance following these signals.
The chart below displays the hypothetical growth of $1 invested in the S&P 500 Index for six months following each new signal shown above.
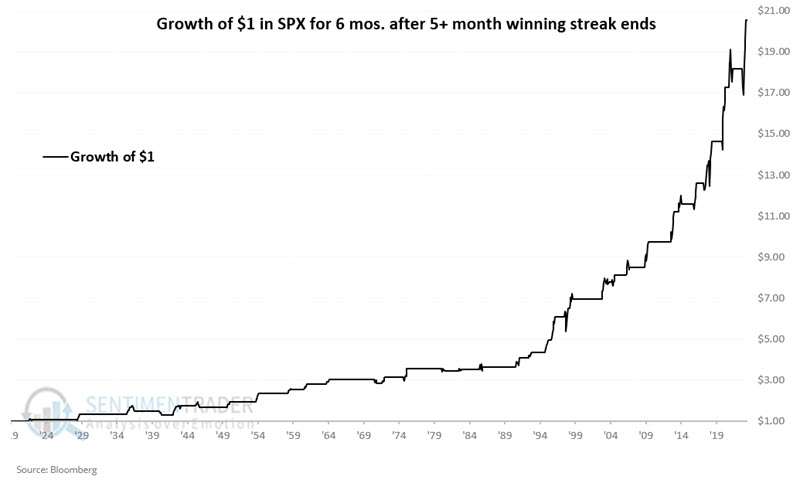
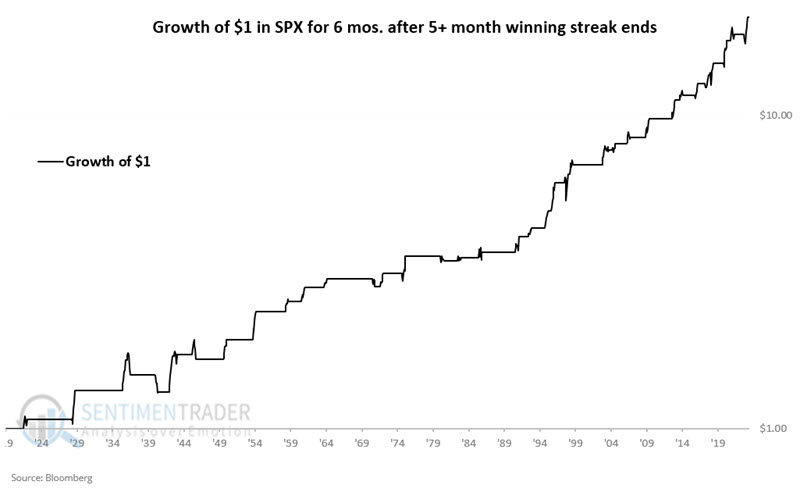
The chart below displays the same information as the chart above on a logarithmic scale. Like anything in the market, it is imperfect and not indicative of a "sure thing." However, investing is a game of probabilities, and the equity curve's "lower left to upper right" nature is evident.
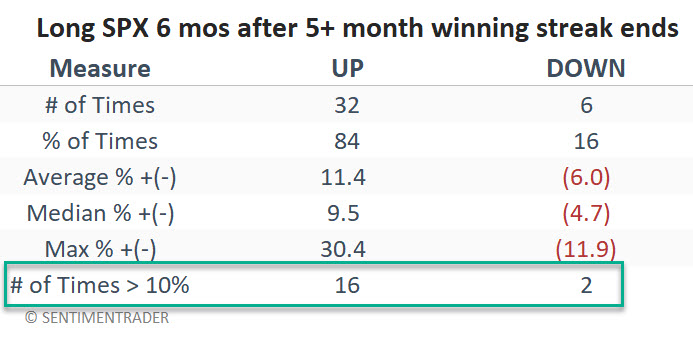
Lastly, the table below shows a further breakdown of winning and losing signals. Note the 84% Win Rate (again, implying a high probability of higher stock prices, but not a sure thing). Also, note that six-month moves of 10% or more skew 16-to-2 to the favorable side.
What the research tells us…
Will the S&P 500 be higher at the end of October than at the end of April? No one can say for sure, but the study above suggests a strong probability of just that possibility. Human nature leads most investors to think that after five consecutive up months, the stock market has "used up" most of its momentum. Likewise, when that streak ends, most investors intuitively consider it bad ("The run was nice, but now it's over"). While results can and will vary widely from signal to signal, the results above suggest that investors continue to give the bullish case for stocks the benefit of the doubt even after a five-month or more win streak ends.
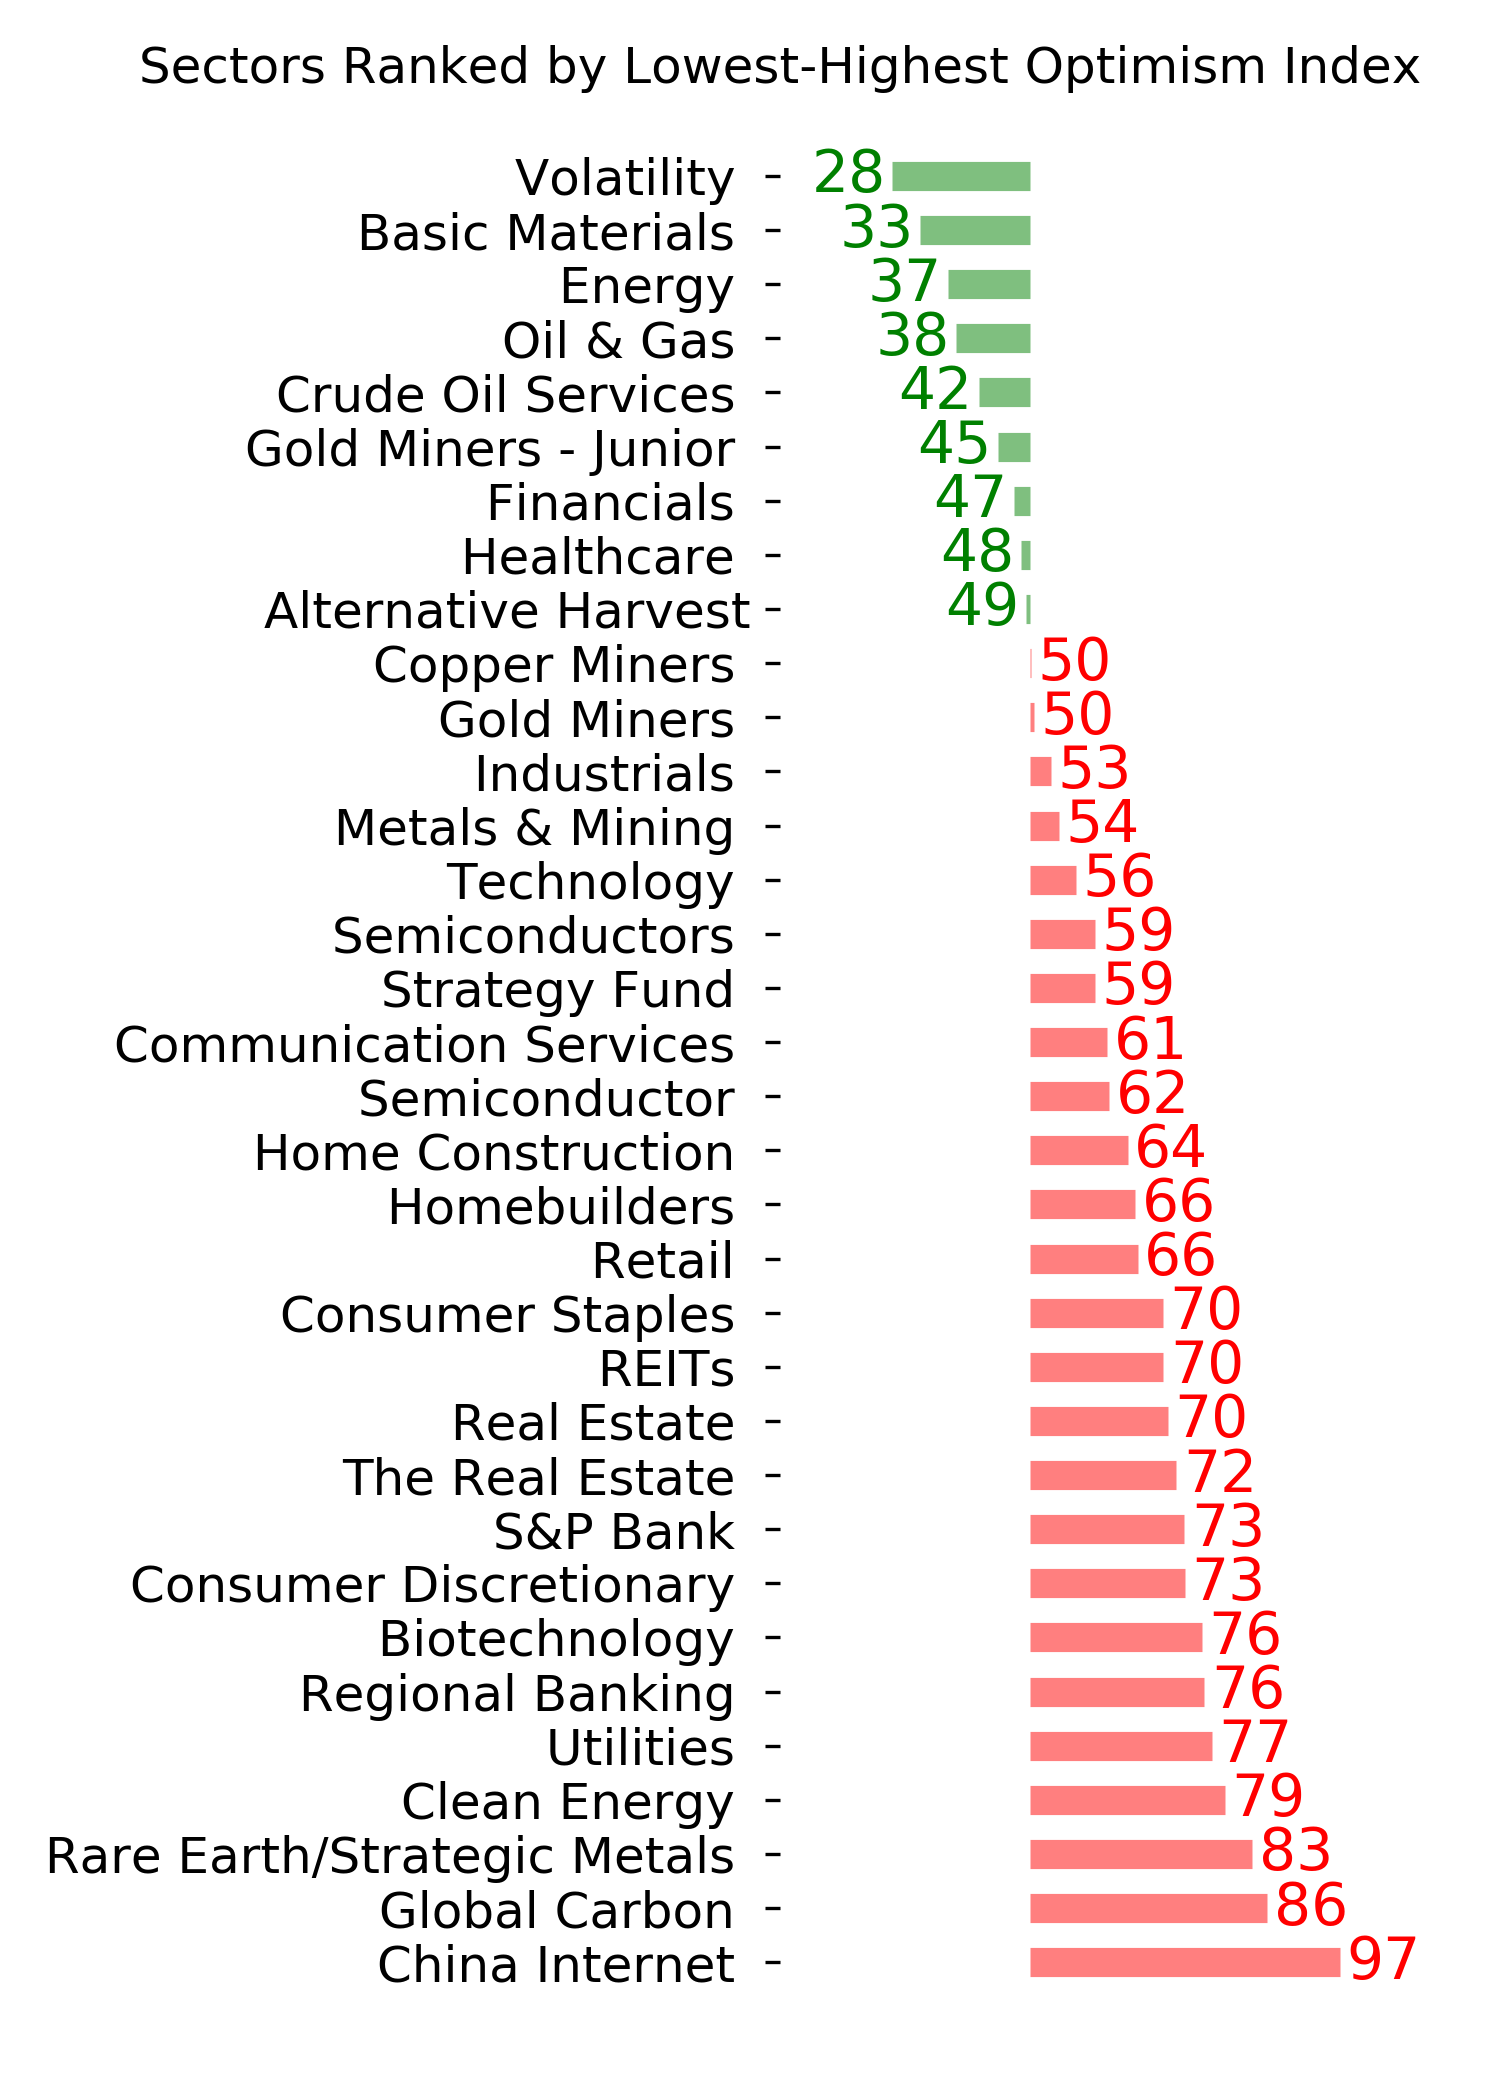
Indicators at Extremes
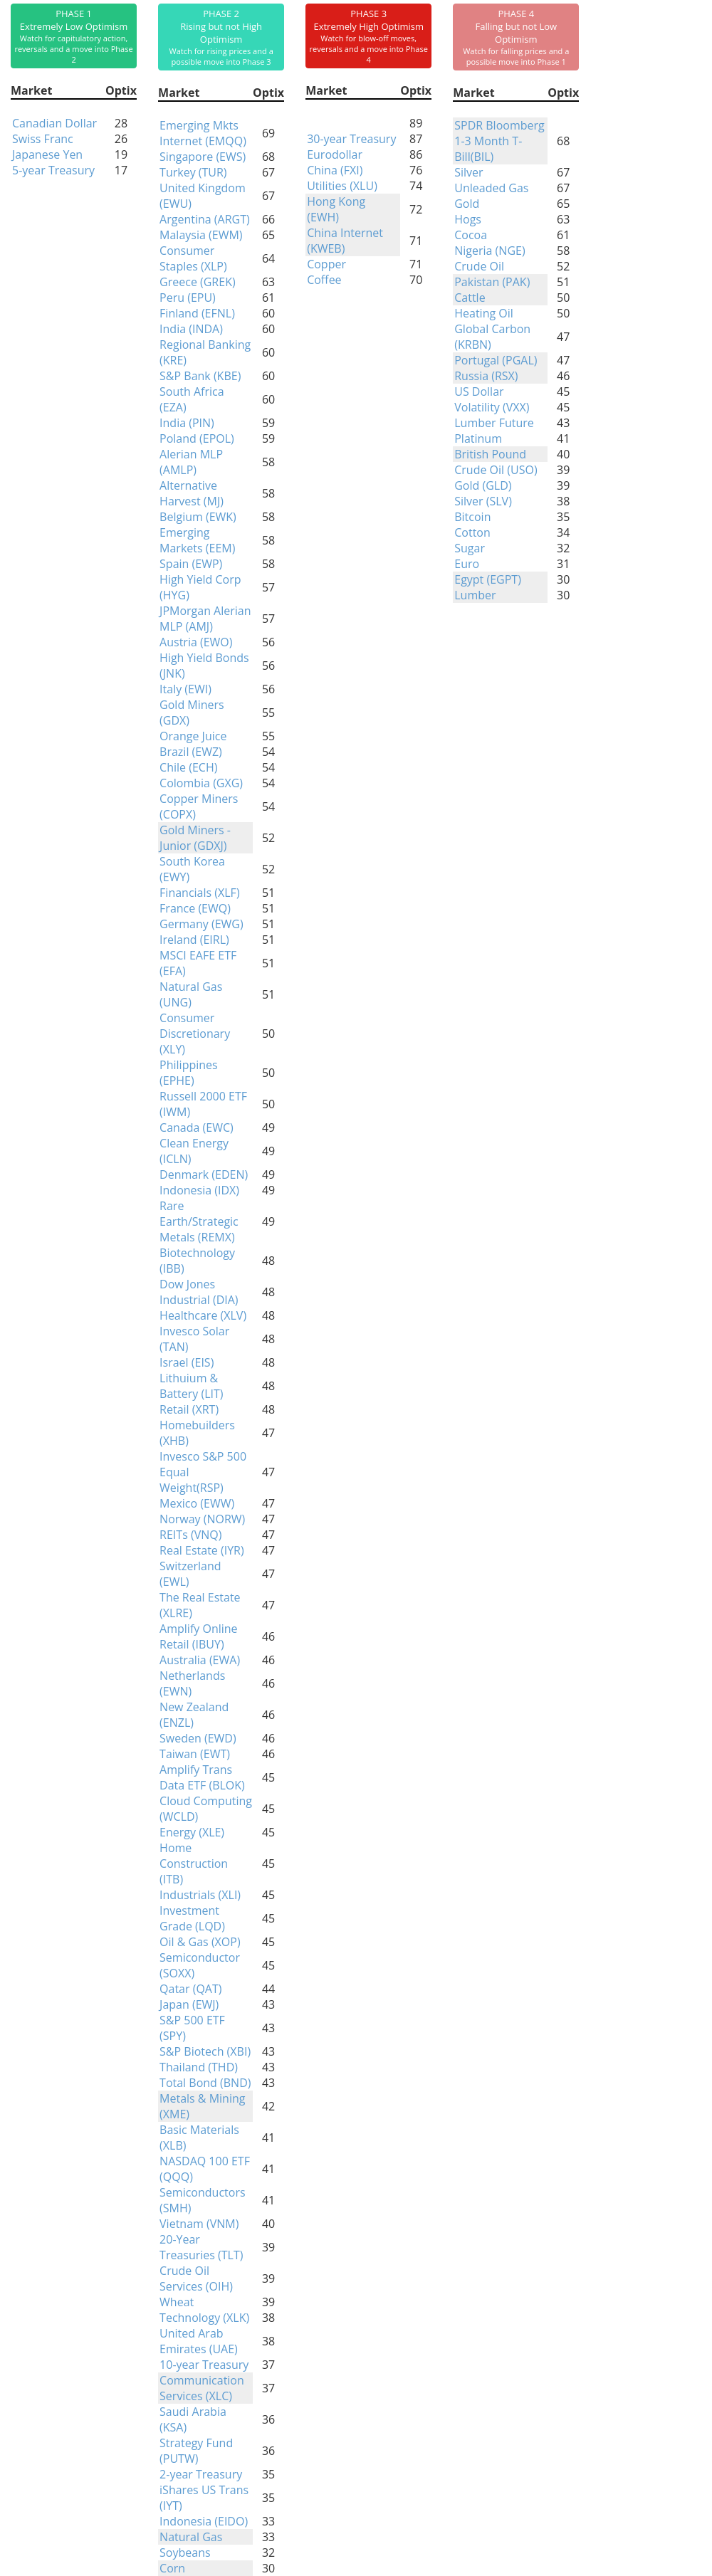
Phase Table
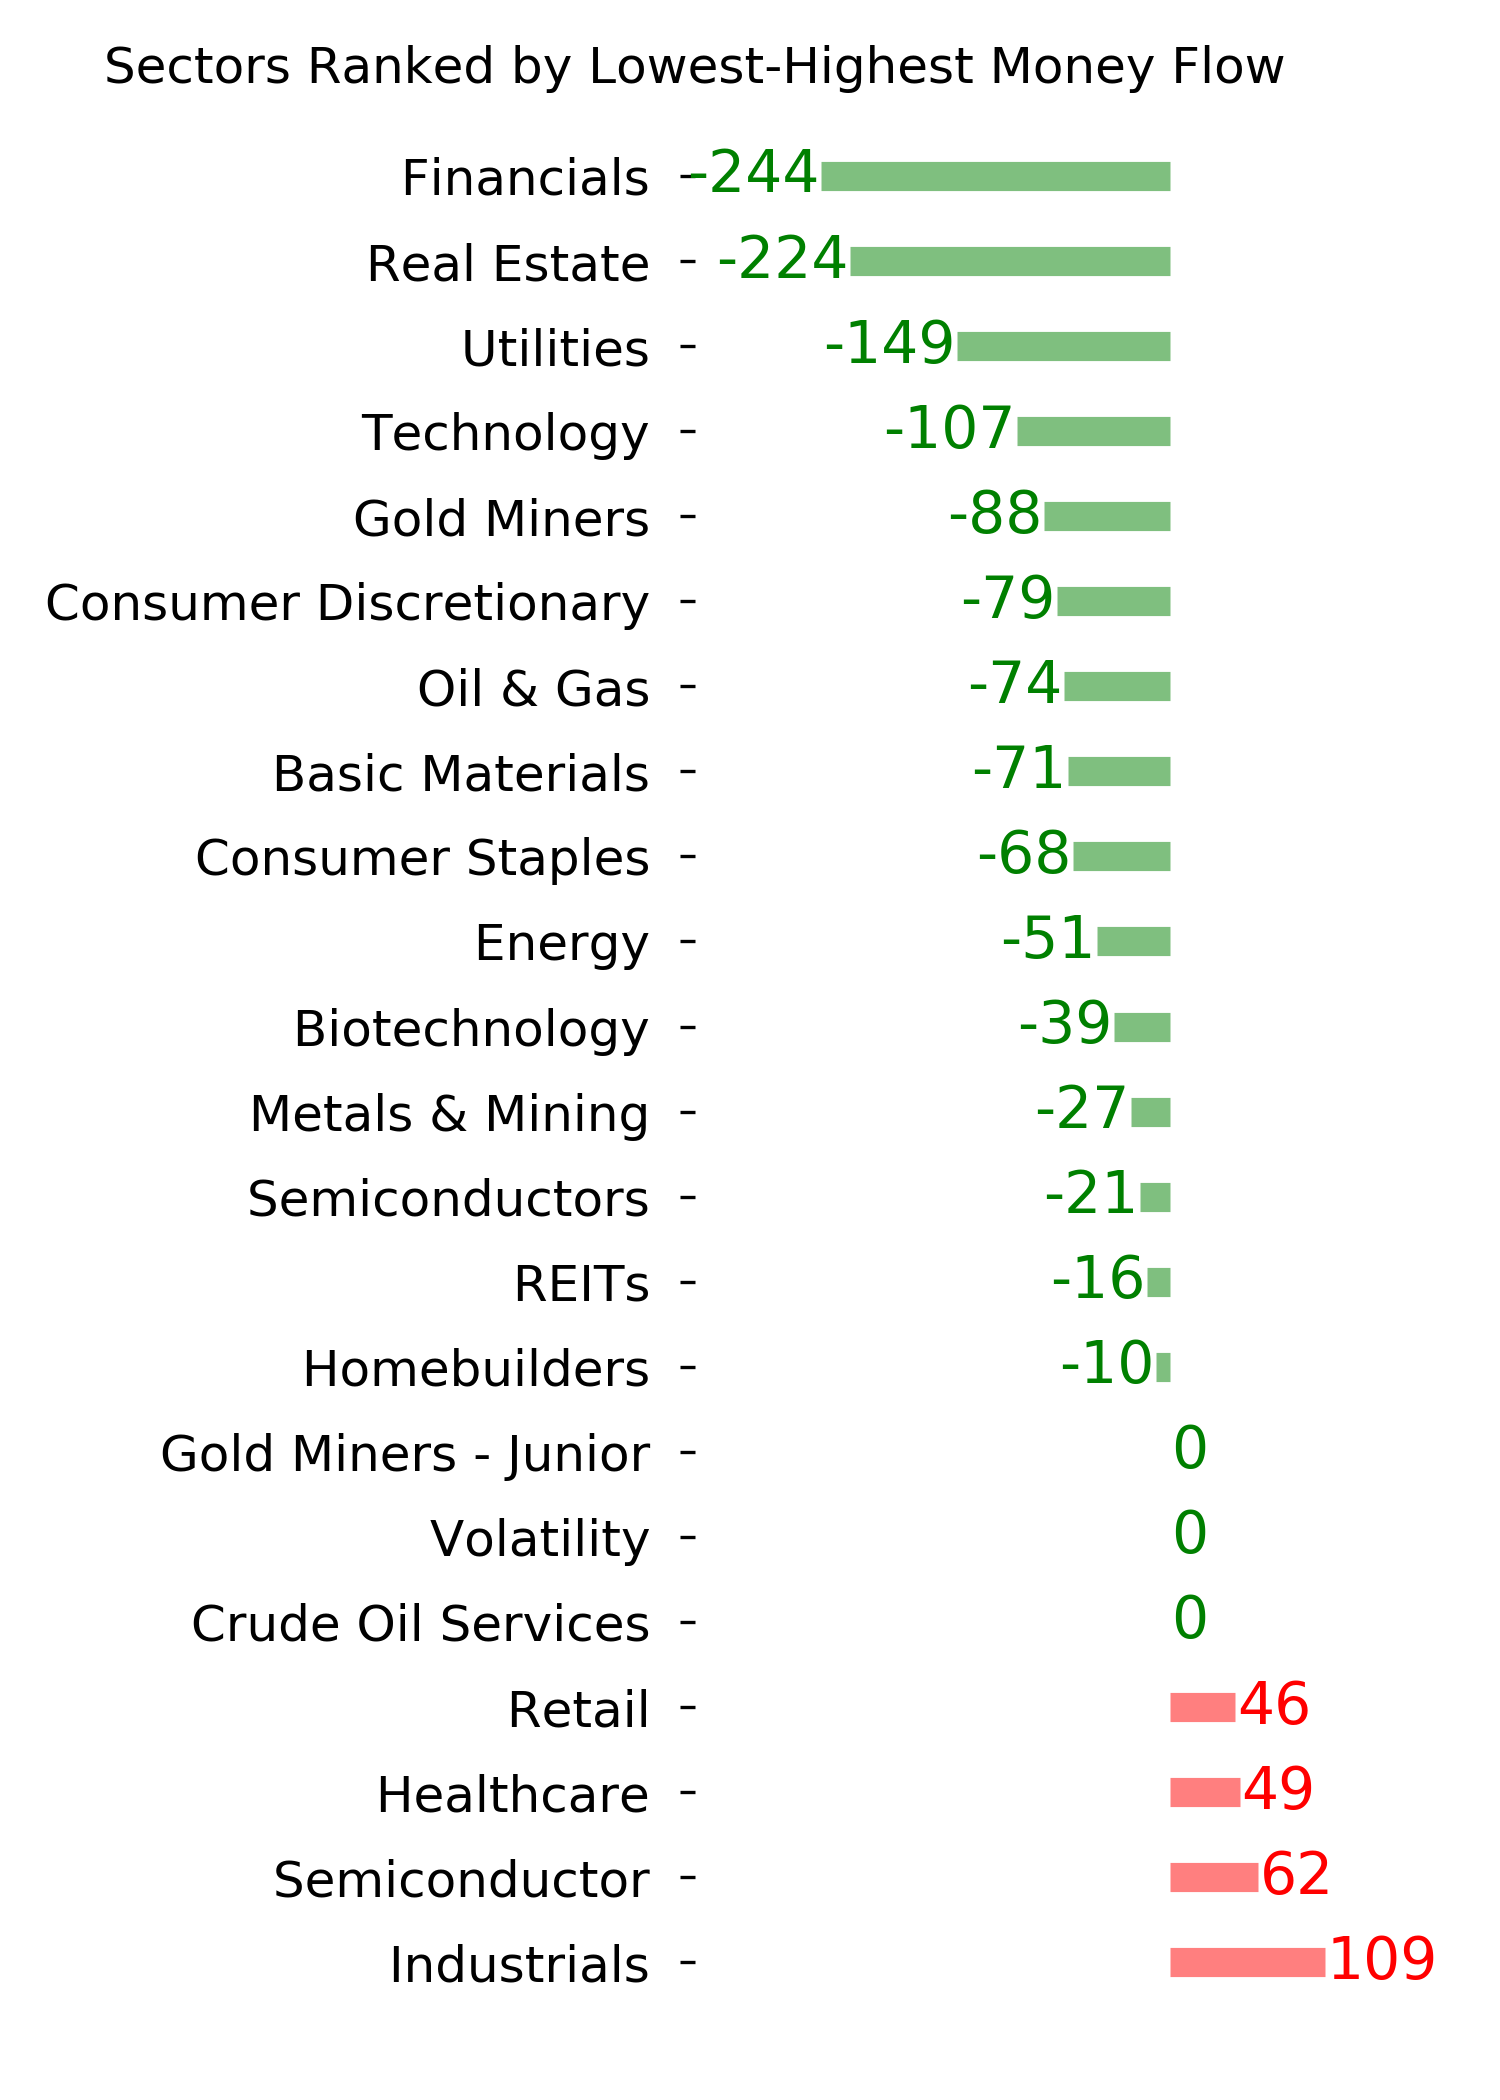
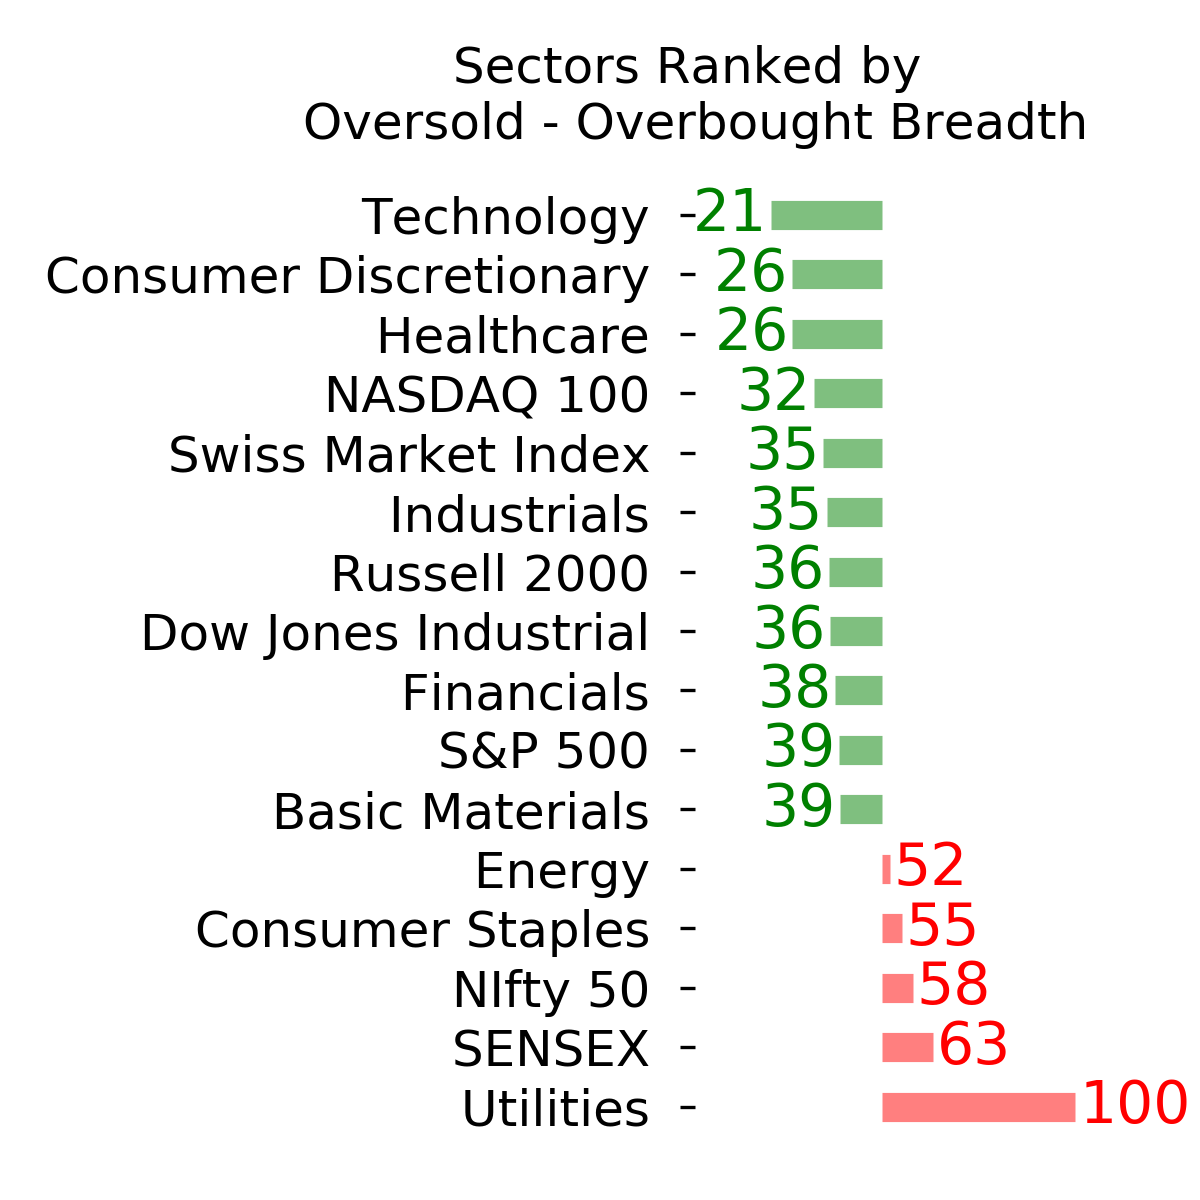
Ranks
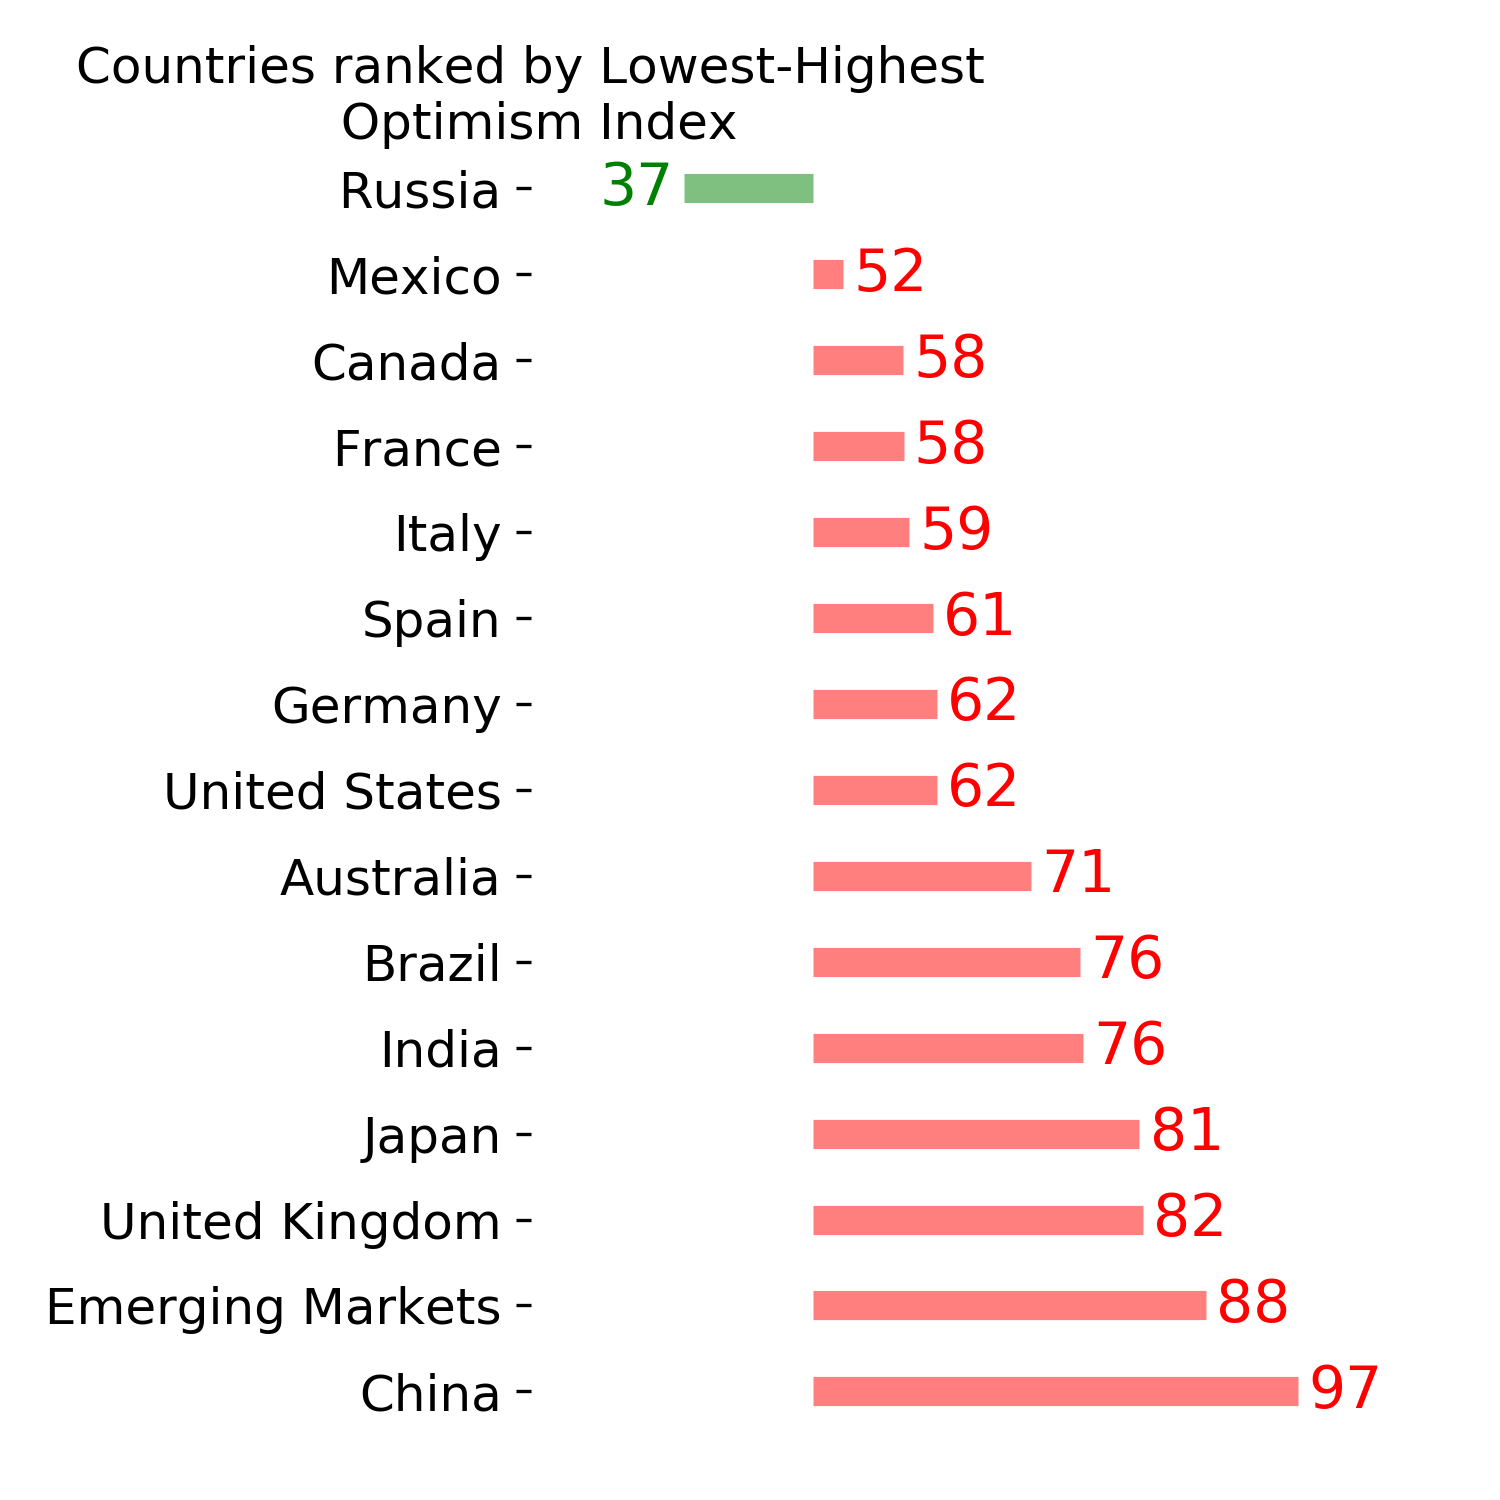
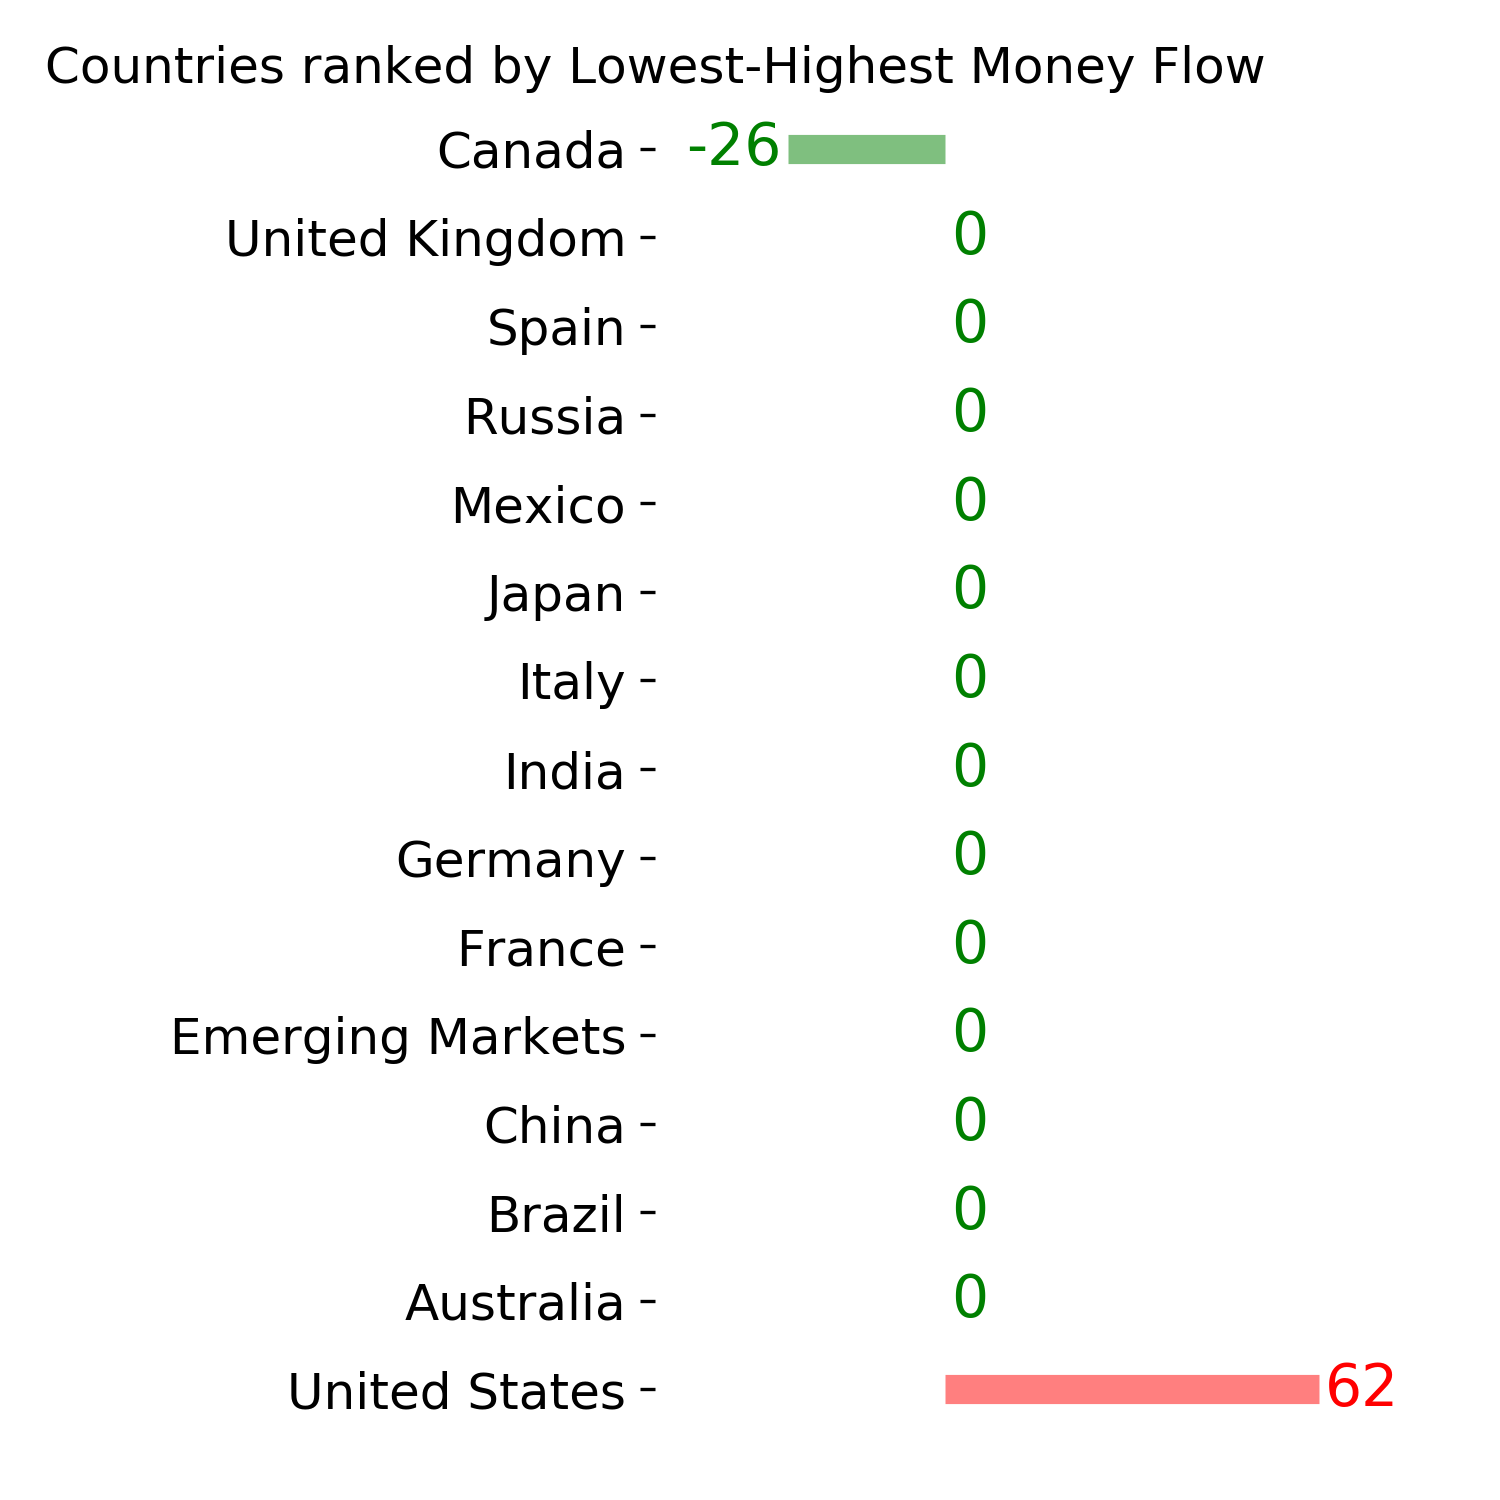
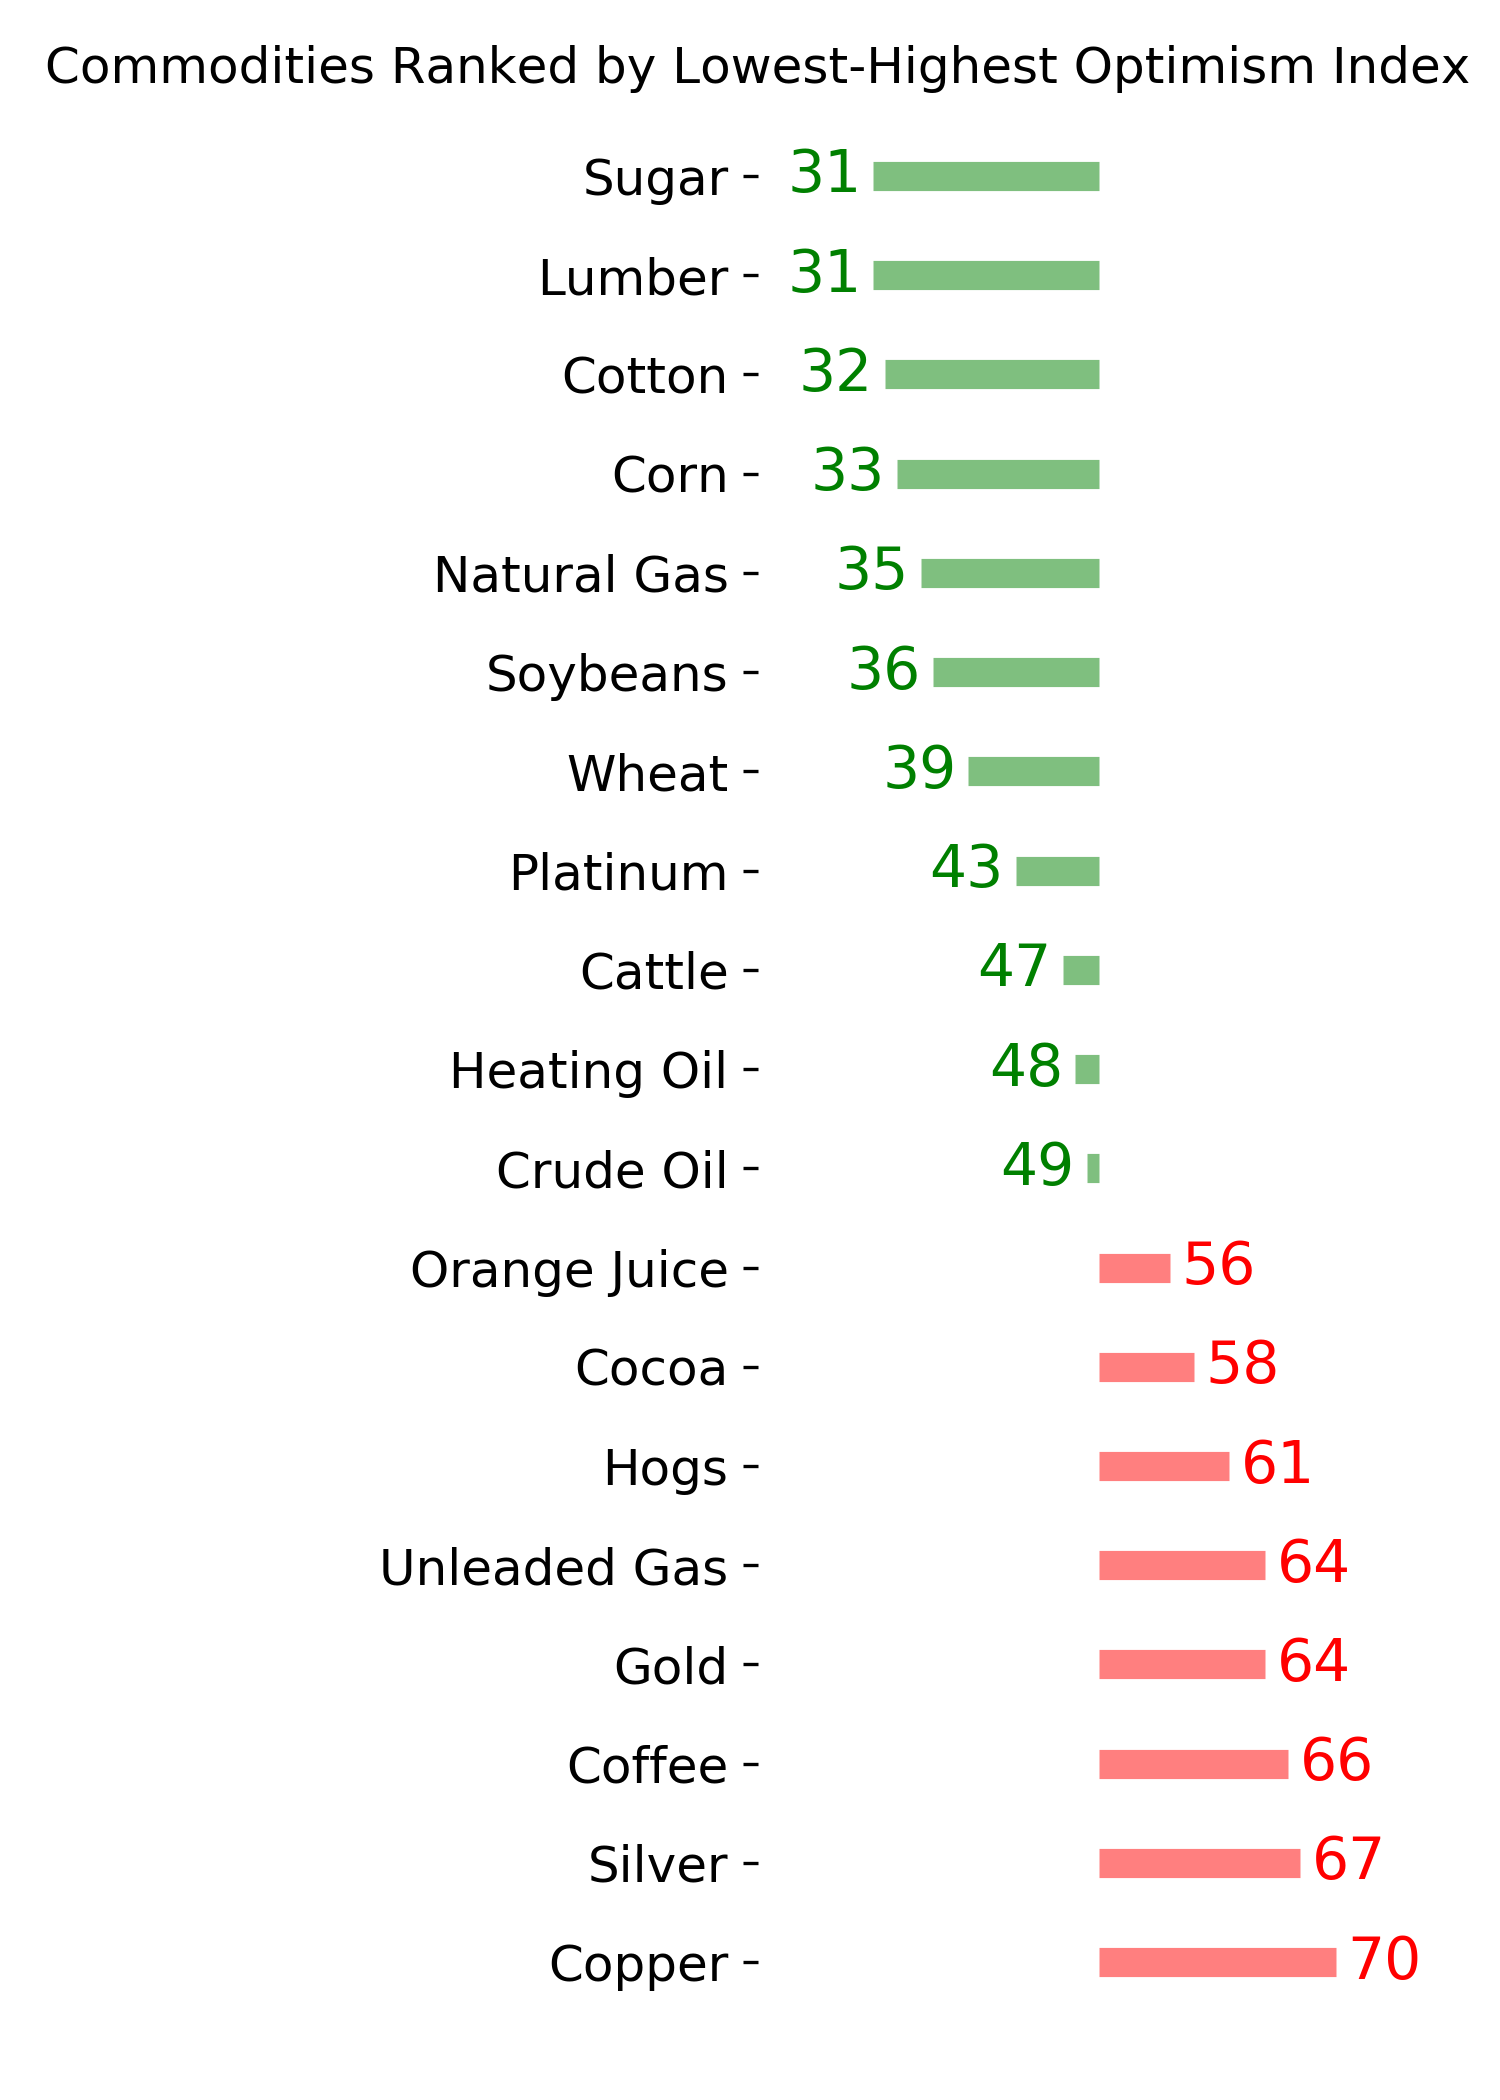
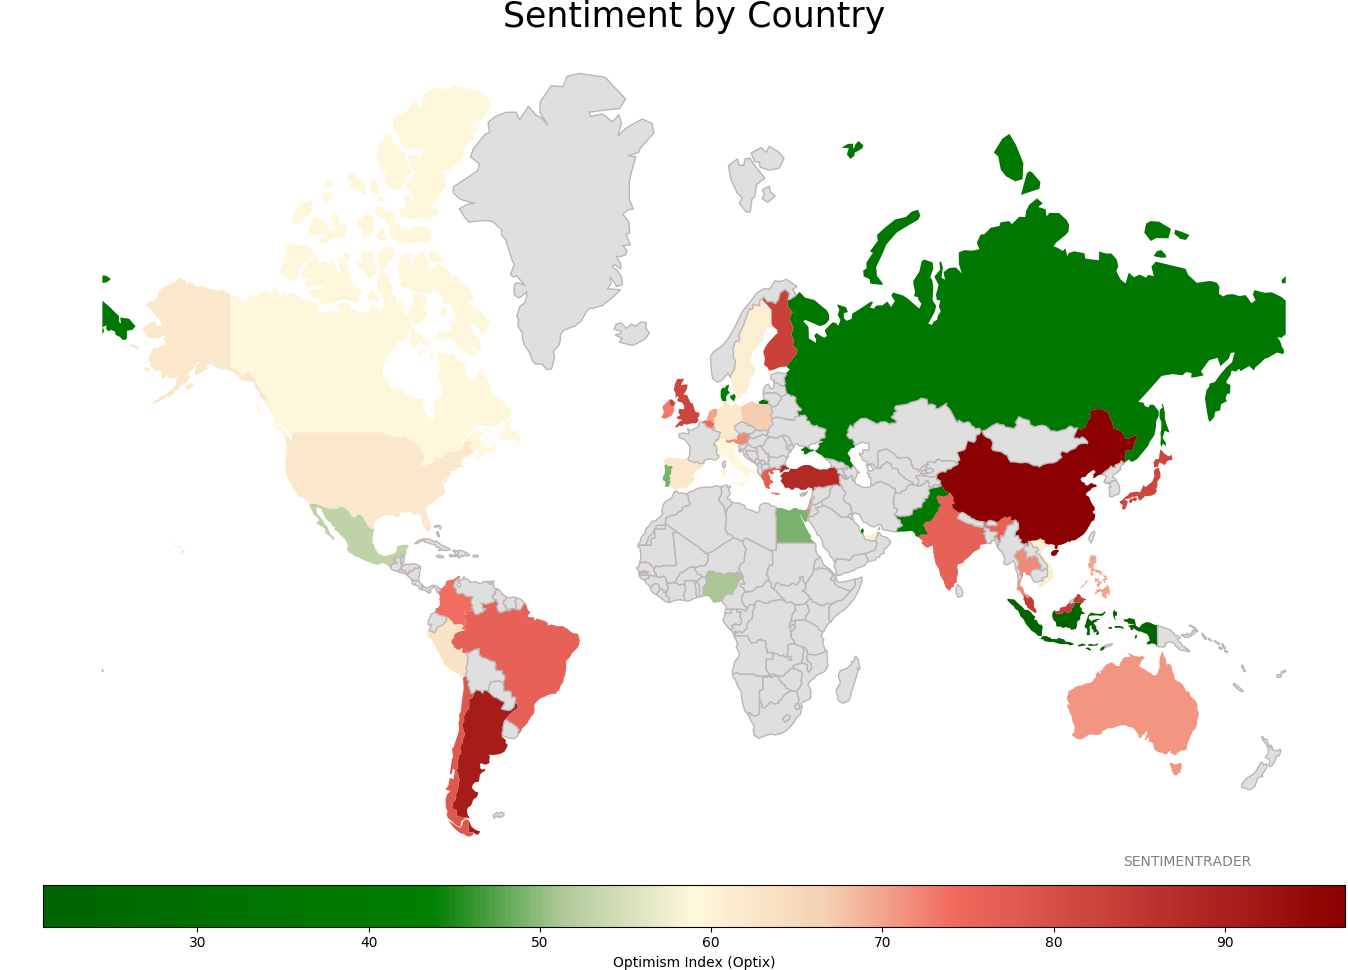
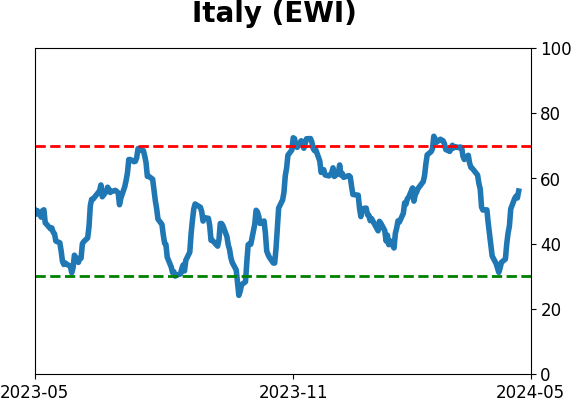
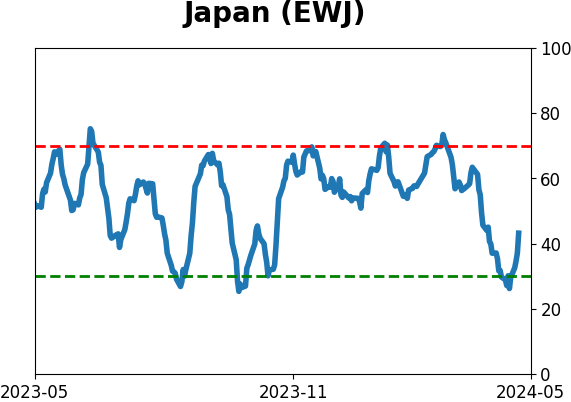
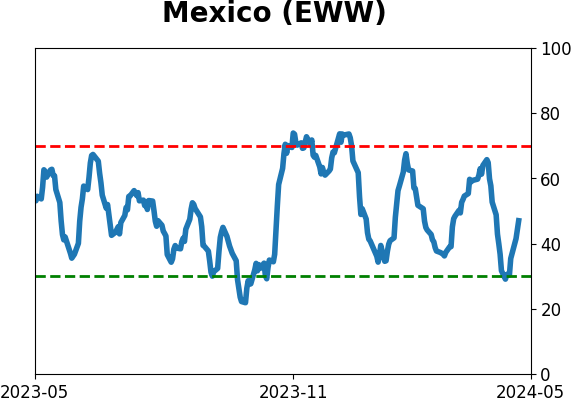
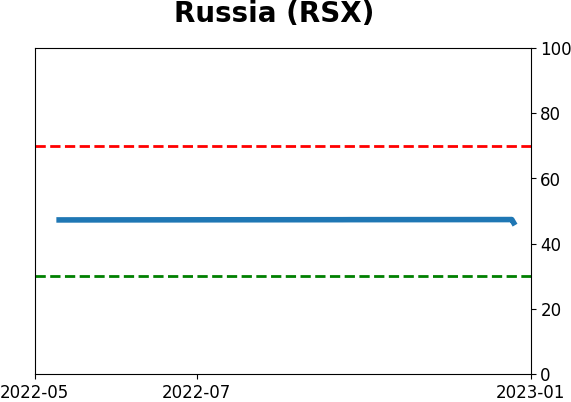
Sentiment Around The World
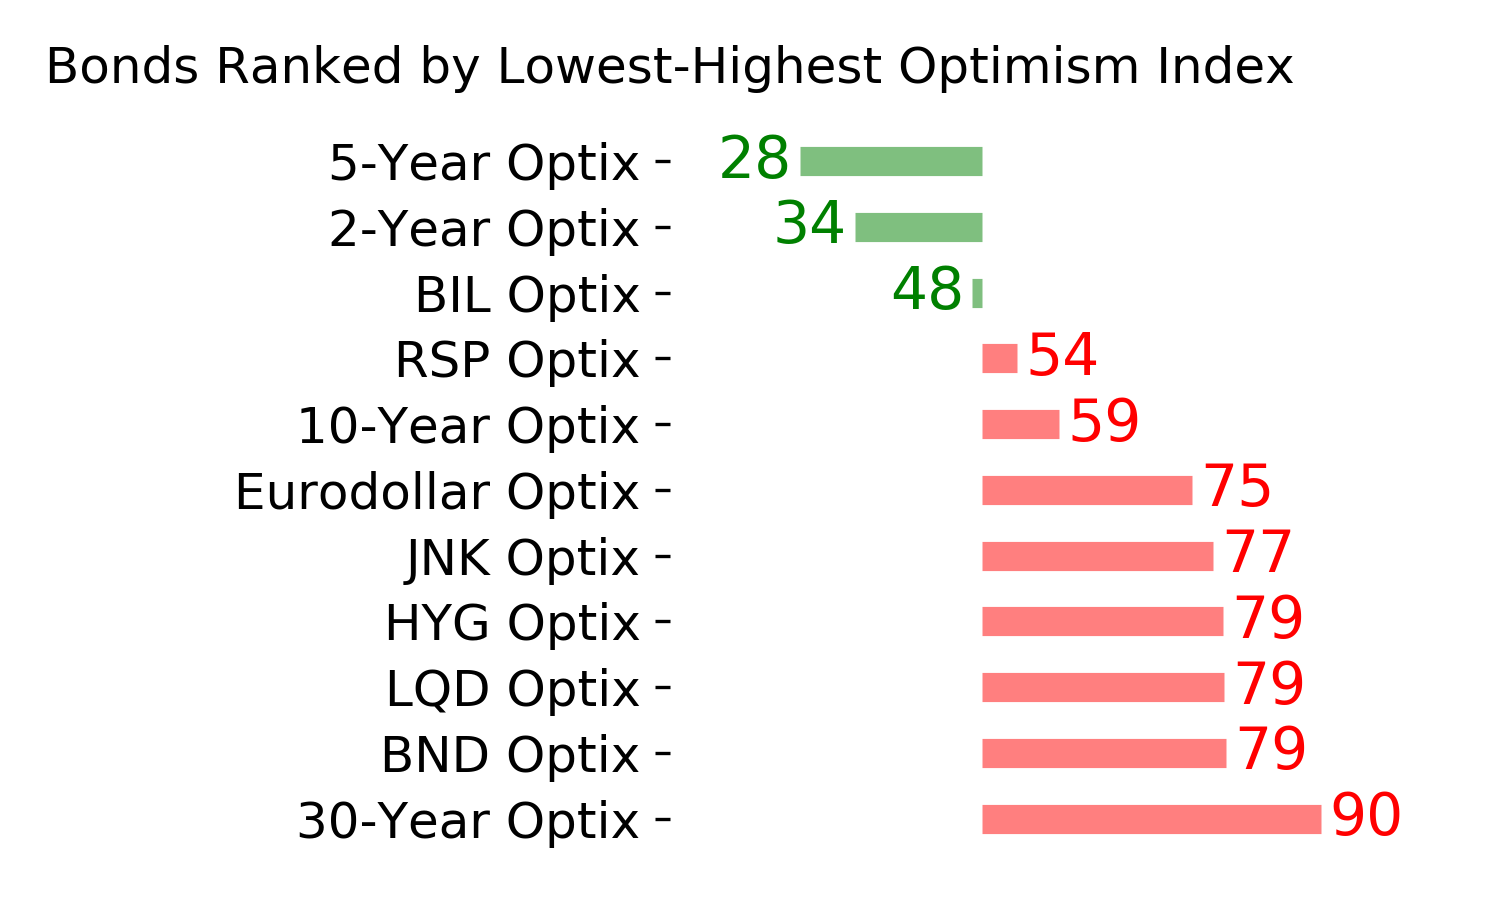
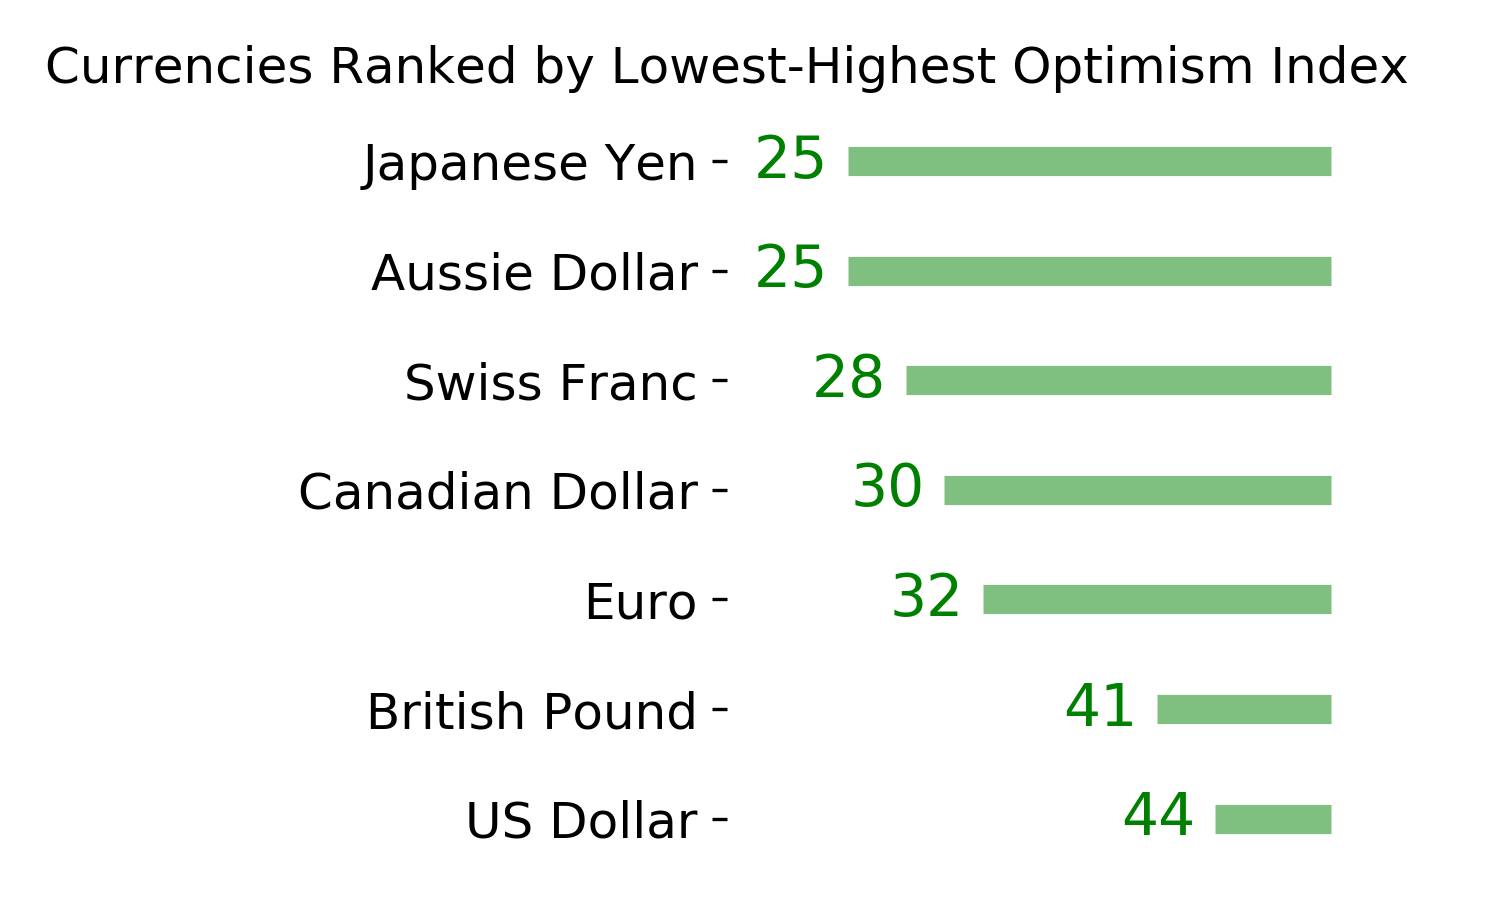
Optimism Index Thumbnails
|
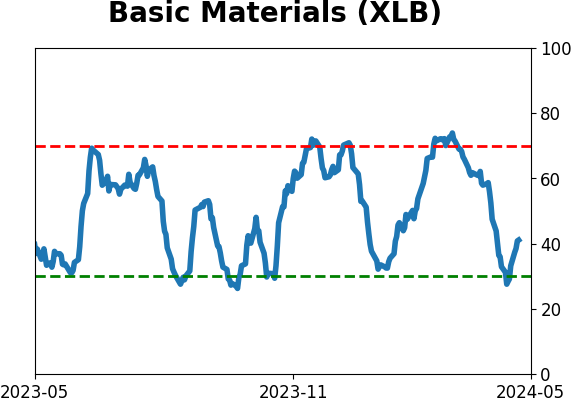
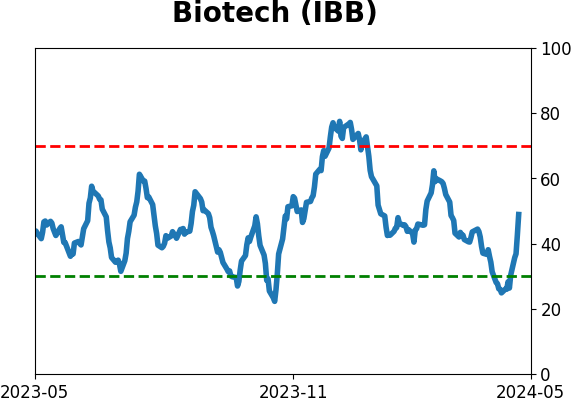
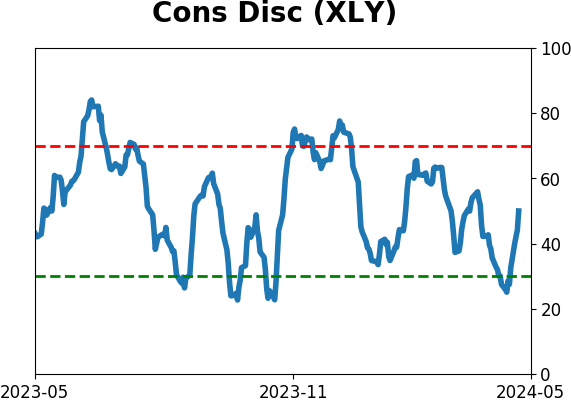
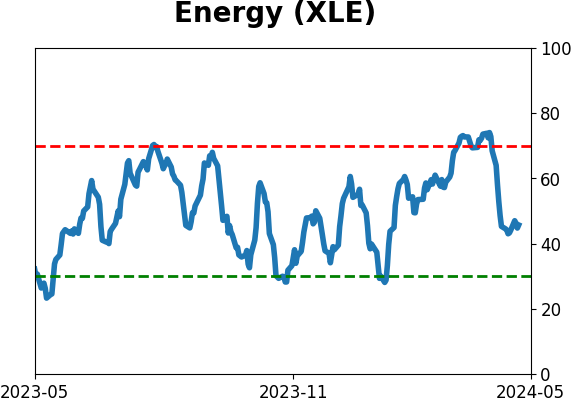
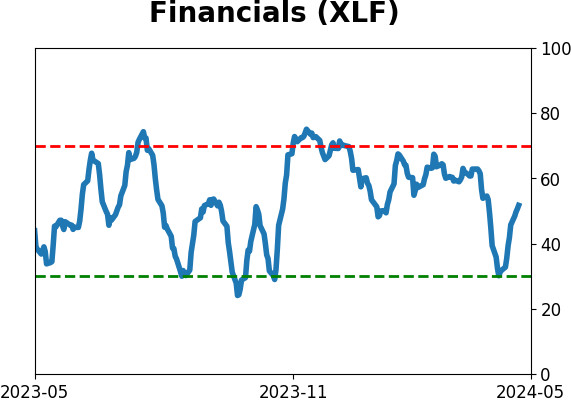
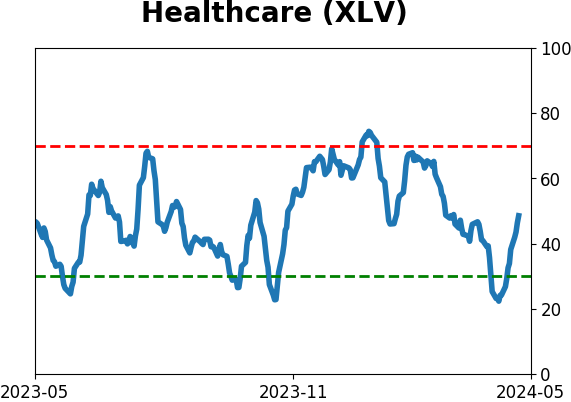
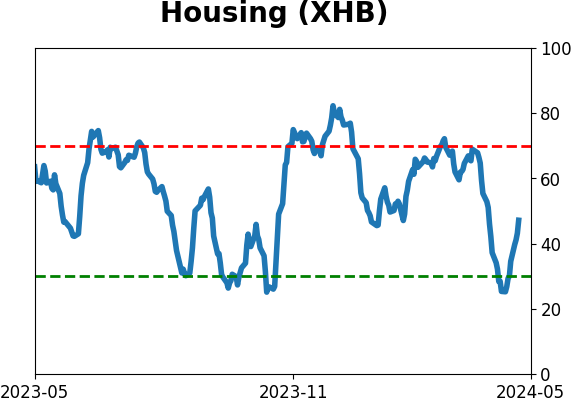
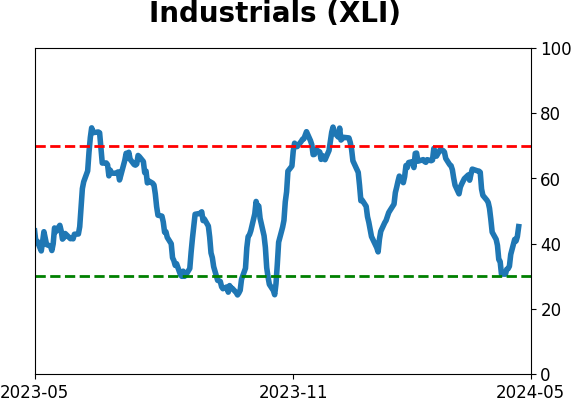
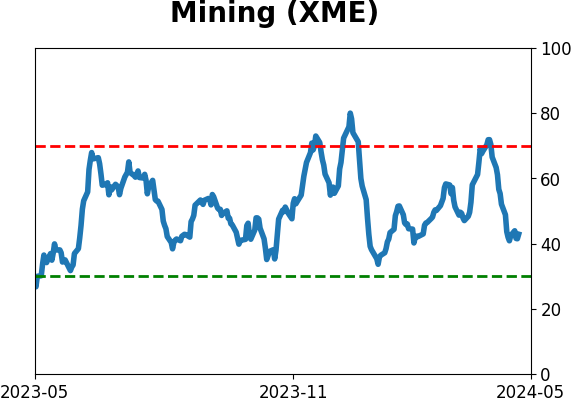
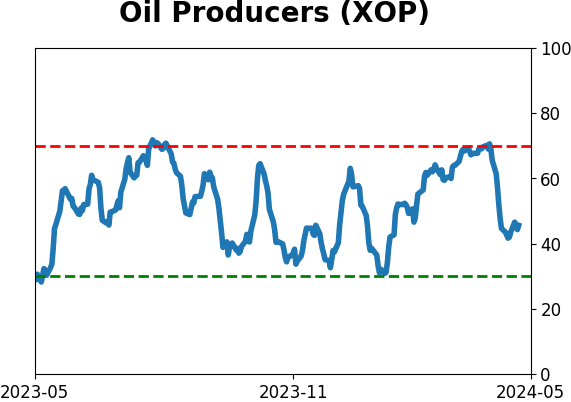
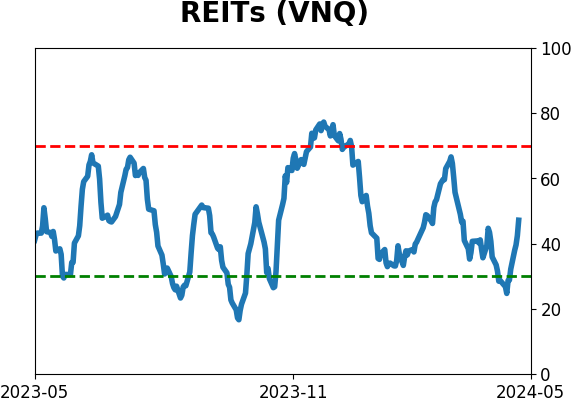
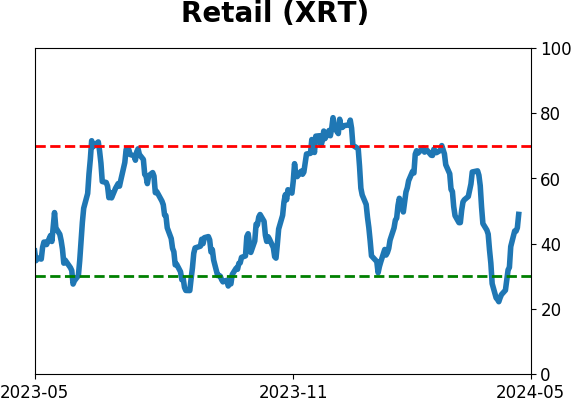
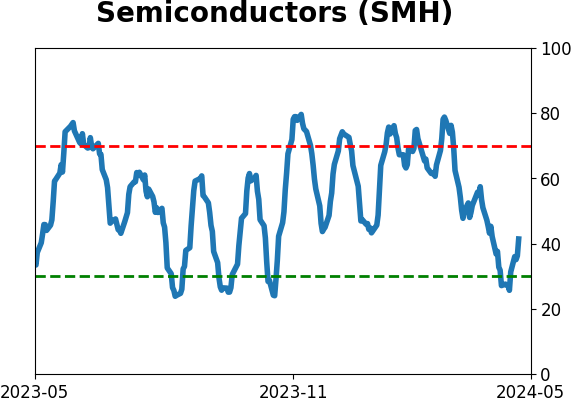
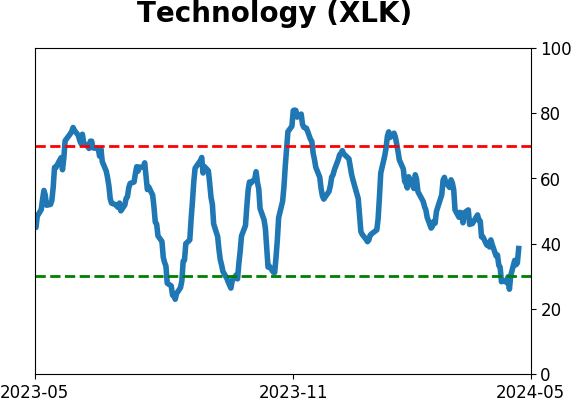
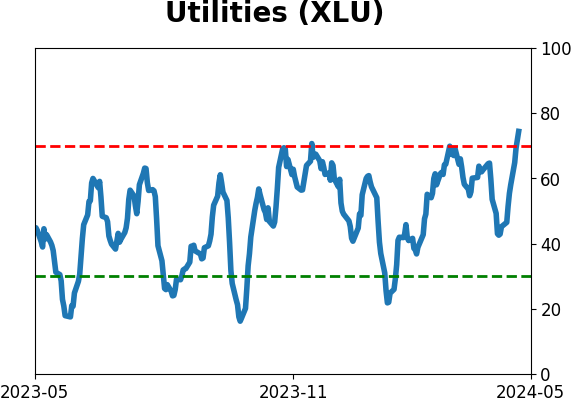
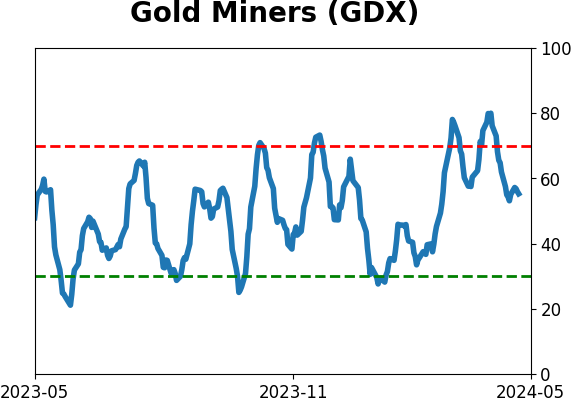
Sector ETF's - 10-Day Moving Average
|
|
|
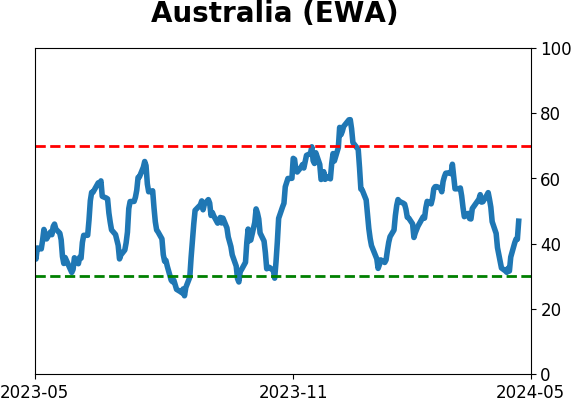
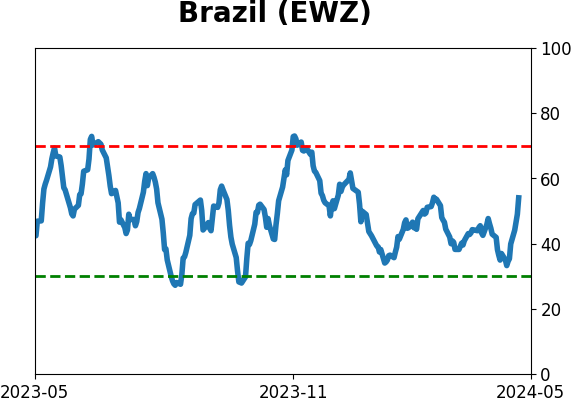
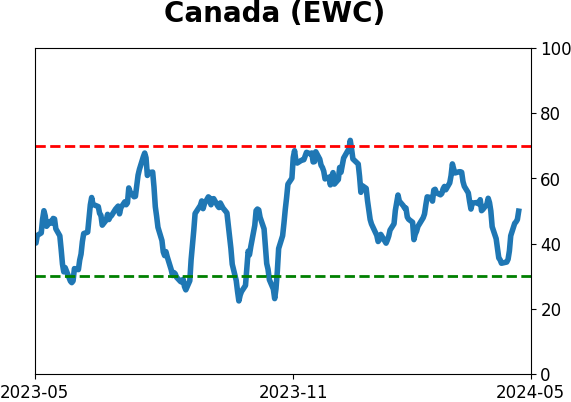
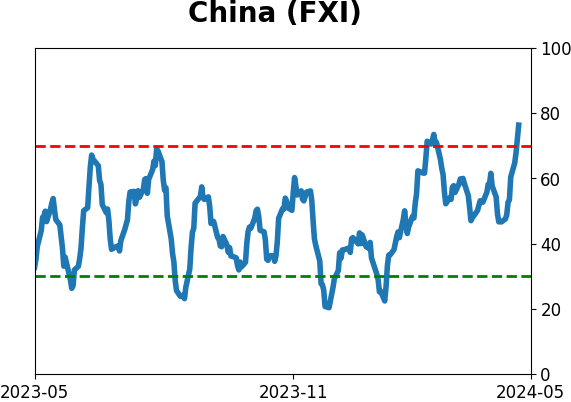
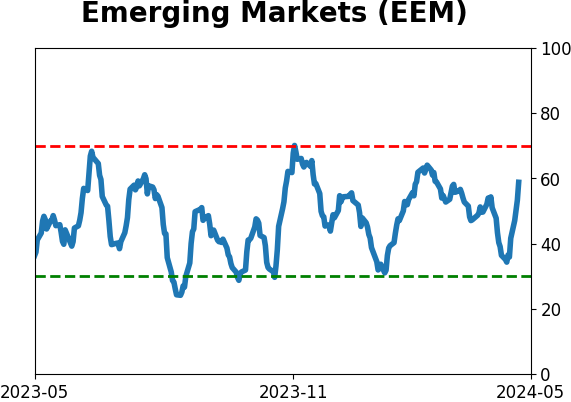
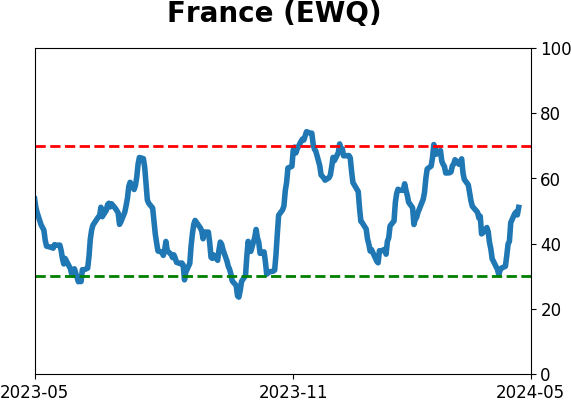
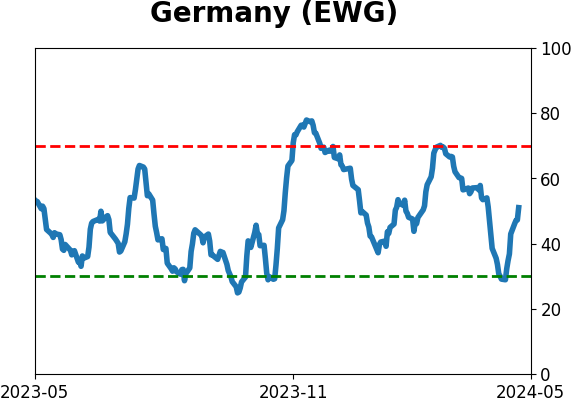
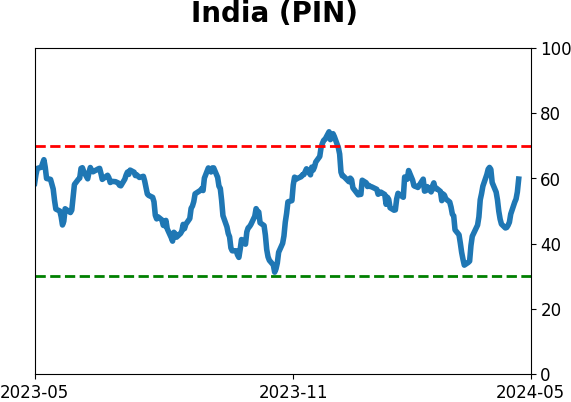
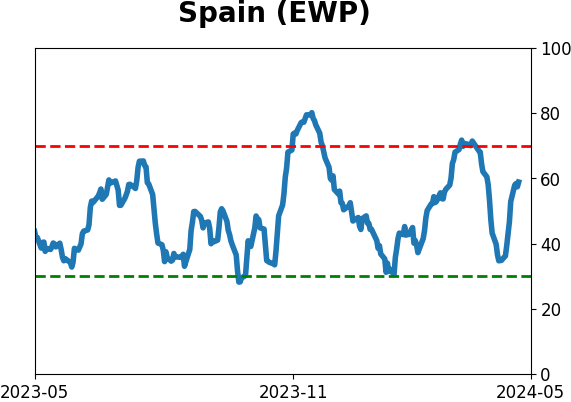
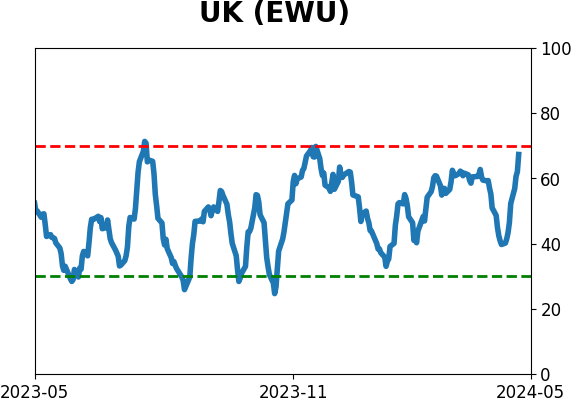
Country ETF's - 10-Day Moving Average
|
|
|
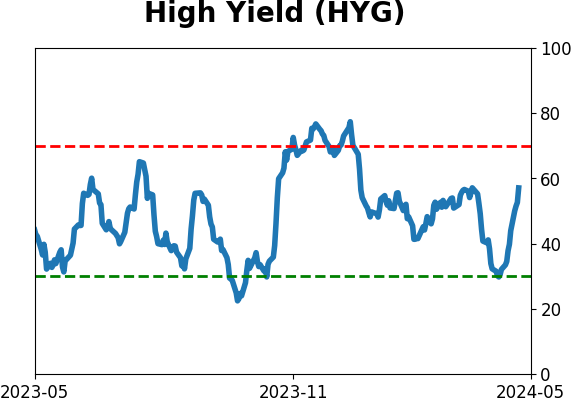
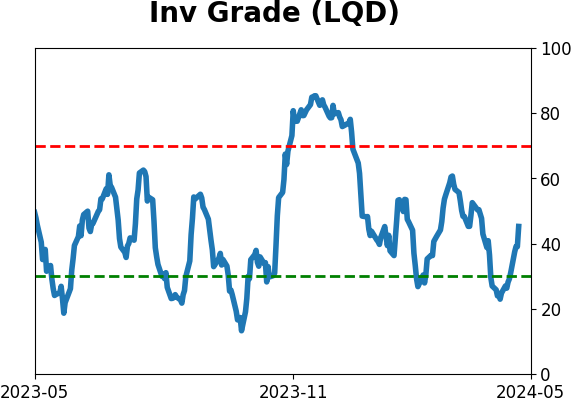
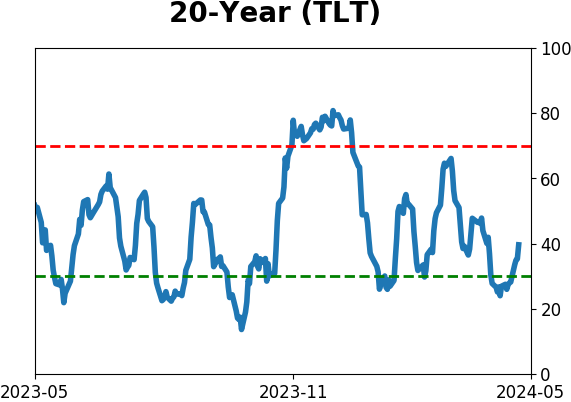
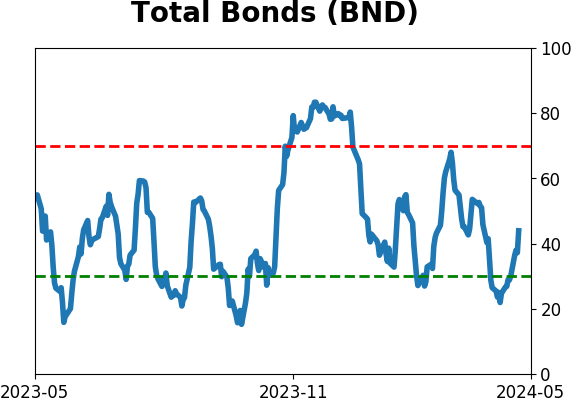
Bond ETF's - 10-Day Moving Average
|
|
|
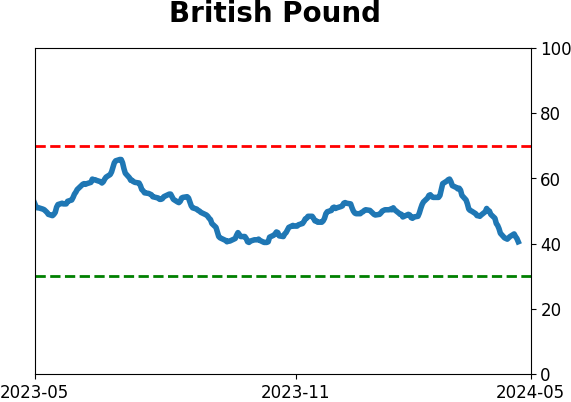
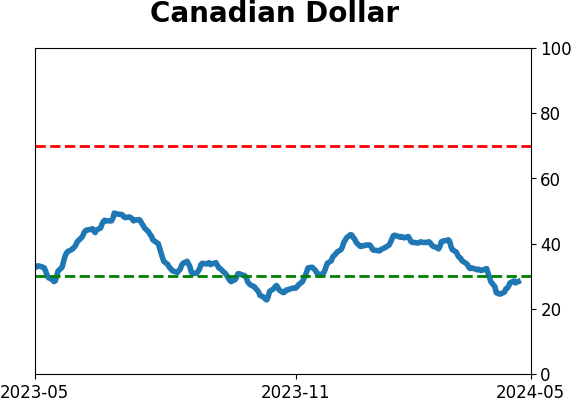
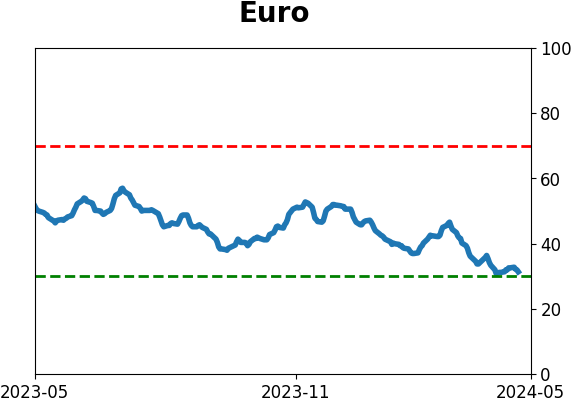
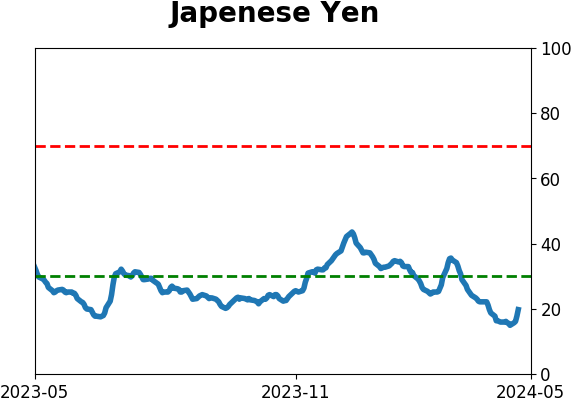
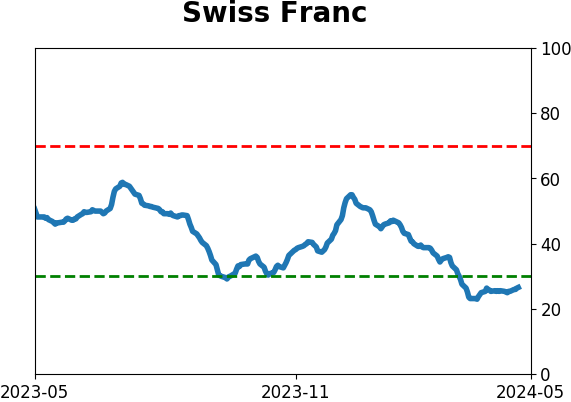
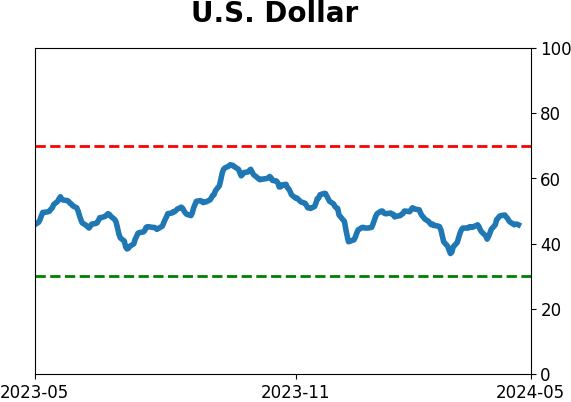
Currency ETF's - 5-Day Moving Average
|
|
|
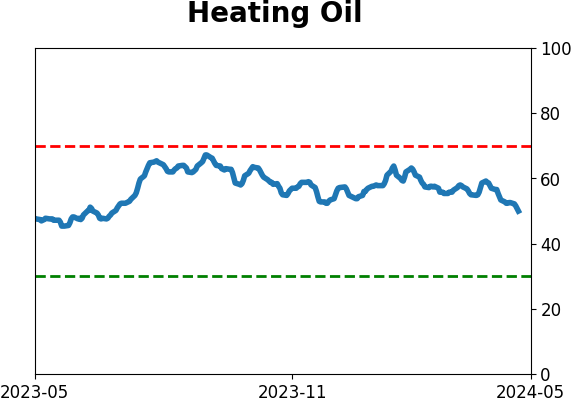
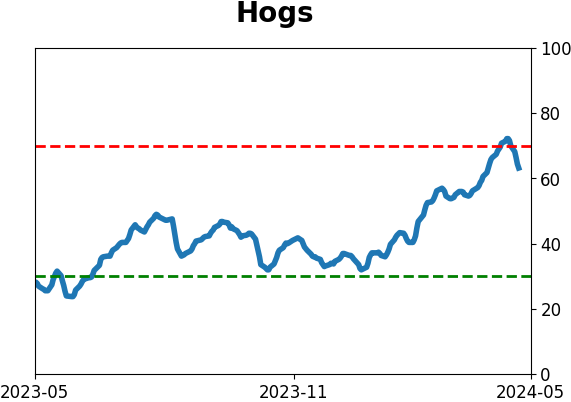
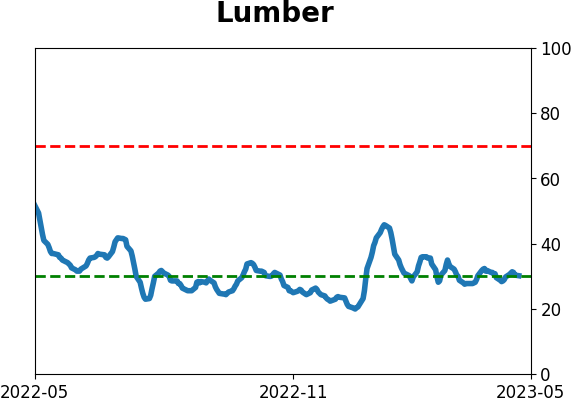
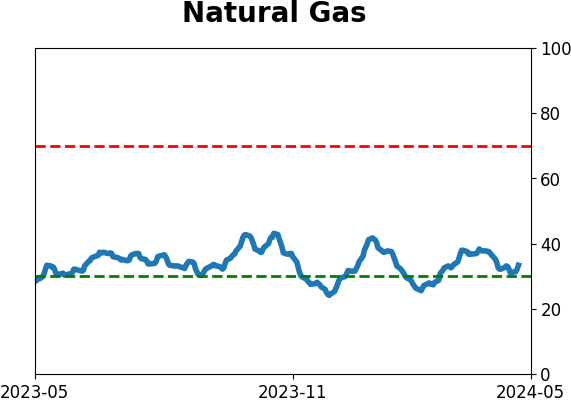
Commodity ETF's - 5-Day Moving Average
|
|