Headlines
|
|
Nasdaq "breadth" falls to a record low:
For the first time in months, the Cumulative Advance/Decline Line on the Nasdaq has fallen to a new low. Over the past 40 years, the line has had a persistent negative bias, and new lows in it have not consistently preceded negative returns for the Nasdaq Composite, especially after the first month.
|
Smart / Dumb Money Confidence
|
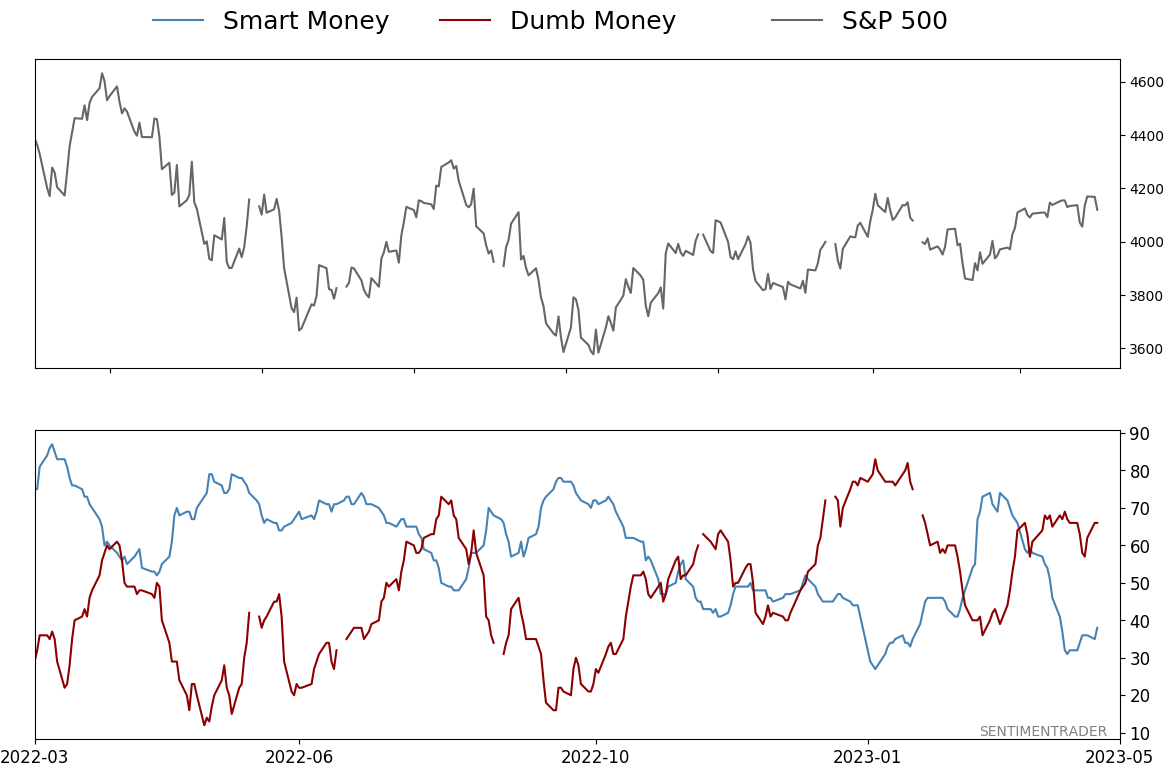
Smart Money Confidence: 38%
Dumb Money Confidence: 66%
|
|
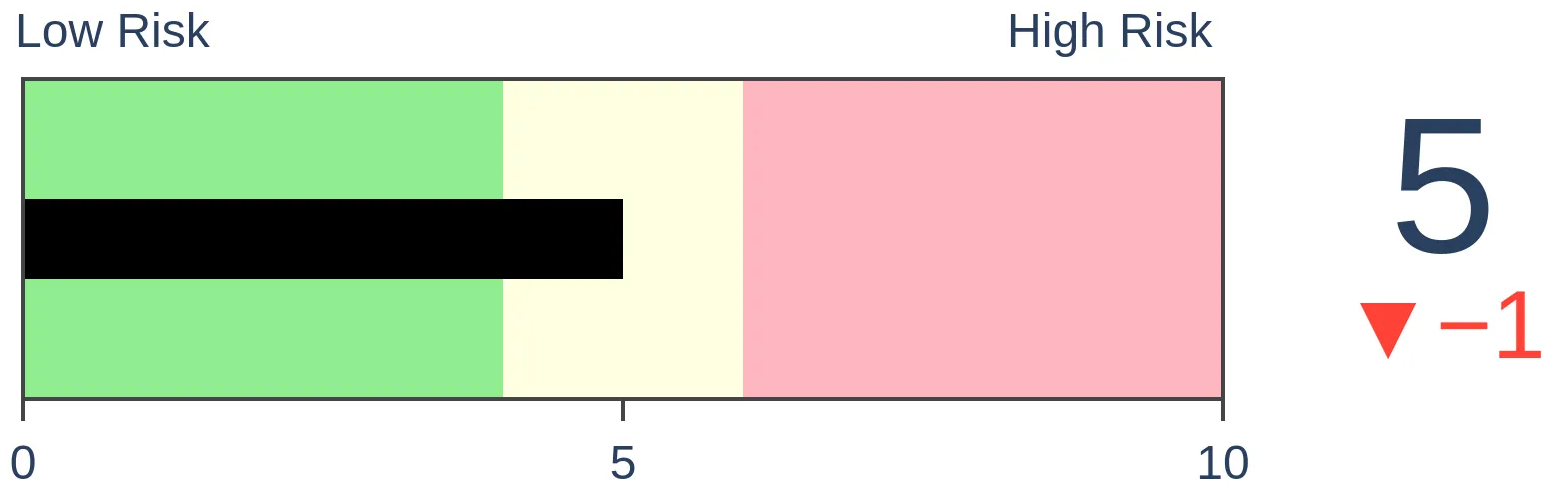
Risk Levels
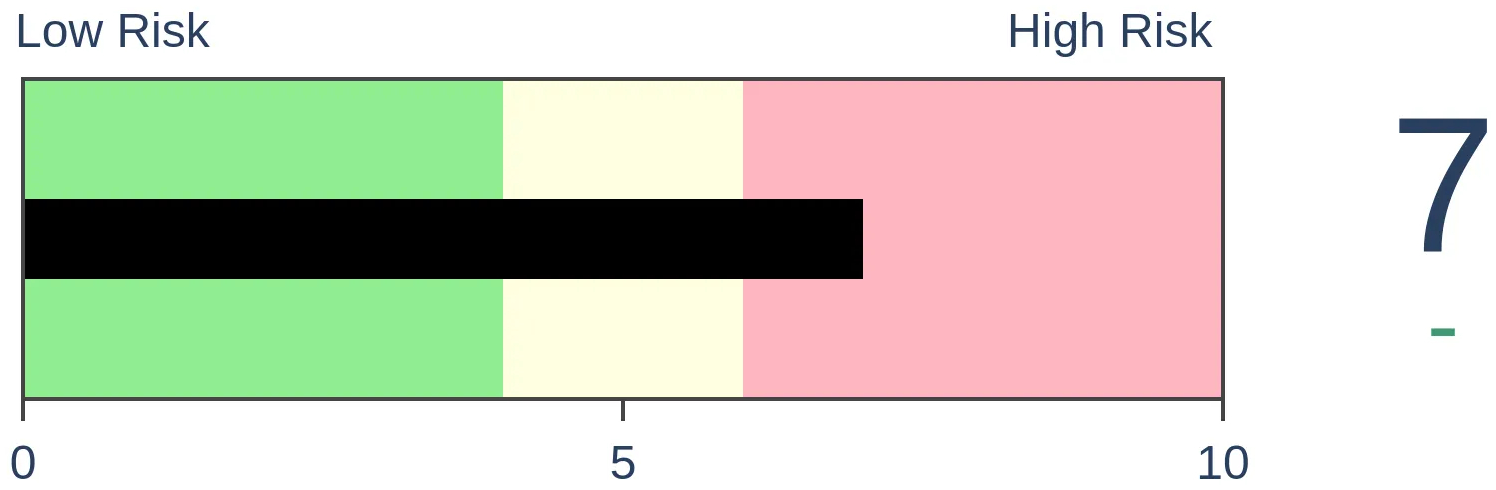
Stocks Short-Term
|
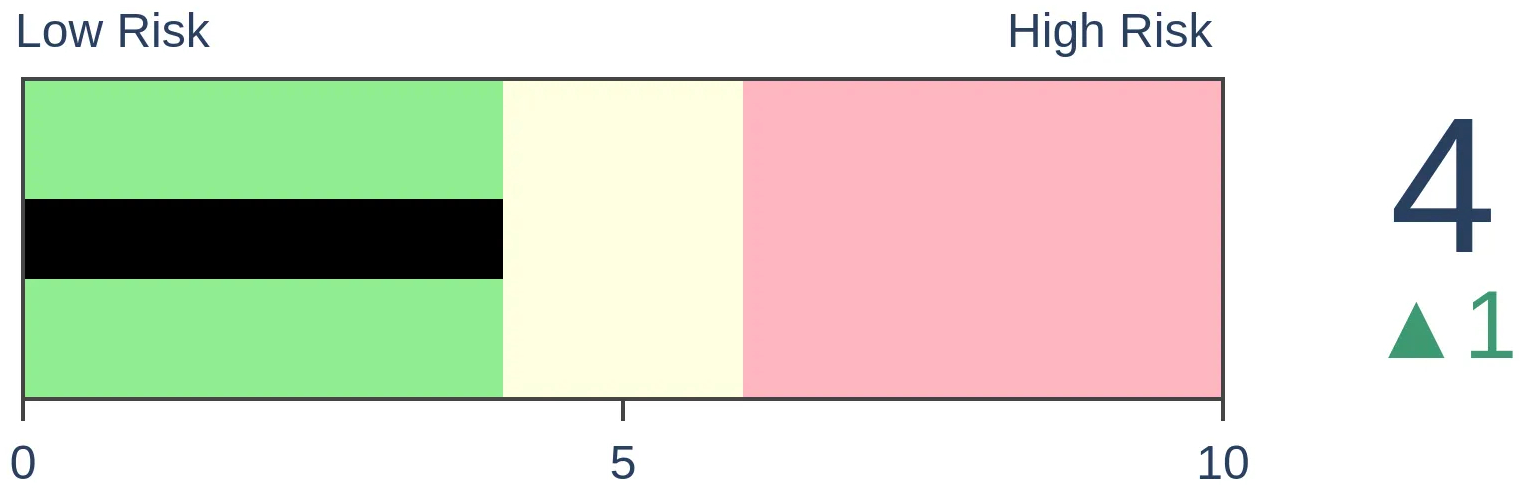
Stocks Medium-Term
|
|
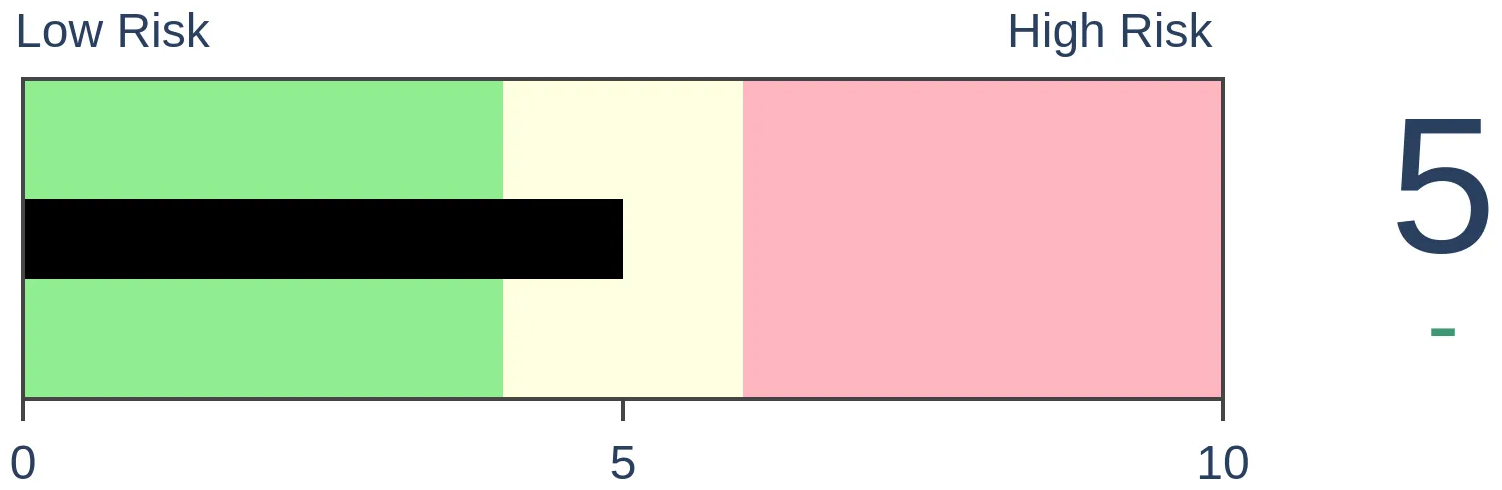
Bonds
|
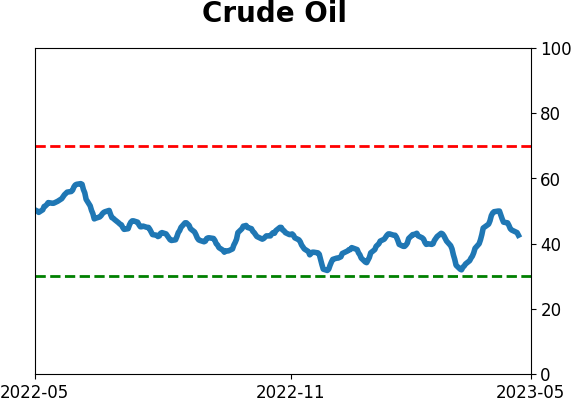
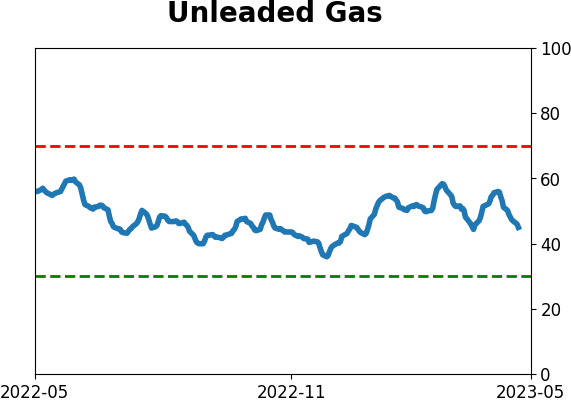
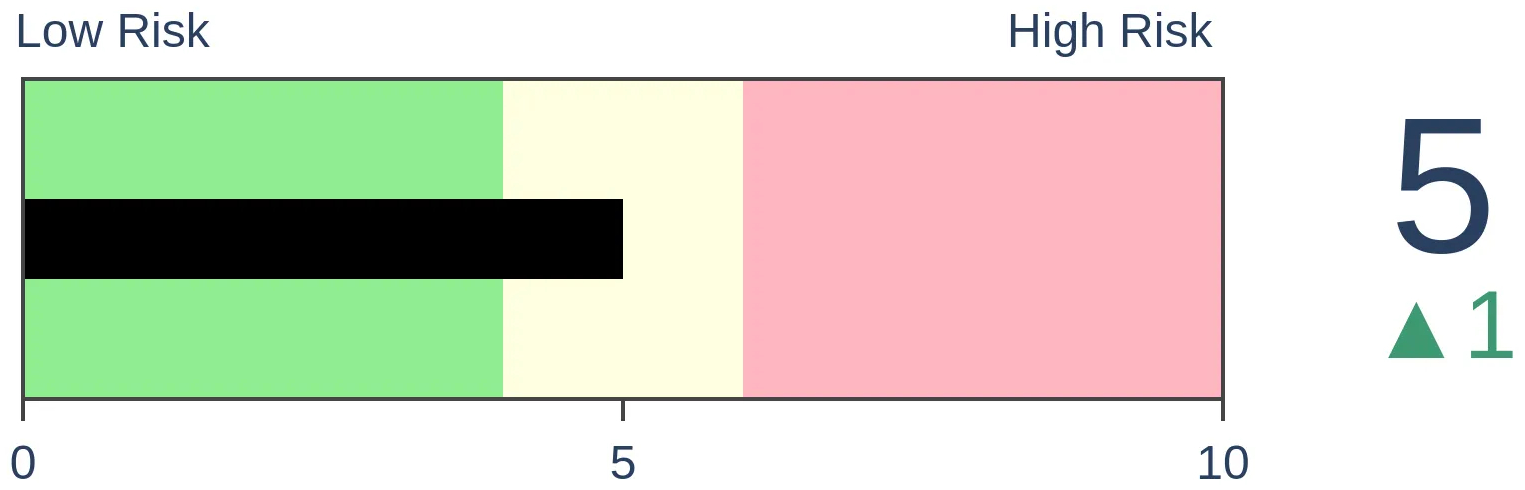
Crude Oil
|
|
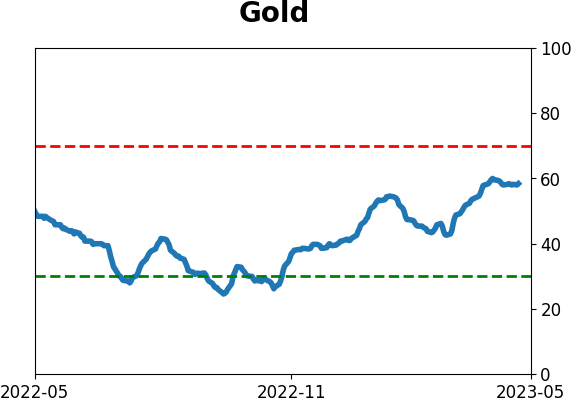
Gold
|
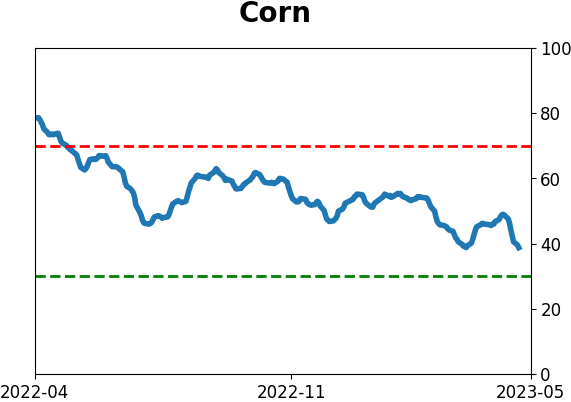
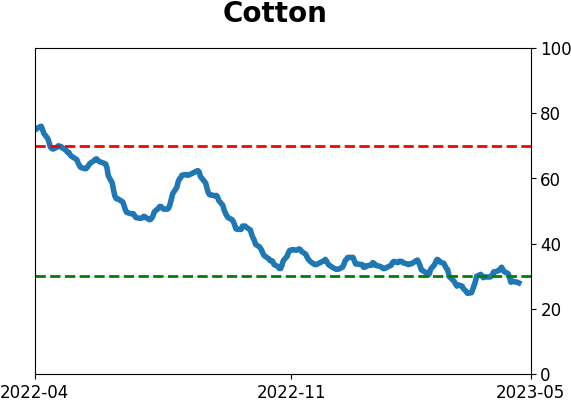
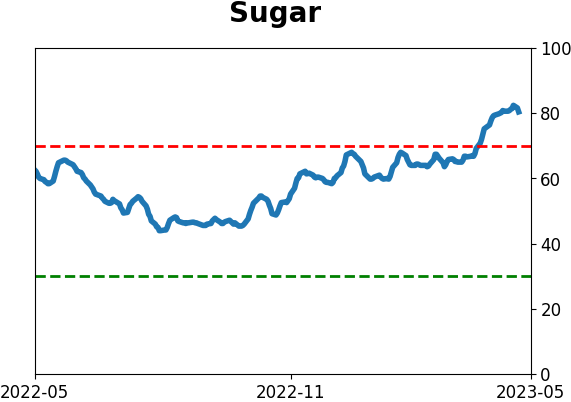
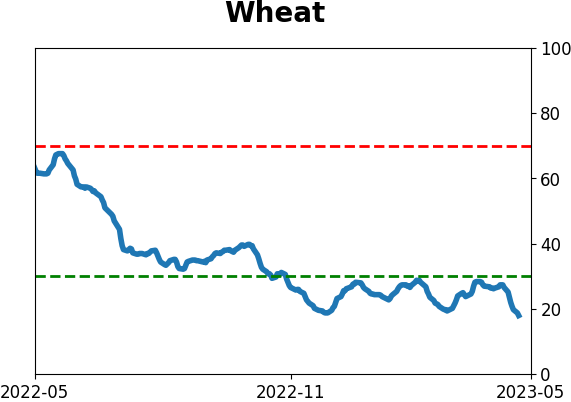
Agriculture

|
|
Research
By Jason Goepfert
BOTTOM LINE
For the first time in months, the Cumulative Advance/Decline Line on the Nasdaq has fallen to a new low. Over the past 40 years, the line has had a persistent negative bias, and new lows in it have not consistently preceded negative returns for the Nasdaq Composite, especially after the first month.
FORECAST / TIMEFRAME
None
|
Key points:
- The Advance/Decline Line for the Nasdaq Composite has reached a new low
- Over the history of the index, there has been a steady decline in the line as most securities decline
- New lows in the line have not consistently preceded negative returns other than short-term
Nasdaq securities show a persistent downtrend
Only a few stocks are holding this market up. At least, that's one of the many arguments from those who insist on being bearish. Undoubtedly, a handful of stocks are doing more than their part, but we looked at this a few weeks ago and found the bearish argument lacking.
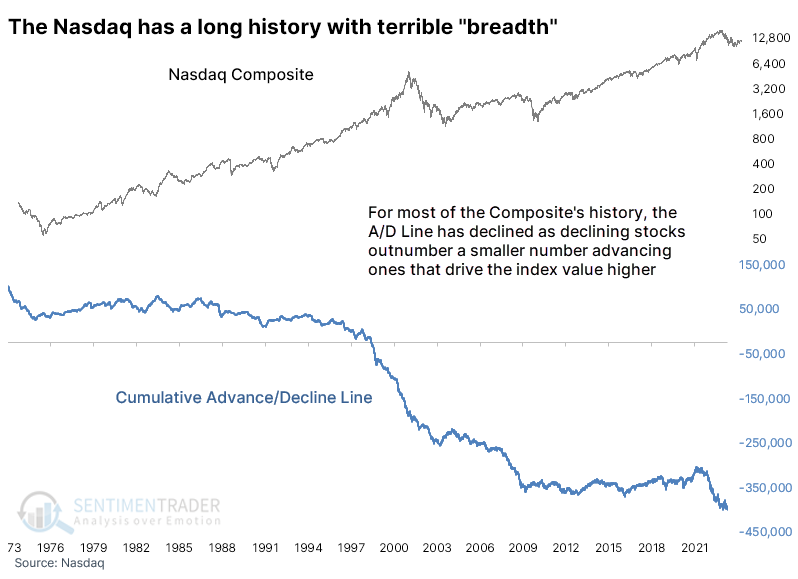
The new shiny object for the "bad breadth" crowd is the Cumulative Advance/Decline Line using all securities listed on the Nasdaq. We've looked at this several times over the decades, and there's a reason why we don't discuss it often; the Nasdaq is littered with iffy securities and always has been.
The most common condition daily on that exchange is for more securities to decline in price than rise. A smattering of star stocks is the only thing that drives the Nasdaq Composite index higher - most issues listed there drag on performance. Since inception, the cumulative effect of the daily net number of advancing minus declining securities has been negative.
New lows in the A/D Line have not been a consistent worry
Let's look at the biggest worry right now (apparently), which is a new multi-year low in the Nasdaq's Cumulative Advance/Decline Line. The table below shows every time the line has reached a new low for the first time in months.
This was a pretty good heads-up to get out the last time it triggered, last September. At least, it was good for a while, then not so much. After the signal before that, the Nasdaq surged nearly 10% before giving up its gains.
Historically, the Composite has declined more often than not in the first month after these signals, but after that, it was not a good excuse to be negative. A year later, the Nasdaq's median return was nearly three standard deviations above a random one-year return.
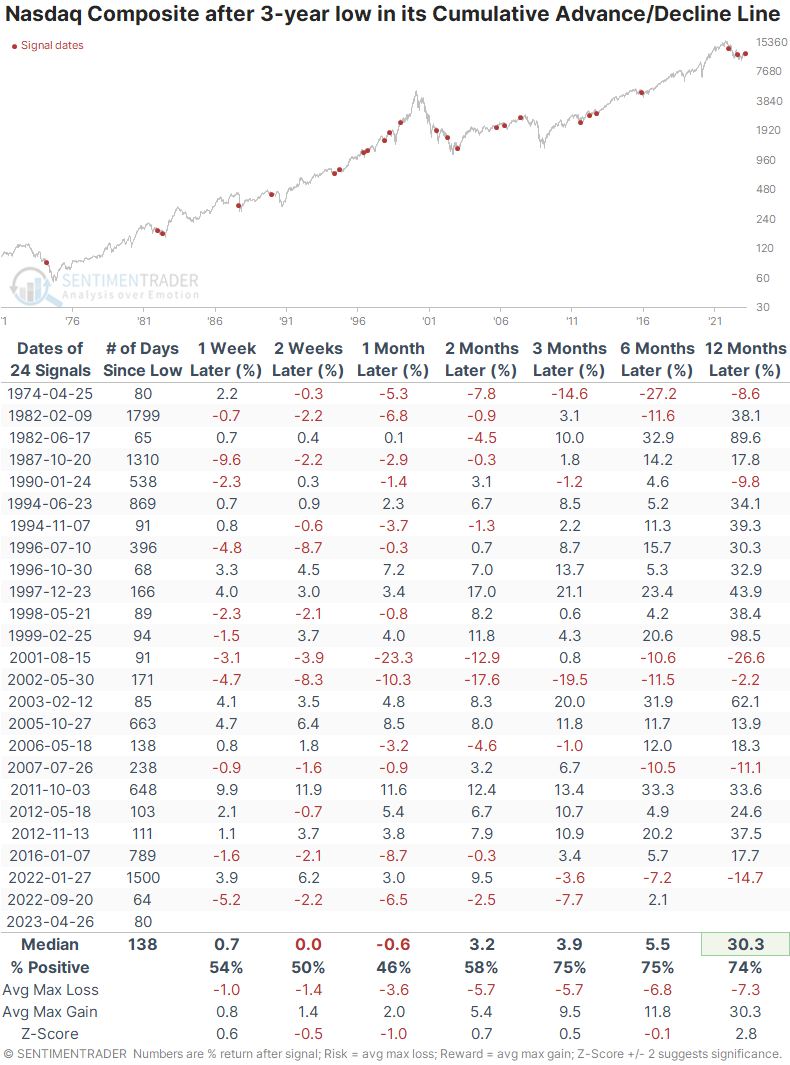
The Nasdaq Composite suffered double-digit losses within the next year after nine of these signals, which is a bit of a worry. But it also enjoyed double-digit gains within the next year after twenty of them. That speaks to the index's volatile nature and a long-term uptrend, especially after many of its stocks have declined.
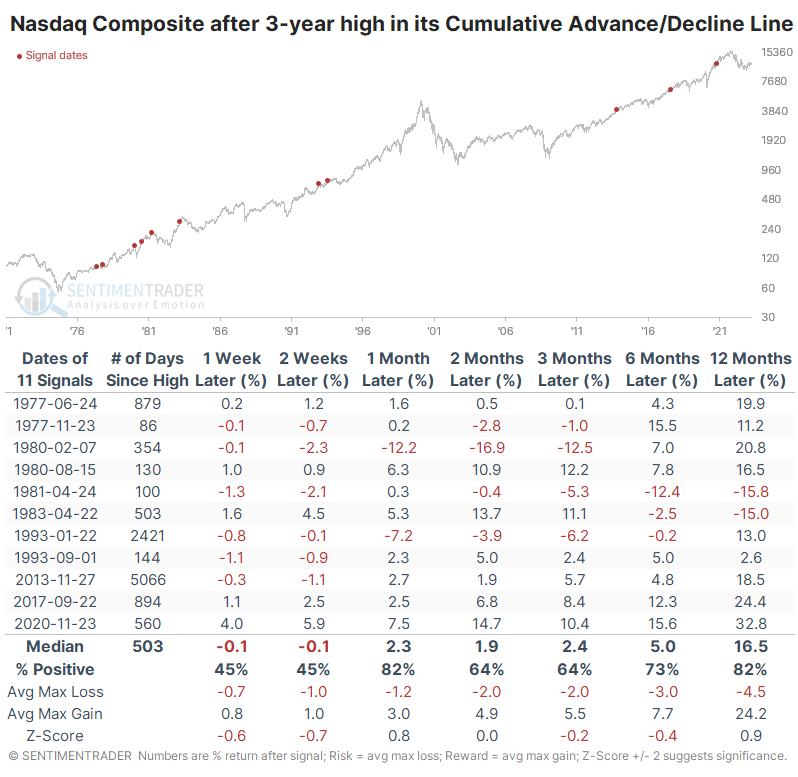
Because the exchange is stuffed with securities that tend to decline, it was twice as hard for the Advance/Decline Line to make a multi-year high. This kind of behavior should sate even the most bearish investors. But the Nasdaq's median return was lower from two months and beyond than when the A/D Line had sunk to a new low.
What the research tells us...
When stocks are performing well, and especially when they are not declining in the face of seemingly bad news, there is a tendency for investors to become complacent. That's one reason we've spent a good deal of time in recent weeks looking at some of the most prominent worries. While there has been some empirical support for those worries, they have almost entirely been short-term, and even then, more of a crap shoot than solid edge. The persistent decline in the Nasdaq's Advance/Decline Line is another one in that camp. There doesn't seem to be much support for the idea that it's a compelling and consistent worry for investors.
Indicators at Extremes
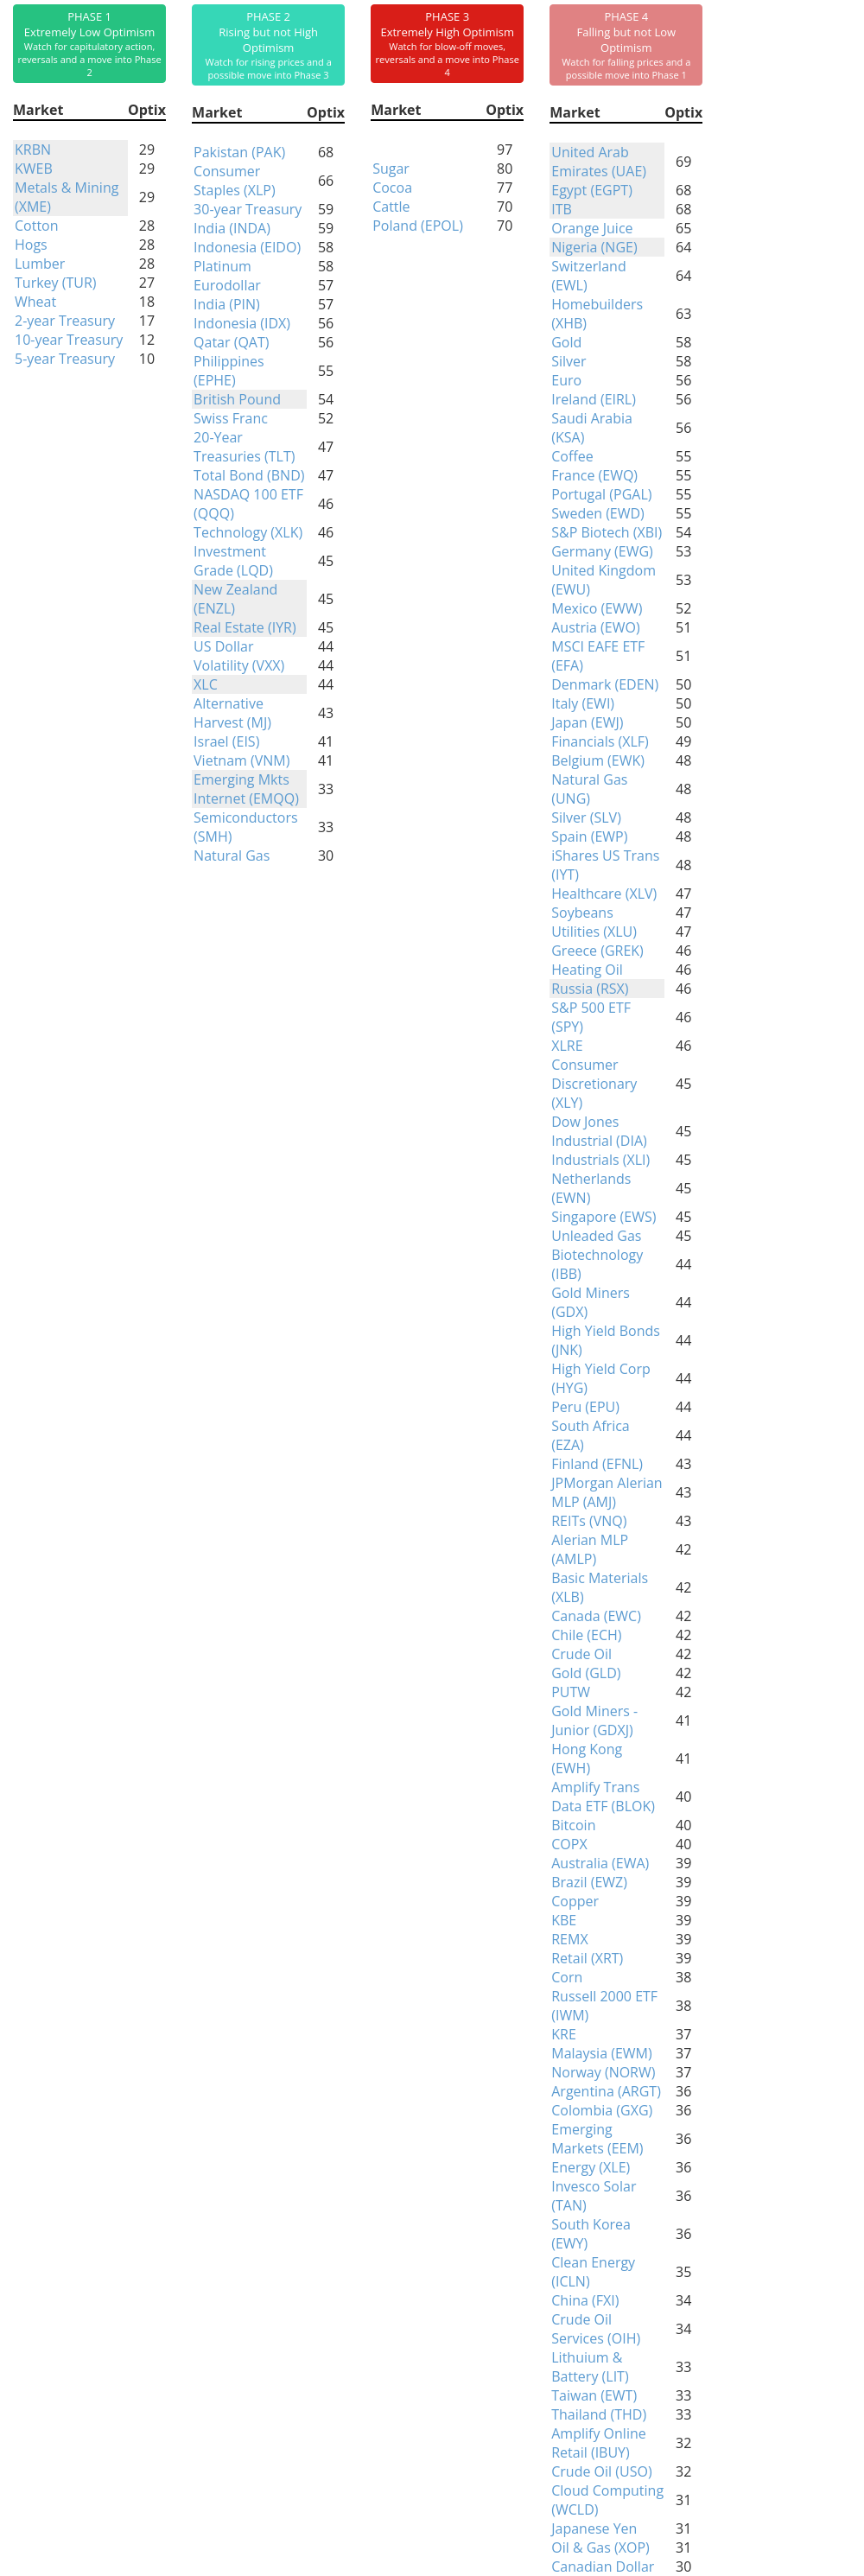
Phase Table
Ranks
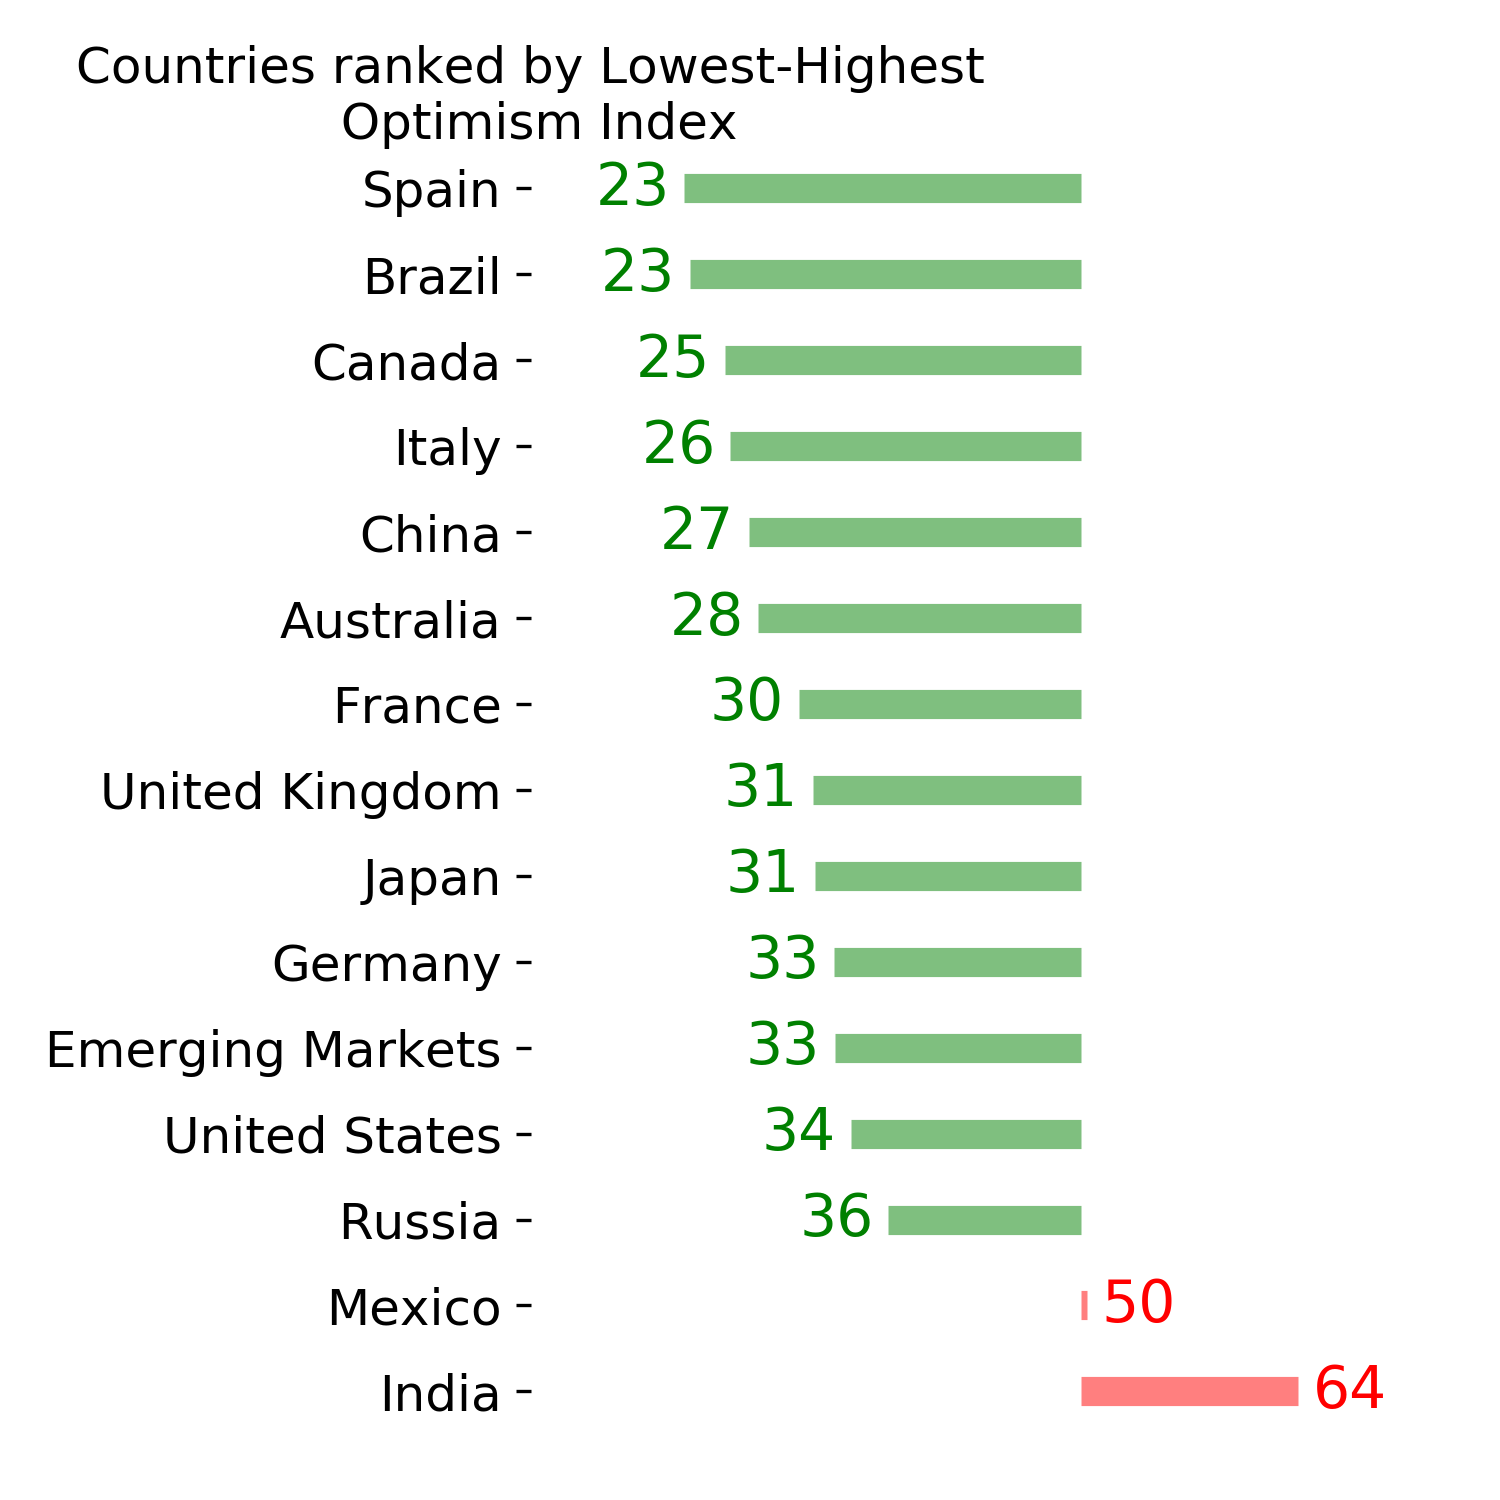
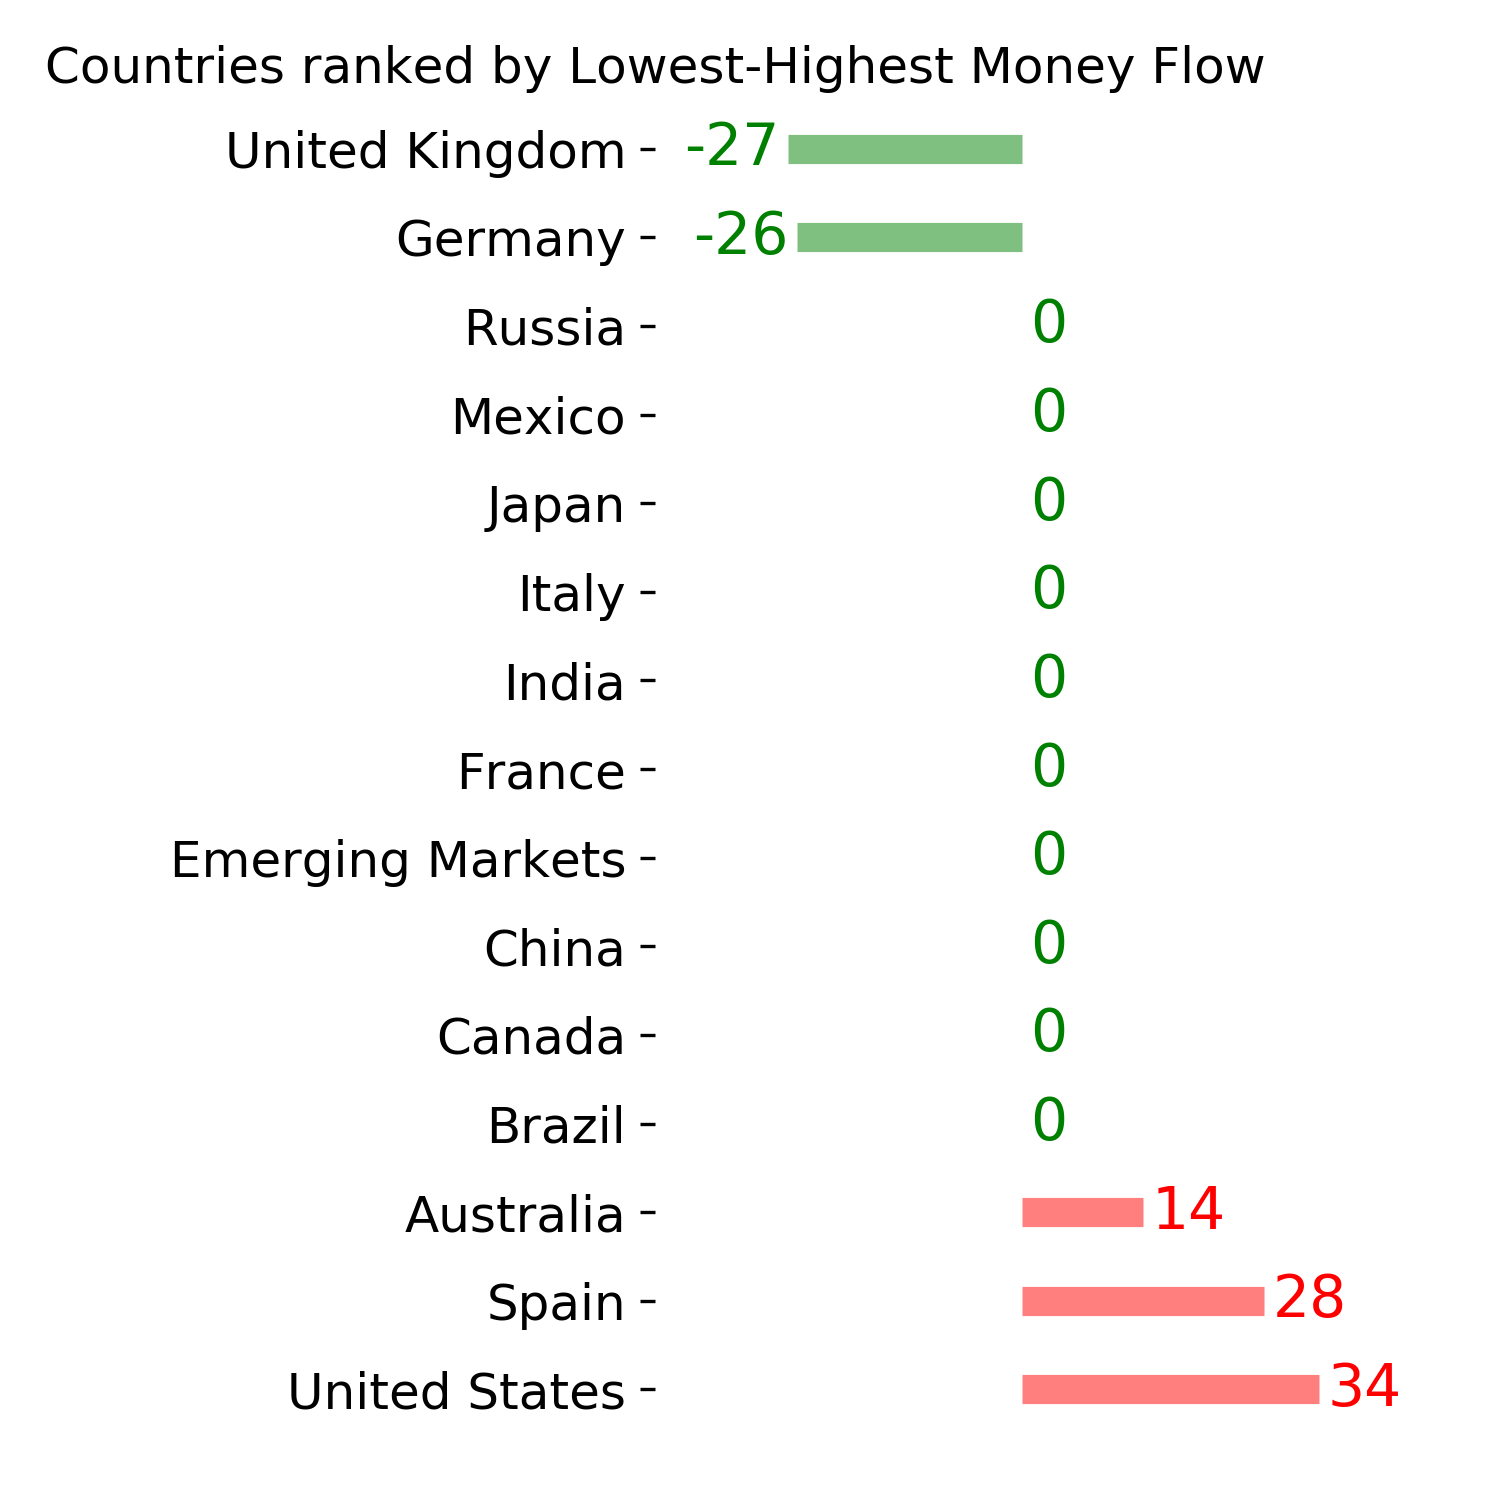
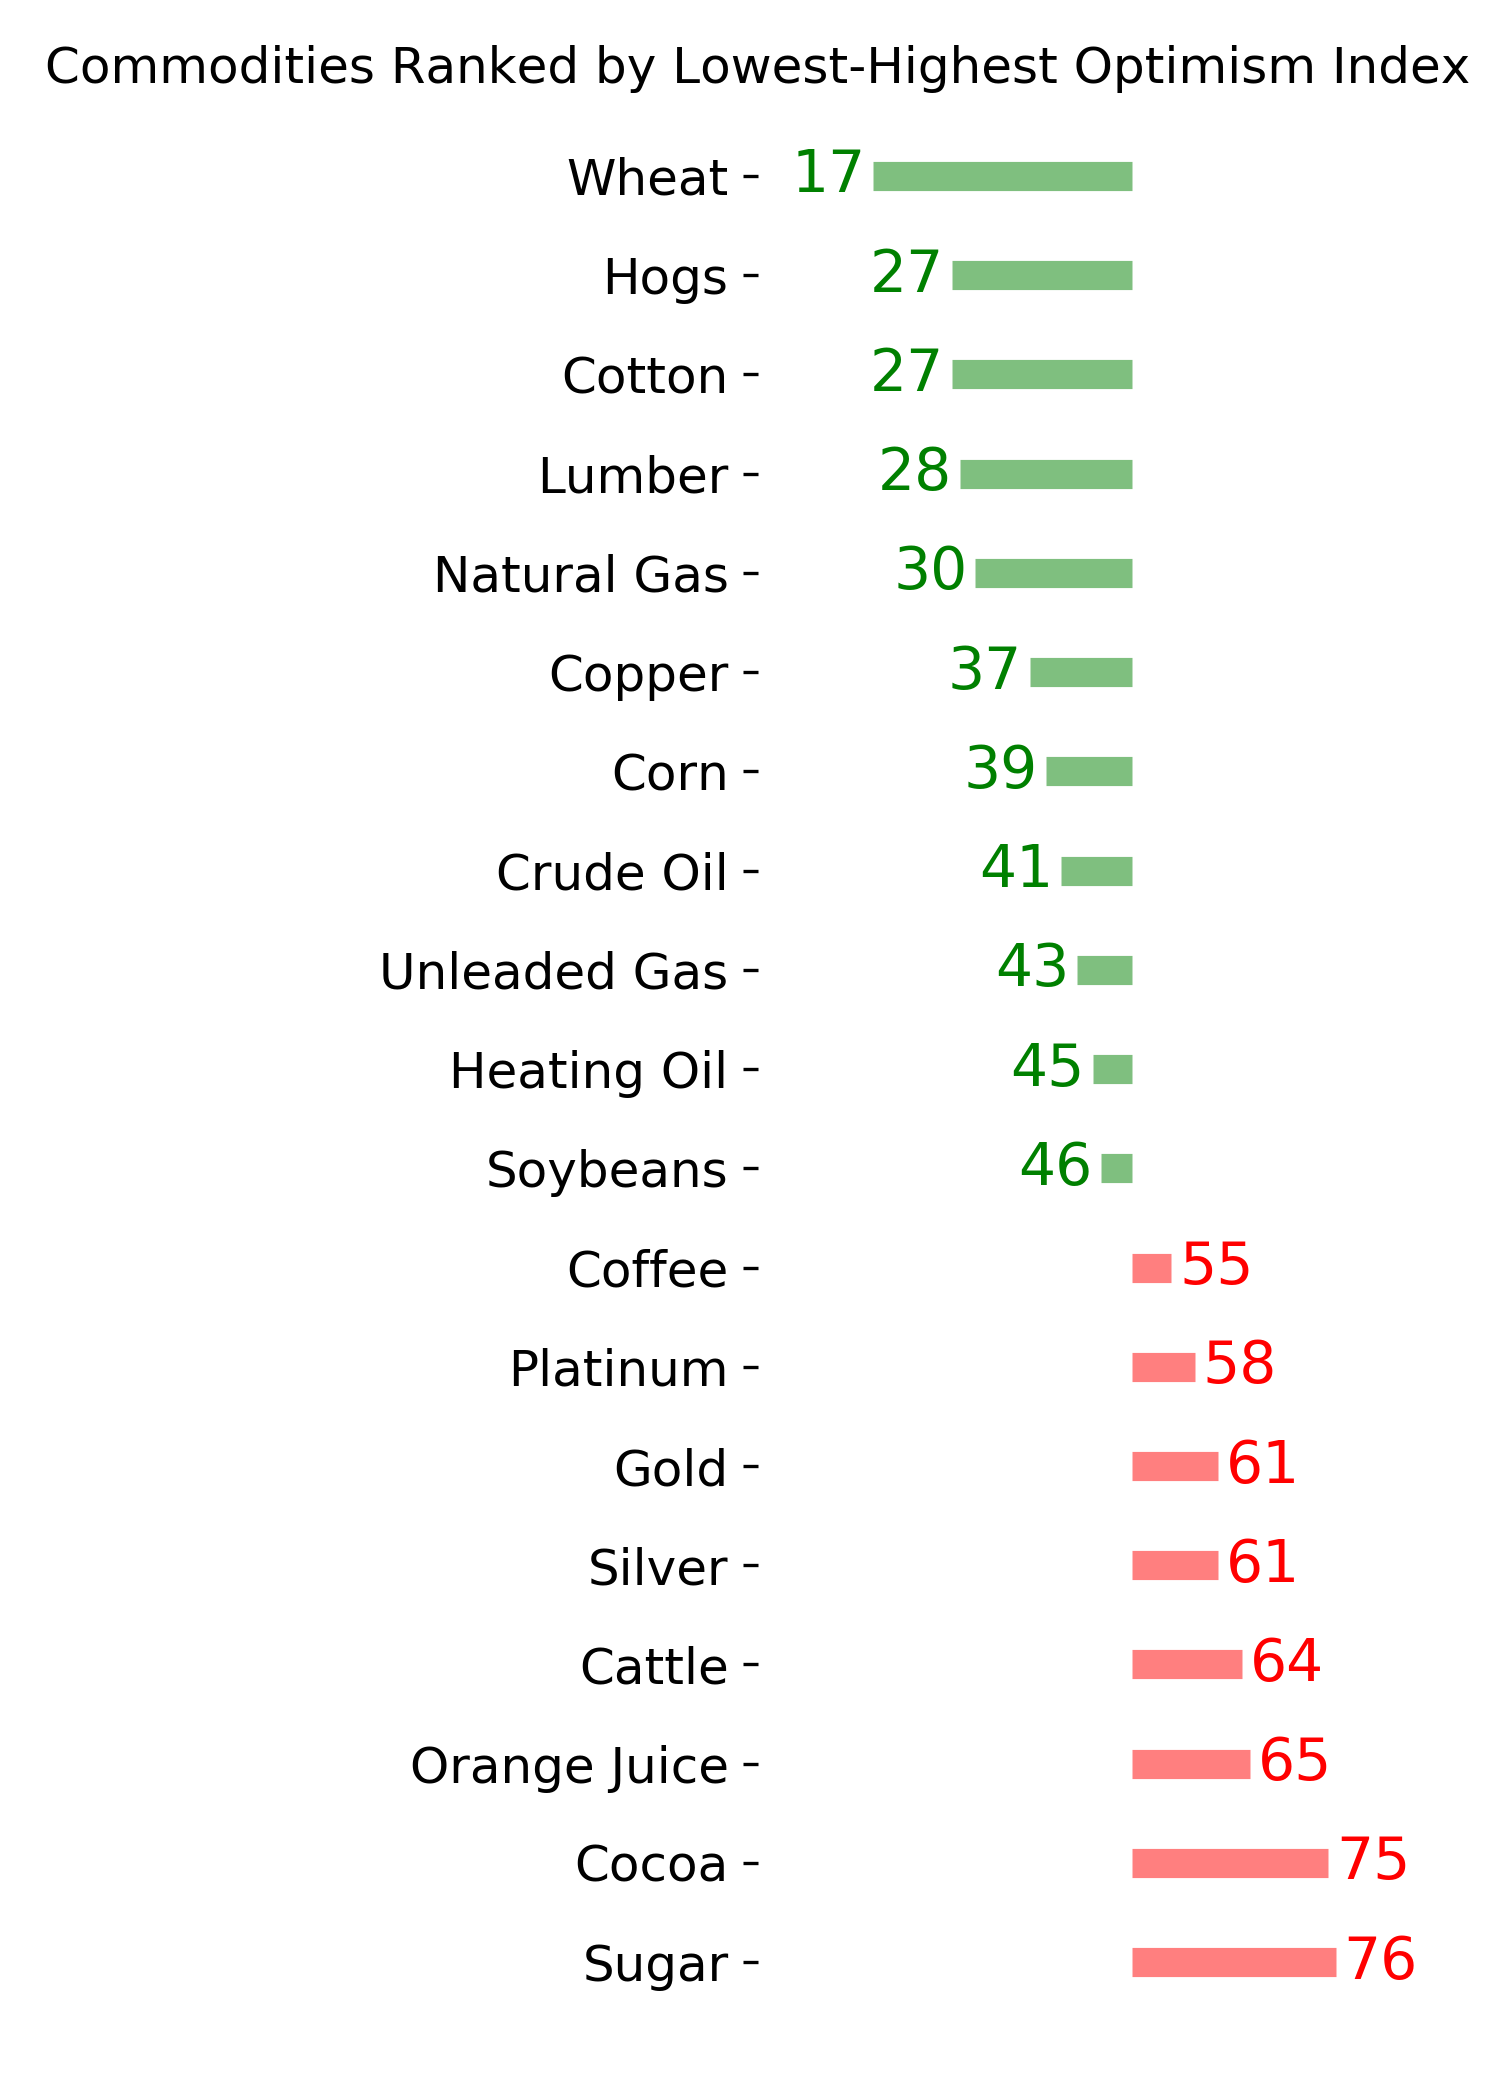
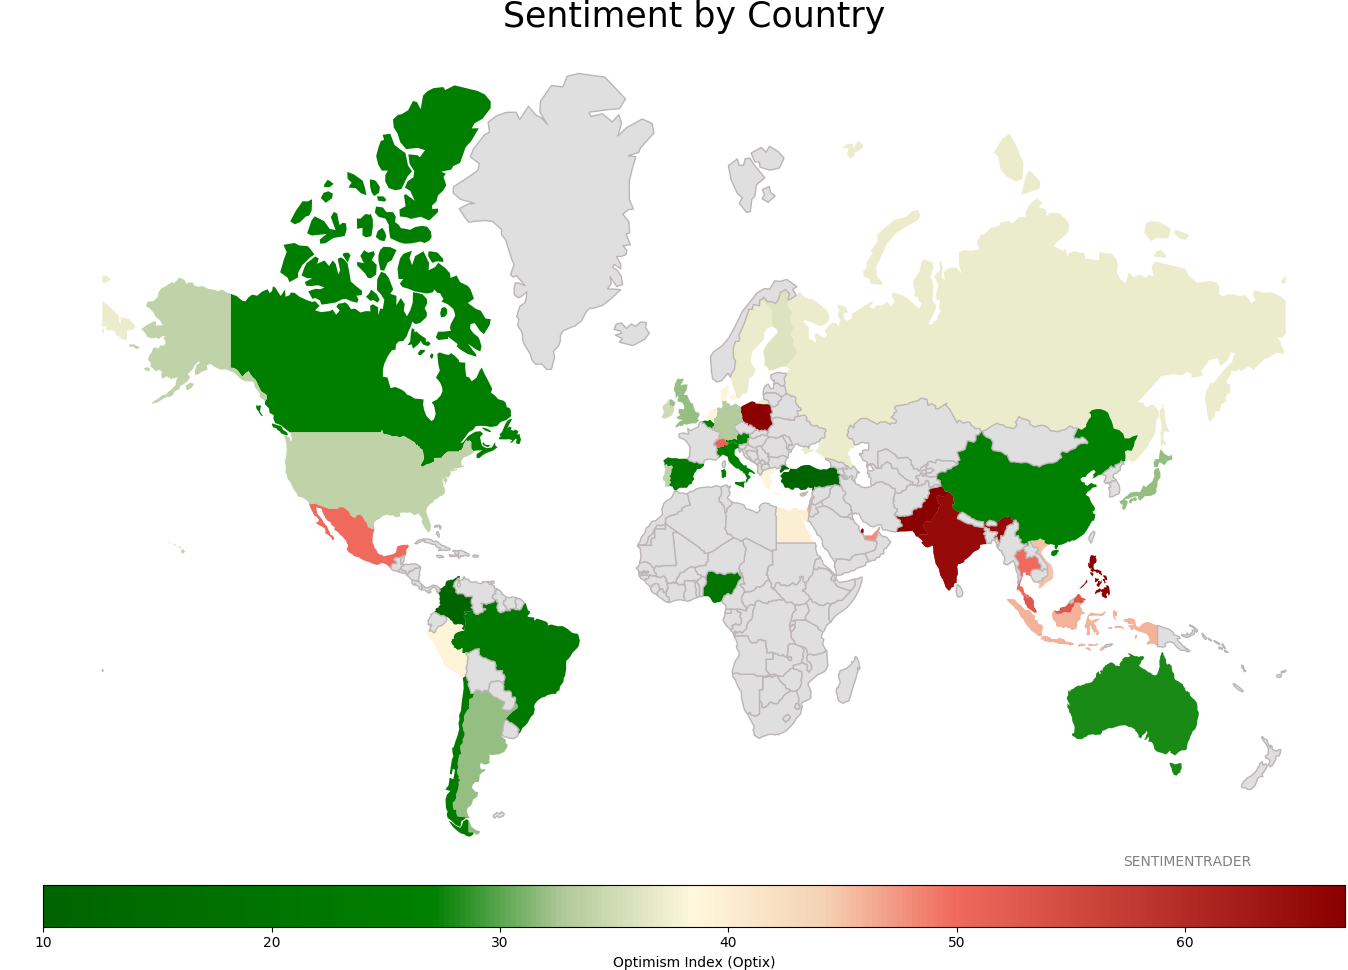
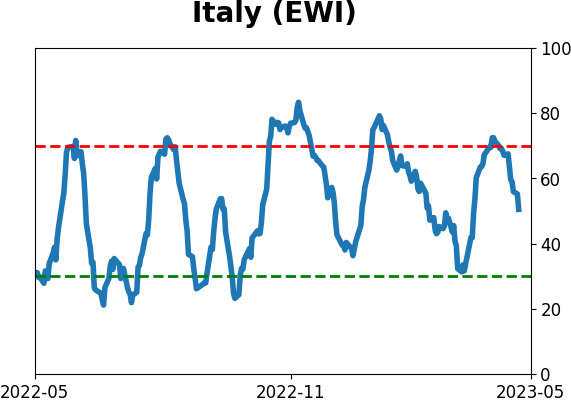
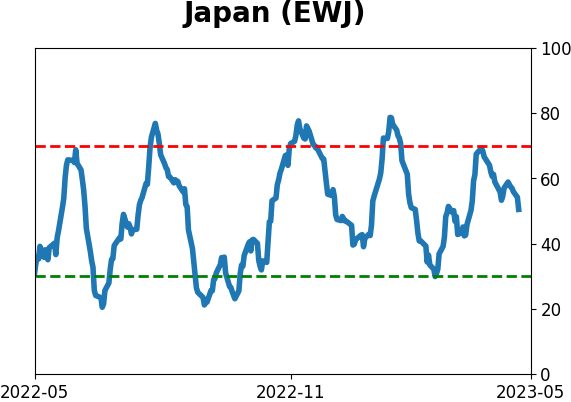
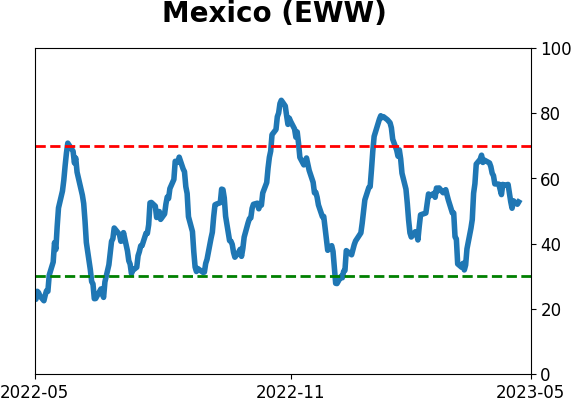
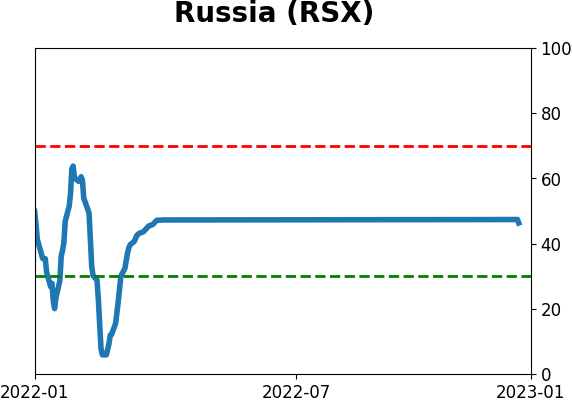
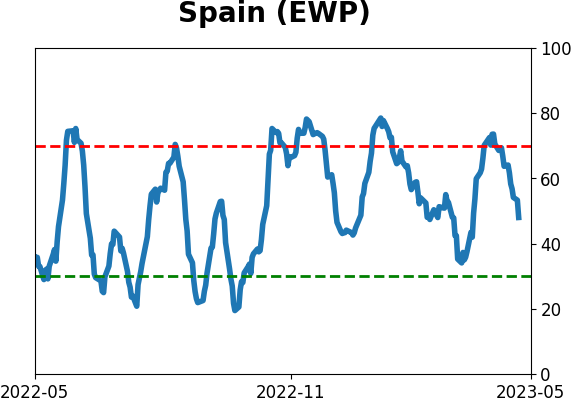
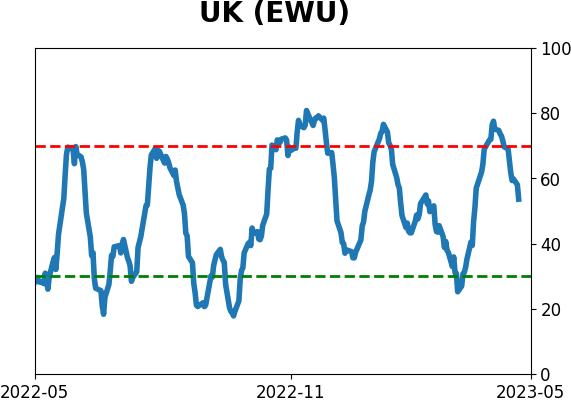
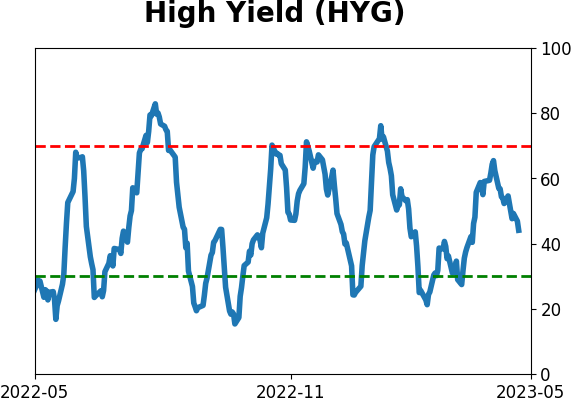
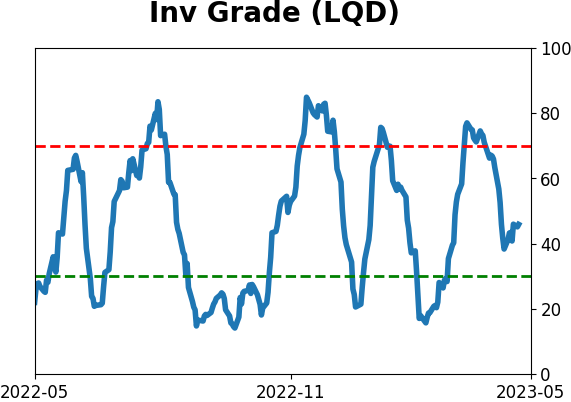
Sentiment Around The World
Optimism Index Thumbnails
|
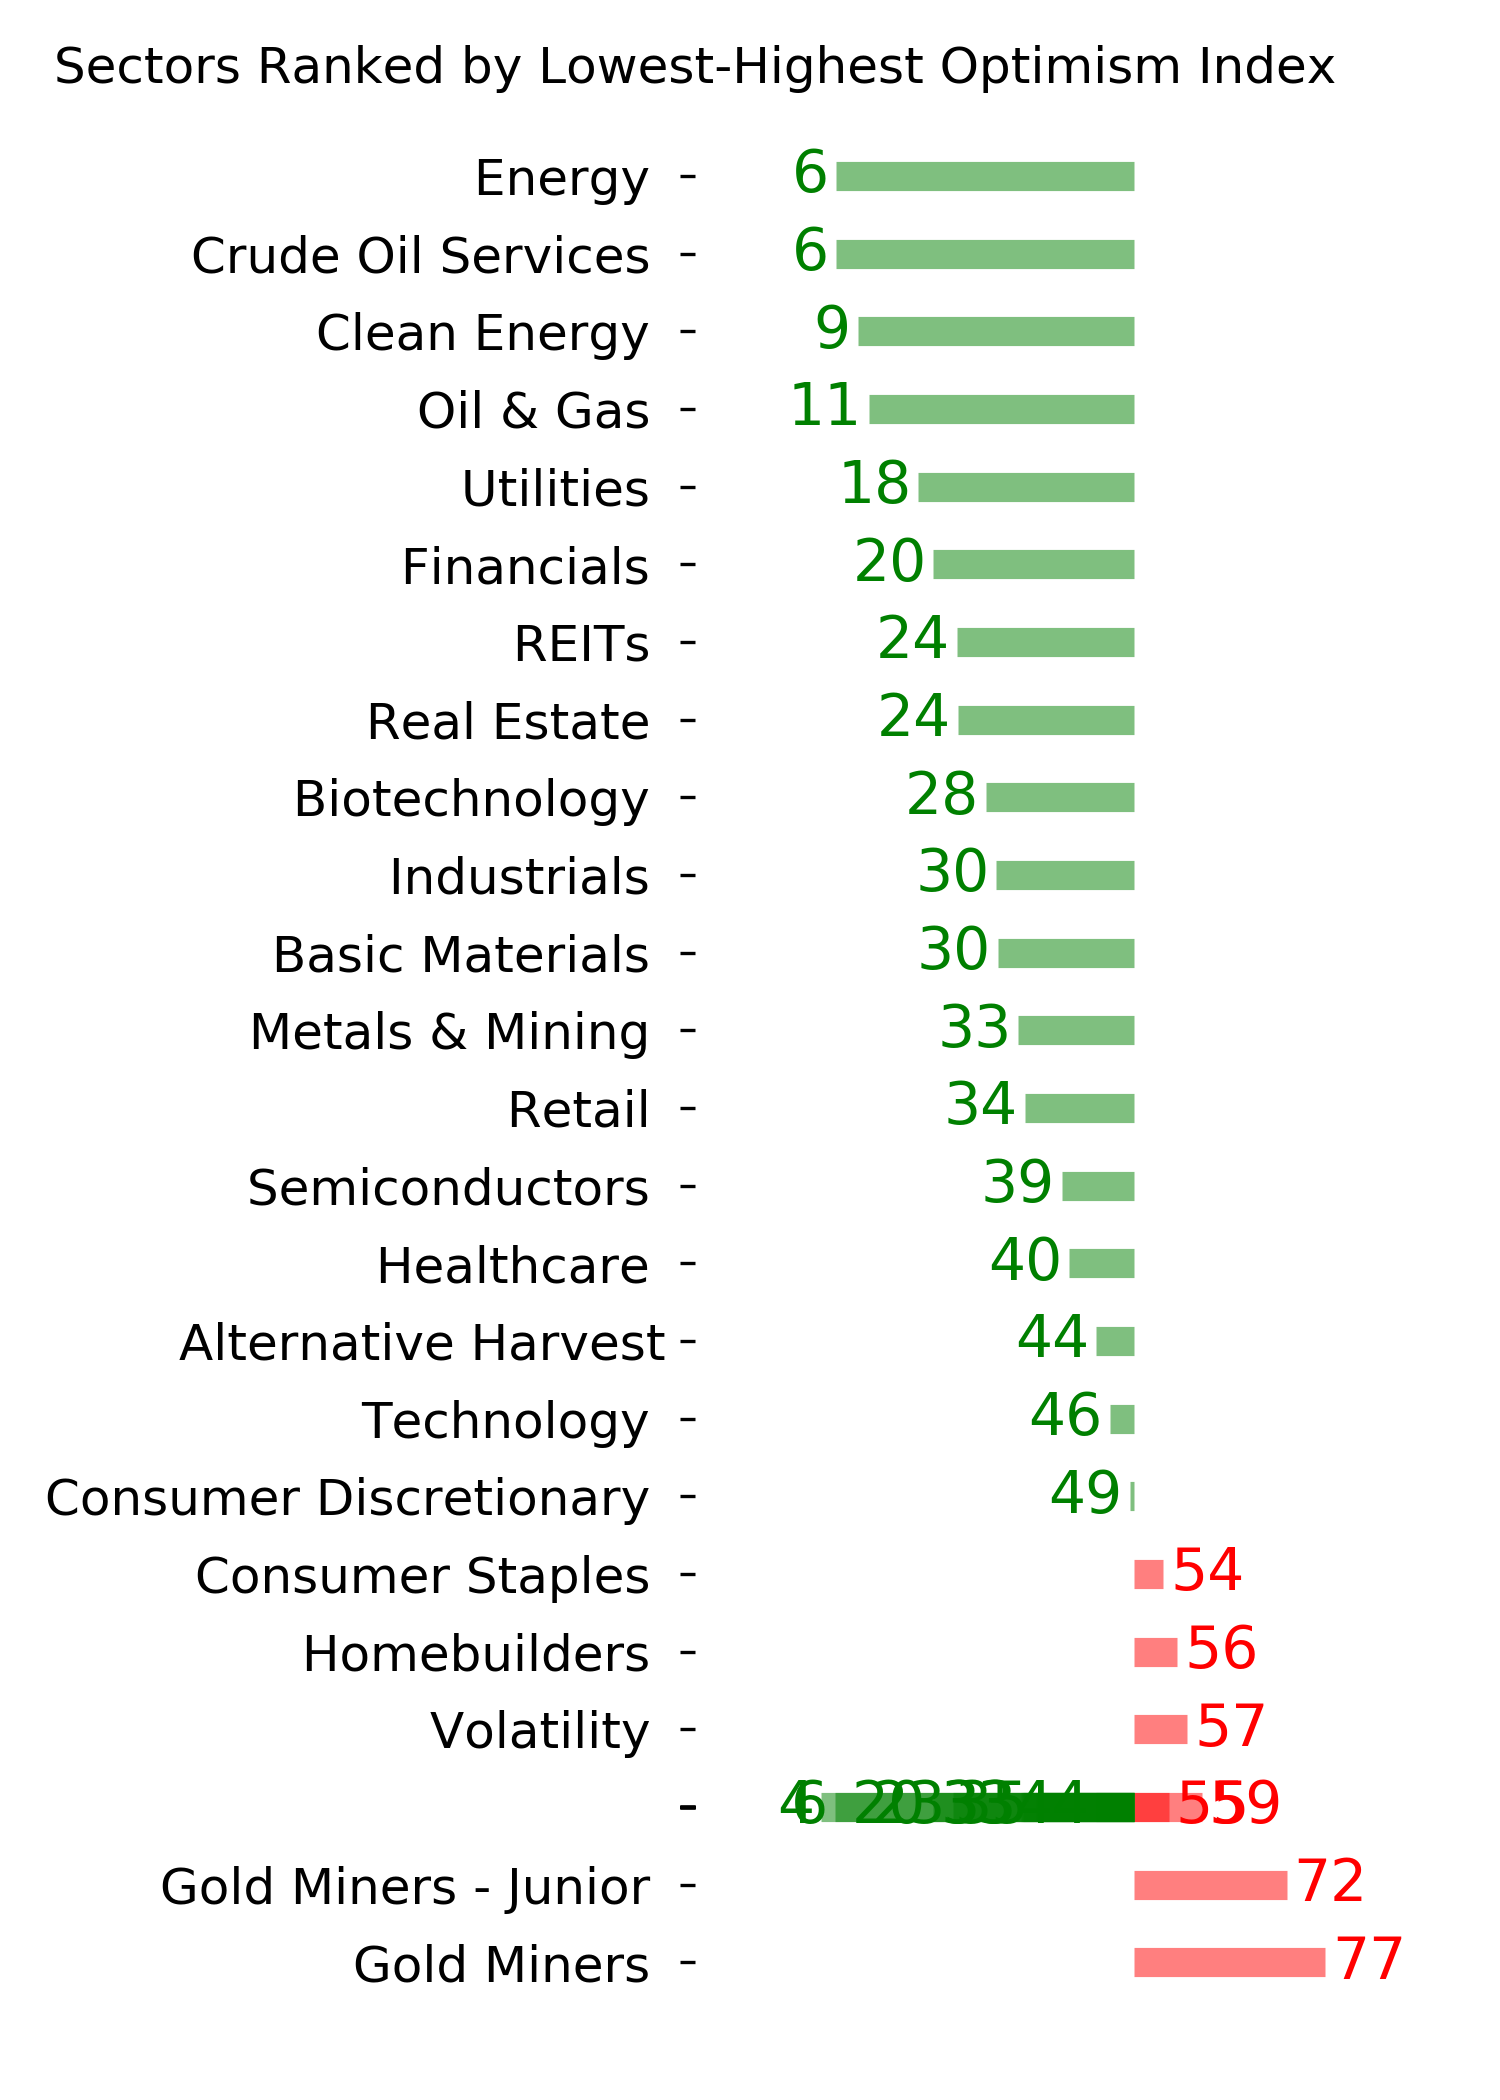
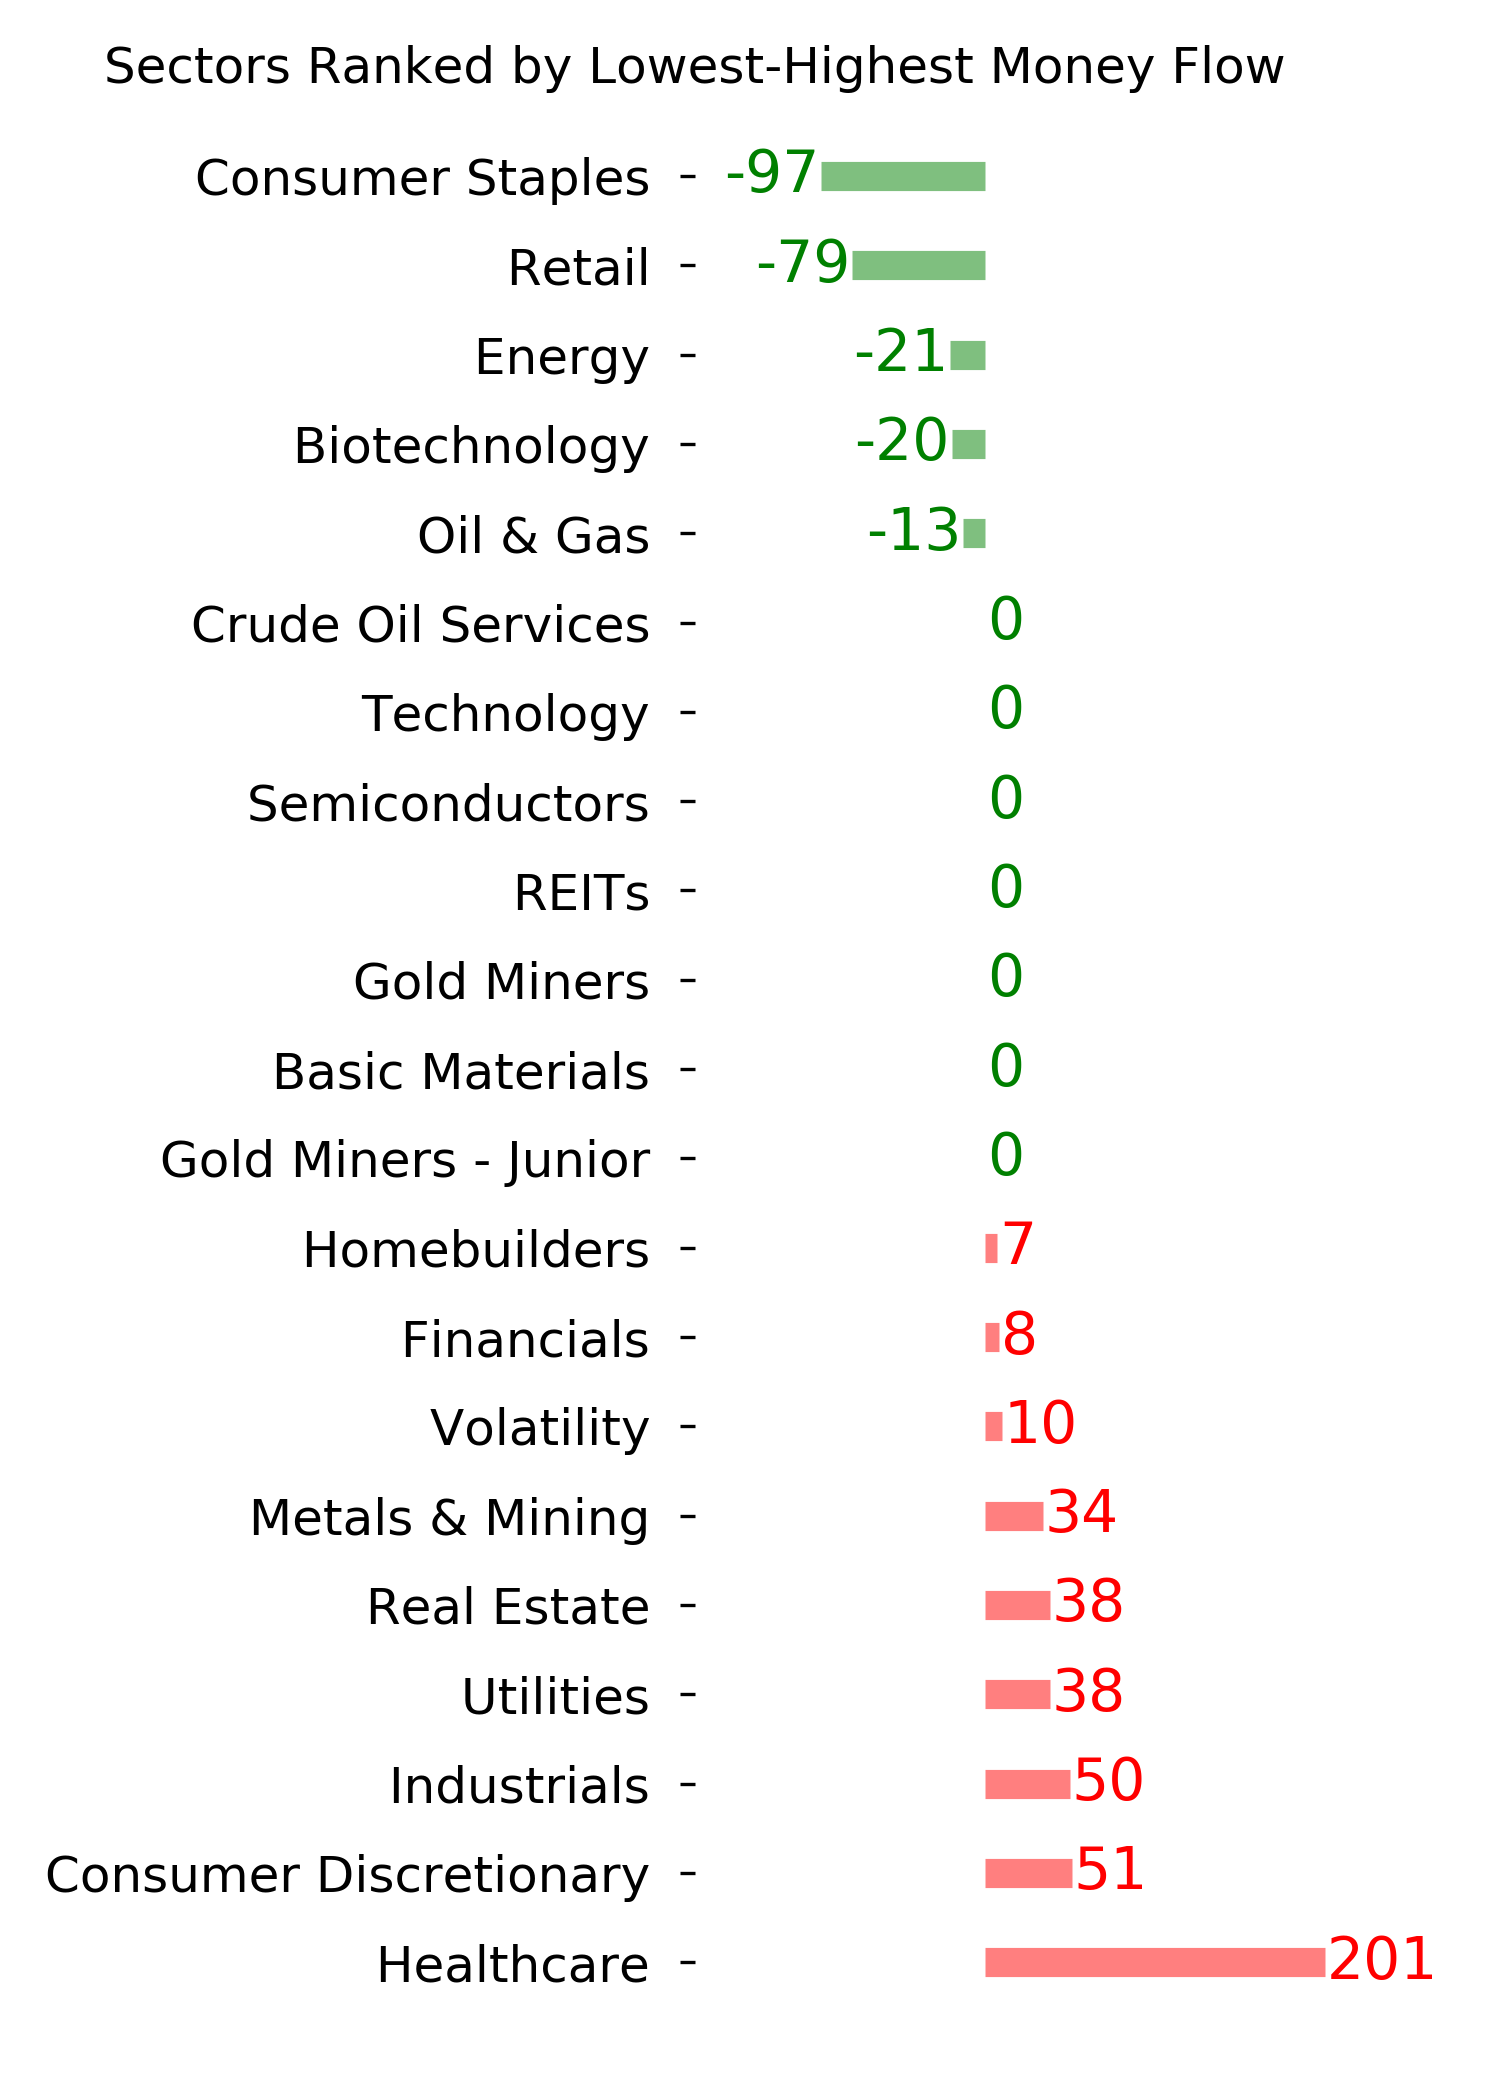
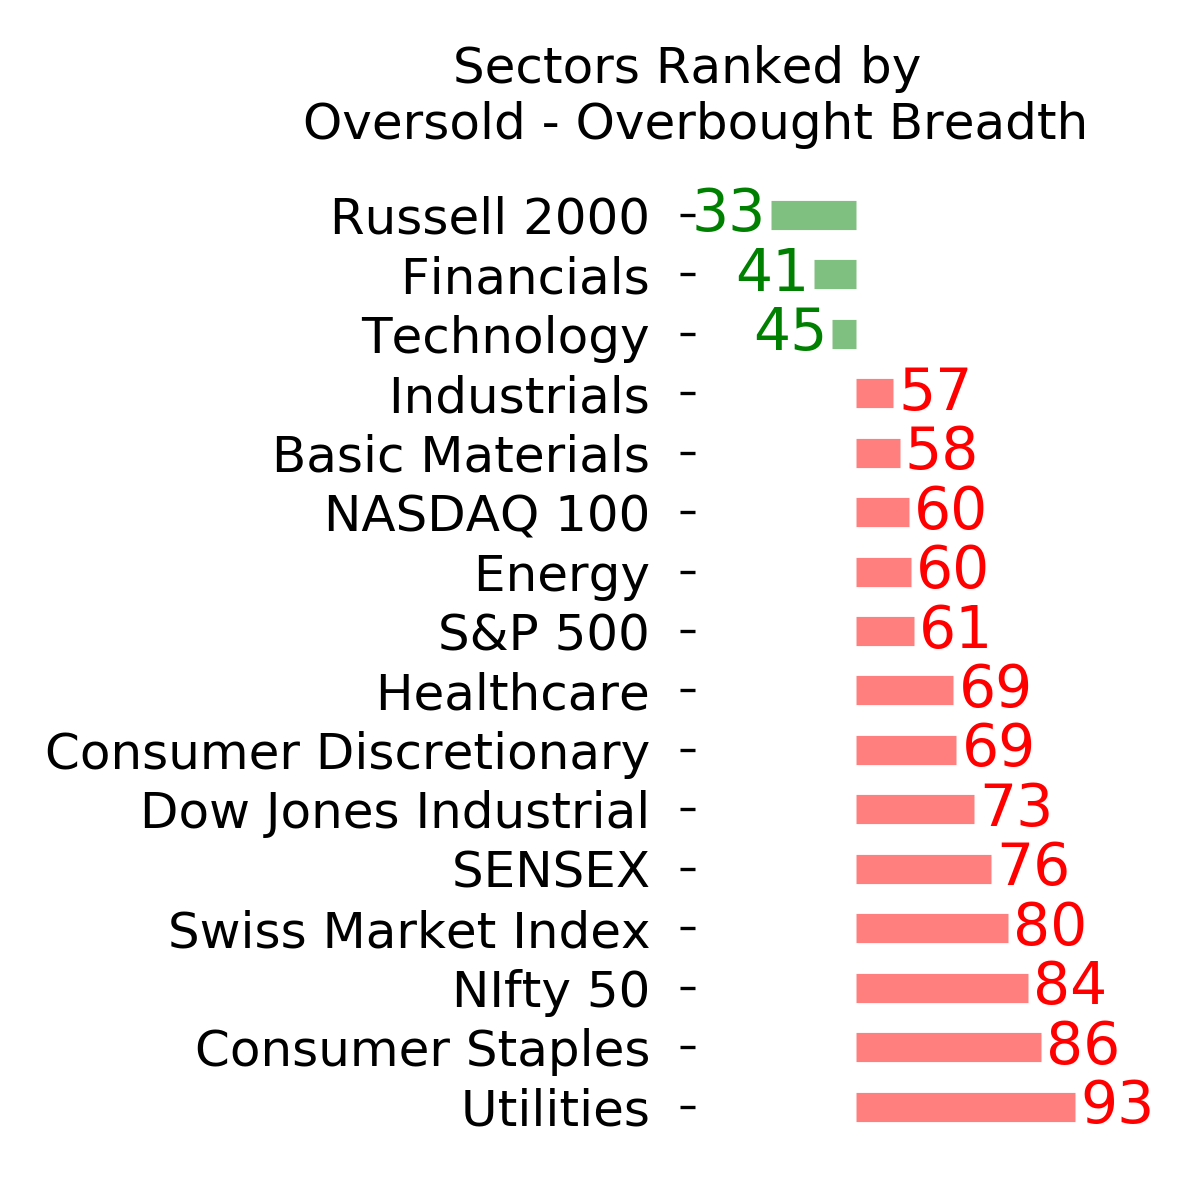
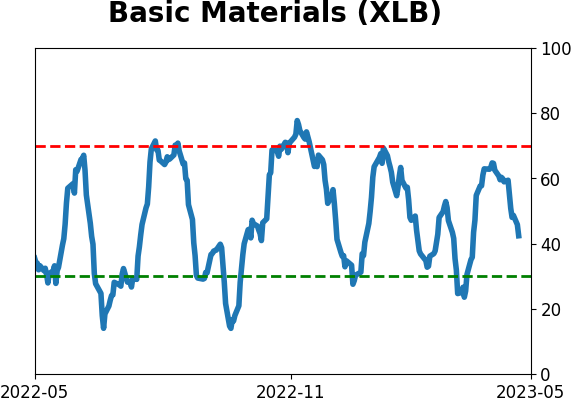
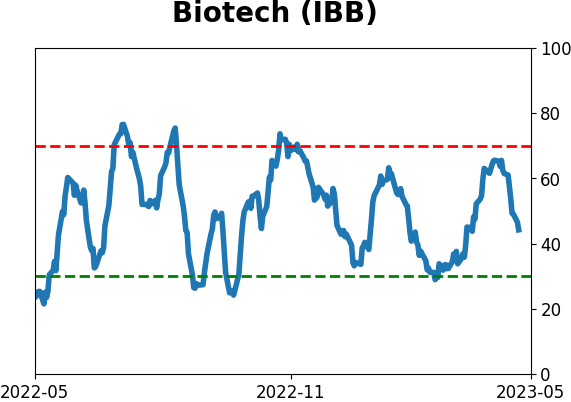
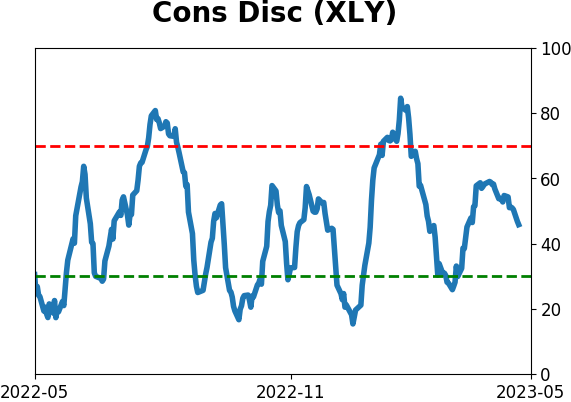
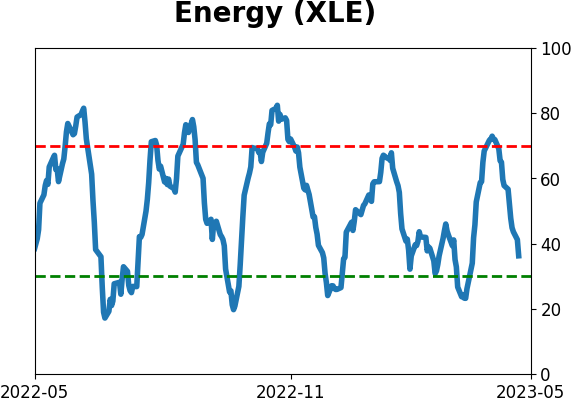
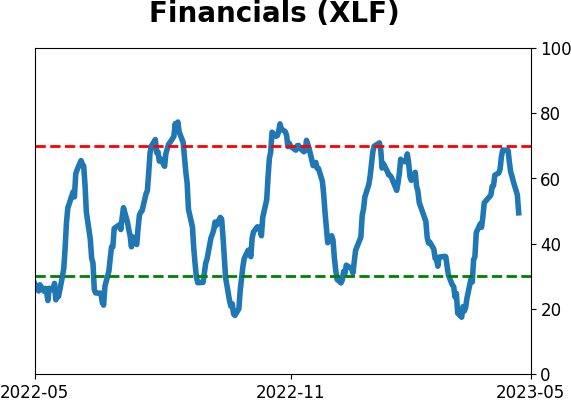
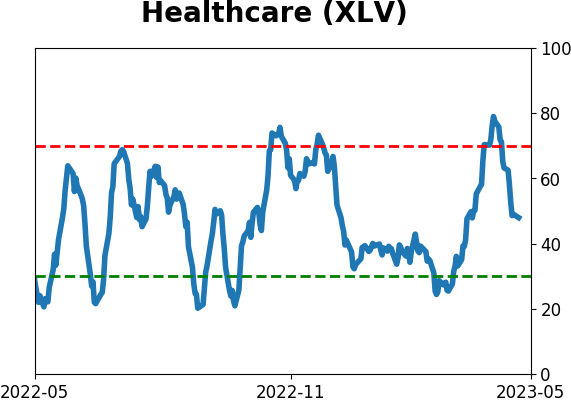
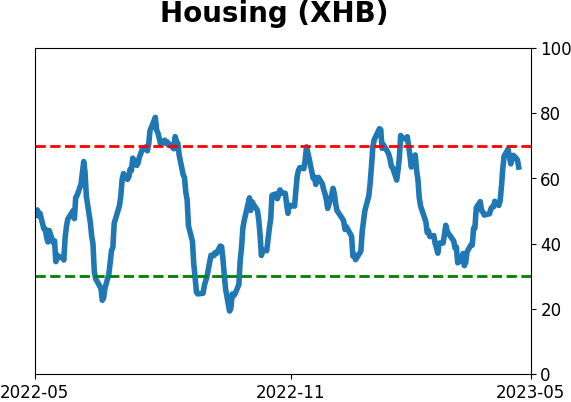
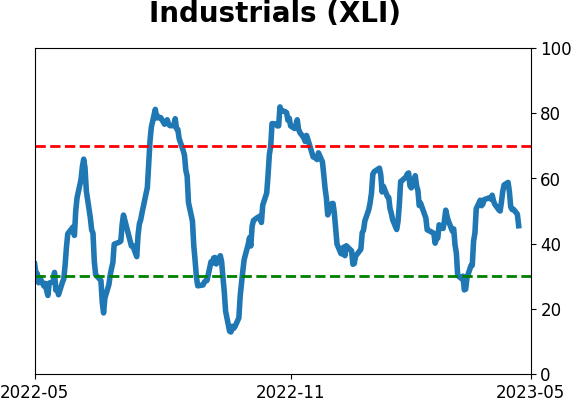
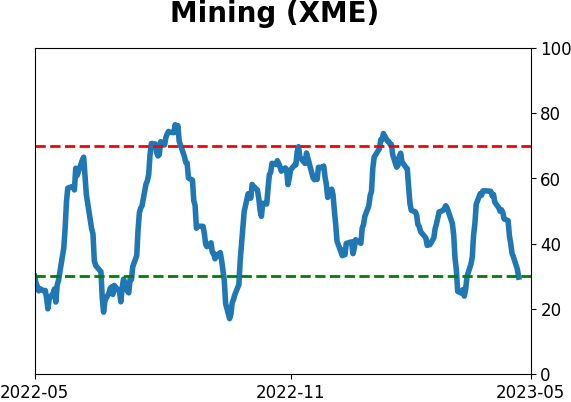
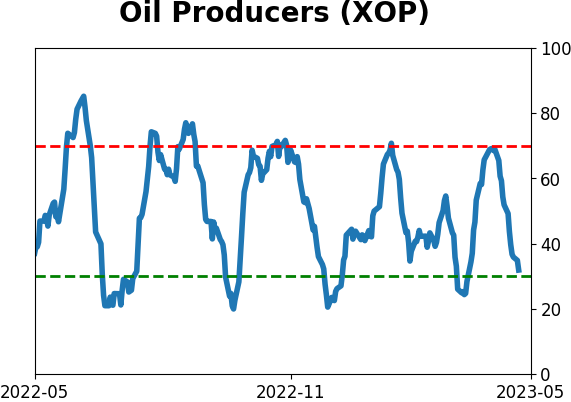
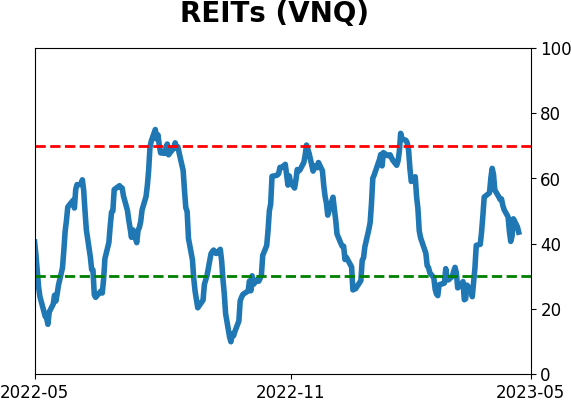
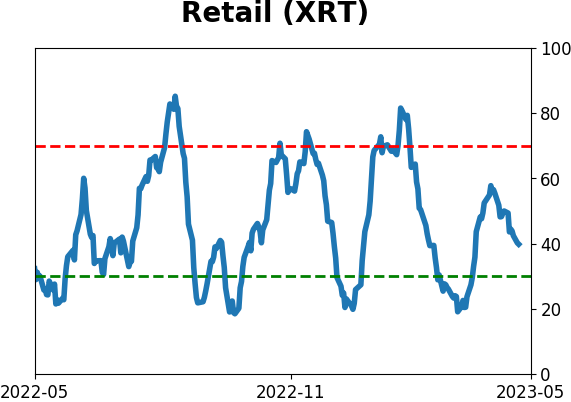
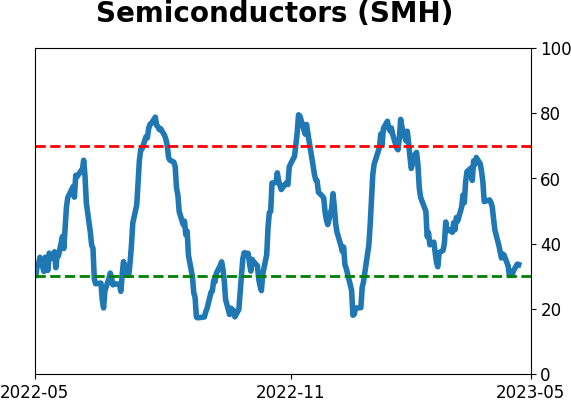
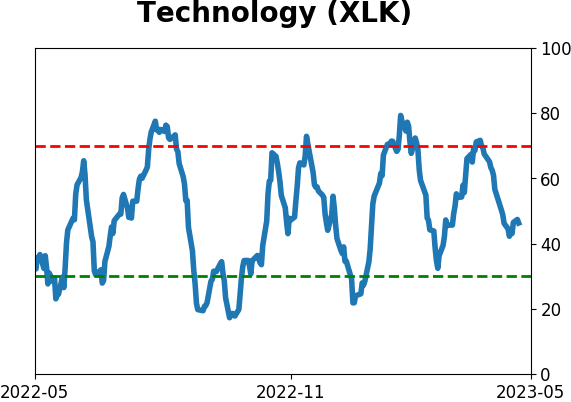
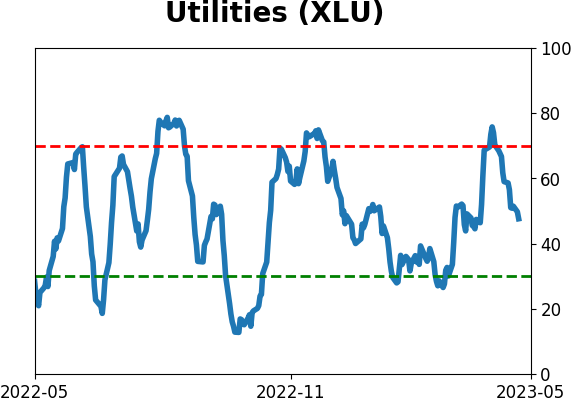
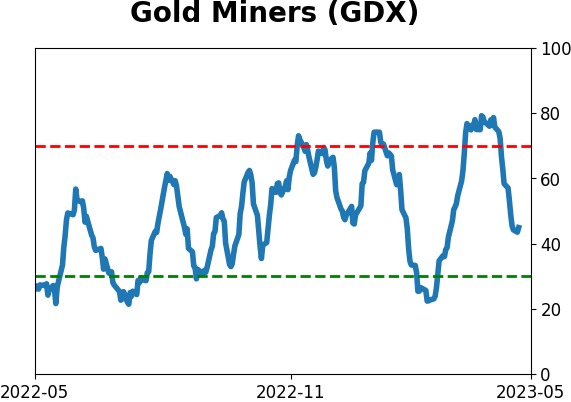
Sector ETF's - 10-Day Moving Average
|
|
|
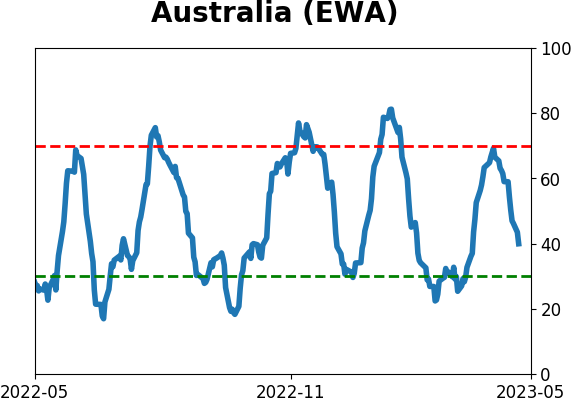
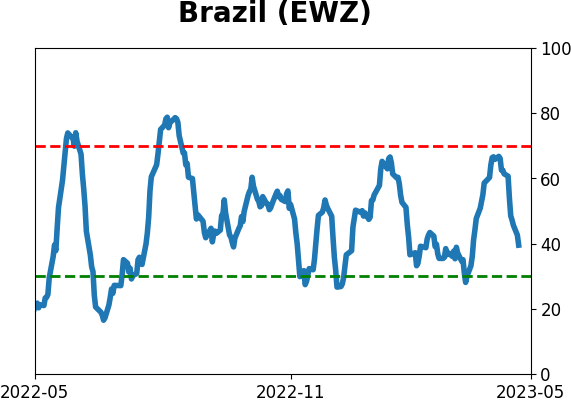
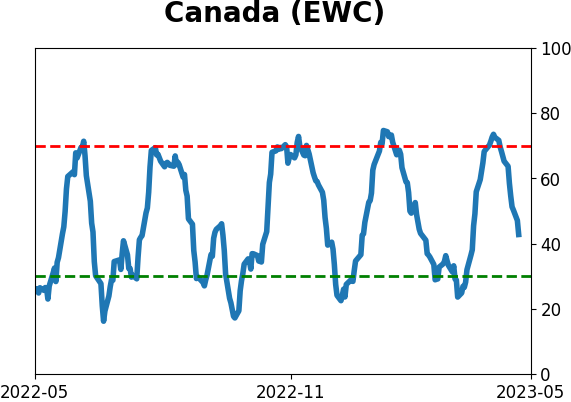
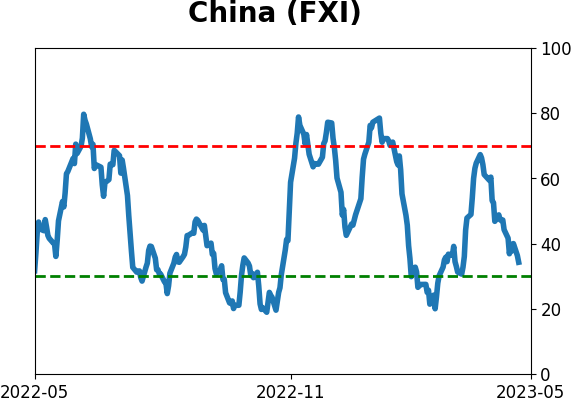
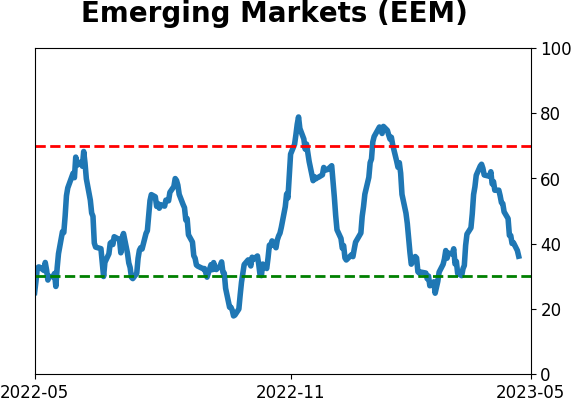
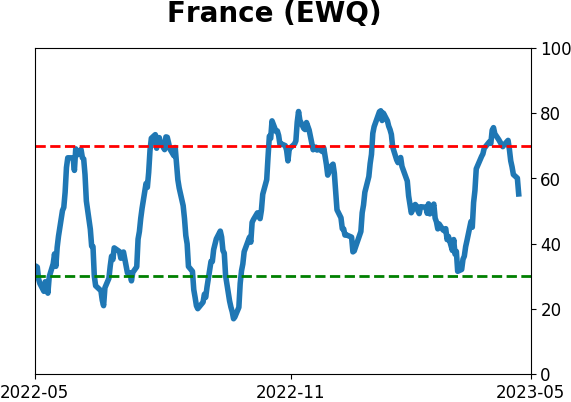
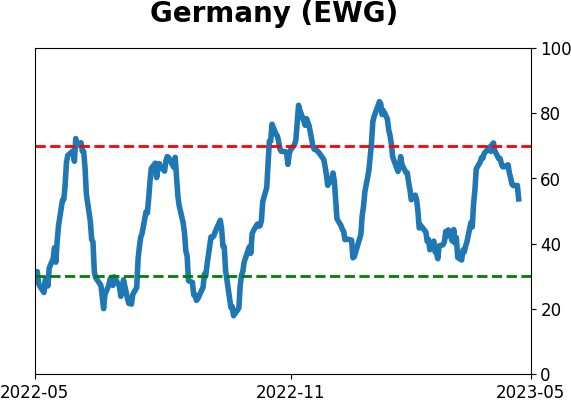
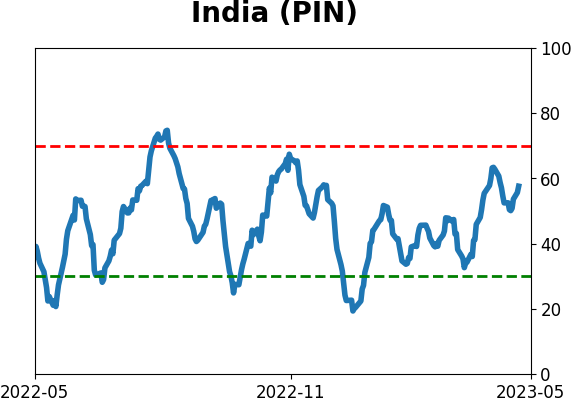
Country ETF's - 10-Day Moving Average
|
|
|
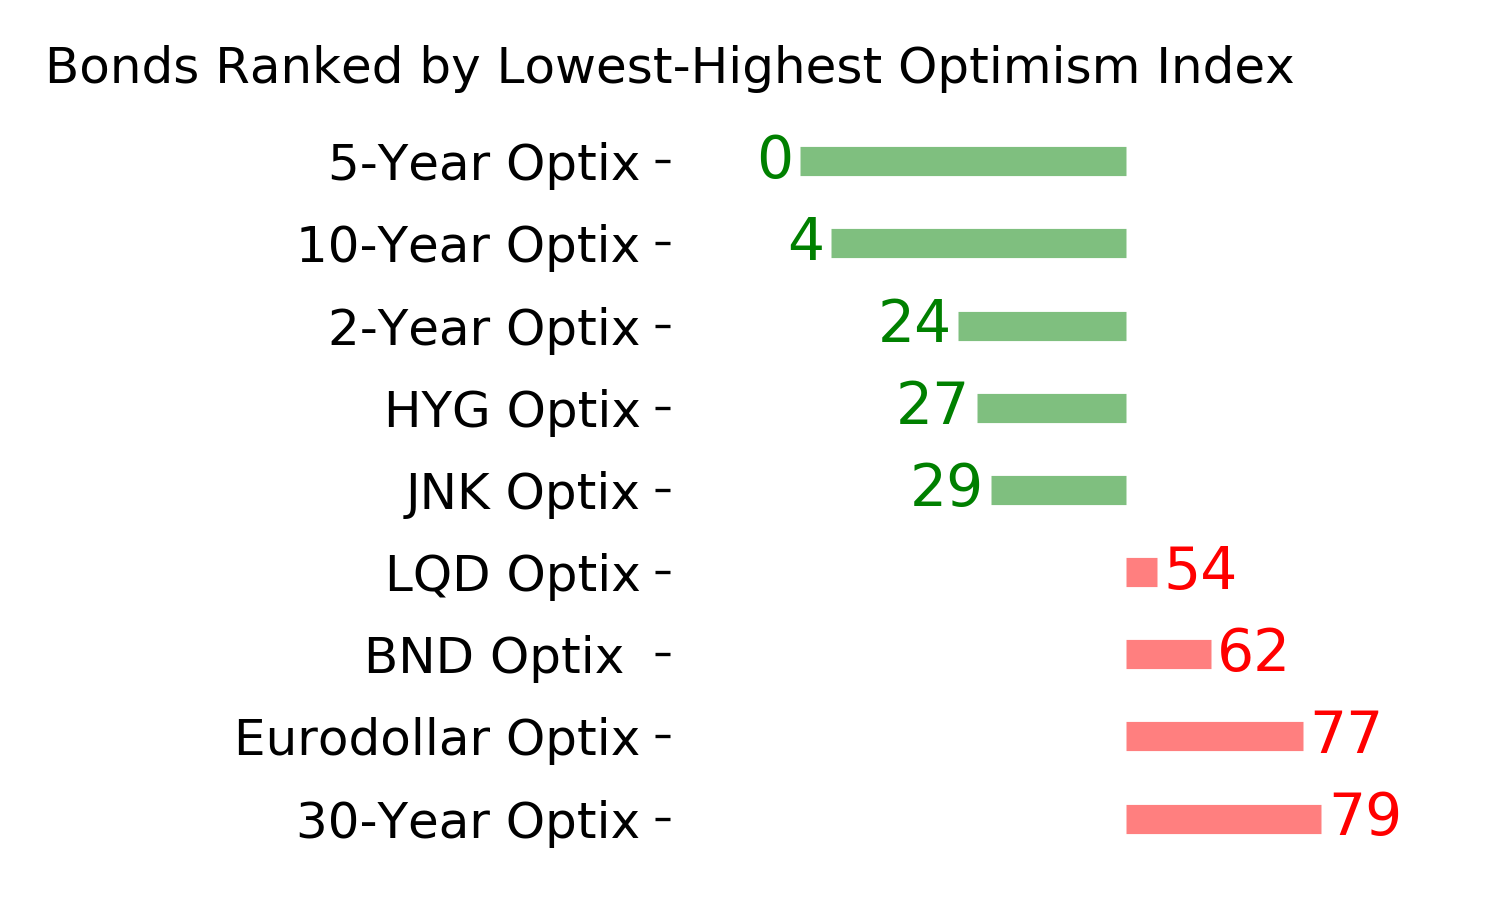
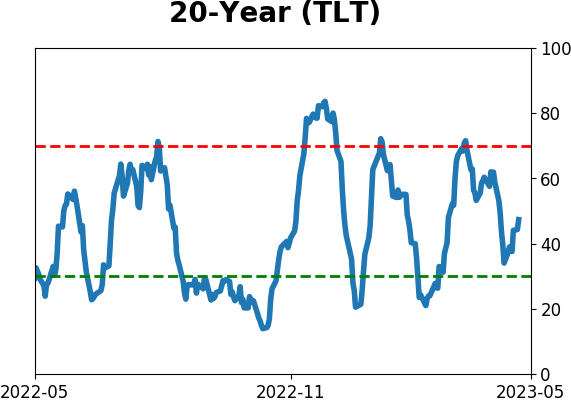
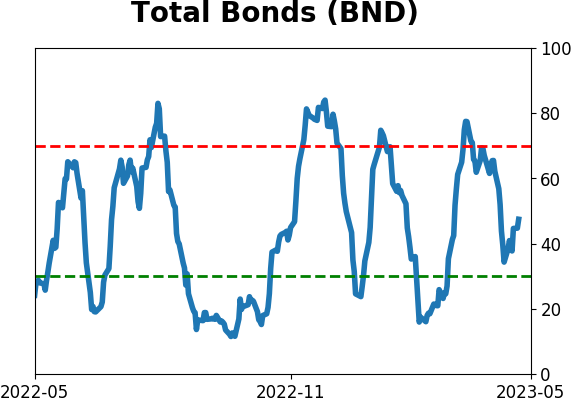
Bond ETF's - 10-Day Moving Average
|
|
|
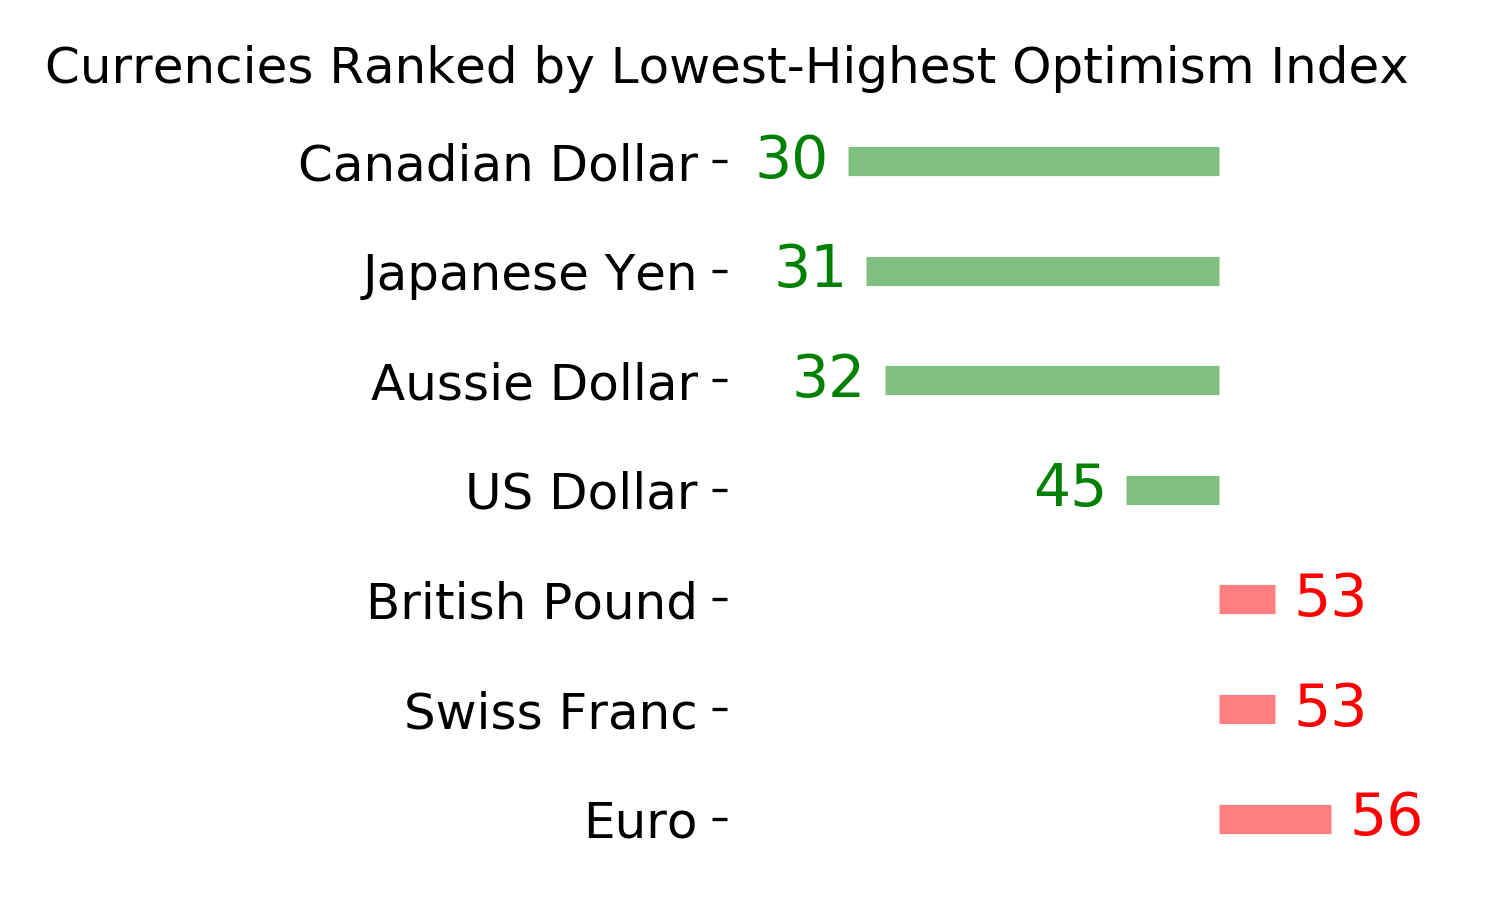
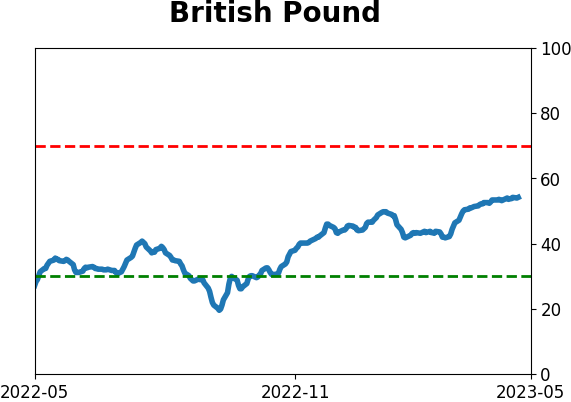
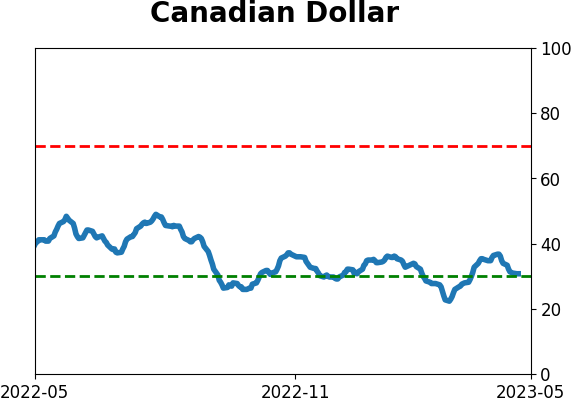
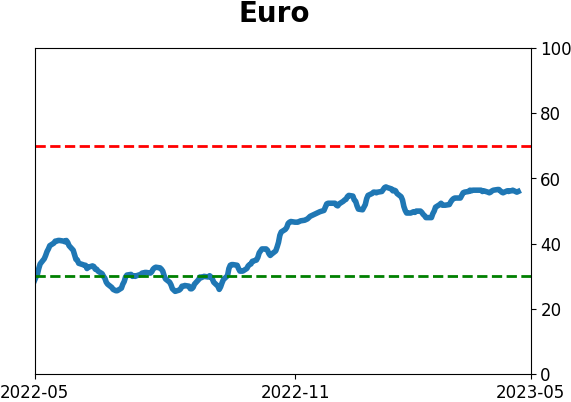
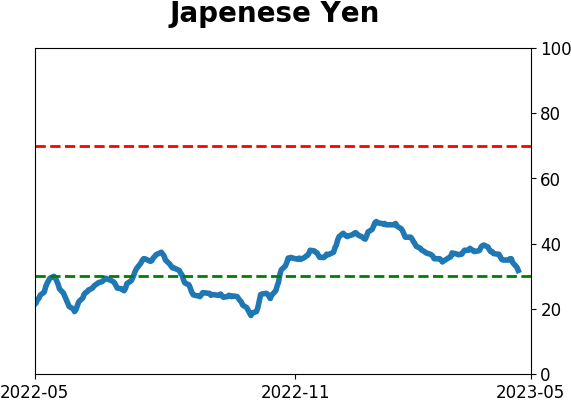
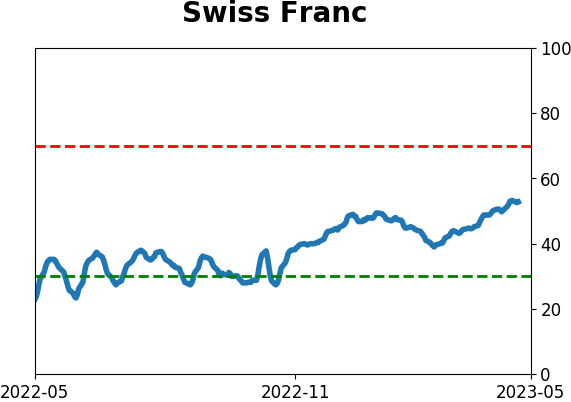
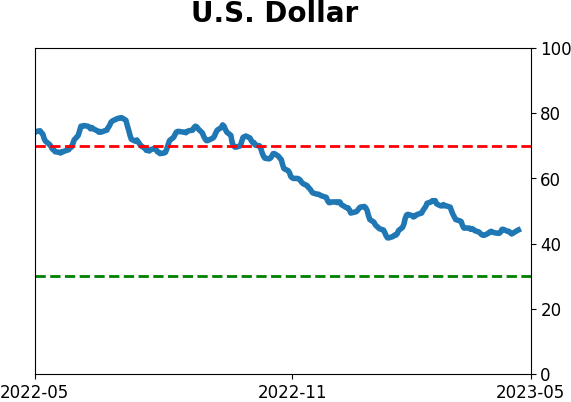
Currency ETF's - 5-Day Moving Average
|
|
|
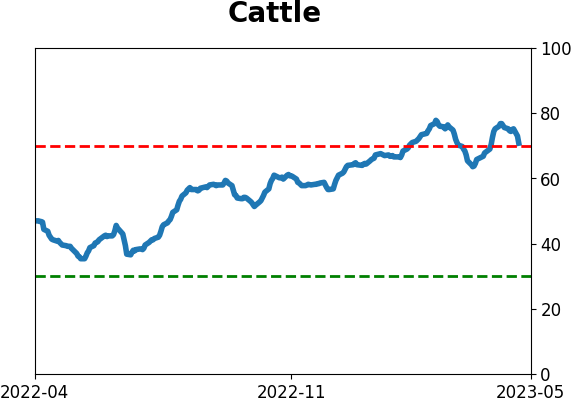
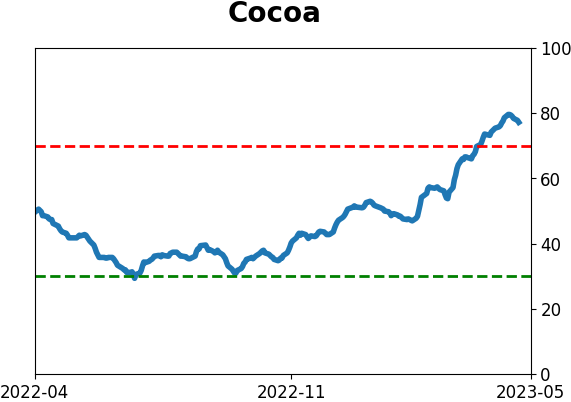
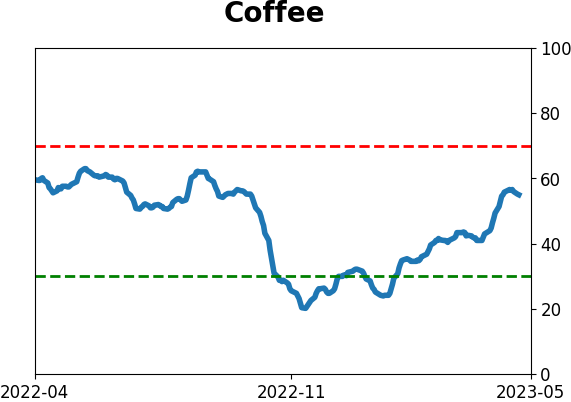
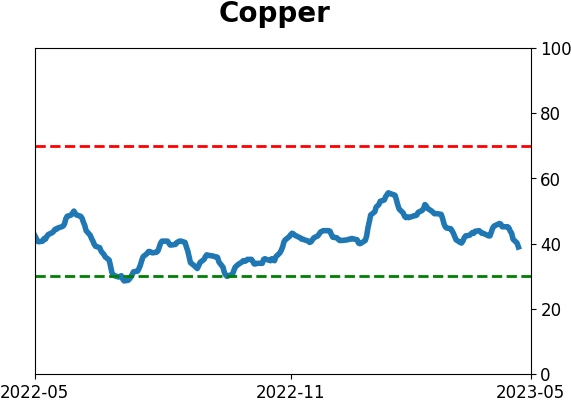
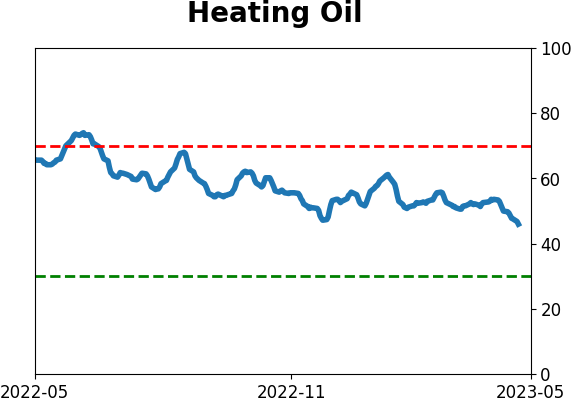
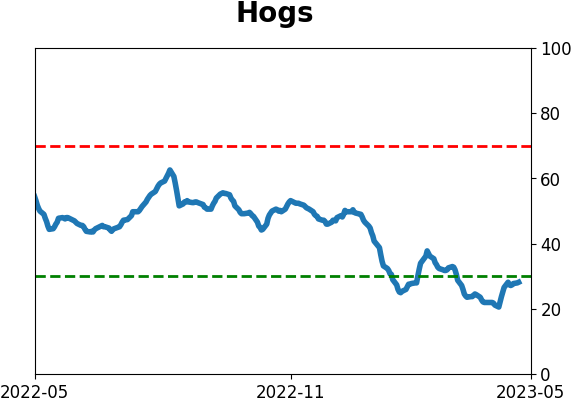
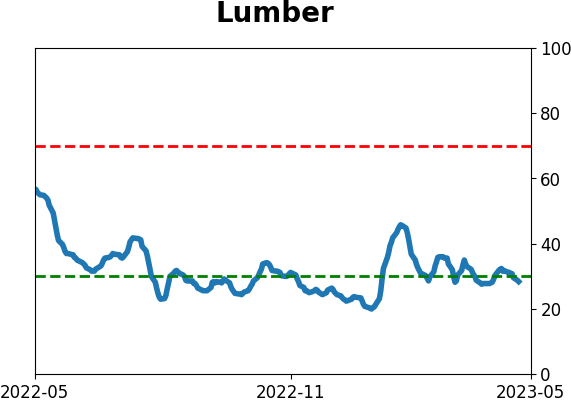
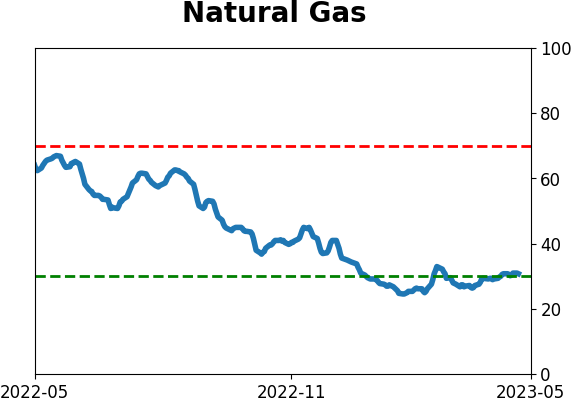
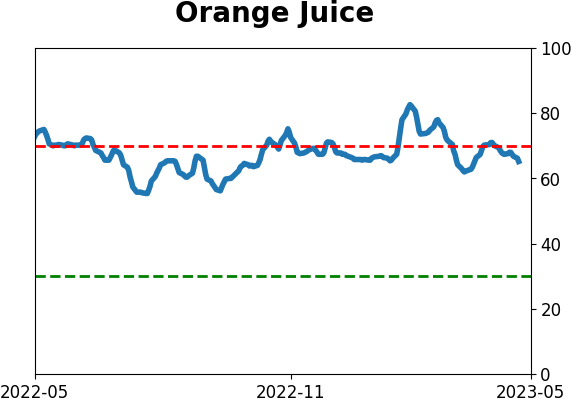
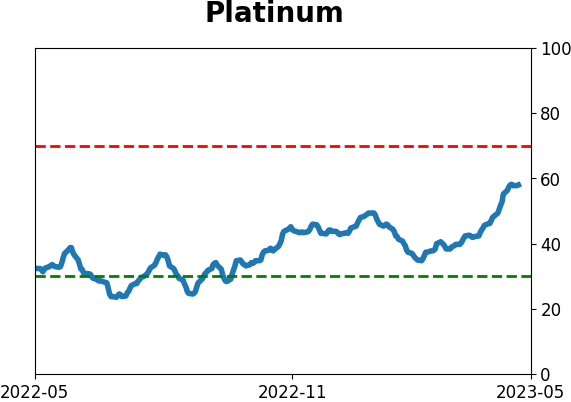
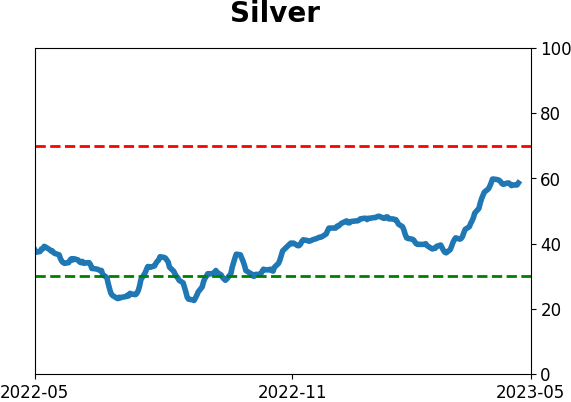
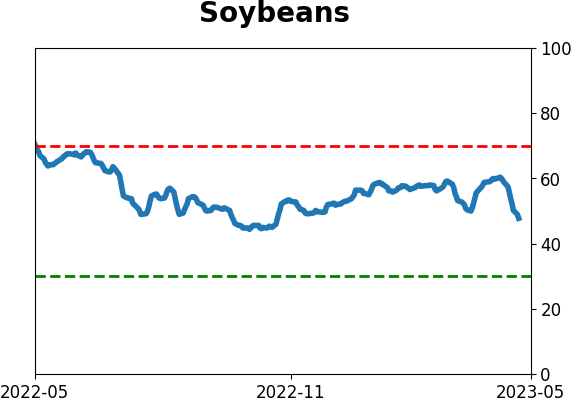
Commodity ETF's - 5-Day Moving Average
|
|