Headlines
|
|
Buy-the-dip is dead:
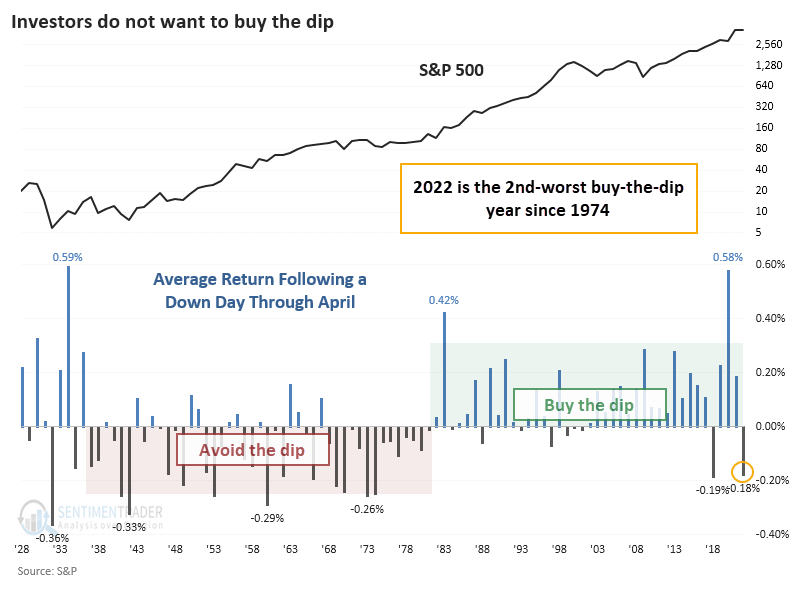
Through April, buy-the-dip activity in the S&P 500 is at its 2nd-worst level since the early 1970s. The S&P 500 has lost nearly 0.2% the day following a down day. Year-to-date, the S&P is witnessing one of its worst performances since the 1920s, which may be bad enough to be good longer-term.
|
Smart / Dumb Money Confidence
|
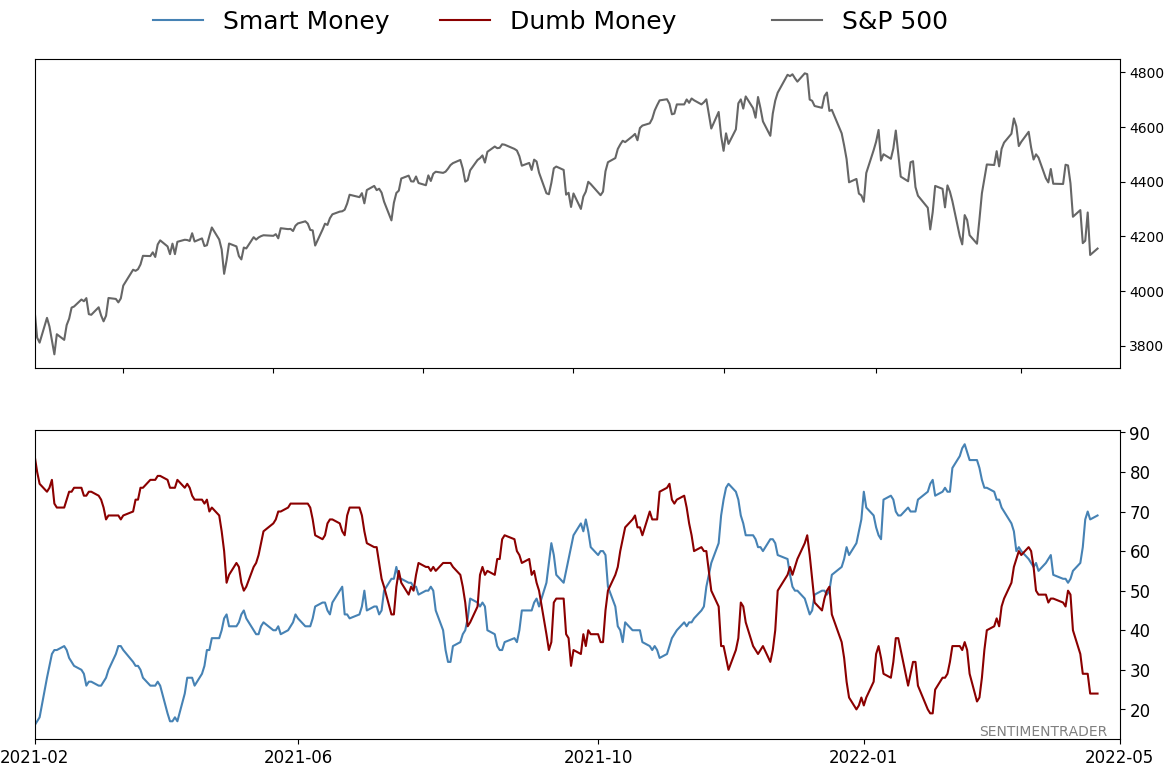
Smart Money Confidence: 69%
Dumb Money Confidence: 24%
|
|
Risk Levels
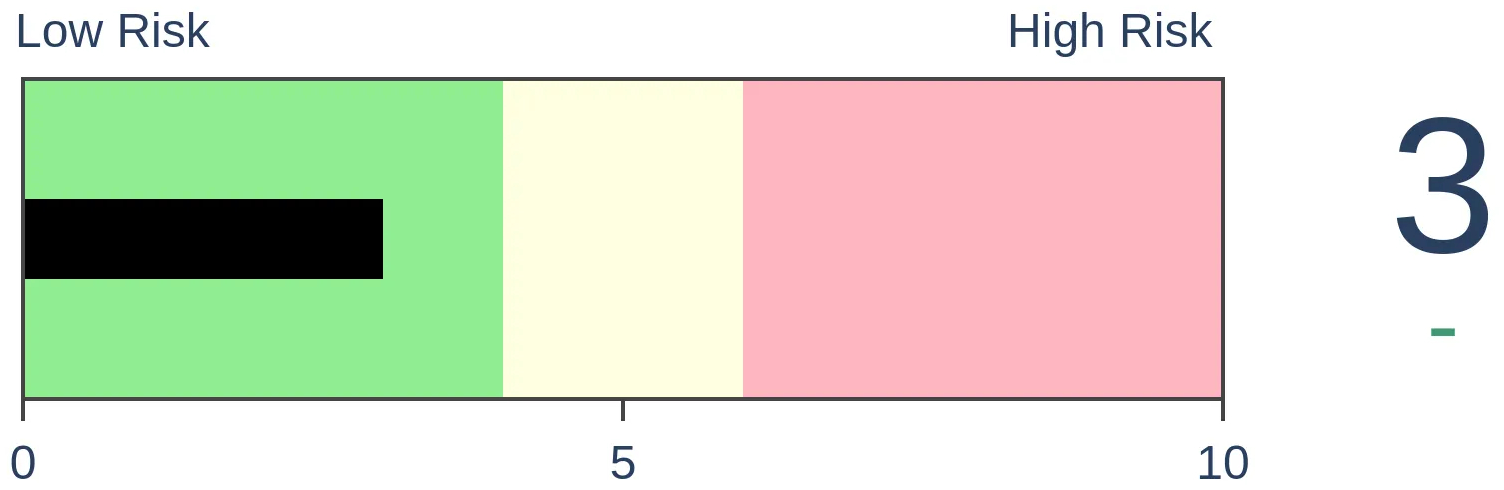
Stocks Short-Term
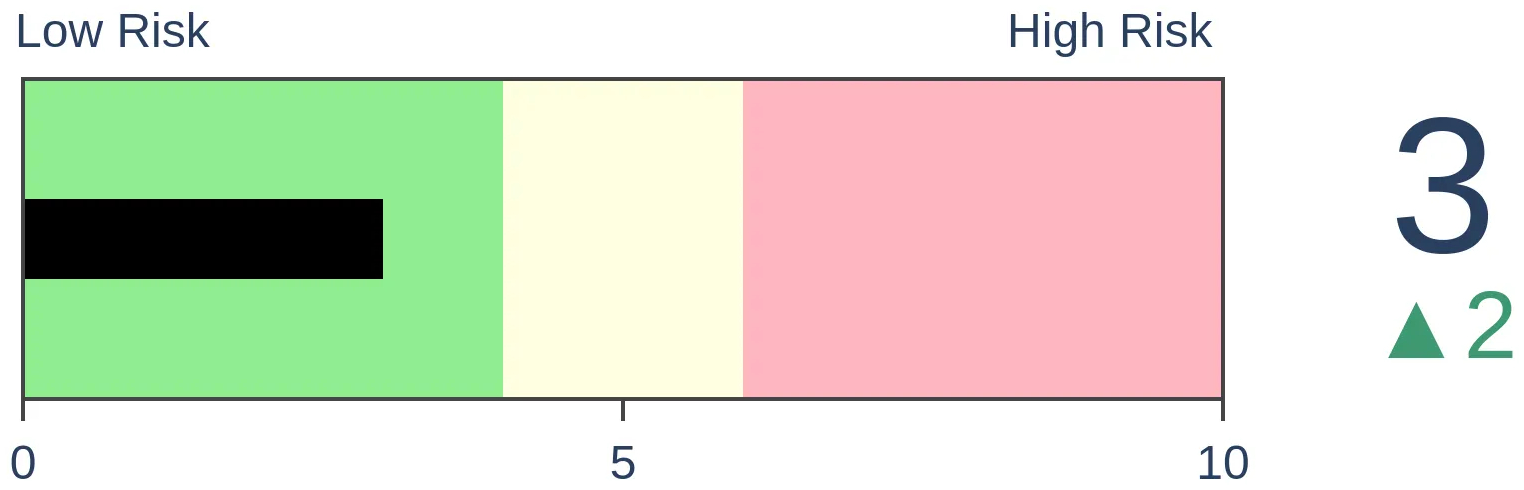
|
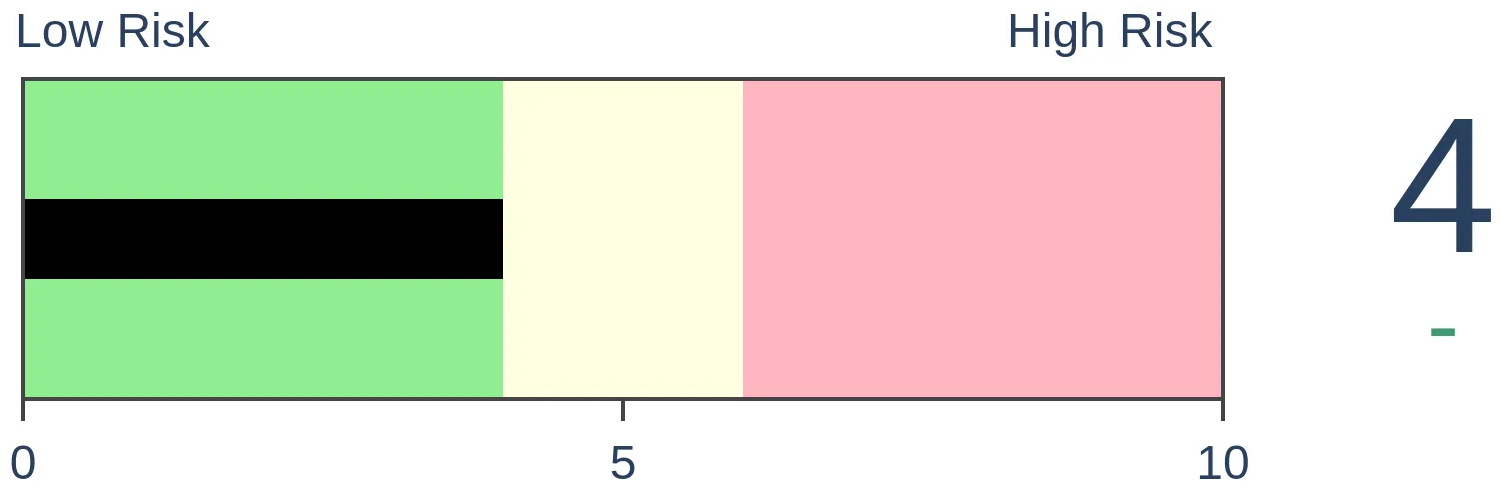
Stocks Medium-Term
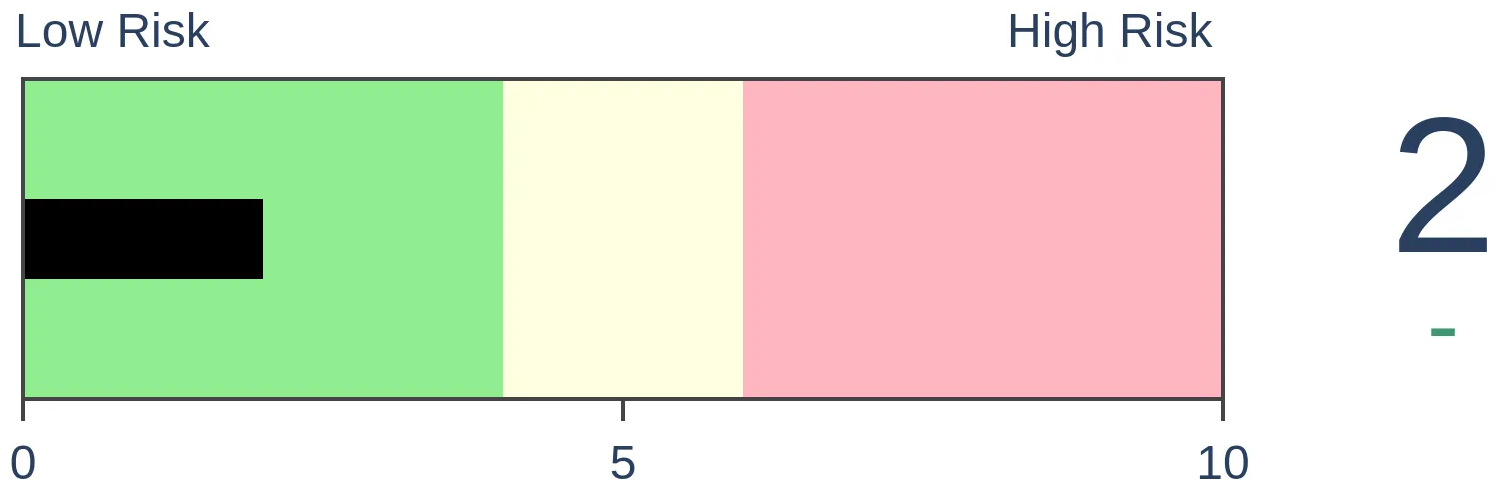
|
|
Bonds
|
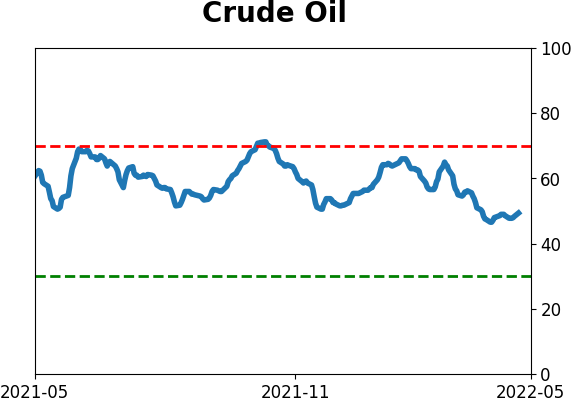
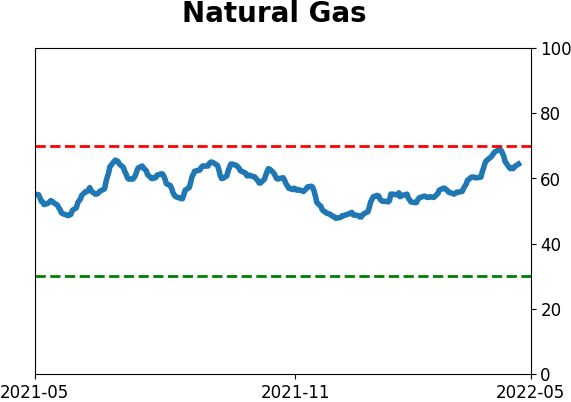
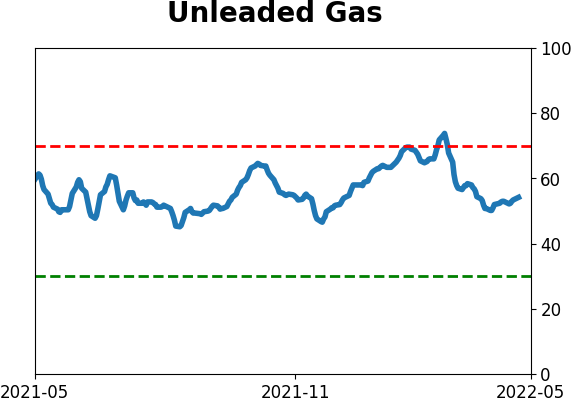
Crude Oil
|
|
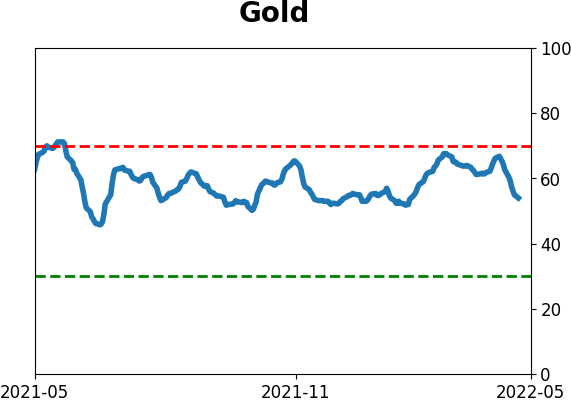
Gold

|
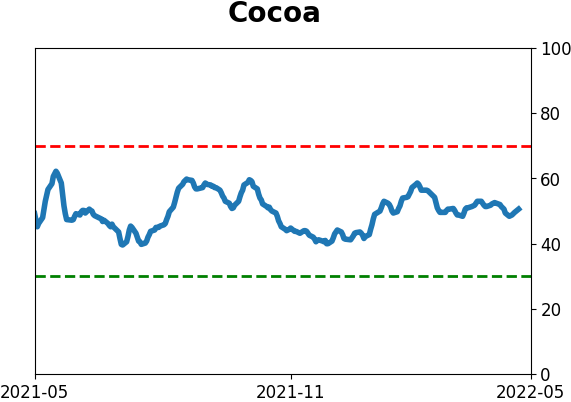
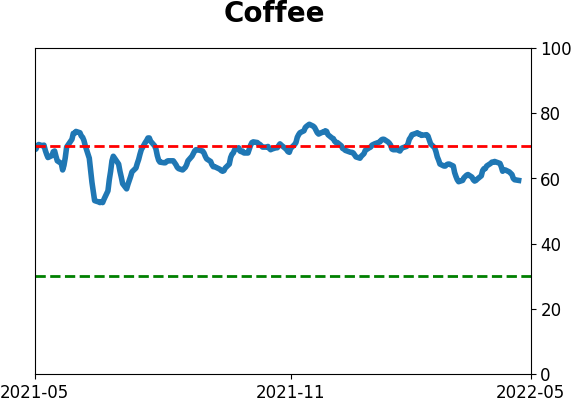
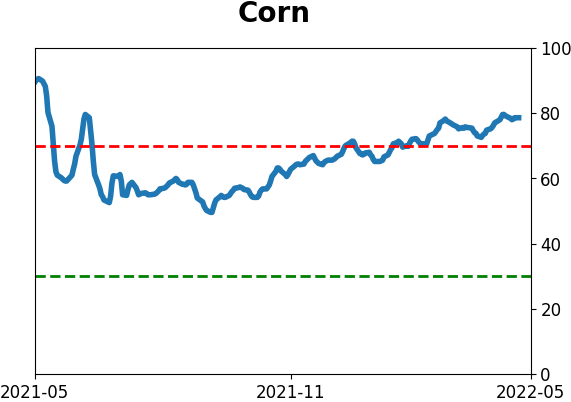
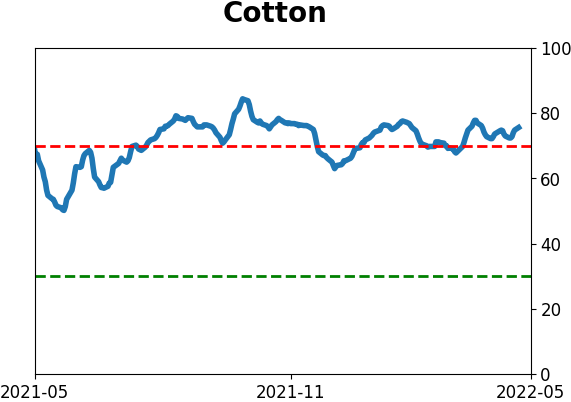
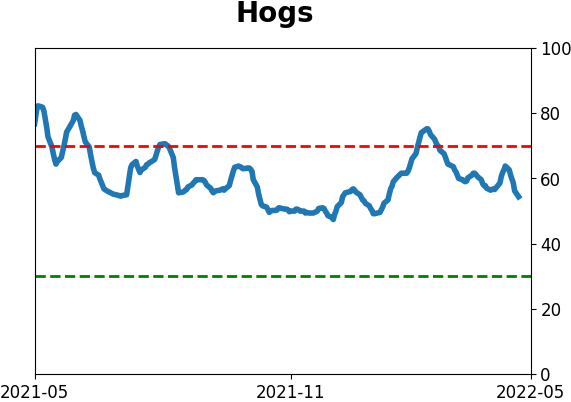
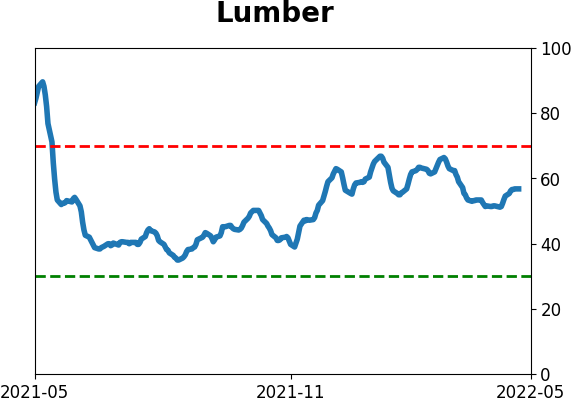
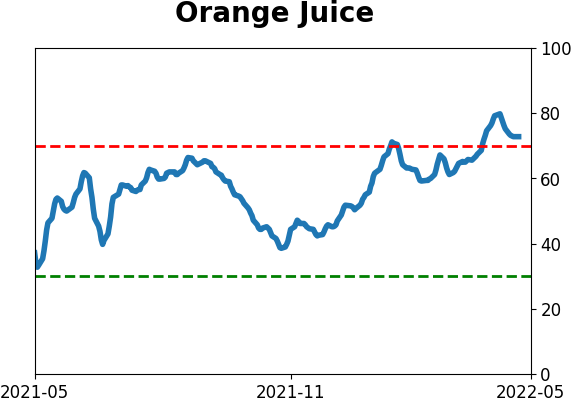
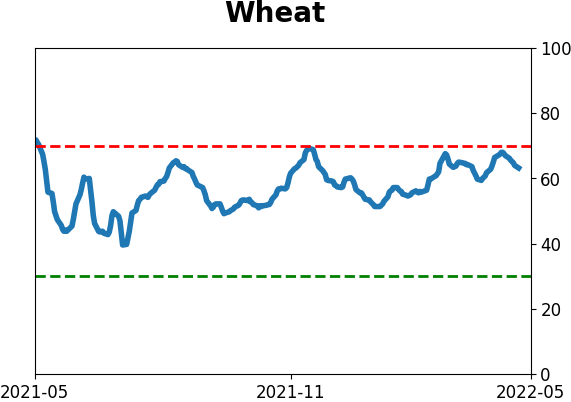
Agriculture

|
|
Research
By Jason Goepfert
BOTTOM LINE
Through April, buy-the-dip activity in the S&P 500 is at its 2nd-worst level since the early 1970s. The S&P 500 has lost nearly 0.2% the day following a down day. Year-to-date, the S&P is witnessing one of its worst performances since the 1920s, which may be bad enough to be good longer-term.
FORECAST / TIMEFRAME
None
|
Key points:
- Through April, buy-the-dip activity in the S&P 500 is the 2nd-worst in 40 years
- Similar behavior preceded weak returns in the months ahead
- This is one of the worst-ever years so far, which may be bad enough to be good longer-term
Buy-the-dip has gone by the wayside
This has been one of the worst starts to a year ever for investors, and it's caused them to abandon BTFD (Buy The F**king Dip).
Bloomberg notes that the tendency of investors to step in after a down day is waning, and S&P 500 pullbacks are lasting longer.
"It's trading like a bear market," said Brian Donlin, an equity derivatives strategist at Stifel Nicolaus & Co. "Rallies are sold pretty aggressively, and bounces are smaller and smaller."
Why so much focus on the S&P 500? Because it's the most important index in the world. While they have an incentive to overstate their case, S&P Dow Jones Indices estimated that $13.5 trillion was indexed or benchmarked to the S&P 500 as of 2020. No other index in the world weighs as much on investors' psyches.
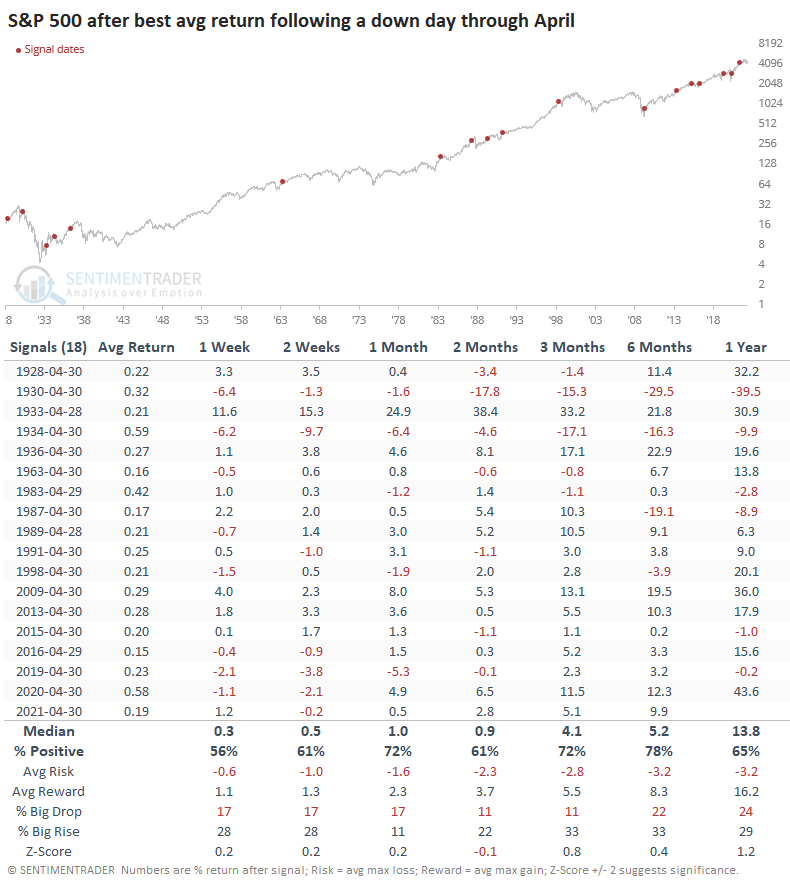
Bloomberg is not wrong. The S&P 500 has returned an average of -0.18% after a down day through April. While it was about as bad in 2018, this is a remarkable change from the past 40 years, when investors greedily snapped up bargains after a down day. Now they're avoiding dips in case the selling gets even worse, similar to behavior throughout much of the 1930s to 1970s.
The avoidance of buy-the-dip was an excellent sign for contrarians four years ago; the S&P dipped a few more days into early May, then rose steadily through September. Historically, though, it wasn't a consistent buy signal. The "sell in May" phenomenon typically put a damper on rallies, and over the next one and two months, returns were poor.
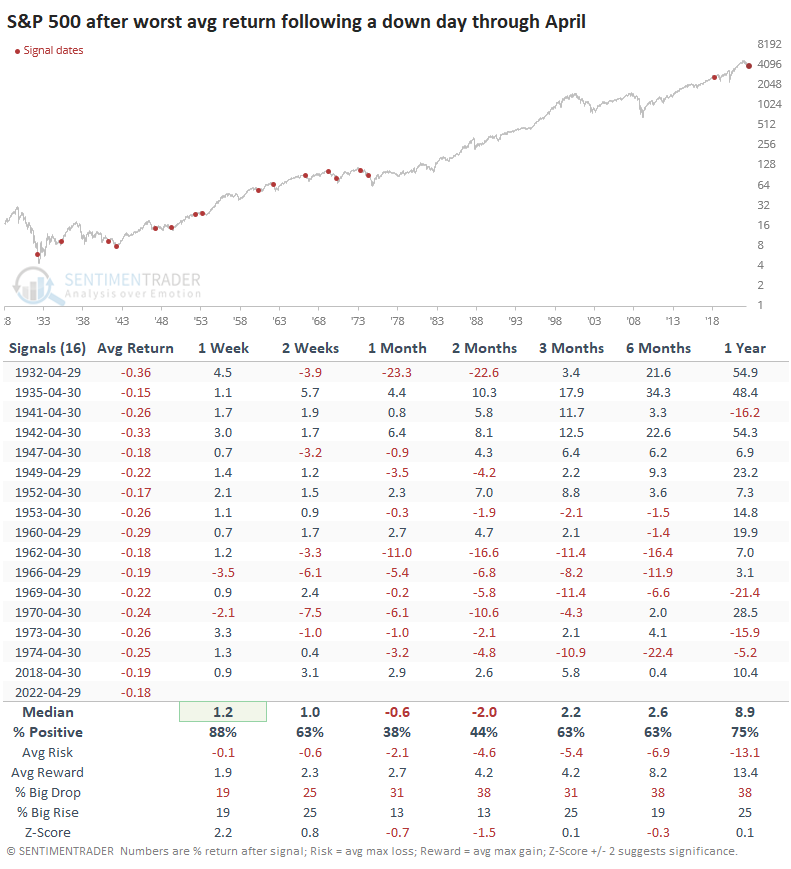
If we look at the opposite condition, when investors showed the most eager BTFD attitudes through April, forward returns were much better, and "sell in May" didn't have much of a hold on their mentalities.
A persistent loss for the year
Also weighing on sentiment is the persistent nature of this drop. The S&P has now suffered three consecutive large weekly declines for the first time since 2009. This was a mixed bag, with returns about in line with average in the weeks and months ahead.
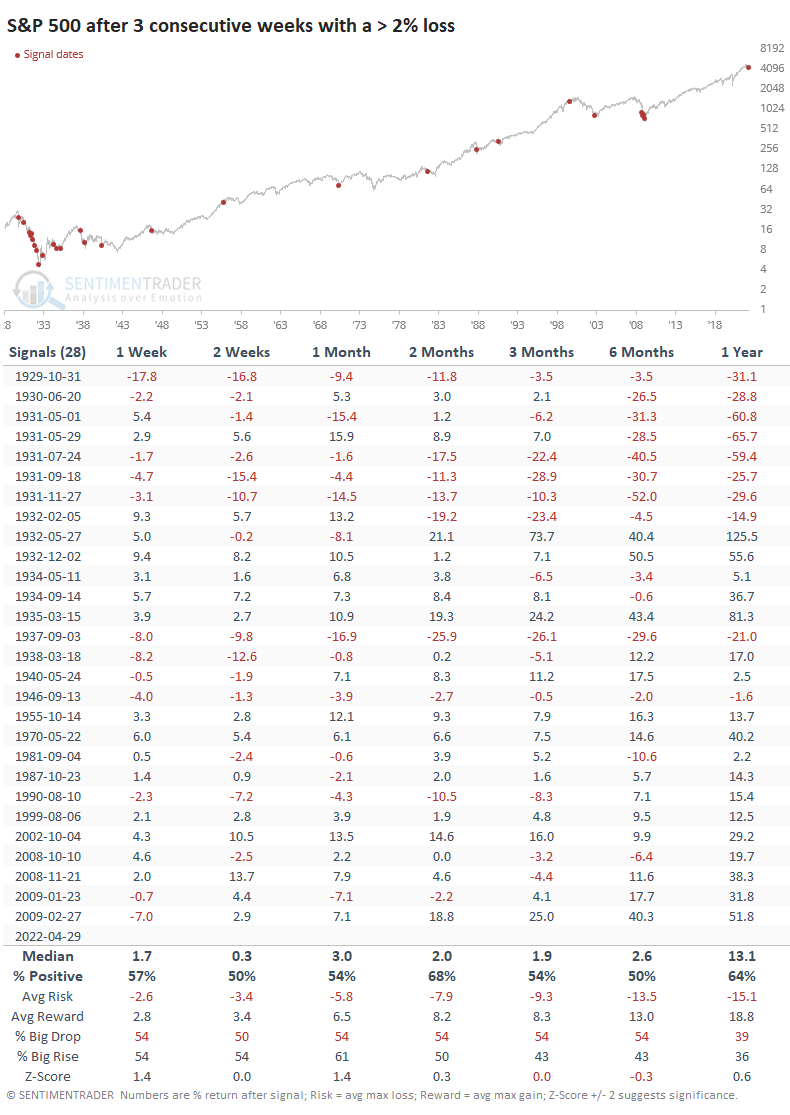
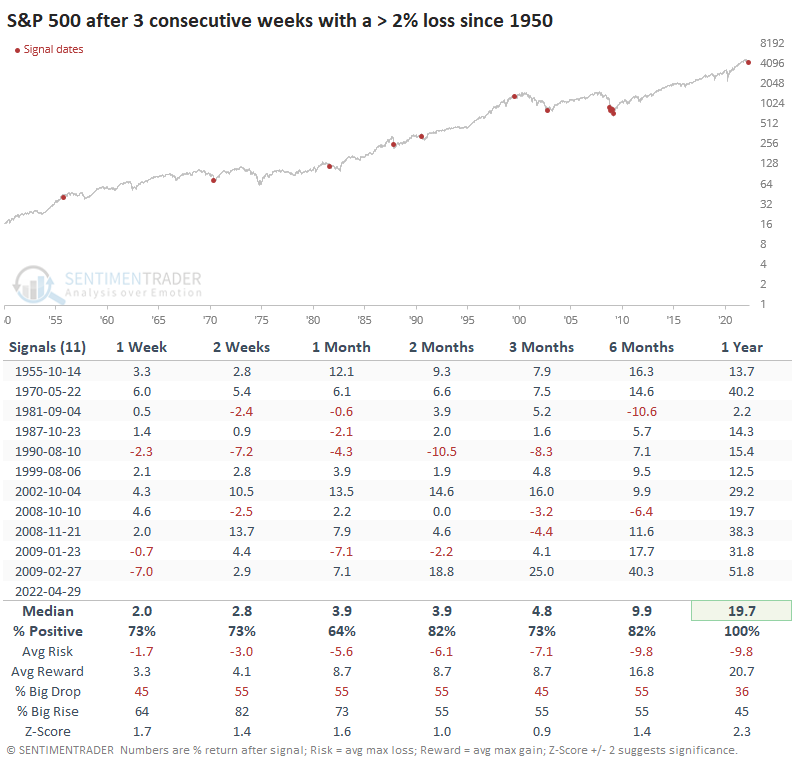
All of the worst losses were in the 1930s. Since markets became "institutionalized" in the 1950s, returns were much better. The S&P enjoyed a 100% win rate over the next year, with an impressive average return of nearly +20%.
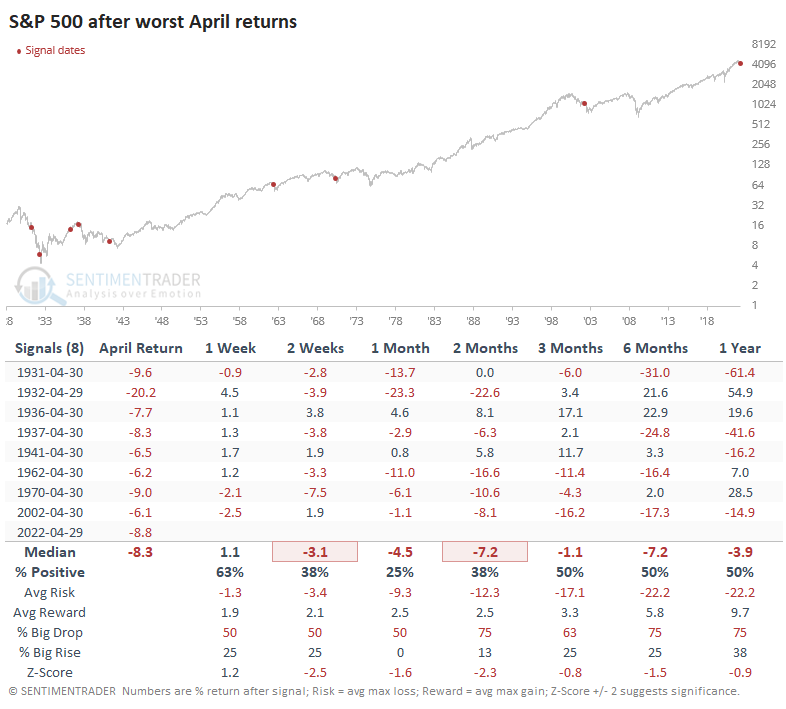
The trouble with statistics is that there's always something we can show to prove whatever point we wish to make. That's why we try to always look from multiple angles, keep context in mind at all times, and let data form opinions instead of the other way around. When we look only at poor returns in April, the modest positive bias from multiple weekly losses evaporates. A bad April showed a strong tendency to lead to even worse losses. About the only solace is that there are few precedents in modern times.
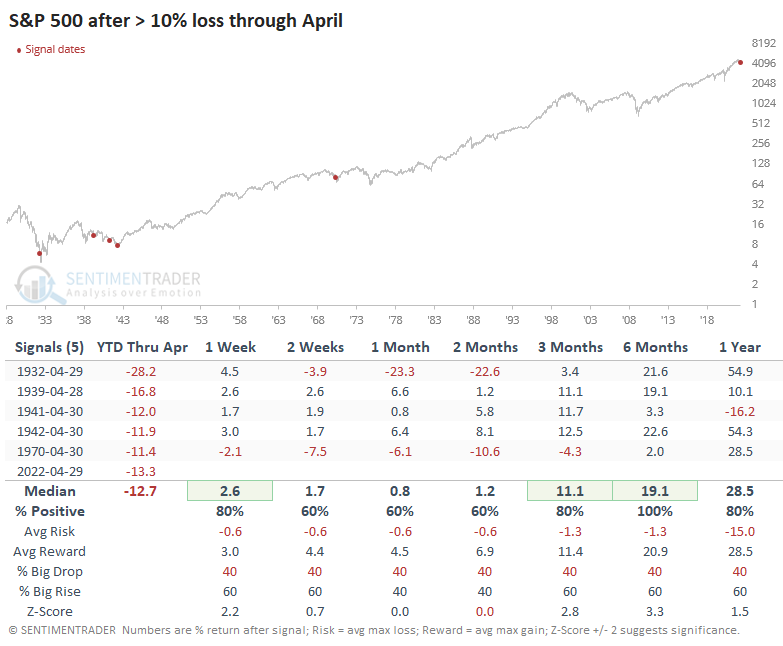
As sample sizes constrict, relying on precedents gets harder and harder. So taking this with an even bigger grain of salt, this is only the sixth time in history that the S&P 500 ended April in correction territory for the year. The last time it showed a year-to-date loss of more than 10% through April was 1970, which was the only precedent since 1950. That year preceded even more losses in the months ahead before staging a furious rebound.
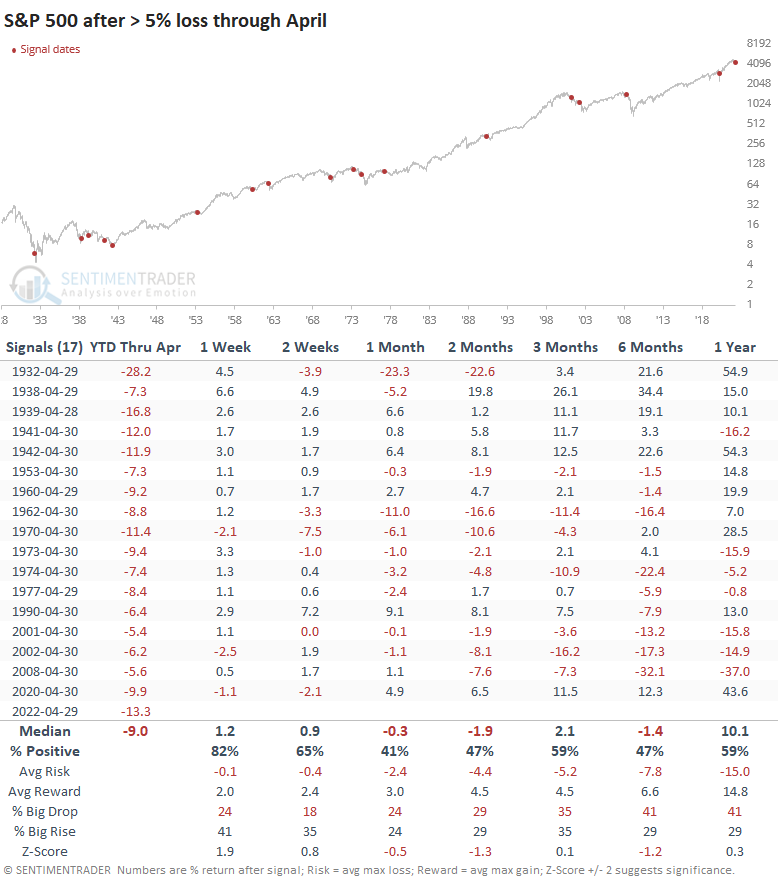
If we relax the parameters to generate a larger sample size, 17 years showed at least a 5% YTD loss through April. These showed mostly weak returns over the next couple of months. It's interesting that since 1950, almost every signal showed a negative return at some point between 3-12 months later.
What the research tells us...
Well, it's mixed. Overall, the behavior of investors last month tilts to the negative side for the months(s) ahead, but it becomes less clear the further out we look. Performance has been so bad that longer-term returns tend to be above average. It's the summer months that look to be the most dangerous. We're in an unhealthy environment with risk-off behavior. Despite some scattered evidence of truly extreme pessimism, our models are not stretched yet, particularly if we're in a bear market.
Indicators at Extremes
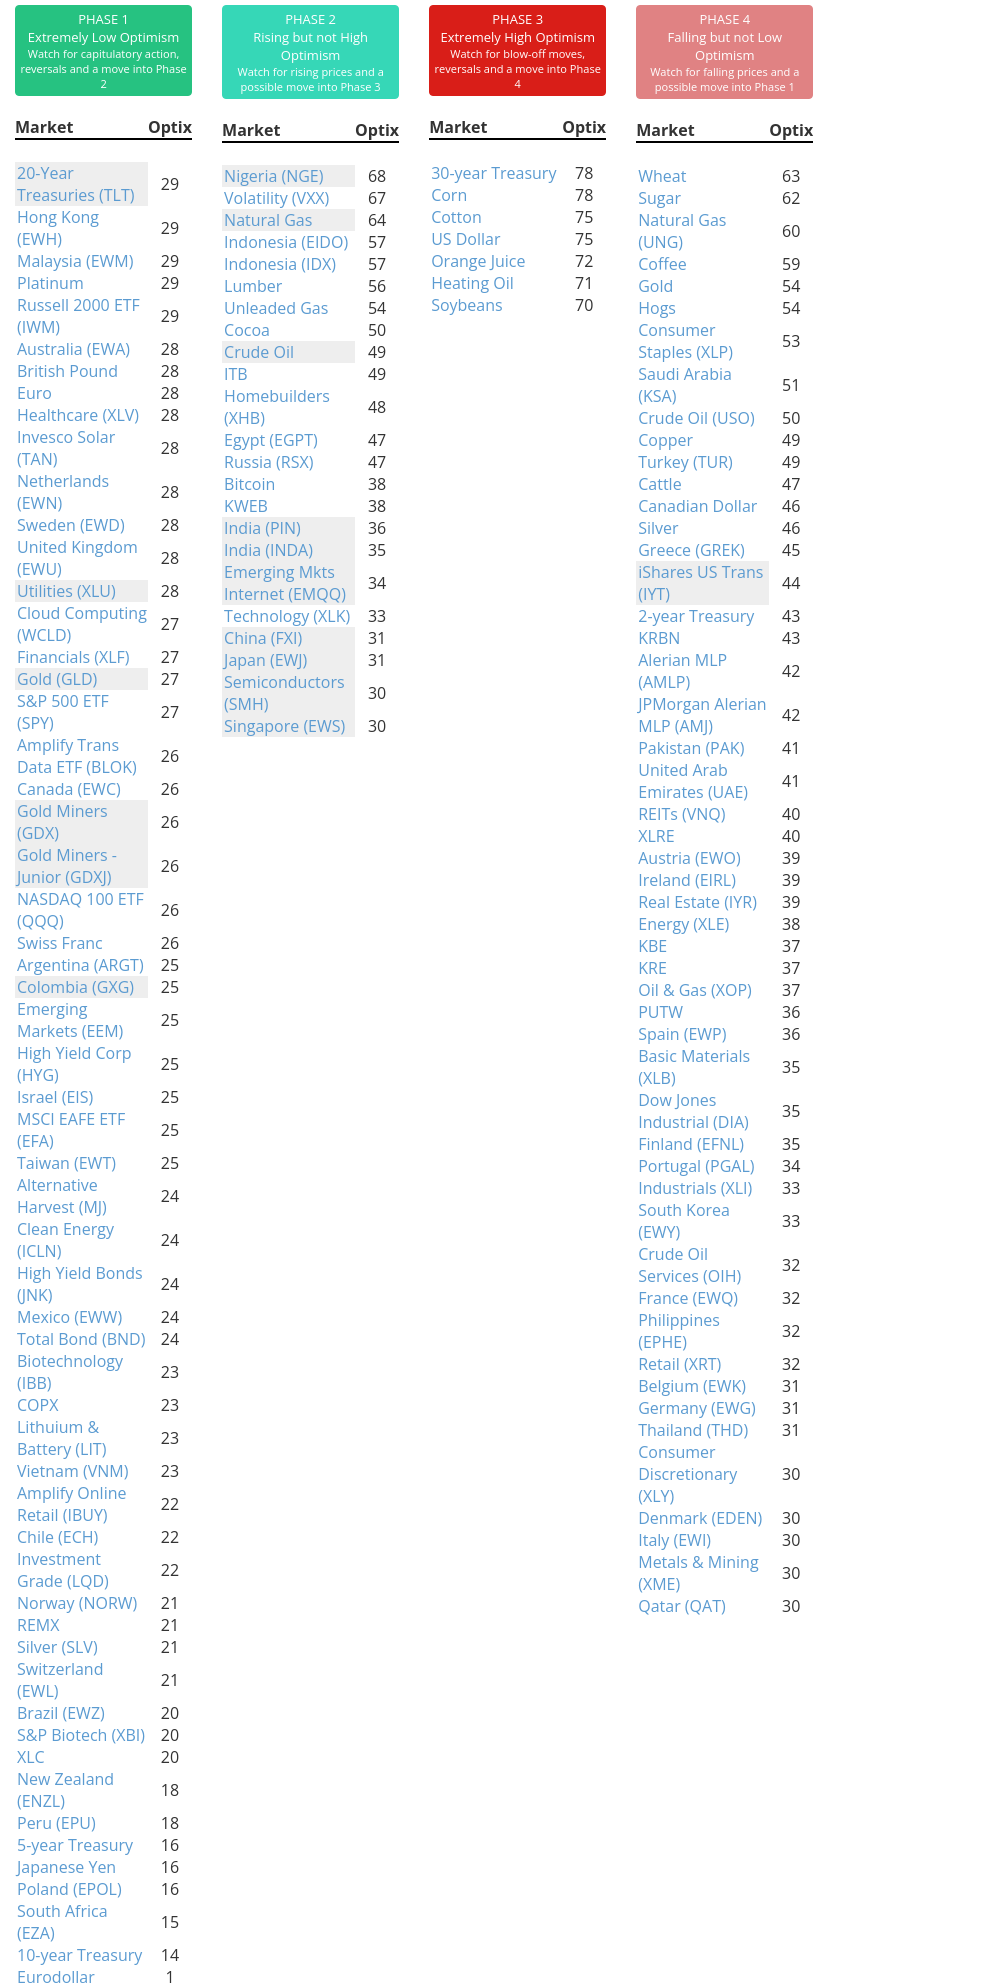
Phase Table
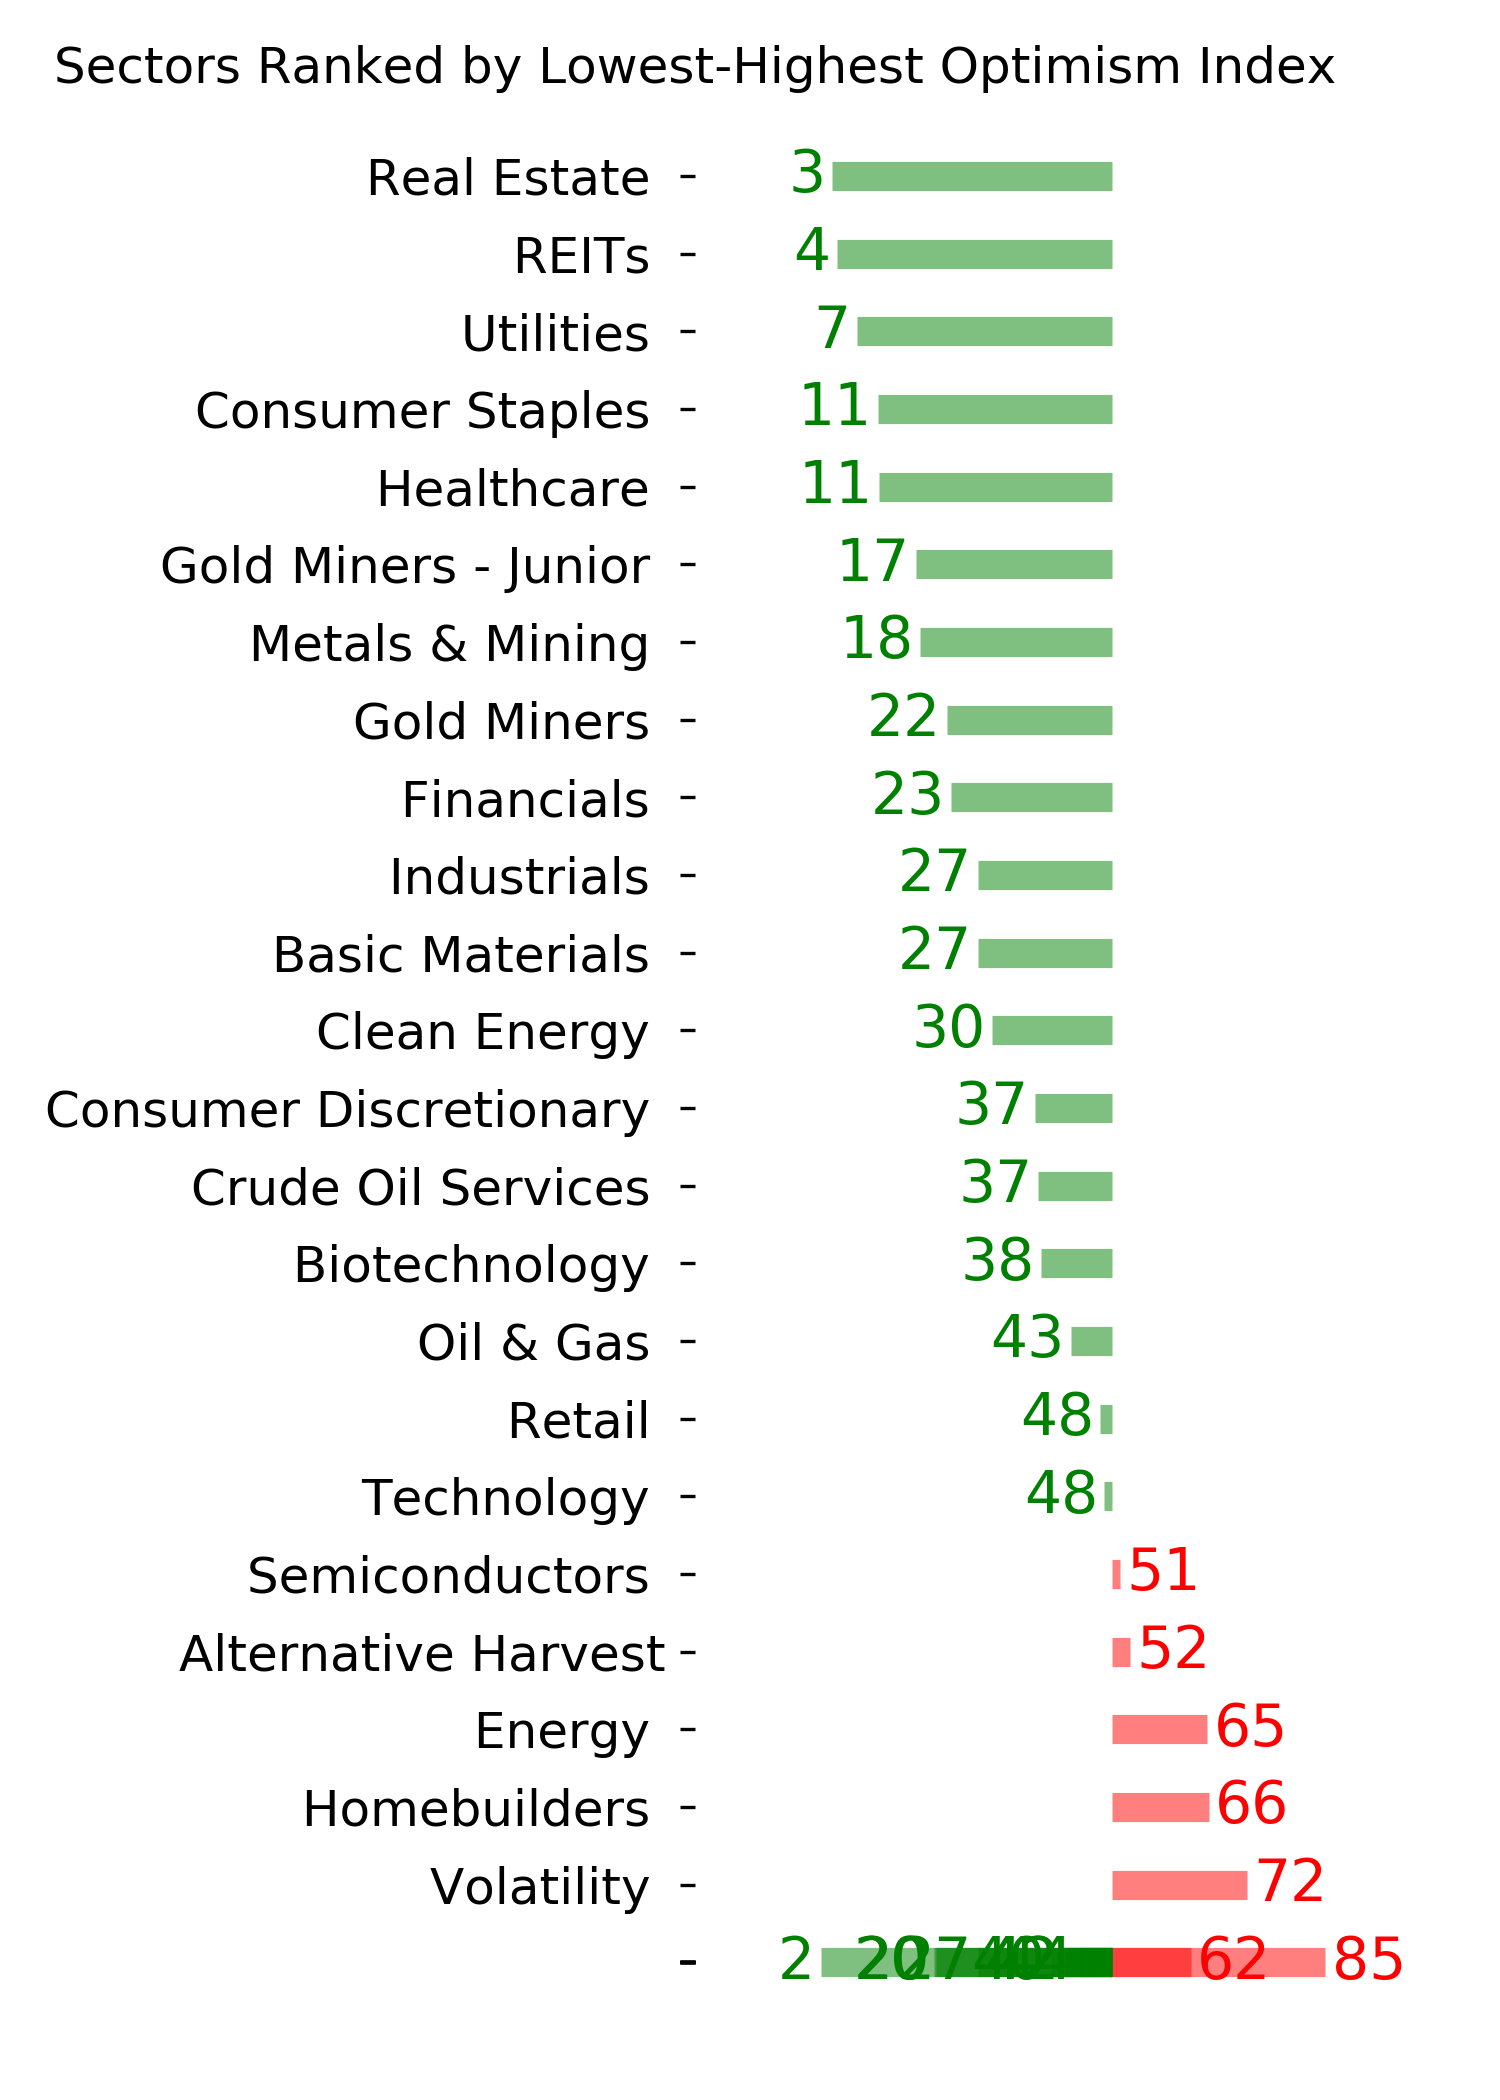
Ranks
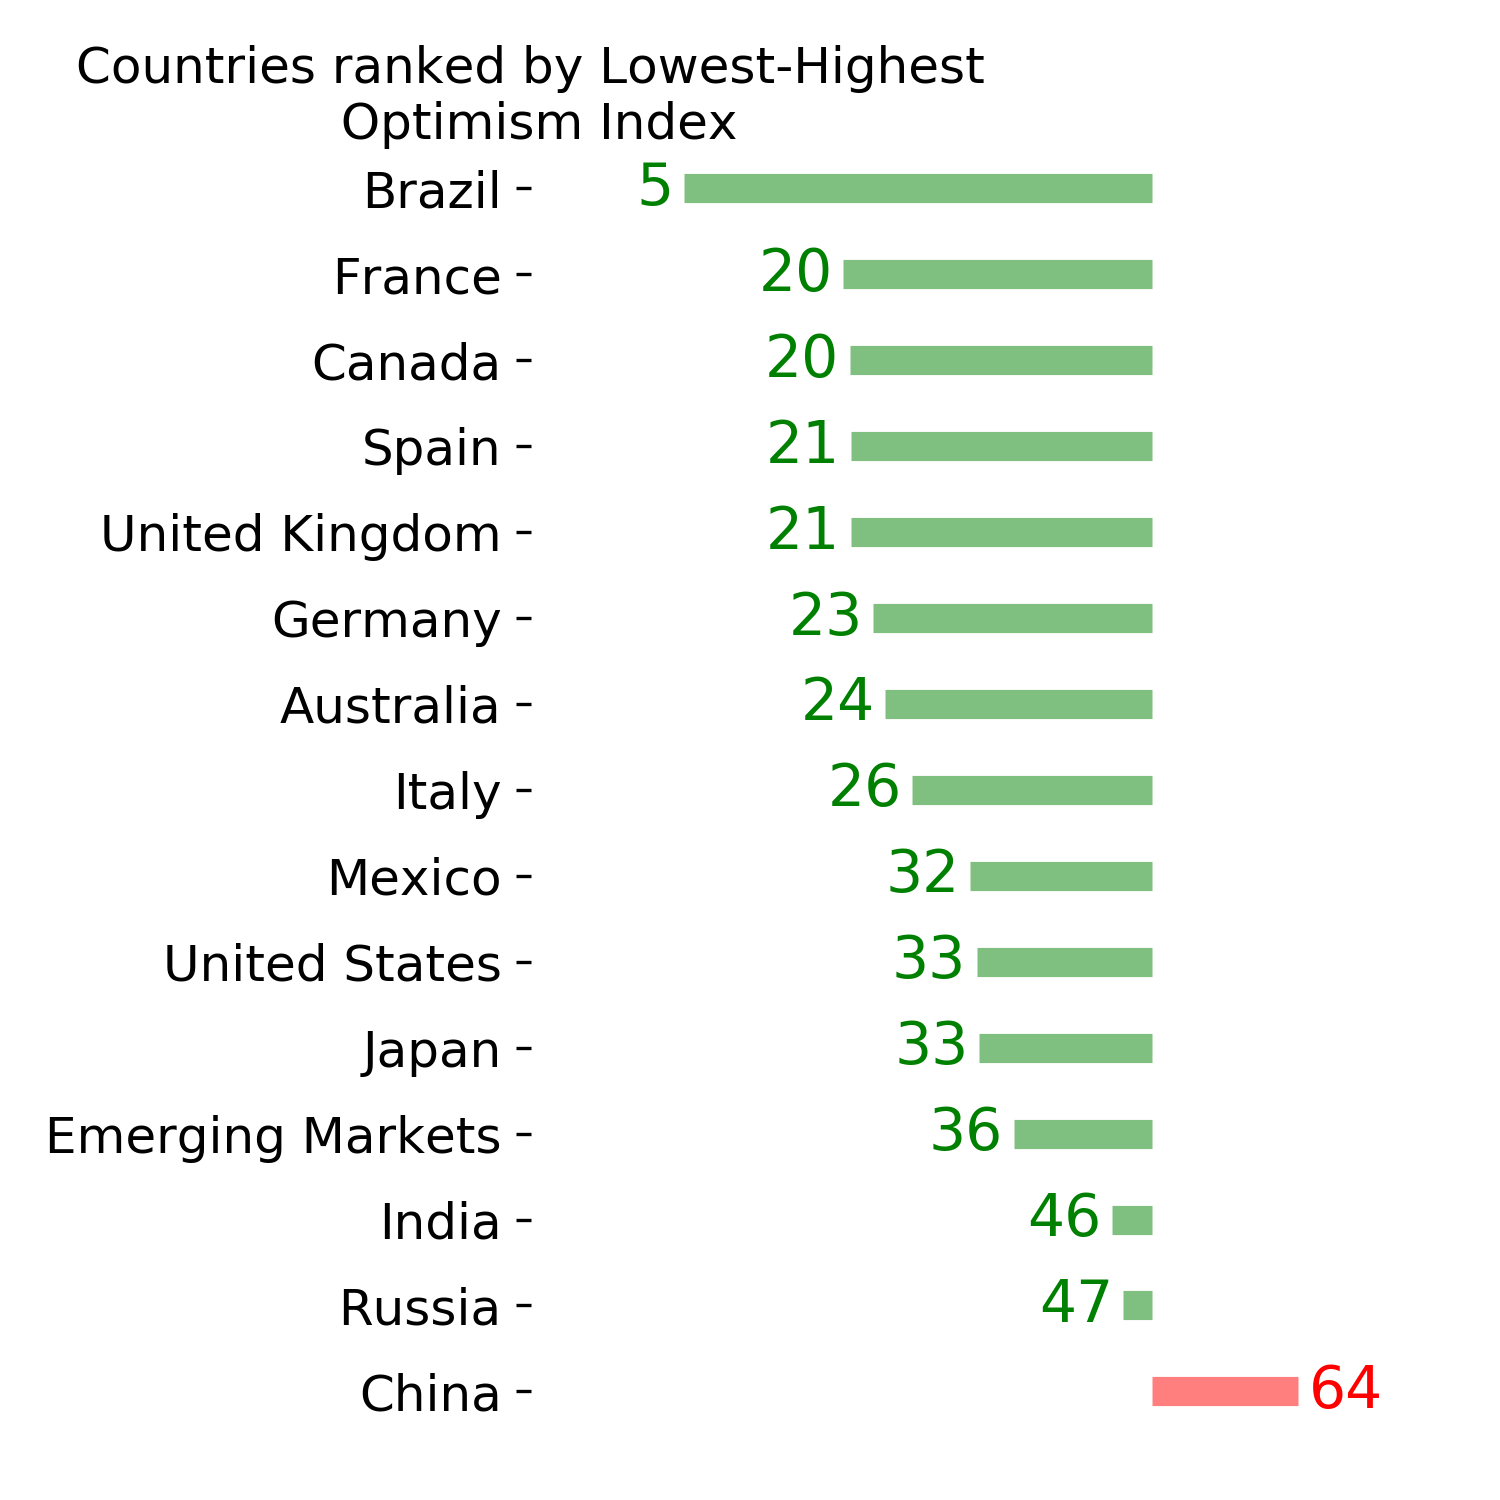
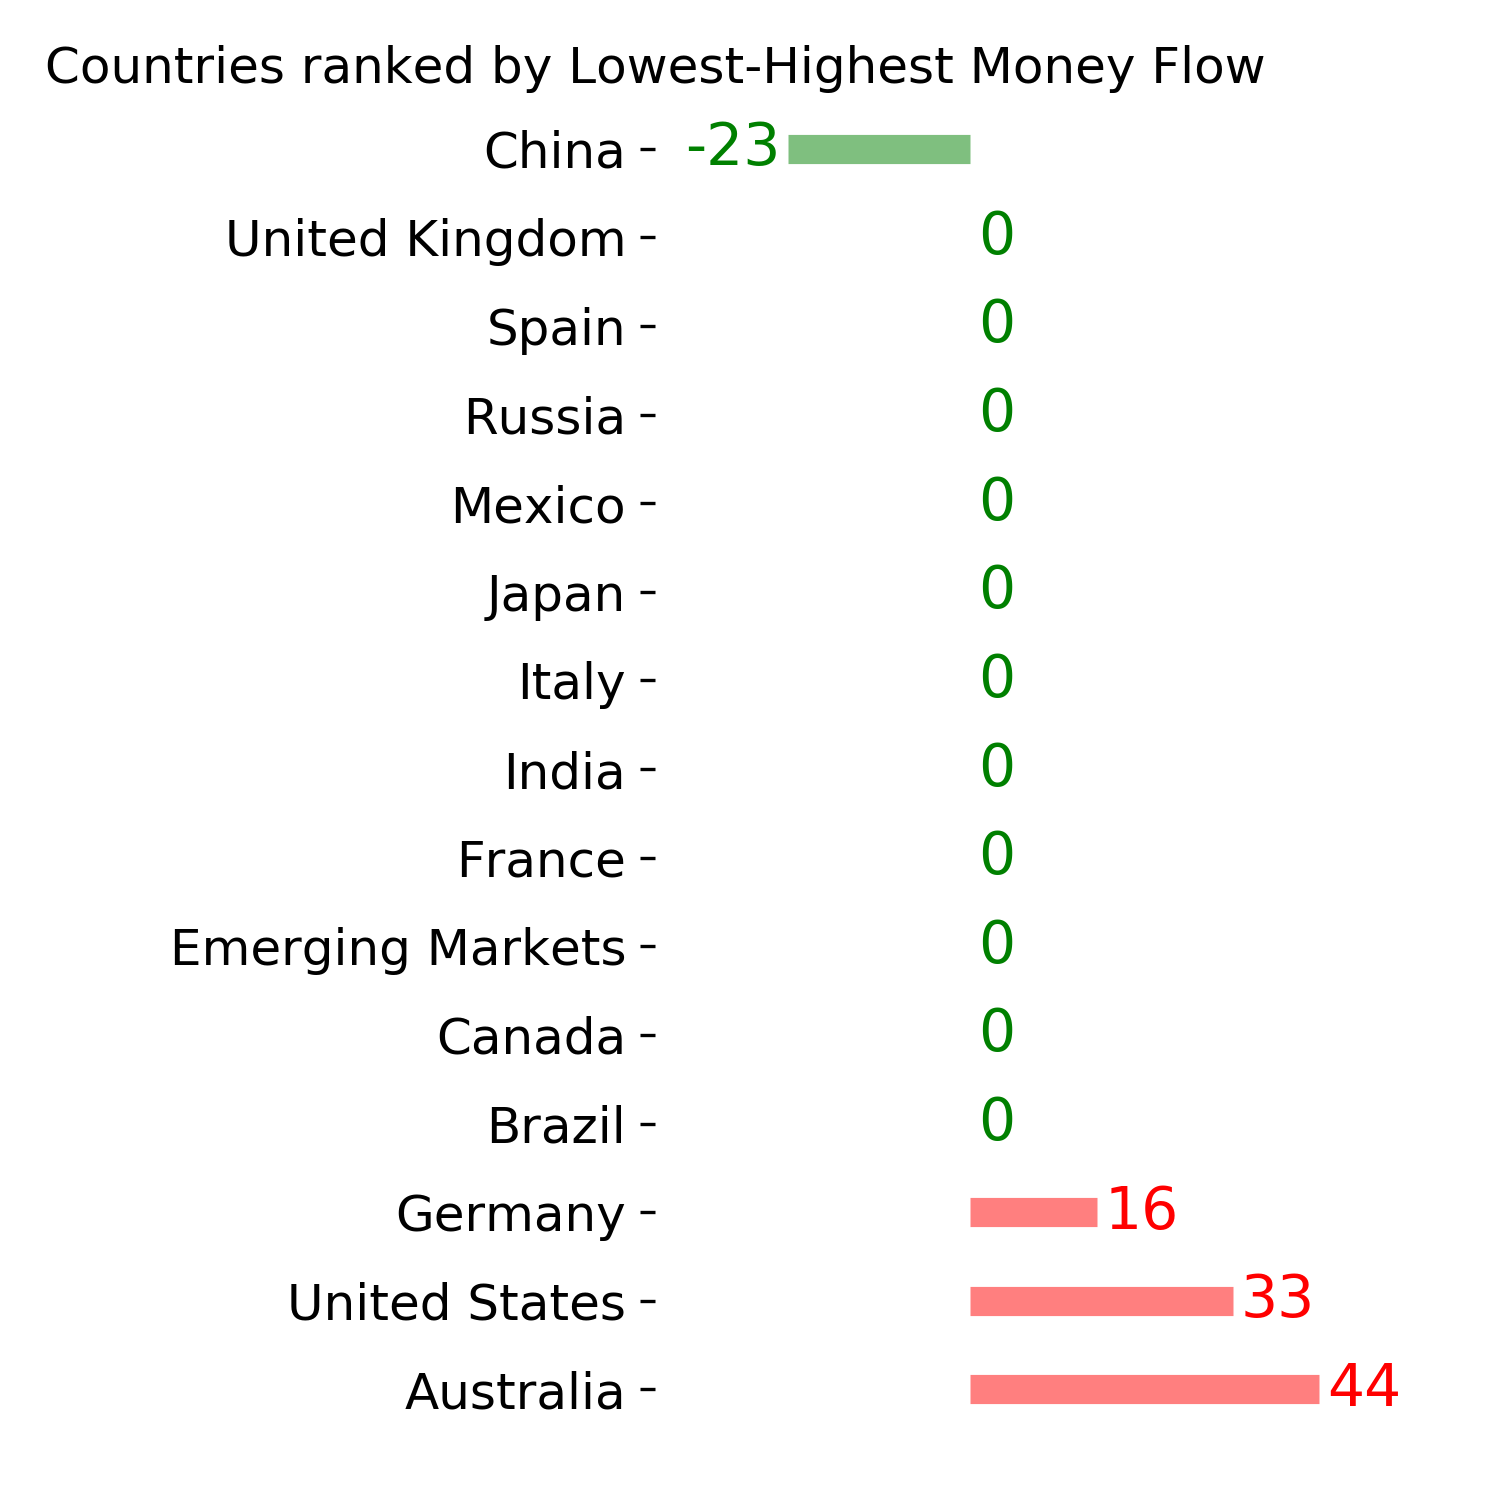
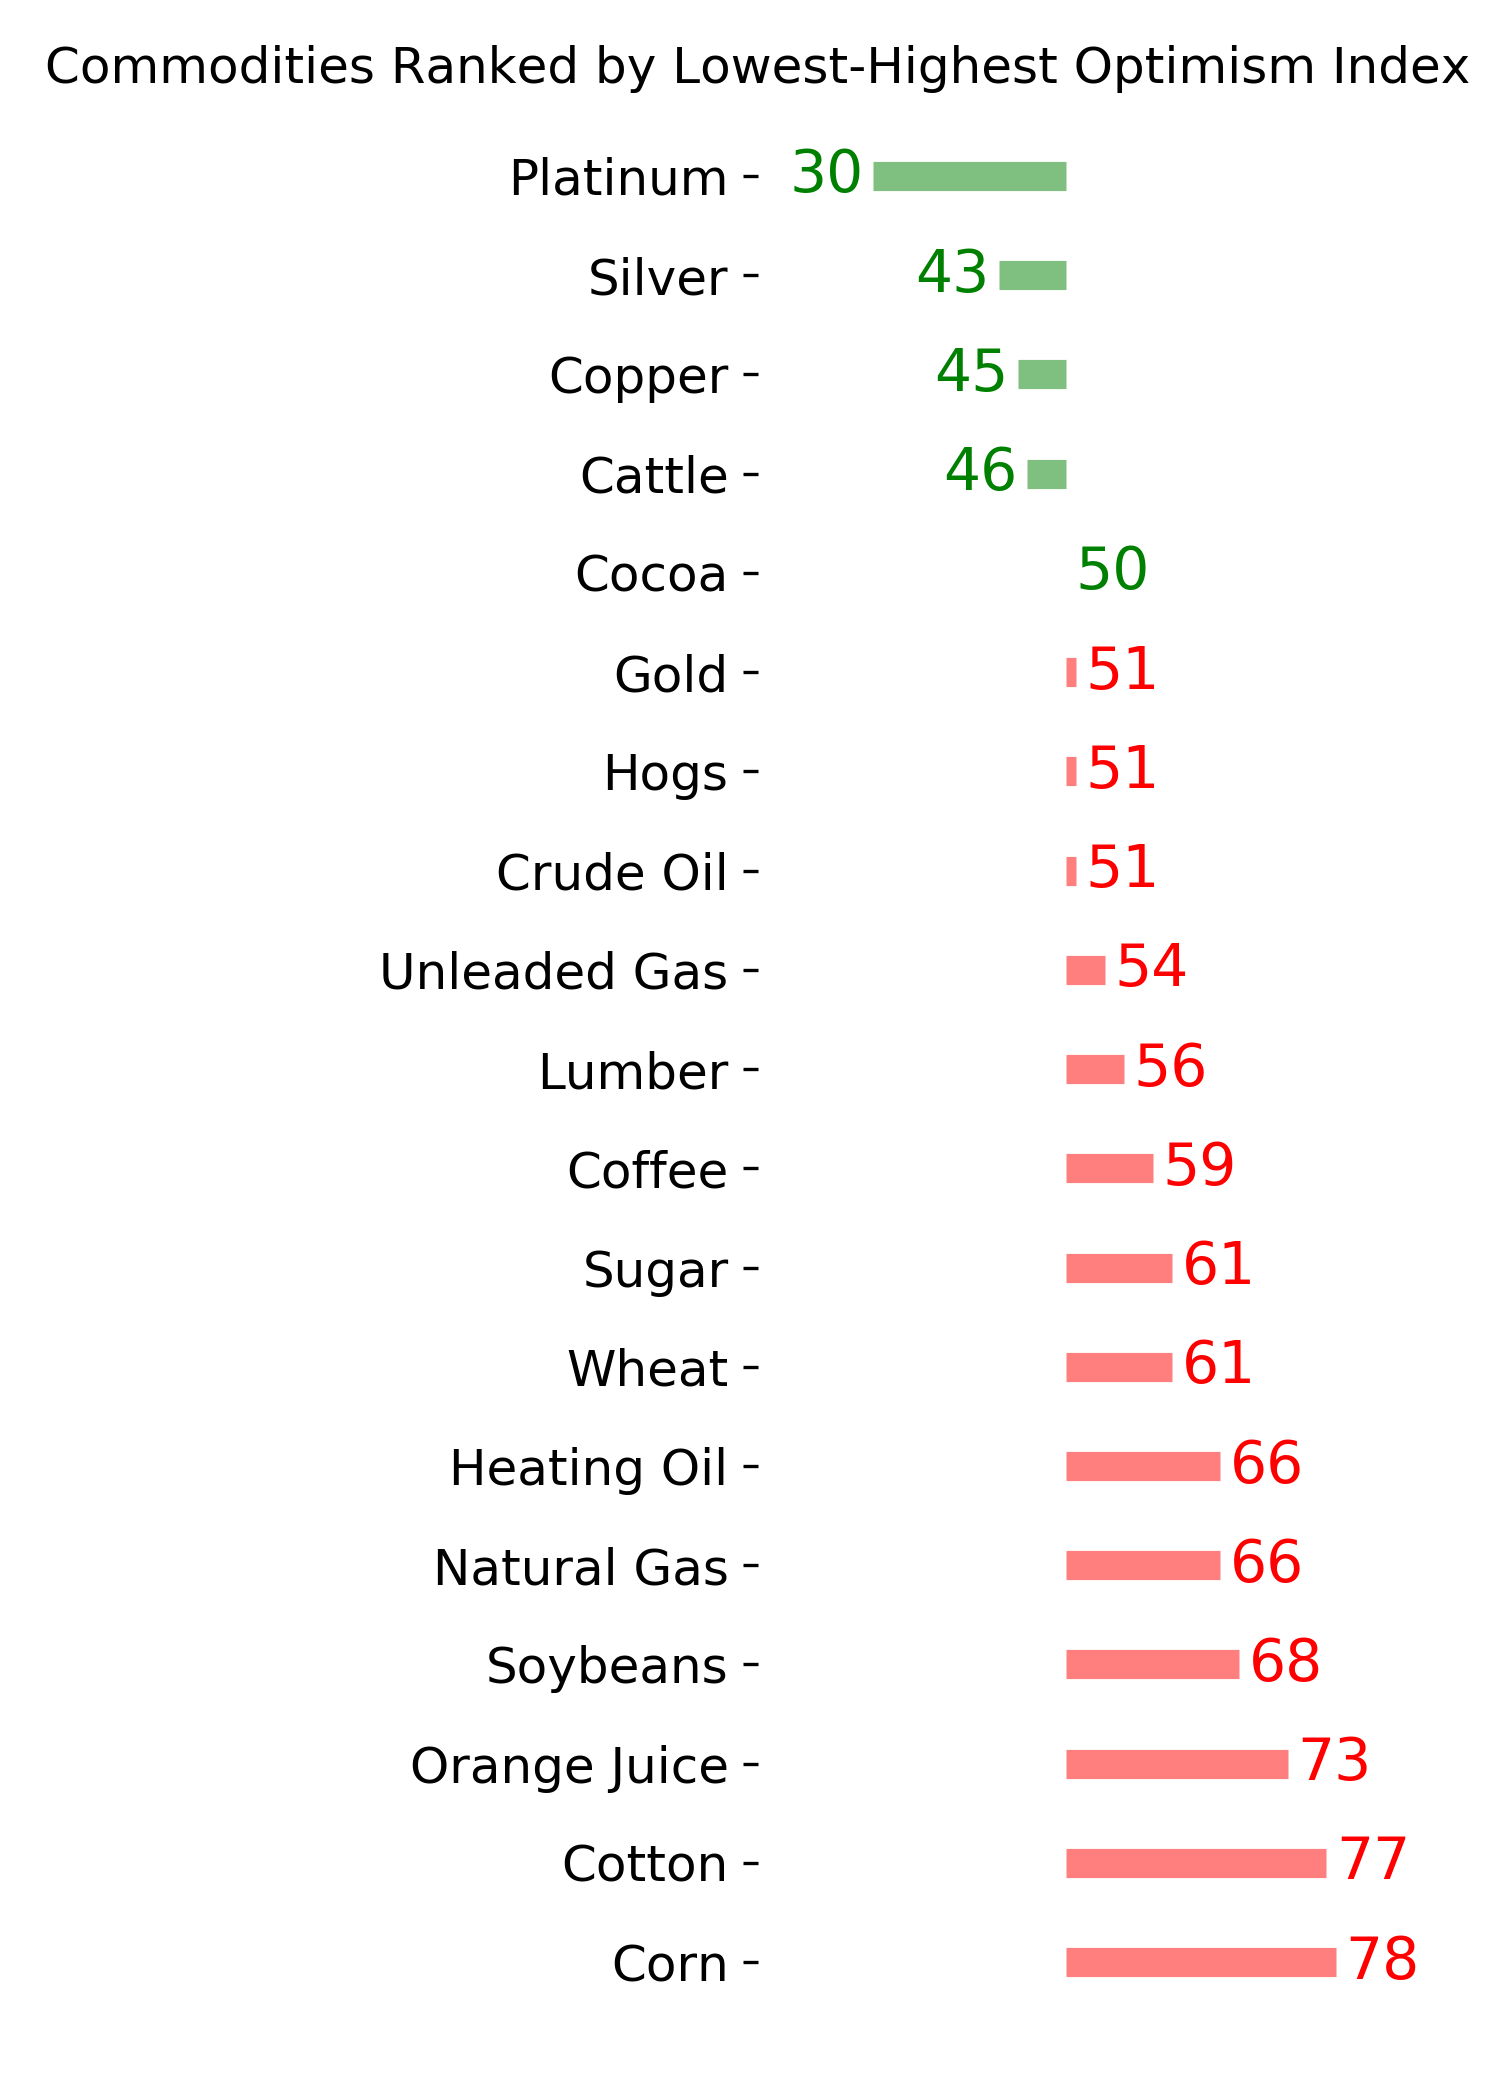
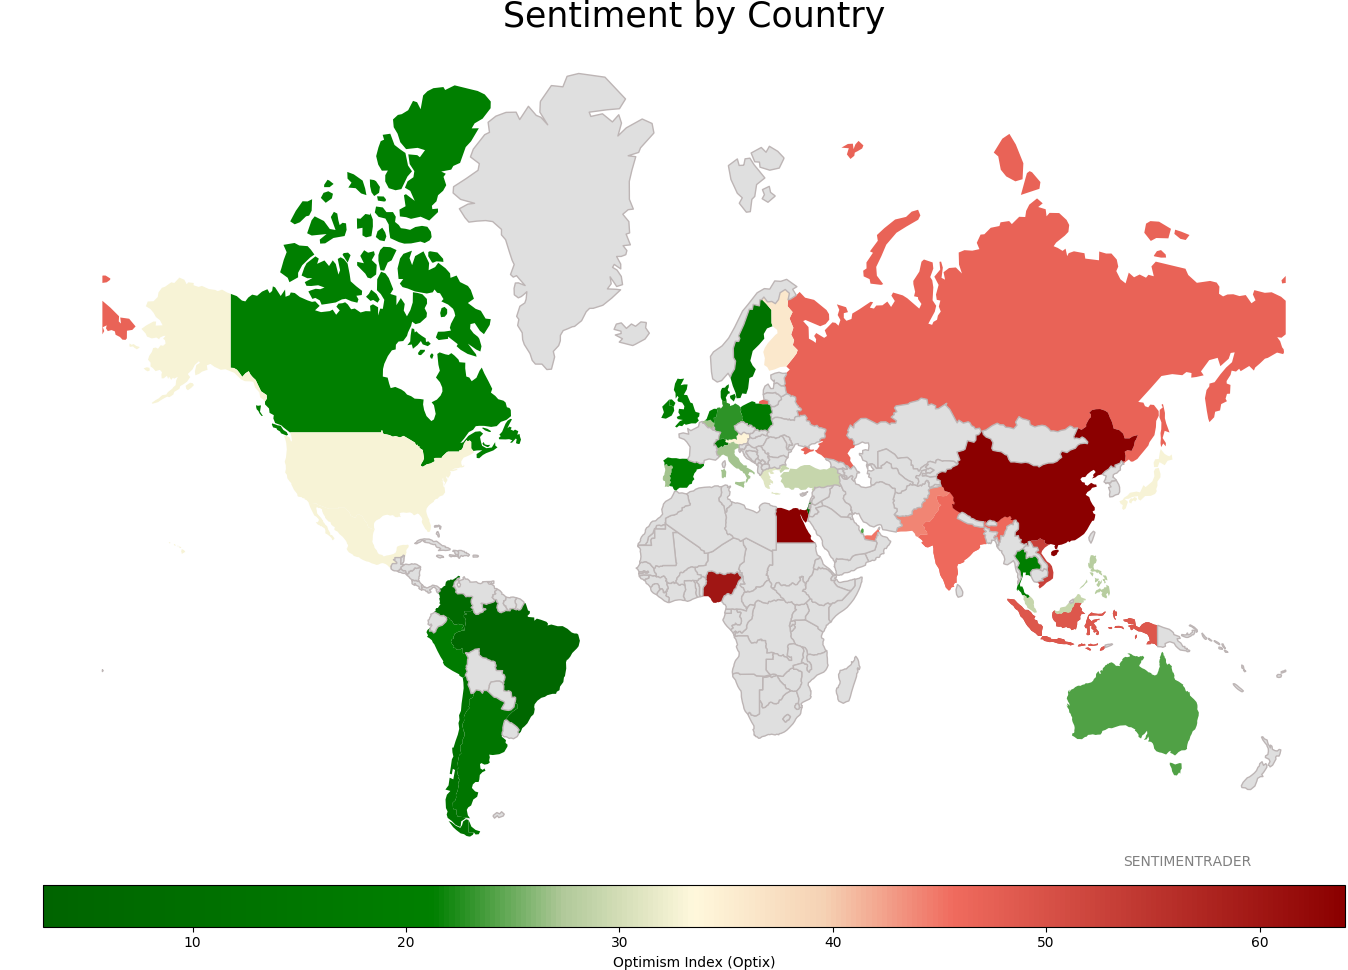
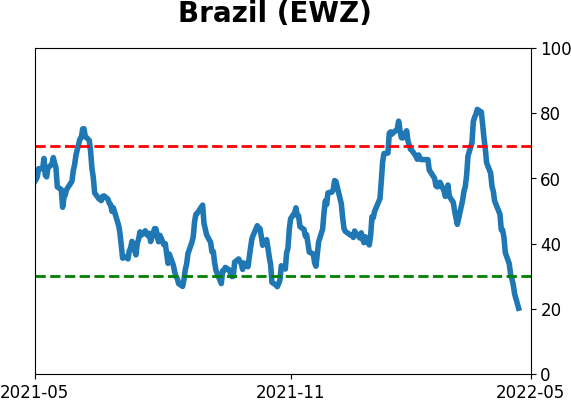
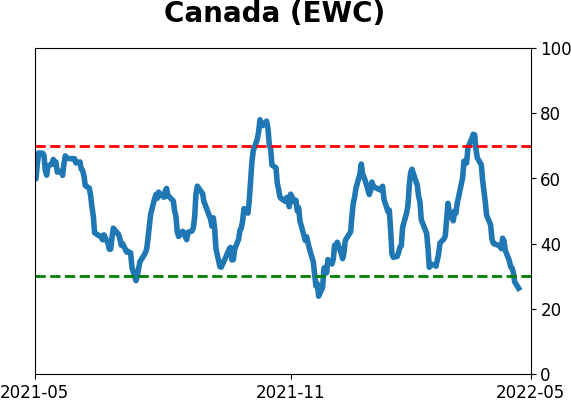
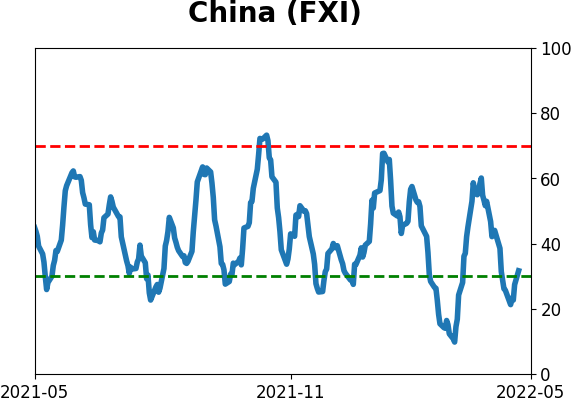
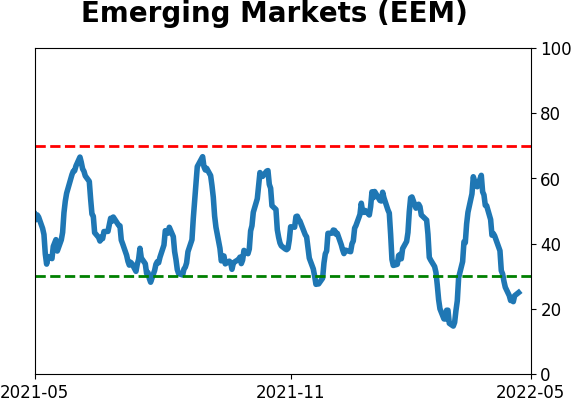
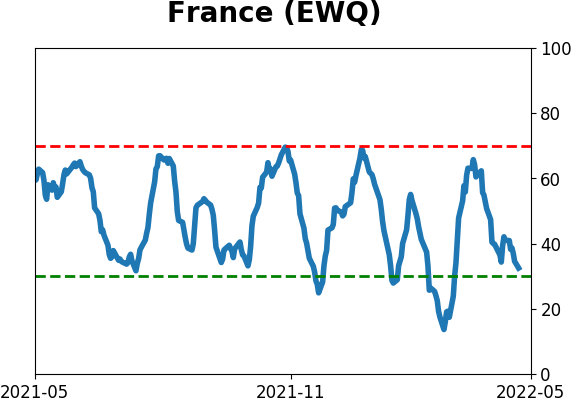
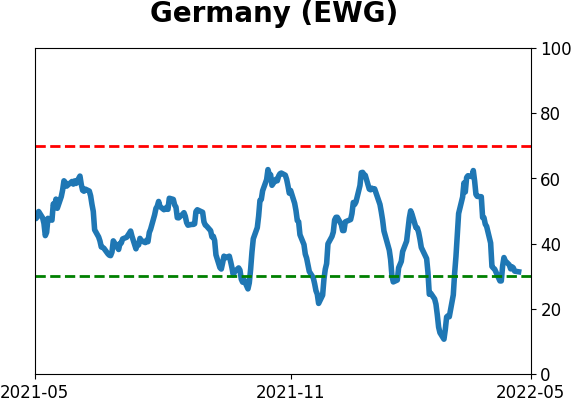
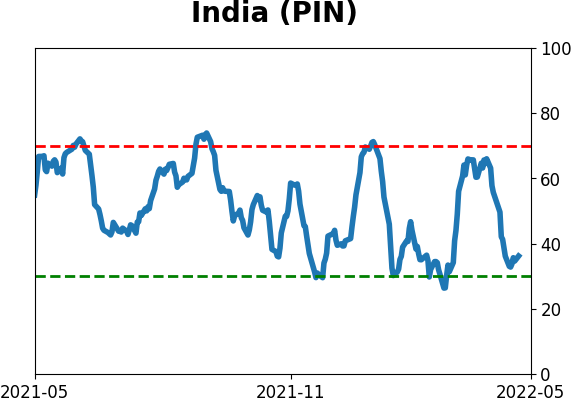
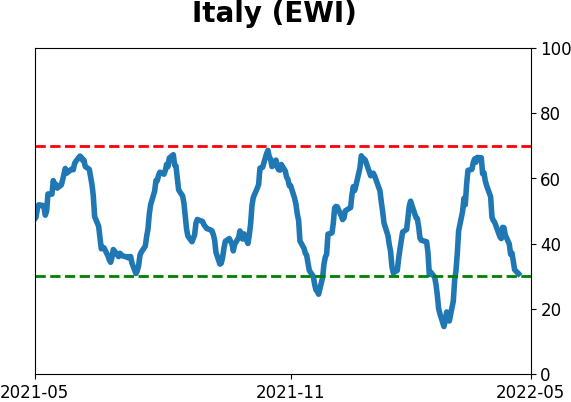
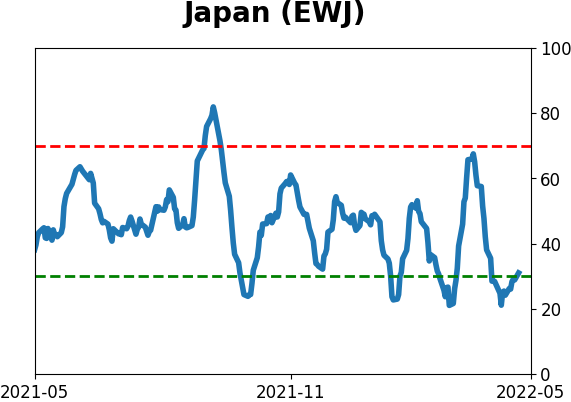
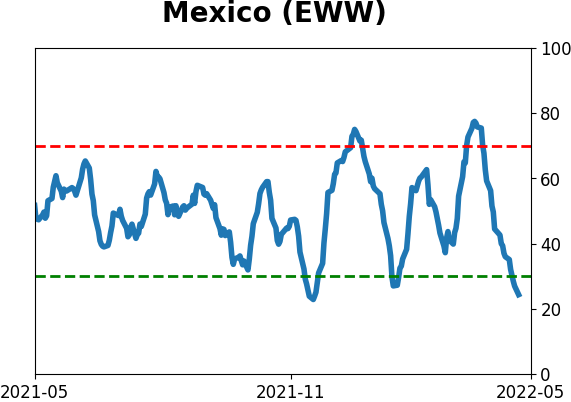
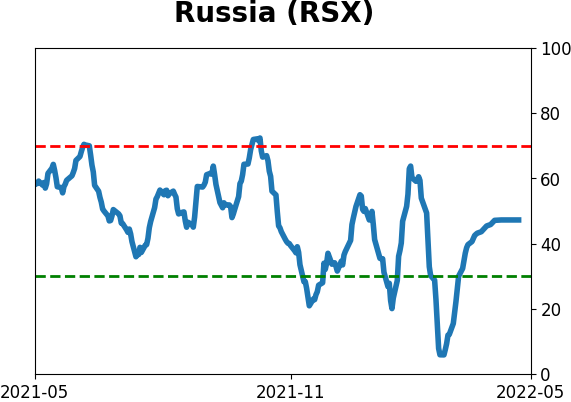
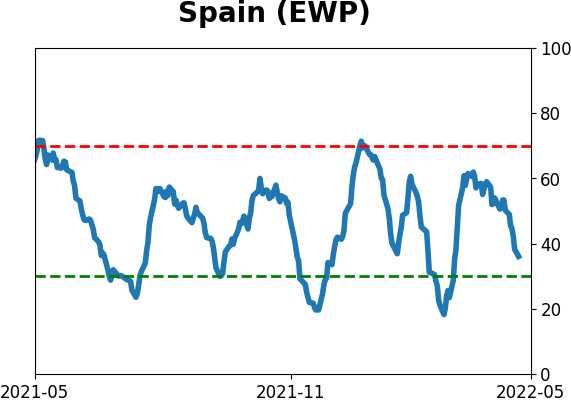
Sentiment Around The World
Optimism Index Thumbnails
|
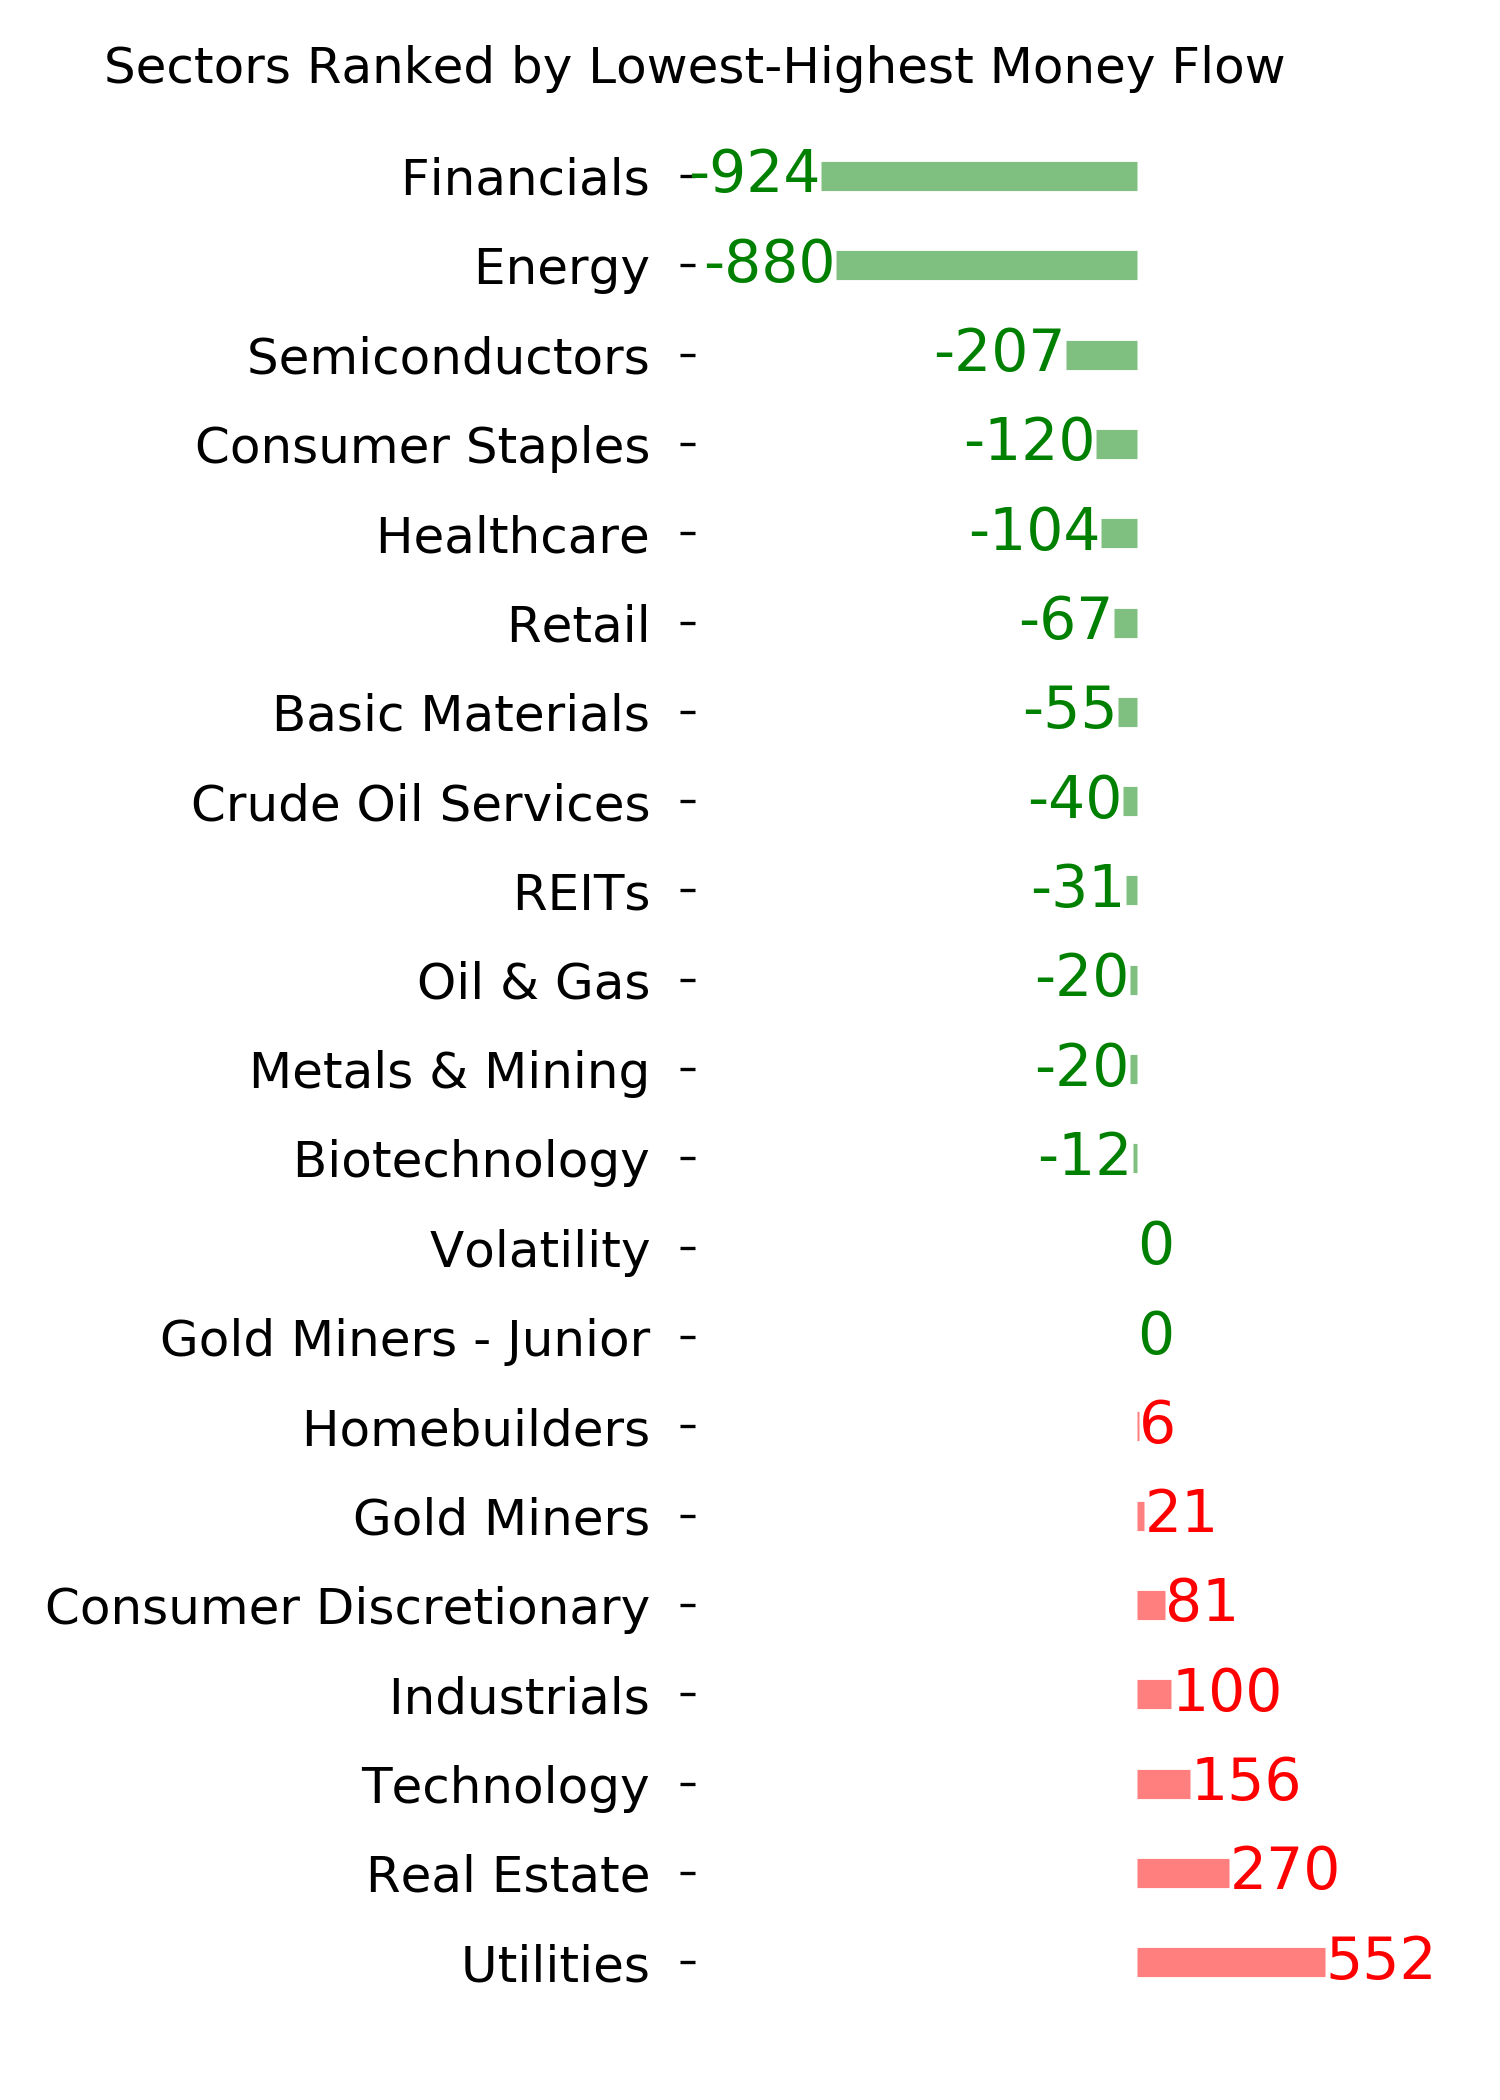
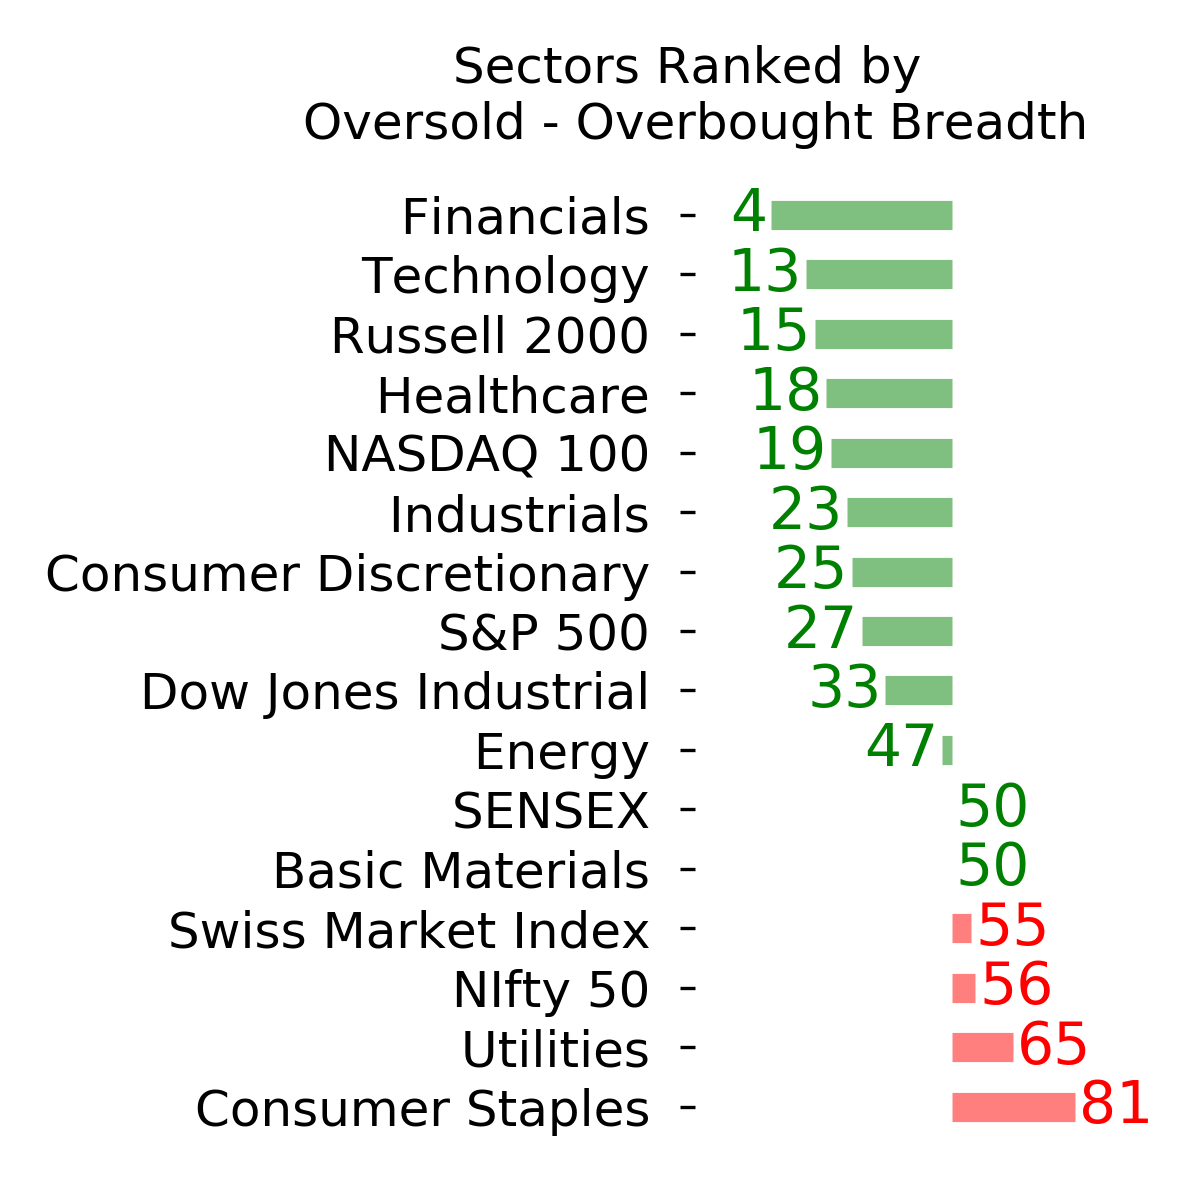
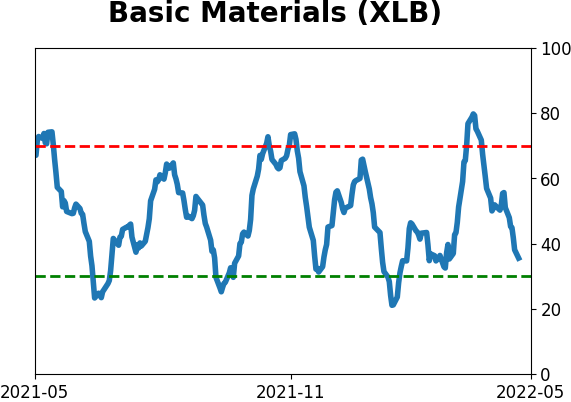
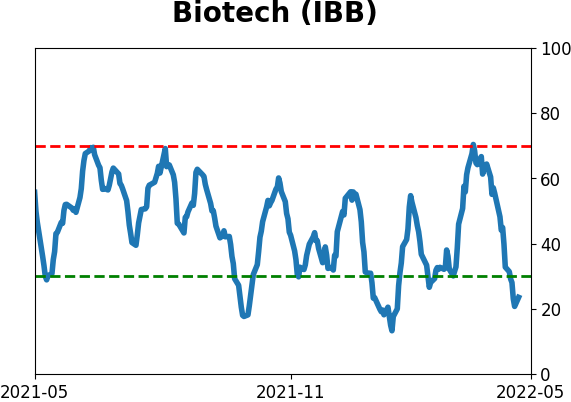
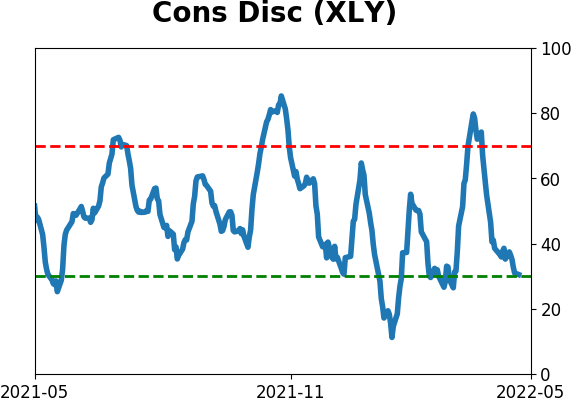
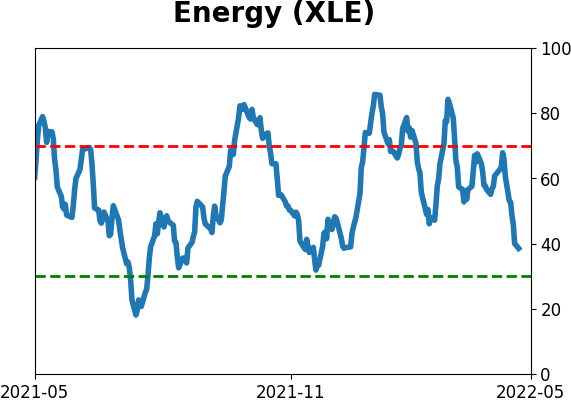
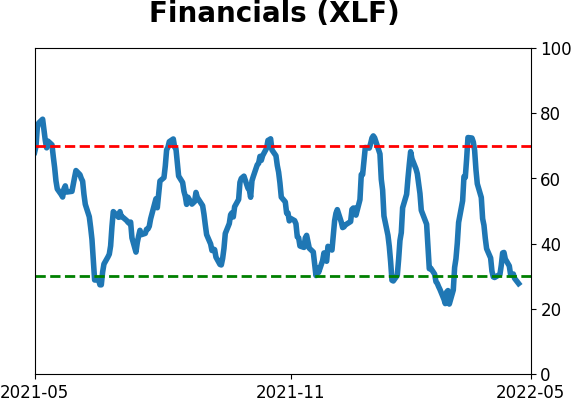
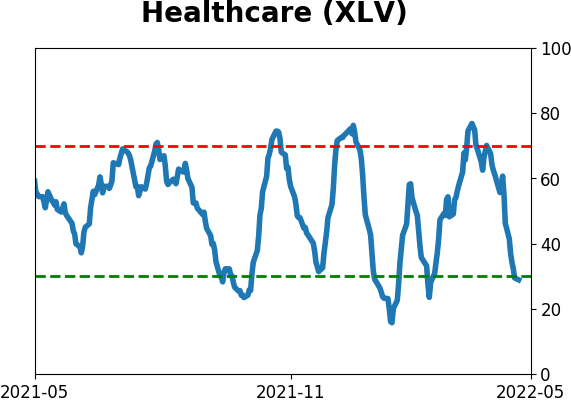
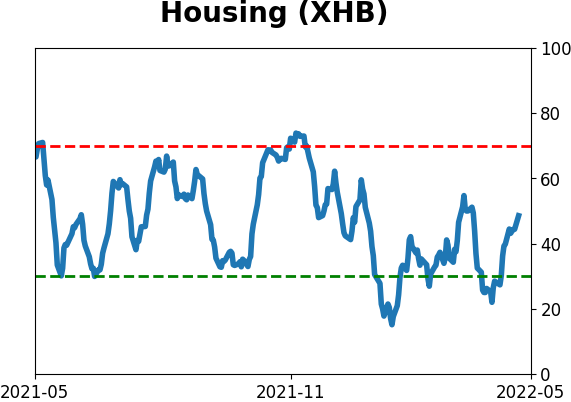
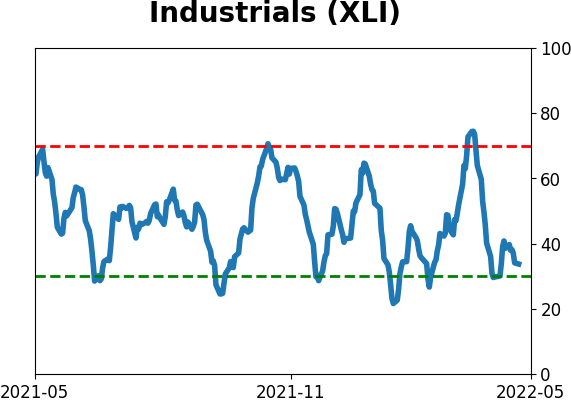
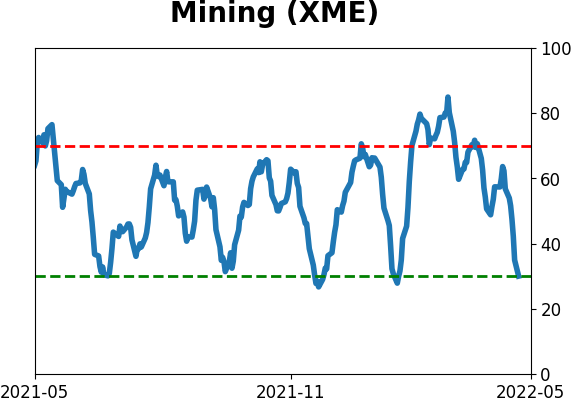
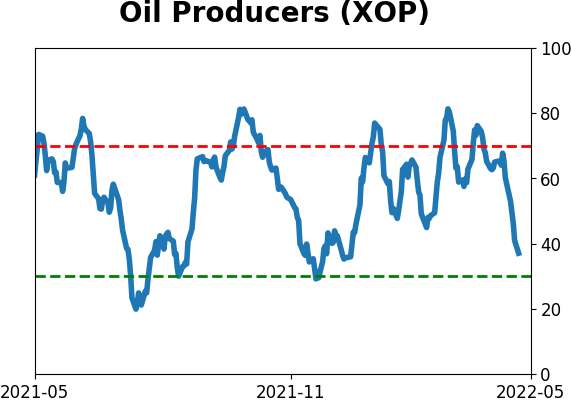
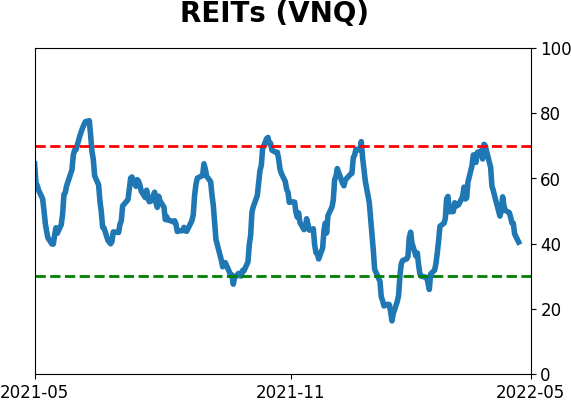
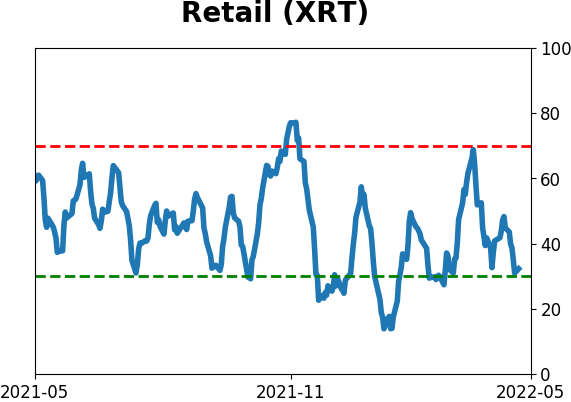
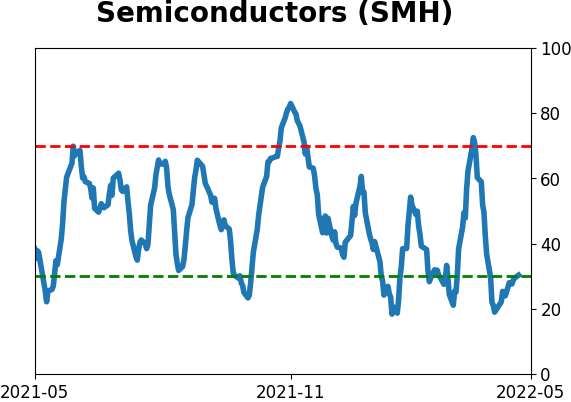
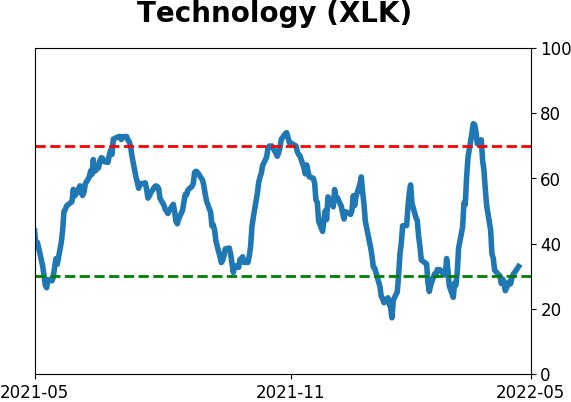
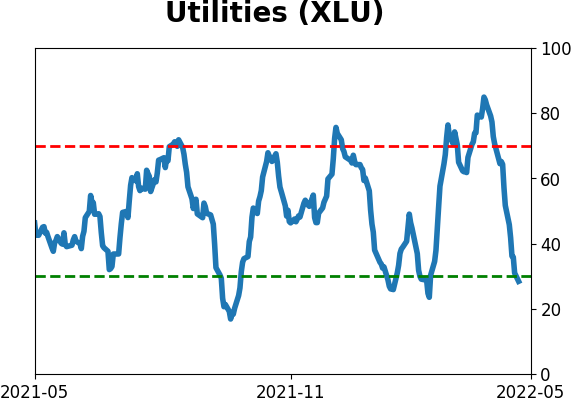
Sector ETF's - 10-Day Moving Average
|
|
|
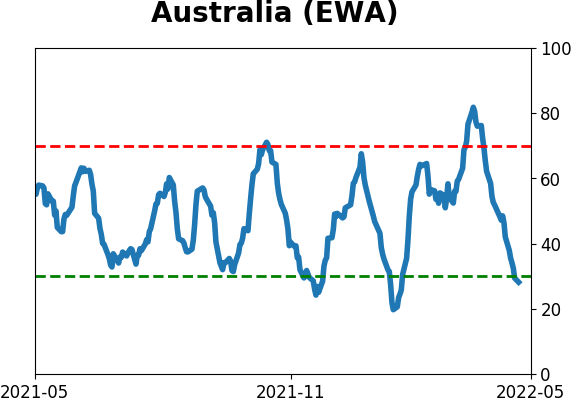
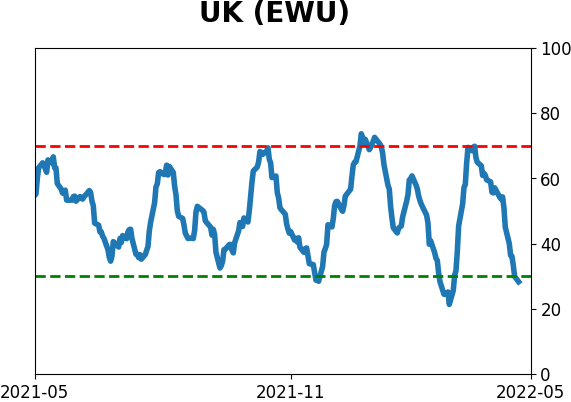
Country ETF's - 10-Day Moving Average
|
|
|
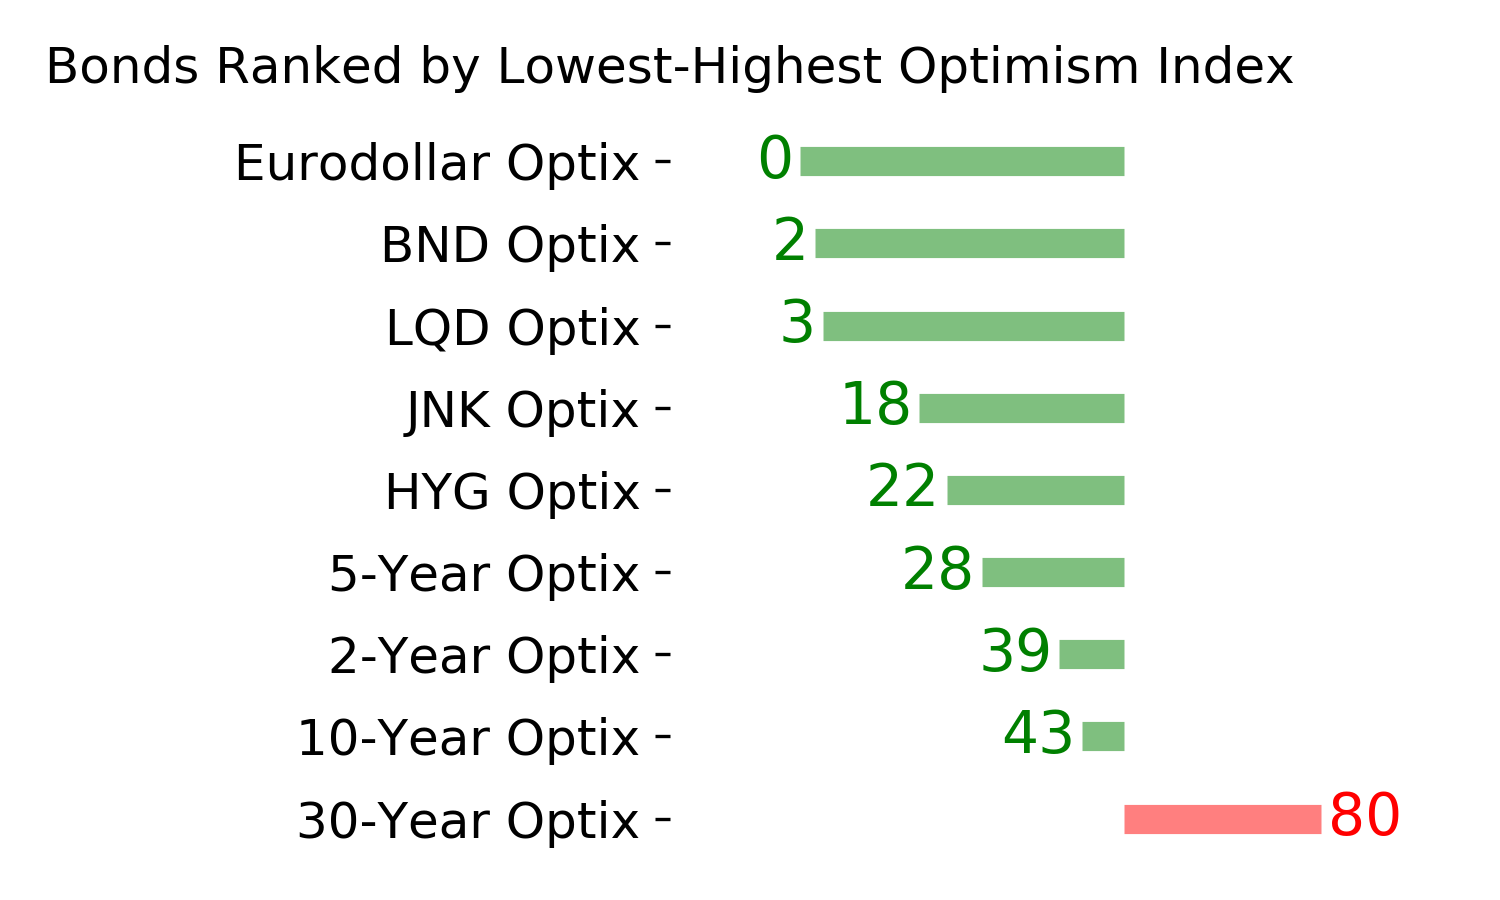
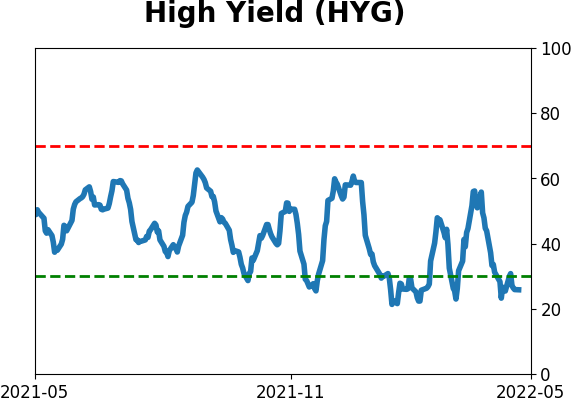
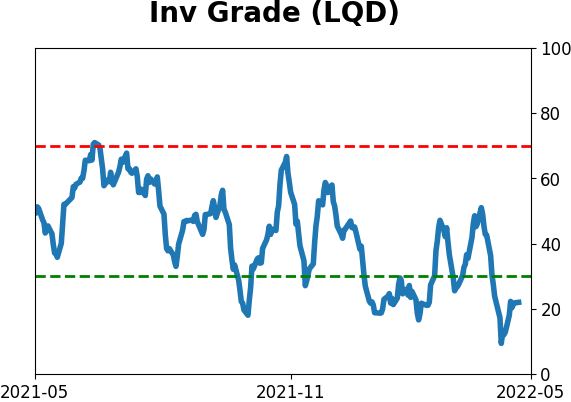
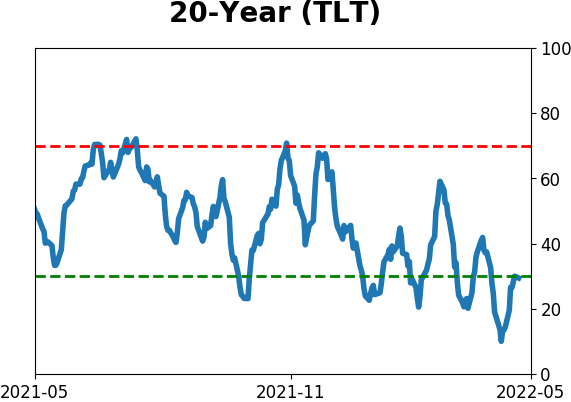
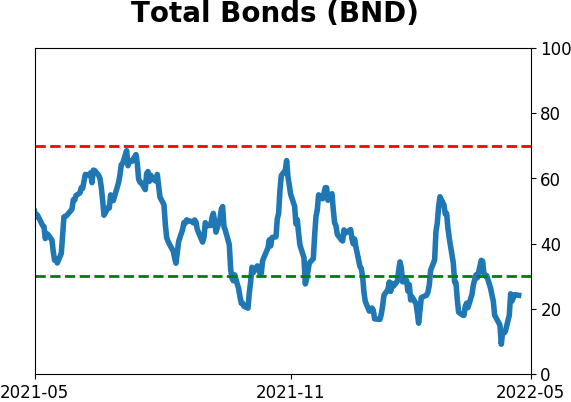
Bond ETF's - 10-Day Moving Average
|
|
|
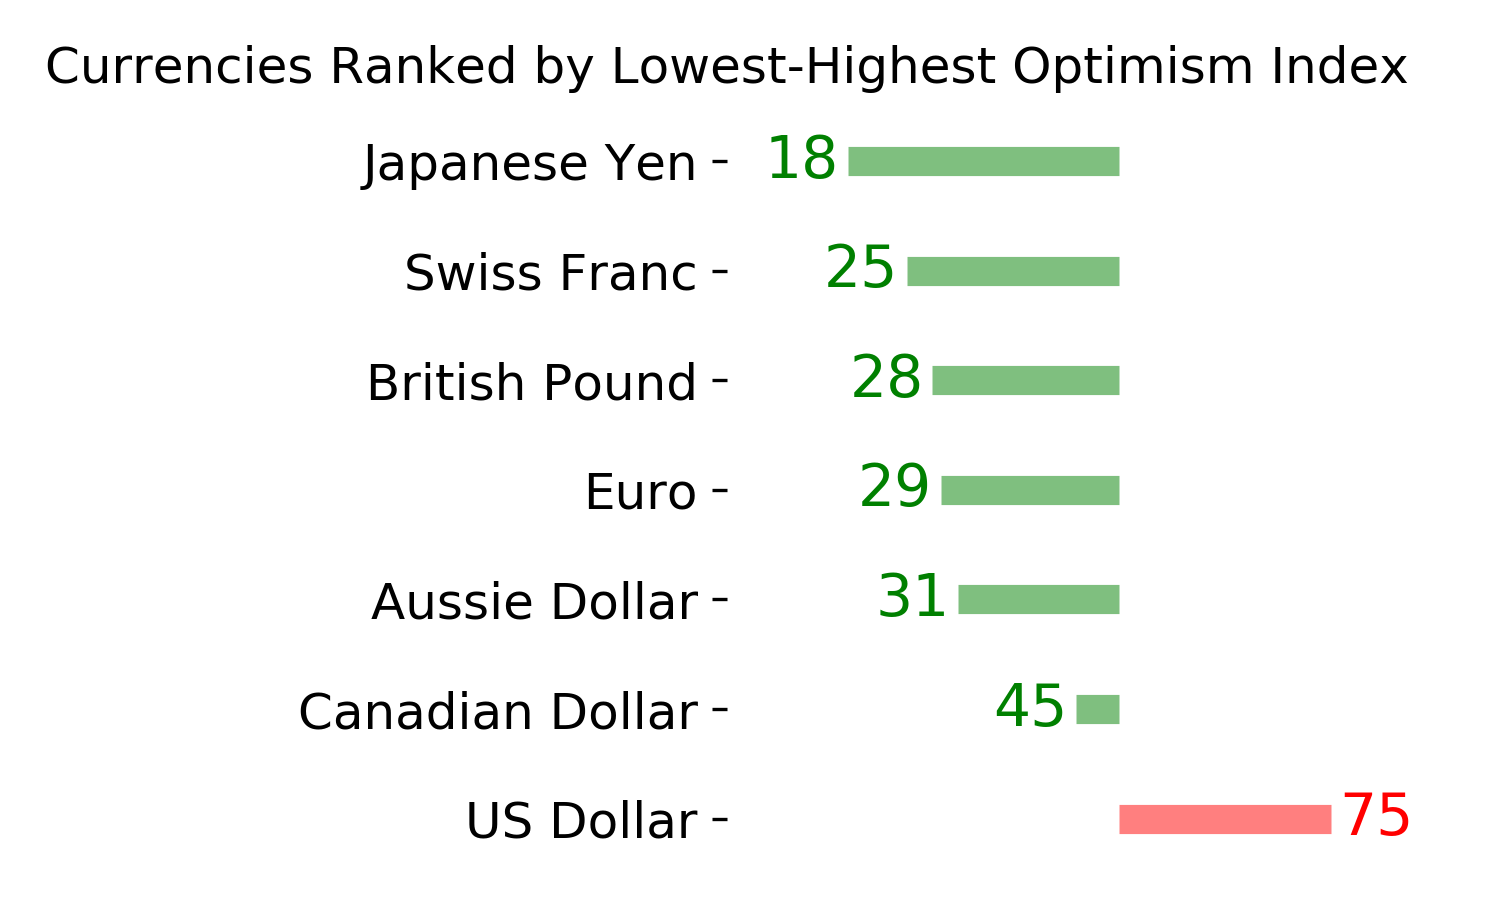
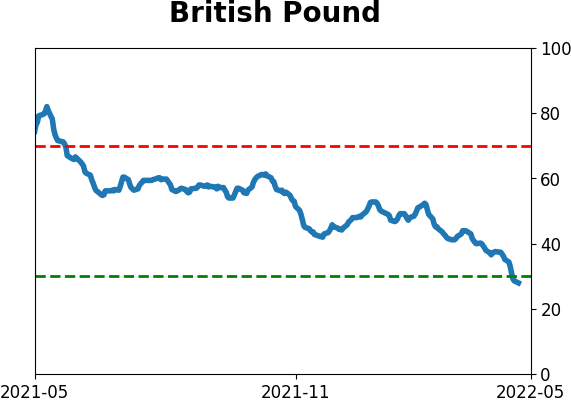
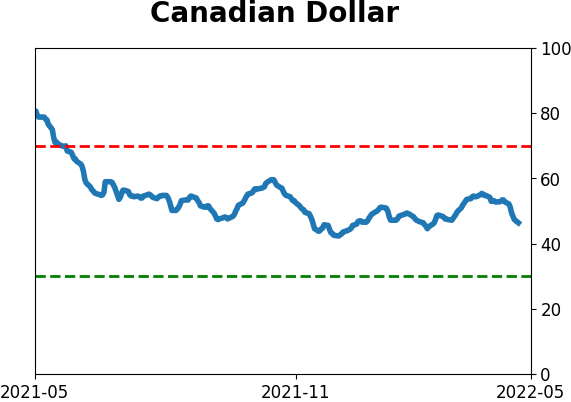
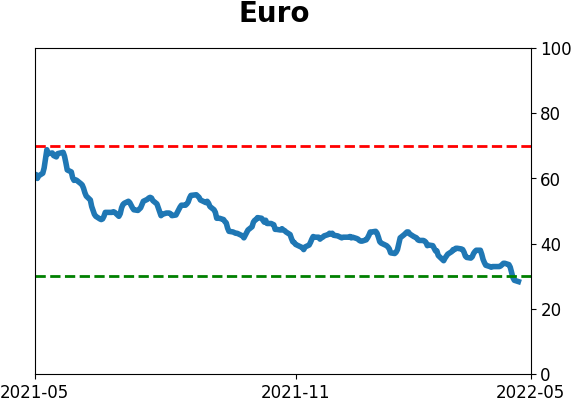
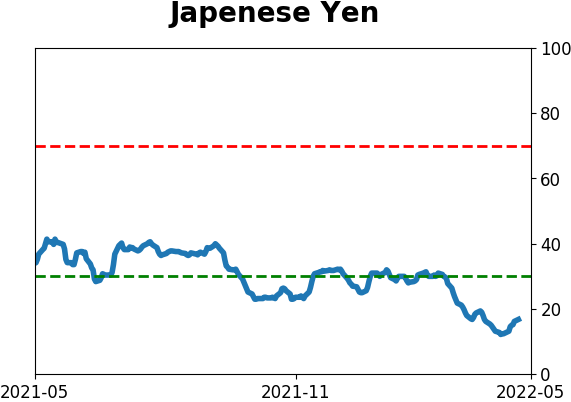
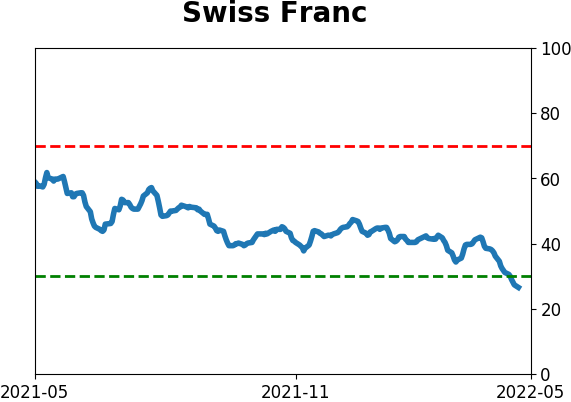
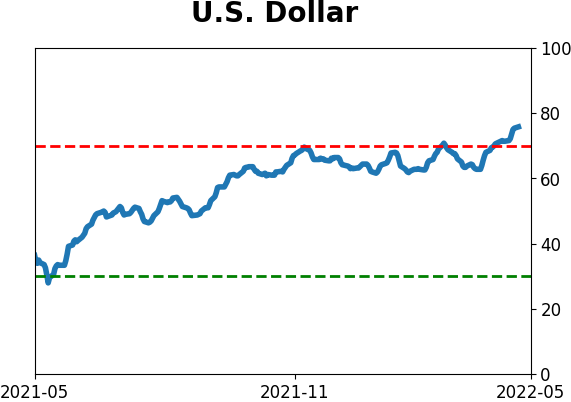
Currency ETF's - 5-Day Moving Average
|
|
|
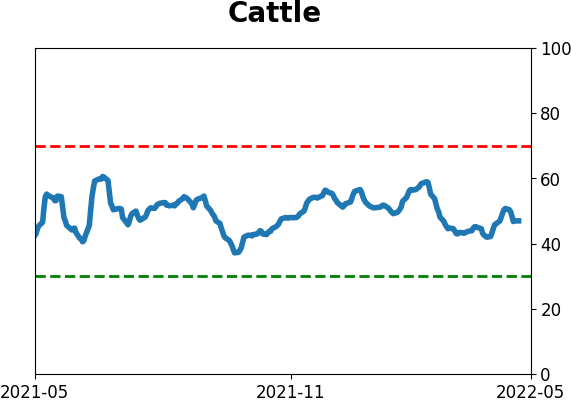
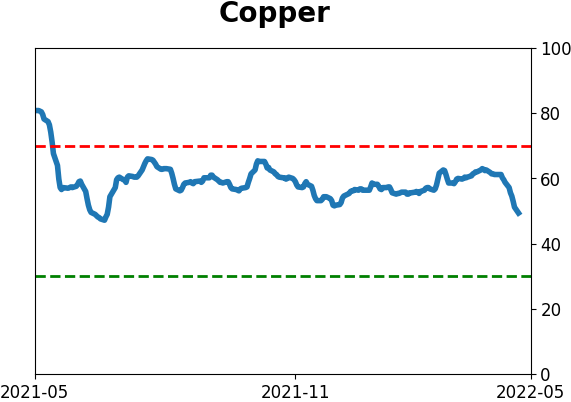
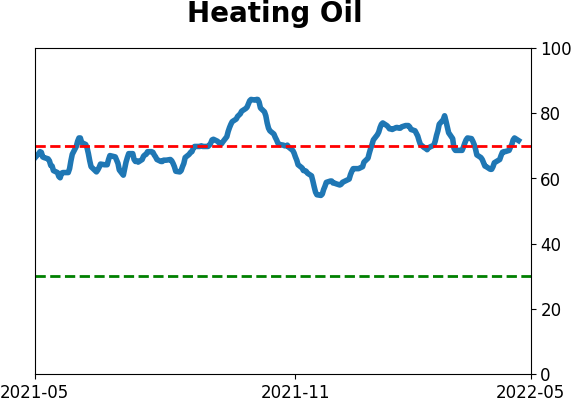
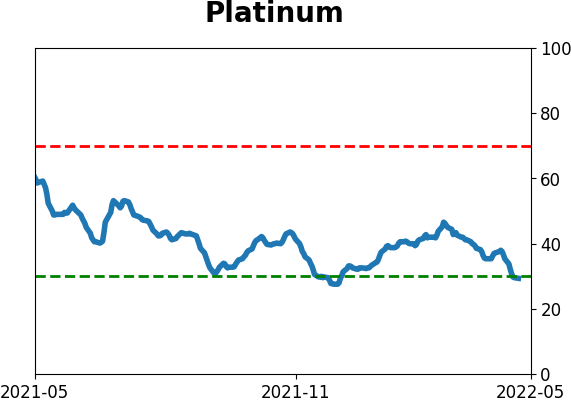
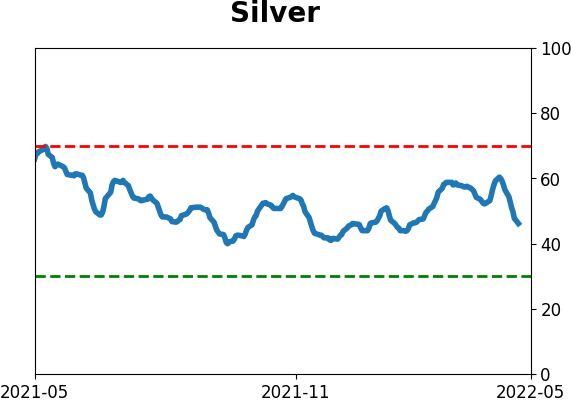
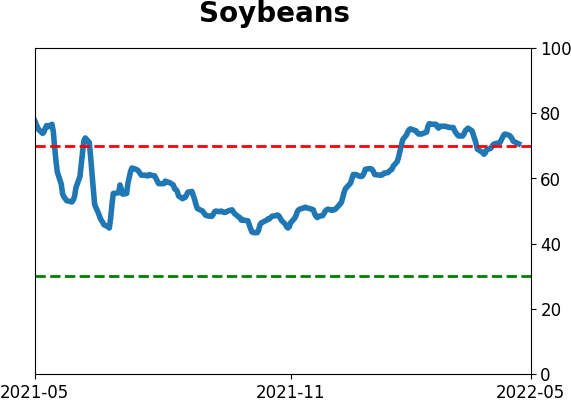
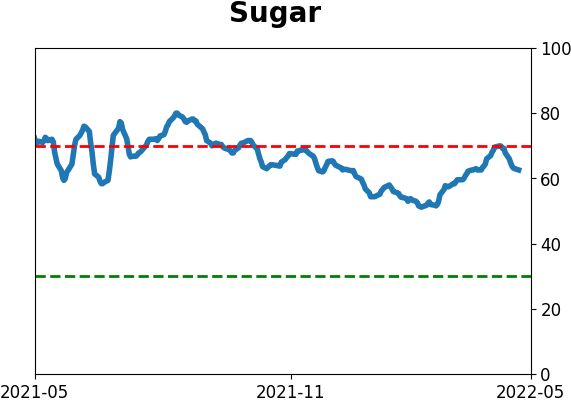
Commodity ETF's - 5-Day Moving Average
|
|