Headlines
|
|
The end of low volatility:
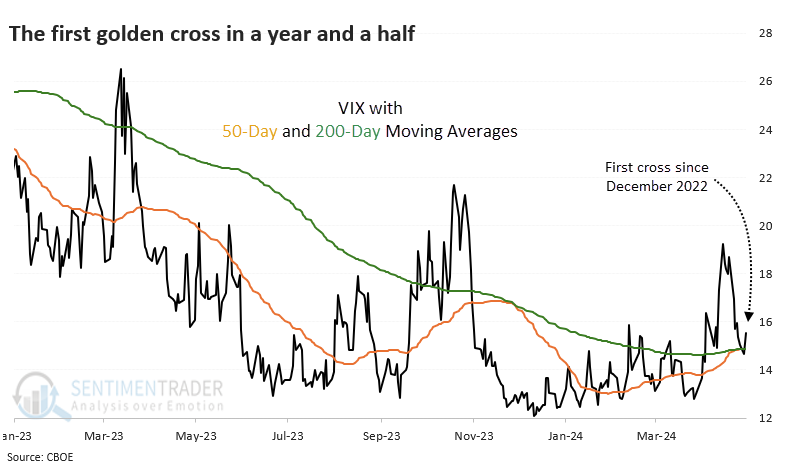
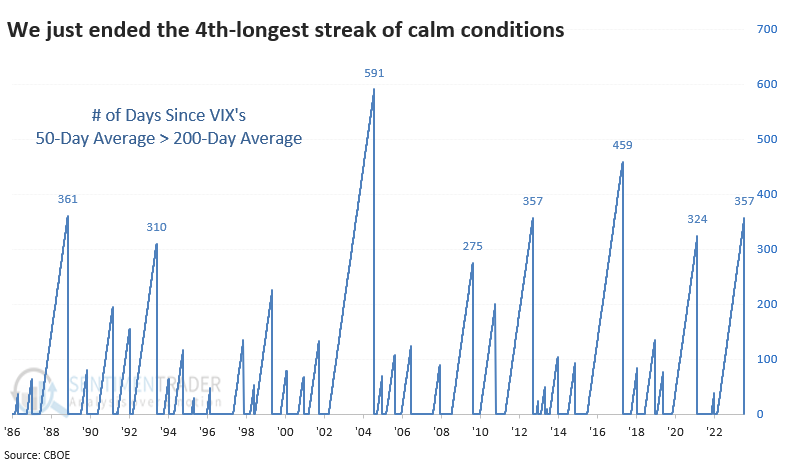
The VIX "fear gauge" triggered a golden cross, with its 50-day moving average rising above its 200-day average for the first time since December 2022. That ends the 4th-longest streak of low volatility since 1986. After the ends of other long streaks, the S&P 500 didn't do very well over the next few months, but neither did the VIX. Defensive stocks shined.
|
Smart / Dumb Money Confidence
|
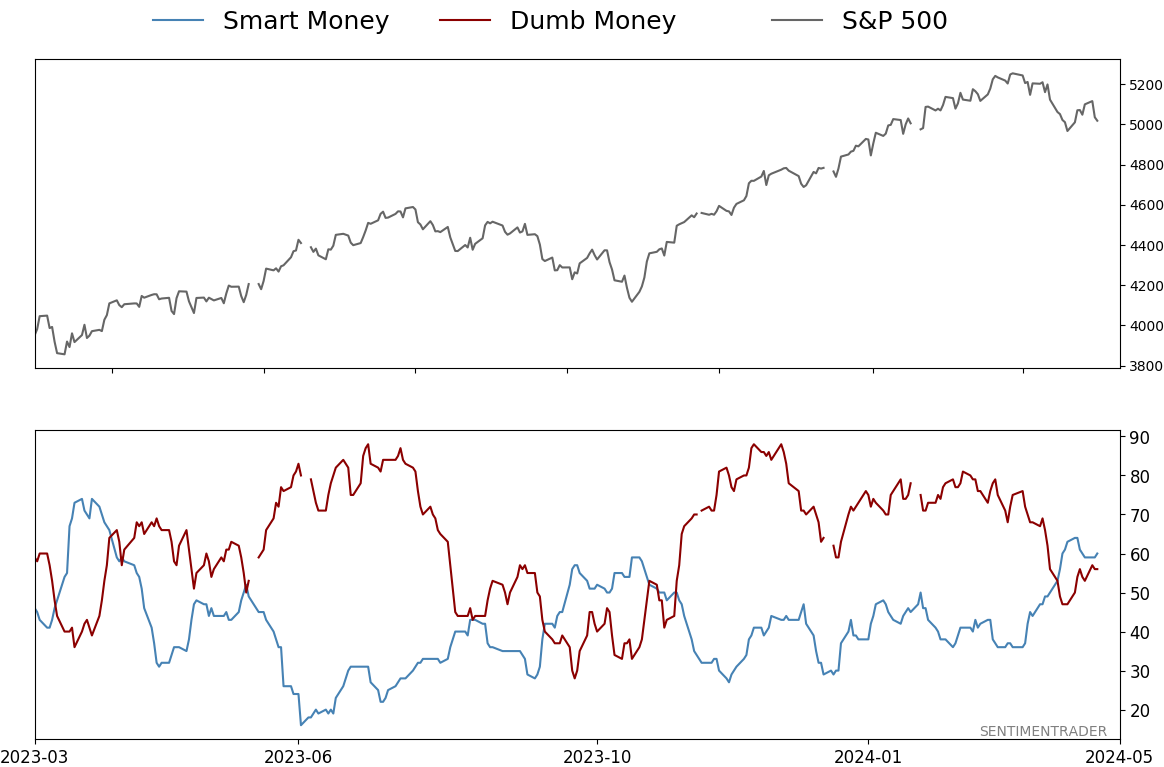
Smart Money Confidence: 60%
Dumb Money Confidence: 56%
|
|
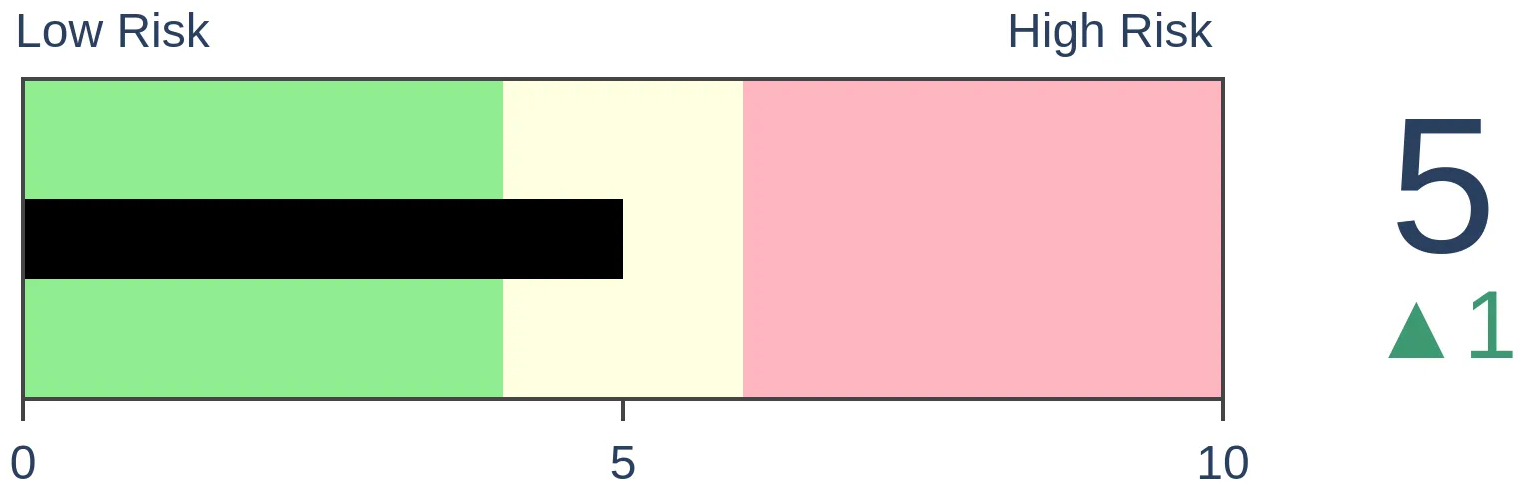
Risk Levels
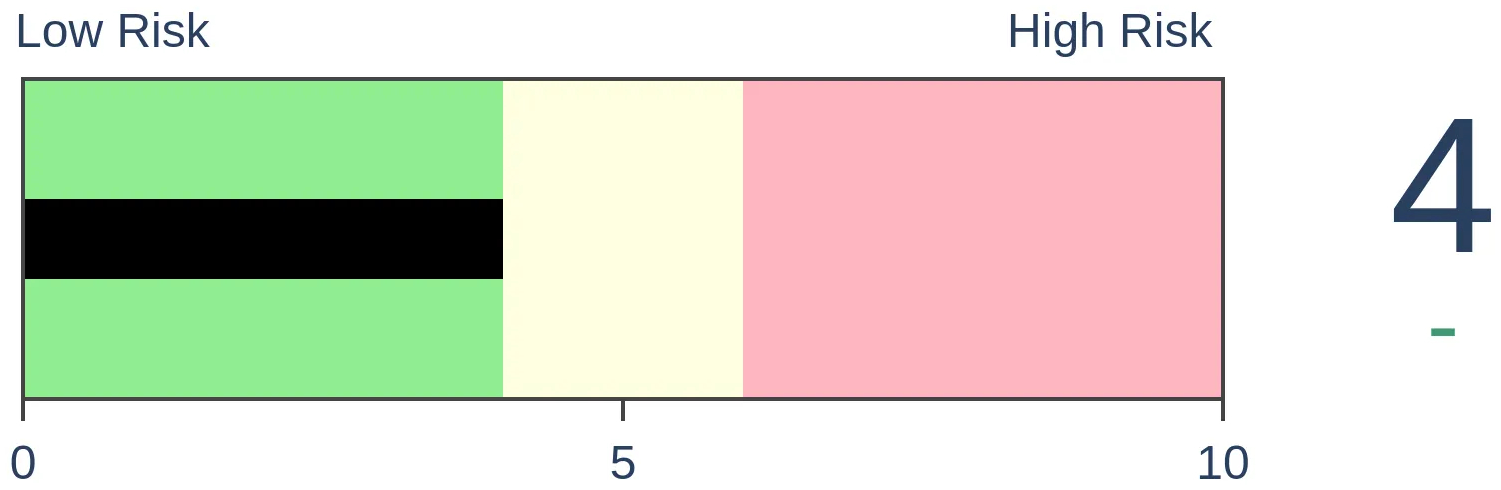
Stocks Short-Term
|
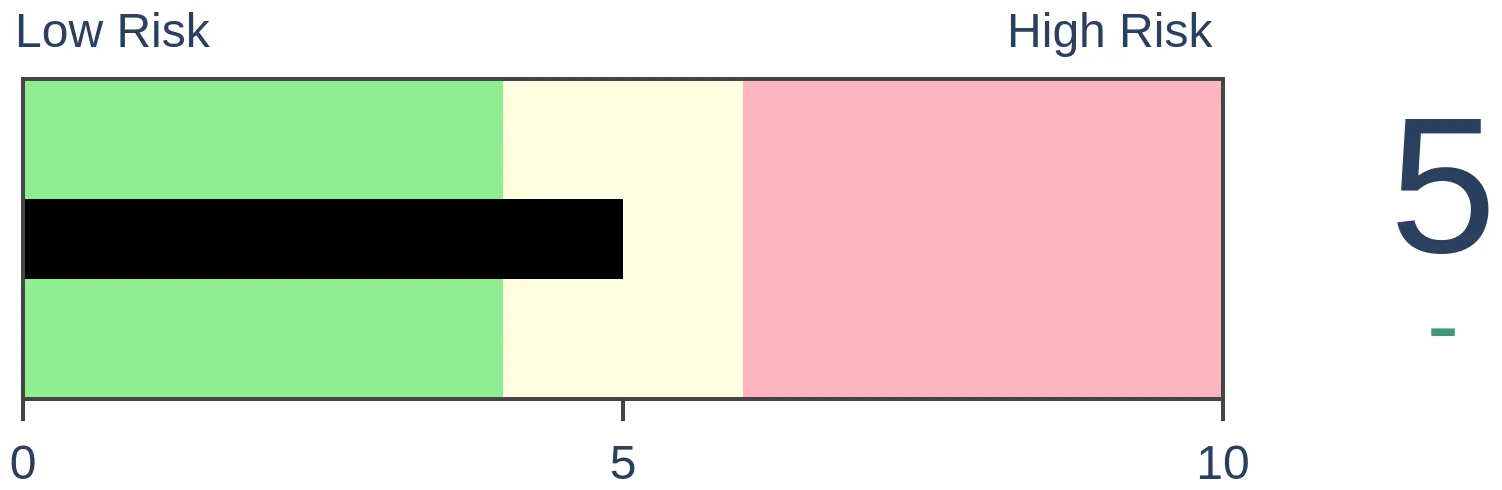
Stocks Medium-Term

|
|
Bonds

|
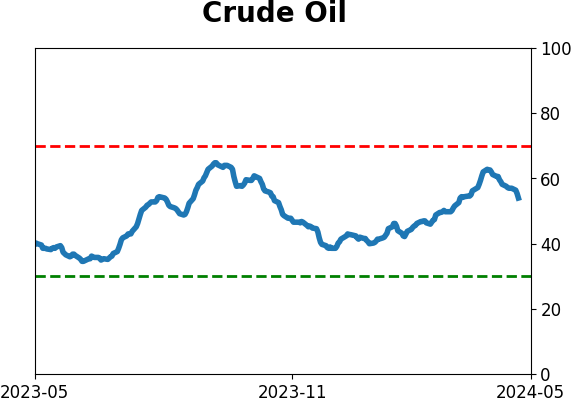
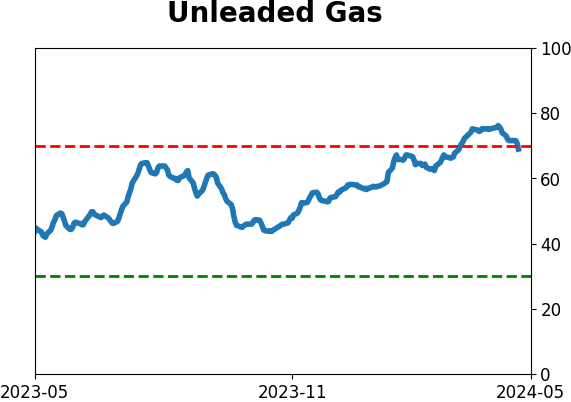
Crude Oil
|
|
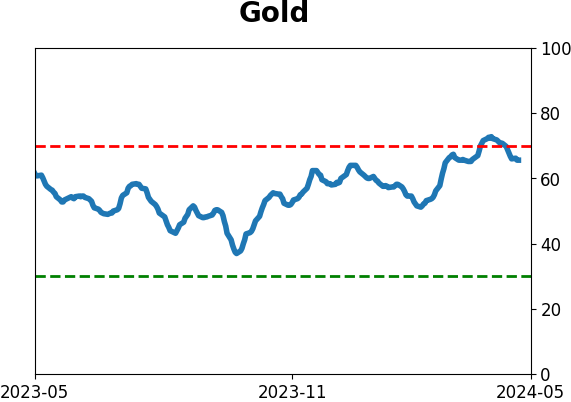
Gold

|
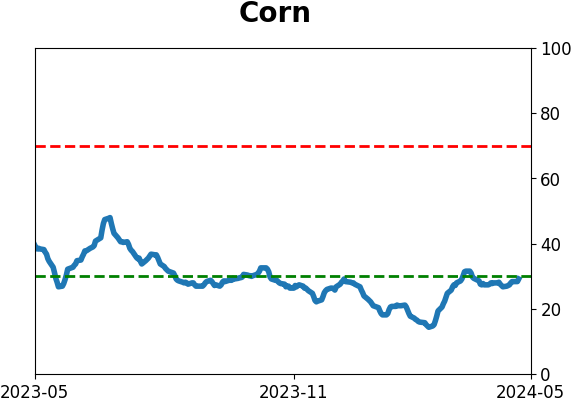
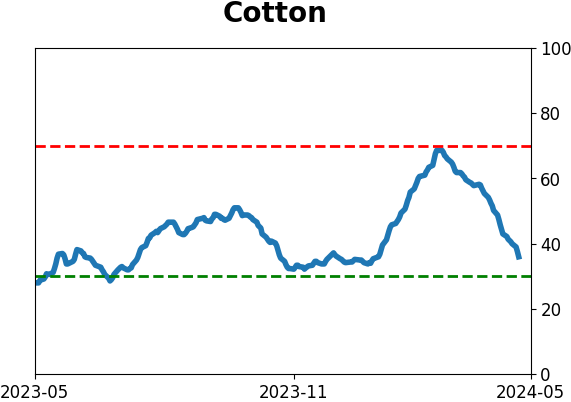
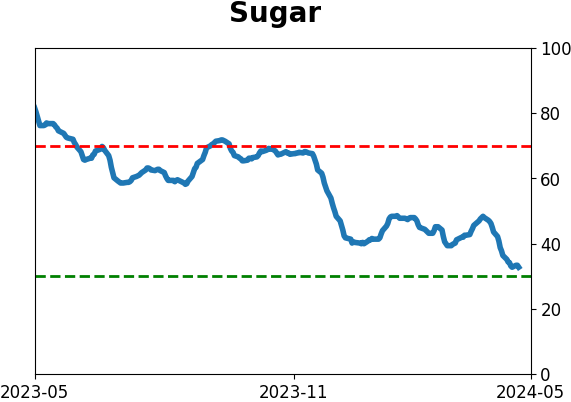
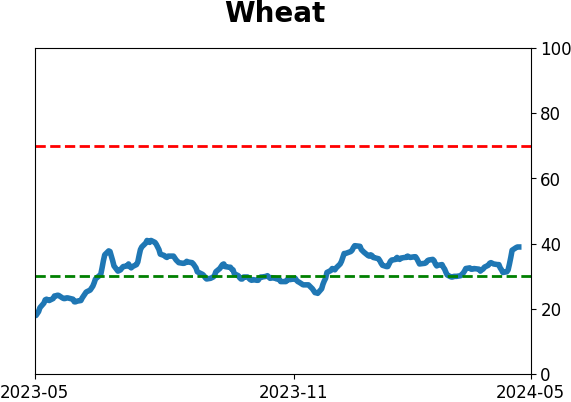
Agriculture
|
|
Research
By Jason Goepfert
BOTTOM LINE
The VIX "fear gauge" triggered a golden cross, with its 50-day moving average rising above its 200-day average for the first time since December 2022. That ends the 4th-longest streak of low volatility since 1986. After the ends of other long streaks, the S&P 500 didn't do very well over the next few months, but neither did the VIX. Defensive stocks shined.
FORECAST / TIMEFRAME
None
|
Key points:
- The VIX has triggered a golden cross, with its 50-day moving average rising above its 200-day average
- This is the first cross in a year and a half, ending the 4th-longest streak of low volatility since 1986
- After the ends of other long streaks, the S&P stumbled over the next few months, but so did the VIX
A not-very-golden cross
For the first time in over a year and a half, the VIX "fear gauge" is firmly in an uptrend. This ends a historically prolonged stretch of calm conditions over short-, medium- and long-term time frames.
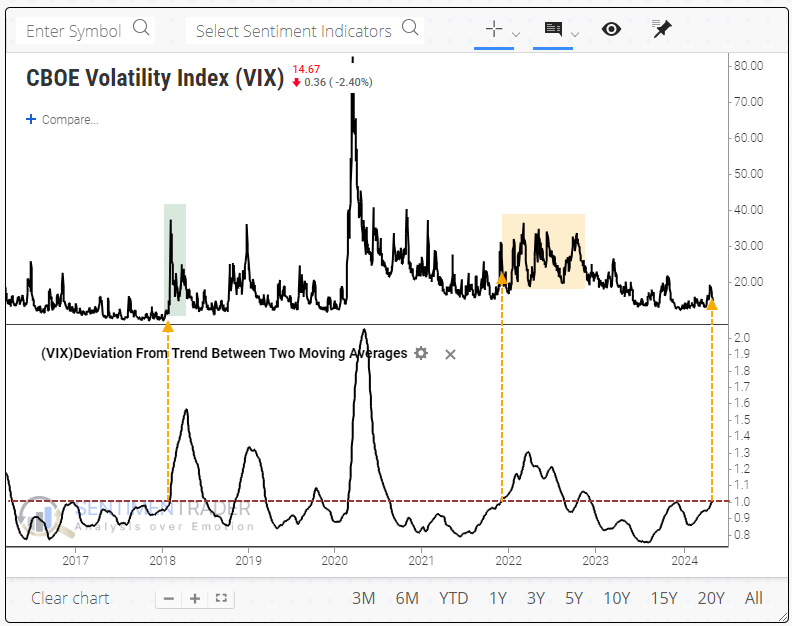
Using the new charting platform, you can use the Deviation From Trend Between Two Moving Averages indicator and change the settings to 50 and 200 days to see the difference between the two moving averages. If it's above 1.0, the 50-day average is higher than the 200-day.
It got close last fall but didn't quite make it. When it was triggered in 2018, there was a massive volatility spike, and the VIX more than doubled within a week. In late 2021, it triggered after the VIX already made a short-term spike, and volatility swung wildly for months afterward.
The end of the most recent streak of the VIX's 50-day average being below its 200-day average was tied for the 4th-longest since 1986. Investors have become too accustomed to low volatility.
What next
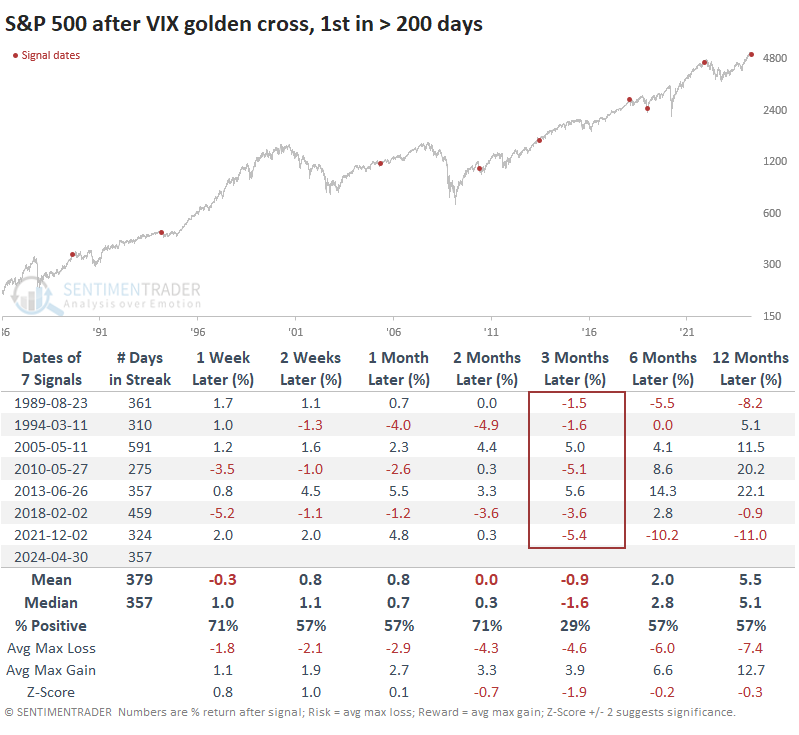
For one of the very few times since October 2022, this study shows a mostly negative implication over the next few months. However, it's hard to place too much weight on it since the negative returns are confined to basically one time frame, the next three months.
When the VIX had its first gold cross in more than 200 sessions, the S&P 500 showed inconsistent returns across most time frames, but three months later, it was higher only twice out of seven attempts.
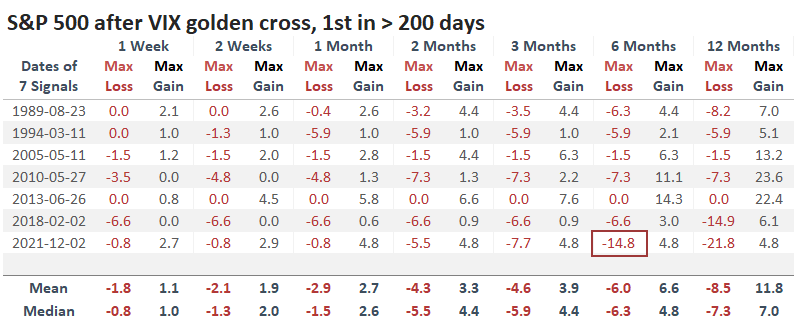
Even though its returns over the next few months were mostly negative, the losses weren't too bothersome. A table of maximum gains and losses across time frames shows that there was only one signal - ahead of a miserable 2022 - when these golden crosses preceded more than a double-digit drawdown within the next six months.
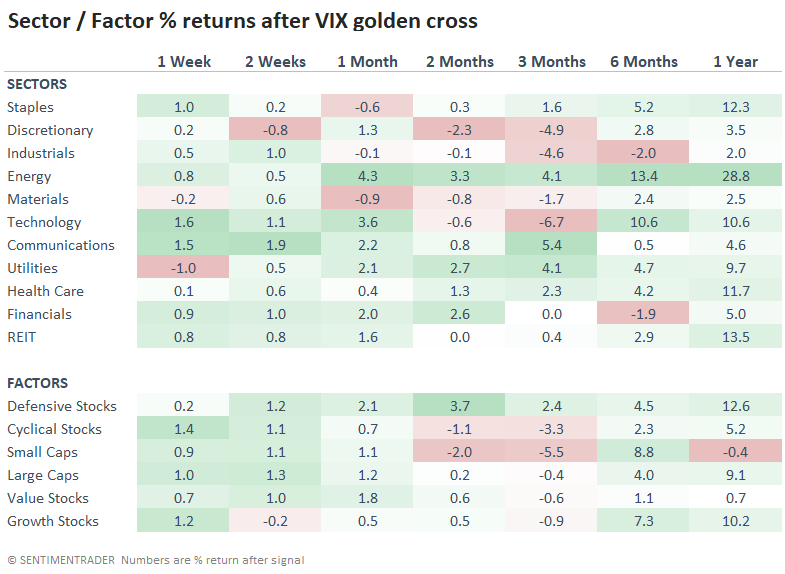
Volatility tends to decline, but defensive stocks shine
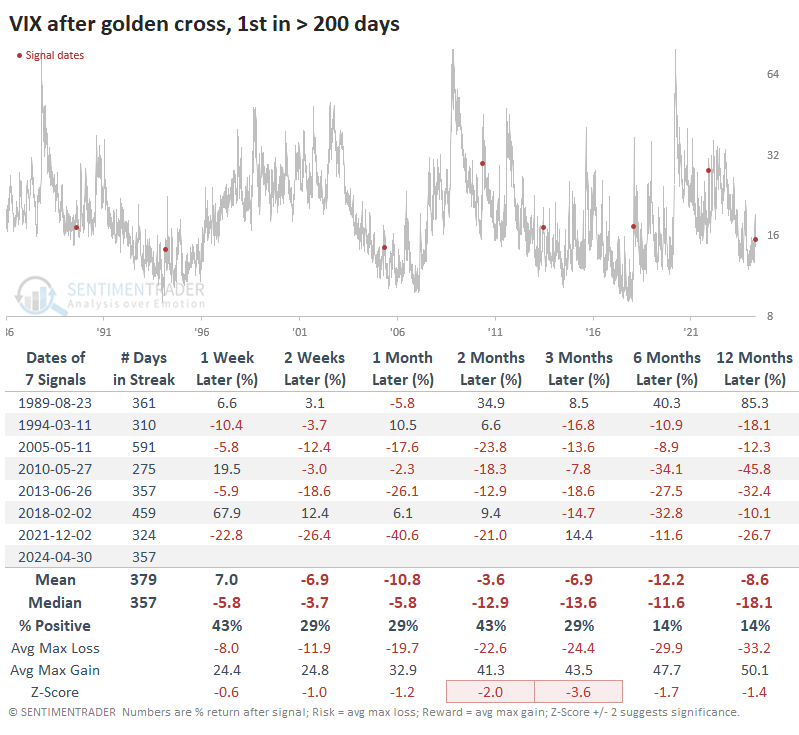
The trouble for volatility traders is that stock declines don't necessarily translate to increases in volatility. And even if they do, it's hard to trade. Regardless, it wasn't a concern here because these signals were terrible signals to "buy" volatility. There was only one signal in 2018 when the VIX doubled within the next year, which happened almost immediately.
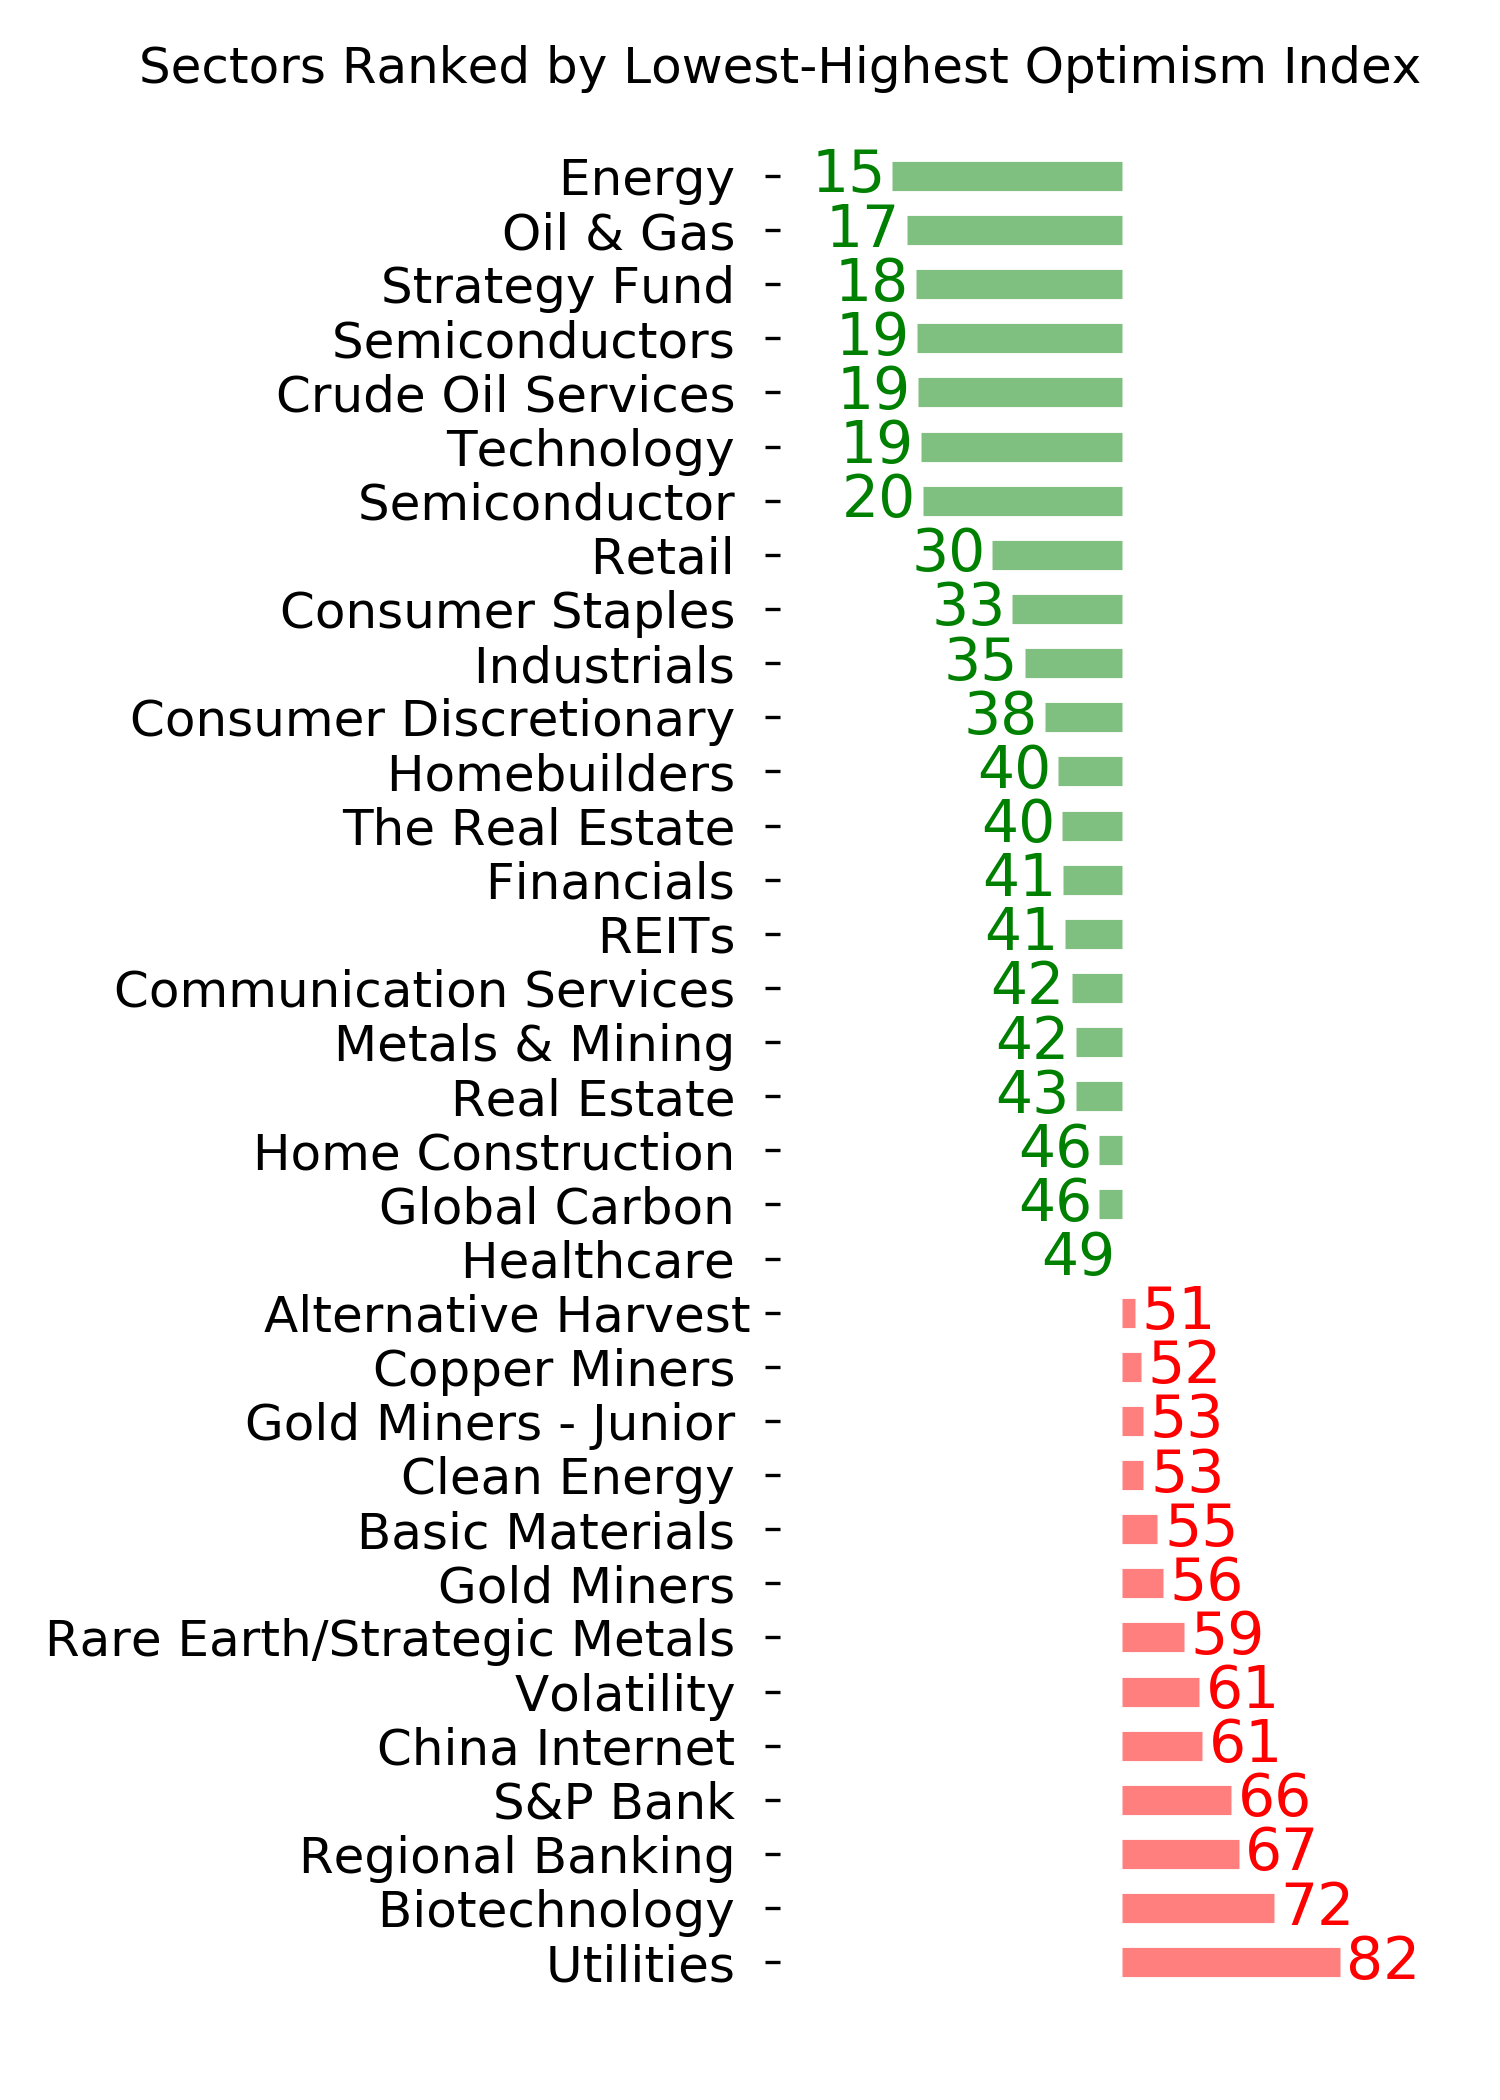
Among sectors and factors, energy stocks tended to enjoy the best returns, along with defensive stocks, which makes sense. Small-cap stocks did not have a good time.
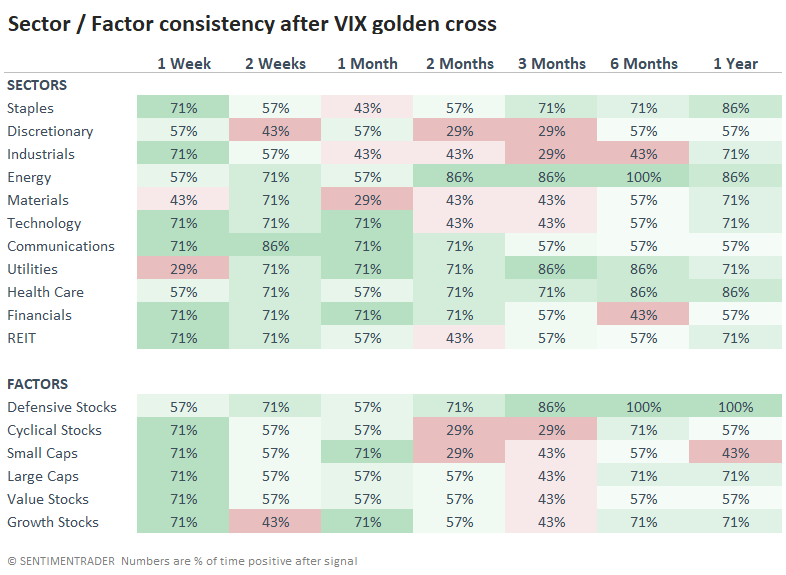
If we look at the percentage of time each sector and factor showed a positive return instead of their average return, then we see that defensive stocks rose 100% of the time over the next six and twelve months.
What the research tells us...
We've seen time after time during the past year+ that periods of extremely positive momentum and low volatility have a strong tendency to persist for months at least. That has played out yet again, but now there are signs that we're transitioning to a more volatile environment, perhaps best expressed by rising moving averages in the widely-watched VIX.
This does not mean that volatility will continue to rise (usually the opposite) or that stocks will fall. But there is a better chance for the latter in the coming months as momentum ebbs and traders see an opportunity to take gains ahead of the lazy summer months and unknowns of the presidential election.
Indicators at Extremes
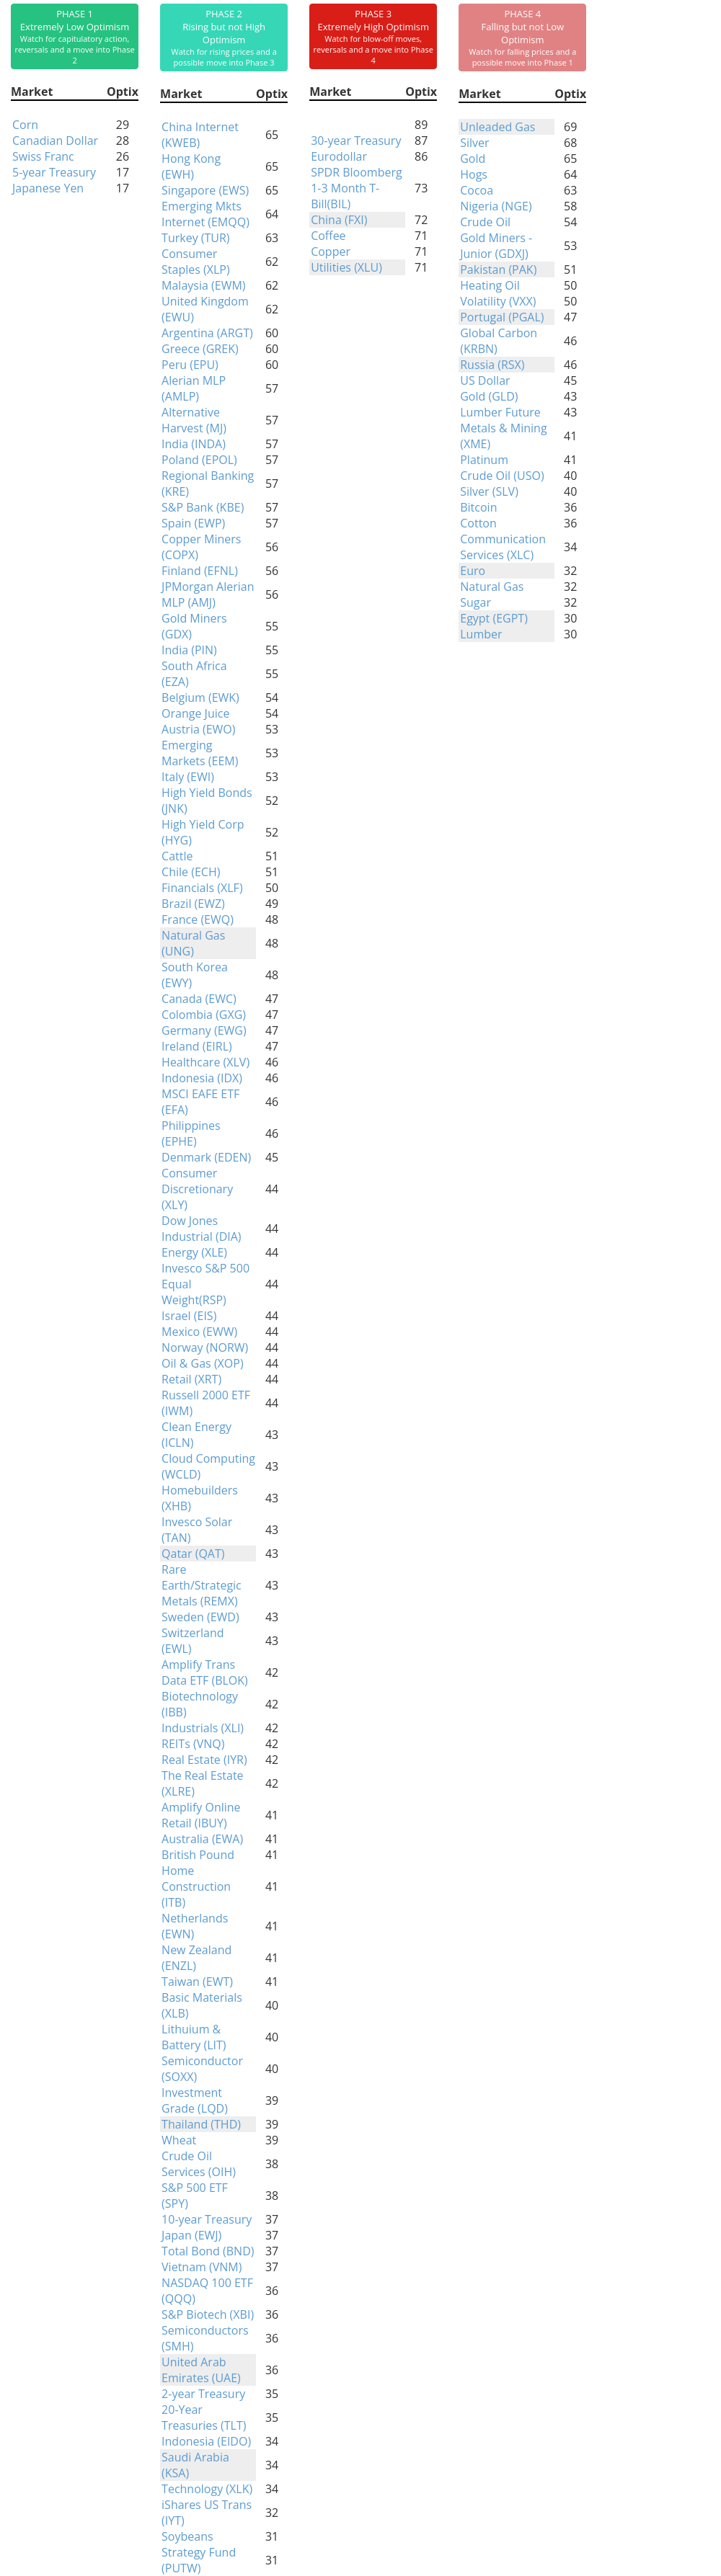
Phase Table
Ranks
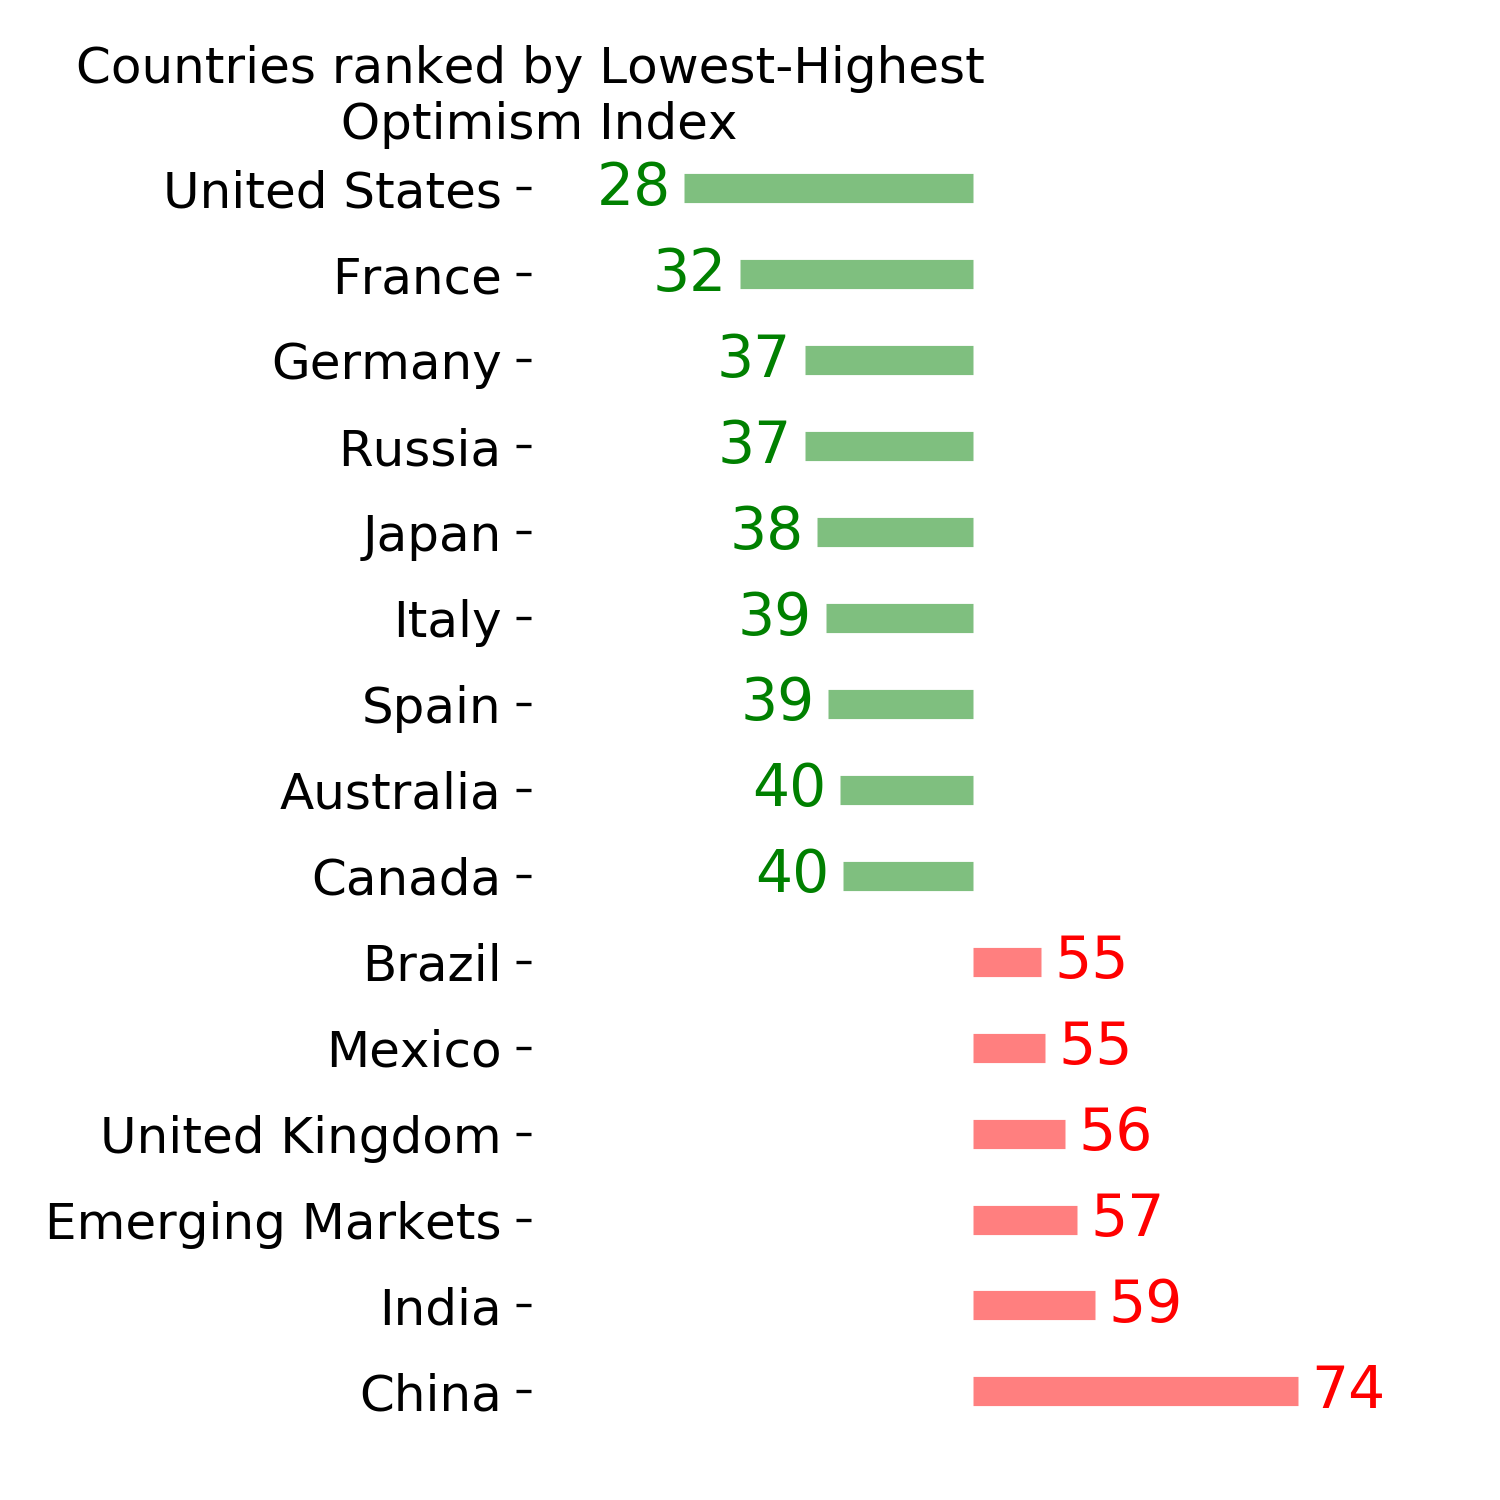
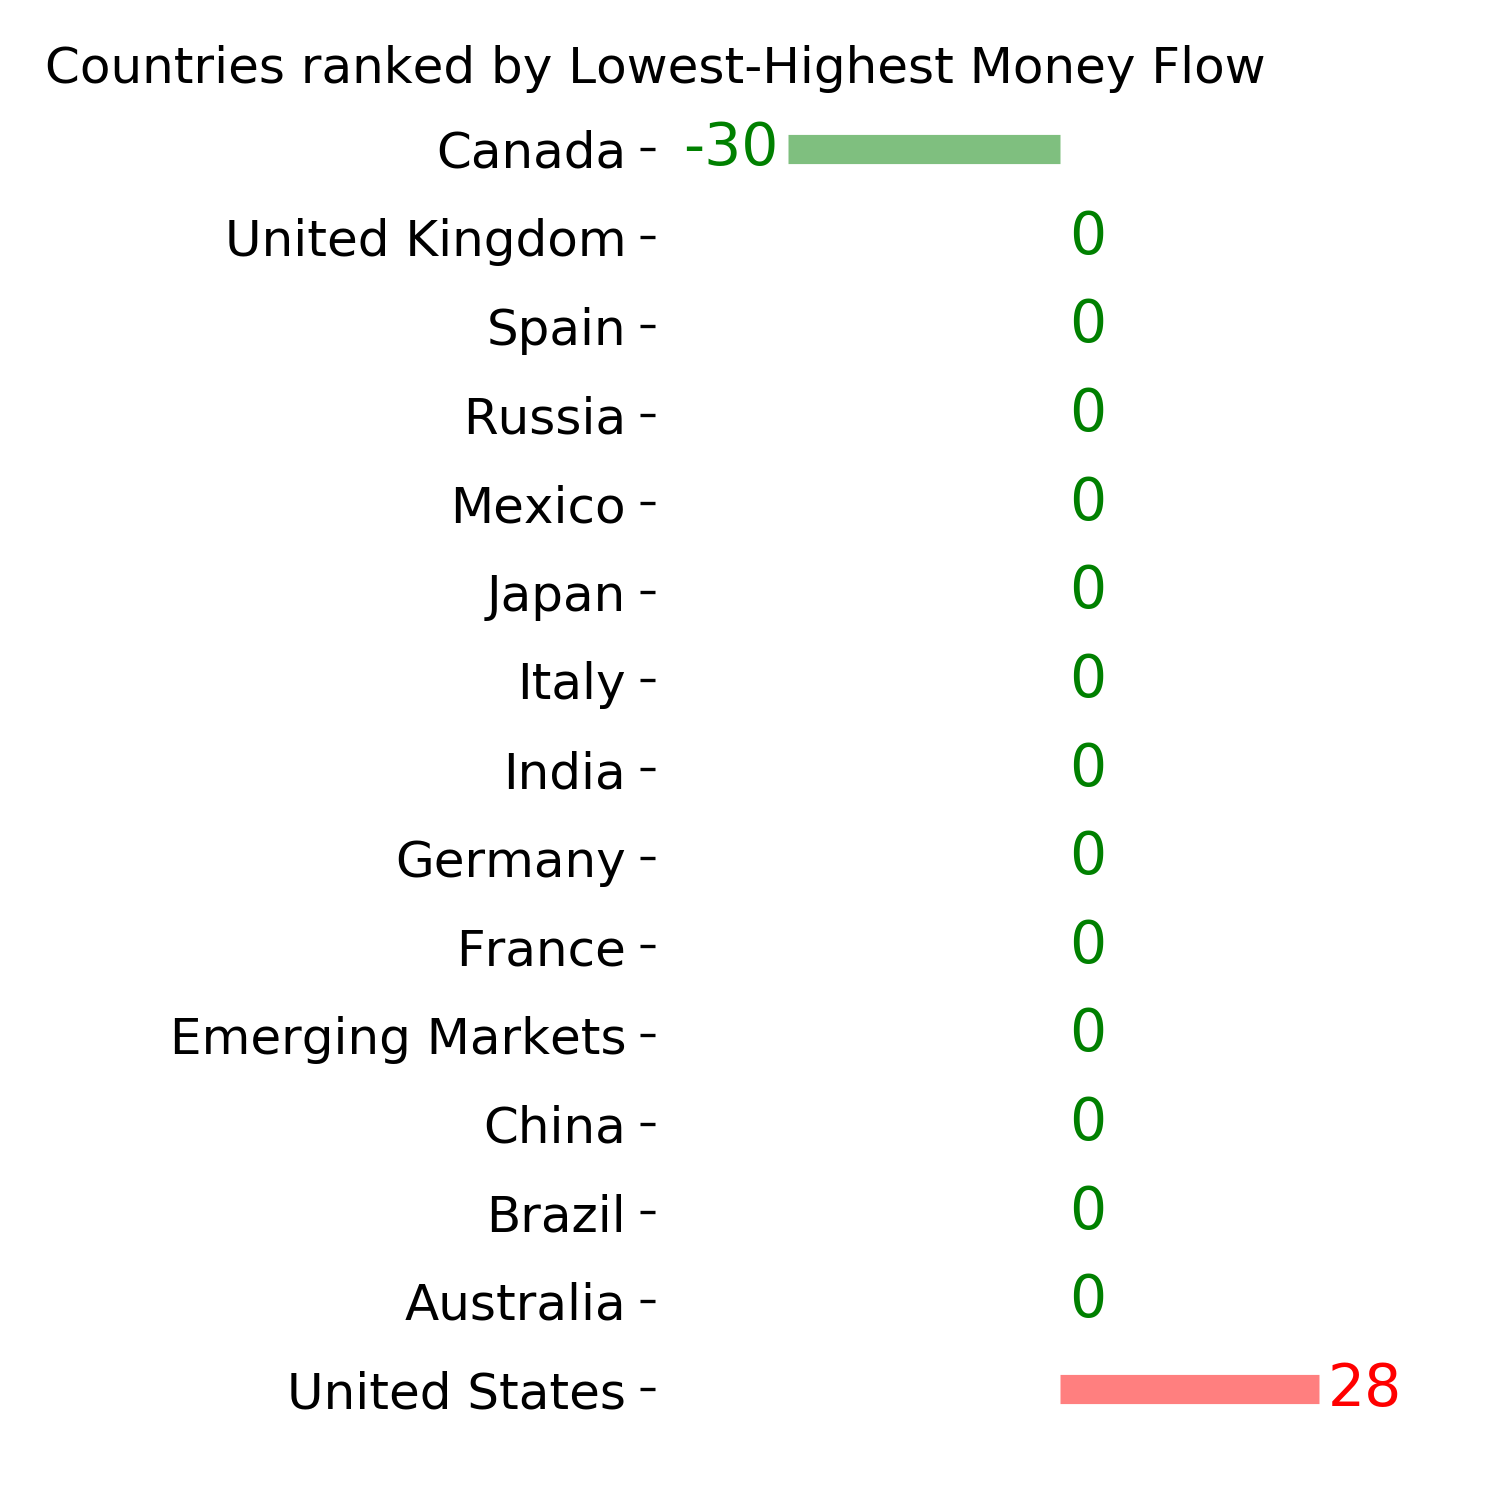
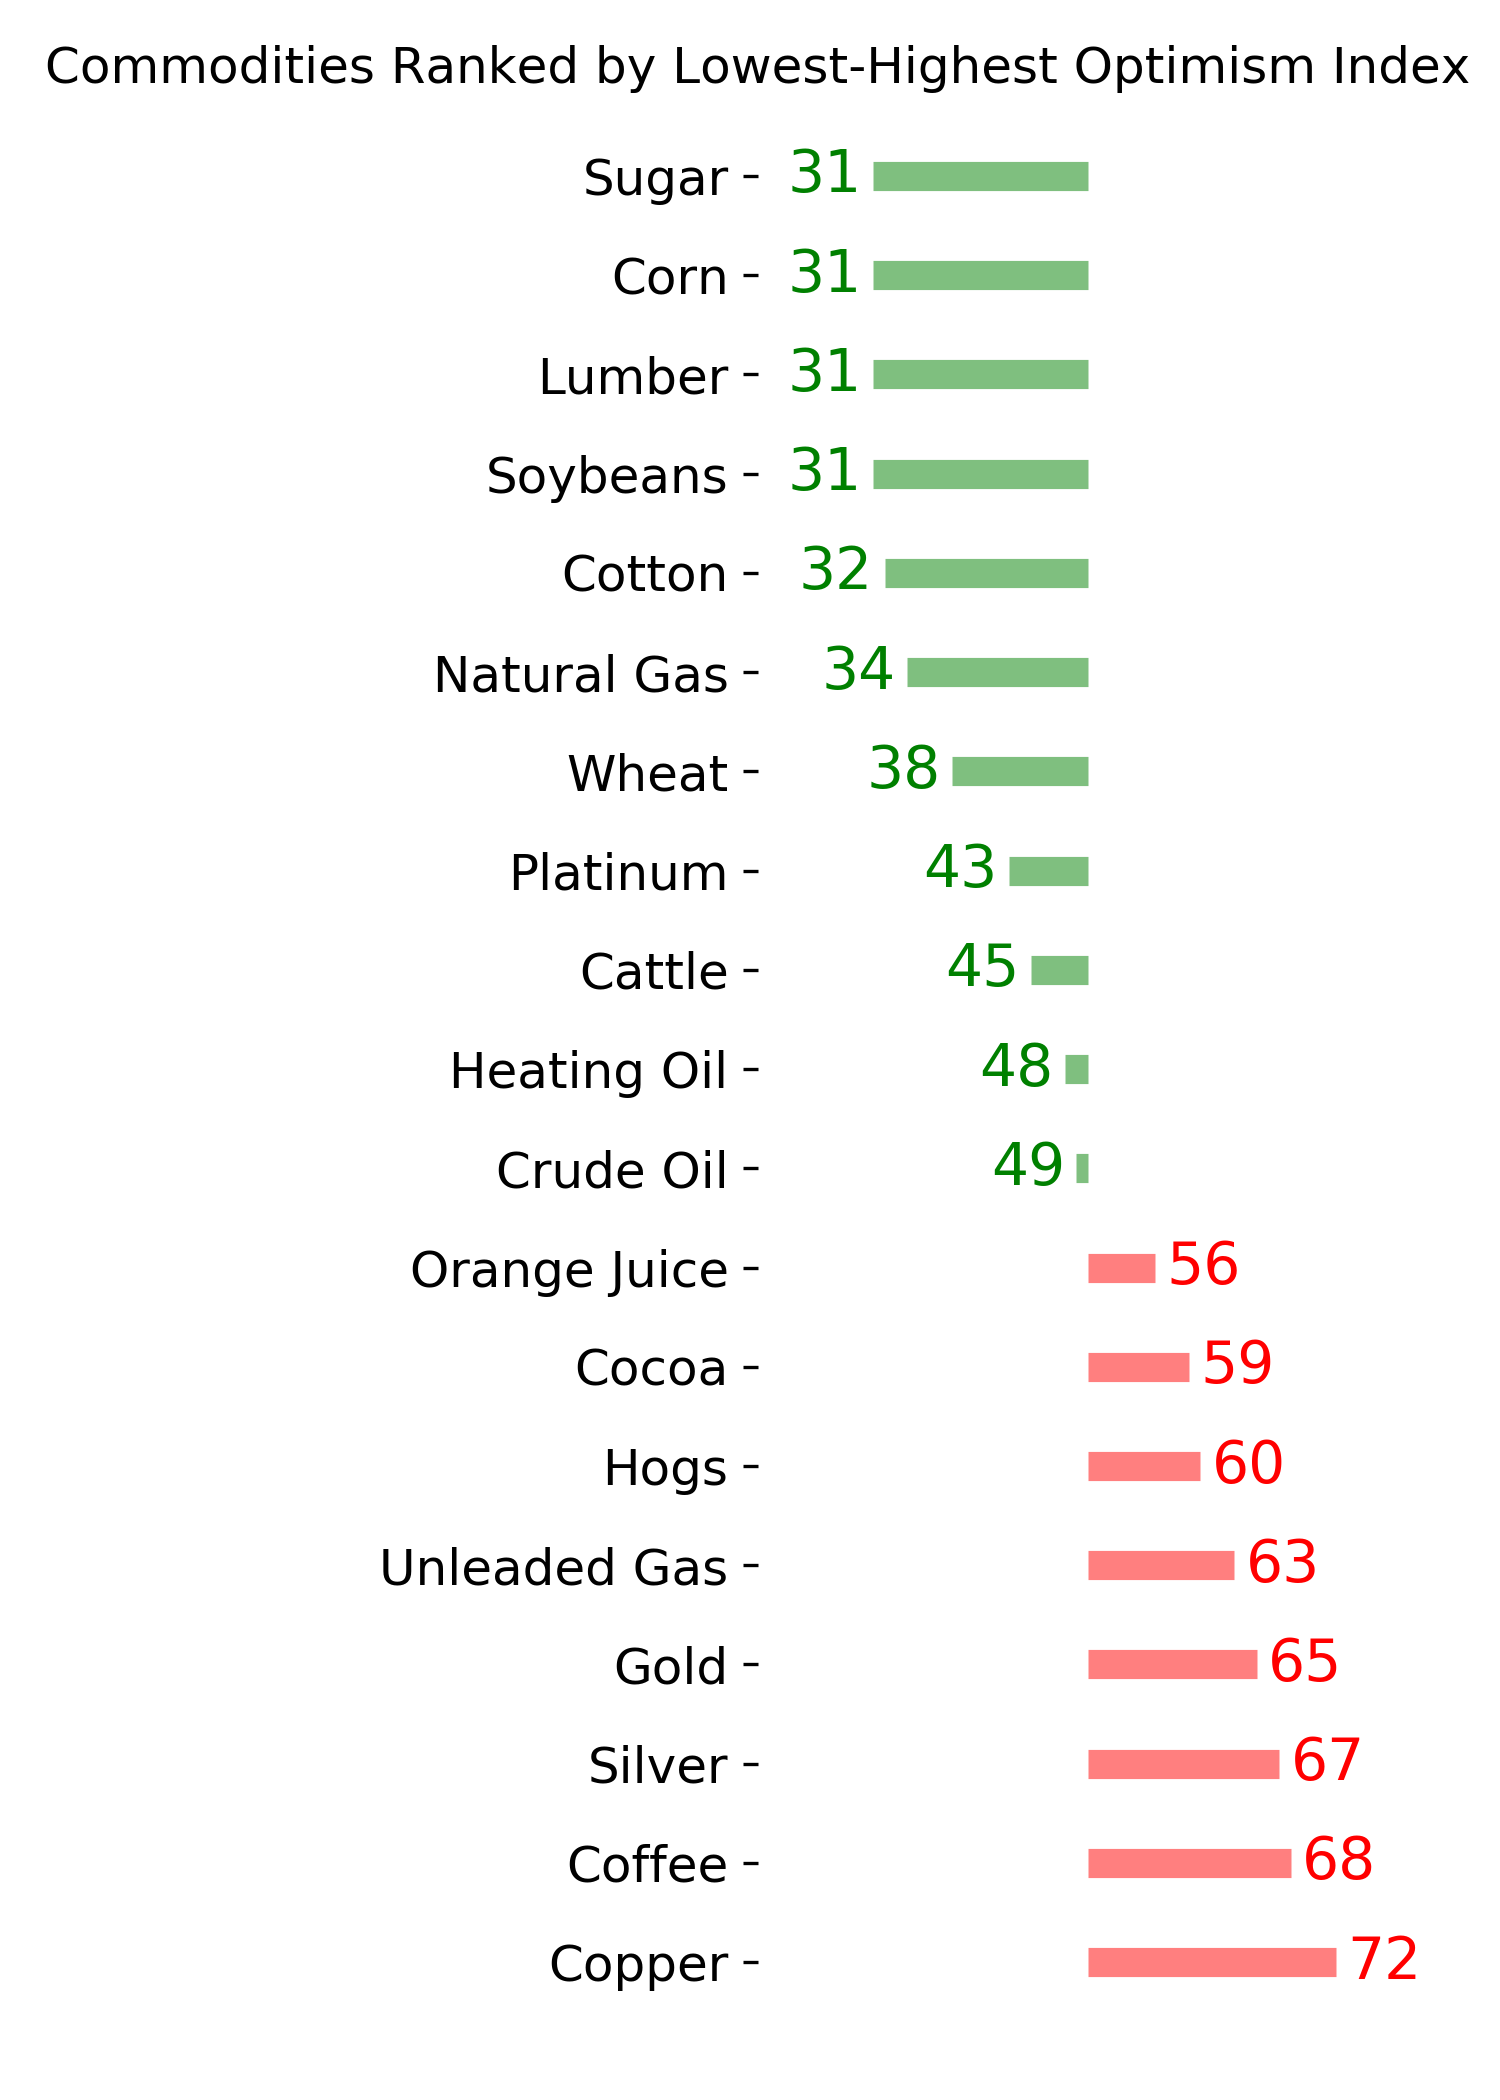
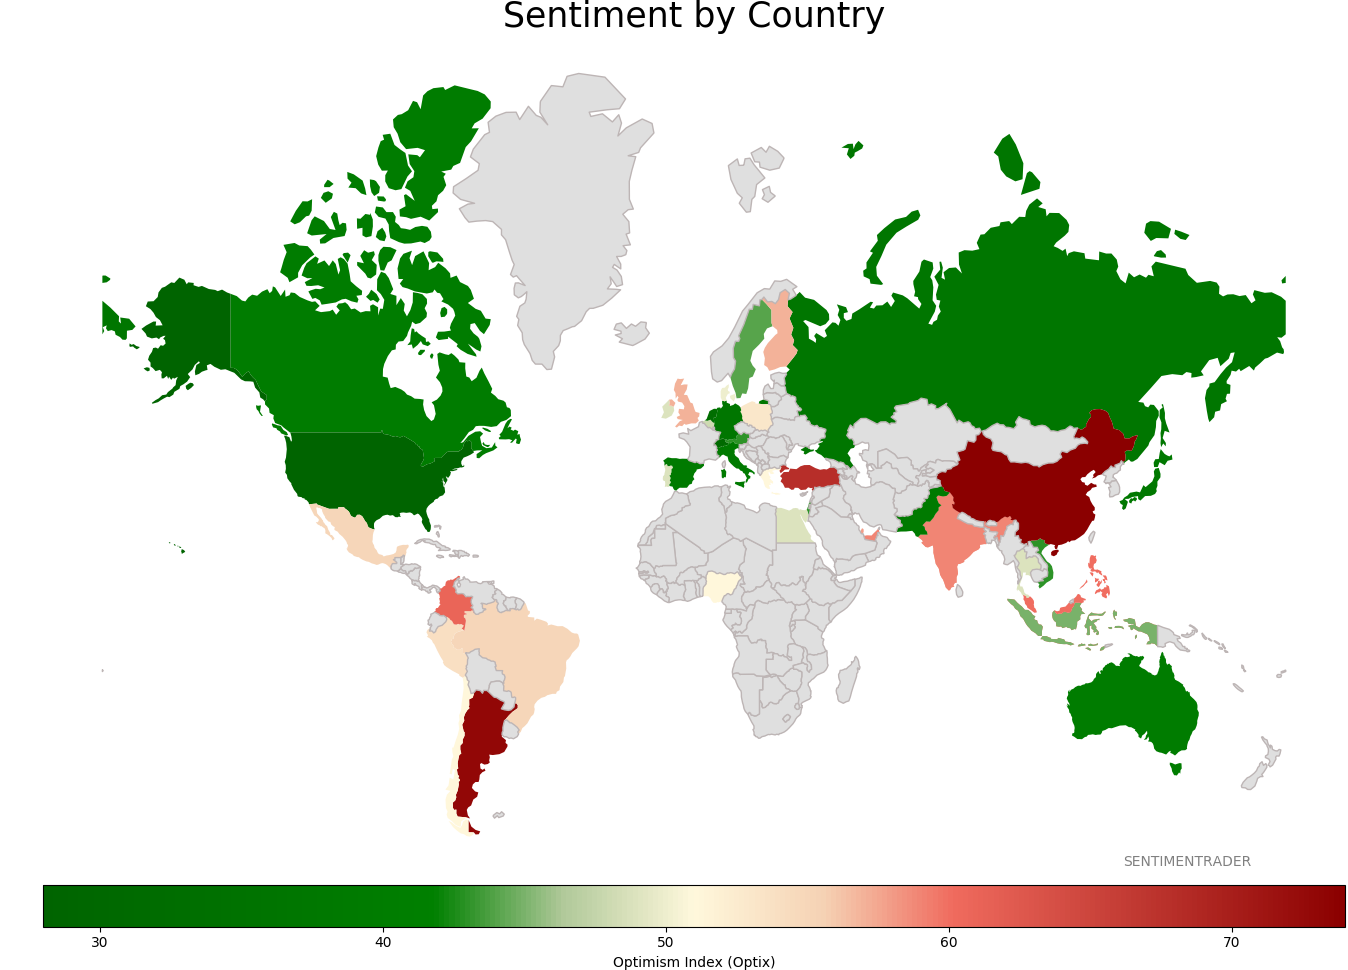
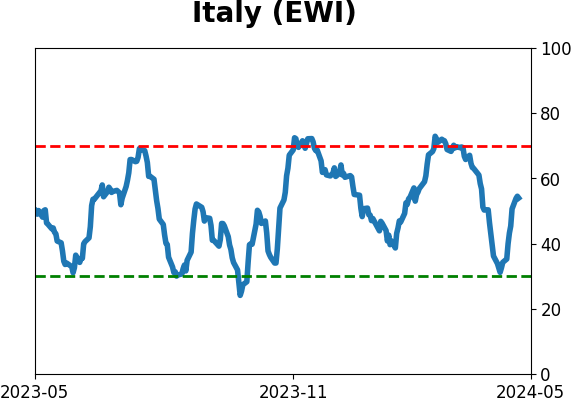
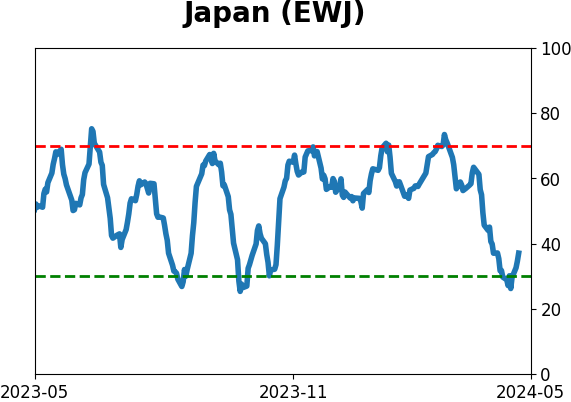
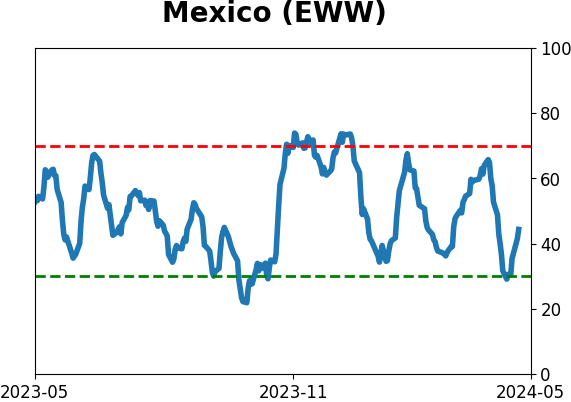
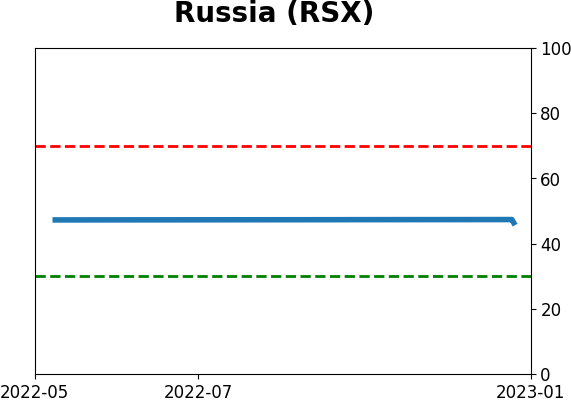
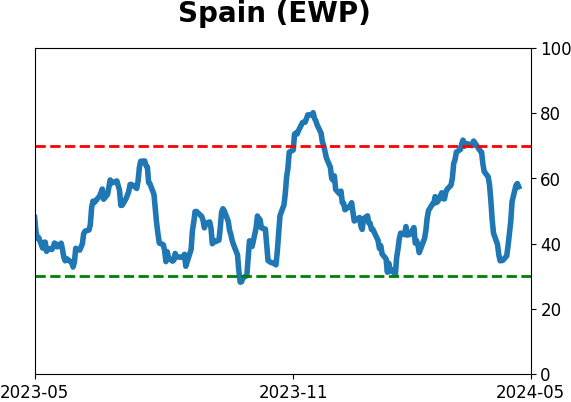
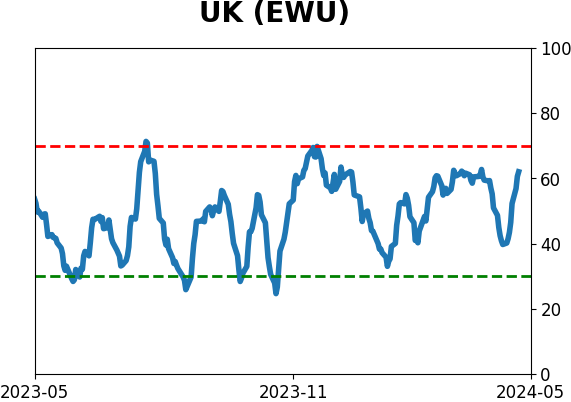
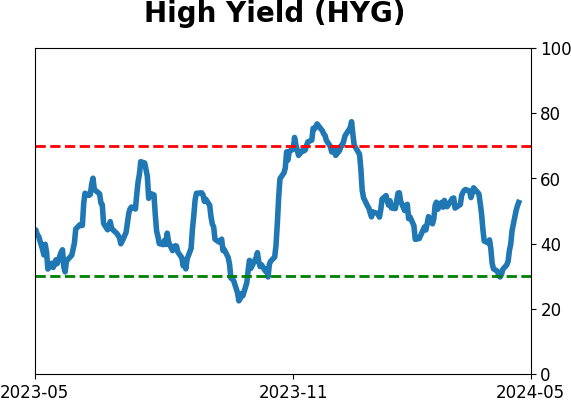
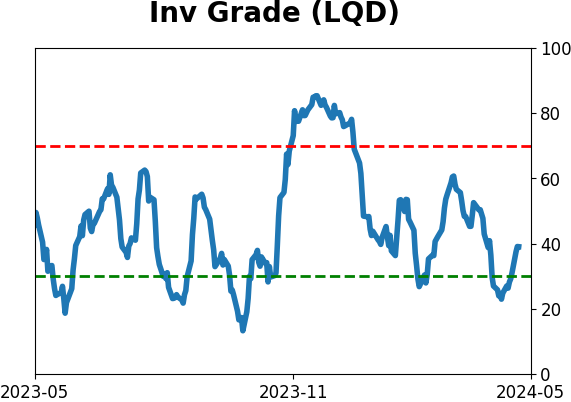
Sentiment Around The World
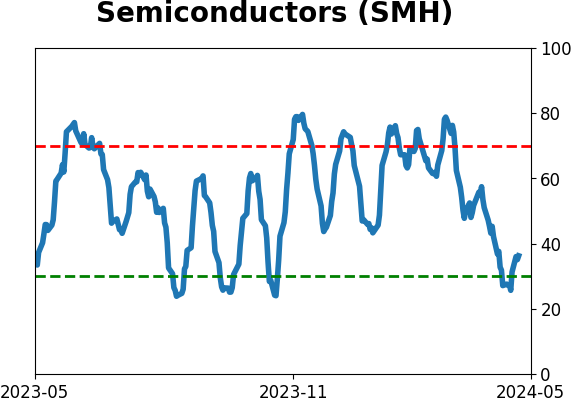
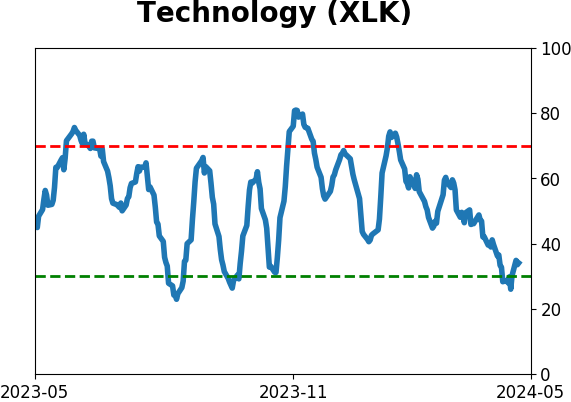
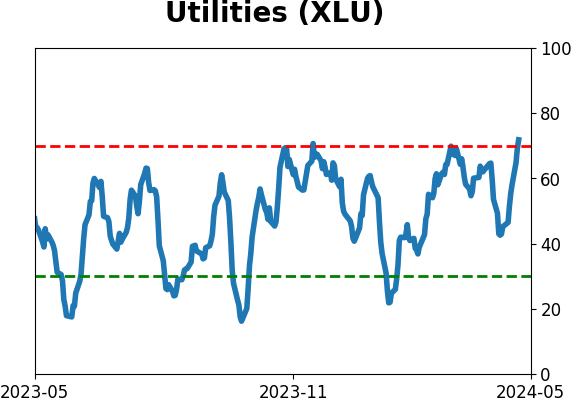
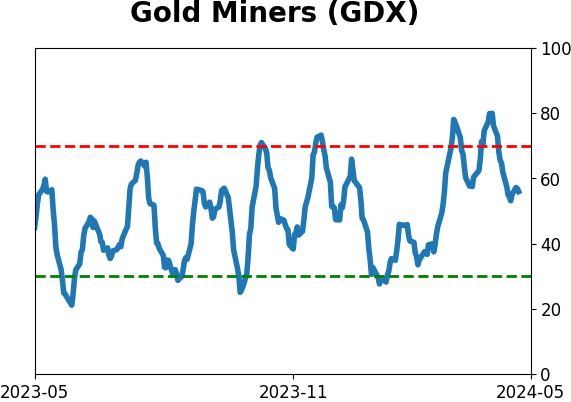
Optimism Index Thumbnails
|
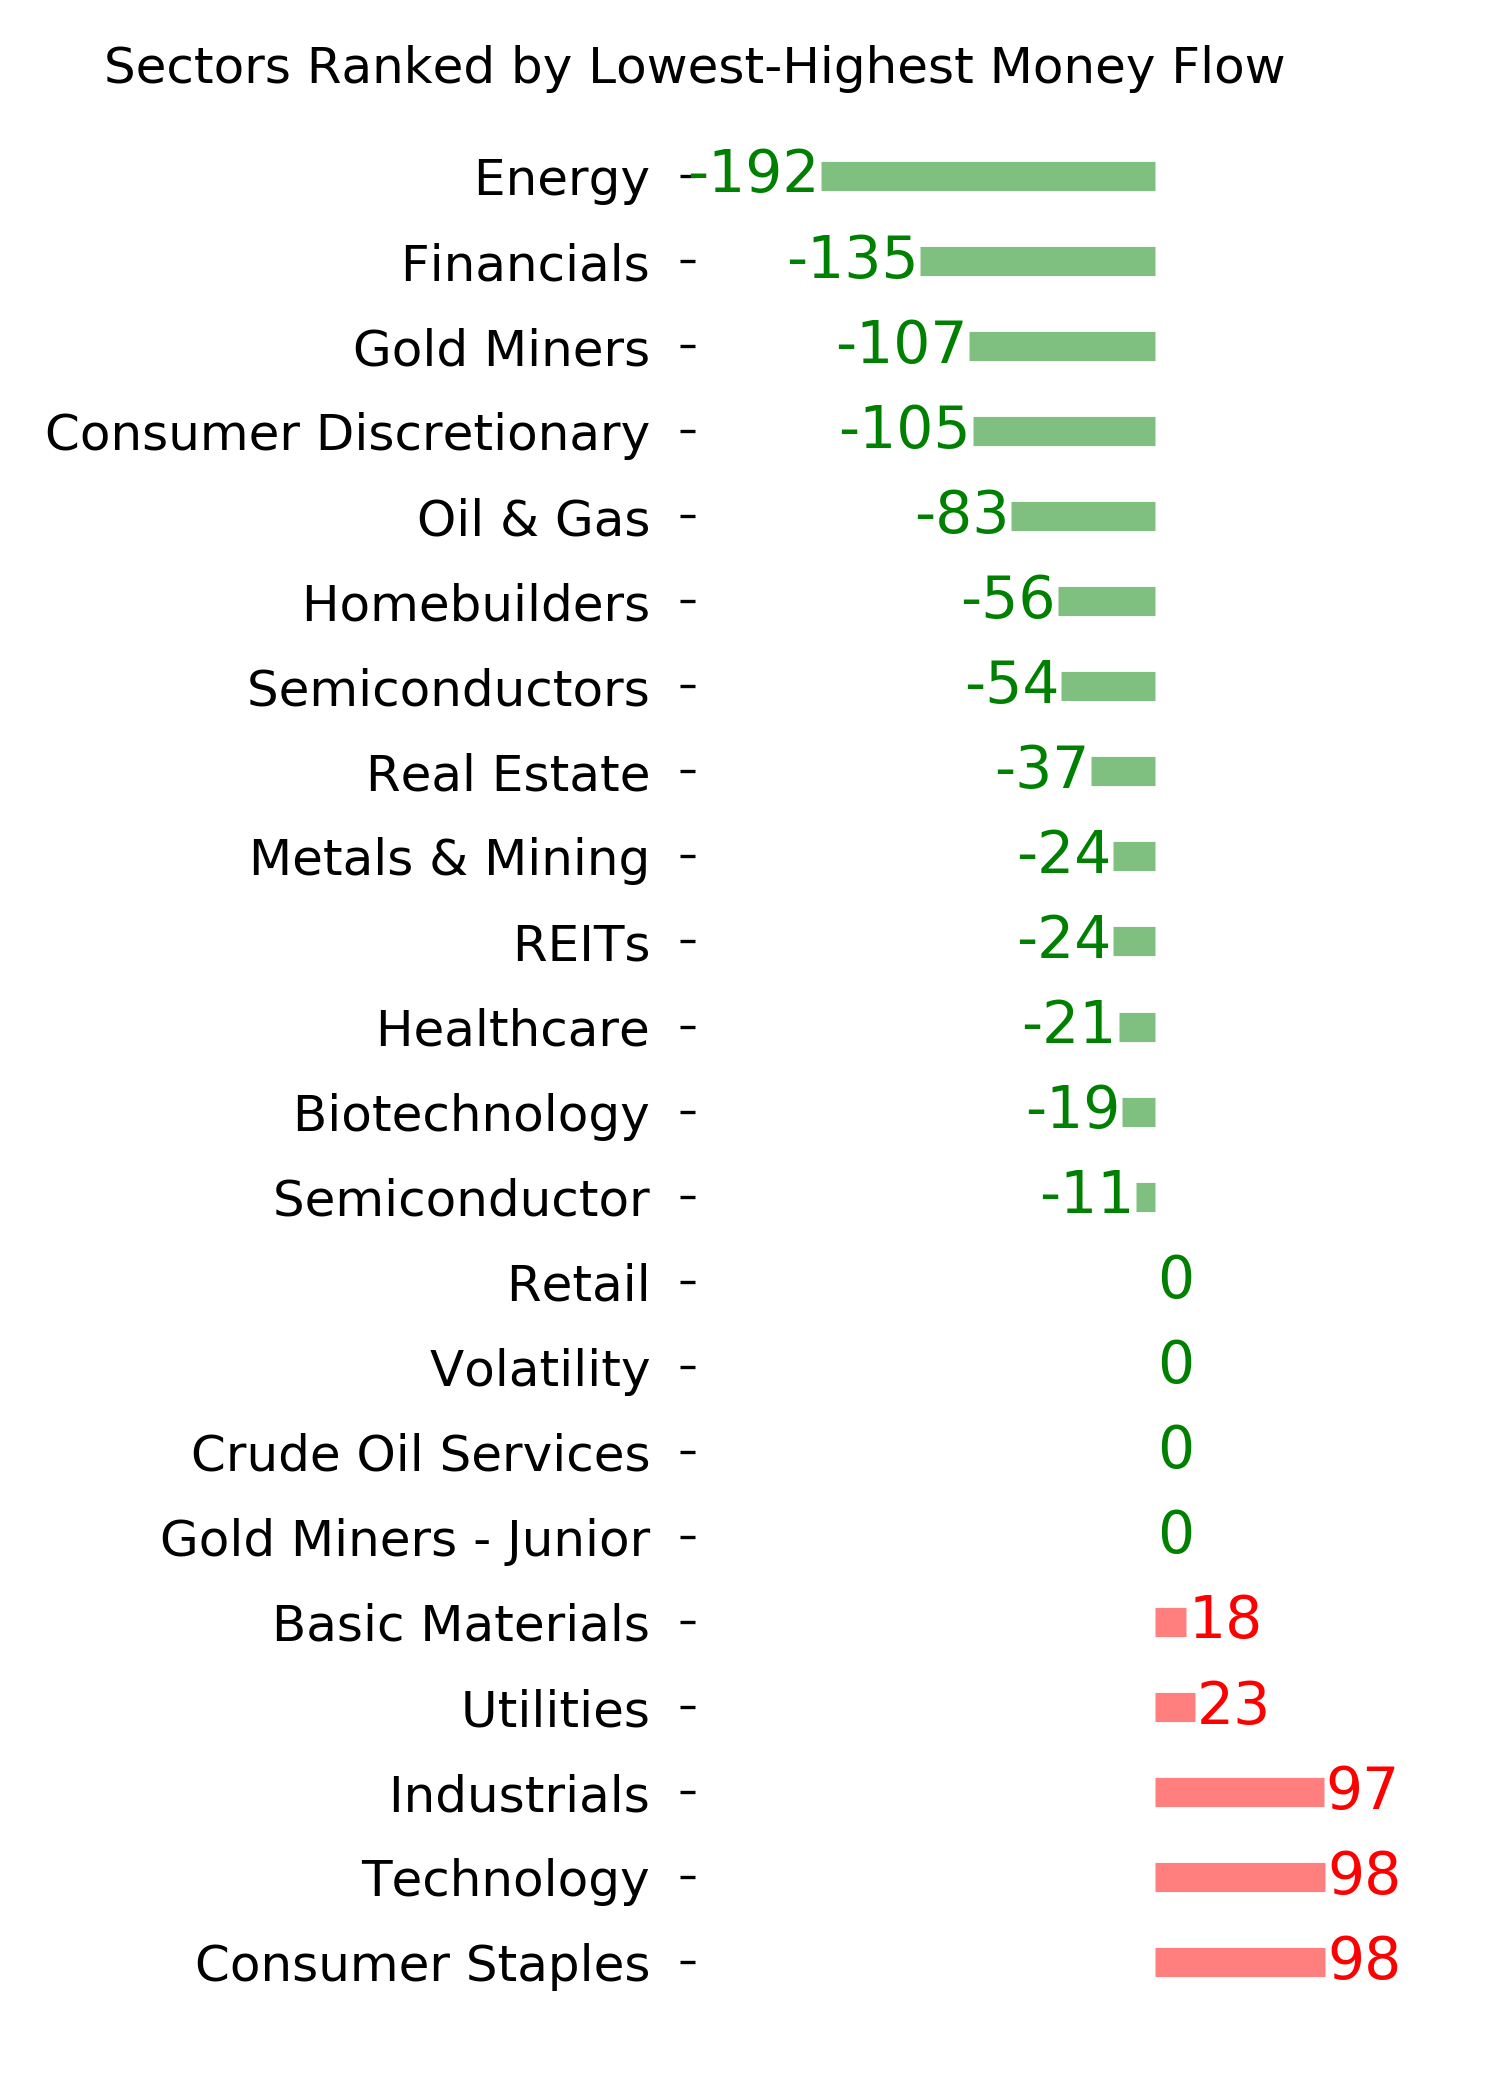
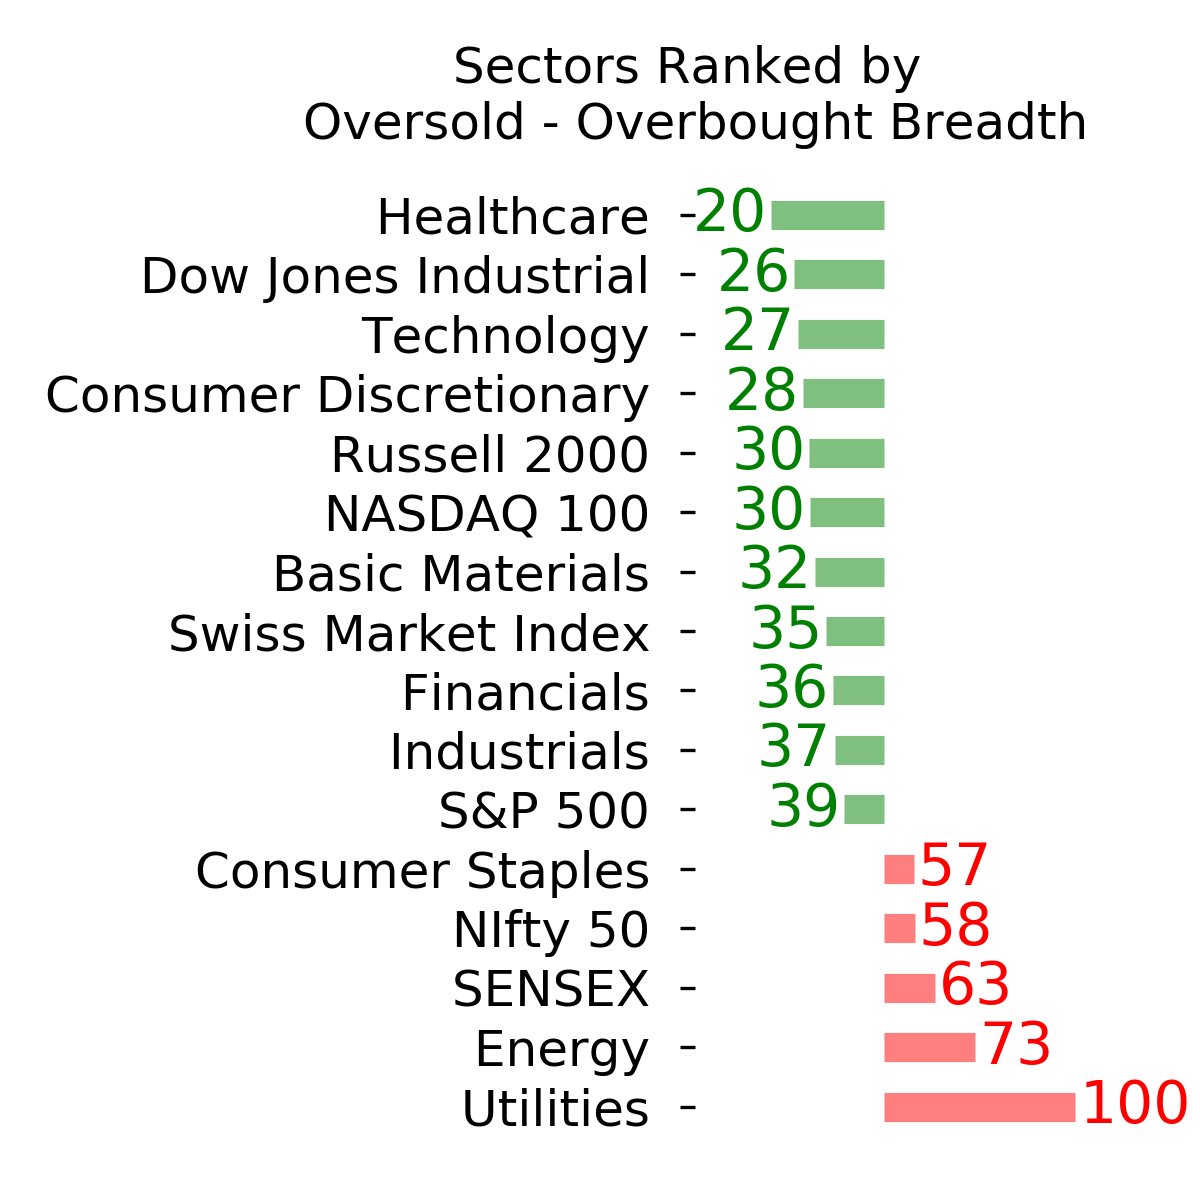
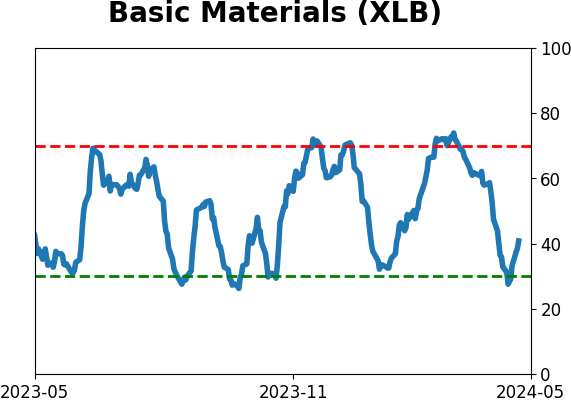
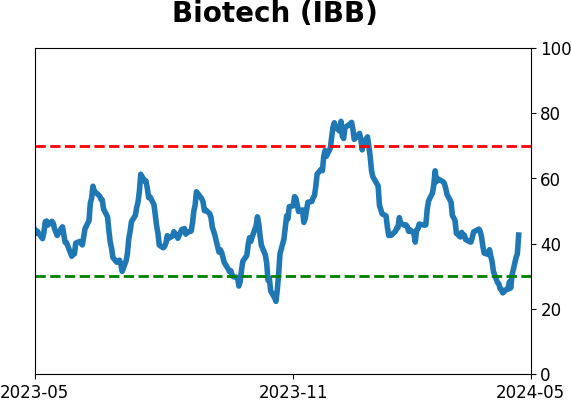
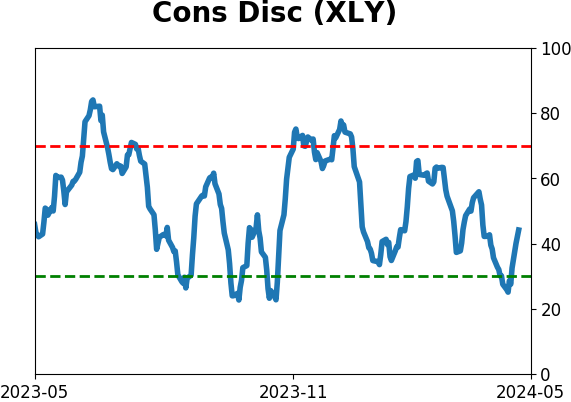
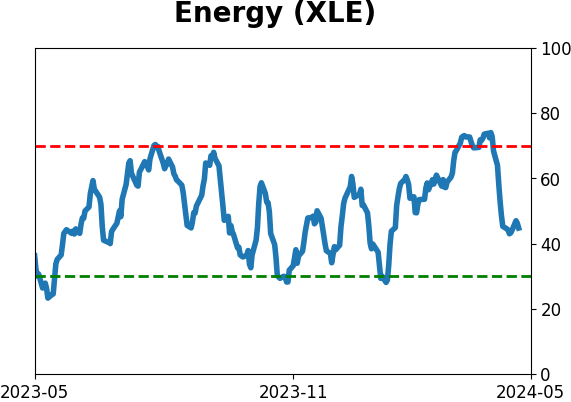
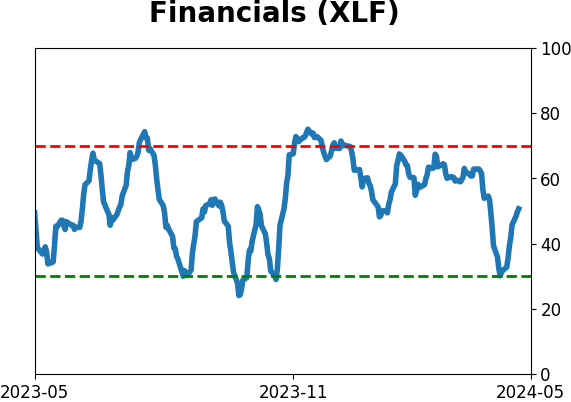
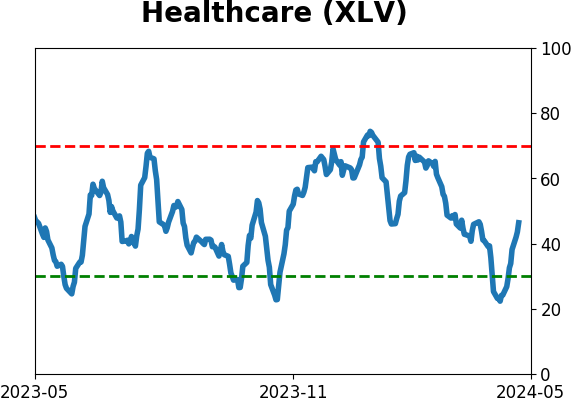
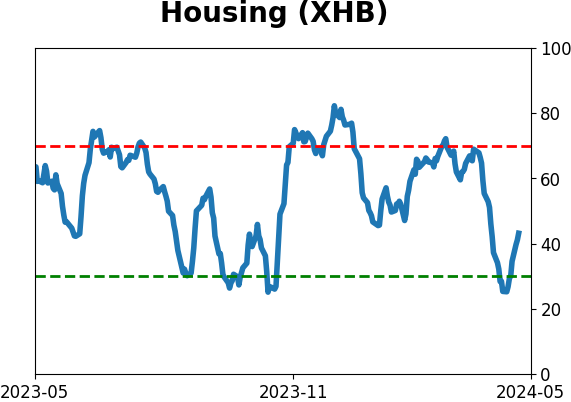
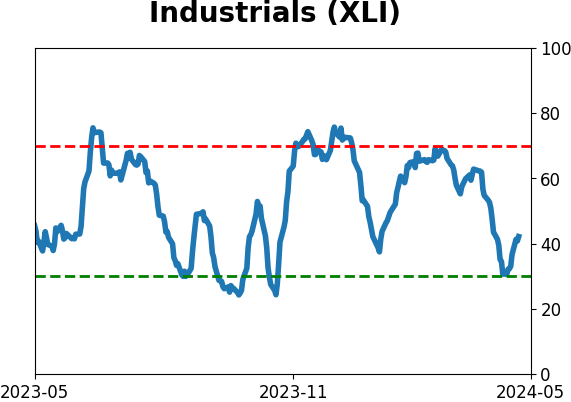
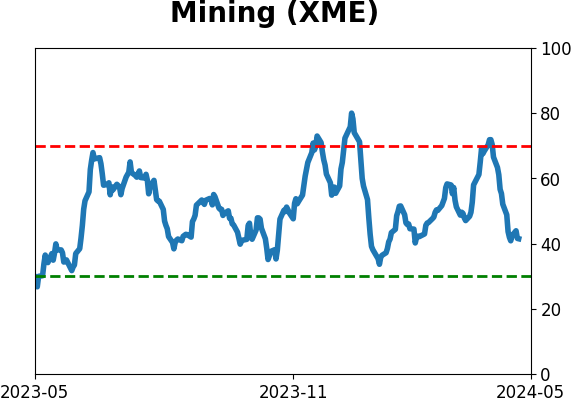
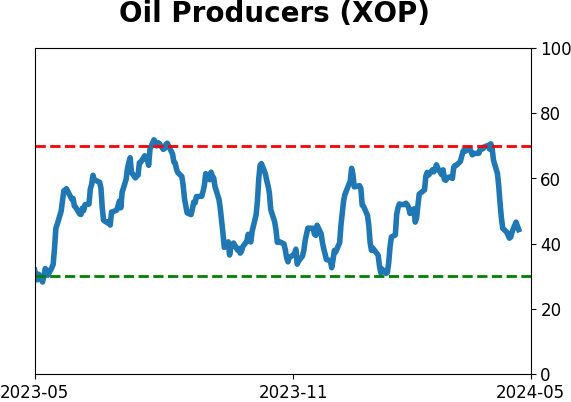
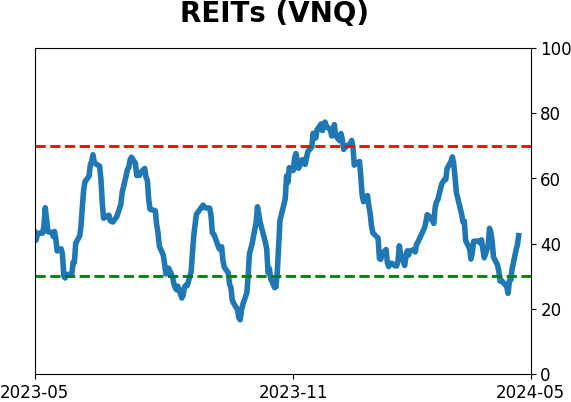
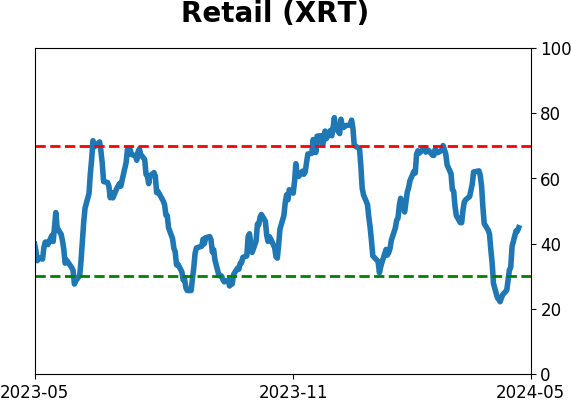
Sector ETF's - 10-Day Moving Average
|
|
|
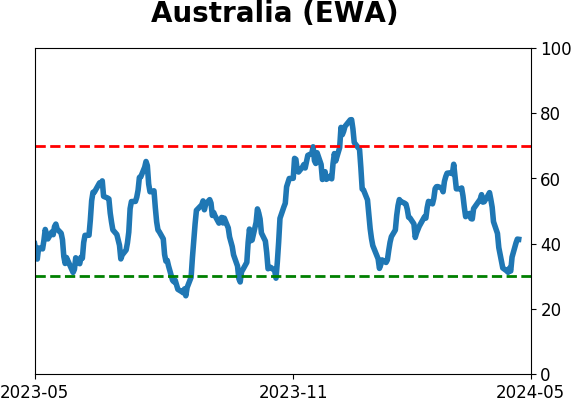
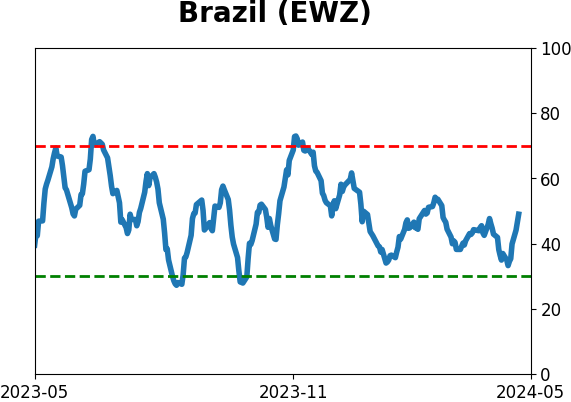
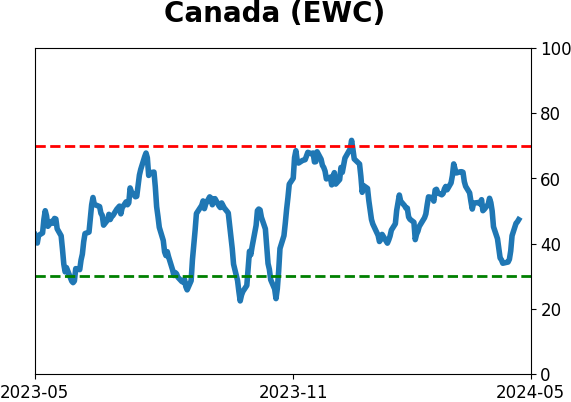
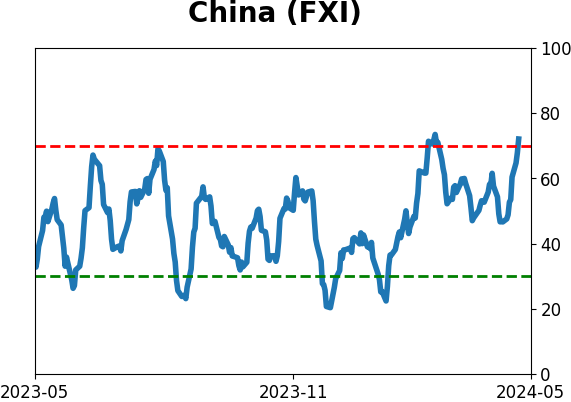
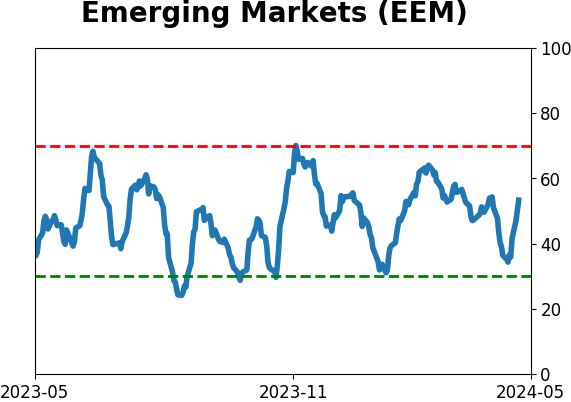
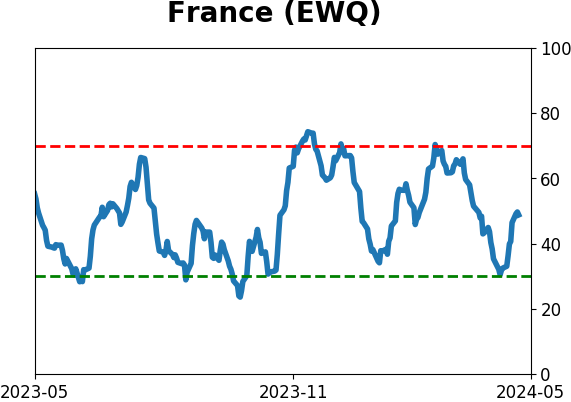
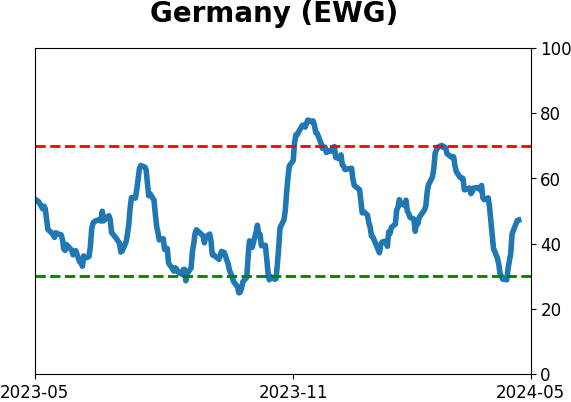
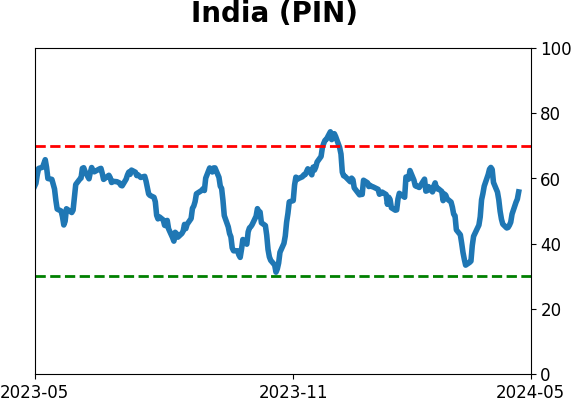
Country ETF's - 10-Day Moving Average
|
|
|
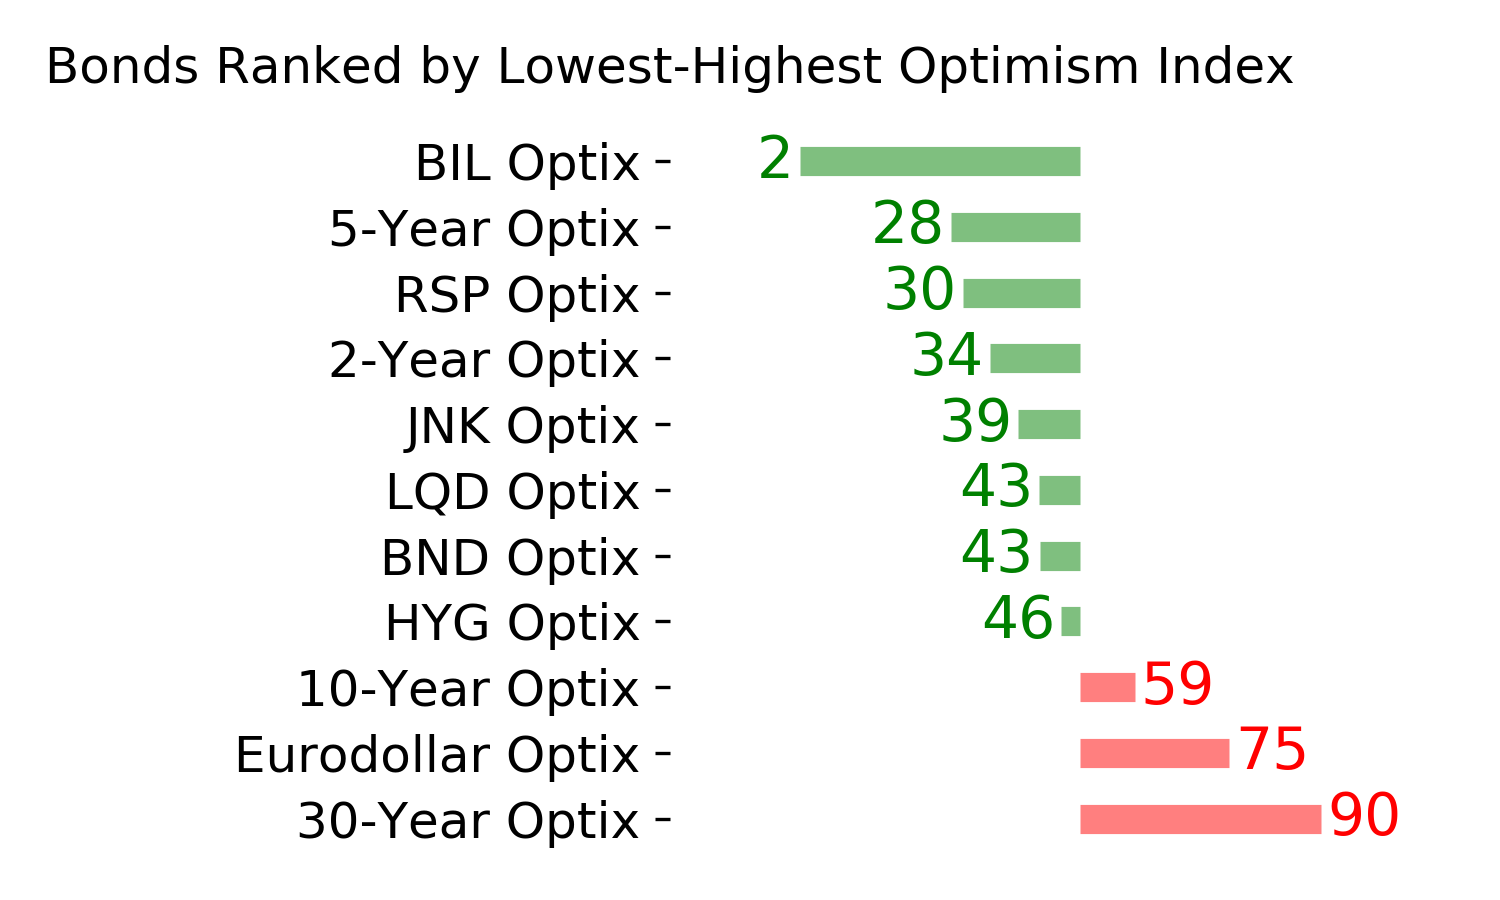
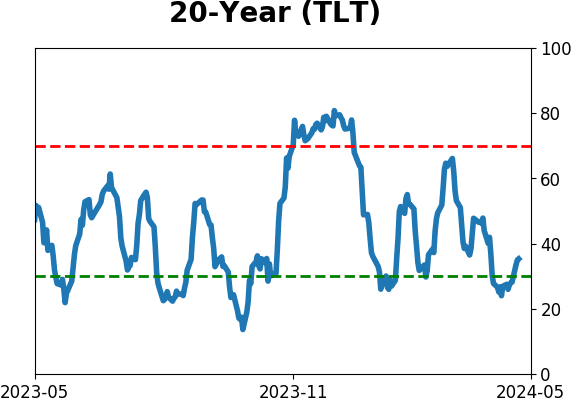
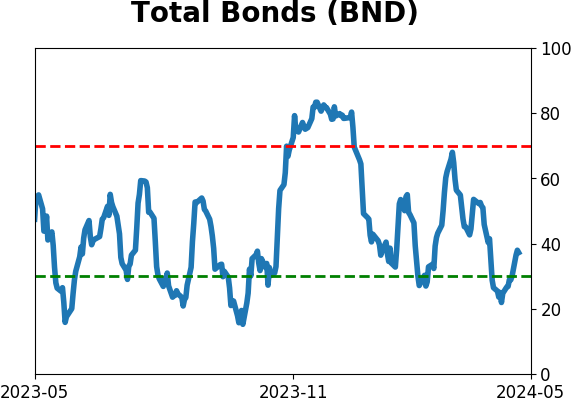
Bond ETF's - 10-Day Moving Average
|
|
|
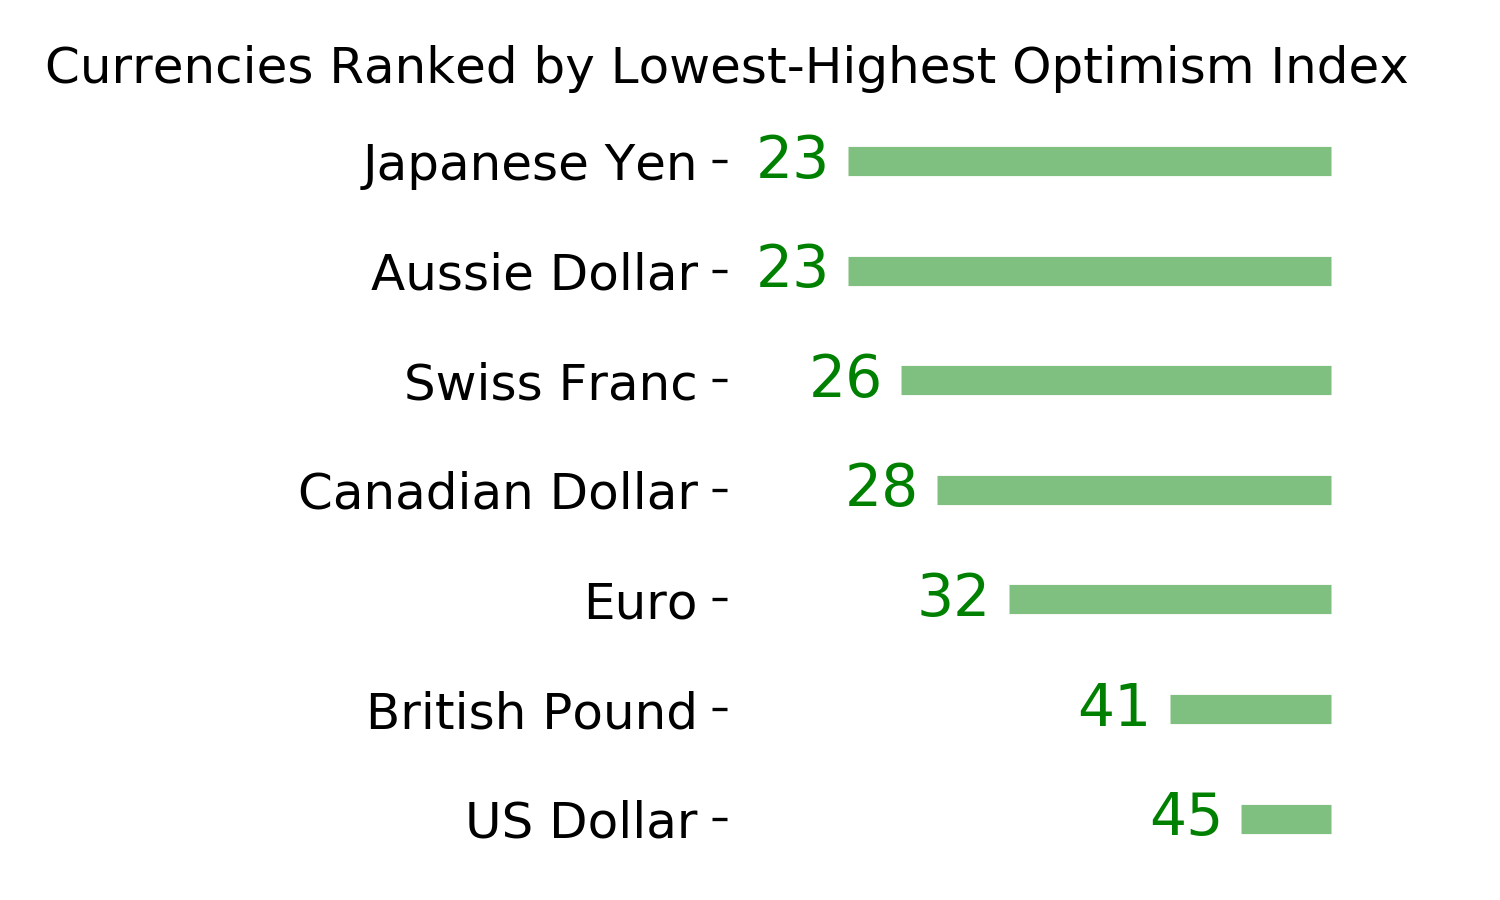
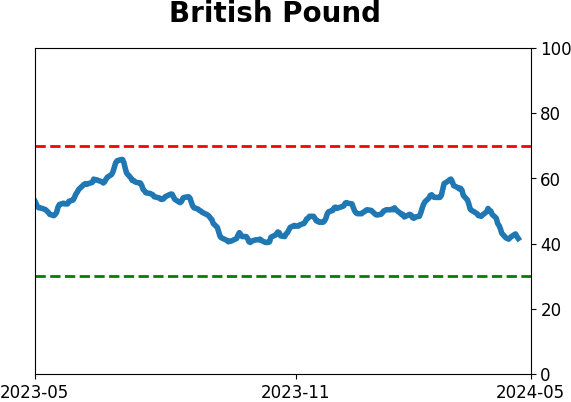
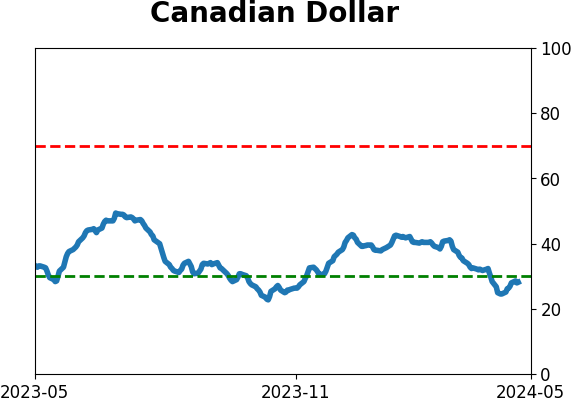
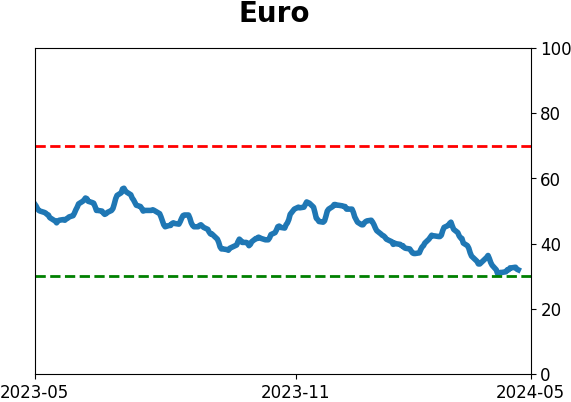
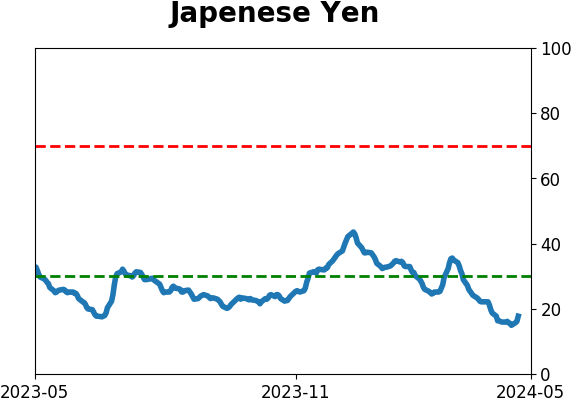
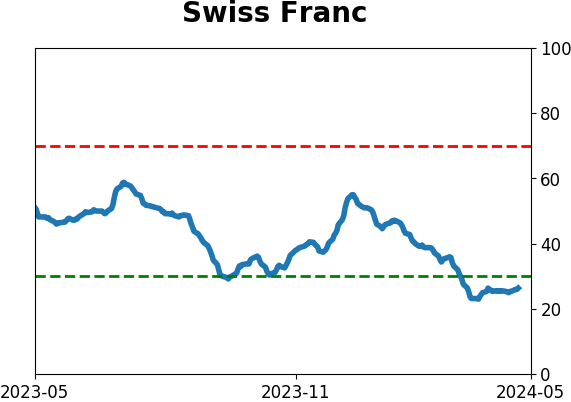
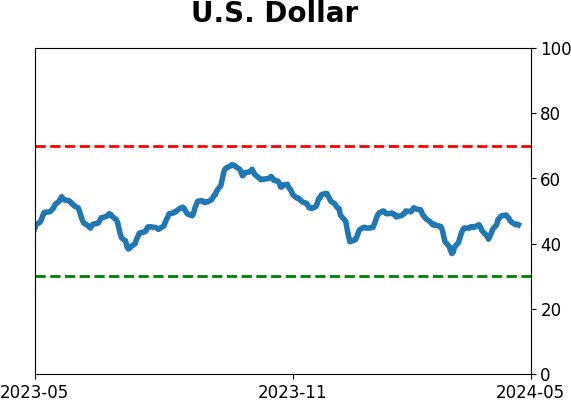
Currency ETF's - 5-Day Moving Average
|
|
|
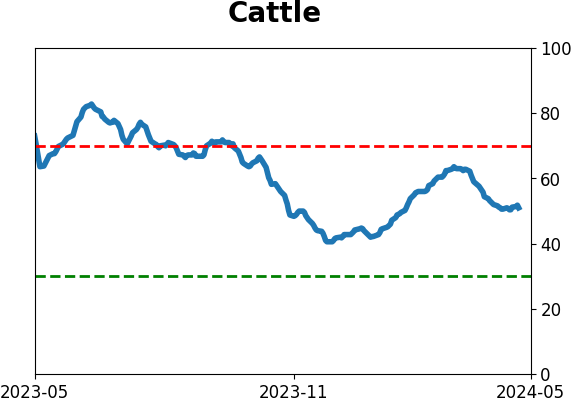
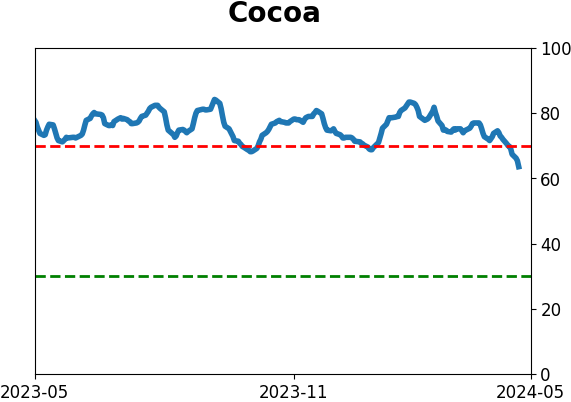
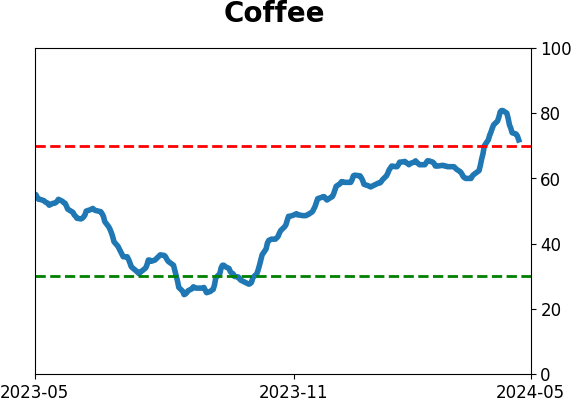
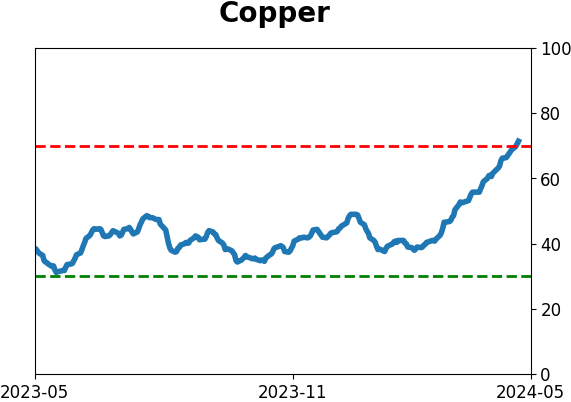
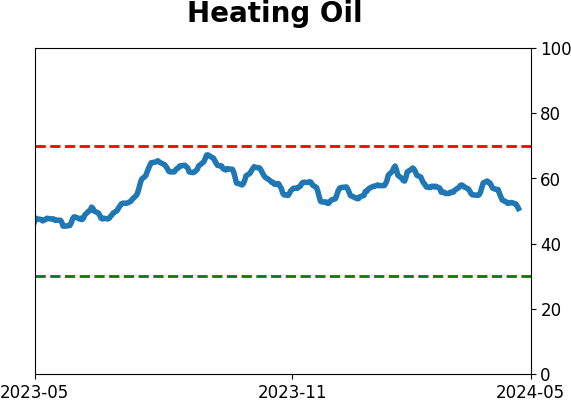
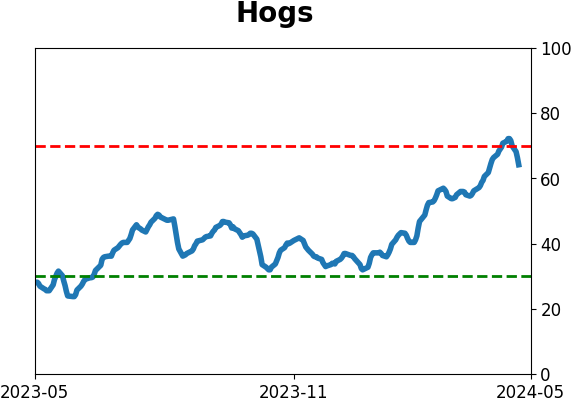
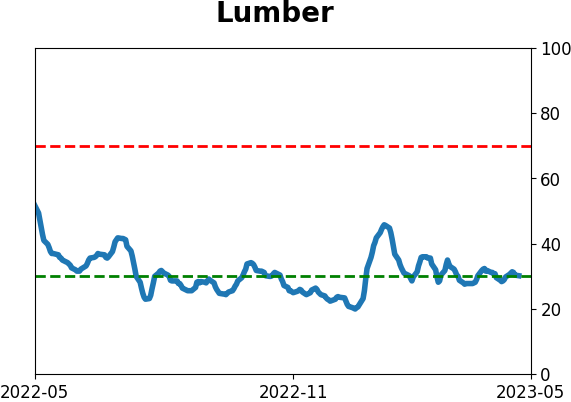
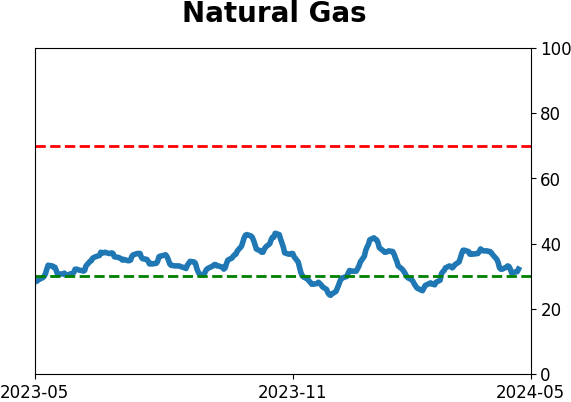
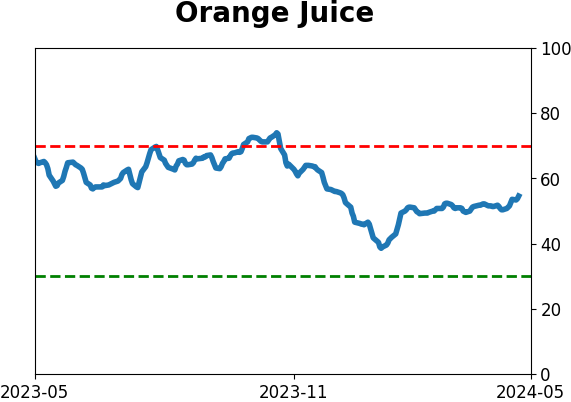
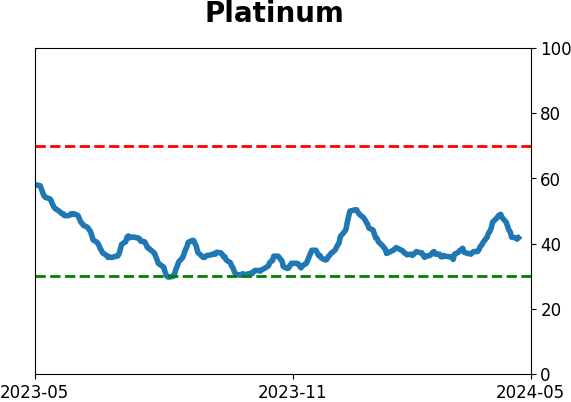
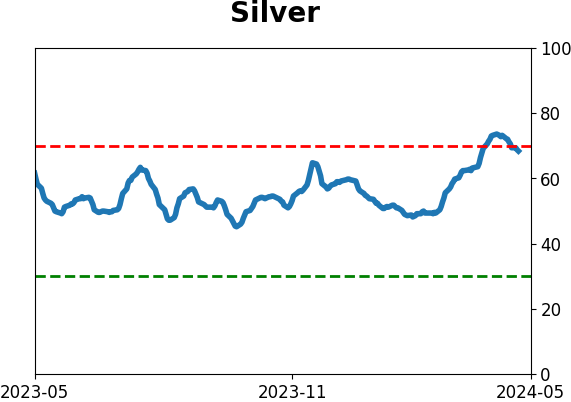
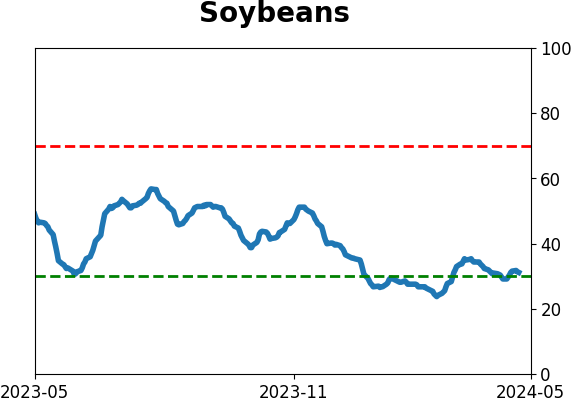
Commodity ETF's - 5-Day Moving Average
|
|