Headlines
|
|
Stocks are holding up but investors are rushing into money markets:
Over the past year, assets in money market funds have jumped by more than 30%, the 2nd-highest growth rate in 40 years. Whenever the year-over-year rise in these liquid assets exceeded 20%, future returns in the S&P 500 tended to be above average. Other markets tended to struggle.
|
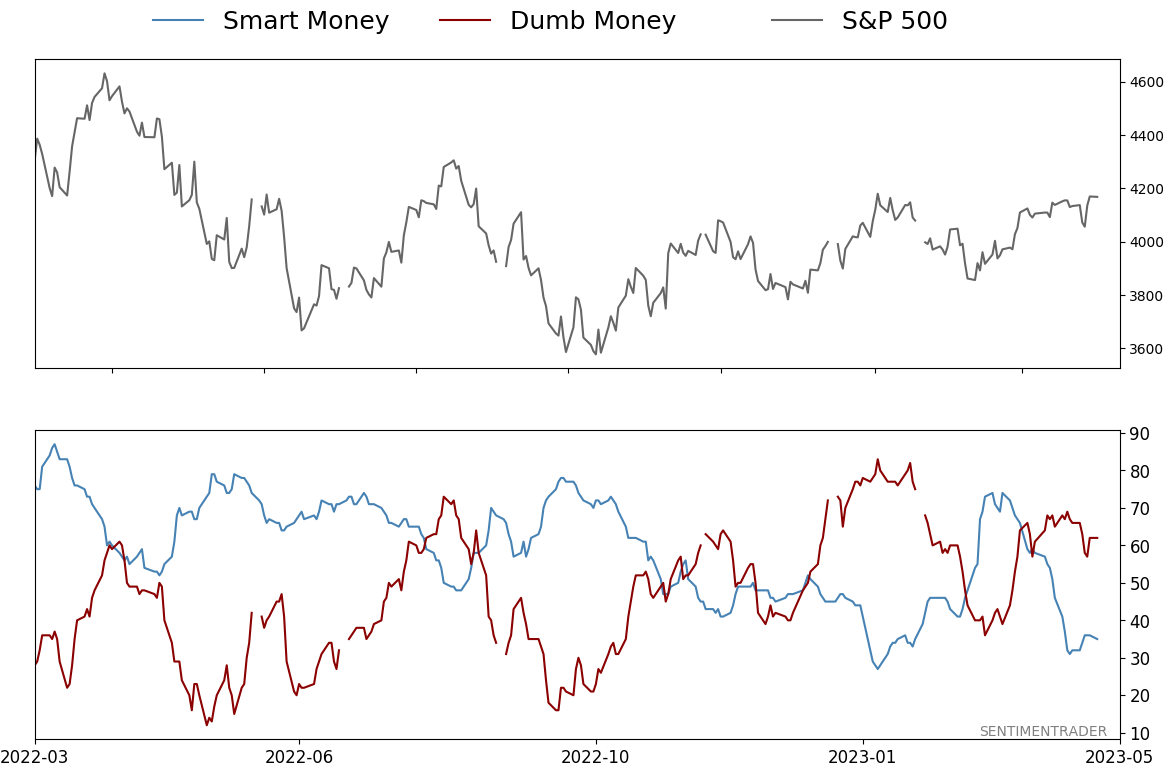
Smart / Dumb Money Confidence
|
Smart Money Confidence: 35%
Dumb Money Confidence: 62%
|
|
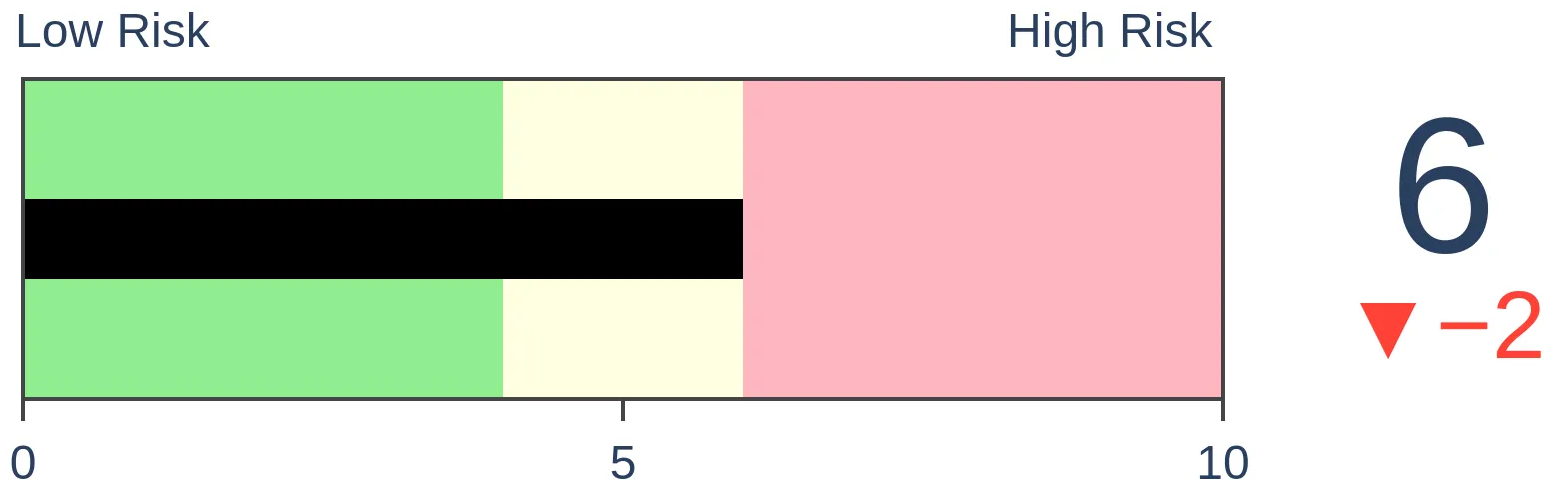
Risk Levels
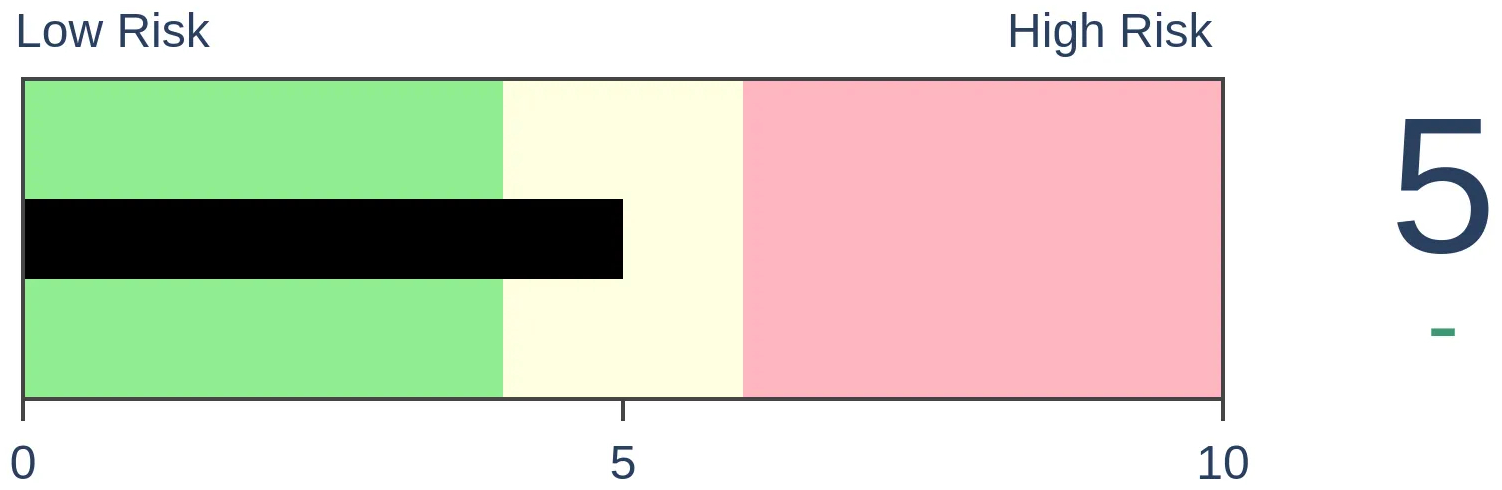
Stocks Short-Term
|
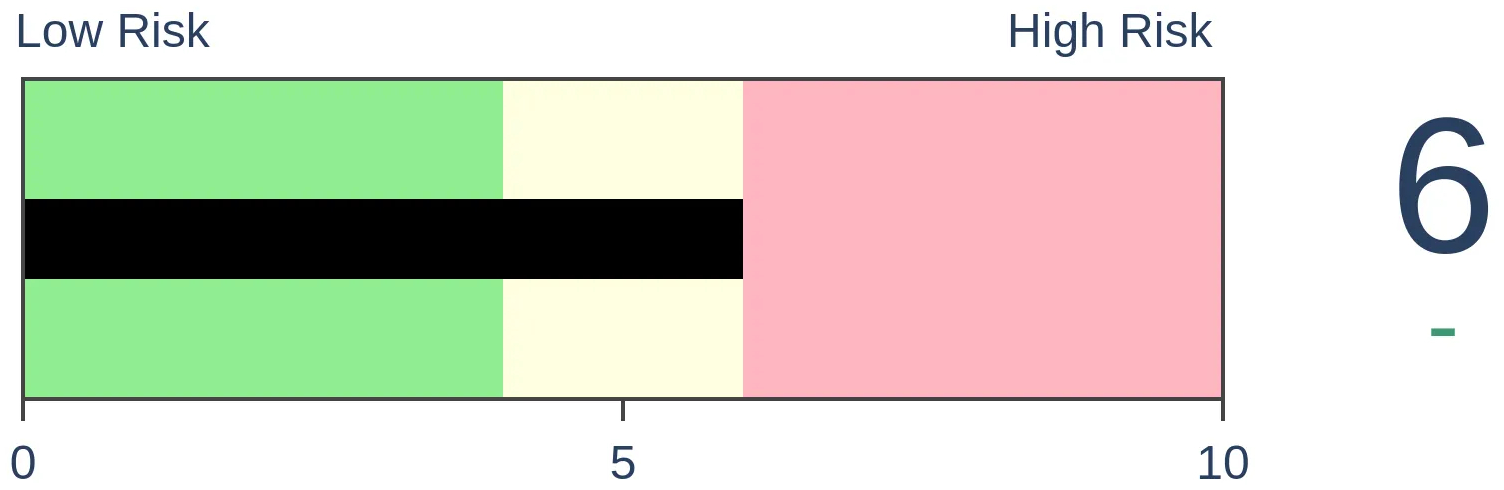
Stocks Medium-Term
|
|
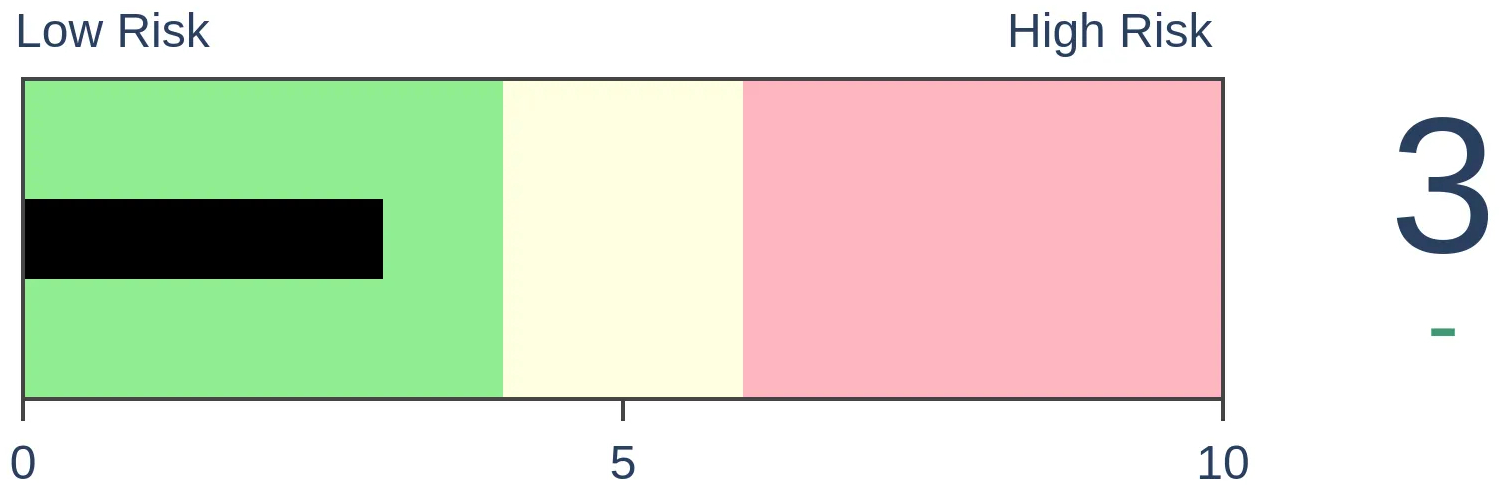
Bonds
|
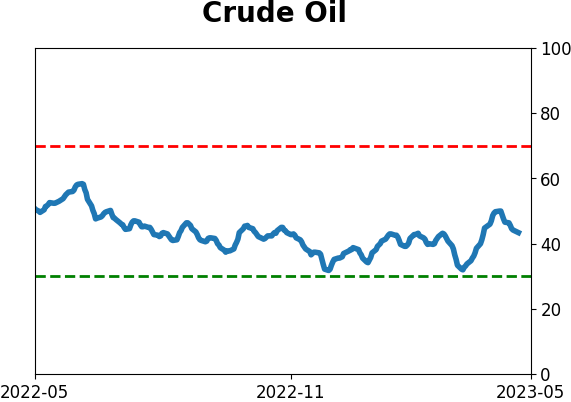
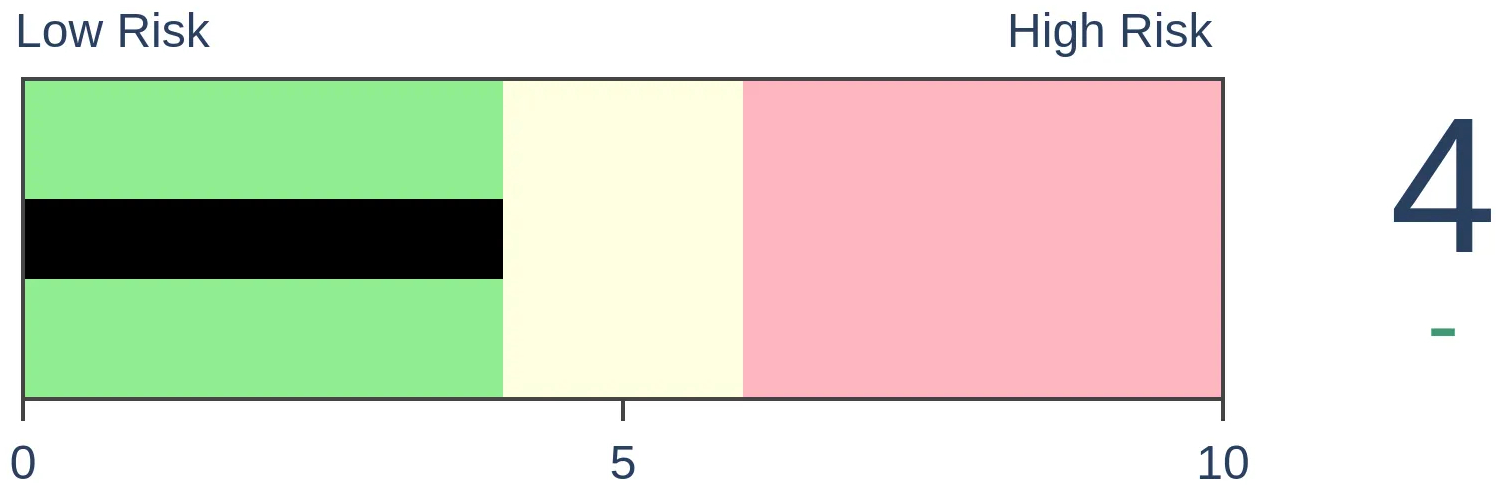
Crude Oil
|
|
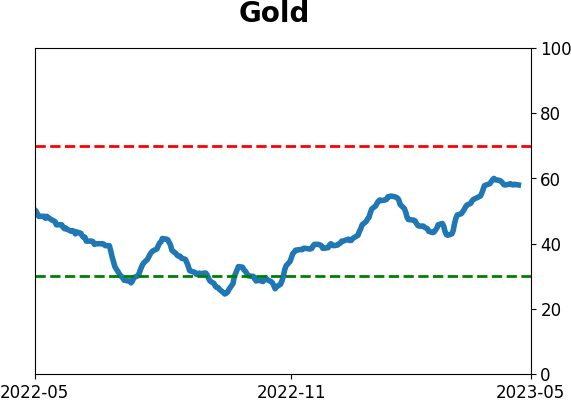
Gold
|
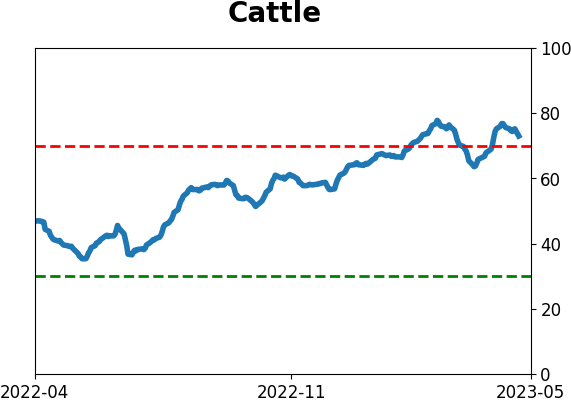
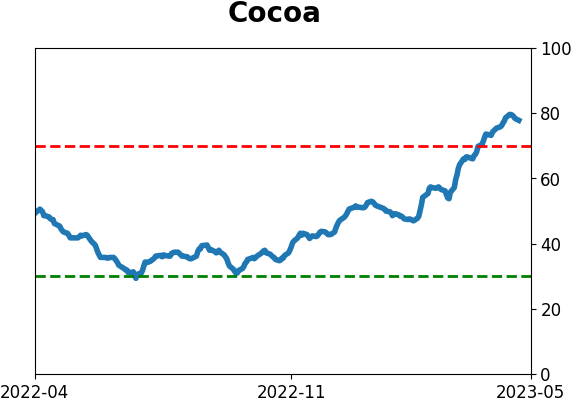
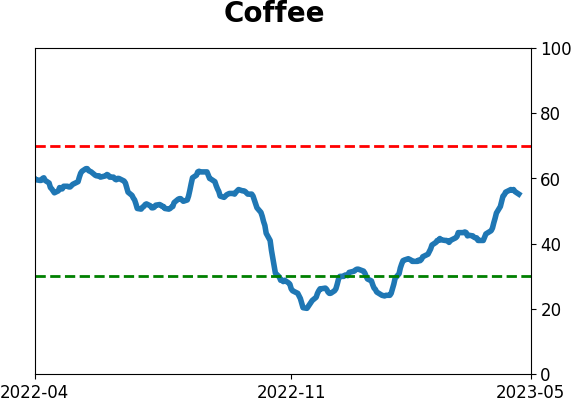
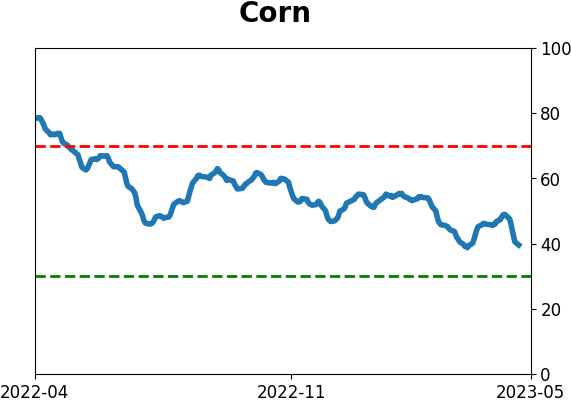
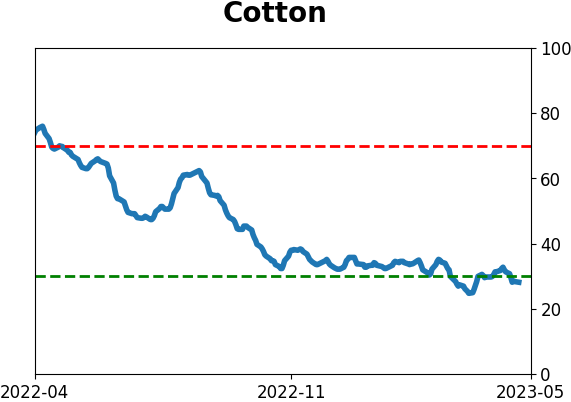
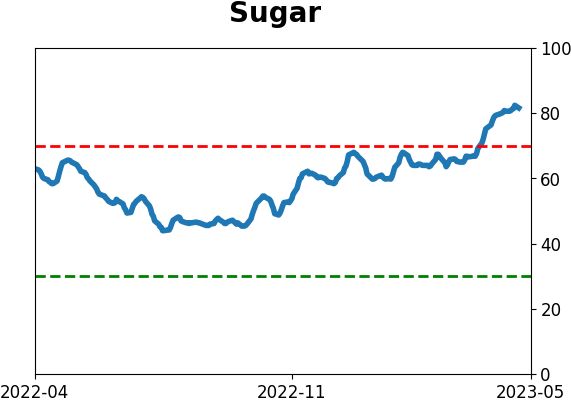
Agriculture

|
|
Research
By Jason Goepfert
BOTTOM LINE
Over the past year, assets in money market funds have jumped by more than 30%, the 2nd-highest growth rate in 40 years. Whenever the year-over-year rise in these liquid assets exceeded 20%, future returns in the S&P 500 tended to be above average. Other markets tended to struggle.
FORECAST / TIMEFRAME
None
|
Key points:
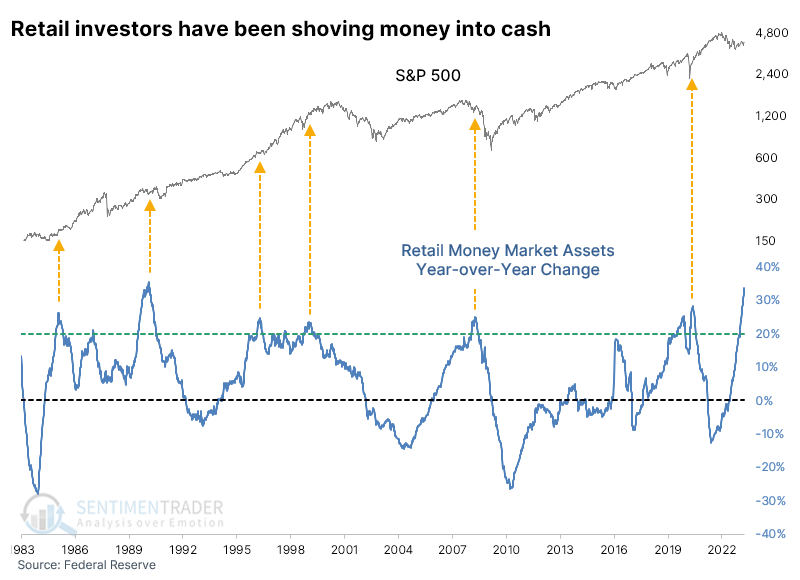
- Assets parked in money market funds have jumped by more than 33% over the past year
- That's the 2nd most extreme year-over-year increase in 40 years
- When assets rise by more than 20% over a year, future returns in stocks tend to be above average
As yields rise, investors rush into money market funds
Investors have been shoving money into cash, and there's no slowdown in sight. As Bloomberg recently noted:
Money-market funds have been scooping up cash in recent months, fueled in large part by depositors pulling their money away from US banks. Much of that flow was driven by more attractive rates, but concern about the steadiness of some smaller lenders helped turbocharge that move last month.
According to the Federal Reserve, retail investors held more than $1.3 trillion (with a "t") in money market assets as of early April. That is, by far, a record high.
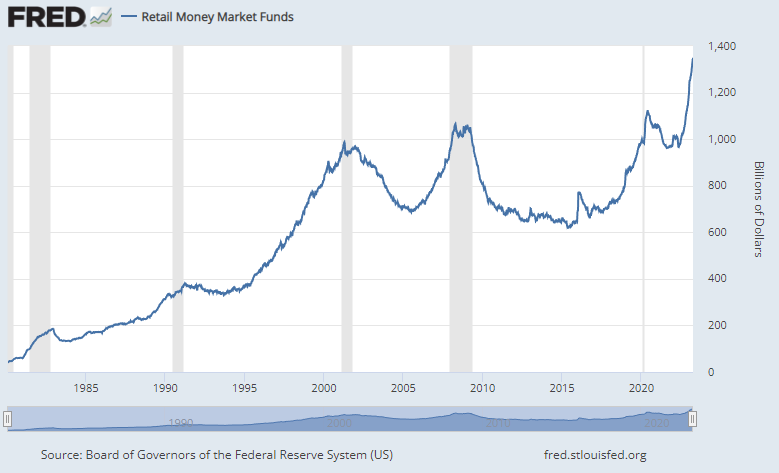
Perhaps the most notable aspect is the drastic growth rate in these assets over the past year. The assumed reasons are increased yield on money market funds, paltry yields on bank saving and checking accounts, and uncertain sentiment regarding stocks and other markets after a disastrous year in 2022.
The only other time in 40 years when money market assets grew by more than a third was February 1990, also when the country was dealing with a banking crisis and a near-doubling of interest rates in the years prior.
Whatever the reasons, the implications are that the money, or at least some of it, eventually tends to find its way into the stock market.
When cash levels rise quickly
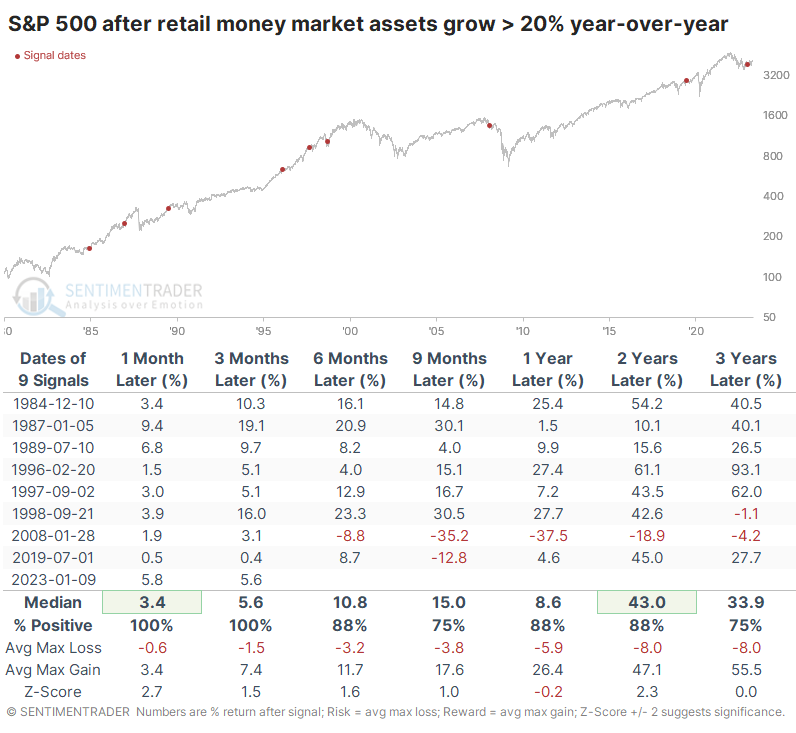
Avoiding the circular argument about "cash on the sidelines," whenever there has been a rush of cash into money market funds, the medium-term performance of the S&P 500 has been quite good. The biggest caveat is 2008, which was decidedly not.
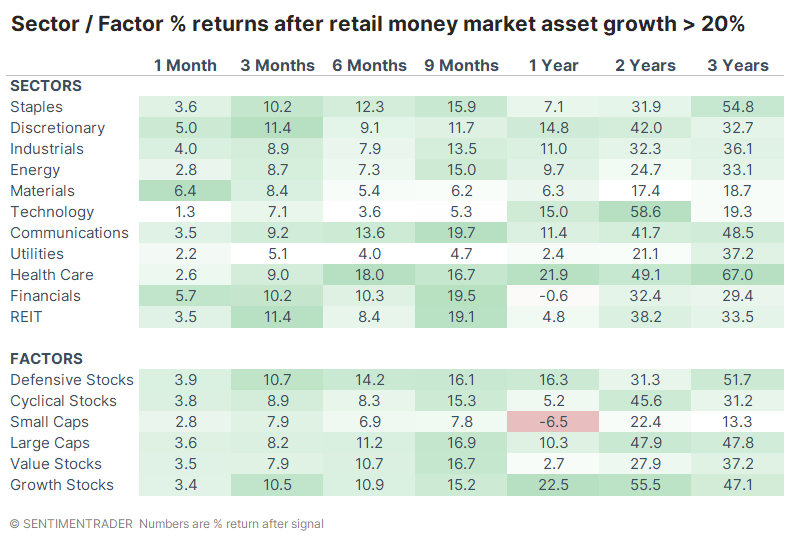
Assets were growing by more than 20% year-over-year by January of this year, so the table below looks at longer-term returns. Outside of 2008, returns were positive, with particularly outsized gains over the next two years.
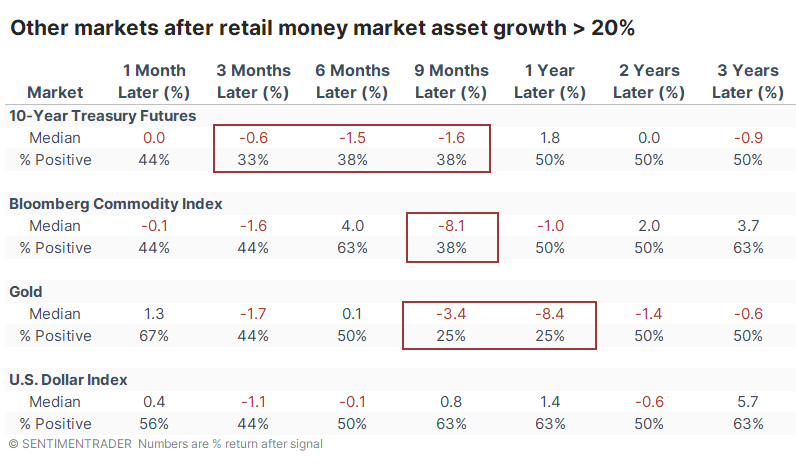
Other markets didn't respond nearly as favorably. Over the next nine months, Treasury note prices, gold, and commodities generally showed consistent losses, typically in concert with a rising dollar.
Technology and Health Care tended to show some of the strongest returns among sectors and factors. Thanks in part to 2008, the Defensive sector held up the best, as did Large-Cap stocks. Also, thanks to solid returns outside of 2008, Growth stocks sported the best returns one and two years later.
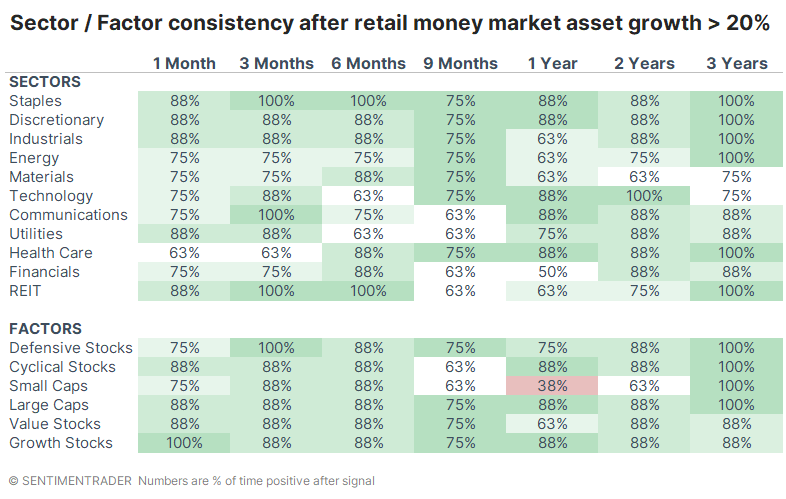
Looking at the consistency of returns, the biggest standout is the difference between Small-Cap and Large-Cap stocks.
What the research tells us...
The rapid surge in assets held at money market funds cannot fully be explained by investors' fears about the stock market. Maybe not even mostly explained by it. Unlike some past episodes, the surge in those assets over the past six months hasn't gone hand-in-hand with a market decline. It seems clear that much, even most, of the rise is due to investors chasing yields on some of the safest instruments available.
But that, in itself, tells us something about sentiment. While a sudden and drastic rise in these liquid investments proved to be a horribly false buy signal in 2008, other instances proved to be good times for investors to move opposite the crowd and put their money into other assets like stocks.
Indicators at Extremes
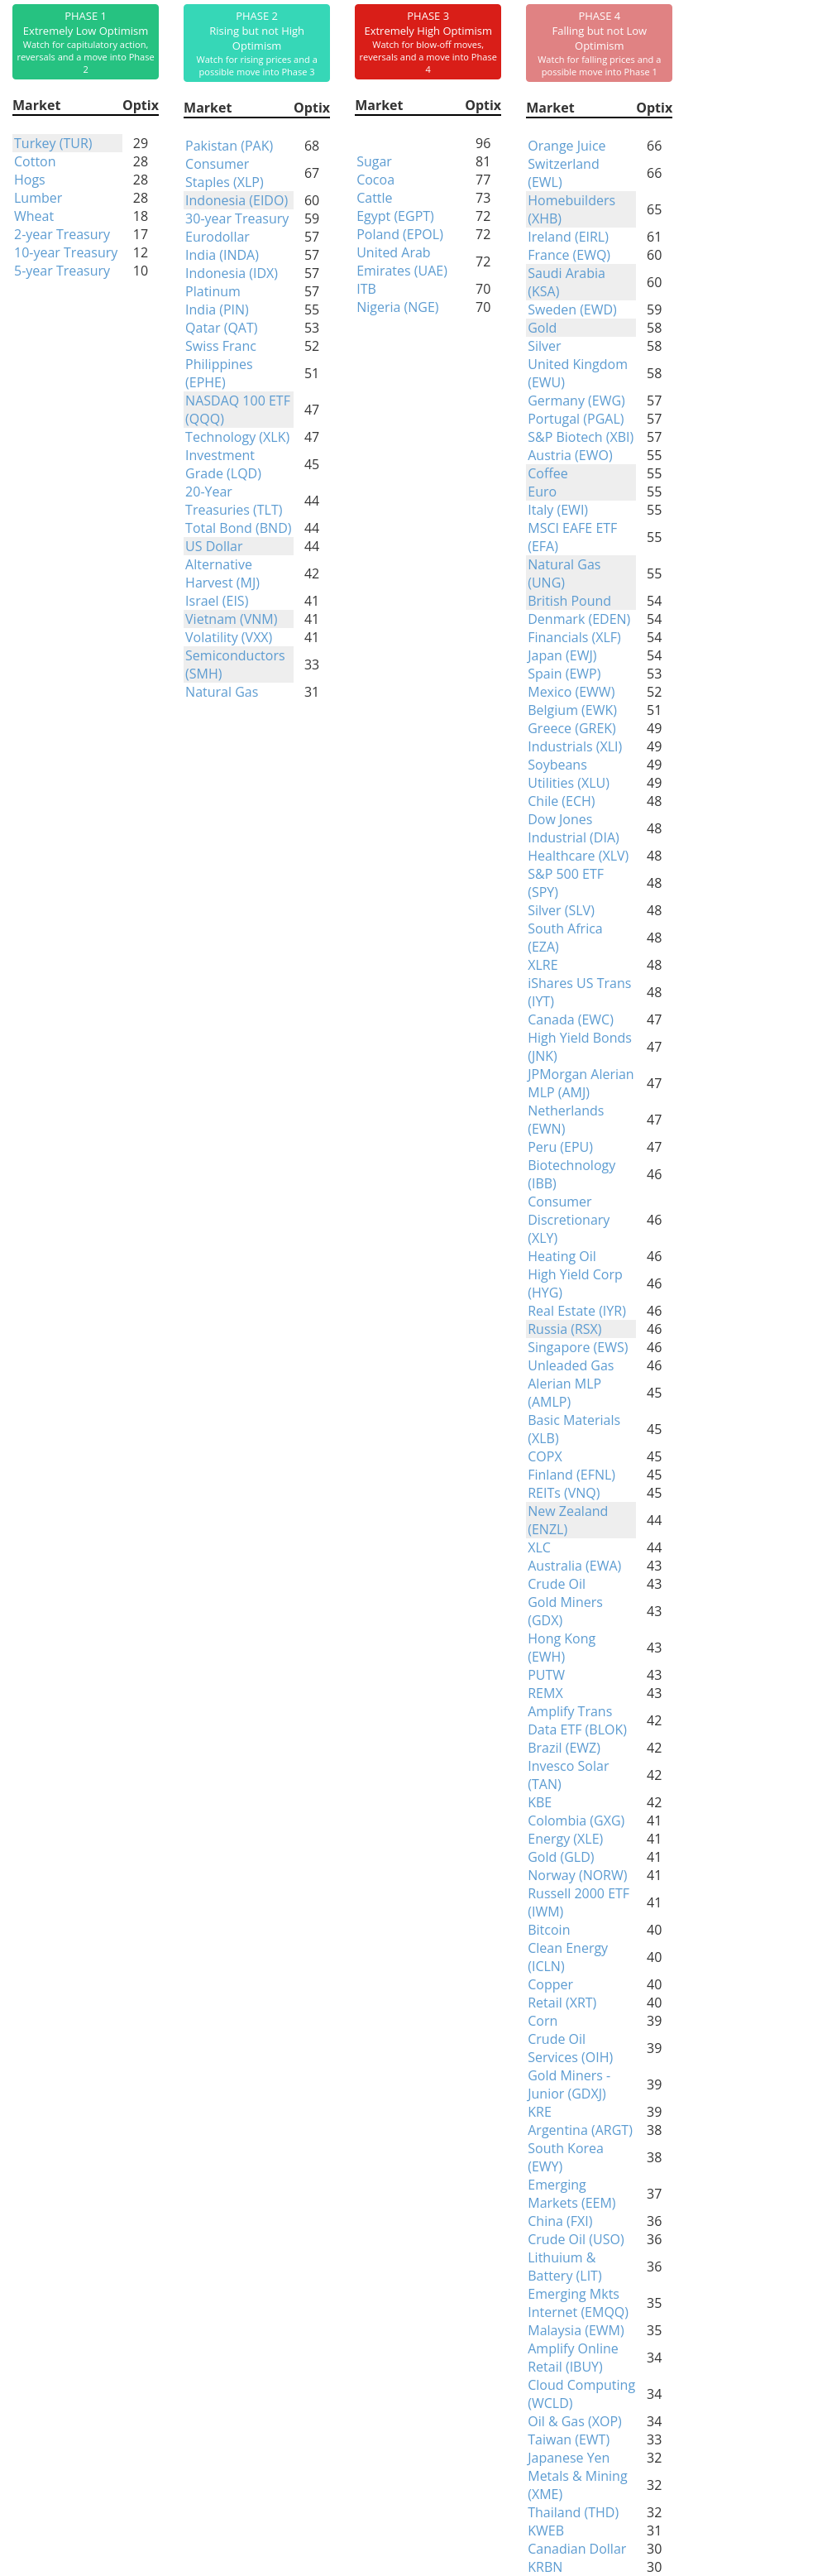
Phase Table
Ranks
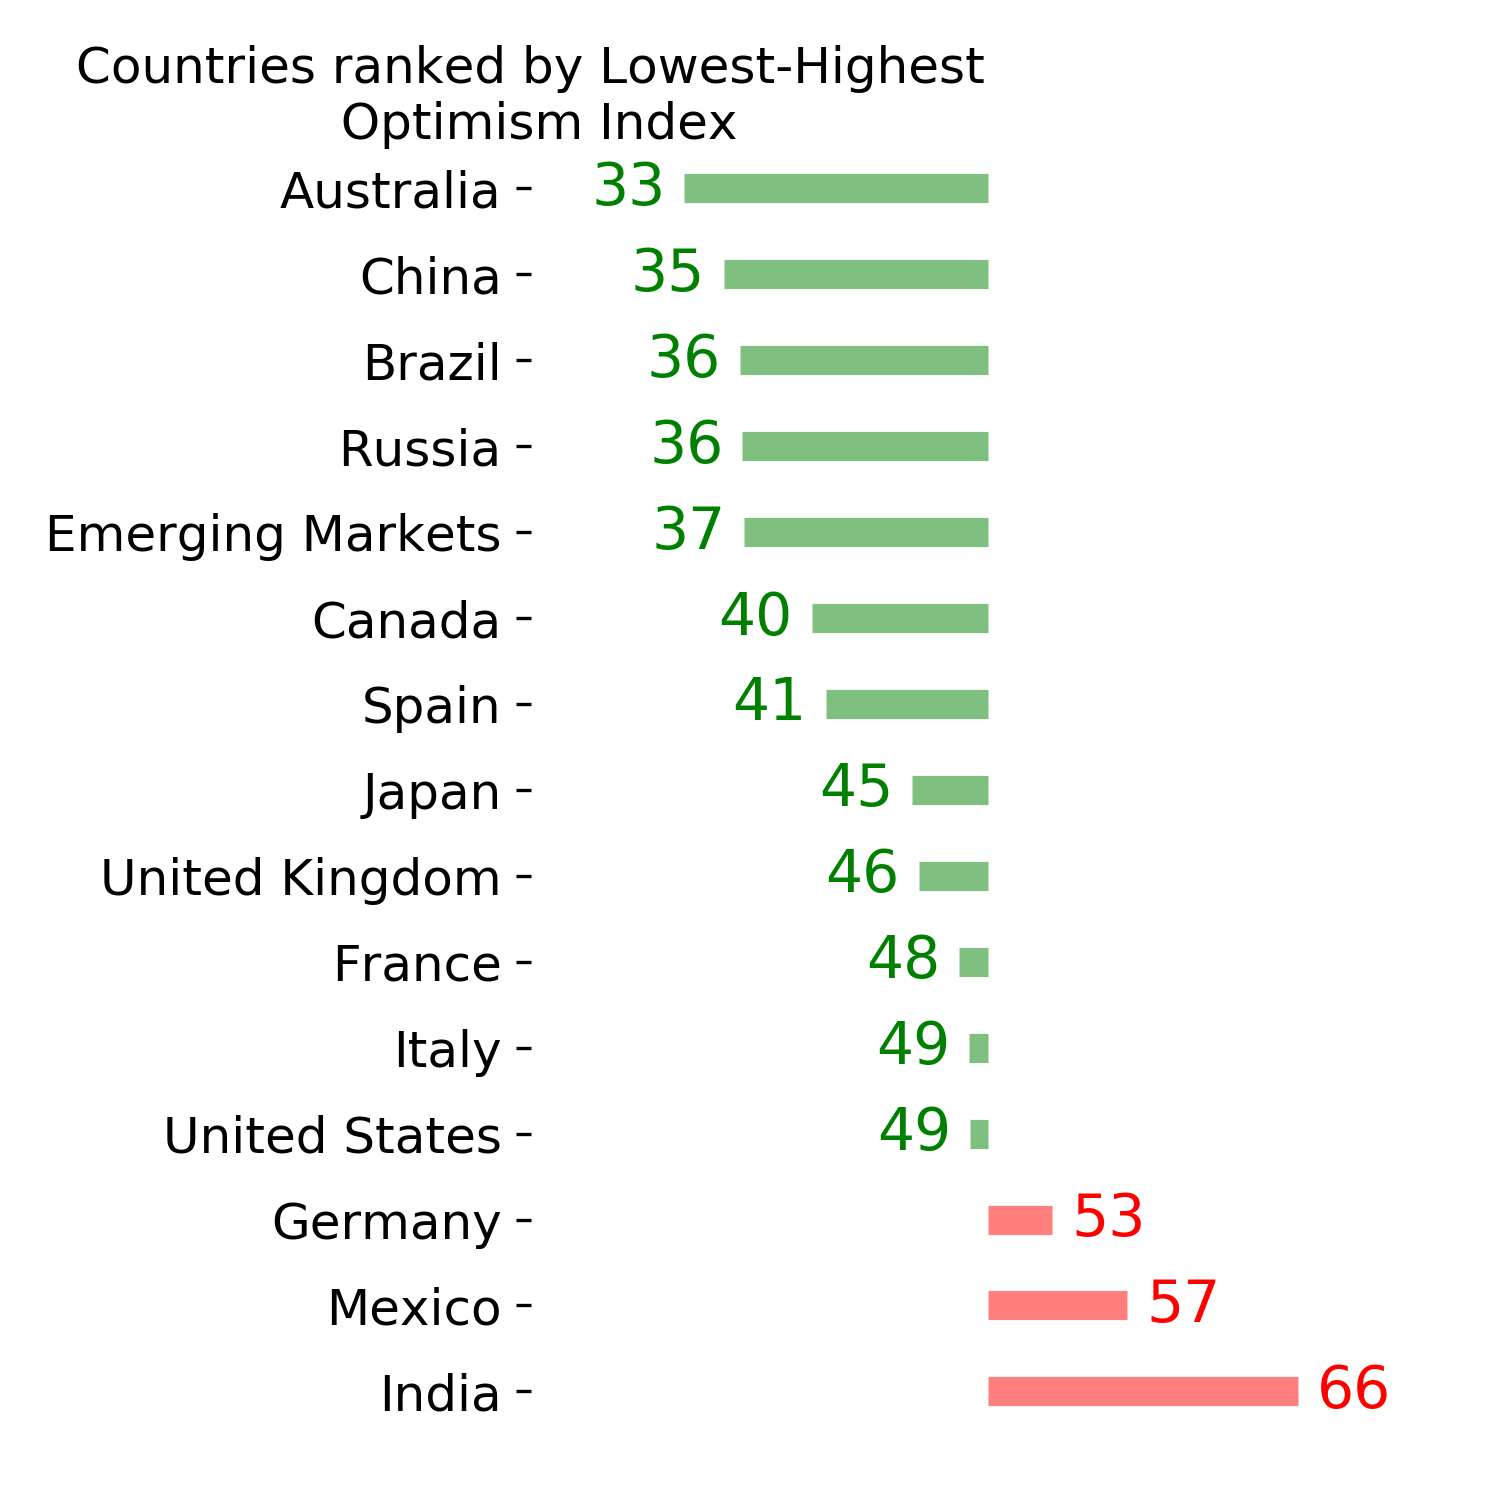
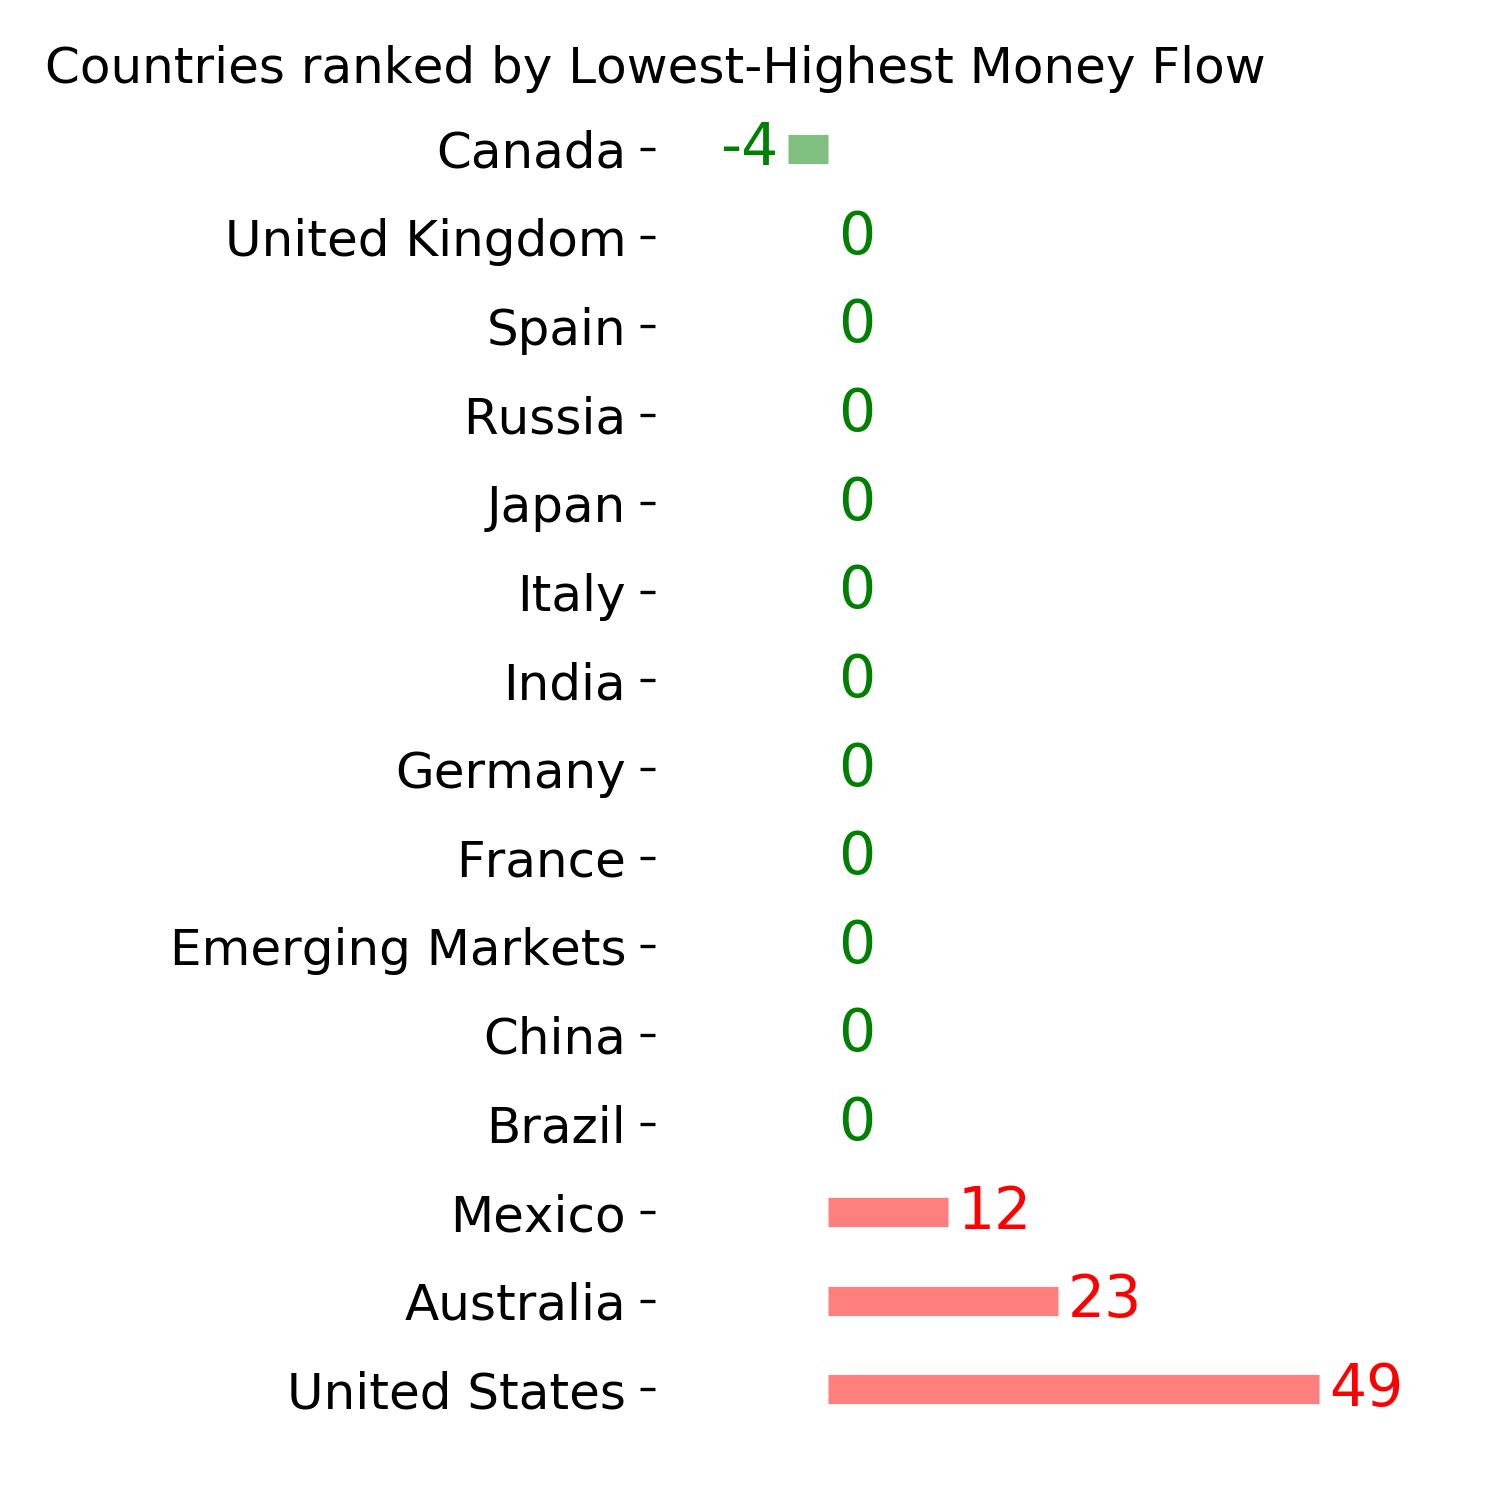
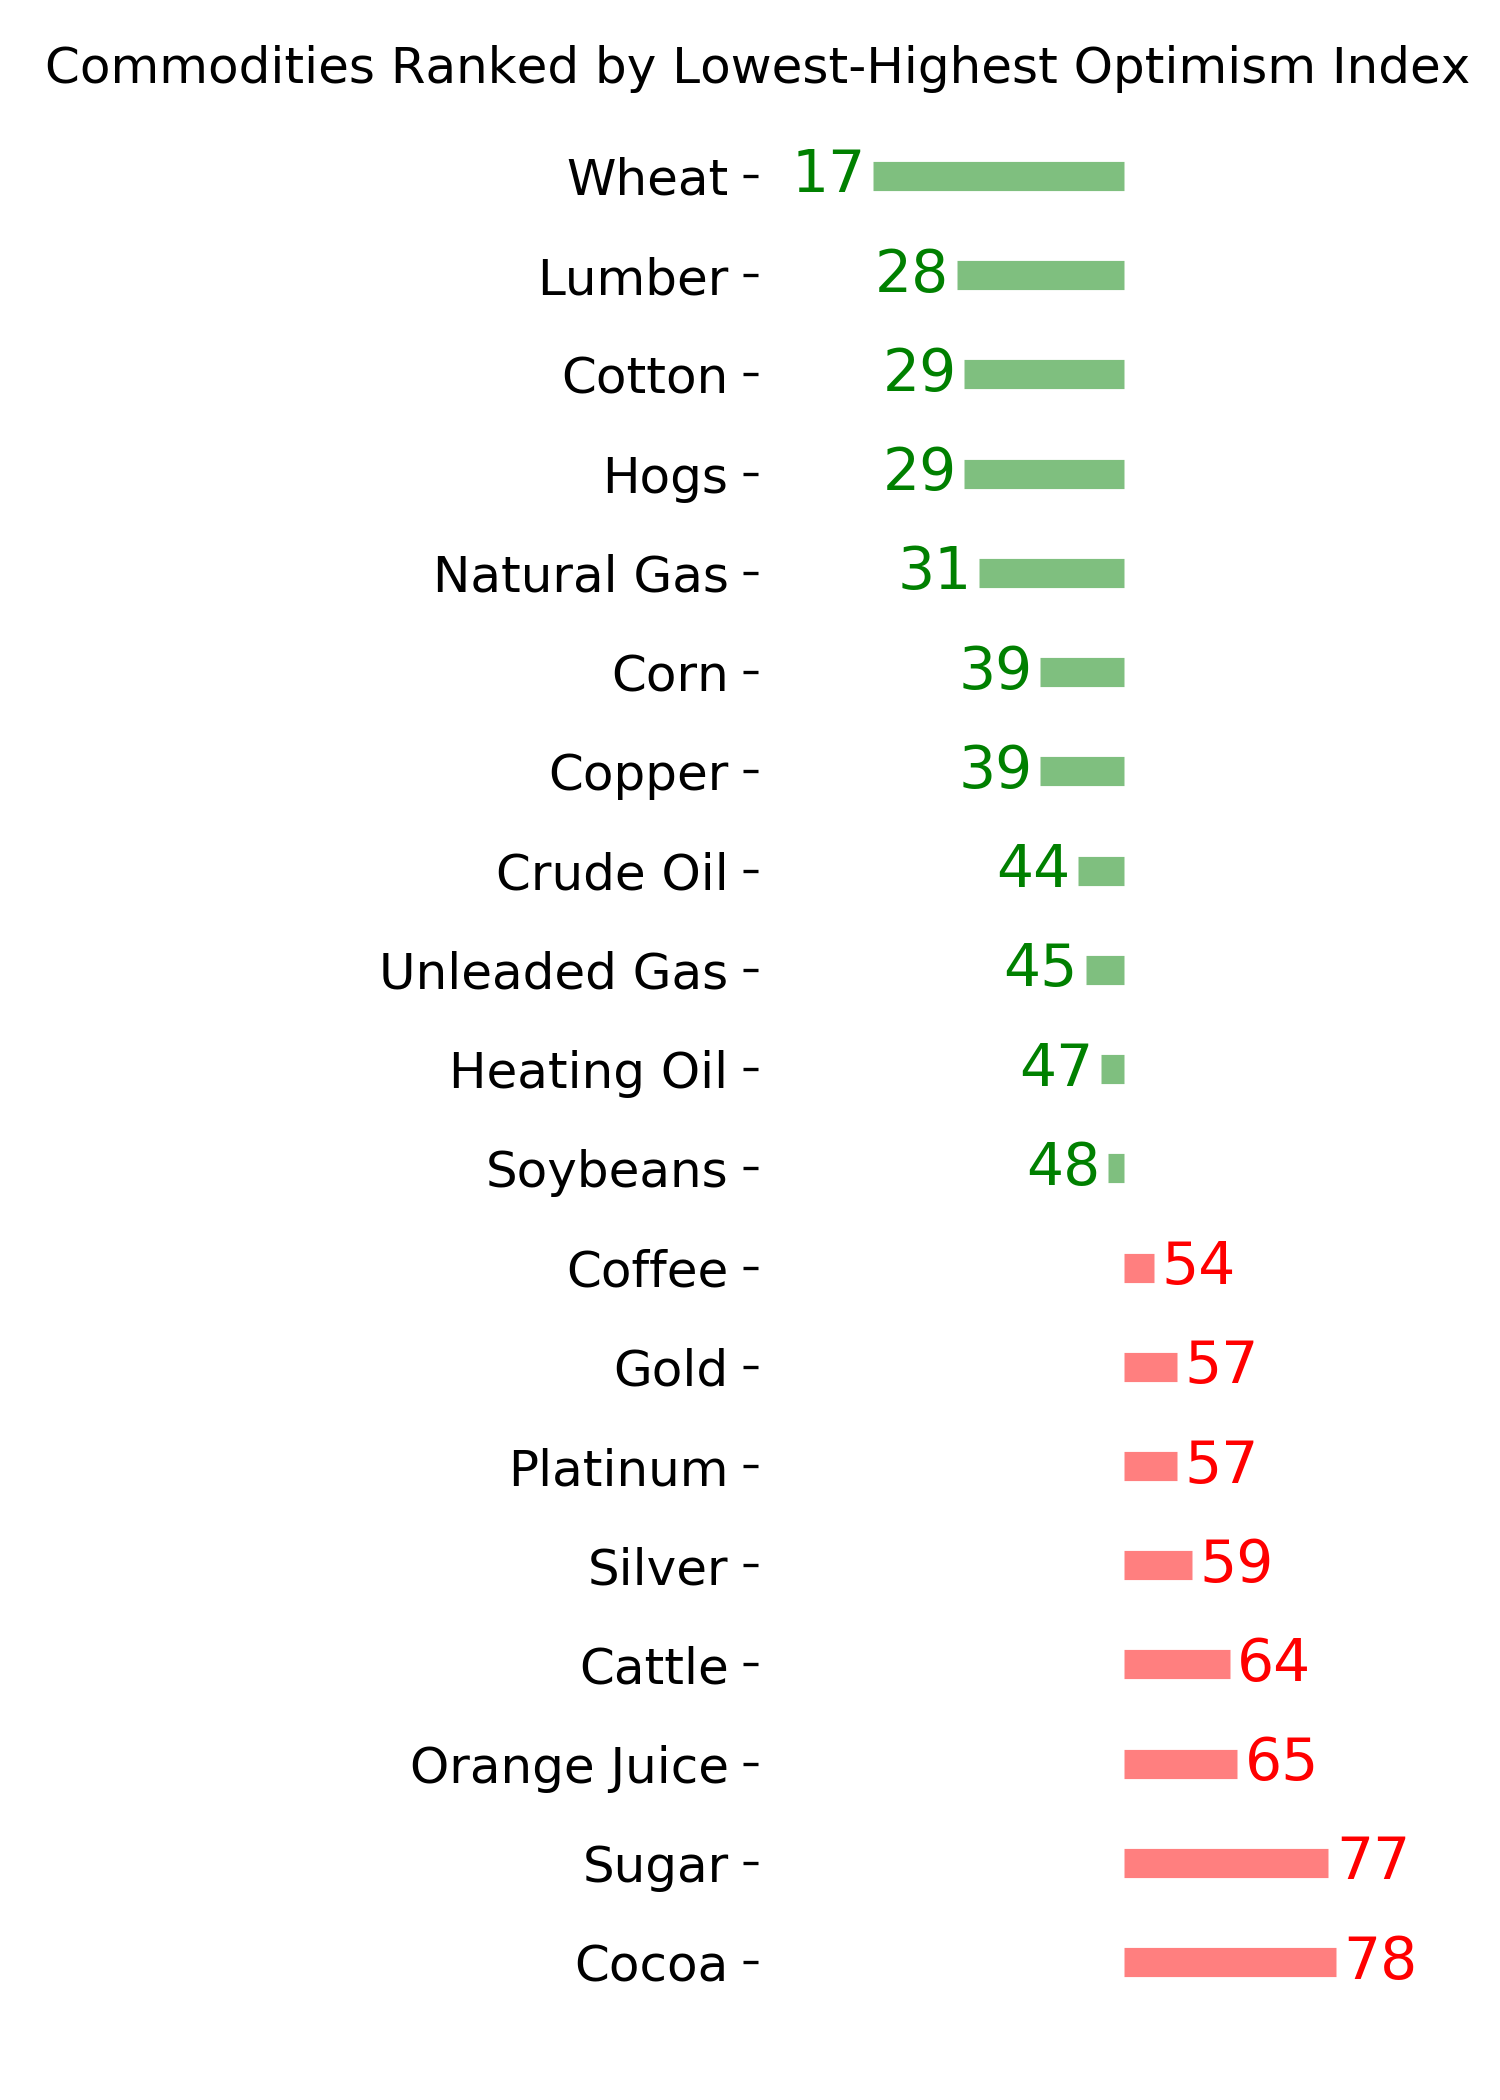
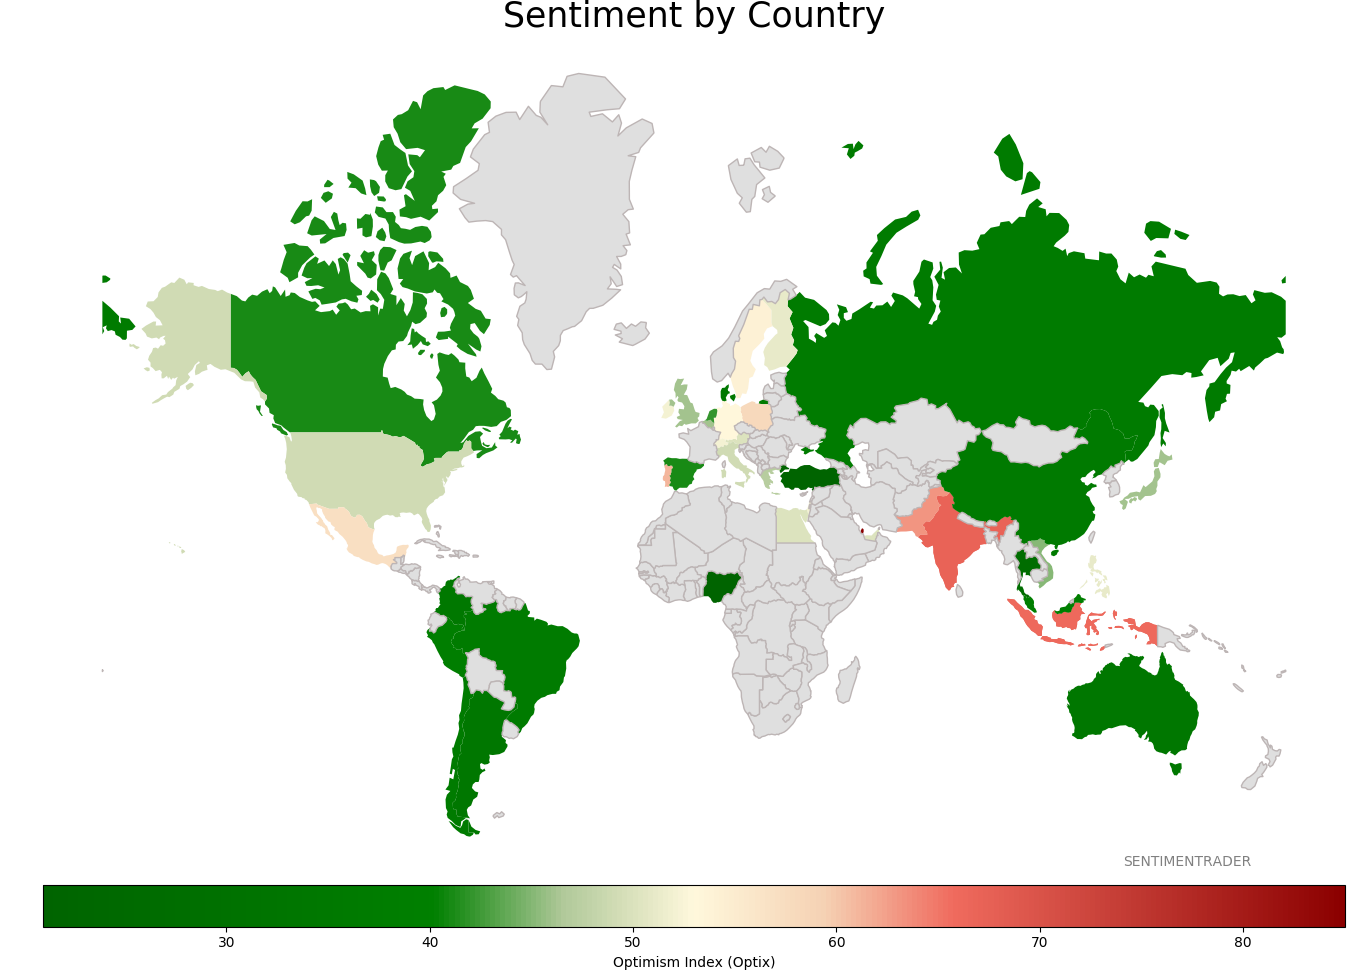
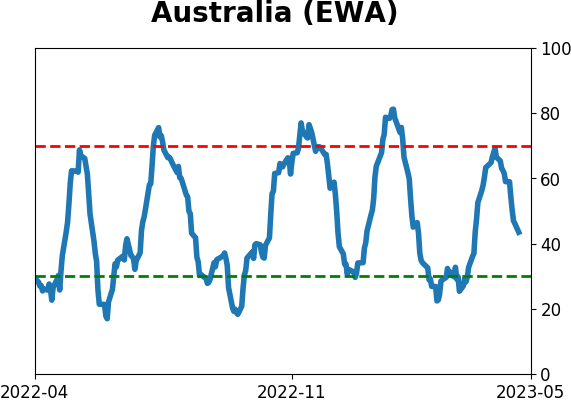
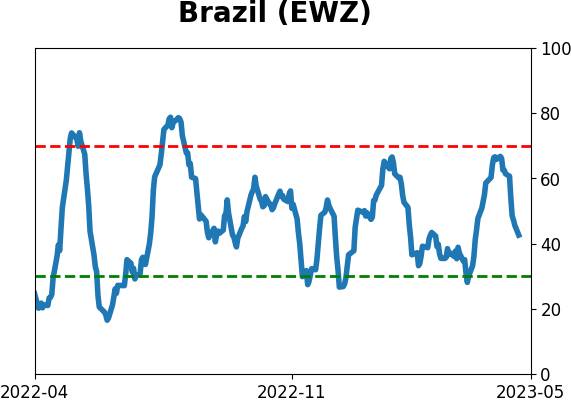
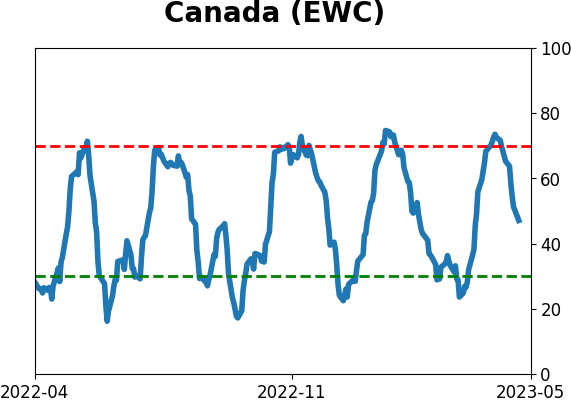
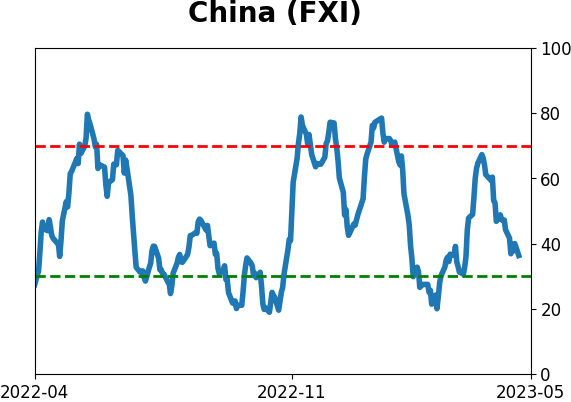
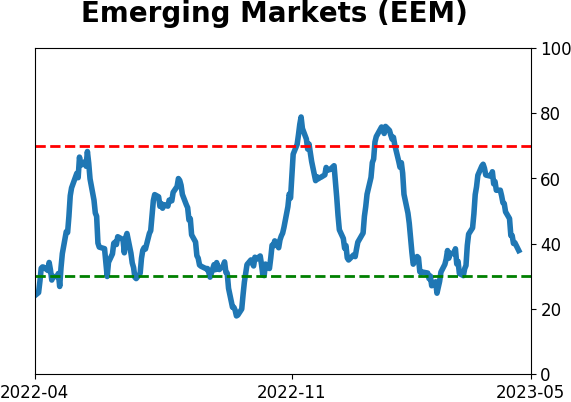
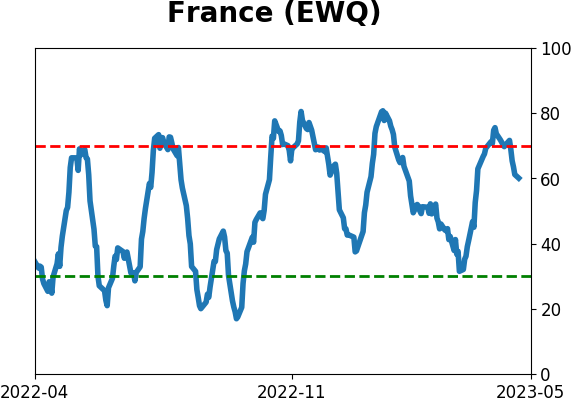
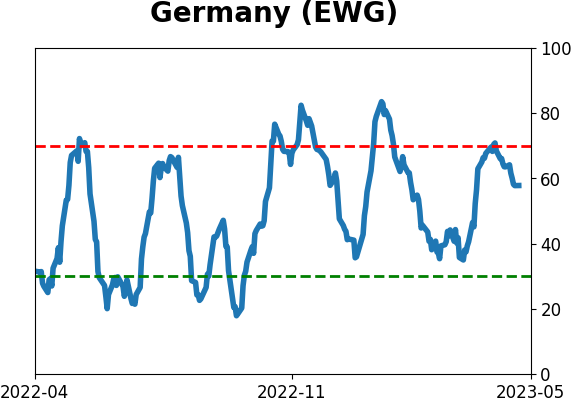
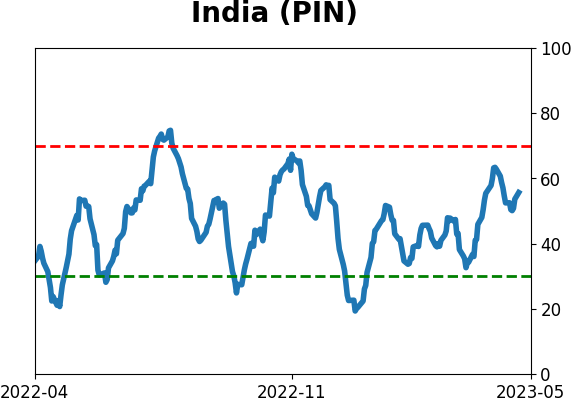
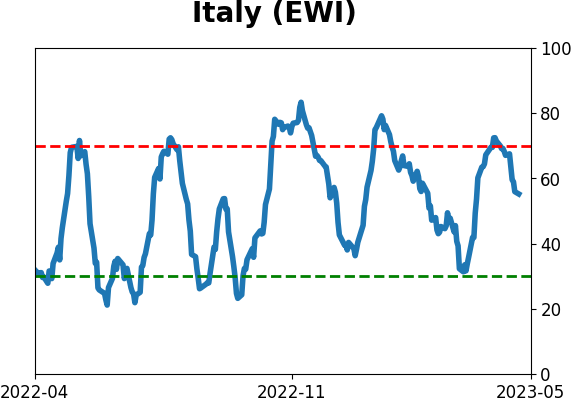
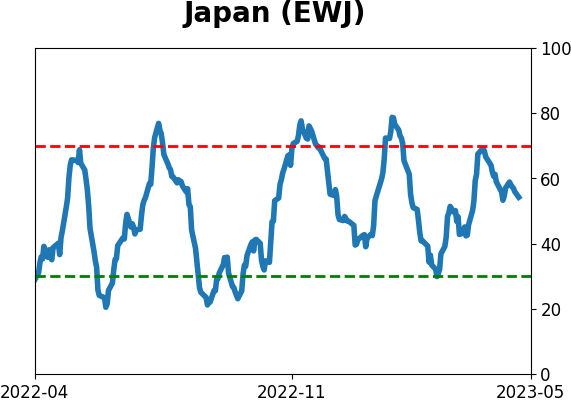
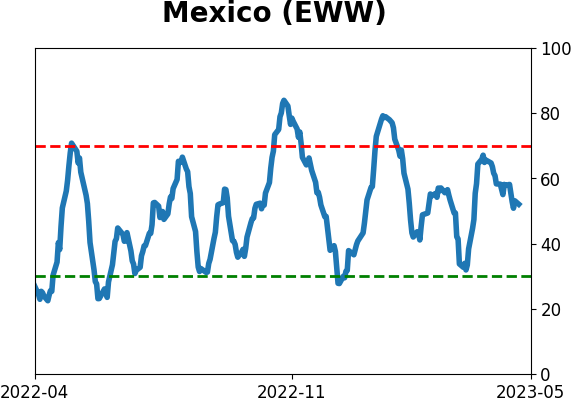
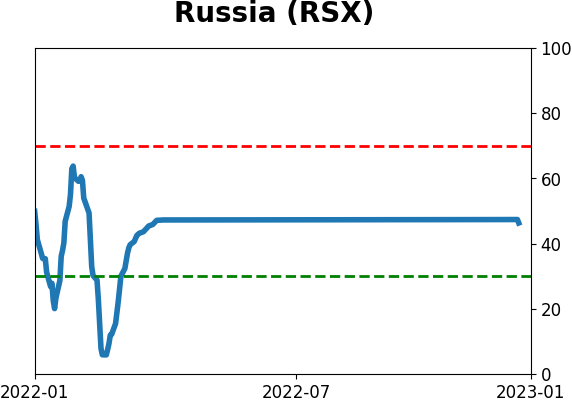
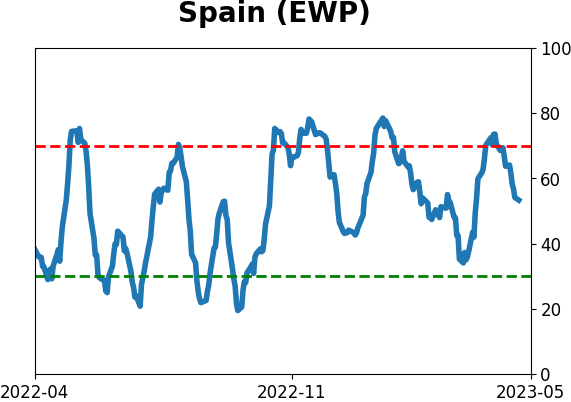
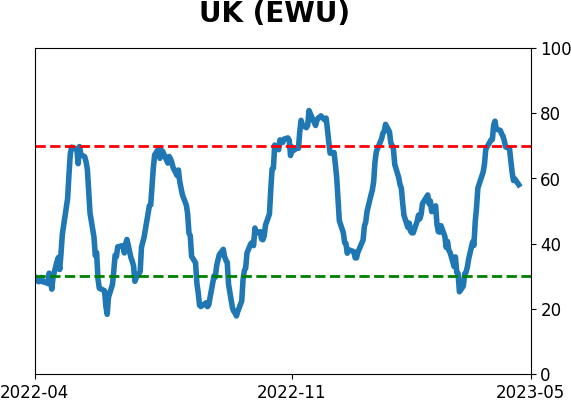
Sentiment Around The World
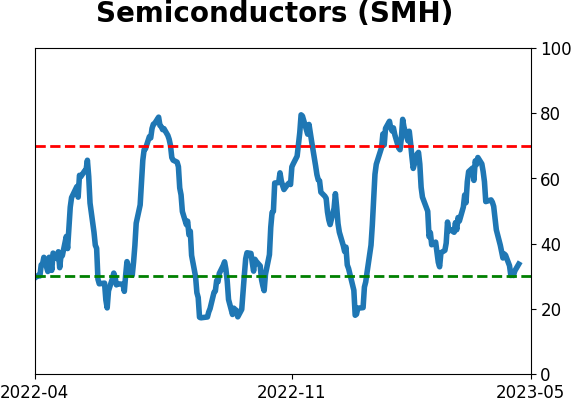
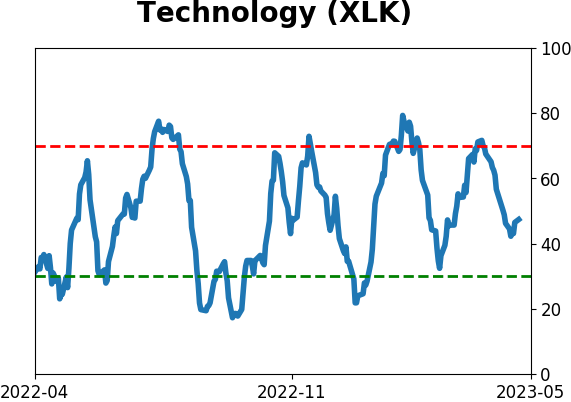
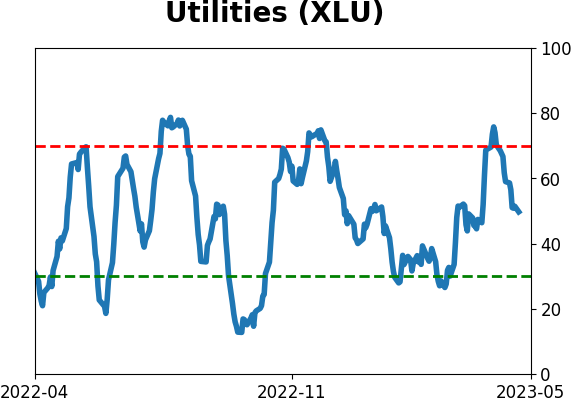
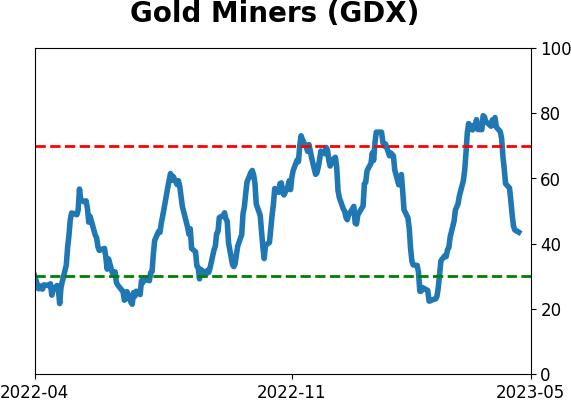
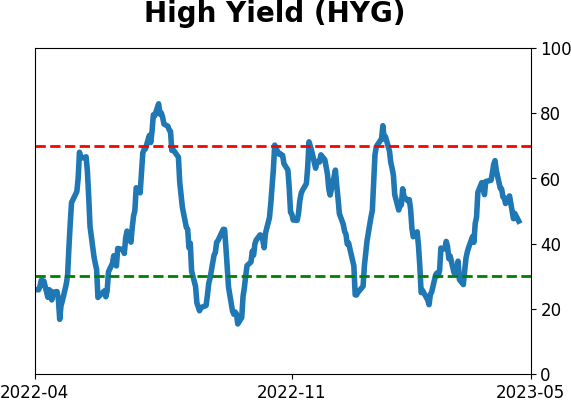
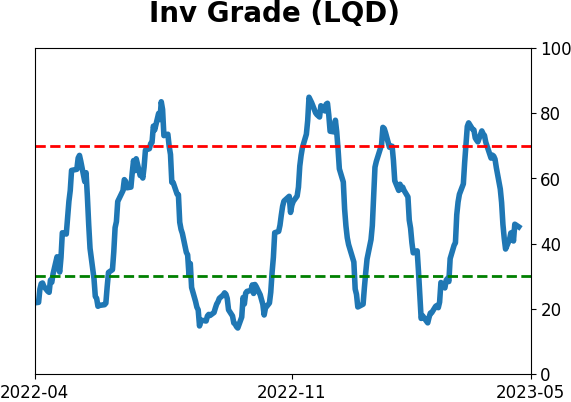
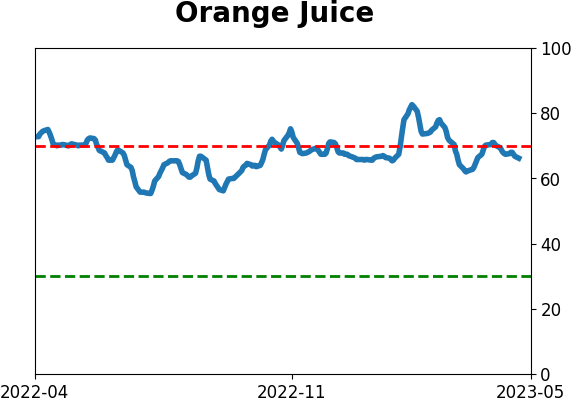
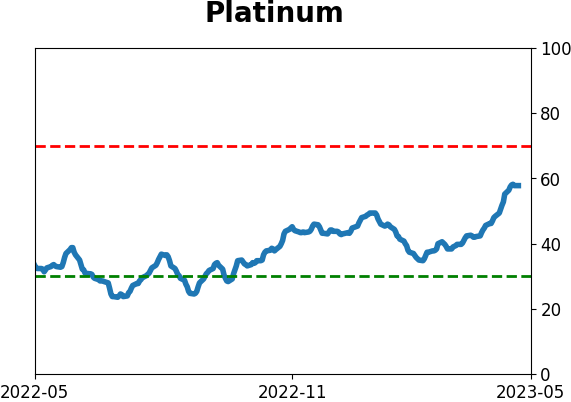
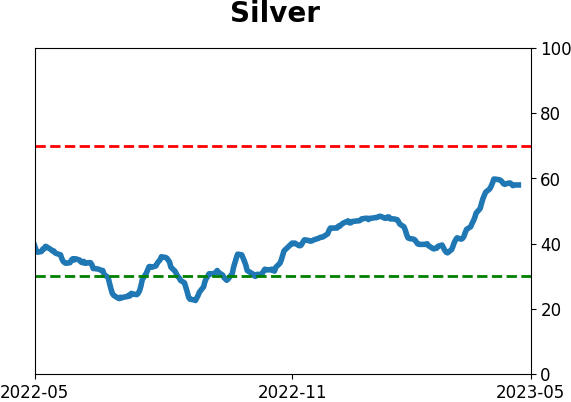
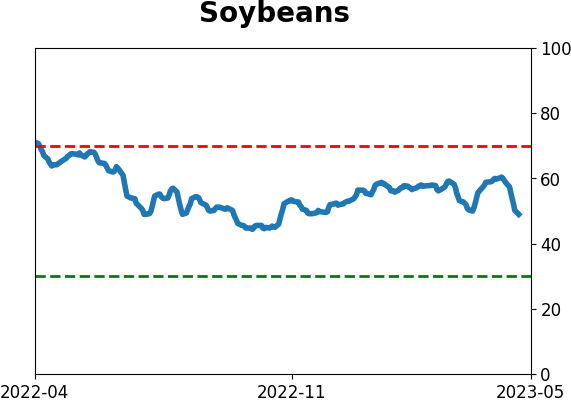
Optimism Index Thumbnails
|
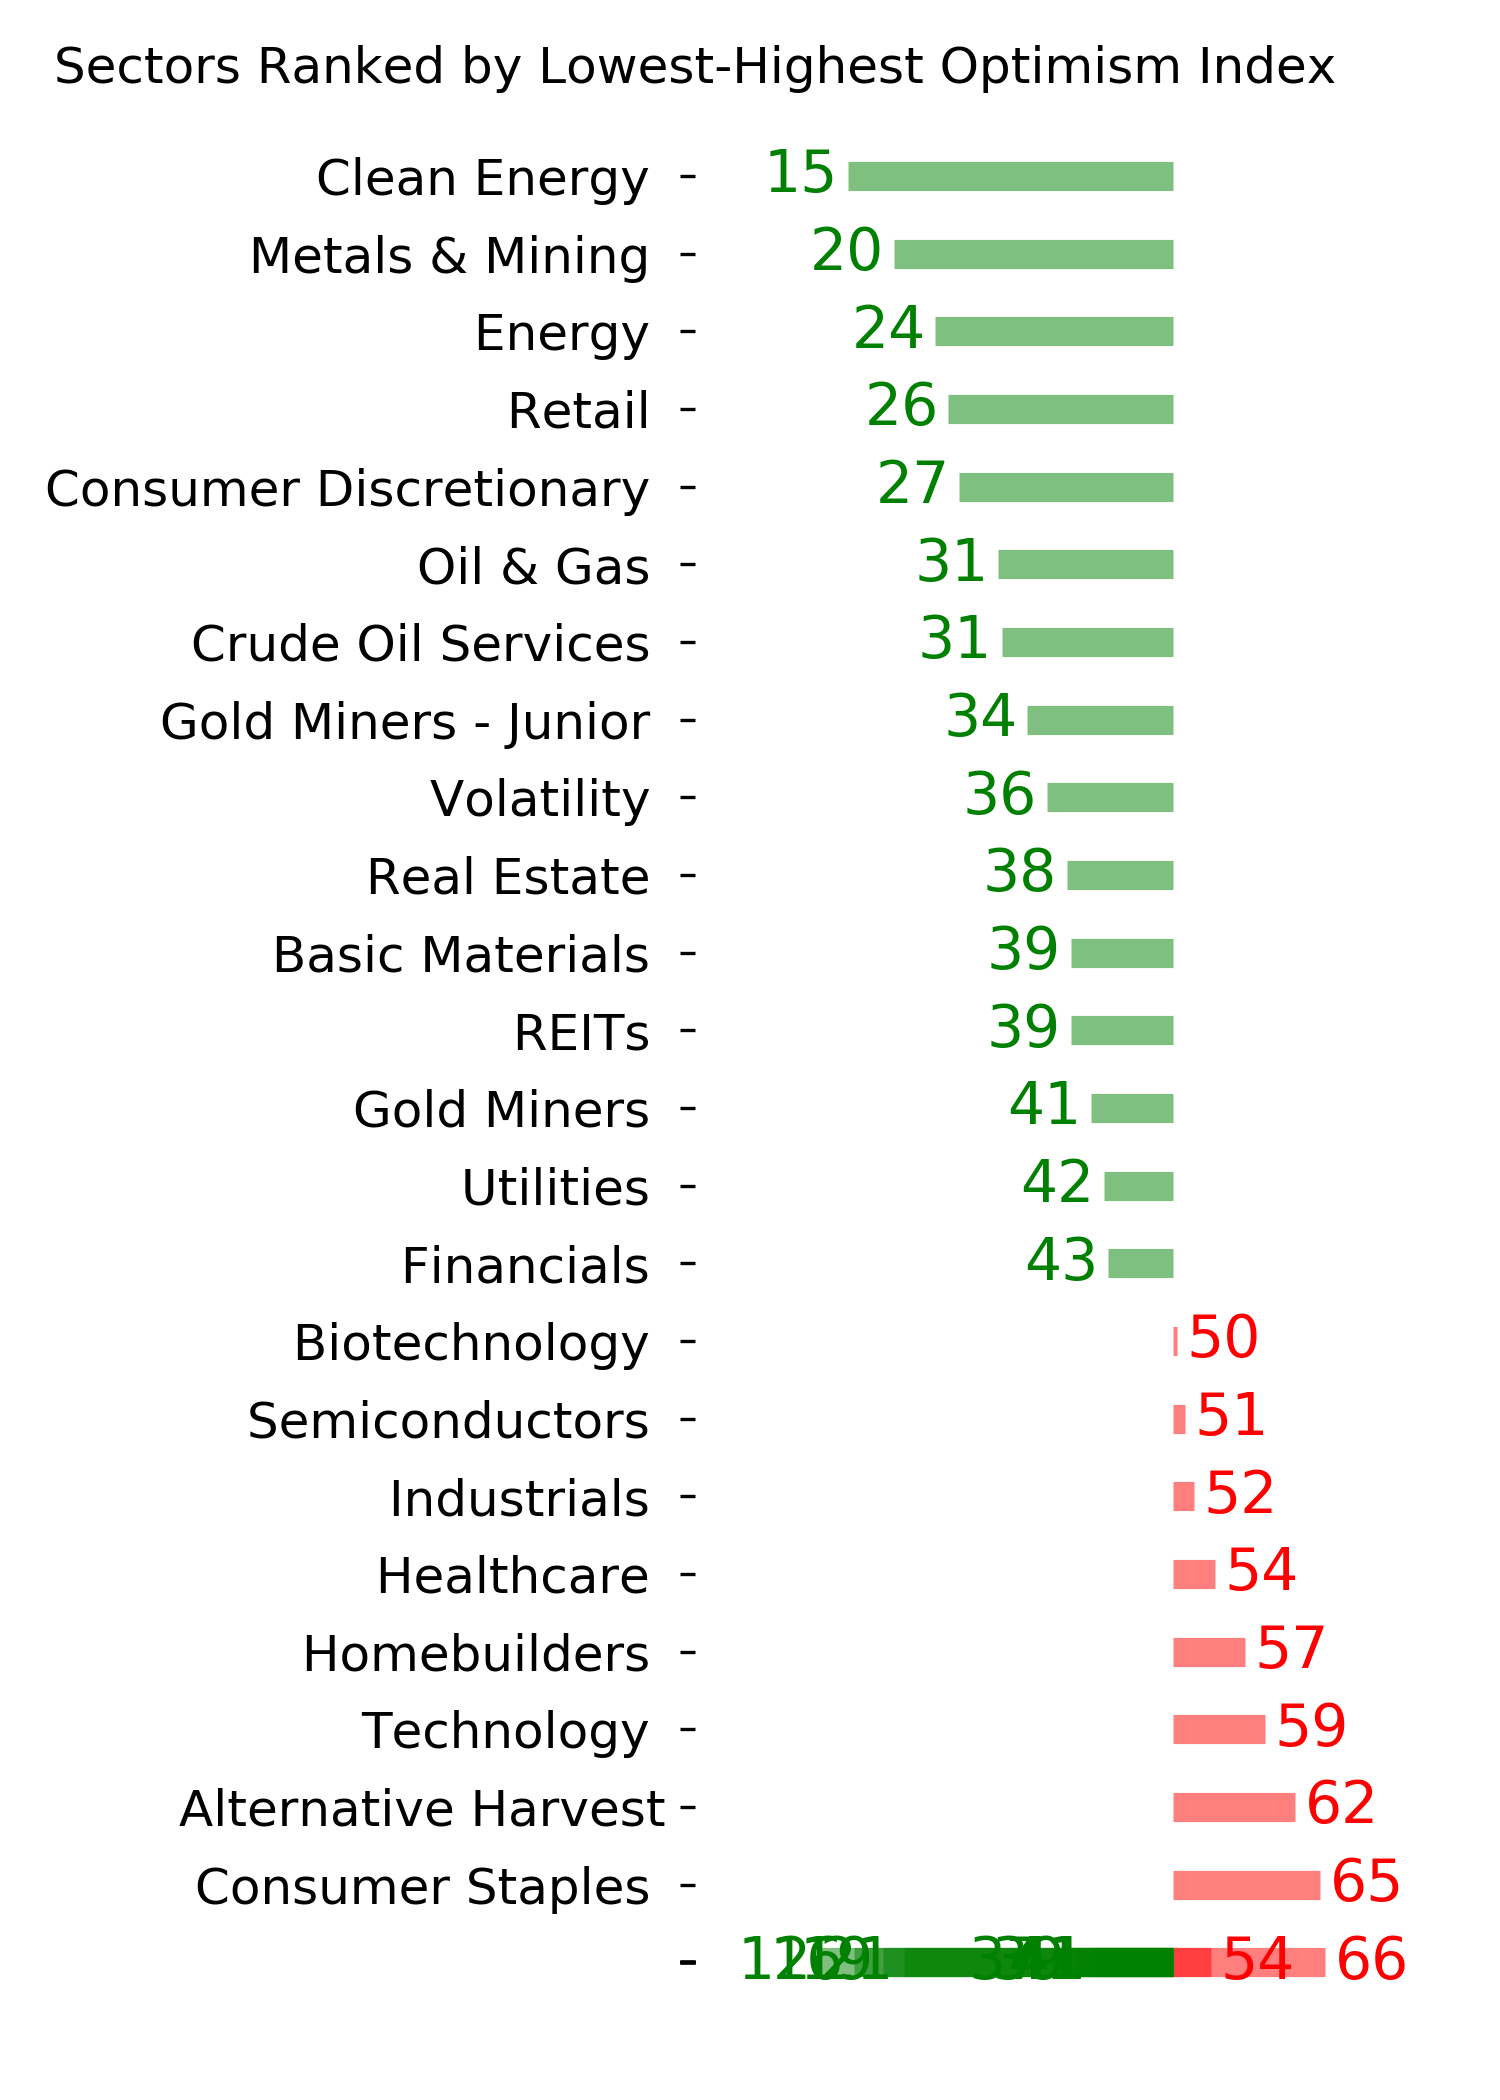
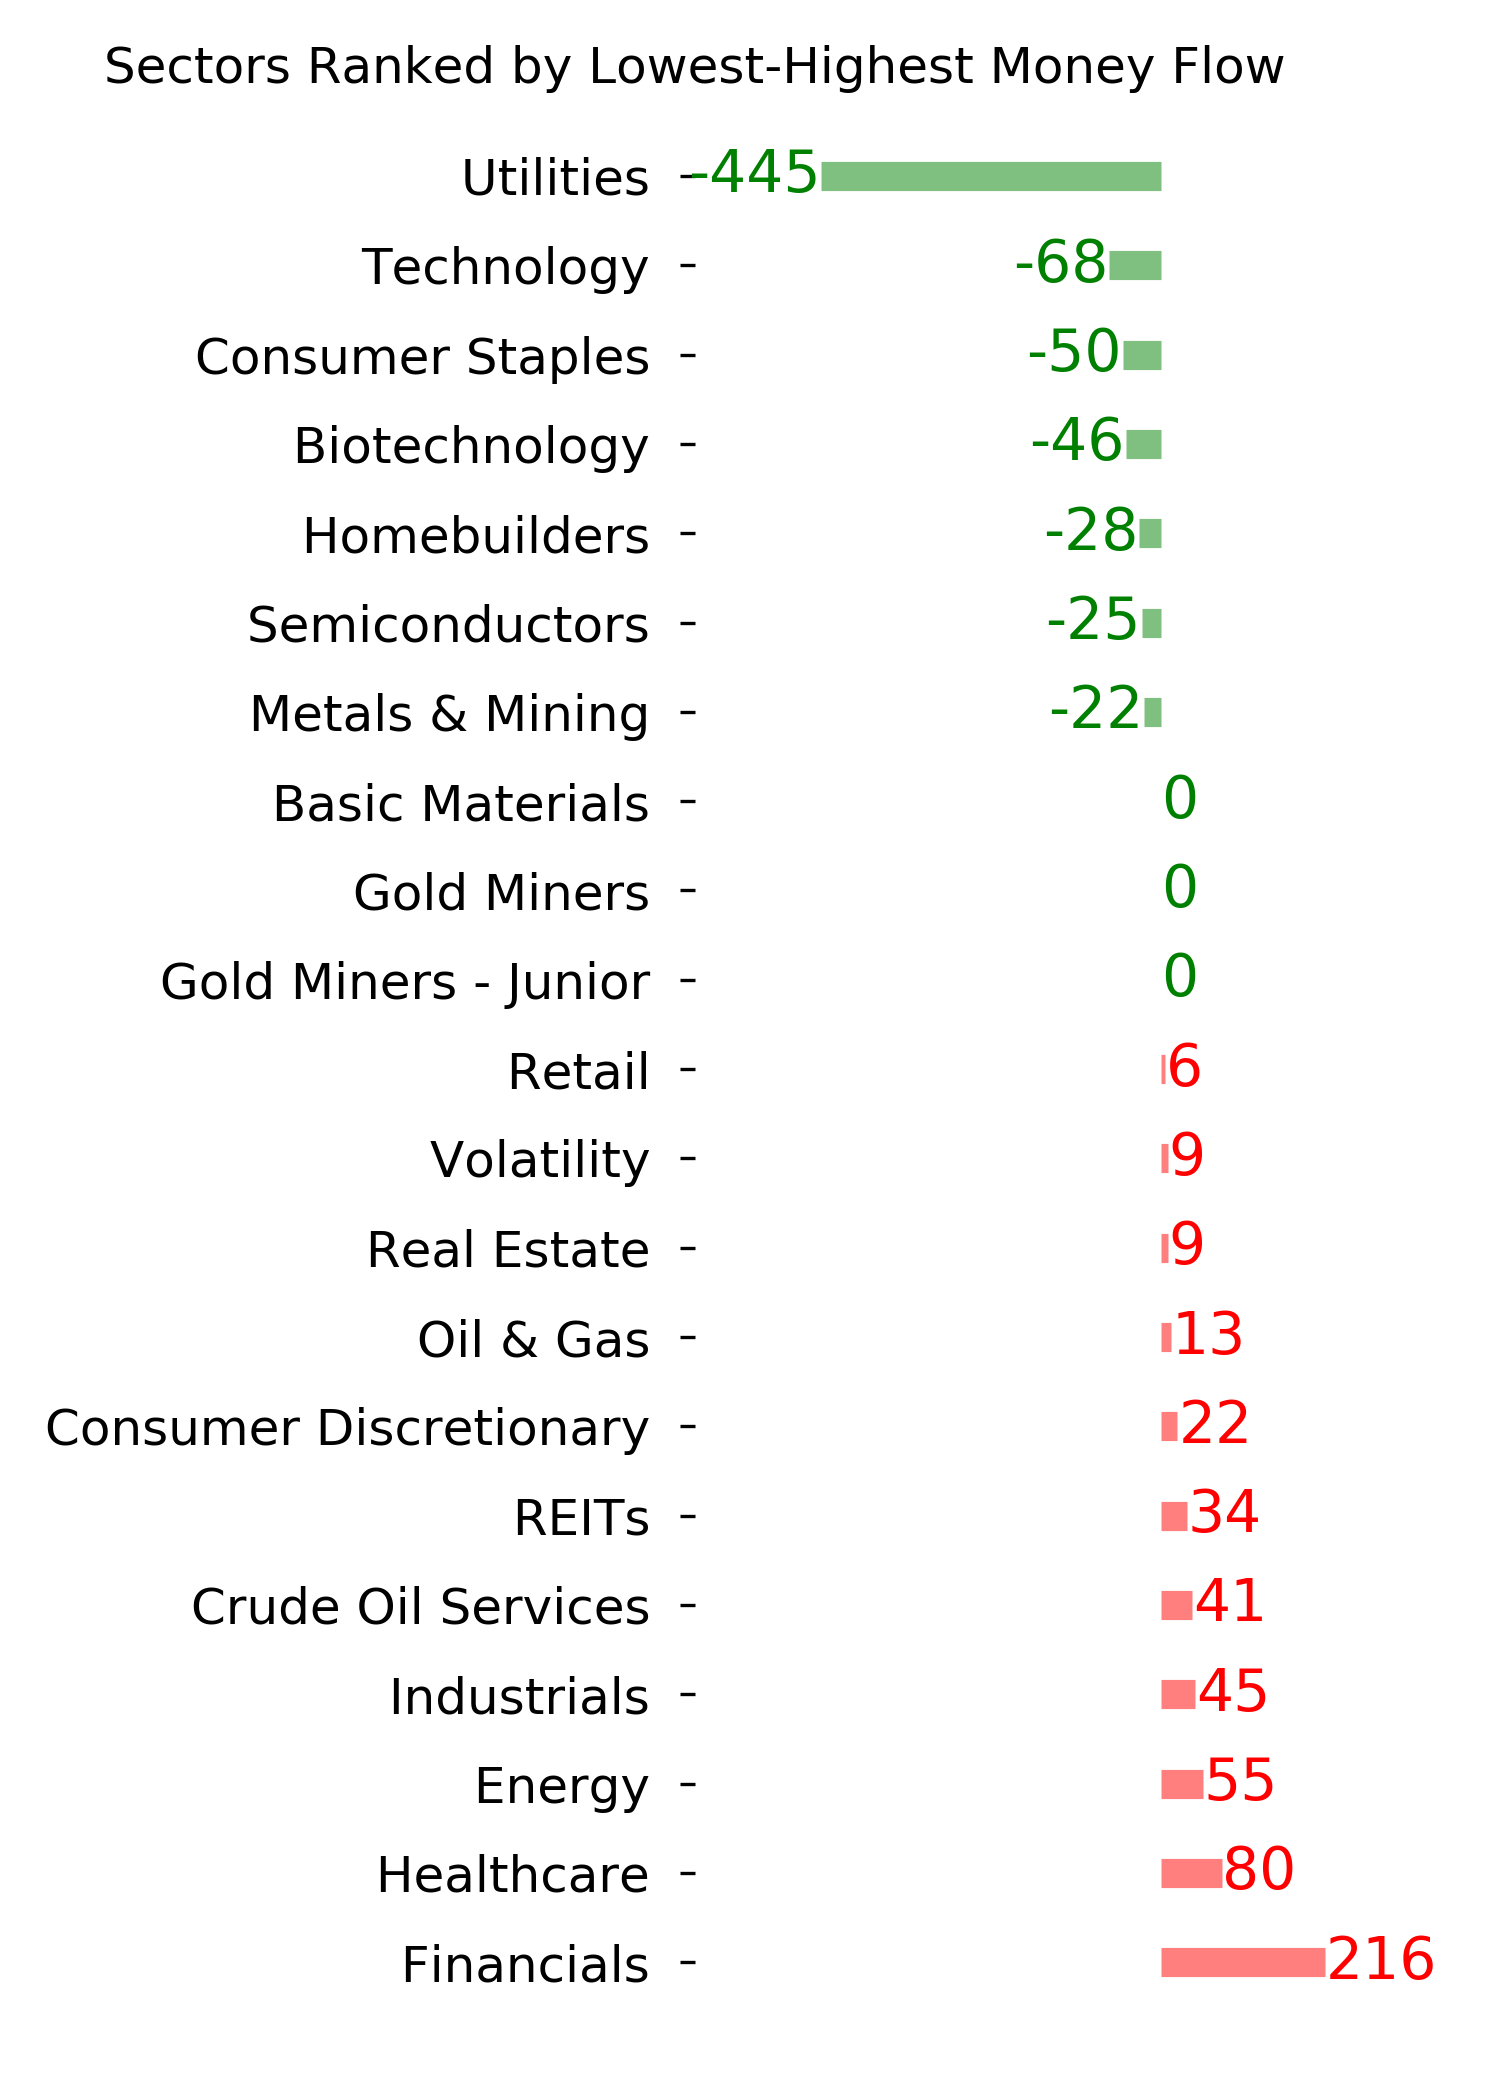
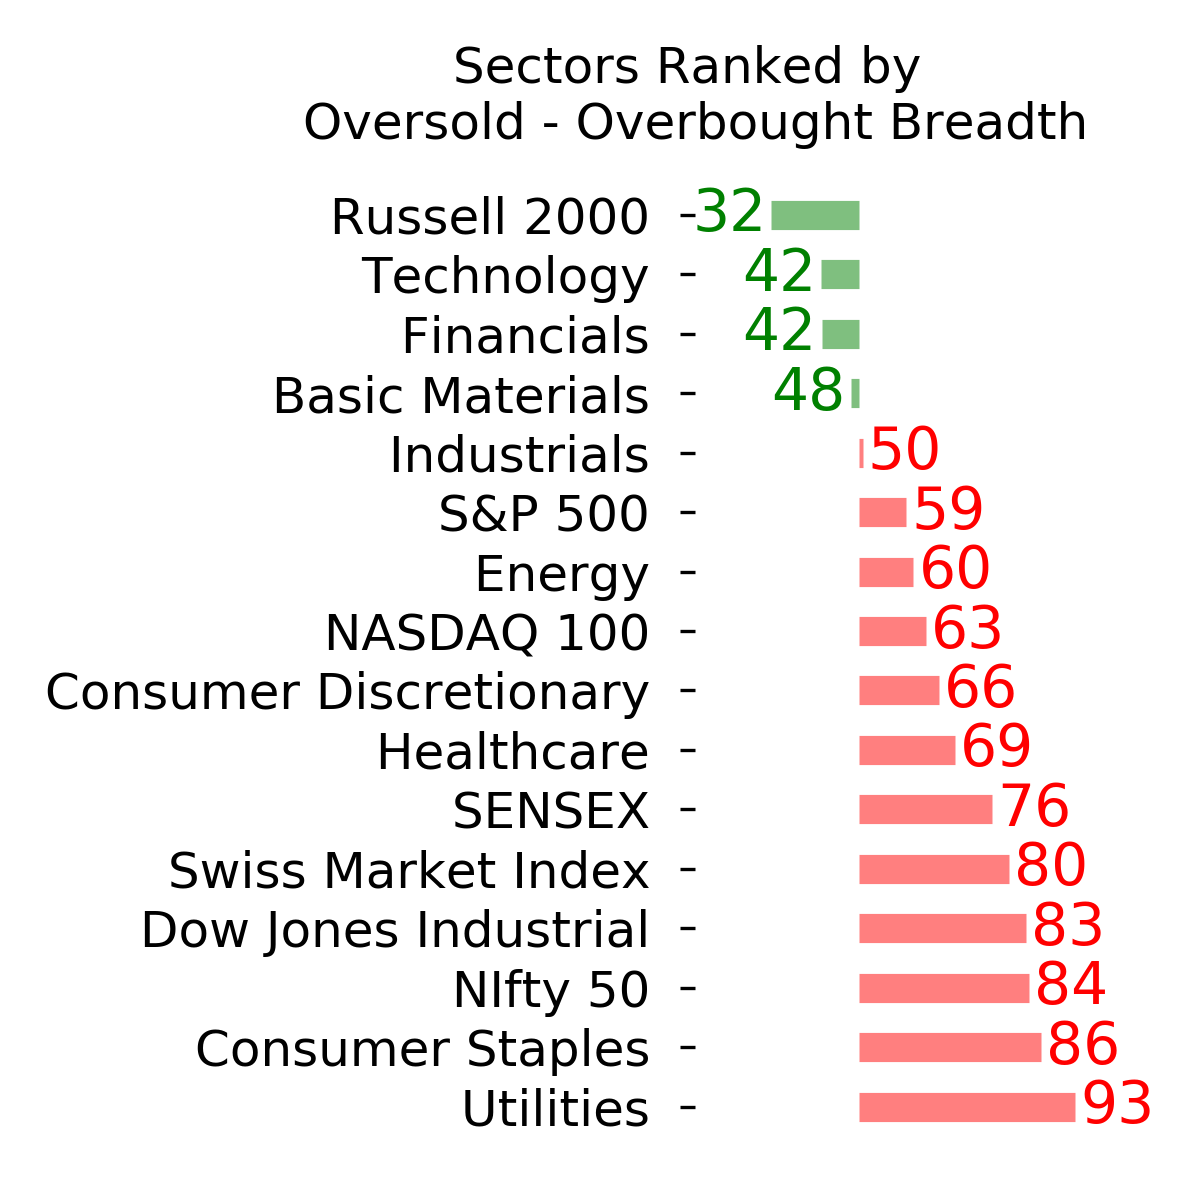
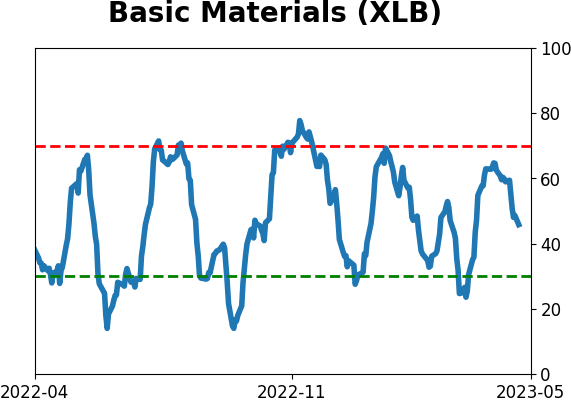
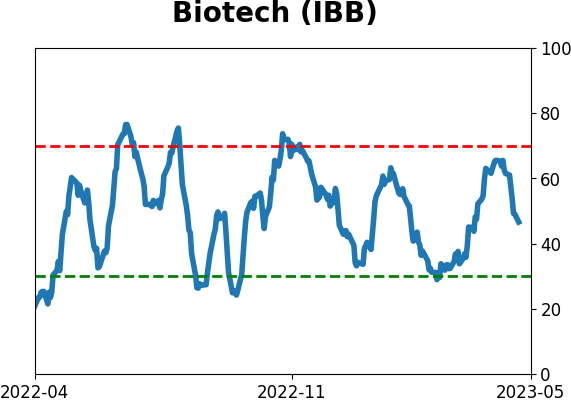
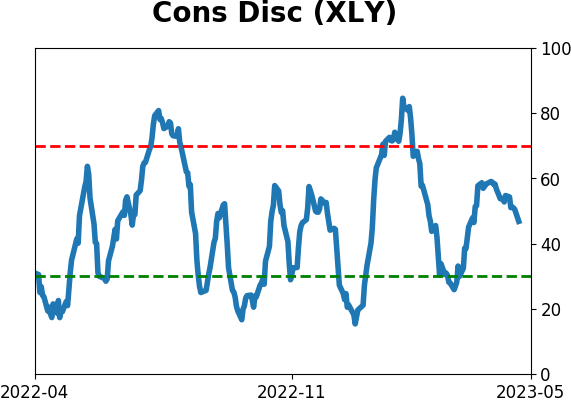
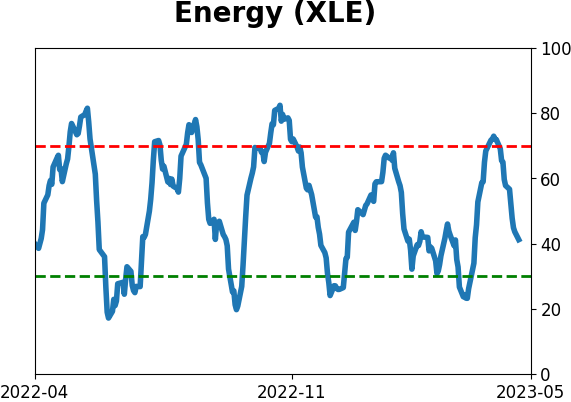
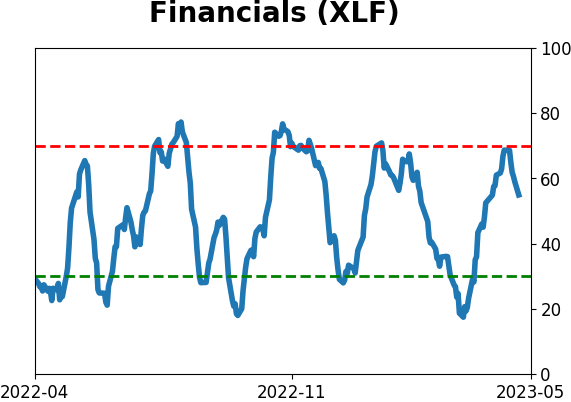
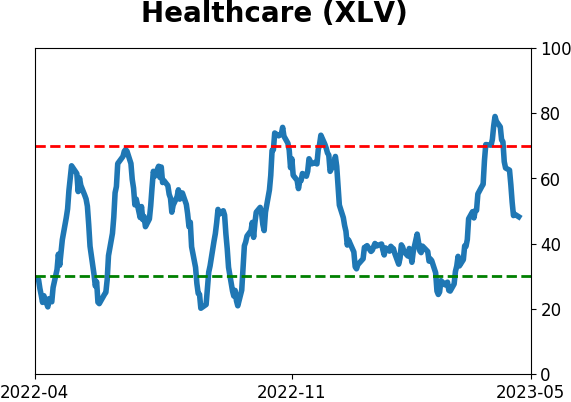
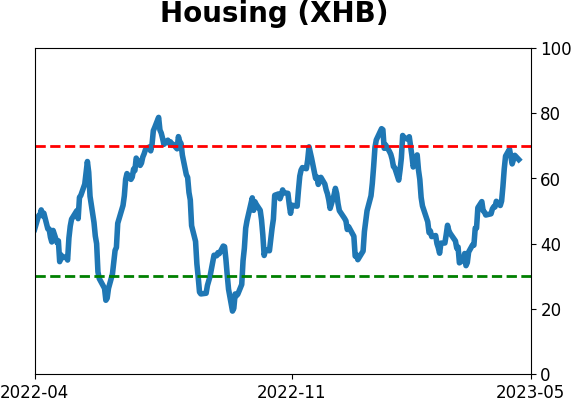
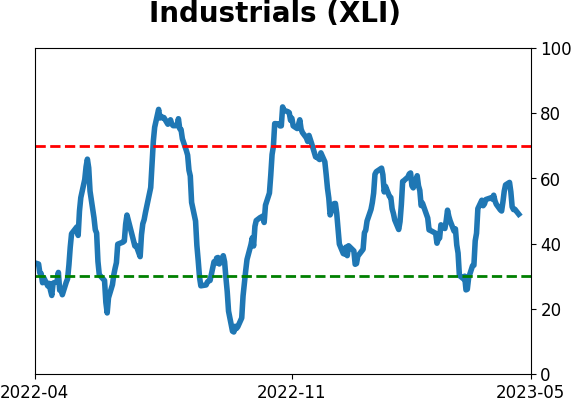
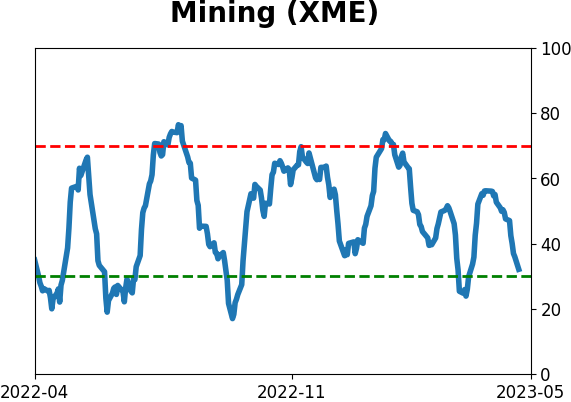
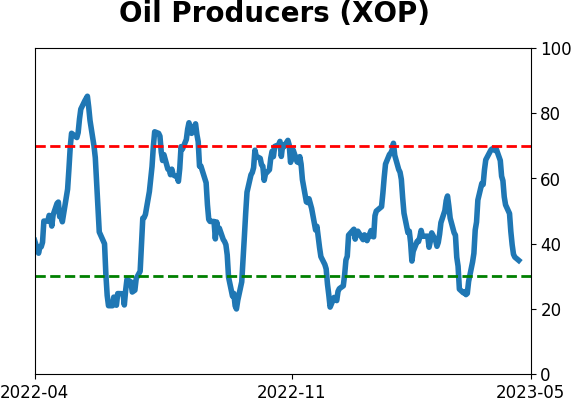
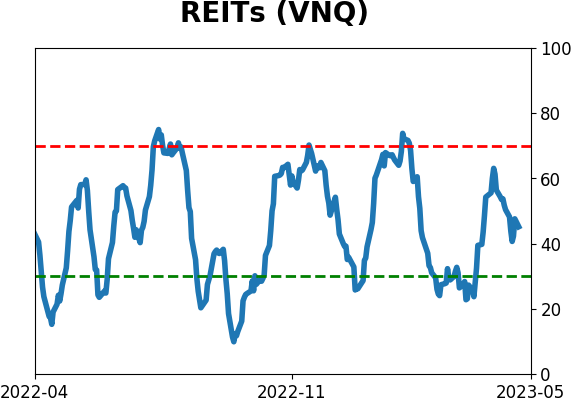
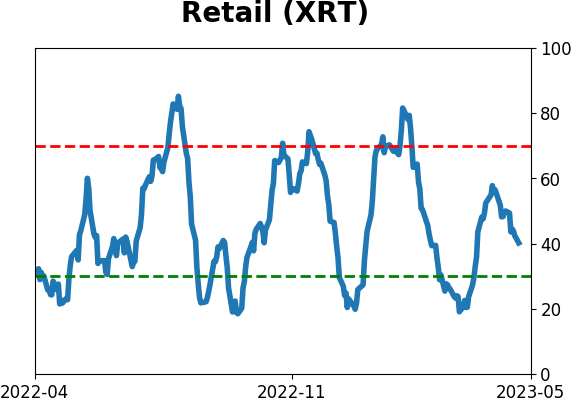
Sector ETF's - 10-Day Moving Average
|
|
|
Country ETF's - 10-Day Moving Average
|
|
|
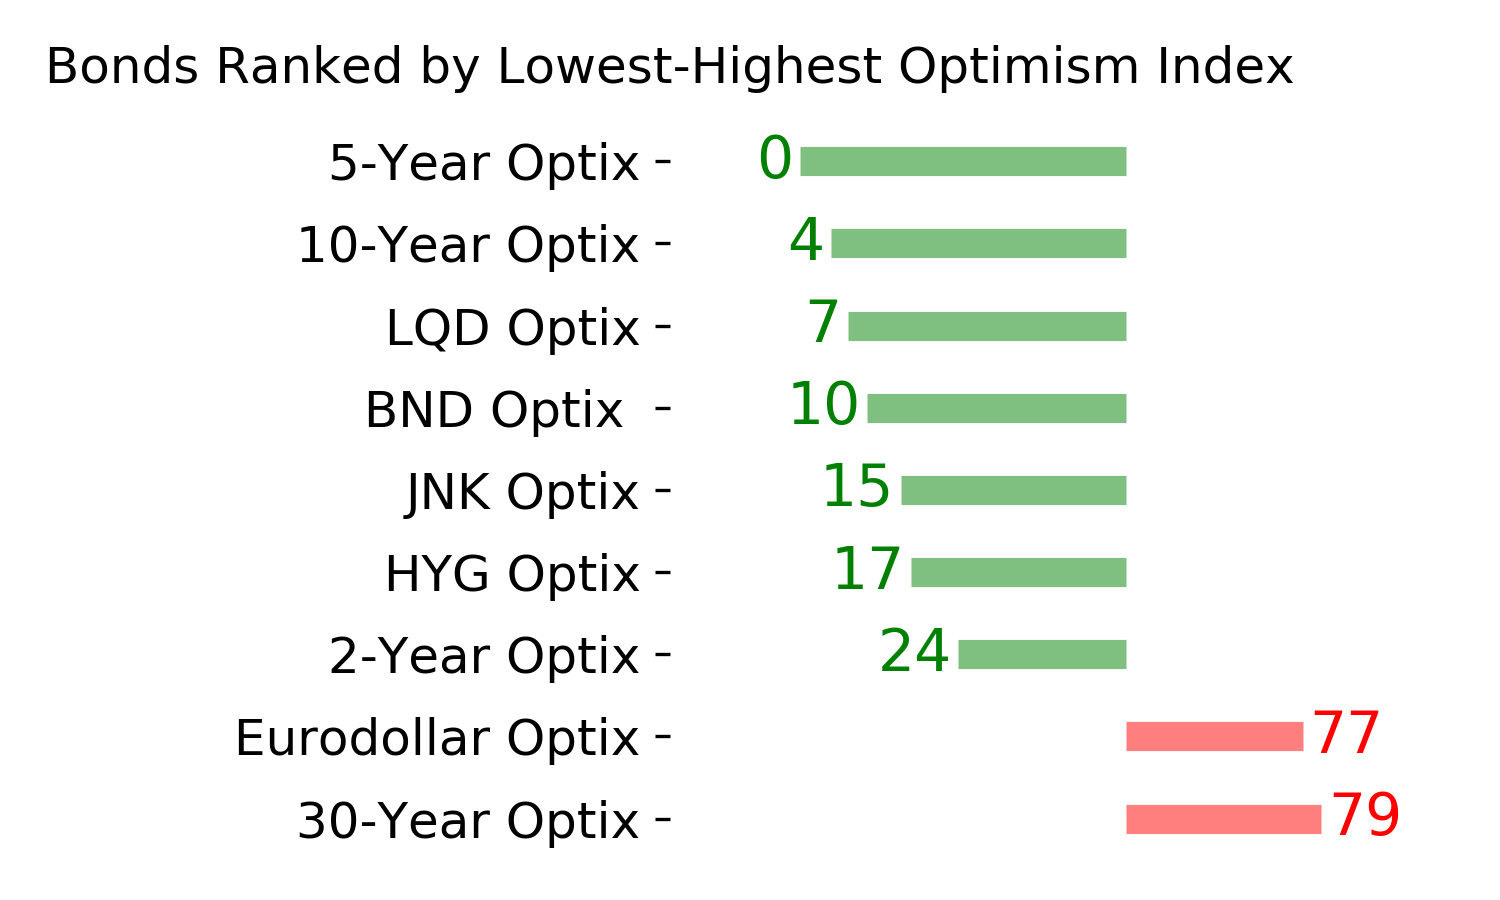
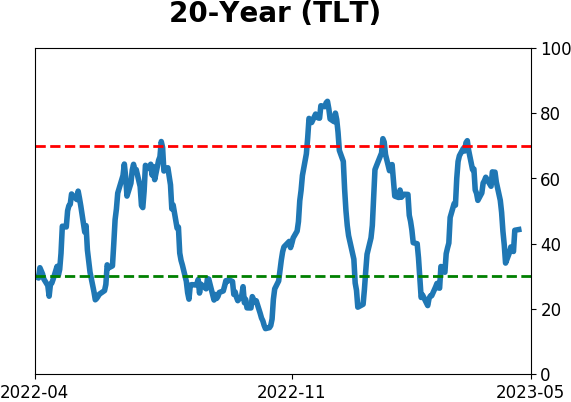
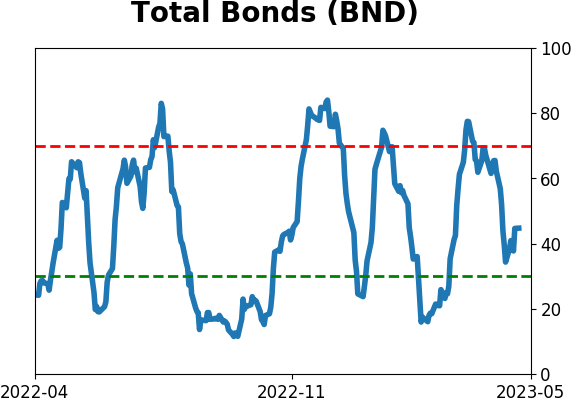
Bond ETF's - 10-Day Moving Average
|
|
|
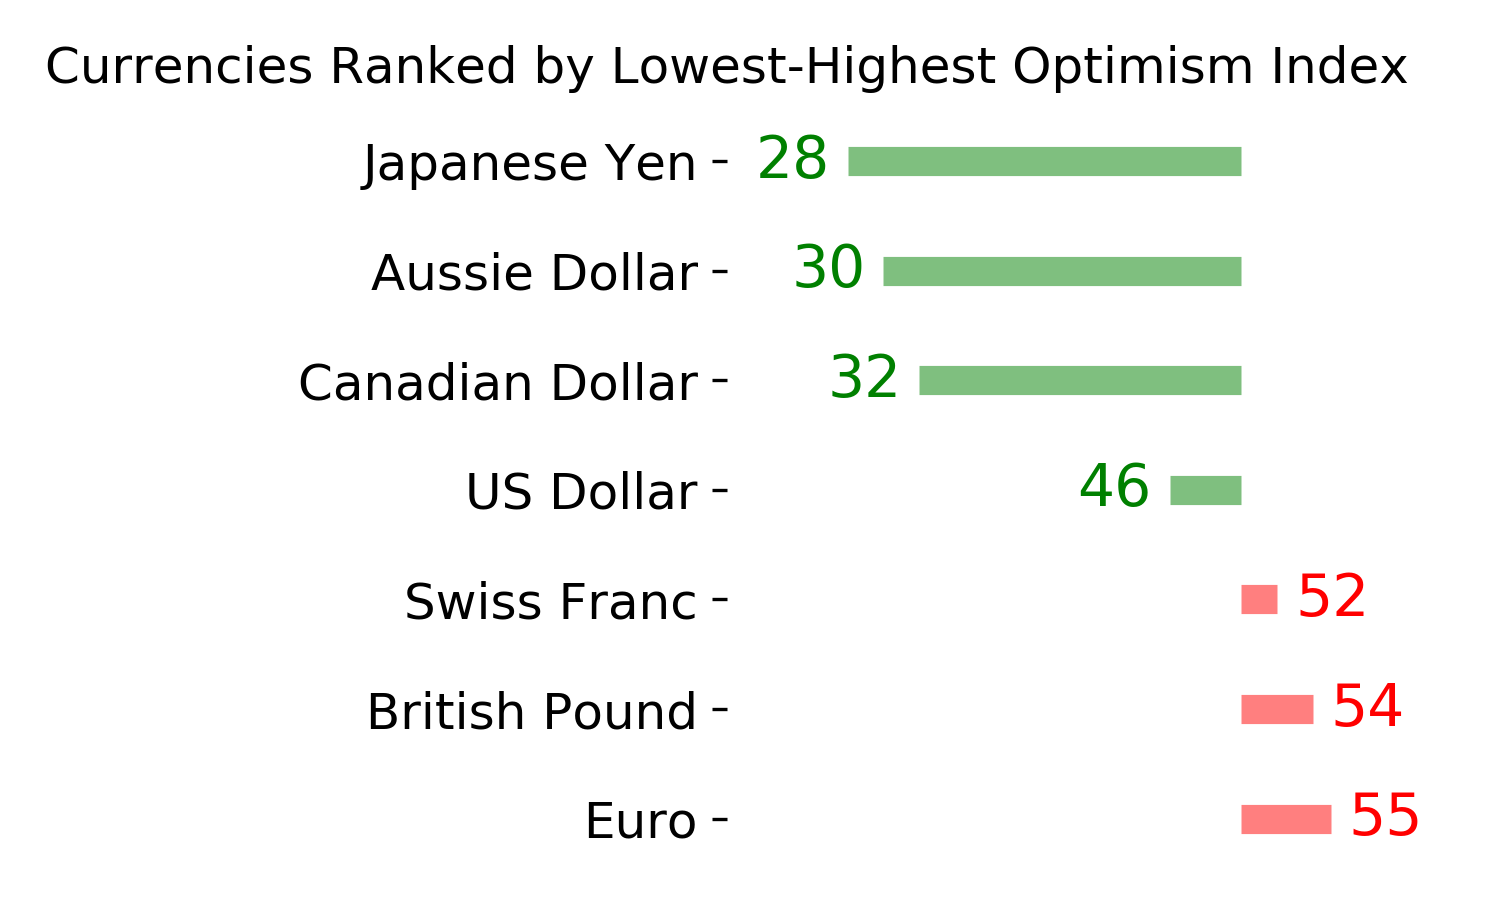
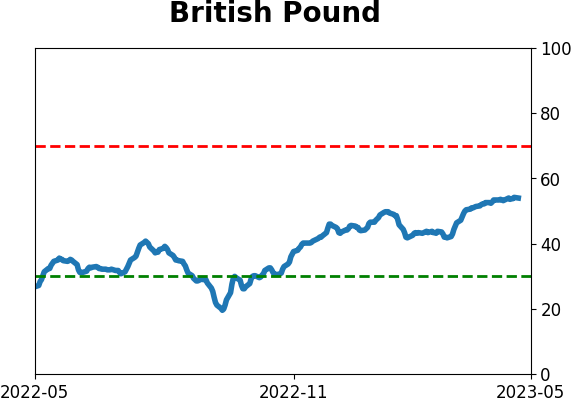
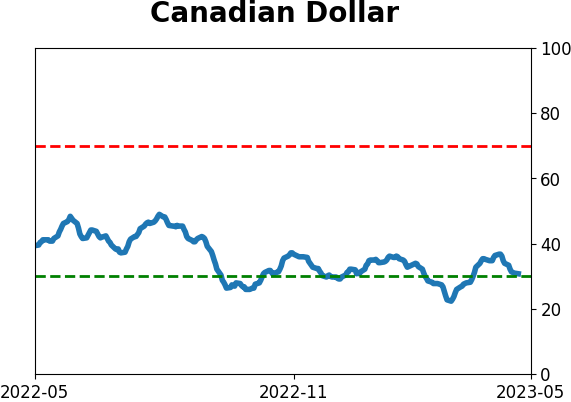
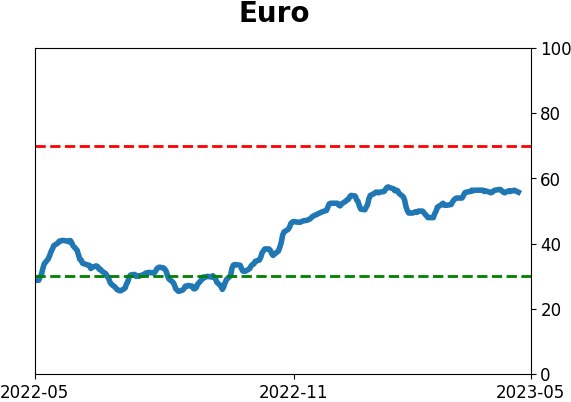
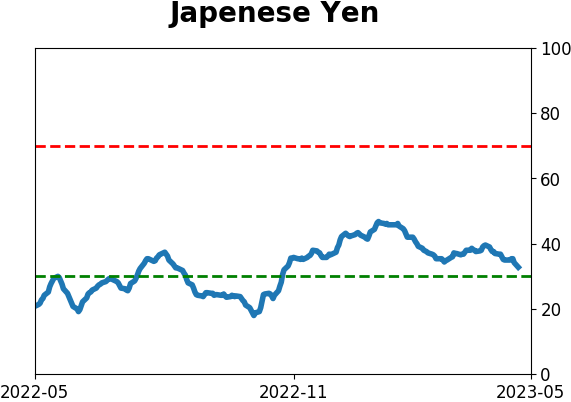
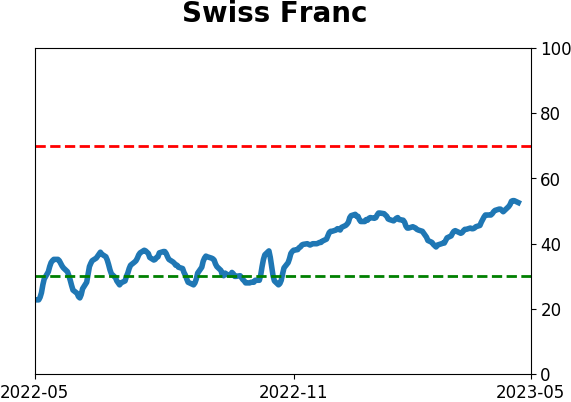
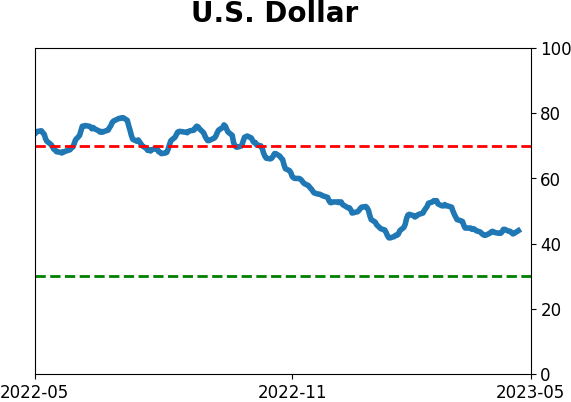
Currency ETF's - 5-Day Moving Average
|
|
|
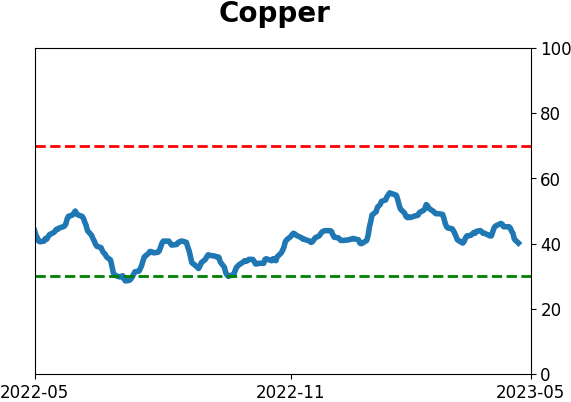
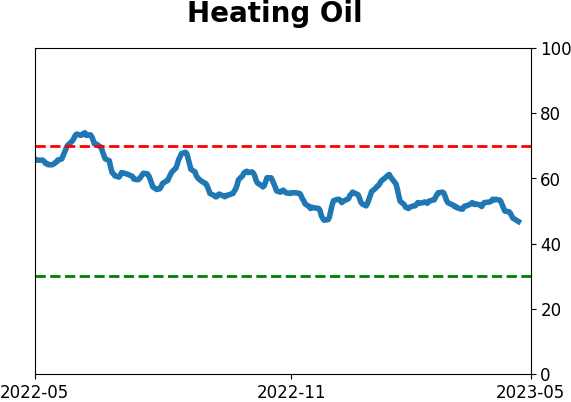
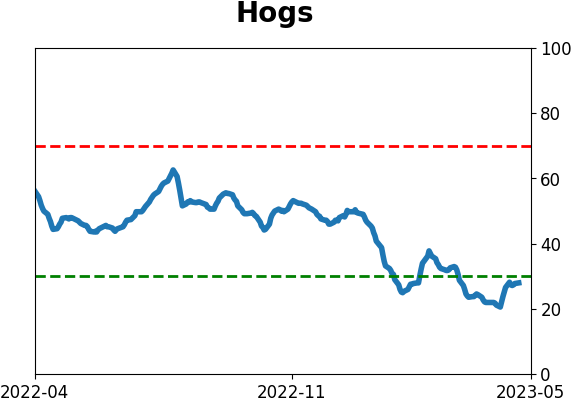
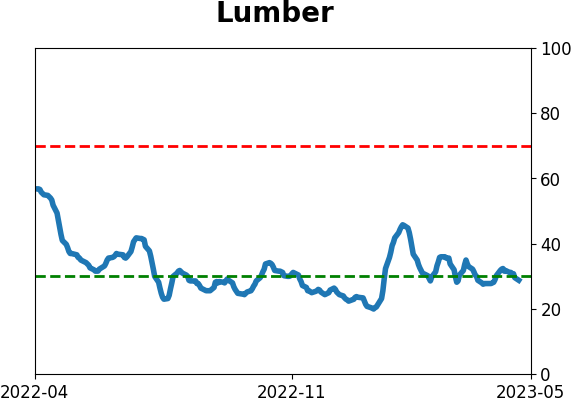
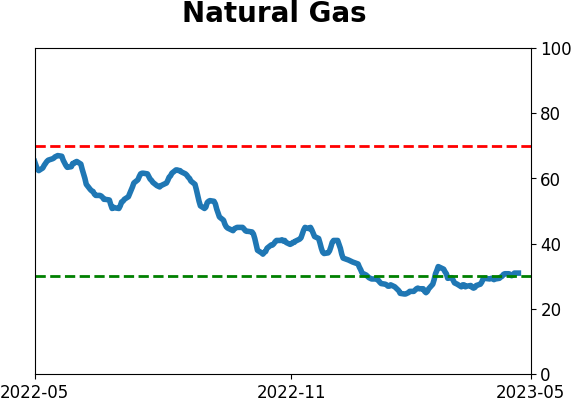
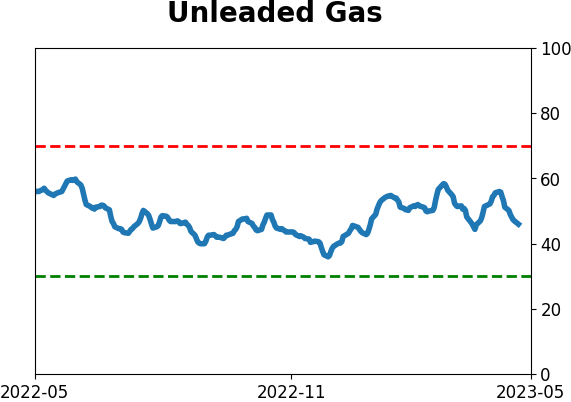
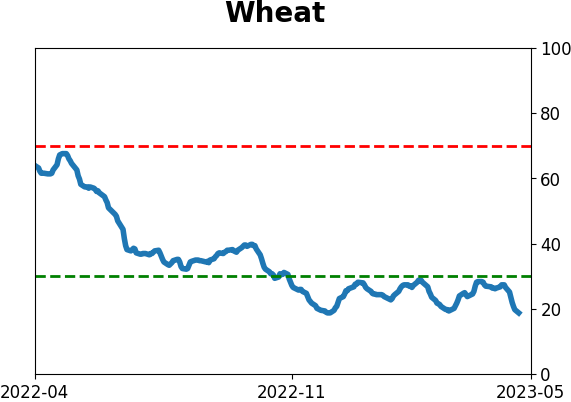
Commodity ETF's - 5-Day Moving Average
|
|