Daily Report : TradingEdge Weekly for Apr 29 - Momentum ebbs, sentiment turns worse, the dollar keeps surging

| View/Print a PDF version of this Report |
Headlines
|
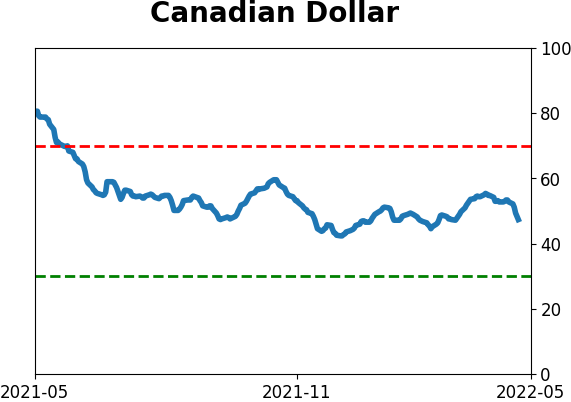
TradingEdge Weekly for Apr 29 - Momentum ebbs, sentiment turns worse, the dollar keeps surging: This week, we saw more deterioration among industries, contributing to a plunge in Big Money sentiment. More economic reports are deteriorating, too, just as the Equity Risk Premium dropped to a decade low. The bond market is about to enjoy a better seasonal tailwind, while gold miners cycled from one extreme to the other and copper momentum turned negative. The latest Commitments of Traders report was released, covering positions through Tuesday: The 3-Year Min/Max Screen shows that "smart money" commercial hedgers established only a couple of new extremes this week. Notably, they're now holding a net short position of less than 6% of the open interest in platinum, which has preceded decent long-term rallies in the metal with the exception of mid-2001. Disappointing to stock bulls, hedgers continued to sell major equity index futures and how hold about $51 billion worth of contracts net short. As we've been noting for almost two years, though, this data (for stocks) started to act screwy after the pandemic and it's probably wise to weigh it less than we have in the prior decade. Also surprising, hedgers appeared to capitulate in 10-year Treasury futures and sold positions heavily. While it's easy to be snarky, these are asset managers with massive positions in other markets and own tremendous amounts of underlying notes and bonds. Treasuries tend to bottom when hedgers build up a large net long positon and then start to reverse them, so this may actually be a positive for that market. In currencies, hedgers increased their long exposure to the British pound and now hold more than 32% of the open interest net long. The Backtest Engine shows decent two-month returns after they accumulated this large of a position. |
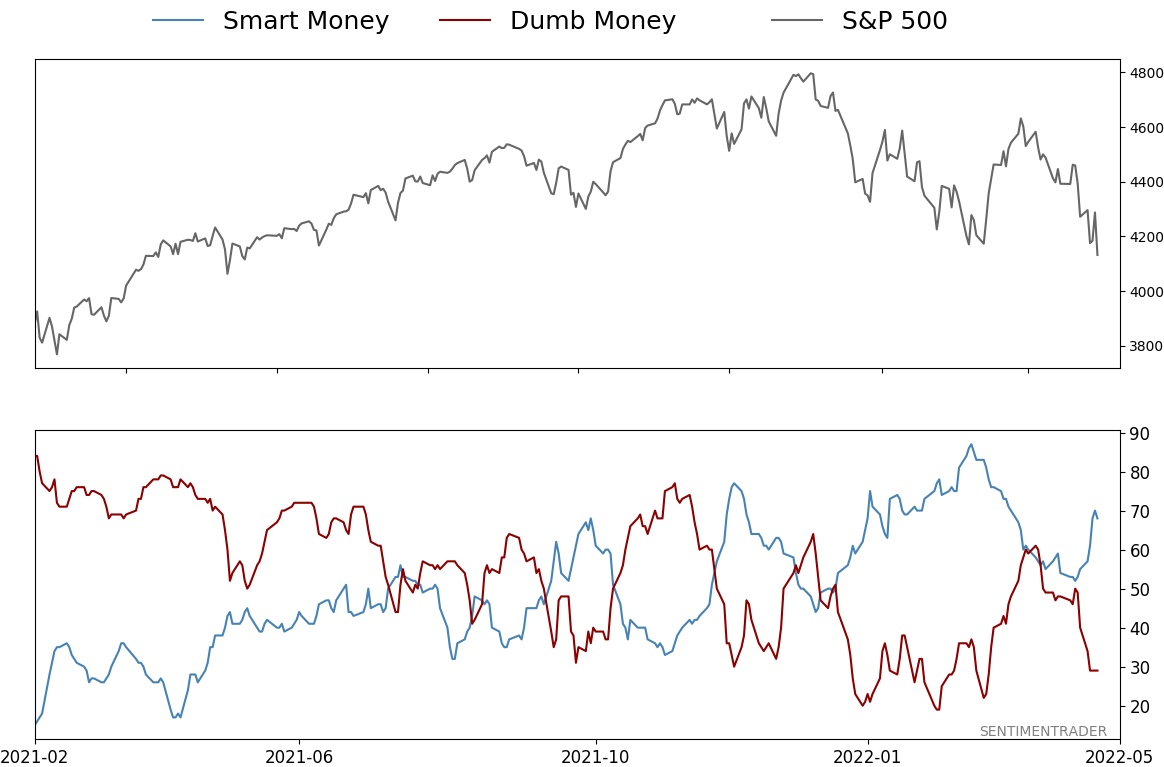
Smart / Dumb Money Confidence
|
|
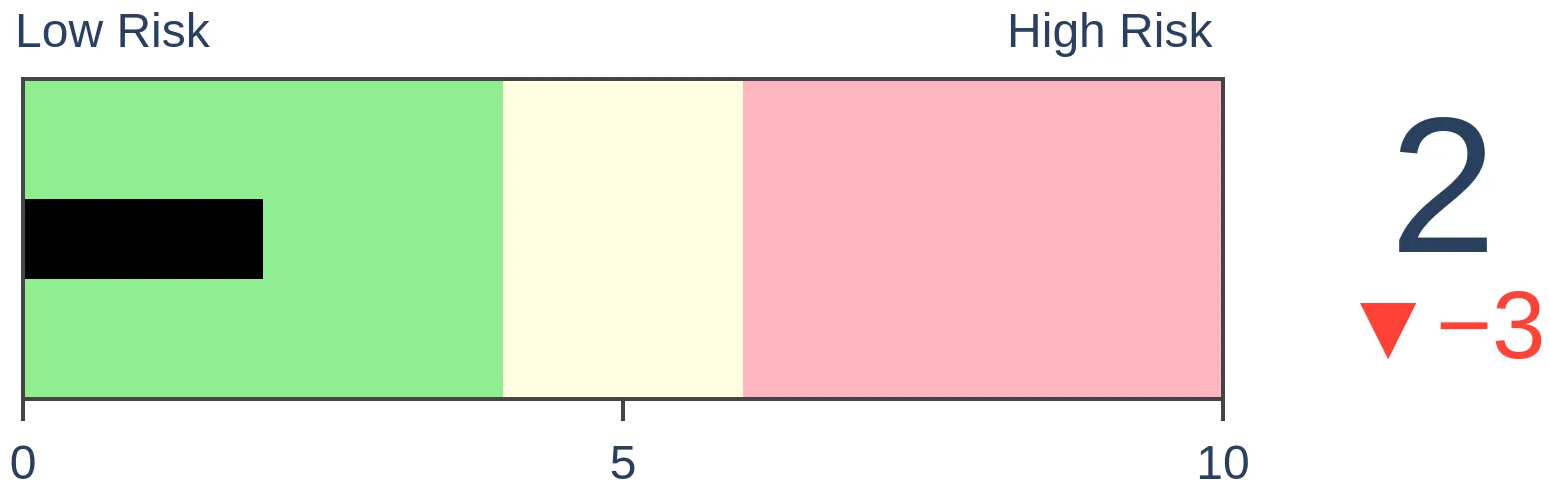
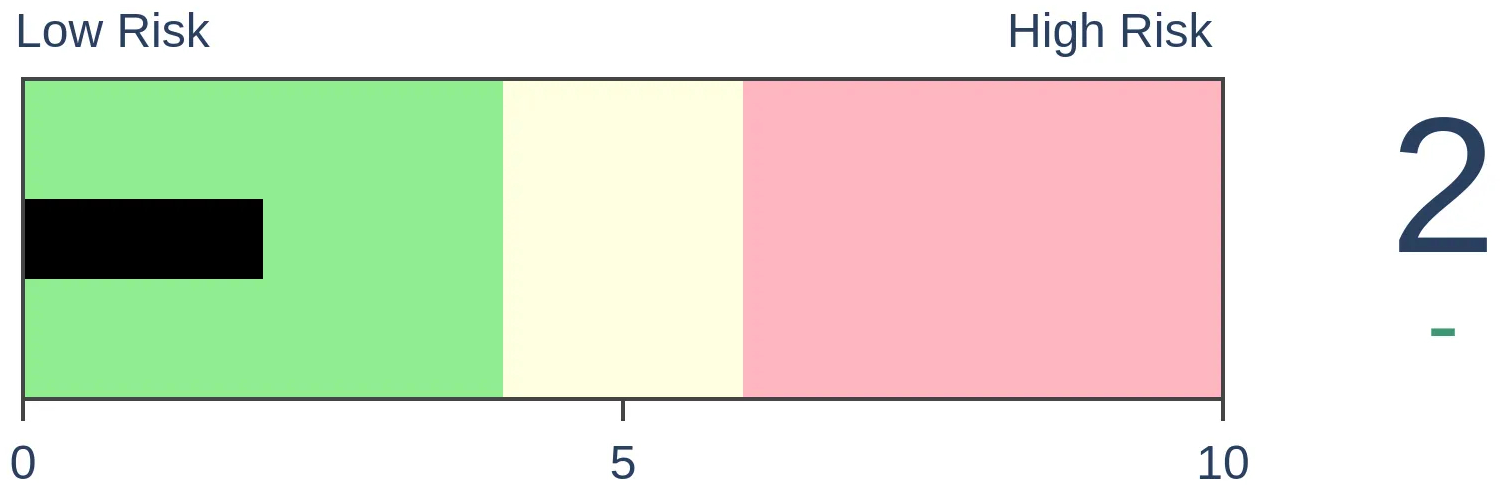
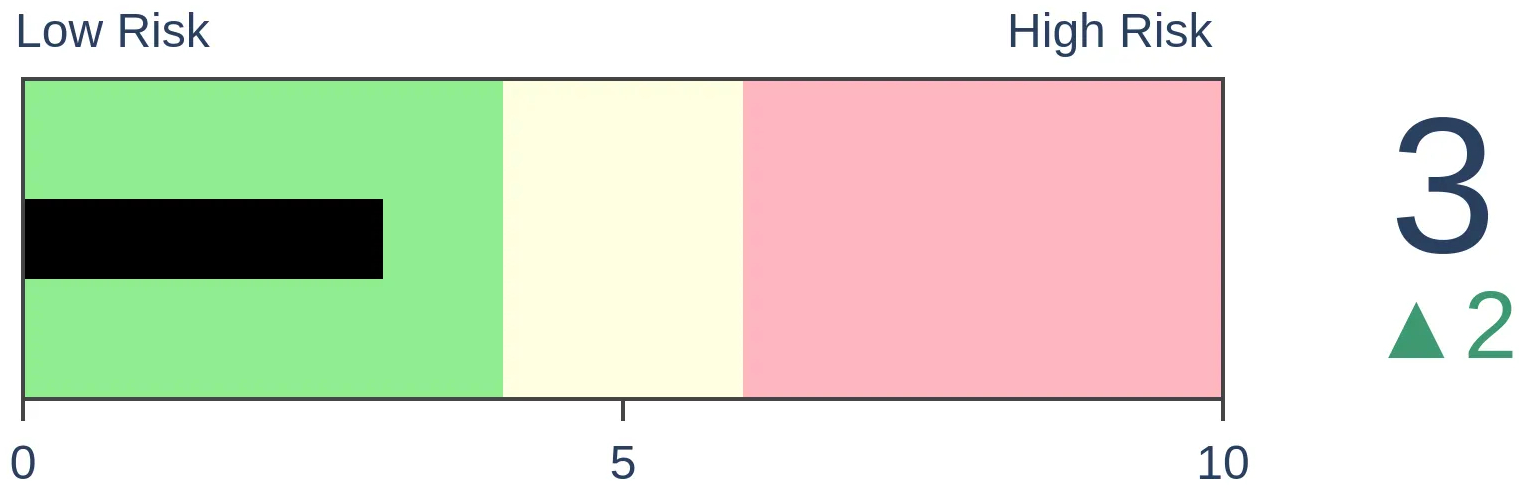
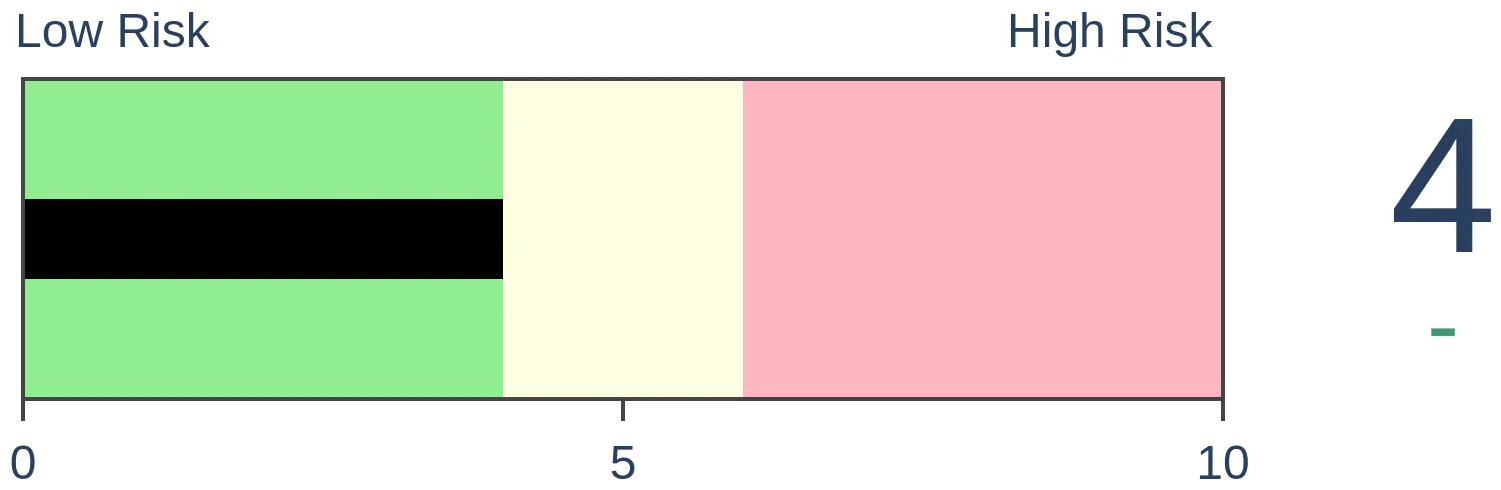
Risk Levels
|
|
|


Research
TradingEdge Weekly for Apr 29 - Momentum ebbs, sentiment turns worse, the dollar keeps surgingBy Jason GoepfertBOTTOM LINEThis week, we saw more deterioration among industries, contributing to a plunge in Big Money sentiment. More economic reports are deteriorating, too, just as the Equity Risk Premium dropped to a decade low. The bond market is about to enjoy a better seasonal tailwind, while gold miners cycled from one extreme to the other and copper momentum turned negative. FORECAST / TIMEFRAME |
Key points:
- Momentum in many industry groups has soured
- A survey of Big Money plunged to the 2nd-lowest on record
- Some economic indicators are also showing contraction
- Defensive stocks tend to be a relatively safe harbor during the summer months
- The Equity Risk Premium just fell to a decade low
- The bond market is about to enjoy a better seasonal tailwind
- Gold miners surged, then plunged
- Copper is showing a drastic reduction in momentum as the dollar continues to surge
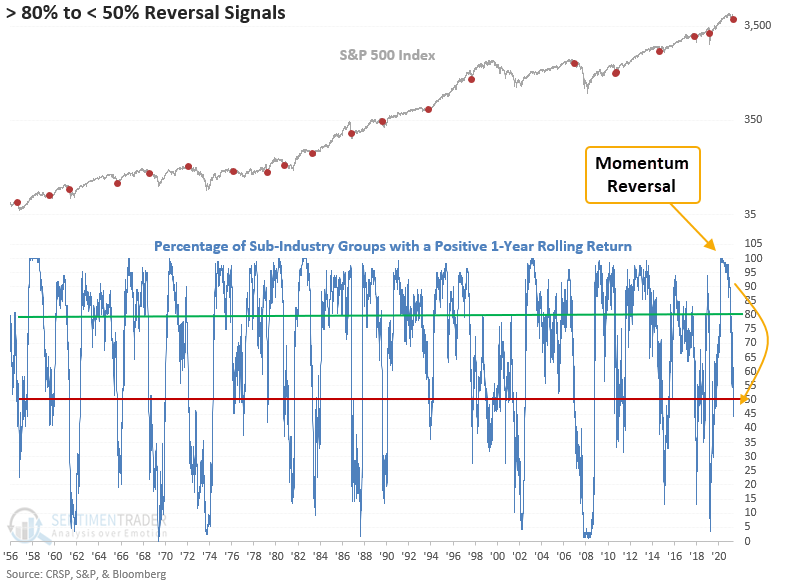
Industry groups are losing momentum
Stocks are losing momentum, and it's evident in their industry groups.
The number of S&P 1500 sub-industry groups with a positive 1-year rolling return fell below 50% this week. Dean noted that the downward shift in momentum occurred after more than 80% of the groups had positive returns as recently as February 2022.
Similar behavior triggered 20 other times over the past 65 years. After the others, S&P 500 future returns, win rates, and risk/reward profiles look okay in the short term. Recent signals in the 1-week time frame suggest there's a chance for an oversold bounce. However, the 2 & 3-month windows show negative returns with z-scores approaching significance. In 19 out of 20 instances, the S&P 500 closed below the signal date close in the next few months.
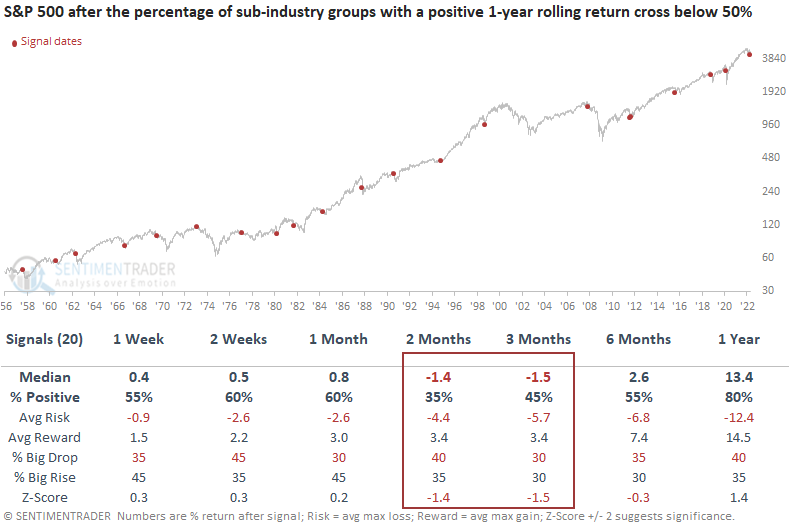
The sector and industry group outlook confirms the cautionary stance for the broad market in the 2 & 3-month time frames, especially for cyclical/value groups like industrials, financials, and consumer discretionary.
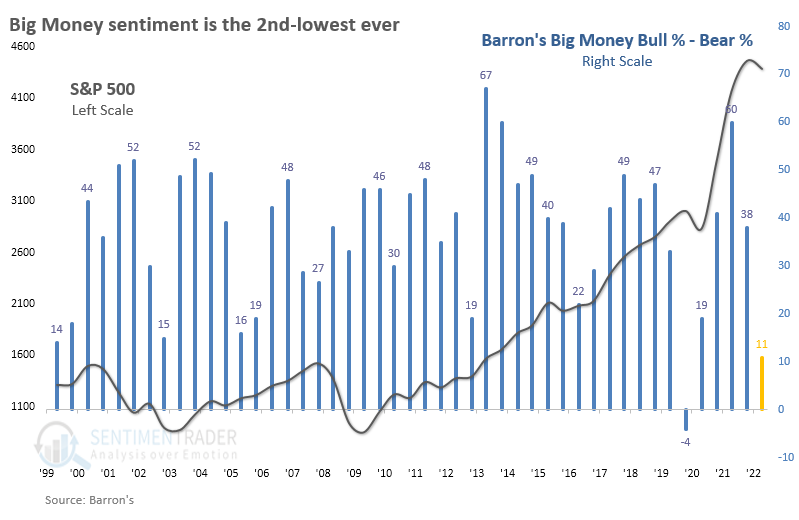
Maybe that's why the Big Money is so negative
The latest semi-annual poll of large money managers from Barron's showed a sharp drop in bulls. The survey represents the attitudes of hundreds of managers with influence over hundreds of billions of dollars under management.
While half of them were optimistic about the prospects for stocks last October, only a third of them are now. The percentage of bears rose, so the net difference between bullish and bearish managers plunged from +38% to only +11%, again the 2nd-lowest reading in 23 years.
We've looked at this survey many times over the years, concluding that the managers can be a slight contrary indicator at extremes, but it's not a decisive edge. While some of the market's better long-term returns came after depressed sentiment, the S&P 500 performed better when managers were bullish and worse when they were bearish.
The table below shows the S&P's returns from one survey to the next, about six months apart. The first three columns show the survey dates with the lowest percentage of bullish managers, and the next three show the dates with the most bullish.
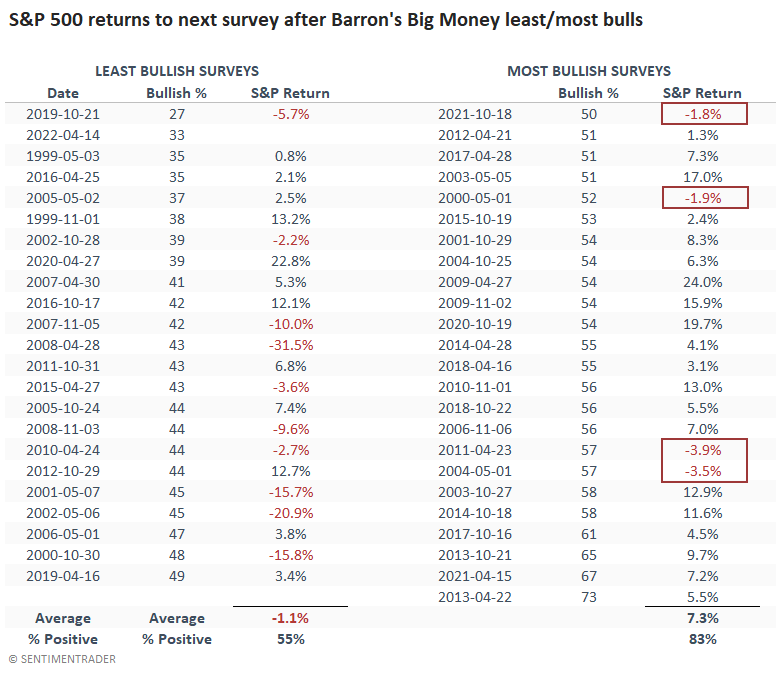
Stocks did tend to rebound after the lowest bullish readings, but overall, when fewer than half of managers were optimistic, the S&P 500 returned an average of -1.1% and showed a positive return 55% of the time. The worst losses came when managers were not inclined to step in and buy.
But when more than half of managers were bullish, the index jumped an average of +7.3%, with 83% of periods showing a positive return. Most notably, the losses were small, none more than -4%.
Fundamentals may be deteriorating, too
The Philadelphia Federal Reserve's monthly manufacturing survey, which targets CEOs, is conducted in the first week of each month and released on the third Thursday. It can potentially indicate the future direction of a broader survey like the ISM manufacturing report, released in the following month.
One of the survey components is the 6-month forecast for new orders. The forecast provides us with an inside look at potential future business plans and it just fell below 5%. Dean showed that the 6-month forecast for new orders has fallen to the lowest level since October 2008.
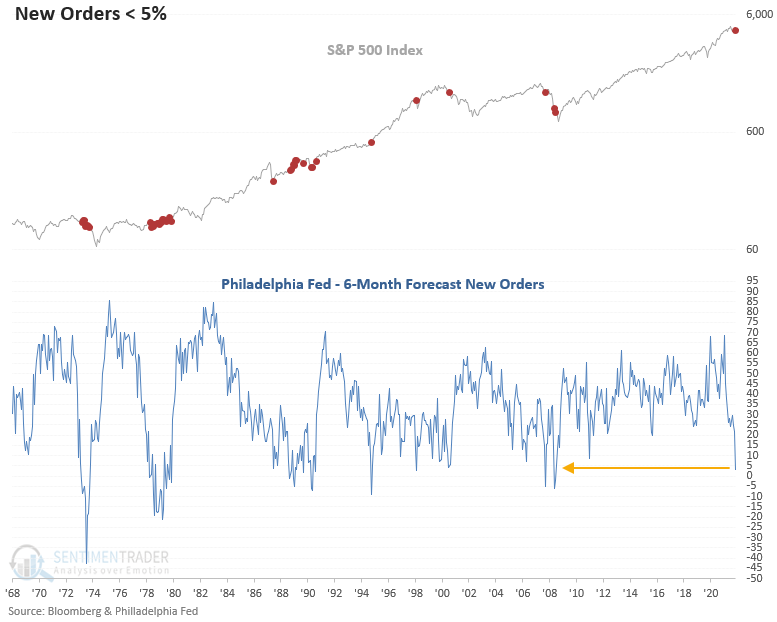
Similar drops preceded declines in ISM new orders, ISM manufacturing, and also our Macro Index Model.
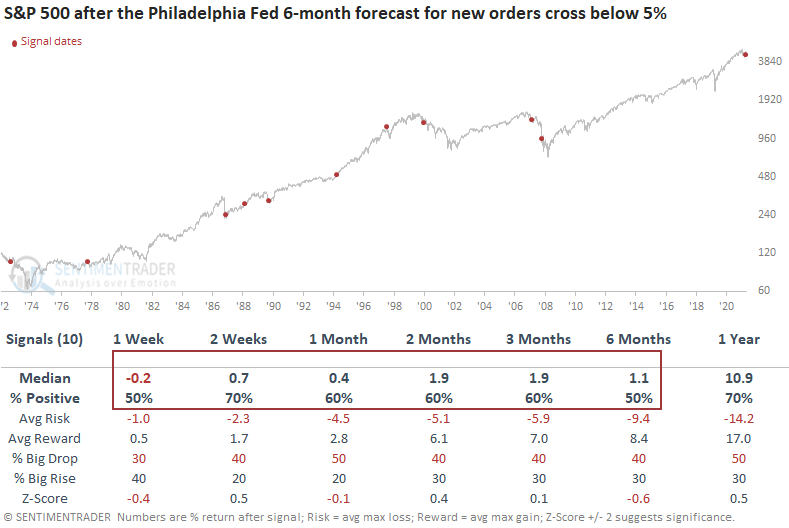
This study generated a signal 10 other times over the past 49 years. After the others, S&P 500 future returns look flat across short and medium-term time frames. 1995 is the only instance where the S&P 500 did not see a lower close at some point in the first 6 months.
The sector and industry group outlook suggests a cautionary stance, especially for financials and technology.
A place to hide - defensive stocks
Overall stock market performance during the summer months of May through August tends to be less robust than in the winter into spring months. A simple four-sector portfolio has demonstrated relatively consistent performance for over 90 years.
Jay completed the following test holding the S&P 500 Index sectors listed below each year only from May through August:
- Consumer Staples
- Utilities
- Health Care
- Real Estate
On the last trading day of April each year, the portfolio is split equally among these four sectors and held through the end of August.
The chart below displays the hypothetical cumulative % growth achieved by holding the four sectors listed above only during May through August from 1927 through 2021. No gain or loss is assumed from September through April for this test.
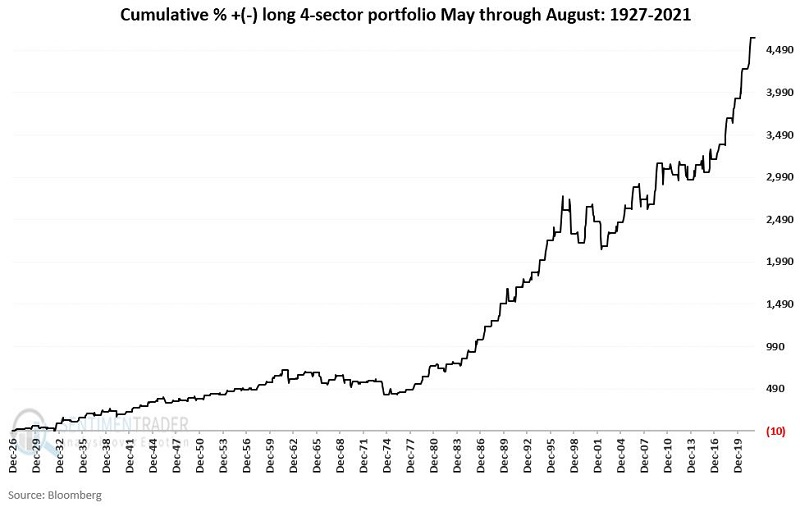
Out of the 95 years, 66 of them showed a profit. More impressively, the average gain was +9.3%, the maximum gain was +43%, and there were ten years with gains of more than 15%. When the strategy lost, it tended to show much smaller losses than the winner years showed gains.
This strategy can be emulated using the following ETFs:
- XLP (Consumer Staples Select Sector SPDR Fund)
- XLU (Utilities Select Sector SPDR Fund)
- XLV (Health Care Select Sector SPDR Fund)
- XLRE (The Real Estate Select Sector SPDR Fund)
For real-world implementation, this strategy requires a high degree of patience and discipline on the part of the investor. While the long-term results display a substantial degree of consistency and have outperformed buying and holding the S&P 500 Index over an extended time, on a year-to-year or even multi-year basis, extended periods of flat to negative results appear inevitable.
The Equity Risk Premium is shrinking
Earlier in the week, stocks pulled back and the bond market enjoyed a slight reprieve from massive selling pressure. The historical ratio between the two markets has eased back a bit.
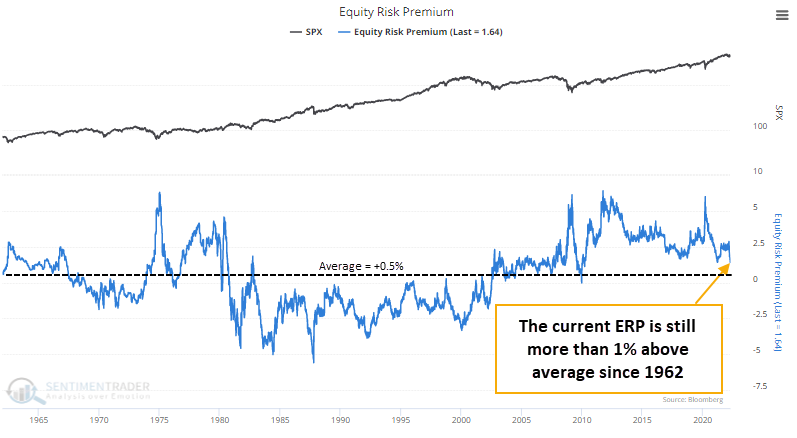
Thanks to the volatile moves in both the stock and bond markets, the S&P 500's earnings yield has declined relative to the yield on 10-year Treasuries. That pushed the Equity Risk Premium (ERP) to its lowest level since 2010. This is a stark change from some of the important lows of the past decade when the S&P earnings yield was 4% or more than Treasuries.
While it sounds like a valid excuse to sell stocks, context is important. When we zoom out, maybe there's not a good reason to panic.
The current ERP of +1.6% is still well above the average of +0.5% over the past 60 years. From 1980 through 2002, the ERP spent almost the entire time in negative territory. Only when it moved below -2.5% did stocks really struggle.
While the absolute level of the Equity Risk Premium may not be an issue, it did recently drop to a one-year low at the same time that the Stock/Bond Ratio was extreme. When the ERP was at a low and the Stock/Bond Ratio 20-day average was above 2, stocks suffered. Up to two months later, the S&P 500 showed a negative median return, though long-term returns were decent (except for 1987).
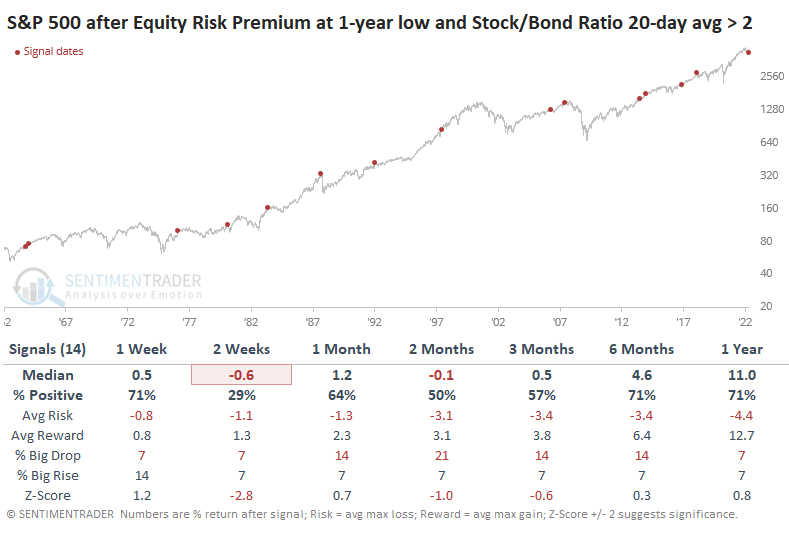
The Stock/Bond Ratio declined over the medium- to long-term every time, suggesting that the two markets showed a strong tendency to mean-revert. While that doesn't mean positive or negative absolute returns, in general, it would suggest stocks relaxing while bonds enjoyed a reprieve.
Some positive seasonal trends for Treasury bonds
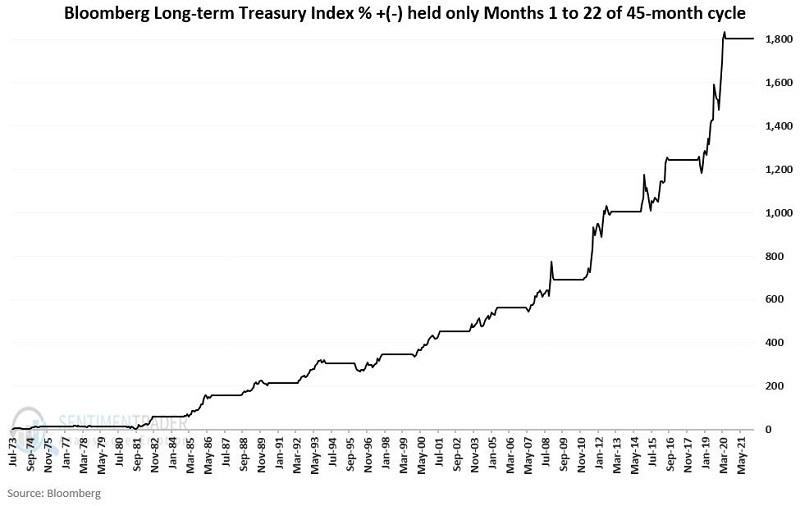
Jay showed that for at least the last 50 years, treasury bond prices have exhibited a trend within a 45-month cycle:
- The first 22 months of the cycle are considered "favorable"
- The last 23 months of the cycle are considered "less favorable"
The first 45-month cycle we will consider started on 7/31/1973. The "favorable" 22-month period extended through 5/31/1975. The "less favorable" 23-month period then extended through 4/30/1977, at which point the cycle began again. The good news (hopefully) is that the favorable part of the cycle will begin again at the close on 4/29/2022.
The chart below displays the cumulative total % return achieved by the Bloomberg Barclays Long Treasury Index if held only during each cycle's first 22 favorable months since 1973. The cumulative total return through March 2022 is +1,803%.
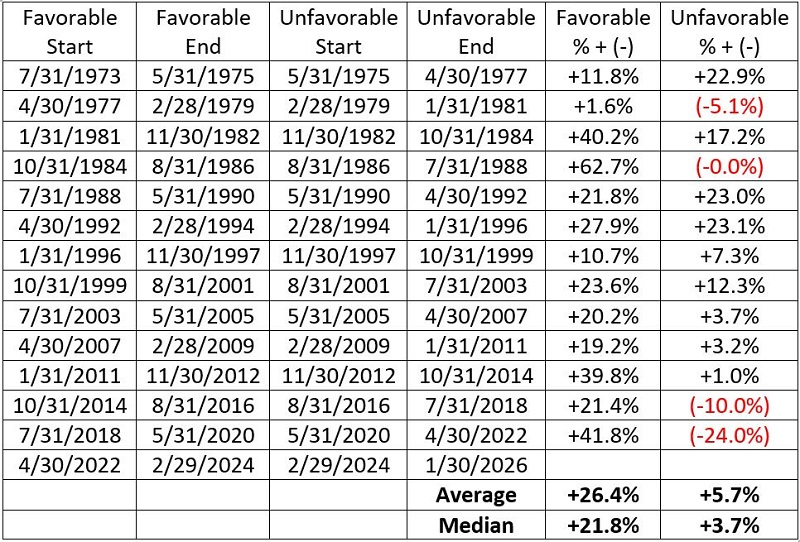
The table below displays the total % return for the Bloomberg Barclays Long Treasury Index during each favorable and unfavorable period since 1973.
Jay also highlighted the annual seasonal trend for the 30-year treasury bond. Note that a favorable period begins on TDY (Trading Day of Year) #91 and runs through TDY # 169.
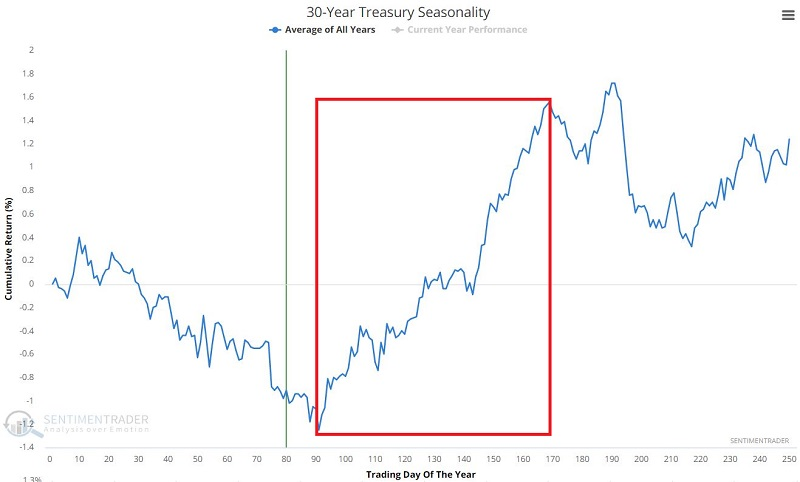
For 2022 this period begins at the close on May 12th and remains favorable through September 1st. The chart below displays the cumulative hypothetical $ gain achieved by holding a long position in t-bond futures (1 point in price movement = $1,000 change in contract value) only during this favorable period every year since 1978.
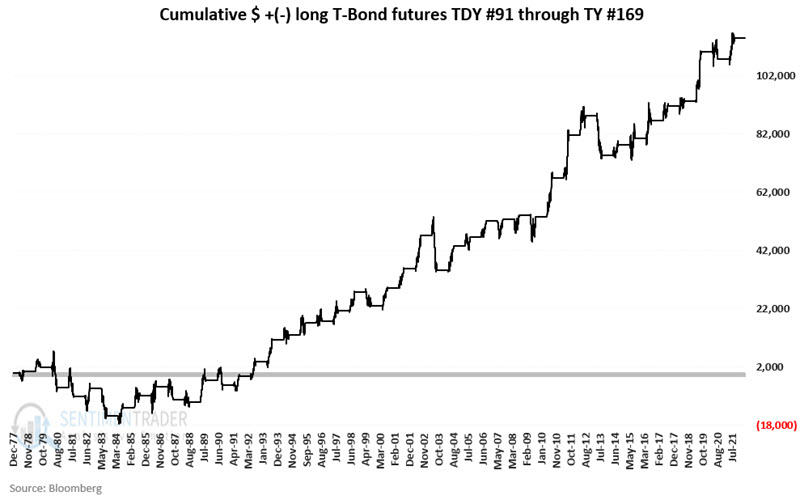
This period showed a gain 33 times and a loss 11 times.
Gold miners surged, then plunged
Gold has had a tough time over the past week and is already trading down to a two-month low.
There isn't a perfect correlation between gold and the companies that mine it, but miners tend to move along with the price of gold. Due to what had been an excellent multi-month run, the percentage of gold miners trading above their 200-day moving average surged above 90% last week before pulling back in recent sessions. During structural bear markets, it's rare to see thrusts like this, but this is the 3rd one in the past several years.
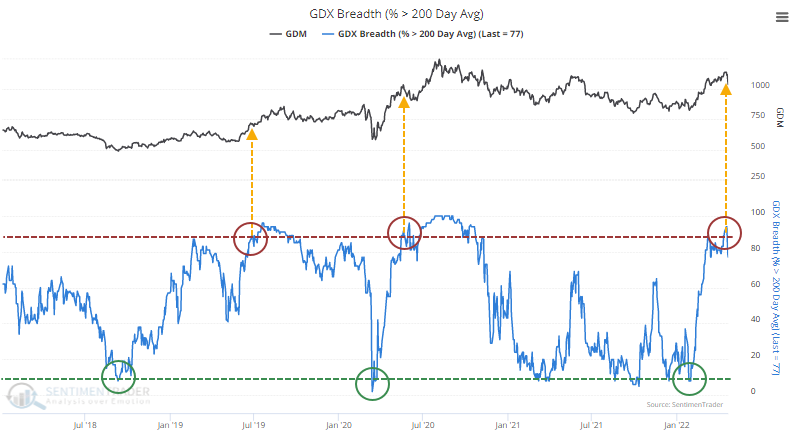
Since that signal, gold mining stocks have already tumbled. From its high on April 18, Newmont Mining has already dropped nearly 20%. The percentage of miners above their 50-day moving average has plunged from 100% to below 15% and the percentage trading above their 10-day moving average cycled all the way from 100% to 0%.
The table below shows every time when more than 95% of miners were above their 10-day average, more than 95% were above their 50-day average, and more than 90% were above their 200-day average. Then there was a pullback and those figures fell to below 5%, 15%, and 80%, respectively.
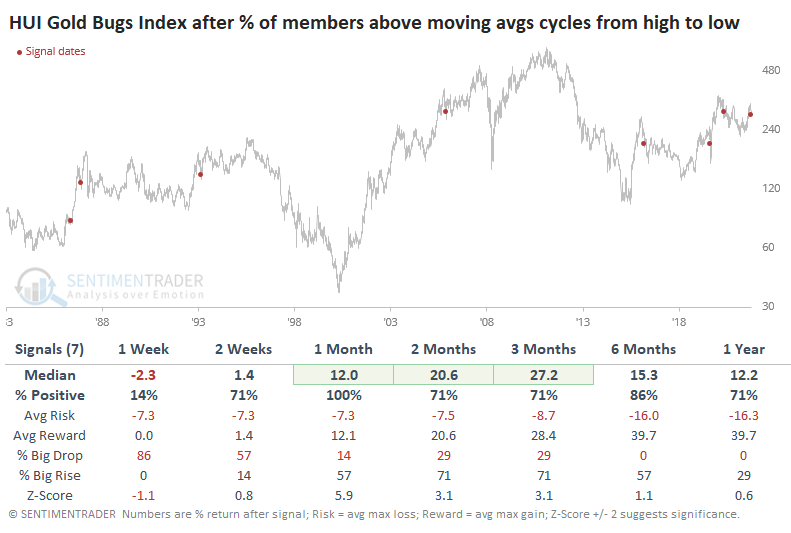
Here, there were still short-term losses, but medium-term returns improved. Over the medium- to long-term, there was only one loss.
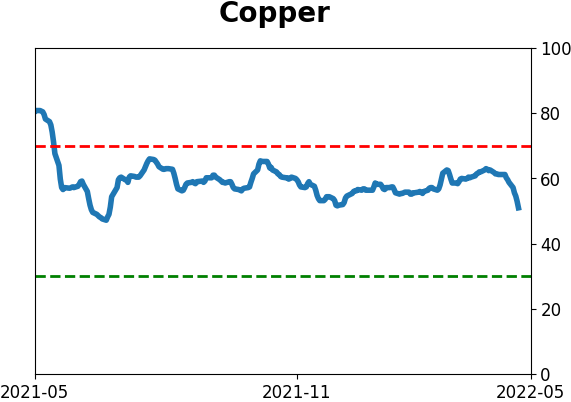
Copper is reversing, too
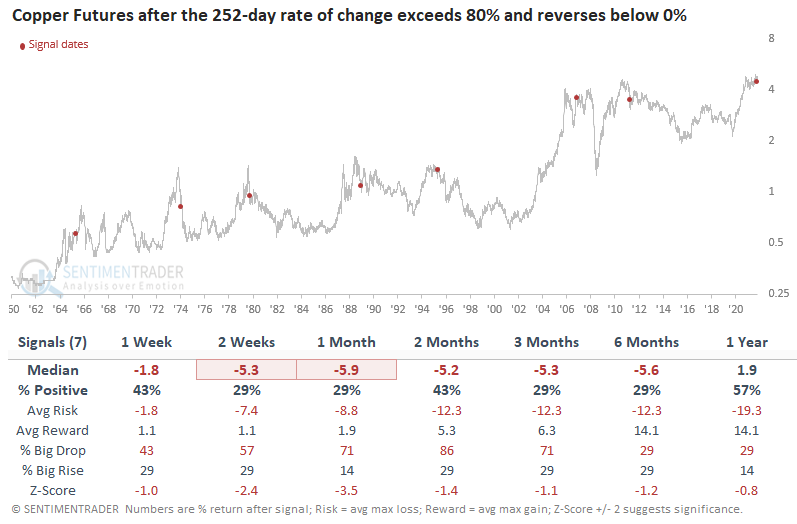
Dean assessed the outlook for copper, commodities, and stocks when the 252-day rate of change for copper exceeds 80% and then reverses below 0%. Copper, like most commodities, rarely maintains a bullish trend for an extended period. The 2002-08 cycle is the exception.
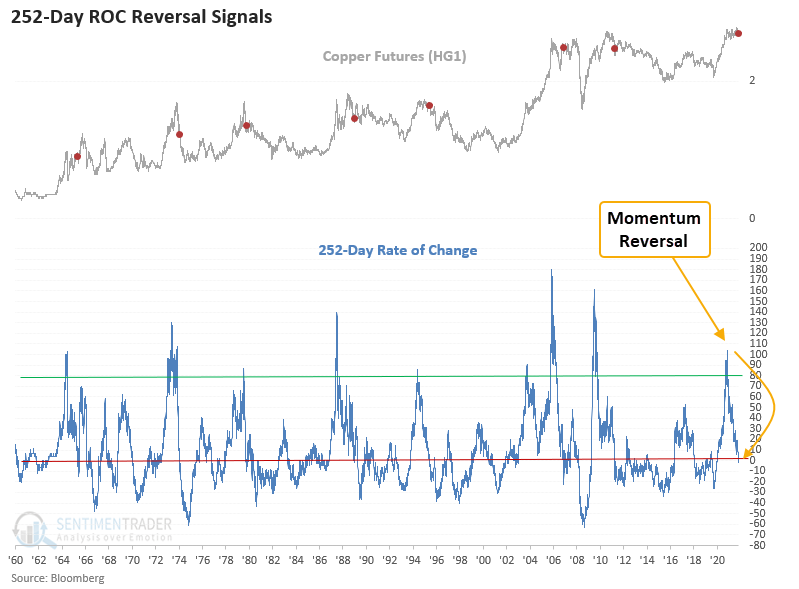
This study generated a signal 7 other times over the past 57 years. After the others, copper returns, win rates, and risk/reward profiles look unfavorable across short to medium-term time frames. The reversal in momentum marked a significant peak in copper in 5 out of 7 instances. 1965 and 2007 are the only signals that recovered and eventually recorded a new high. The sample size is small.
When I apply the copper signal dates to the Bloomberg Commodity Spot Index, the outlook table suggests that a broad basket of commodities can continue to rally. The 6-month time frame looks excellent.
The outlook looks constructive when applying the copper signal dates to the S&P 500 Index. Several time frames show an 86% win rate. However, returns are somewhat limited in the first few months.
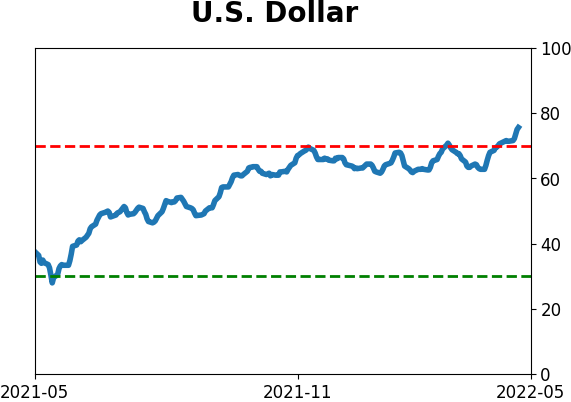
More headwinds - a surging dollar
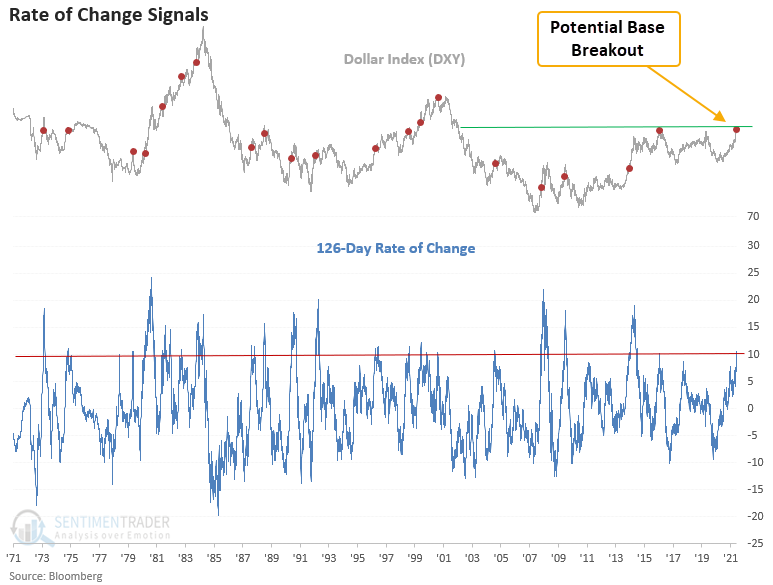
Dean looked at returns after the 126-day rate of change for the Dollar Index (DXY) increases by 10%. The Dollar Index is up a meaningful amount over the trailing 6-month period and on the cusp of breaking out of a significant base formation.
This study generated a signal 20 other times over the past 48 years. After the others, the Dollar Index's future returns, win rates, and risk/reward profiles look solid in the 1-4 week time frames. And, more recent signals look even better, with 13 out of 14 winners at some point in the first month.
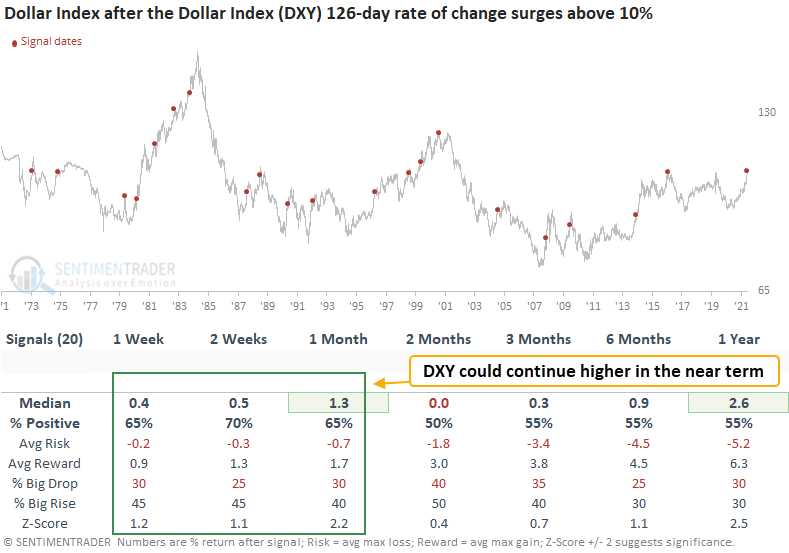
After these signals in the dollar, commodities, stocks (domestic and overseas), copper, and oil tended to suffer. Gold's returns were mostly below average, but not as bad as the others.
About TradingEdge Weekly...
The goal of TradingEdge Weekly is to summarize the research published to SentimenTrader over the past week. Sometimes there is a lot to digest and this summary is meant to highlight the highest conviction or most compelling ideas we discussed. This is NOT the full research that's published, rather it pulls out some of the most relevant parts. It includes links to the published research for convenience; if you don't subscribe to those products it will present the options for access.
Indicators at Extremes
|
|
|
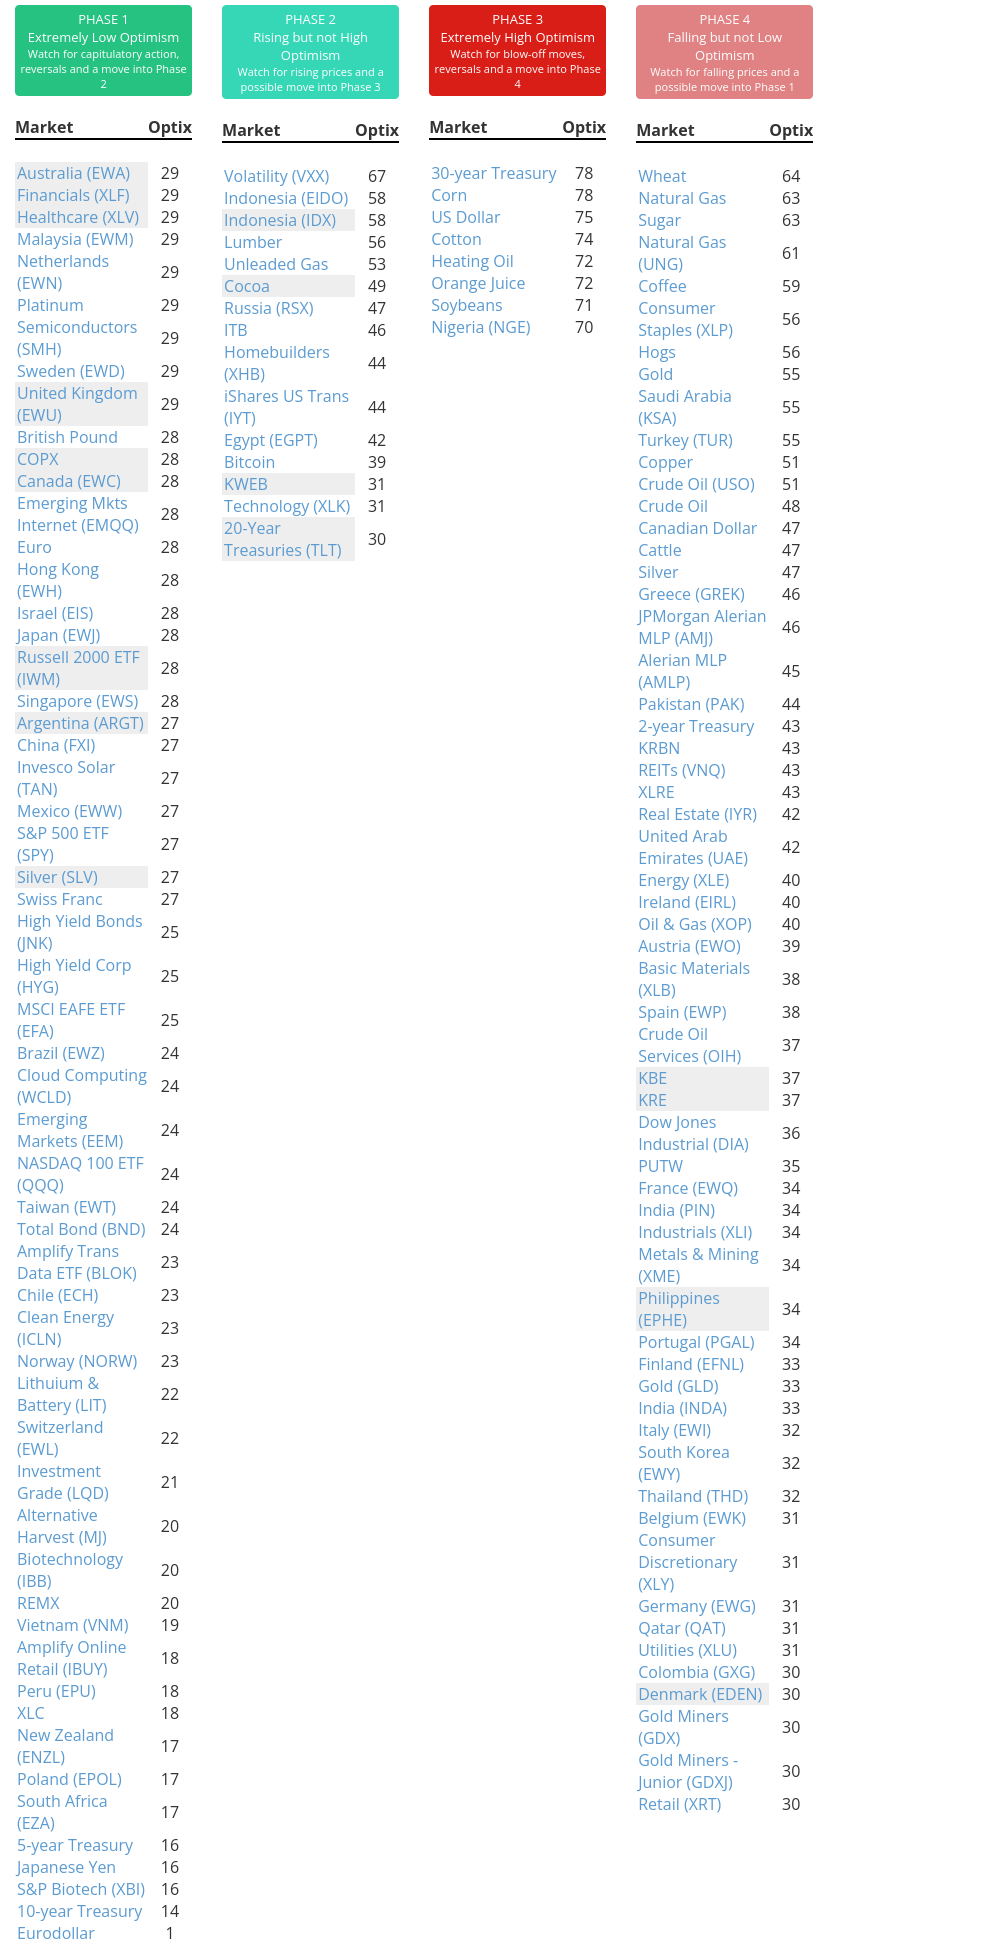
Phase Table
|
|
|
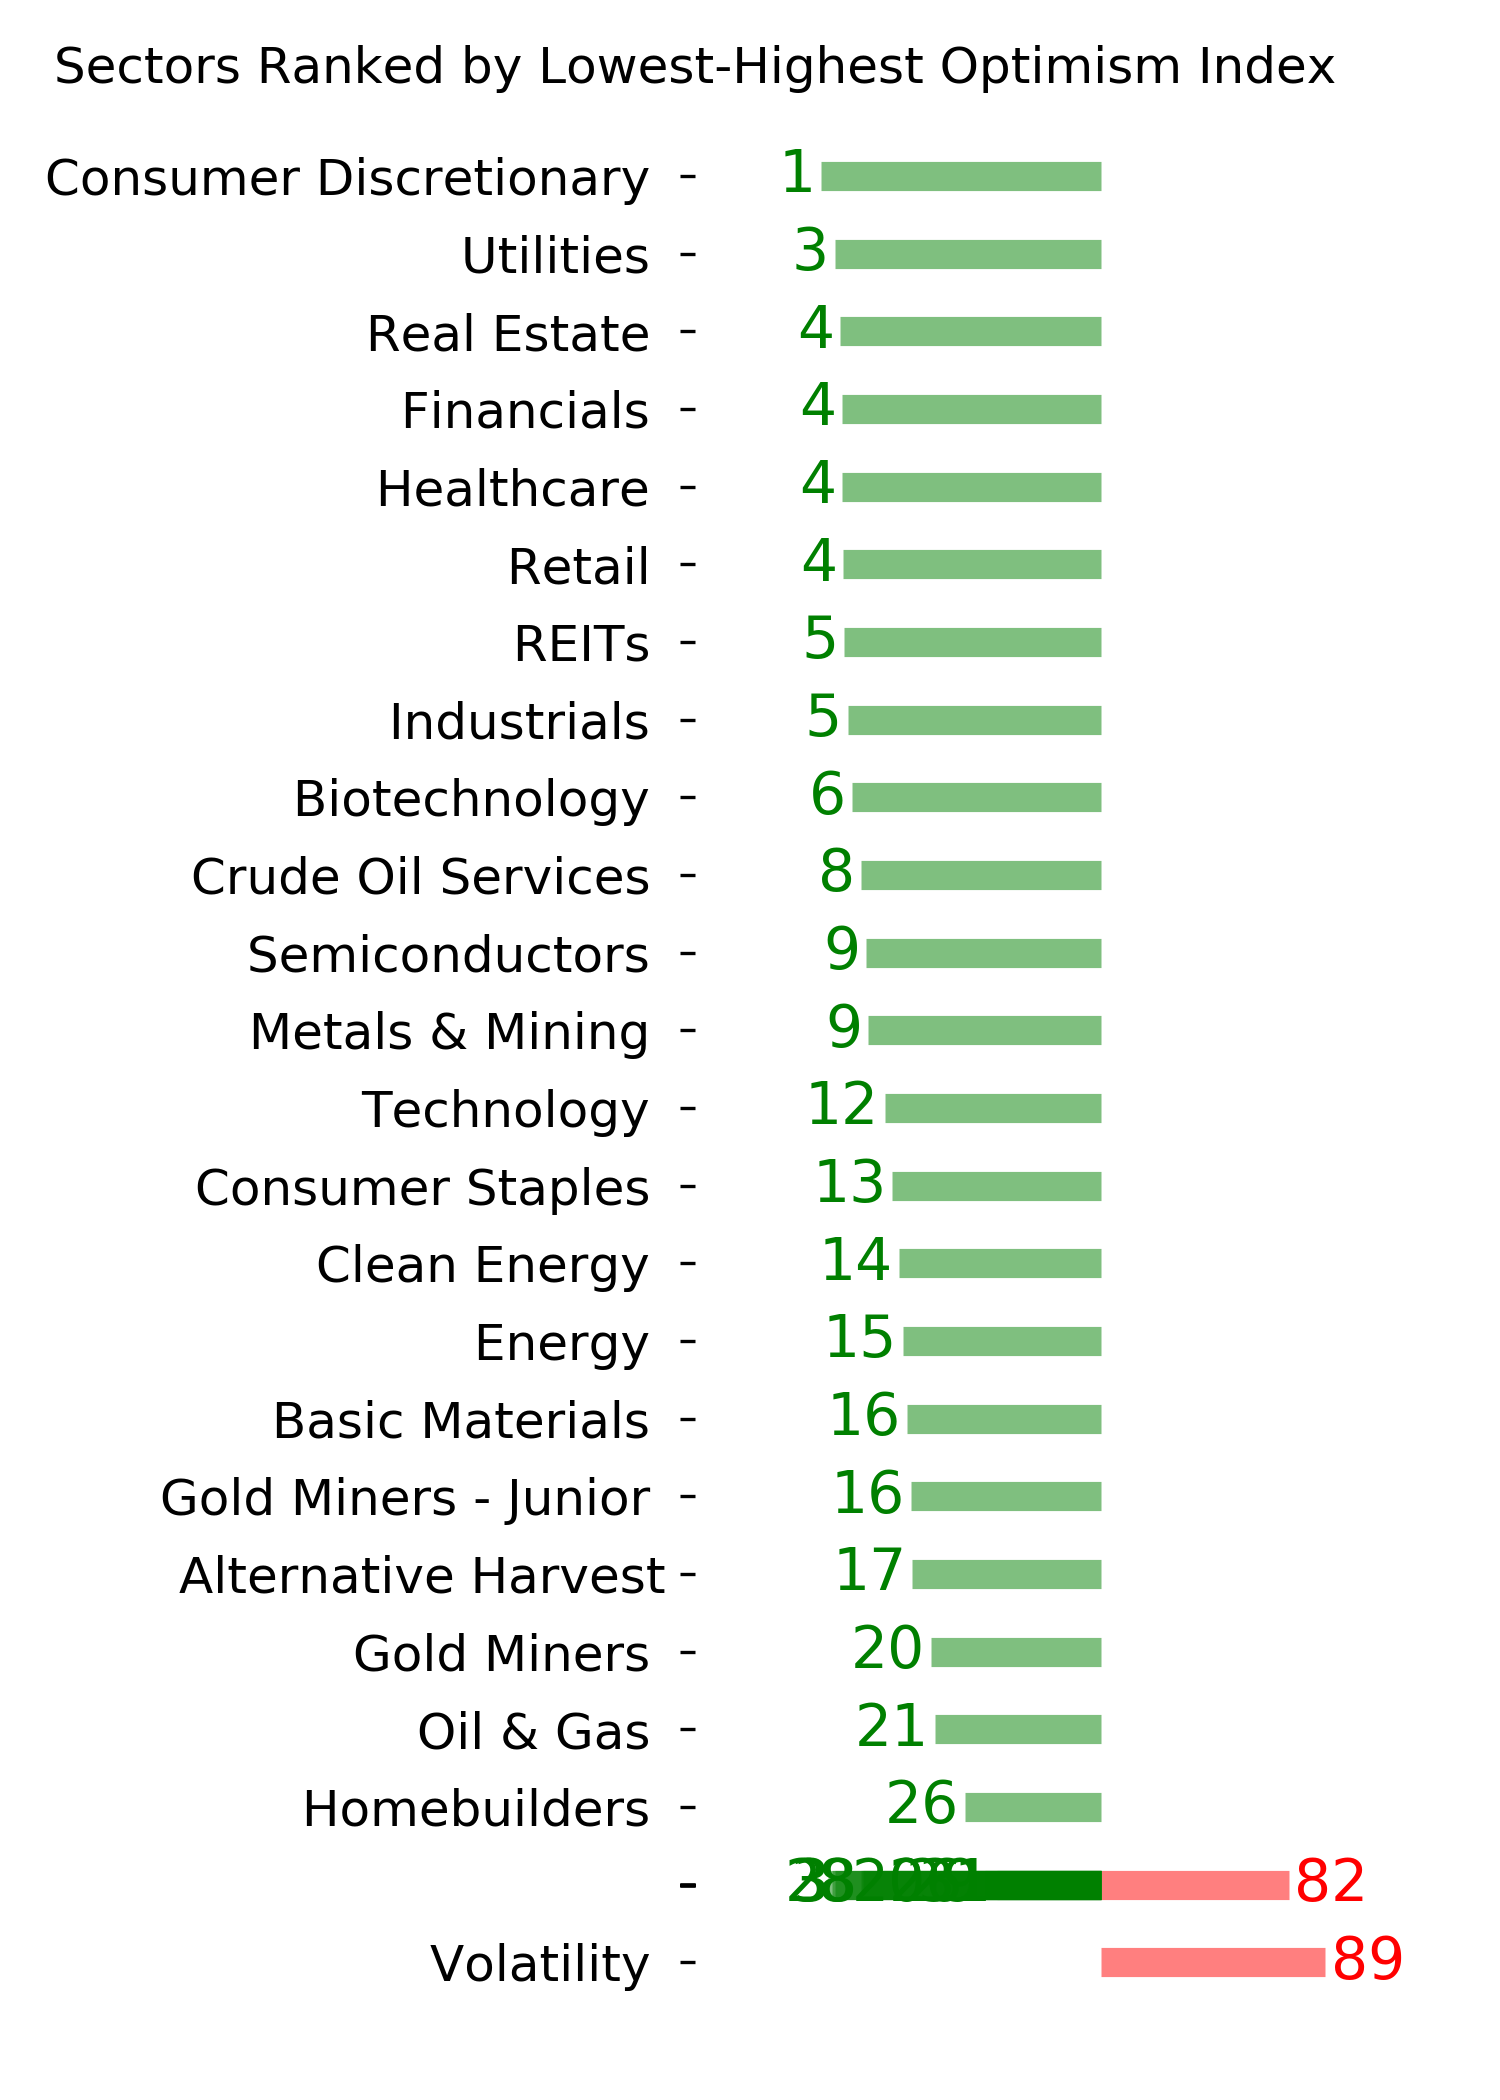
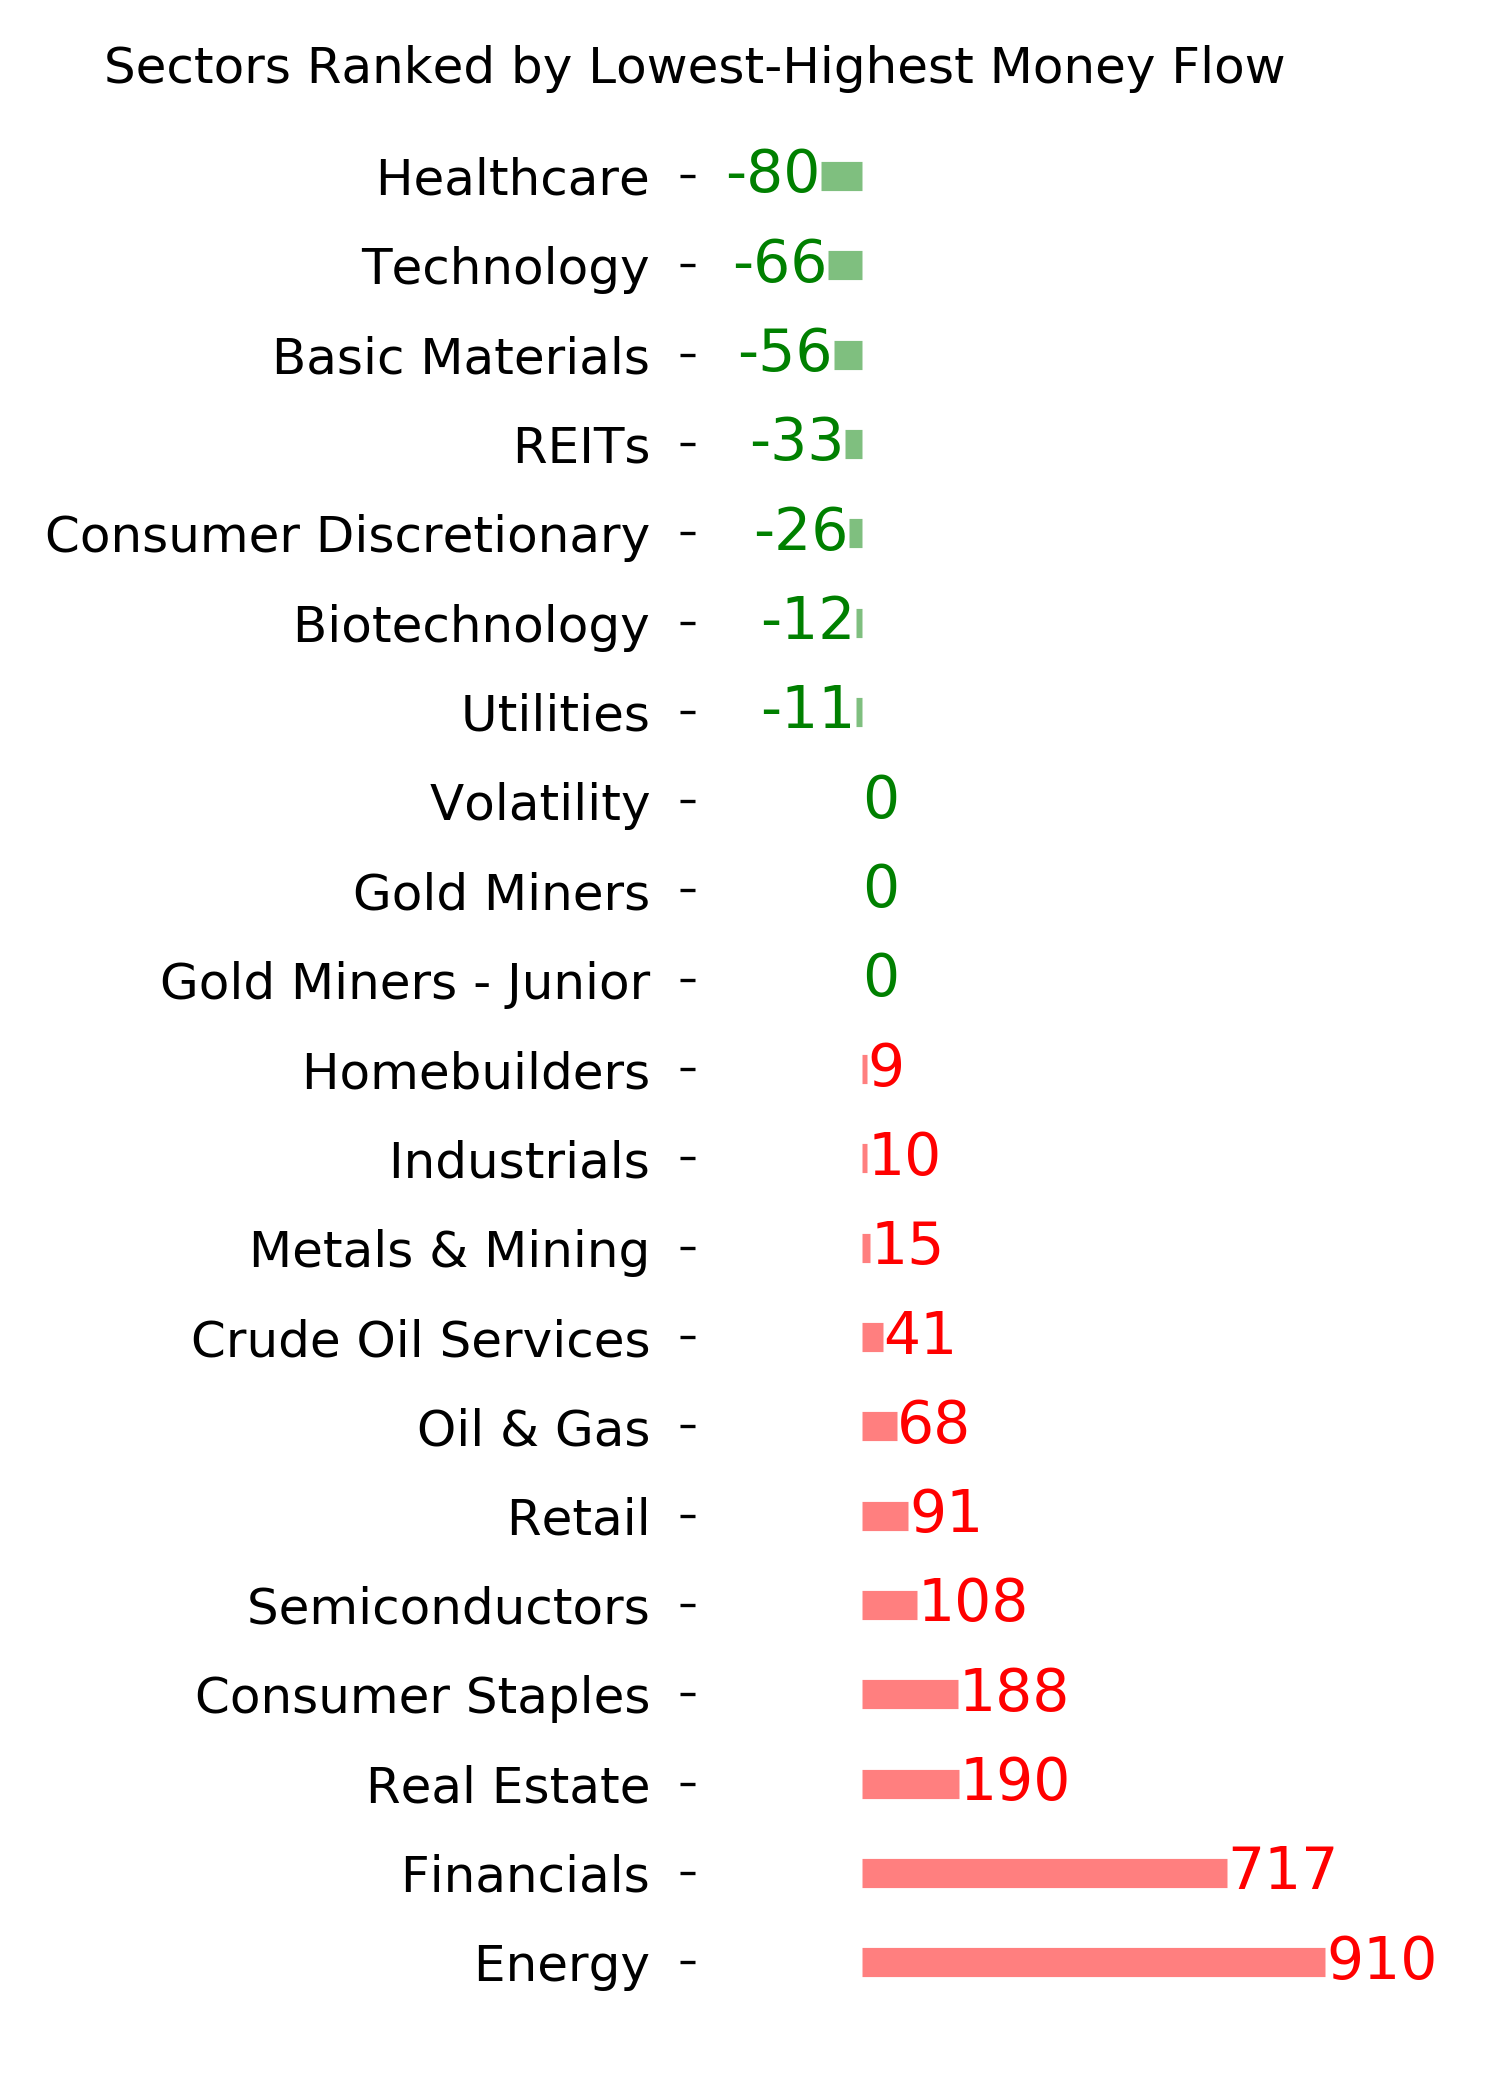
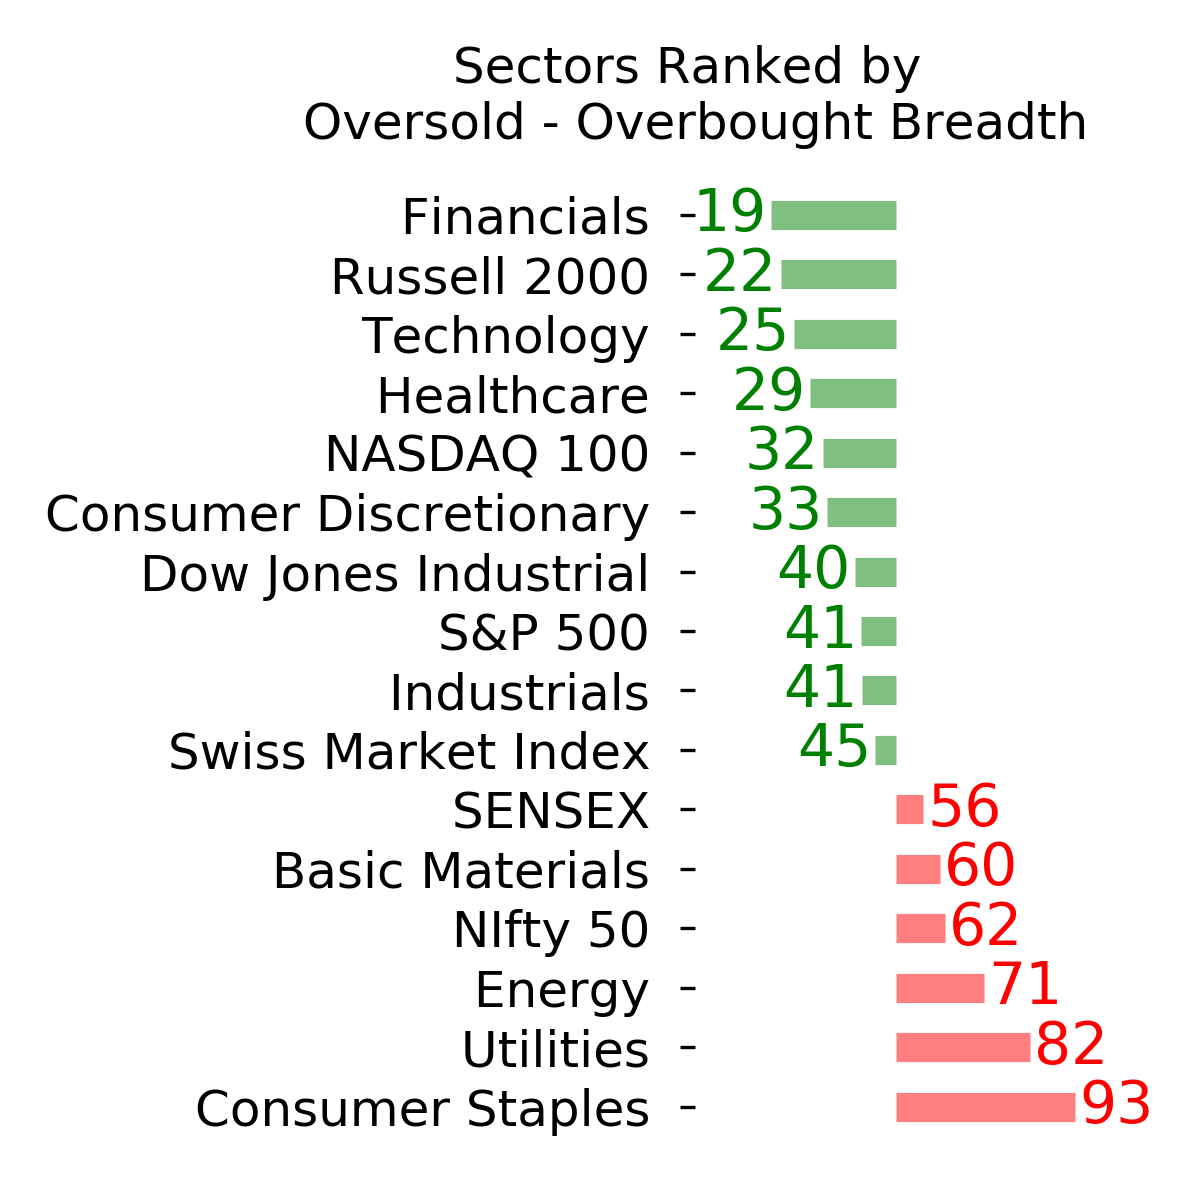
Ranks
|
|
|
|
|
|
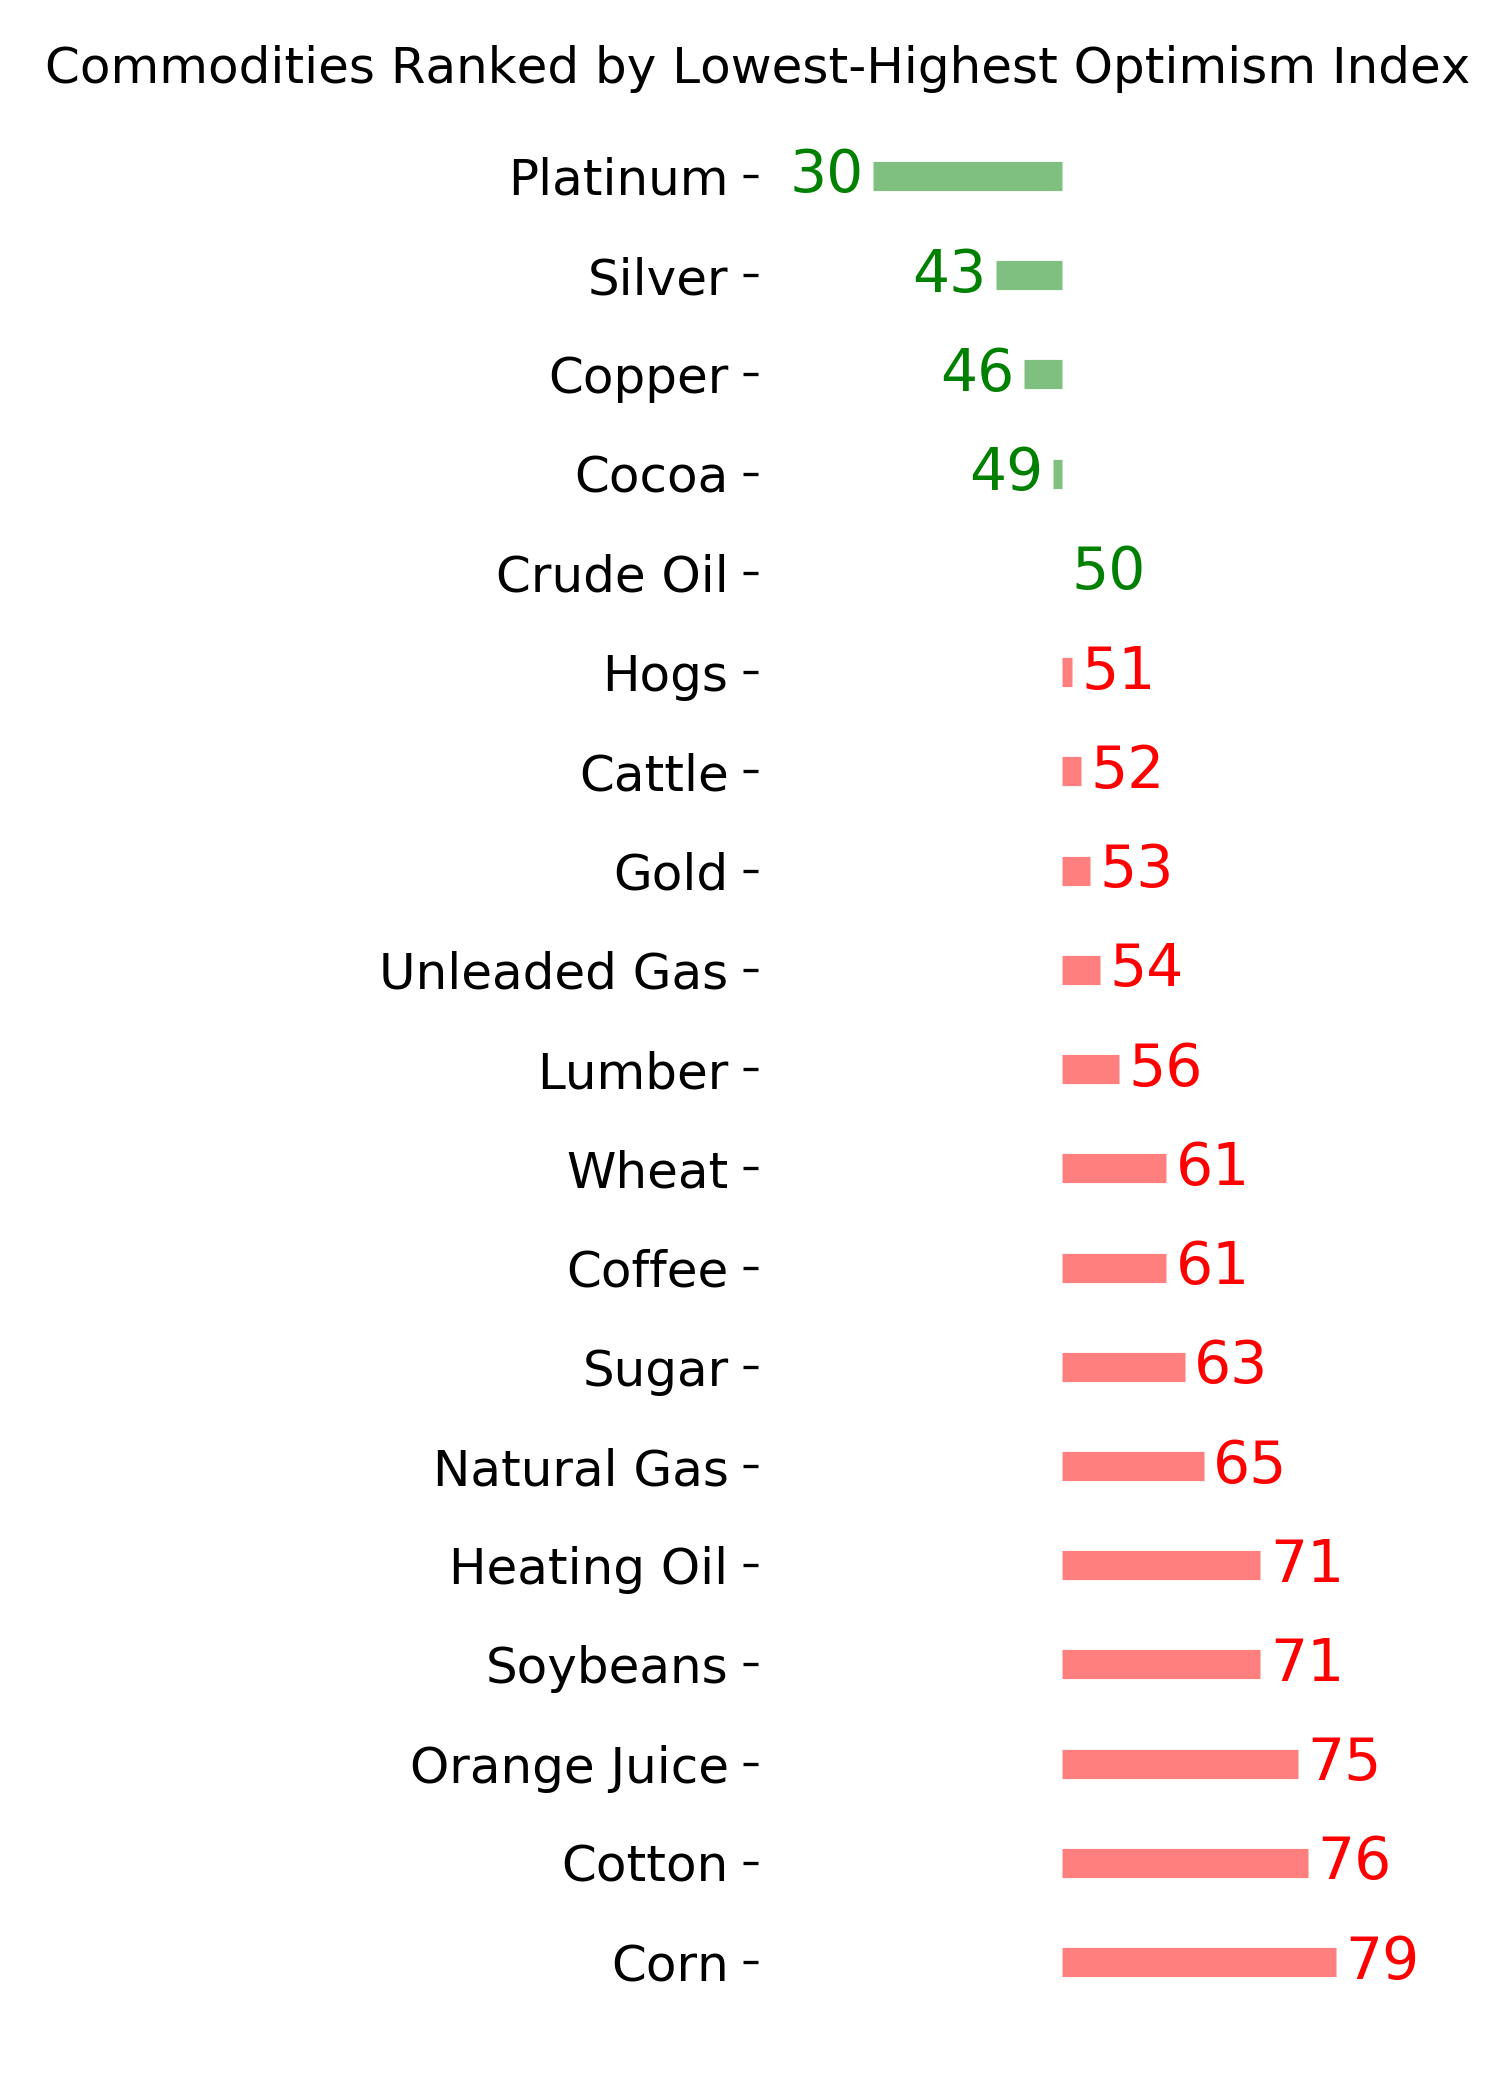
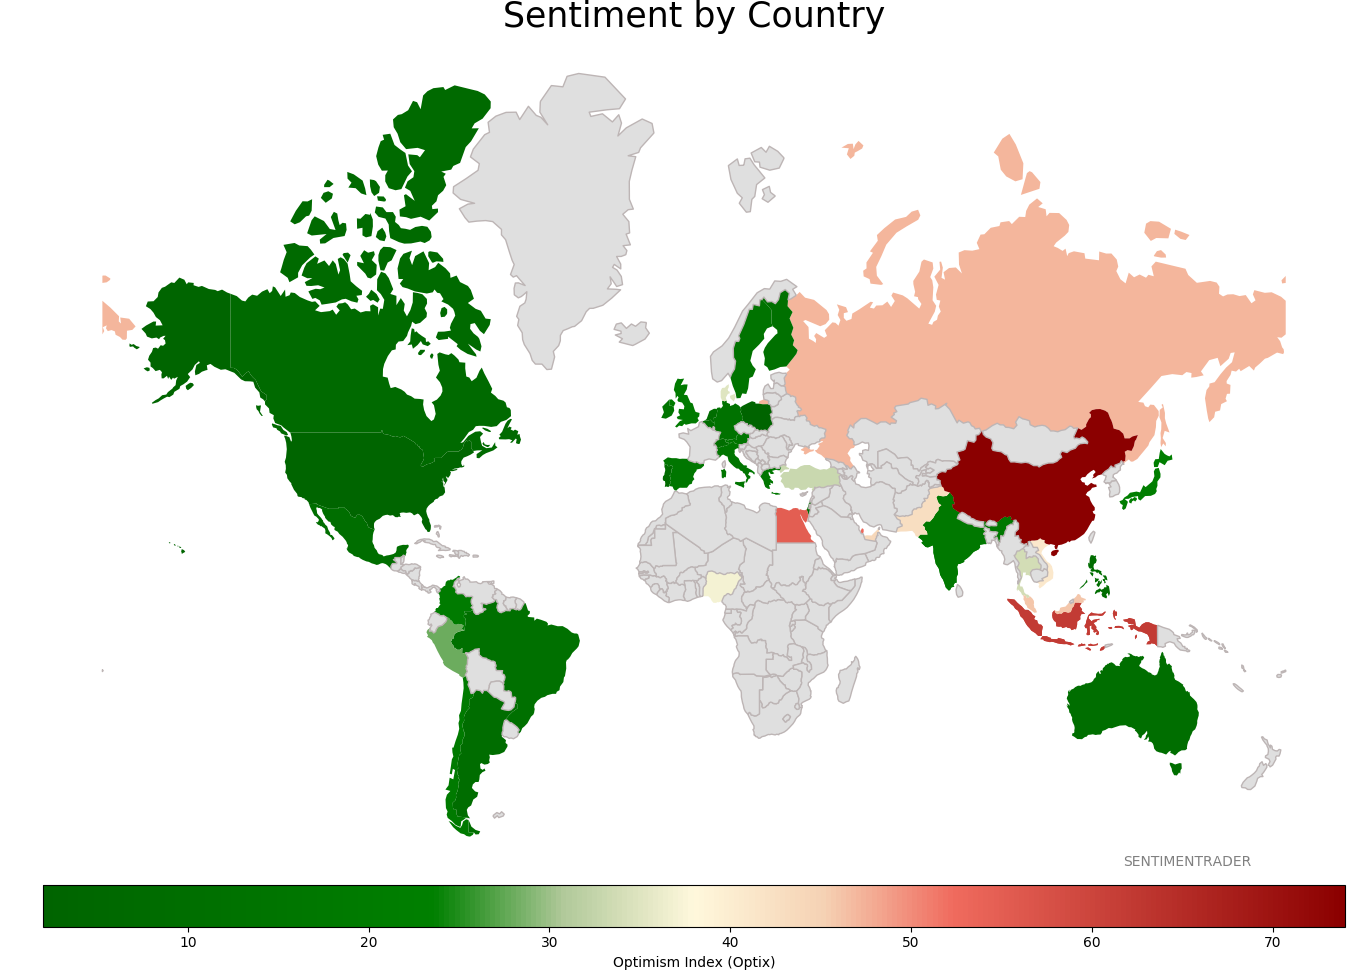
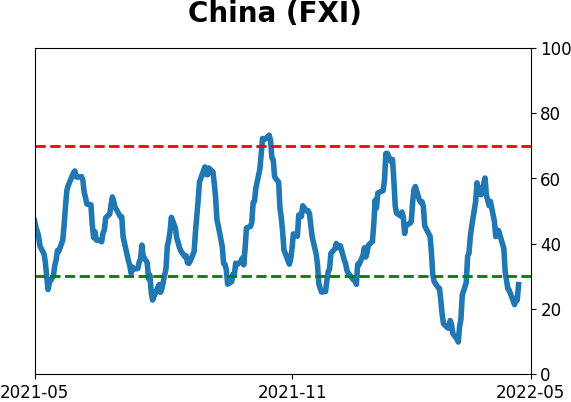
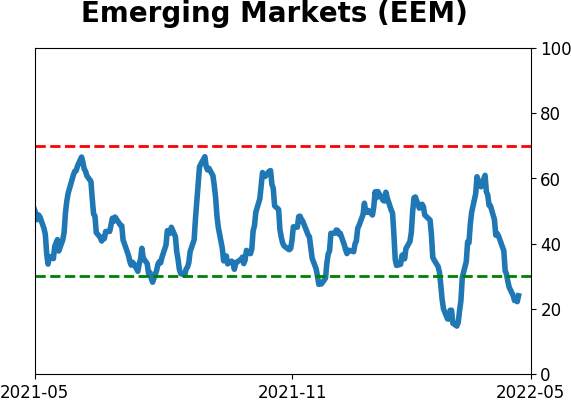
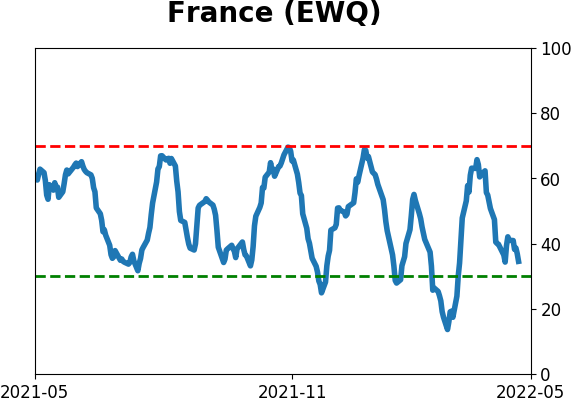
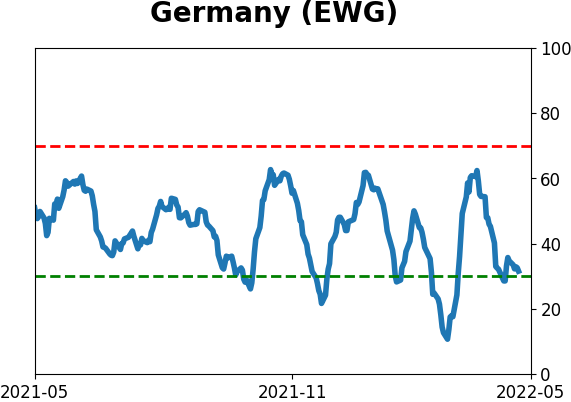
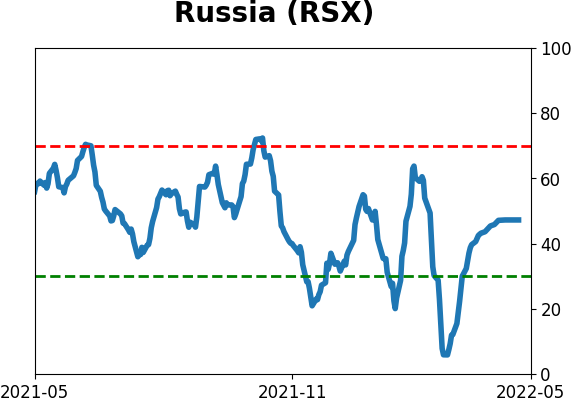
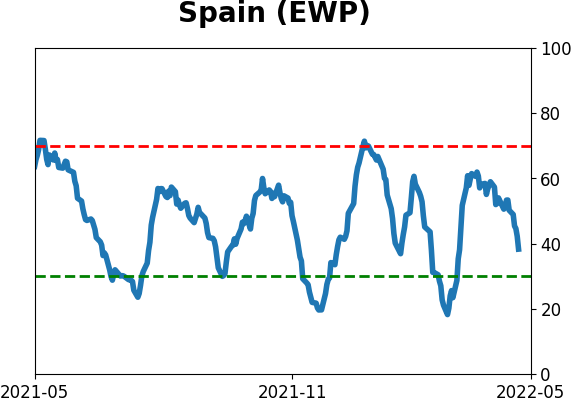
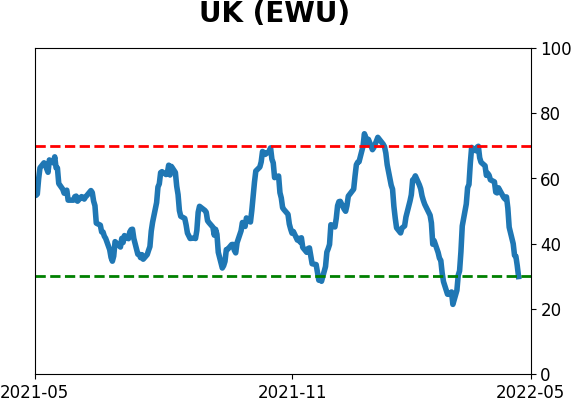
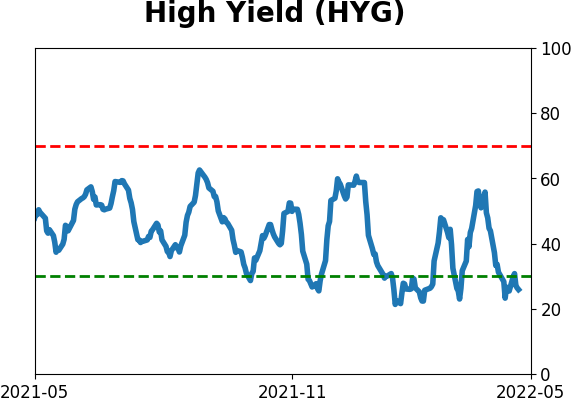
Sentiment Around The World
|
|
|
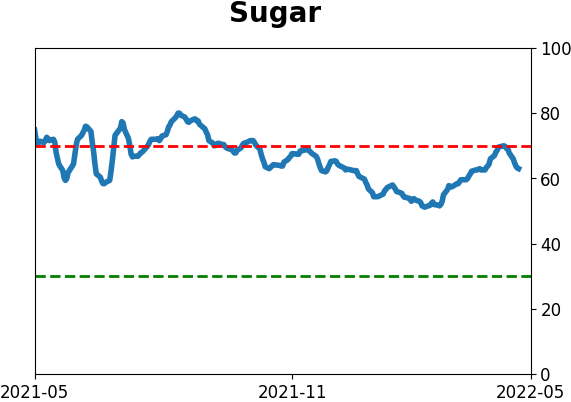
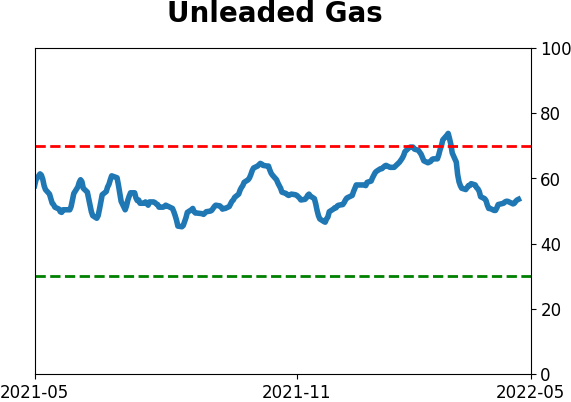
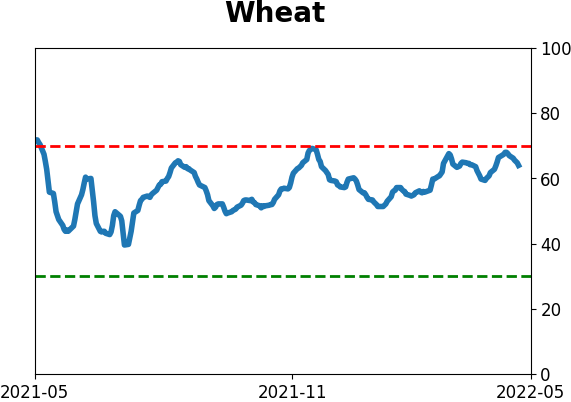
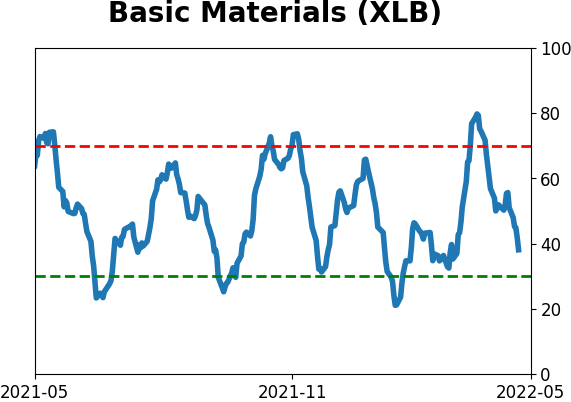
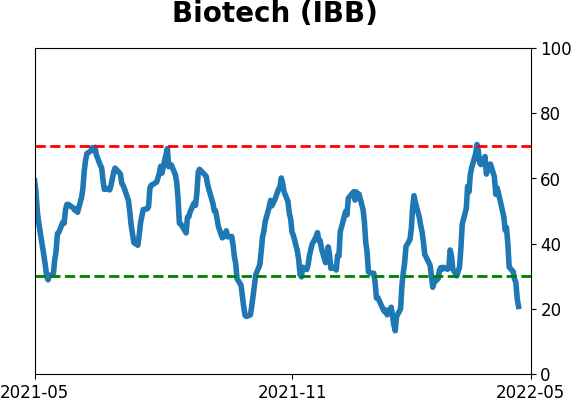
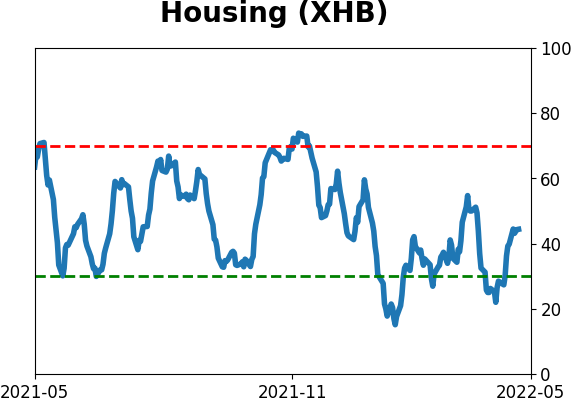
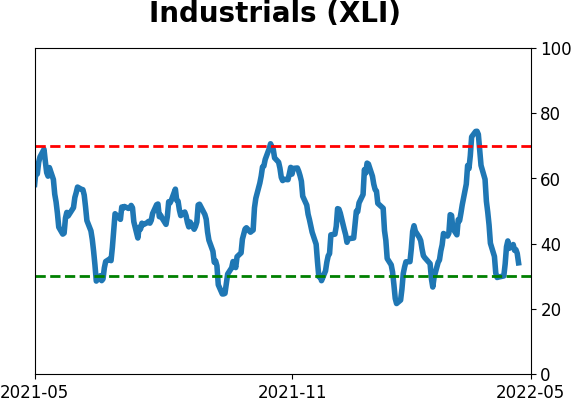
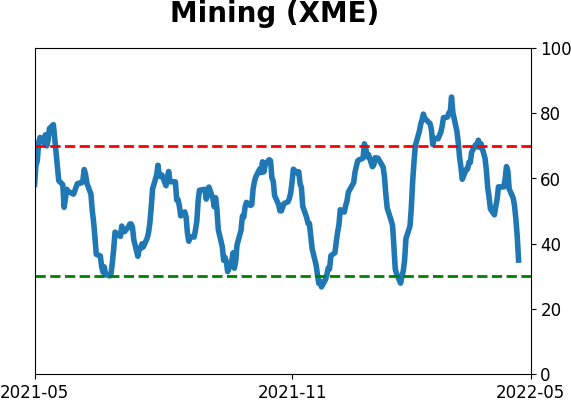
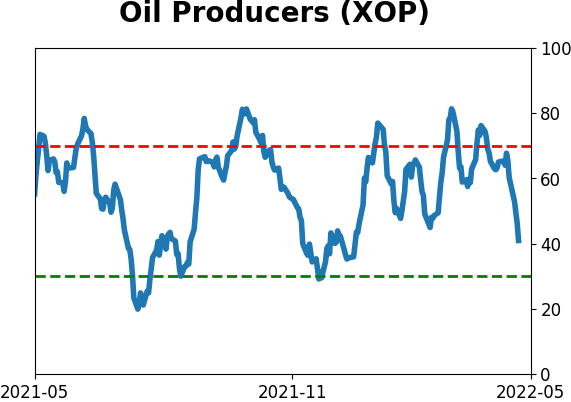
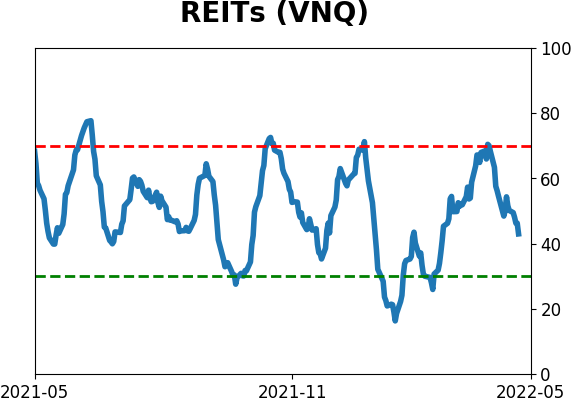
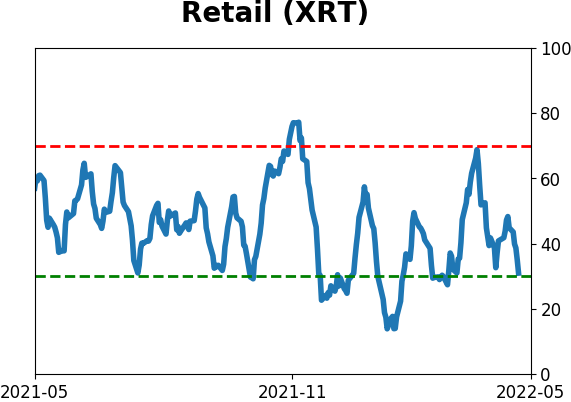
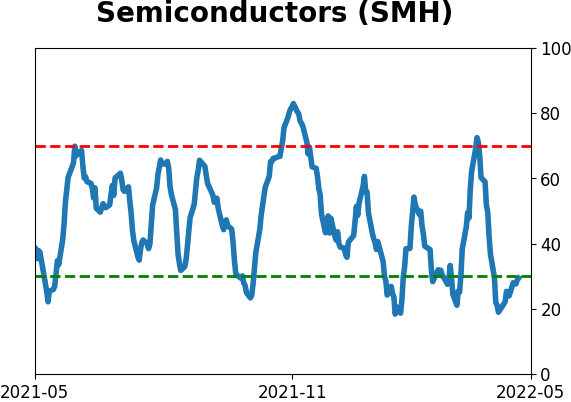
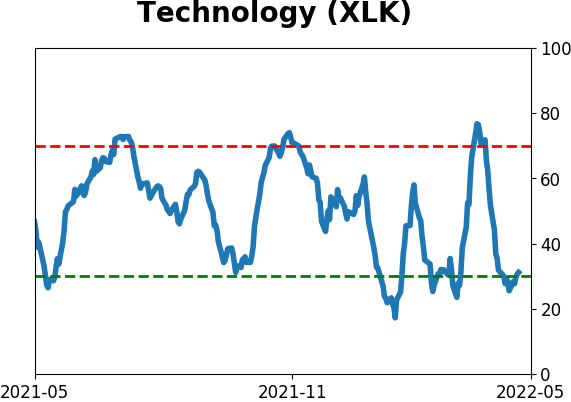
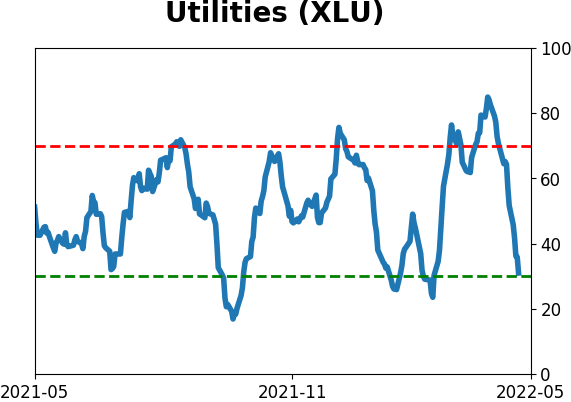
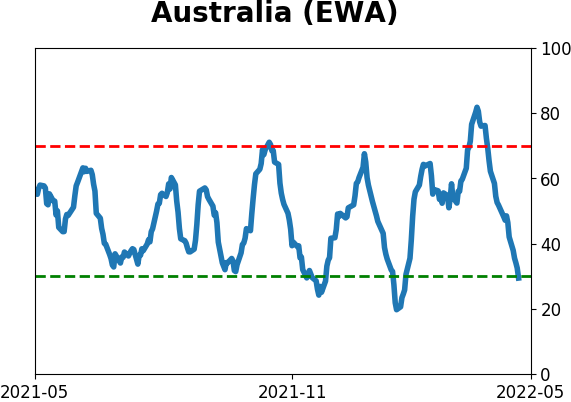
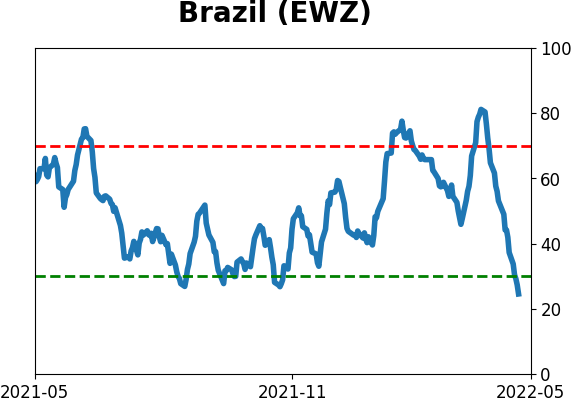
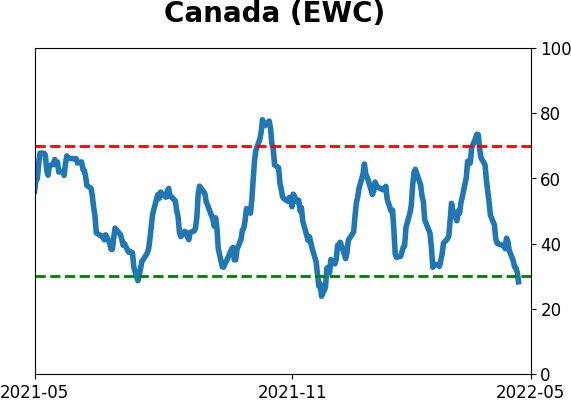
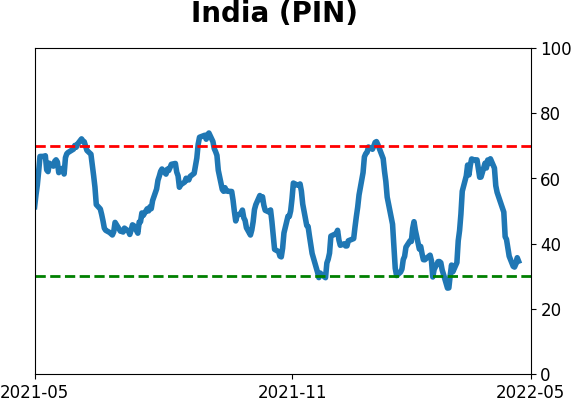
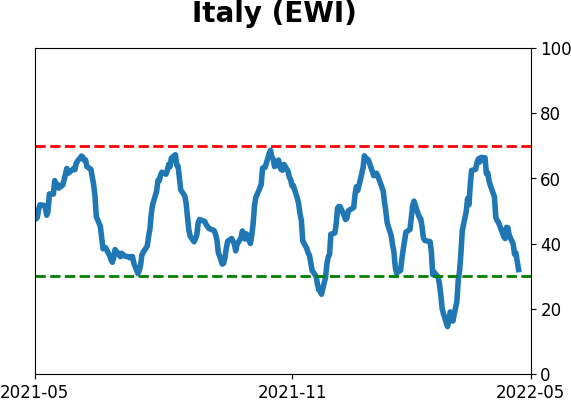
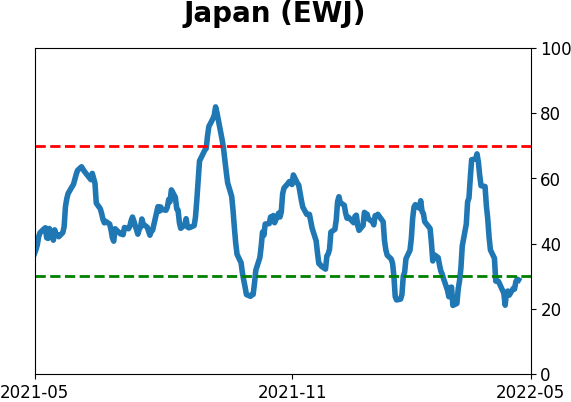
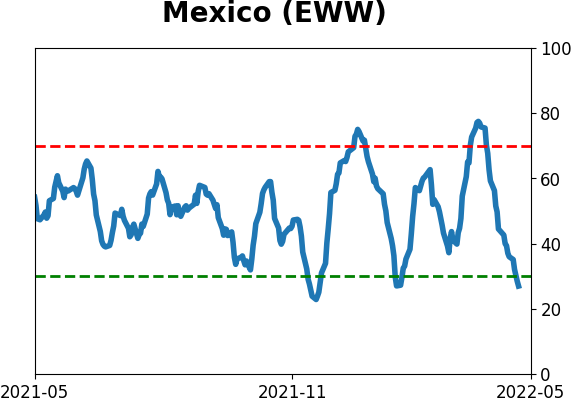
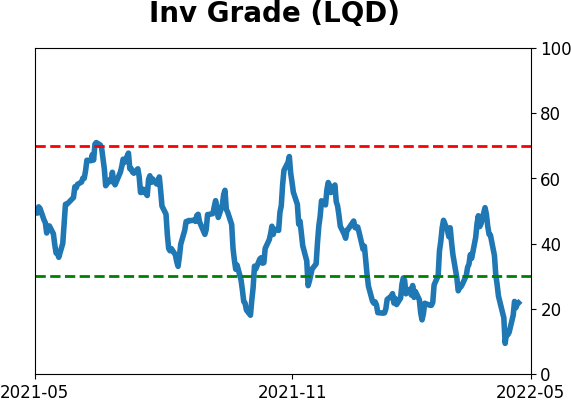
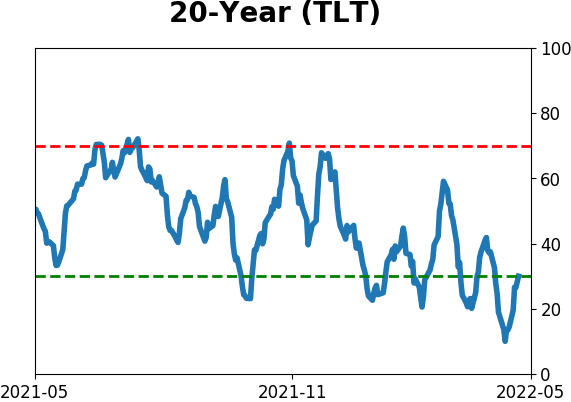
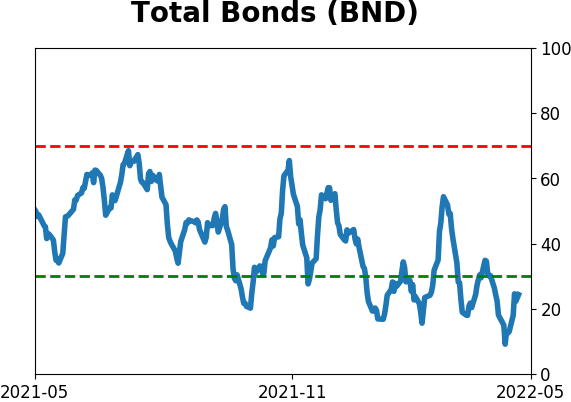
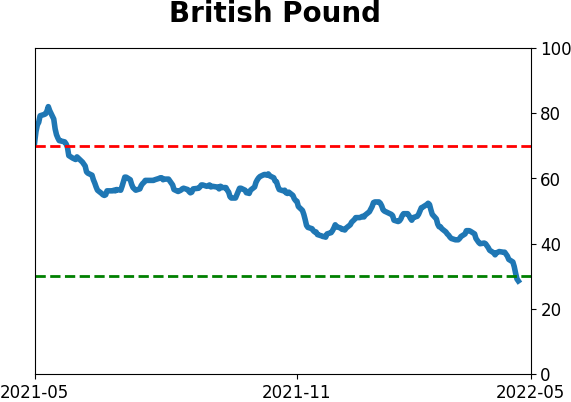
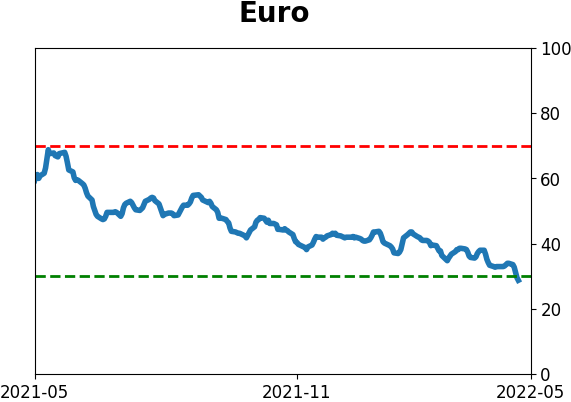
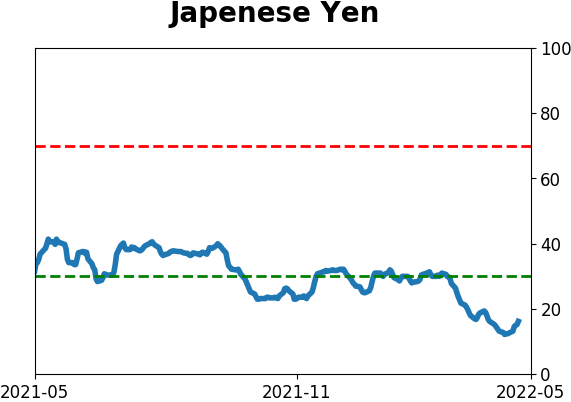
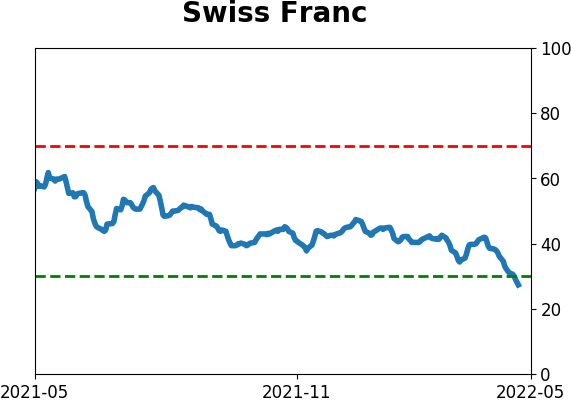
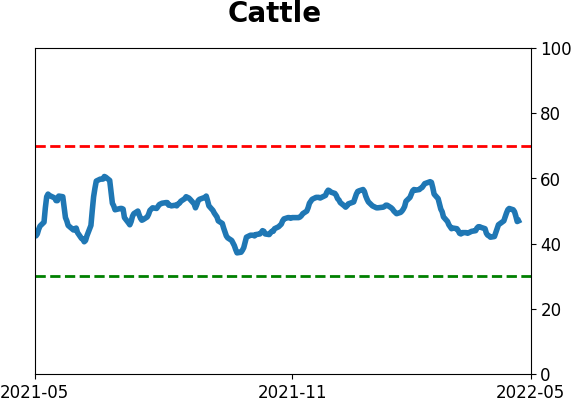
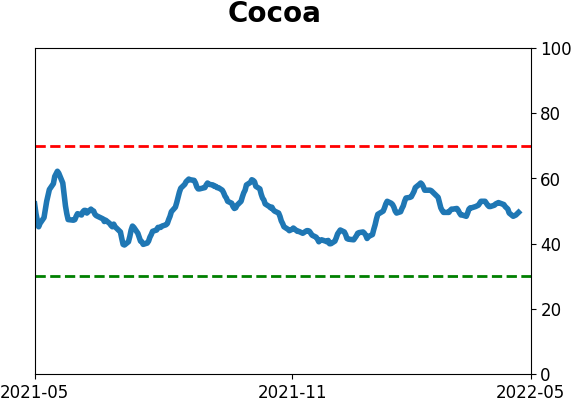
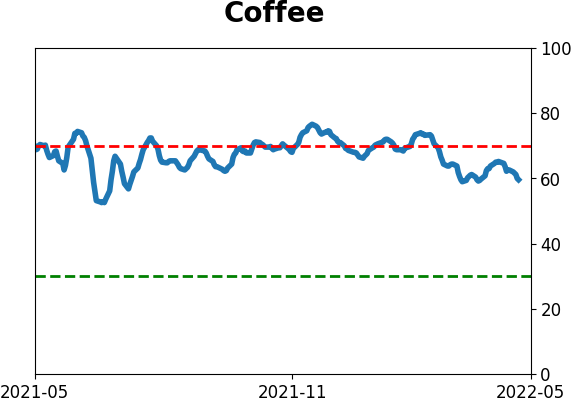
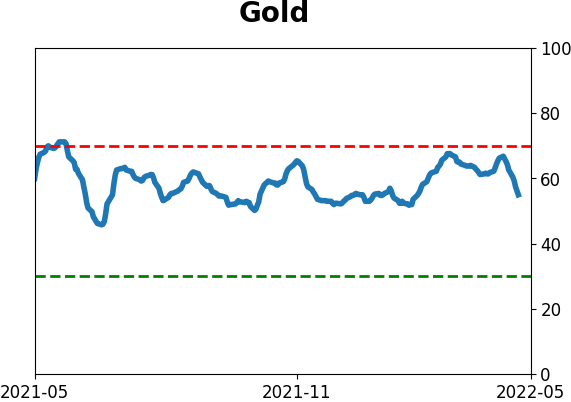
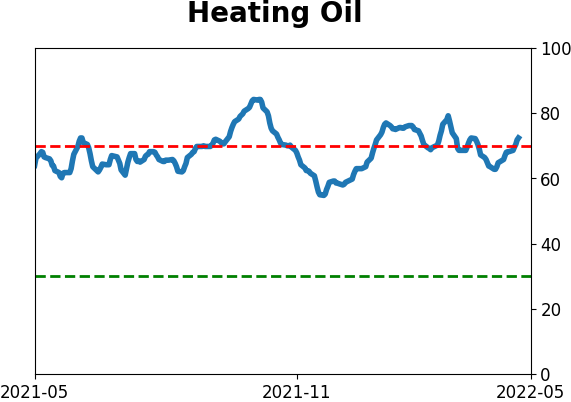
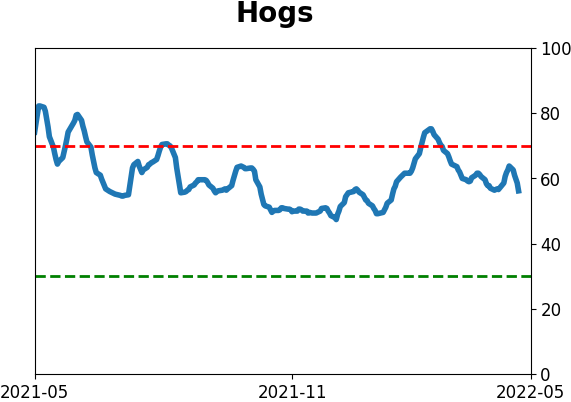
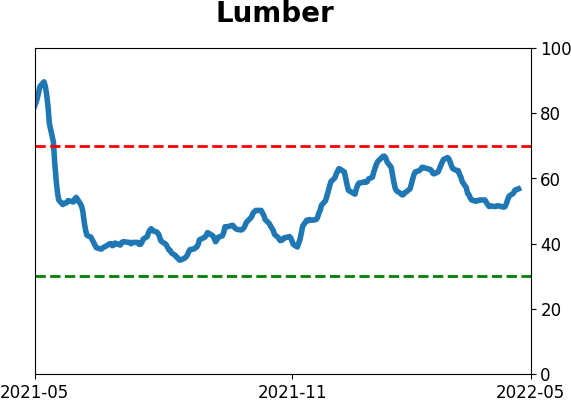
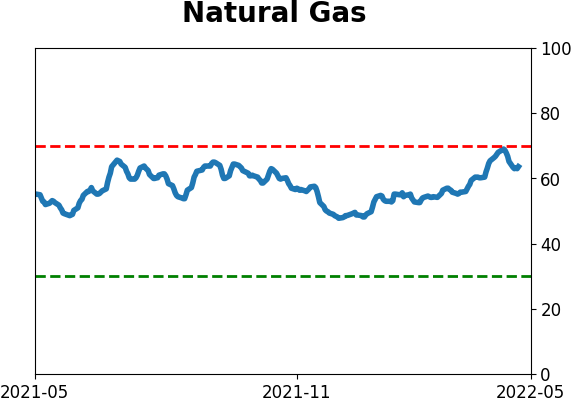
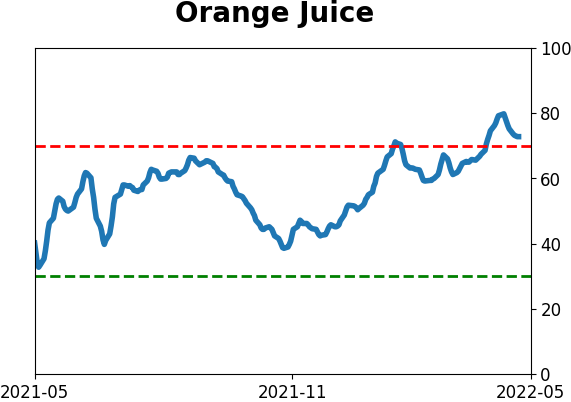
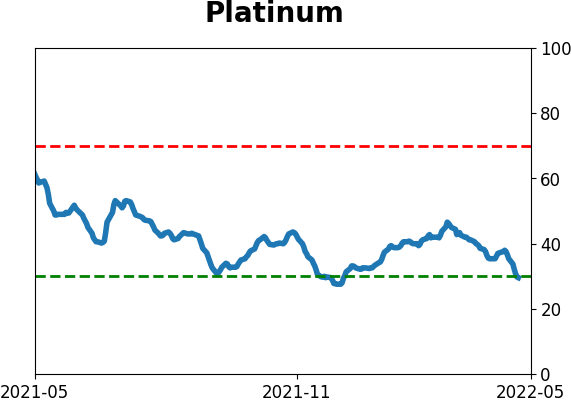
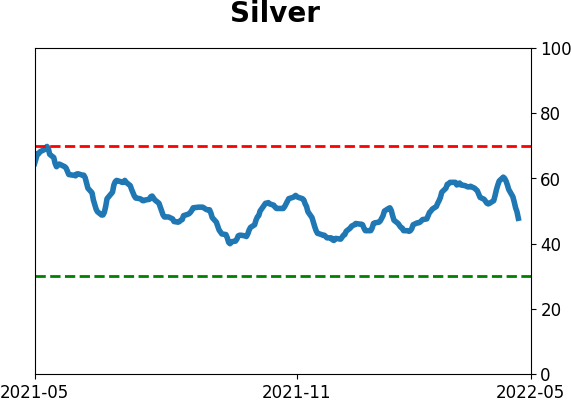
Optimism Index Thumbnails
|
|
|
|
|
|
|
|
|
|
|
|
|
|
|
|
|
|
|
|
|