Daily Report : TradingEdge Weekly for Apr 28 - Negative divergences, recovering junk, commodity struggles

| View/Print a PDF version of this Report |
Headlines
|
TradingEdge Weekly for Apr 28 - Negative divergences, recovering junk, commodity struggles: This week, we saw that divergences are starting to show among breadth metrics for S&P 500 stocks. Volatility has been dropping, but the volatility of volatility spiked. The high-yield bond market is recovering, a good sign for other markets. Uptrends among commodities are becoming harder to find. |
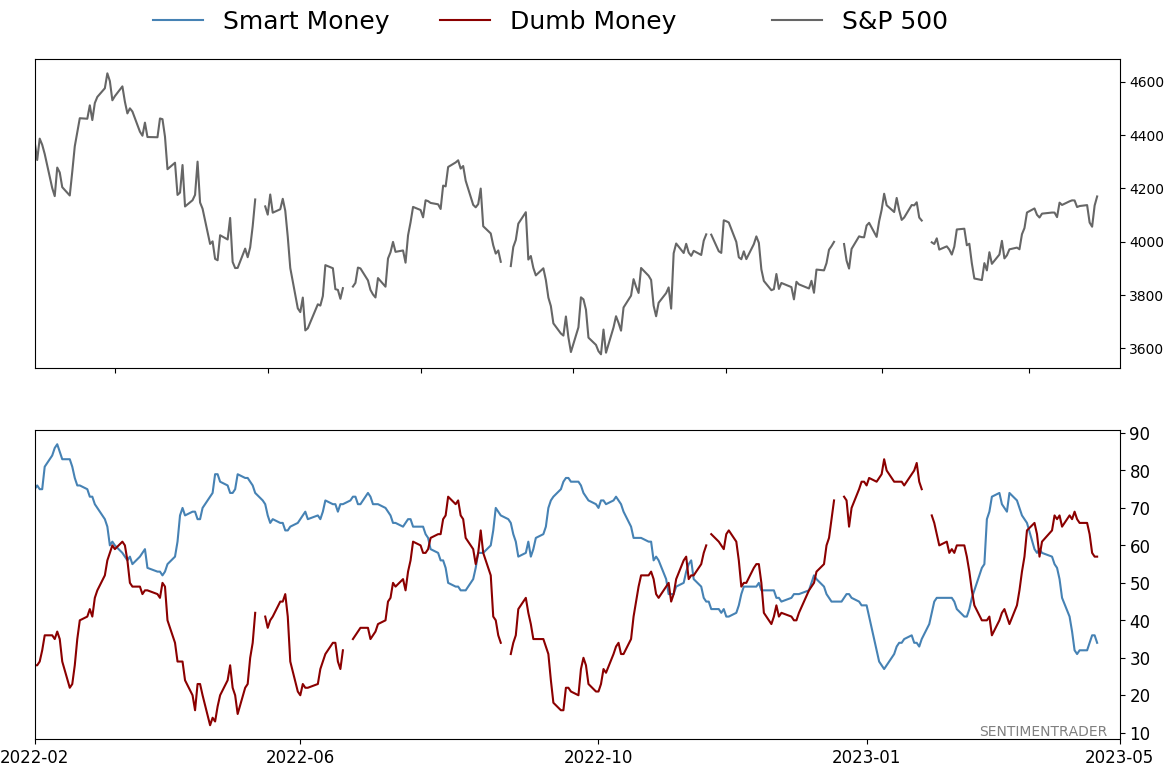
Smart / Dumb Money Confidence
|
|
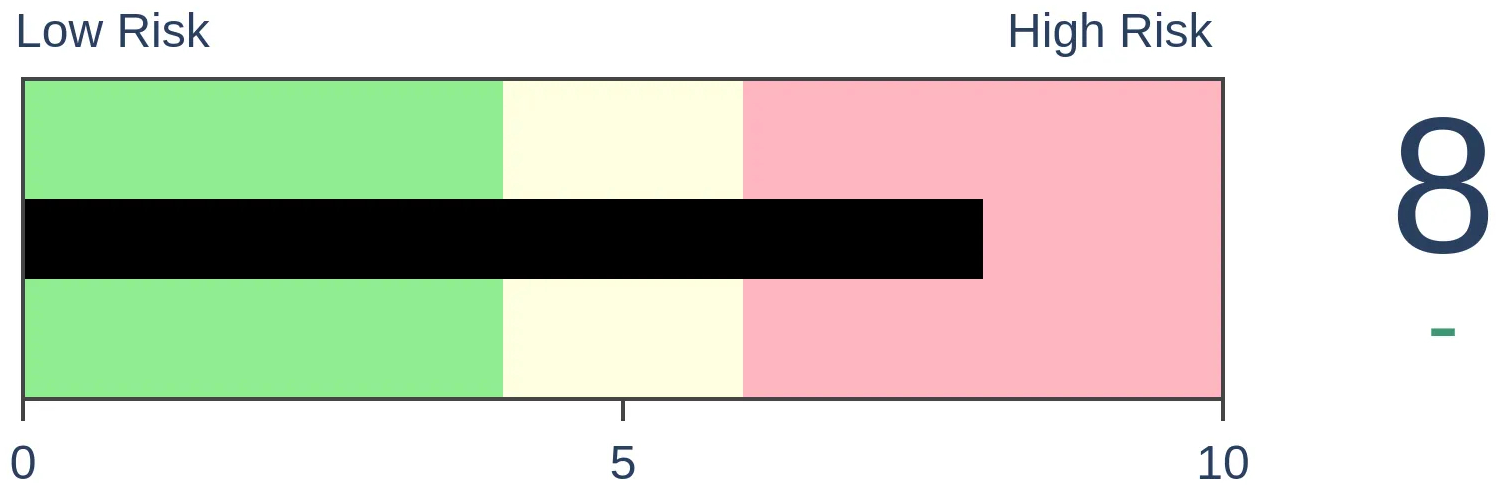
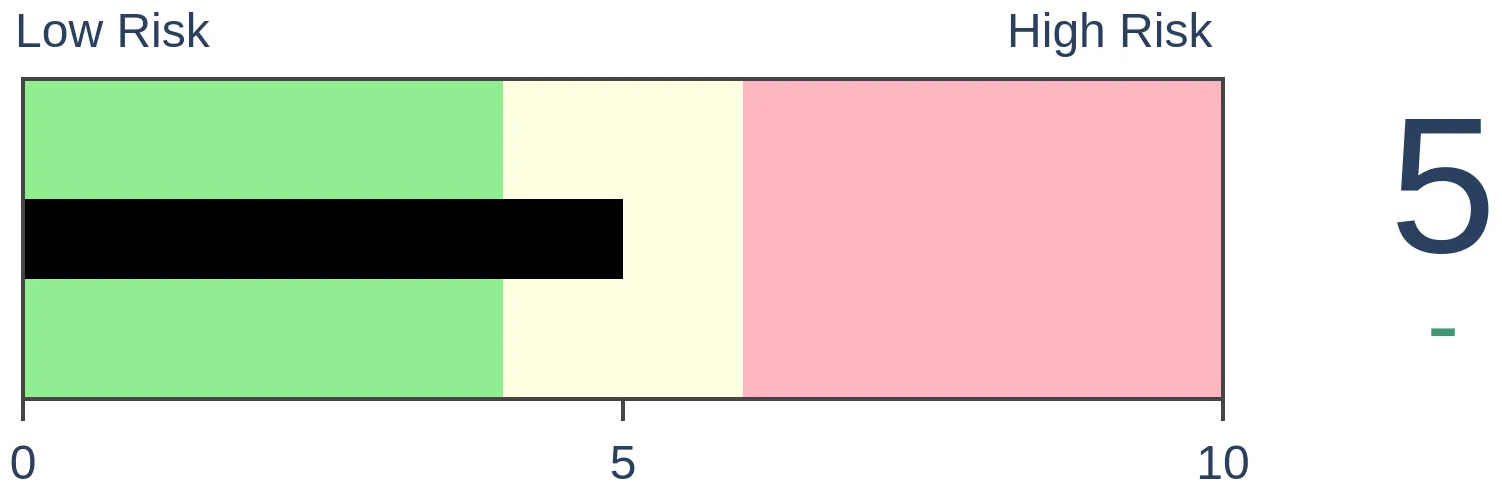
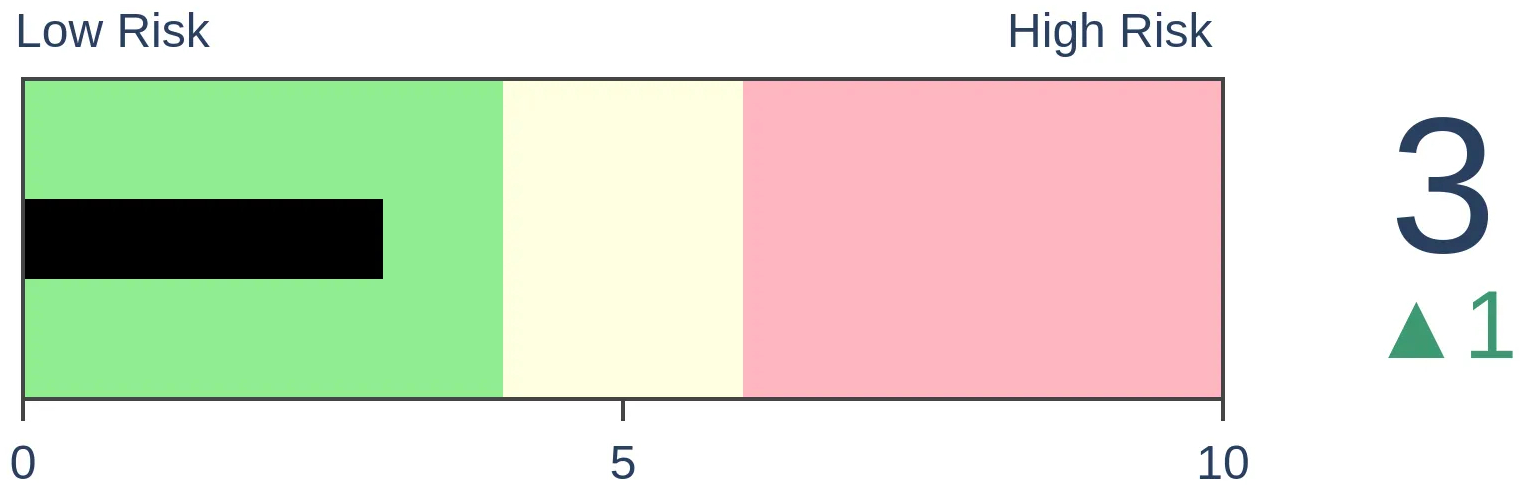
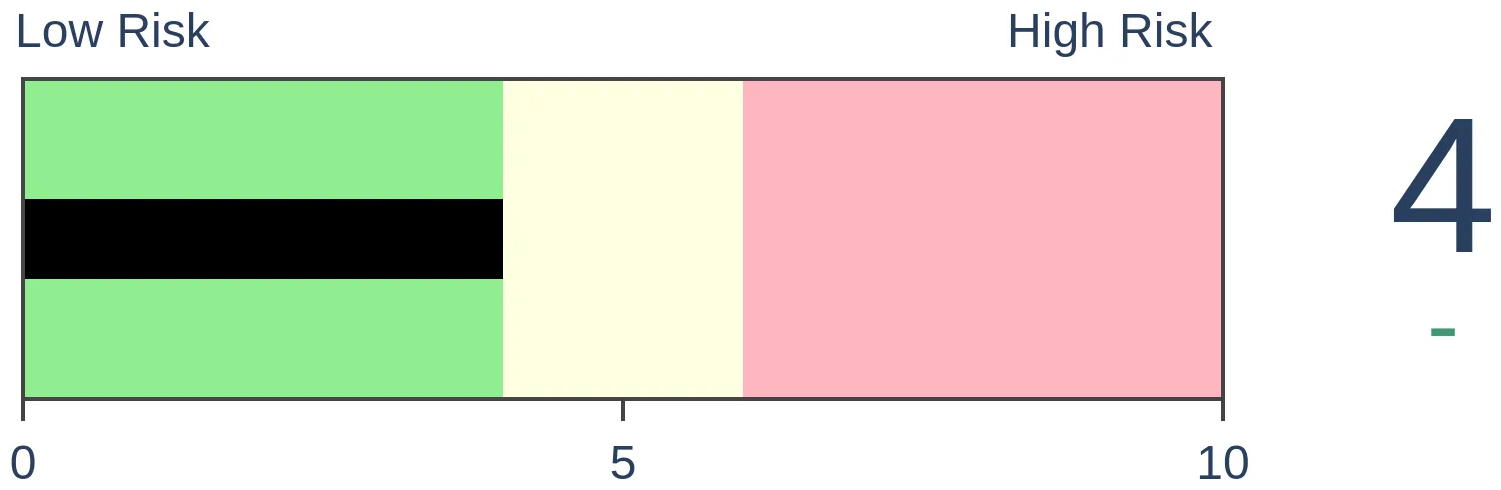
Risk Levels
|
|

|

Research
TradingEdge Weekly for Apr 28 - Negative divergences, recovering junk, commodity strugglesBy Jason GoepfertBOTTOM LINEThis week, we saw that divergences are starting to show among breadth metrics for S&P 500 stocks. Volatility has been dropping, but the volatility of volatility spiked. The high-yield bond market is recovering, a good sign for other markets. Uptrends among commodities are becoming harder to find. FORECAST / TIMEFRAME |
Key points:
- Breadth underlying the S&P 500 has been showing some divergences
- Volatility is low, but the volatility of volatility recently spiked
- A long-term look at breadth in the high-yield bond market is recovering
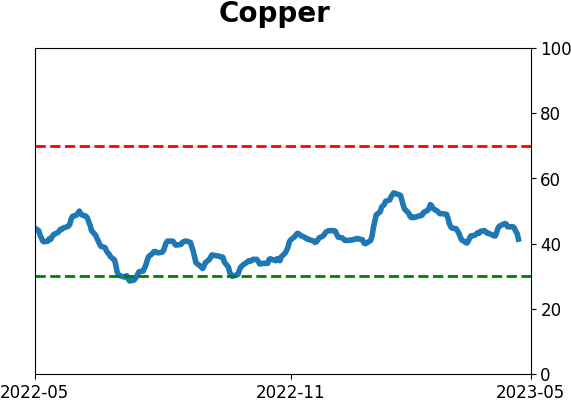
- The Copper/Gold ratio dipped to a low level
- Asia-Pacific stocks have lagged badly lately
- Sectors to be wary of for spring
- Uptrends among commodity contracts have faltered significantly and quickly
- Agriculture looks particularly bad
- Copper is facing a seasonal headwind
Negative divergences between indexes and their stocks
We've discussed several prevalent worries among investors in recent weeks, and we can add another that popped up this week. Breadth is showing negative divergences. By this, the usual definition is that price in, say, the S&P 500 is making higher highs while fewer of its stocks are holding above their moving averages.
We can see this in the percentage of stocks trading above their 50-day moving averages. When the S&P formed a 30-day peak in February, more than 74% of its stocks traded above their 50-day; on April 18, barely 60% of stocks were.
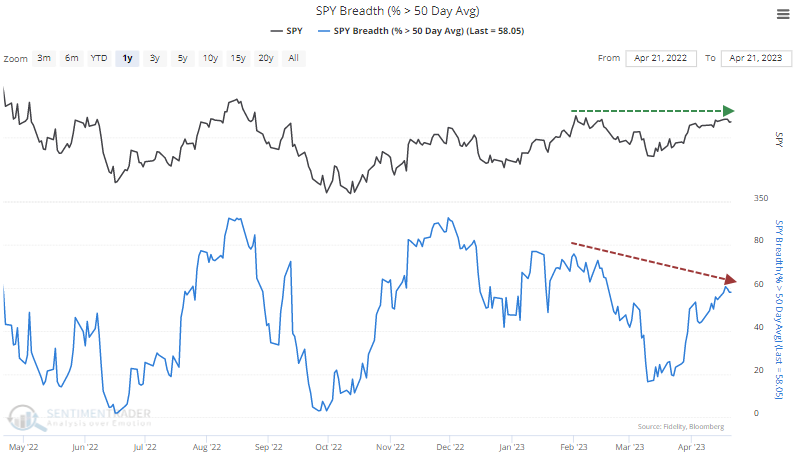
It's also evident in the percentage of stocks above their 200-day averages. In February, more than 78% of stocks traded above their long-term averages. By last week, that had dropped to fewer than 62%.
Let's go back to 1928 and look for every date when the S&P 500 carved out a 30-day peak. This is the highest price reached in at least 30 days on either side of that date. Then we'll look at the next date when the S&P hit a 30-day high, but we won't know in advance that it's a peak so we won't suffer from look-ahead bias. That allows us to compare breadth readings between the two dates and look at divergences.
The table below looks at S&P returns following the most negative divergences when the percentage of members above their 50- and 200-day moving averages was at least 10% below the immediately preceding 30-day peak figures. In our current instance, it's comparing the figures on April 18 to those recorded on February 2.
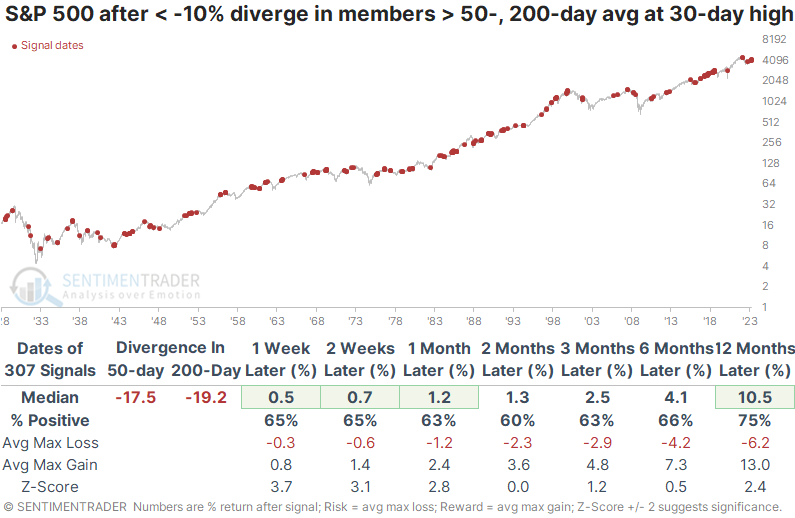
At these divergences, there were about 17% fewer members above their 50-day moving averages and nearly 20% fewer members above their 200-day averages. There was a large sample size, with more than 300 signals since 1928. And the S&P's returns going forward weren't too bad - above average on most time frames.
It's not like these were great buy signals, with only a moderate win rate and an unimpressive ratio of maximum gains to maximum losses. Still, it didn't seem like a great excuse to hit the sell button.
Since the 2008 financial crisis, these divergences gave investors a good heads-up in 2018 and before some hefty losses last year. But other than that, investors would have missed incredible gains by selling based on these signals. A year later, the S&P was up 92% of the time (most of the study period was dominated by bull markets), though its average return was well below random.
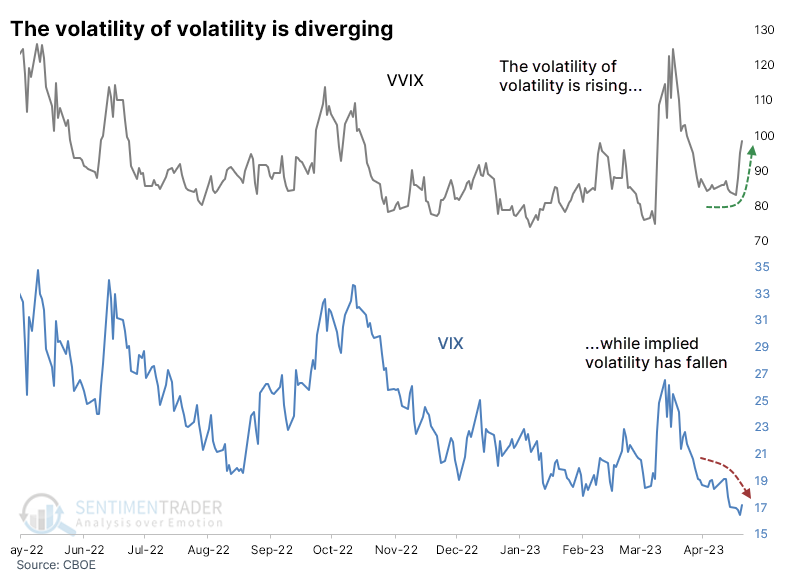
Volatility is too low, according to the volatility of volatility
Another investor worry is that volatility itself is too volatile. The VIX "fear gauge" has been dropping, but traders are pricing in larger moves in the coming weeks. An index called the VVIX tracks this phenomenon, and it has been jumping to multi-week highs even while the VIX itself crumbles.
After these signals, the S&P's returns were pretty poor up to three months later. That's almost entirely due to a couple of signals in 2008, though, and the latest one from last August.
For the VIX itself, these were decent buy signals. Over the next couple of weeks, the VIX rose after 10 out of 11 signals, and the lone loss was reversed in the weeks ahead. Unfortunately, it's next to impossible to trade the VIX. The ETF proxies designed to track it are some of the worst creations ever to be listed, and most traders have no interest in constructing complicated options positions to try to mimic it.
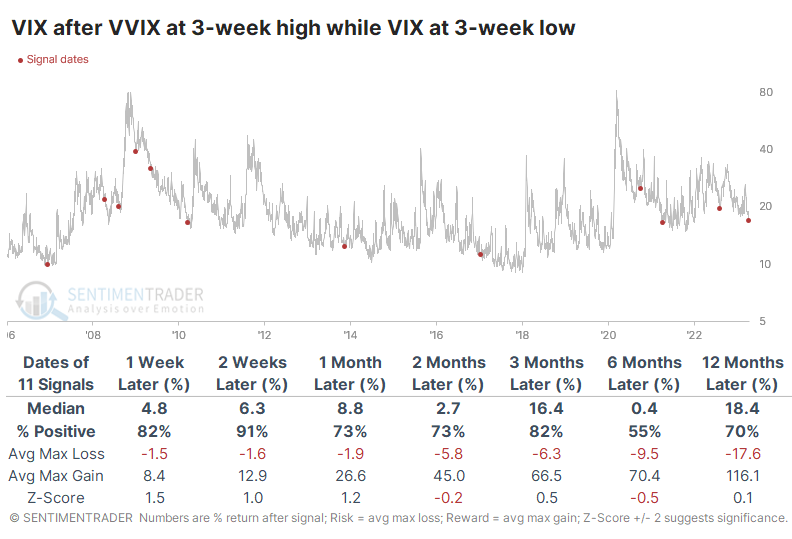
Some gravitate to safe havens, like bonds or gold, as an alternative to the VIX. Well, those haven't been great outlets, either. A fund like TLT, which tracks Treasury notes, has been an even worse holding than the S&P after these signals. Over the next month, only a single signal showed a positive return.
Gold has been a better alternative, but not in the short term. Over the next few months, gold gained after 8 of the 11 signals, but the three losses were fairly significant, including the last one.
High-yield bonds are recovering
Jay noted that because the high-yield bond market is tied closely to economic activity, it can act as a valuable barometer for many currently range-bound markets.
One primary indicator shows the net number of high-yield bonds that set a 52-week high minus those that set a 52-week low on the day. This indicator has shown value as a longer-term trend reversal confirmation type of indicator. The chart below displays HYG and a 200-day moving average of New Highs - New Lows among high-yield bonds.
The chart plots a red dot on those dates when the 200-day moving average of the High-Yield Bond NH-NL indicator crossed above -100, and the table summarizes subsequent HYG performance.
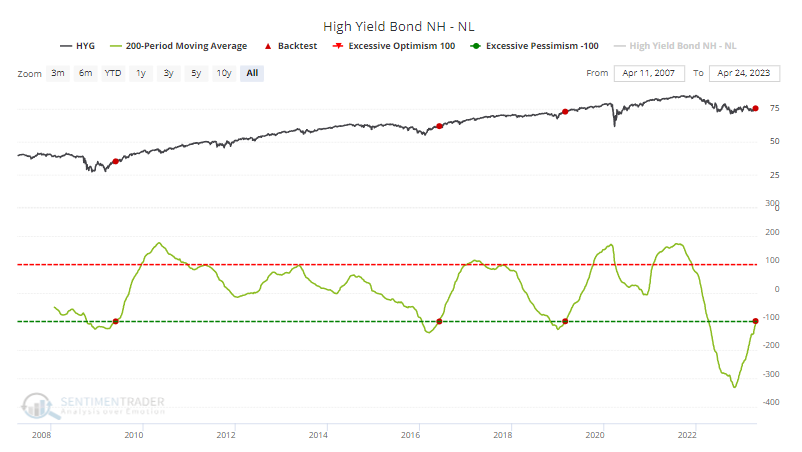
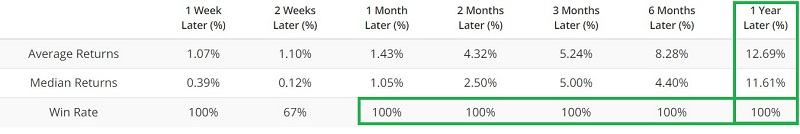
The good news is that historical performance has been decidedly bullish following previous signals. The obvious potential problems here are a) an exceedingly small sample size and b) all the signals that occurred during a significantly bullish period (Post 2008 GFC).
The other interesting thing to note is that many other markets also appear to dance to the tune of the high-yield bond market.
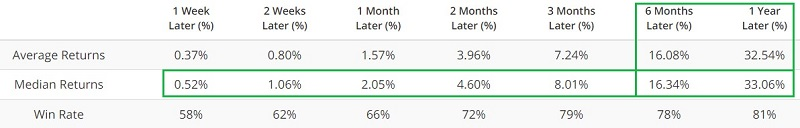
The table below summarizes subsequent SPDR S&P 500 ETF Trust (SPY) performance after these signals. Performance during the first two weeks after a signal has been weak, but two months and out has been favorable. Over the past five years, tickers HYG and SPY have fluctuated with a roughly 76% correlation.
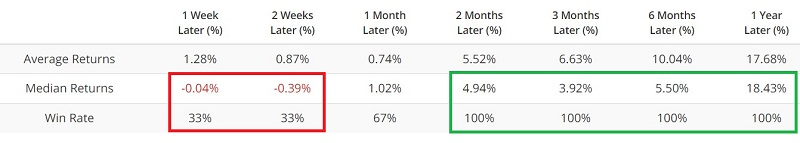
Like high-yield bonds and stocks, the broader bond market has also shown favorable results following the admittedly limited number of previous signals. Gold has had an interesting response following previous High-Yield Bond NH-NL signals. Results during the first three months after a signal were weak, but six and twelve months were quite positive.
Copper/Gold ratio dips to a low level
Copper has been losing ground to gold, which Jay shows has significant implications for the financial markets.
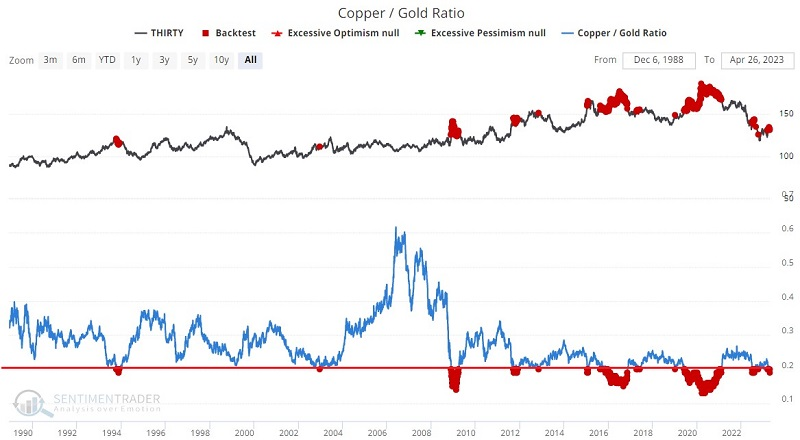
The copper/gold ratio is popular and widely followed because a) many market participants perceive Doctor Copper to have "a Ph.D. in economics." Likewise, gold is considered by some to be "the ultimate store of value" and also a hedge against inflation and other economic turmoil. There is a typical ebb and flow to the relationship between the primary industrial metal and the primary precious metal. At times this ratio can reach extremes. In this study, we highlight the 0.20 level as an important cutoff value.
The chart below displays price action for 30-year treasury bonds at the top and highlights with a red dot all days when the copper/gold ratio was below 0.20.
Two key things to note:
- The Win Rates remind us that it is no sure thing that t-bonds will decline
- Both average and median returns get worse across progressive timeframes
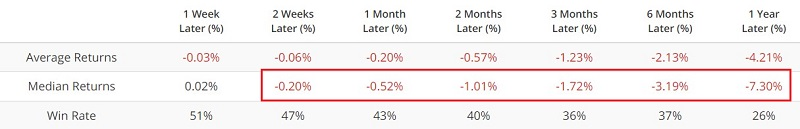
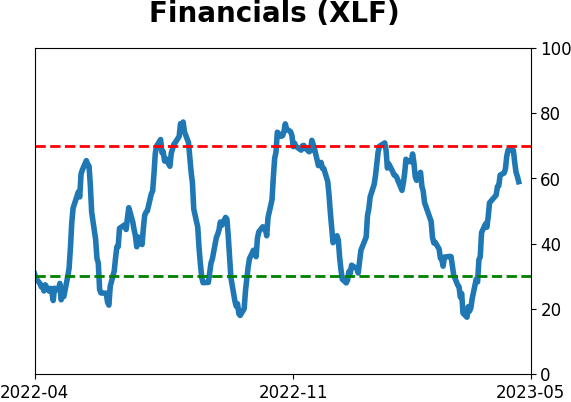
Both long-term treasury bonds and stocks in the financial sector are affected by fluctuations in interest rates. So many would likely assume that what's bad for bonds is probably bad for financial stocks. But in the case of the copper/gold ratio, the numbers tell a different story.
The chart below displays price action for Financial Select Sector SPDR Fund (ticker XLF) after all days when the copper/gold ratio was below 0.20.
The Win Rates remind us that it is no sure thing that financial stocks will rally but it is interesting to note that both average and median returns get better across each progressive timeframe.
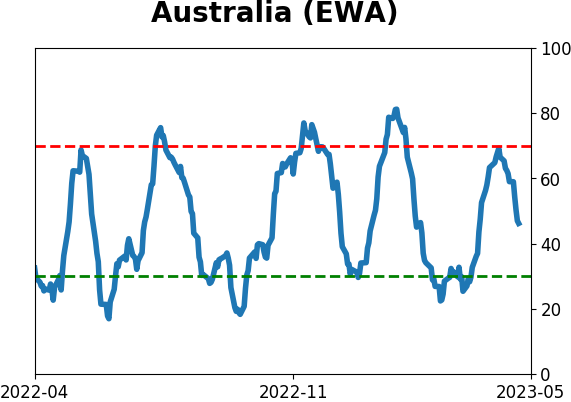
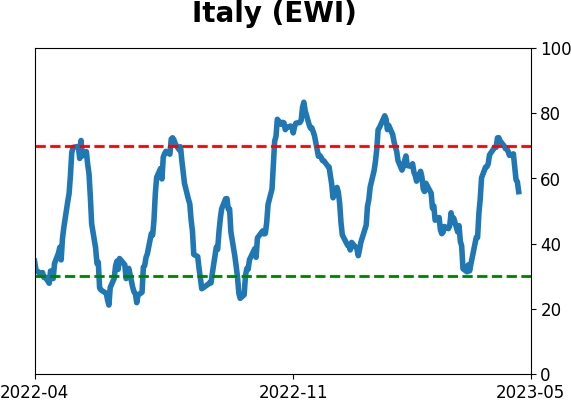
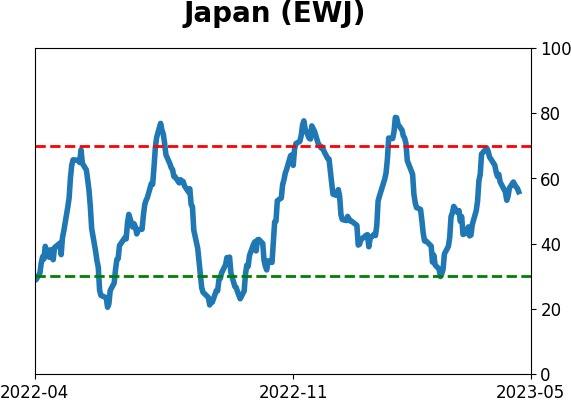
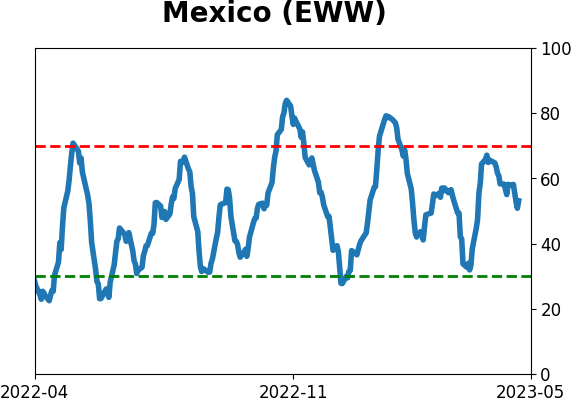
Asian-Pacific stocks are acting particularly weak
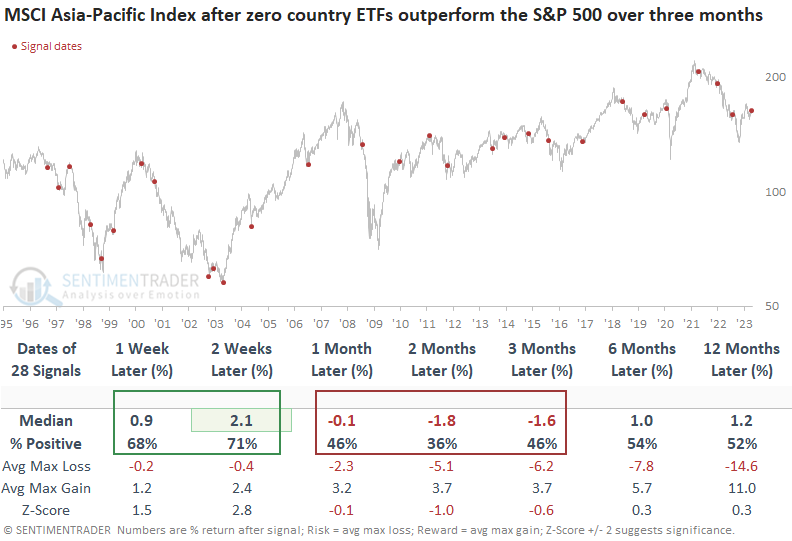
Not a single Asia-Pacific country ETF outperformed the S&P 500 over the last three months. Dean showed that similar relative performance trends did not bode well for absolute returns for the MSCI Asia-Pacific Index.
Over the last three months, not a single Asia-Pacific country ETF outperform the S&P 500. When fewer than 5% of Asia-Pacific country ETFs outperform the S&P 500 over three months, the MSCI Asia-Pacific Index shows an annual return of -15%.
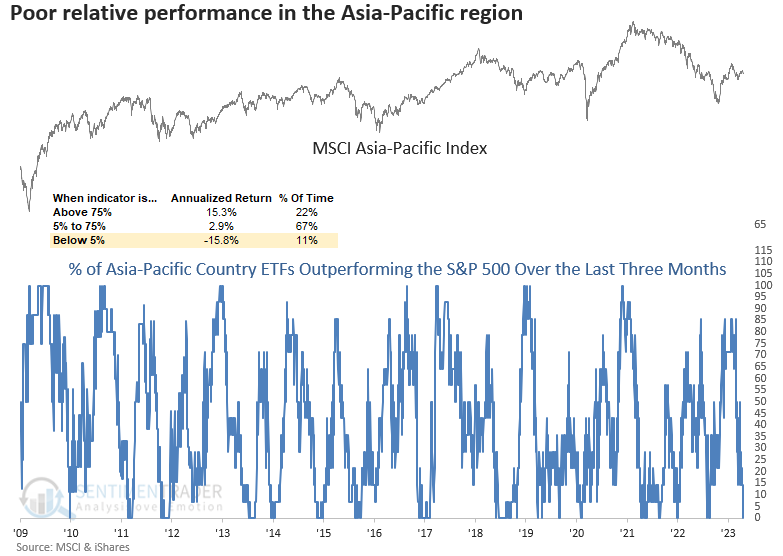
When not a single Asia-Pacific country ETF outperforms the S&P 500 over three months, the weak relative performance tends to presage an unfavorable outlook for the MSCI Asia-Pacific Index over the next one to three months. Since 2008, 14 out of 15 signals showed a negative return sometime in the next few months.
When the percentage of ETFs outperforming the S&P 500 is weak over three and twelve months, all is not well in the export-driven manufacturing region. Forward returns for the MSCI Asia-Pacific Index look even worse in the one- to three-month horizon.
Sectors to be wary of for spring
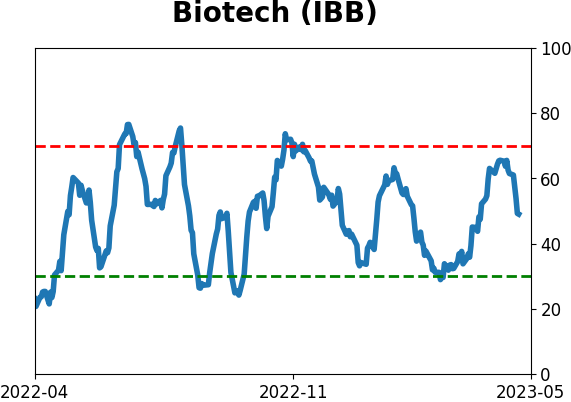
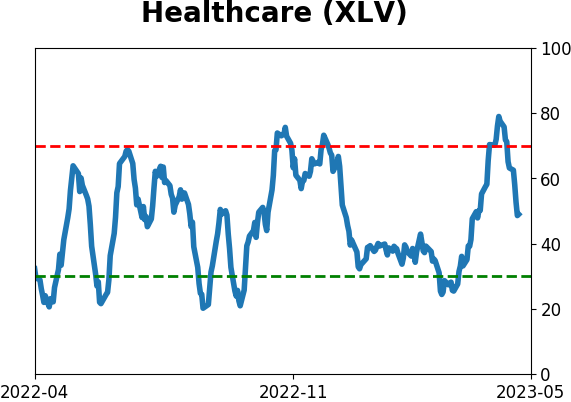
Jay suggested that seasonal trends do not predict what will happen, but they can be useful in helping to decide where best to allocate capital. Specific sectors tend to show weakness during early to mid spring, including Biotech, Home Builders, and Emerging Markets.
The chart below displays the annual seasonal trend for iShares Biotechnology ETF (ticker IBB). The period from Trading Day of Year (TDY) #80 through TDY #113 is highlighted in the red box. For 2023, this period extends from the close on 2023-04-27 through 2023-06-14.
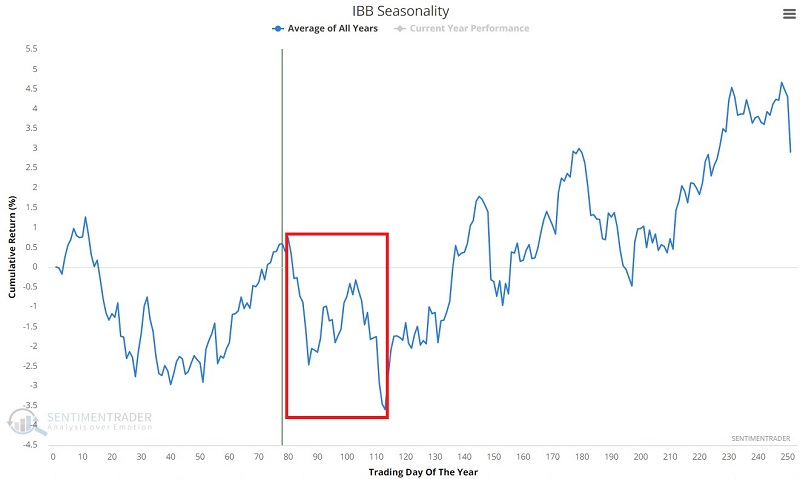
Over its history, IBB has rallied 43% of the time during these windows, with a median loss almost twice as large as its median gain, and was more than twice as likely to see a negative move of 6% than a positive one.
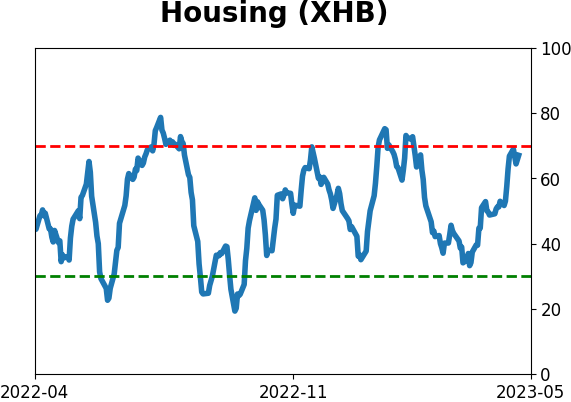
The chart below displays the annual seasonal trend for SPDR S&P Homebuilders ETF (ticker XHB). The period from Trading Day of Year (TDY) #81 through TDY #131 is highlighted in the red box. For 2023, this period extends from the close on 2023-04-28 through 2023-07-11.
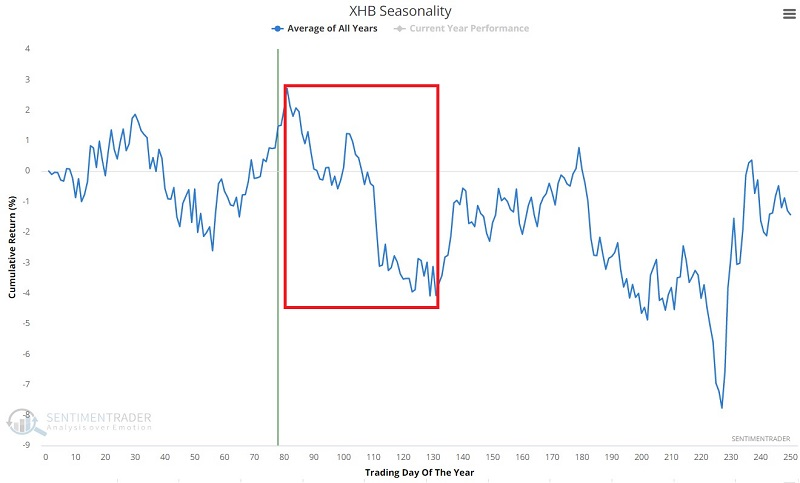
During these windows, XHB gained 41% of the time. Its median decline was a whopping -10.1% versus a median gain of only +2.9%. It lost more than -6% during seven years while gaining more than +6% only once.
The chart below displays the annual seasonal trend for iShares MSCI Emerging Markets ETF (ticker EEM). The period from Trading Day of Year (TDY) #78 through TDY #99 is highlighted in the red box. For 2023, this period extends from the close on 2023-04-25 through 2023-05-24.
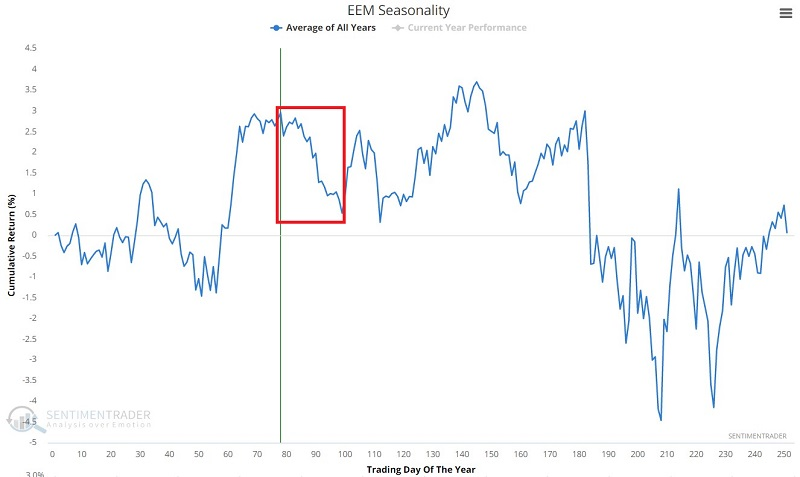
The EEM fund rallied 40% of the time during these windows. Its median loss (-5.9%) was more than twice as large as its median gain (+2.6%) and it lost more than -6% during six years while rallying more than +6% only once.
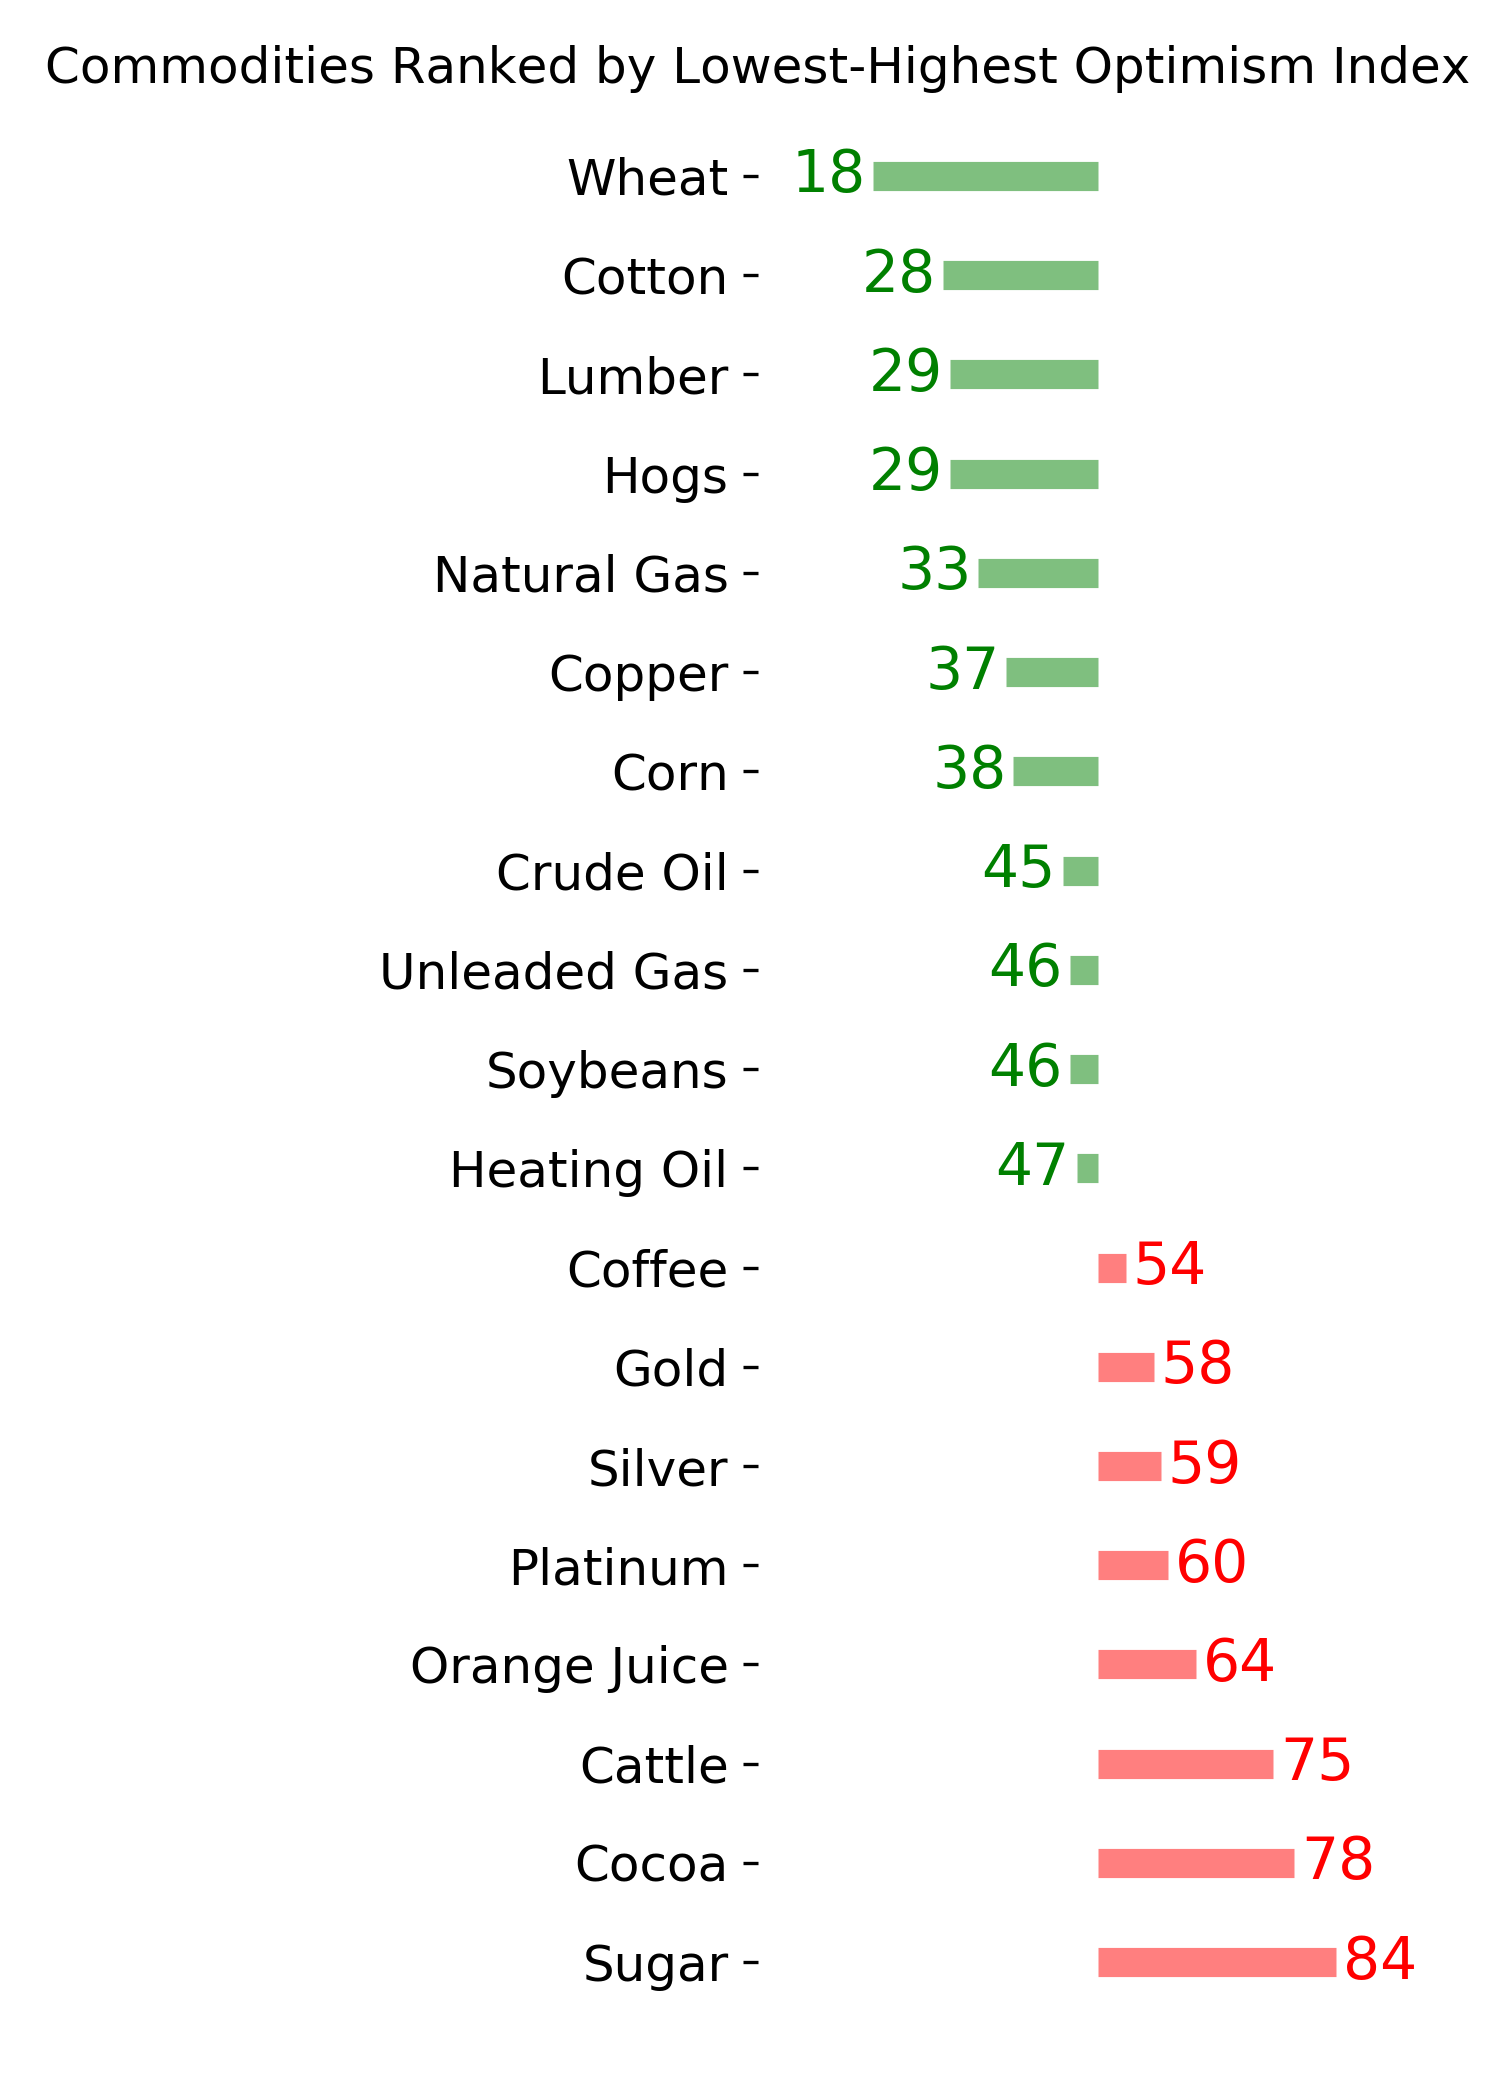
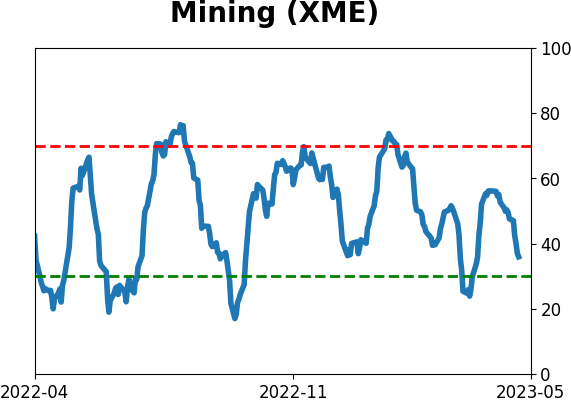
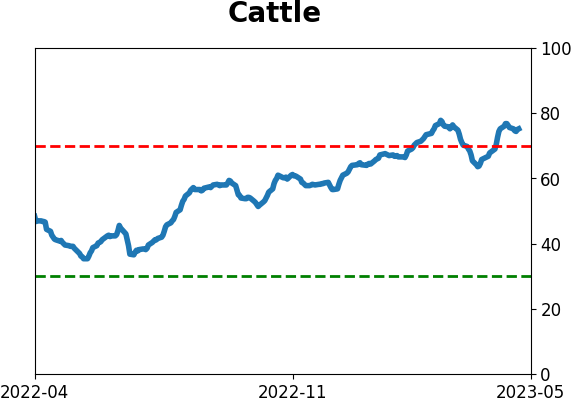
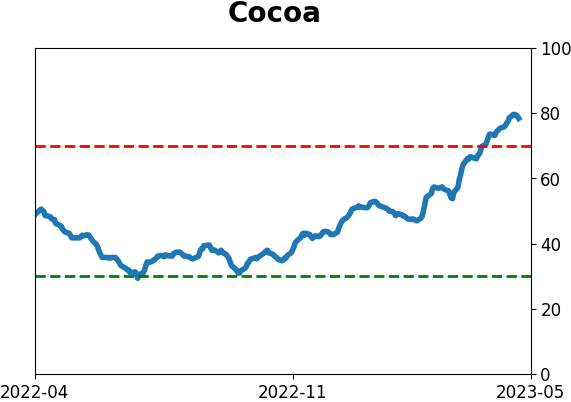
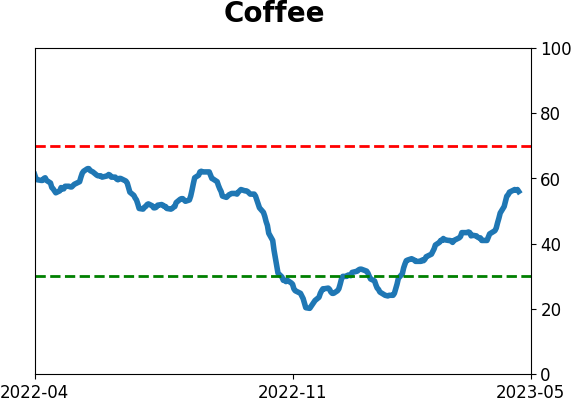
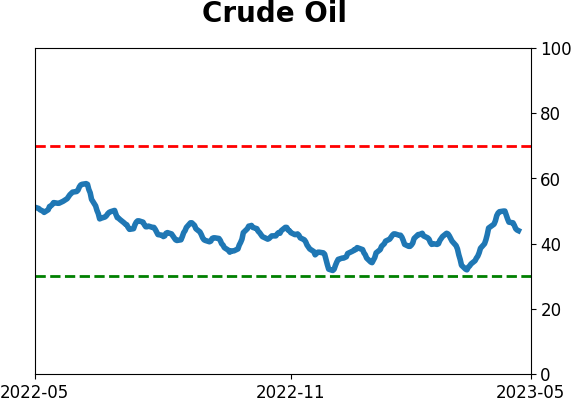
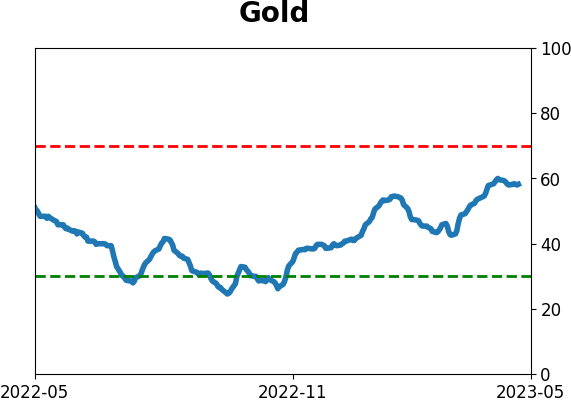
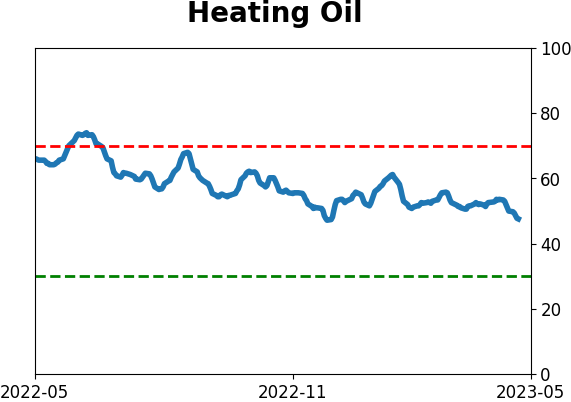
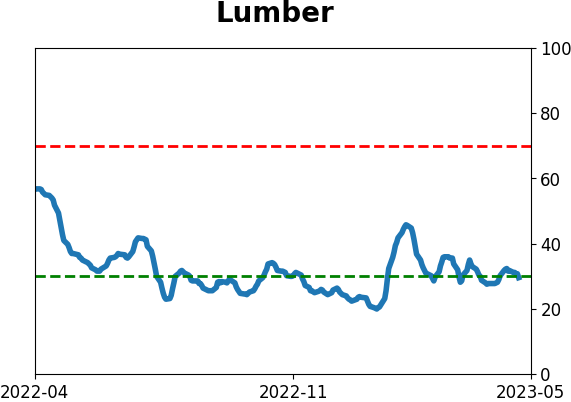
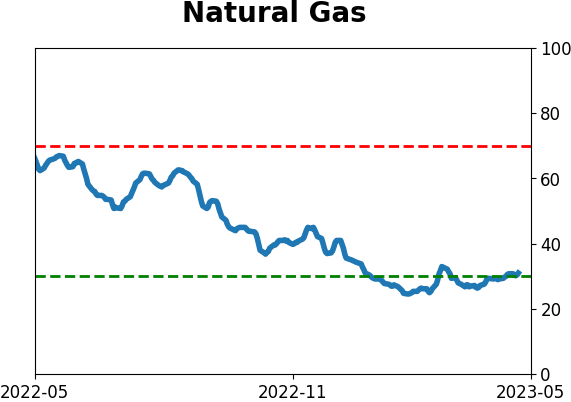
Commodity breadth is weakening quickly
Dean noted that a breadth composite for commodities declined by more than 30% in five days, and similar downshifts in price trends led to unfavorable returns over the next three months.
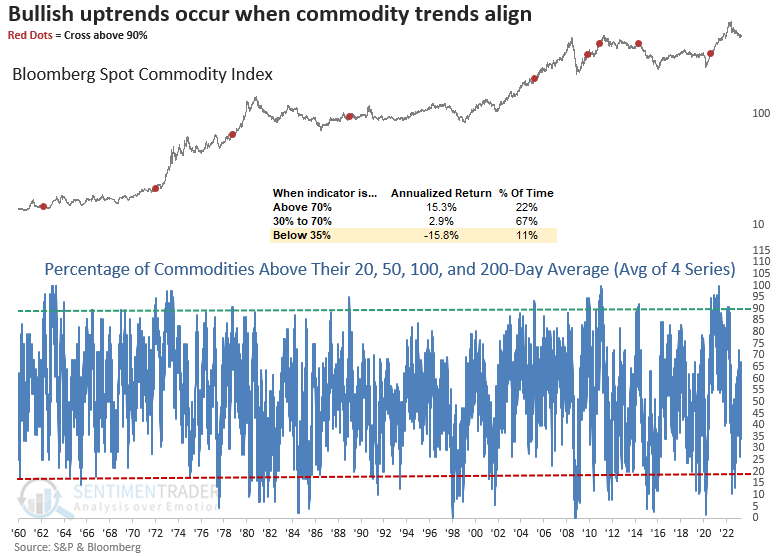
The composite combines the percentage of commodities trading above their 20, 50, 100, and 200-day averages. A decline of more than 30% over only five days last occurred during the Covid crash in January 2020.
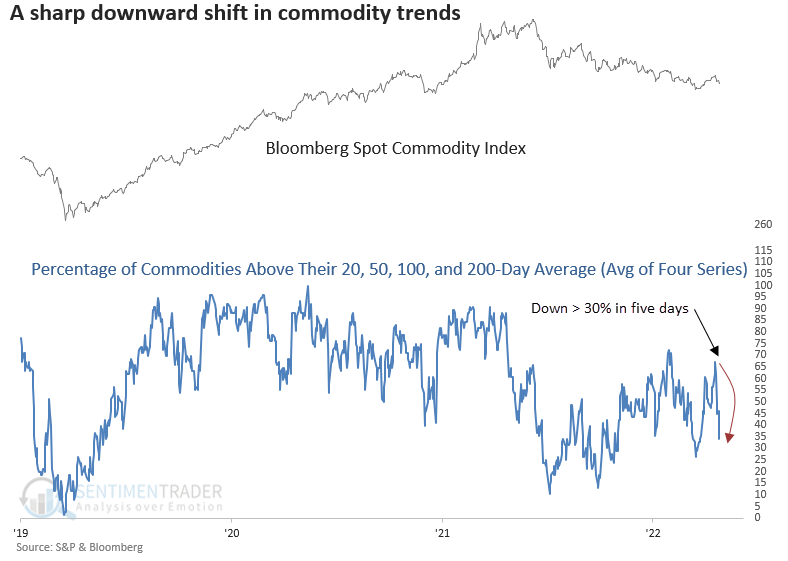
The composite does not include gold and silver. And the signal includes two additional conditions for context similar to the current environment.
- The percentage of commodities above their 200-day average < 42%
- The average for the composite < 42%
When the commodity composite falls by 30% or more in five days or less, the Bloomberg Spot Commodity Index tends to decline on a consistent basis over the next three months.
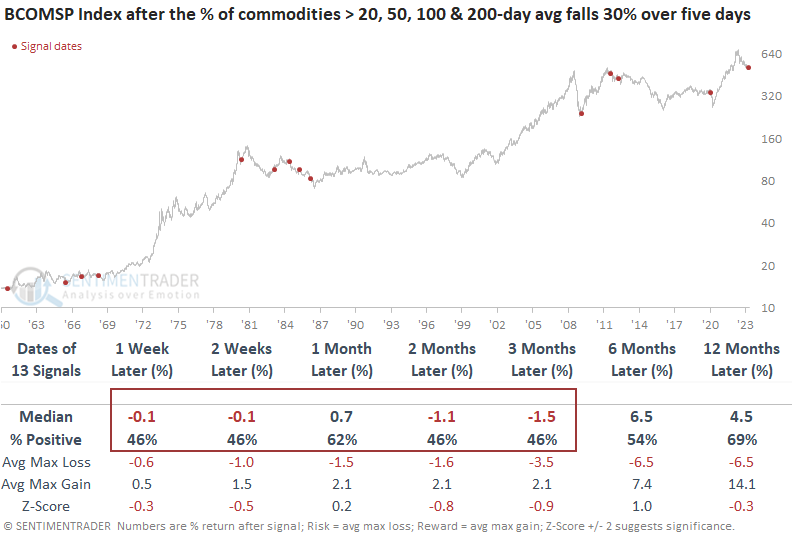
When the composite cycles downward near a high, returns and win rates for the Commodity Index look worse across all time frames. The previous signal occurred right after the significant rally from June to August 2022, which coincided with a broad selloff in risk assets.
The Bloomberg Spot Commodity Index returns are excellent when the composite averages 70% or greater. And a cross above 90% typically indicates a secular uptrend. They're a long way from that positive condition now.
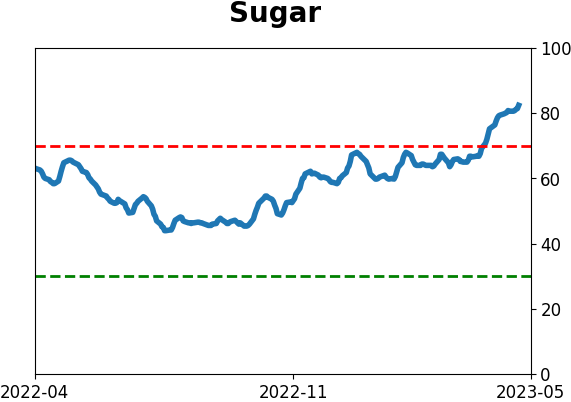
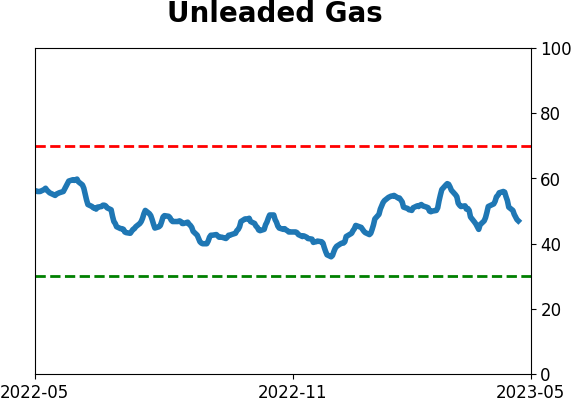
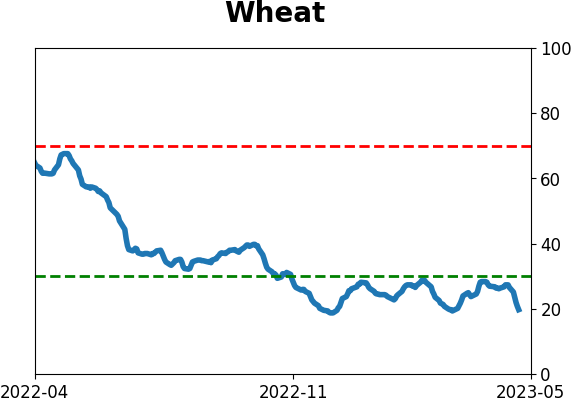
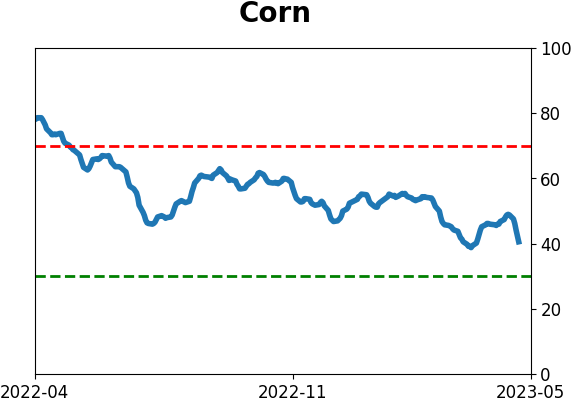
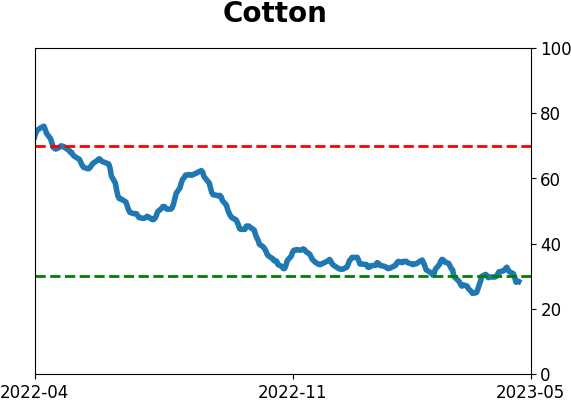
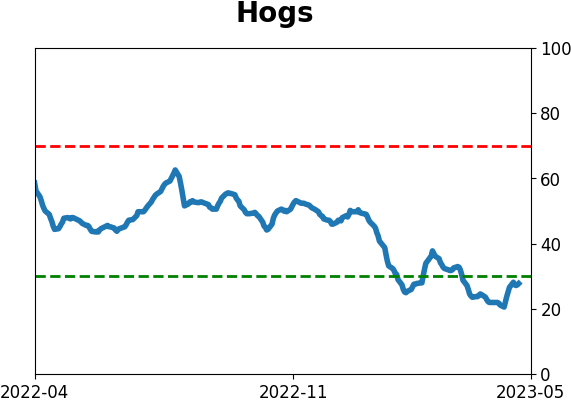
Agriculture looks particularly bad
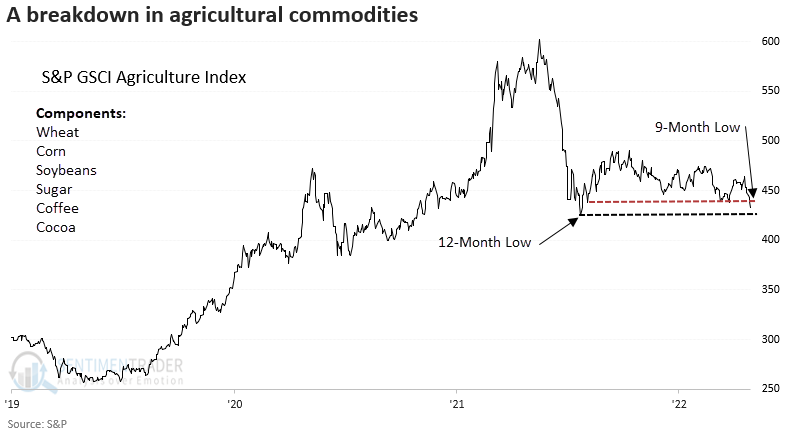
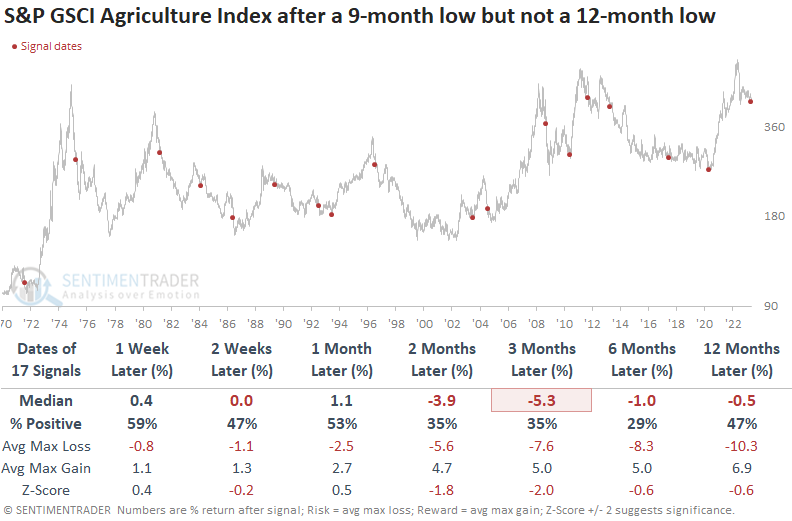
Dean further noted that the S&P GSCI Agriculture Index closed at a 9-month low but not a 12-month low, and similar price patterns preceded negative returns for the Agriculture Index.
With a 1-year low, only a few percentage points lower, agricultural commodities appear to be on the brink of a material breakdown, which would unwind one of the more significant multi-year advances in history for foods we consume daily.
The breakdown in the Agriculture Index comes after the second-best 2-year return for the commodity Index in history. When the Agriculture Index closes at a 9-month low but not a 12-month low, Index returns are negative across most time horizons. Six months later, the Index was lower 71% of the time, with all precedents but two showing a negative return at some point over that same time frame.
If we isolate signals that occurred after the Agriculture Index increased by 50% or more over two years, the prospects for agricultural commodities are abysmal. After all 7 previous times that triggered, the Agriculture Index suffered negative returns between two and six months later.
Copper's looming headwind
Copper will soon enter one of the most seasonally unfavorable parts of the year. Jay noted that while year-to-year results can vary greatly, the long-term trend has been unmistakably bearish.
Copper has shown a historical tendency for price weakness between Trading Day of the Year (TDY) #82 and TDY #123. In 2023, this period extends from the close on 2023-04-27 through the close on 2023-06-23.

The chart below displays the hypothetical $ +(-) achieved by holding one copper futures contract only during the TDY #82 through TDY #123 period, every year starting in 1960 (copper futures contracts began trading in 1988. Before that time, cash copper prices are used for testing purposes).
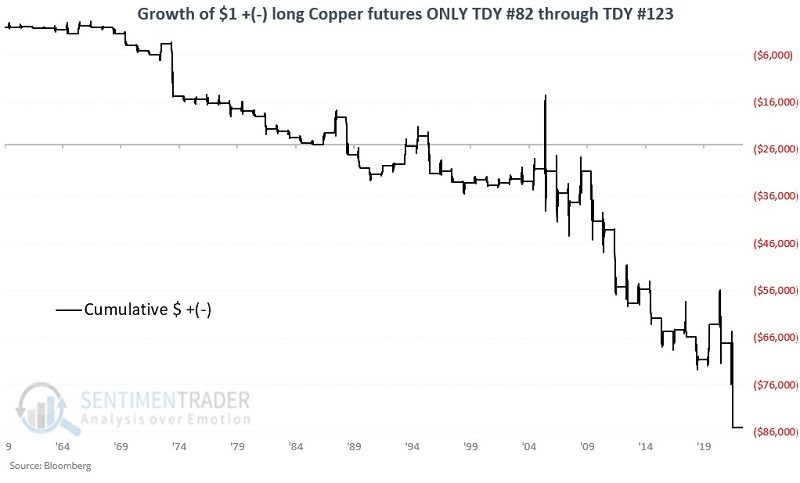
These seasonal windows showed a gain for copper only 40% of the time. The median loss was more than twice as large as the median gain, and copper gained more than $5,000/contract three times while losing more than -$5,000 nine times.
The United States Copper Index Fund ETF (ticker CPER) is designed to be a convenient, cost-effective way for investors to access the returns of a portfolio of copper futures contracts. As such, it also has tended to show weakness during the seasonally unfavorable period highlighted above.
About TradingEdge Weekly...
The goal of TradingEdge Weekly is to summarize some of the research published to SentimenTrader over the past week. Sometimes there is a lot to digest, and this summary highlights the highest conviction or most compelling ideas we discussed. This is NOT the published research; rather, it pulls out some of the most relevant parts. It includes links to the published research for convenience, and if you don't subscribe to those products, it will present the options for access.
Indicators at Extremes
|
|
|
Phase Table
|
|
|
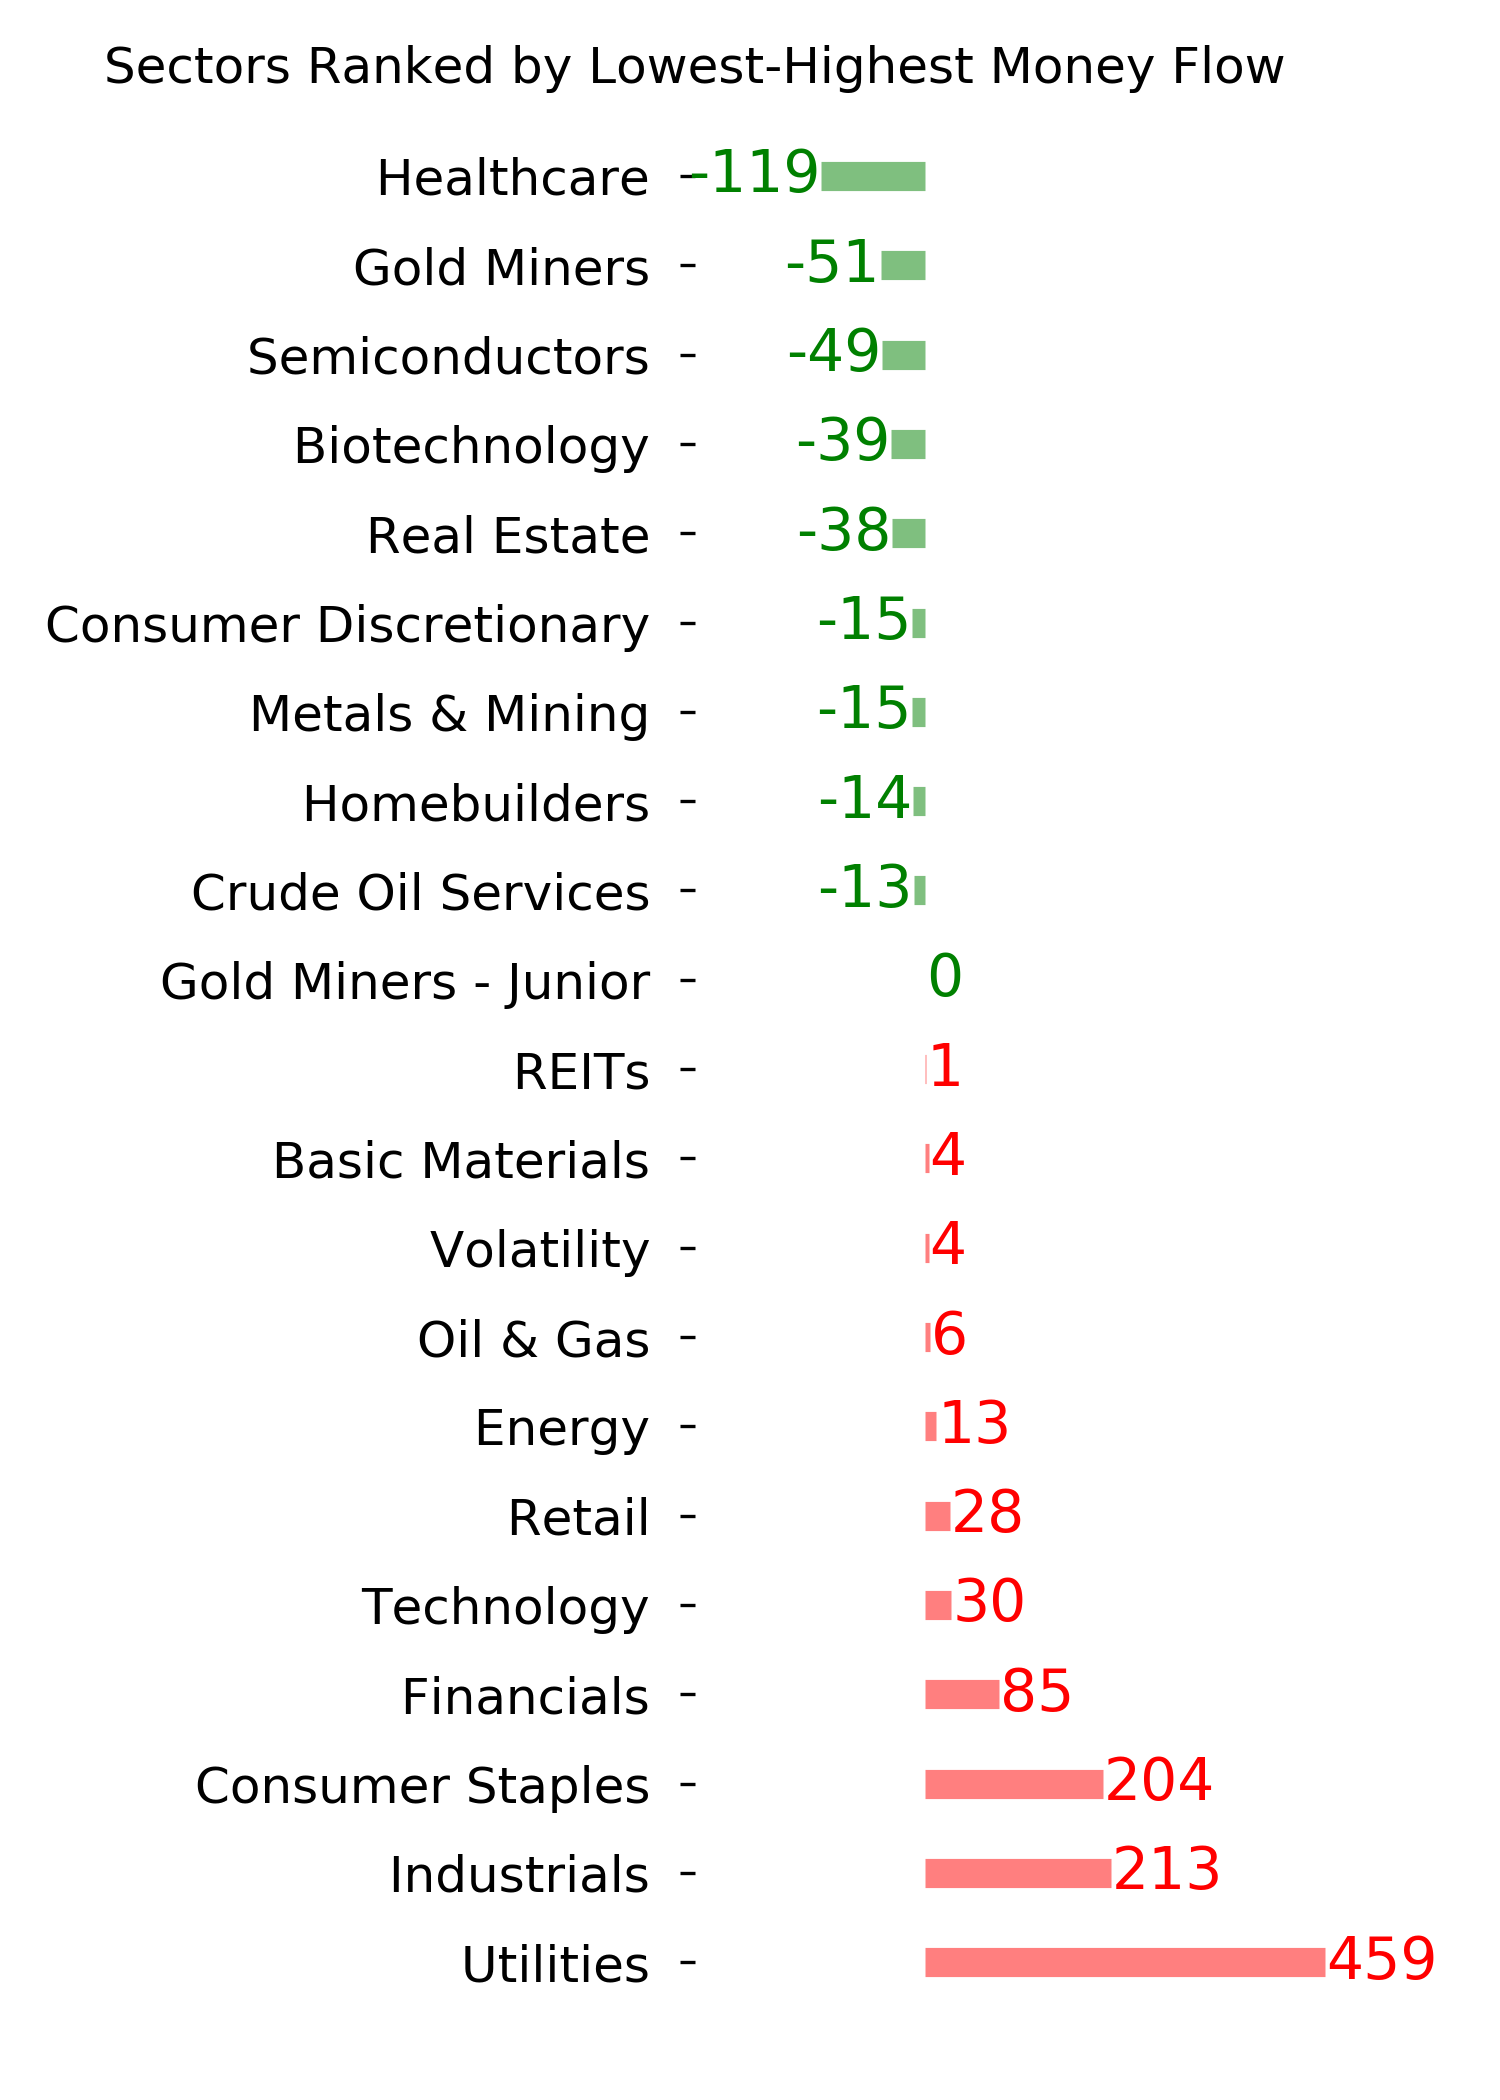
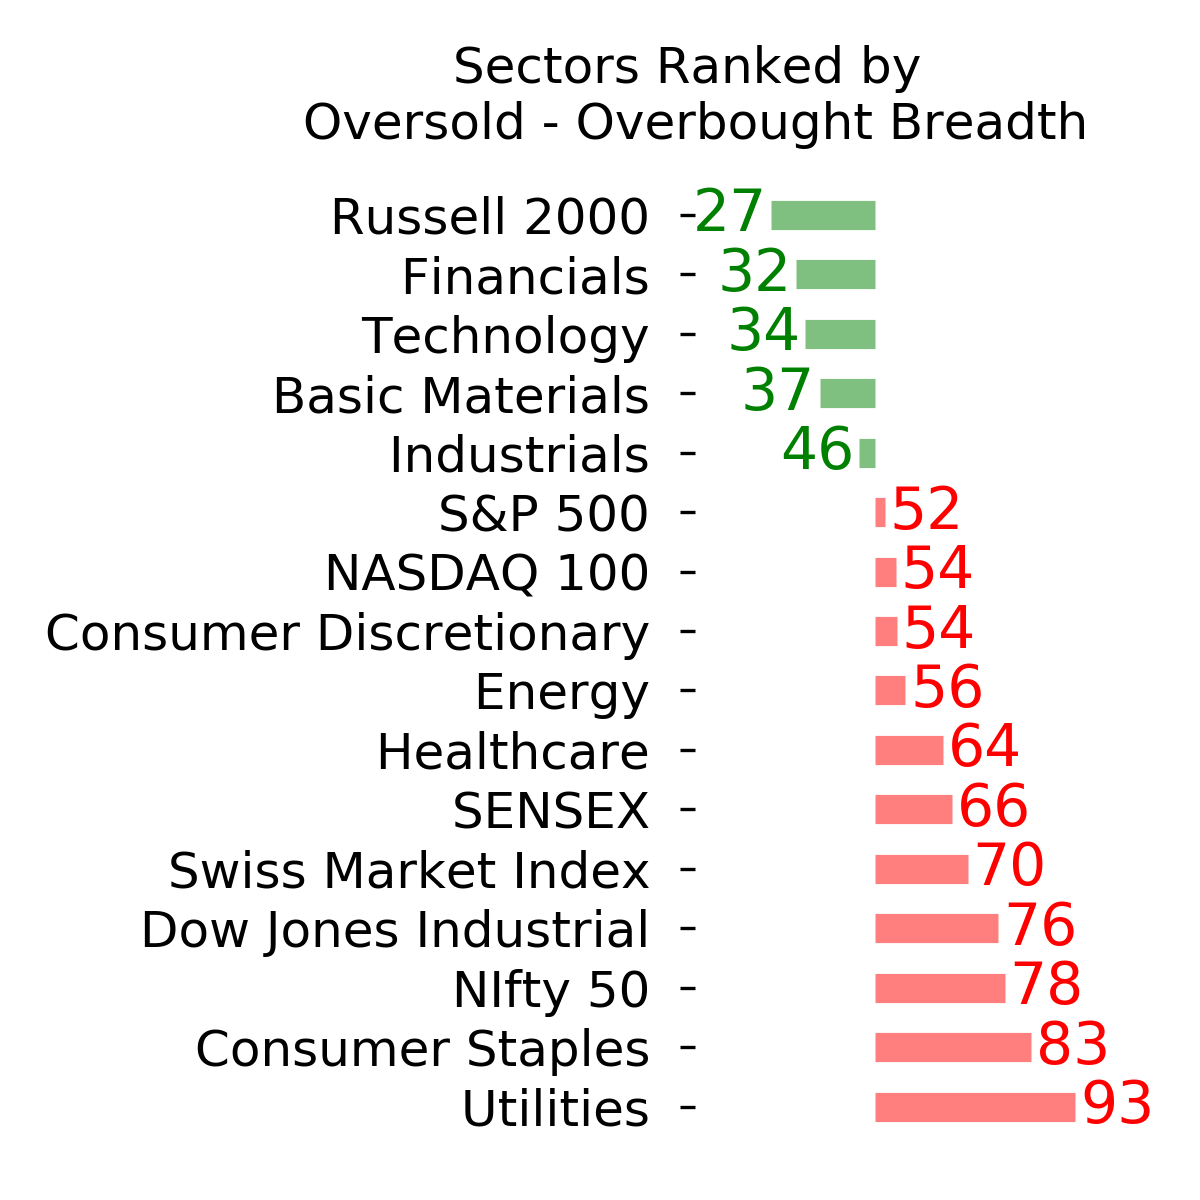
Ranks
|
|
|
|
|
|
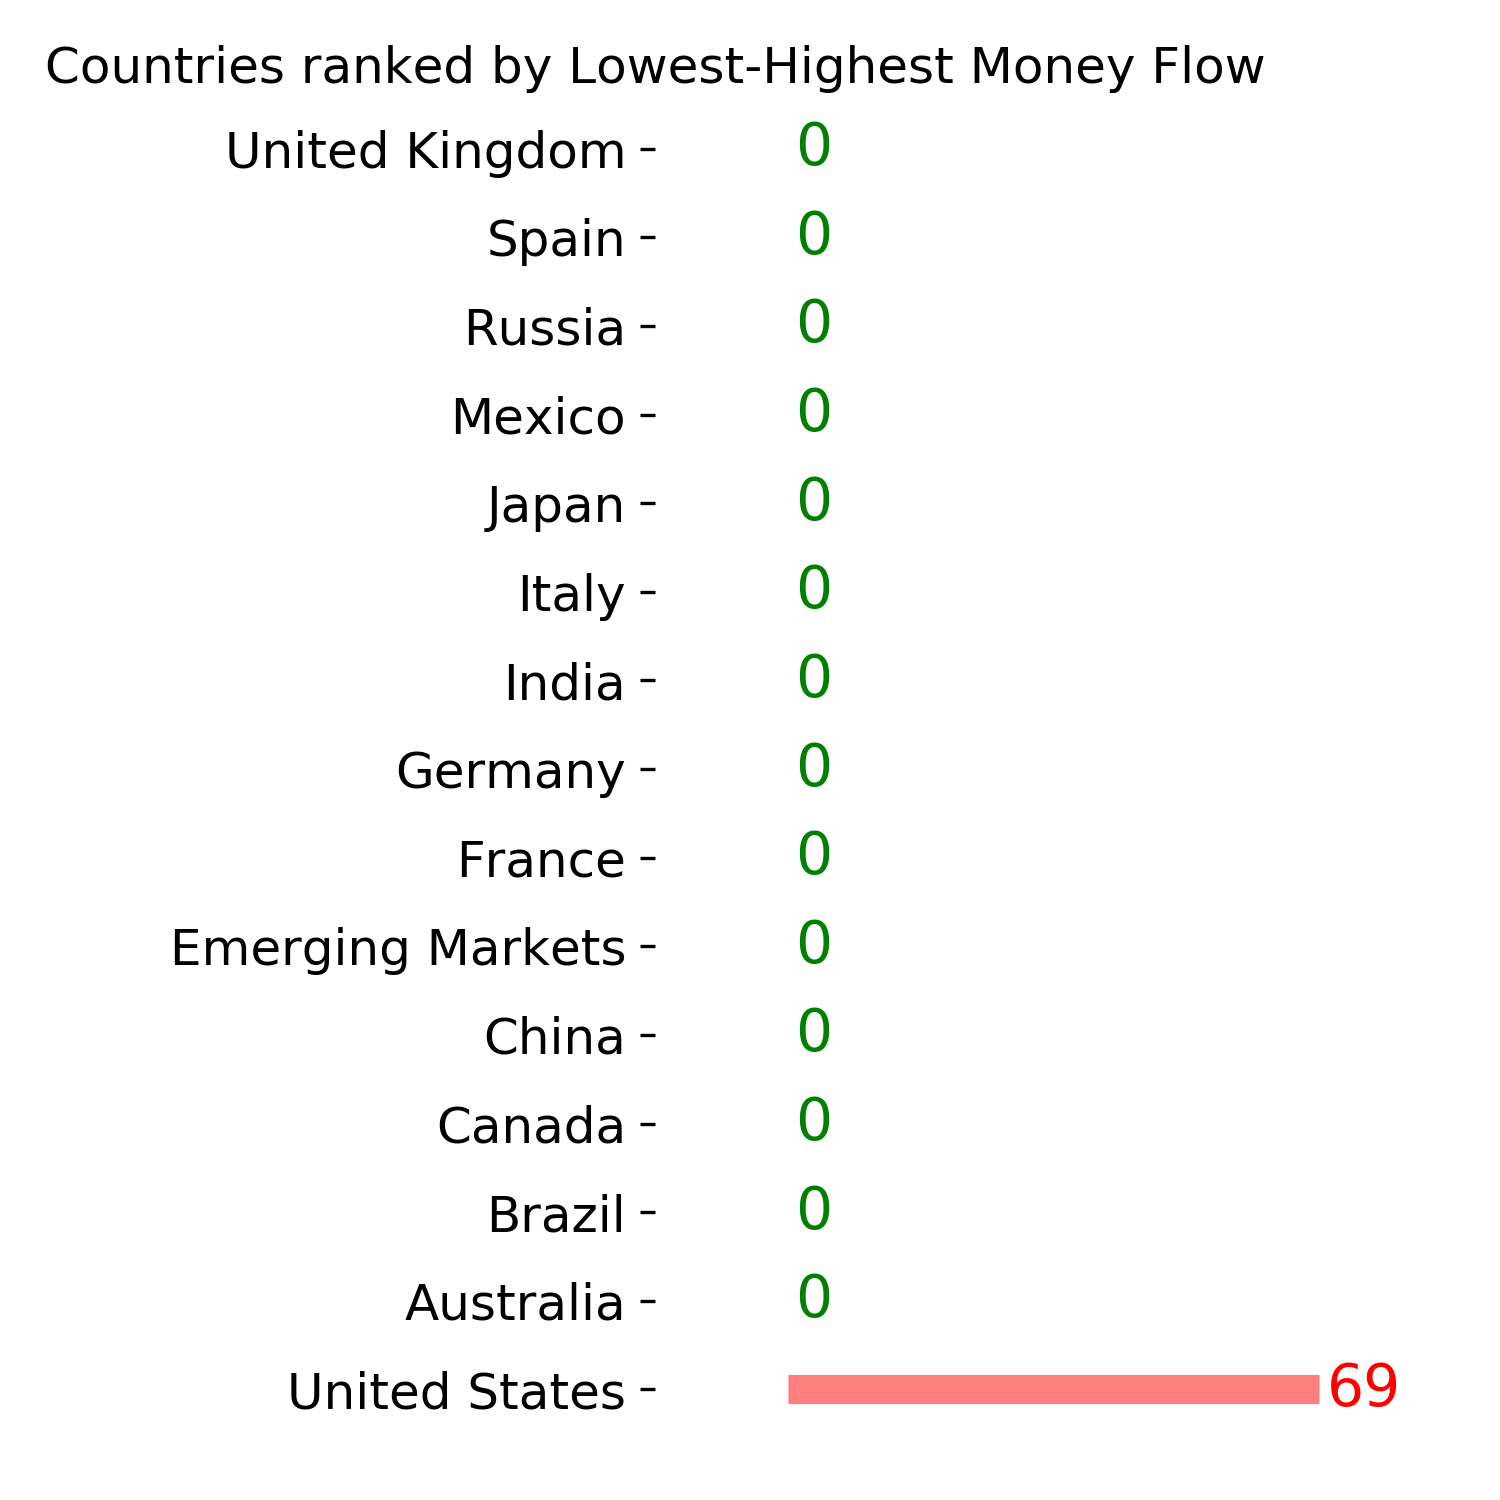
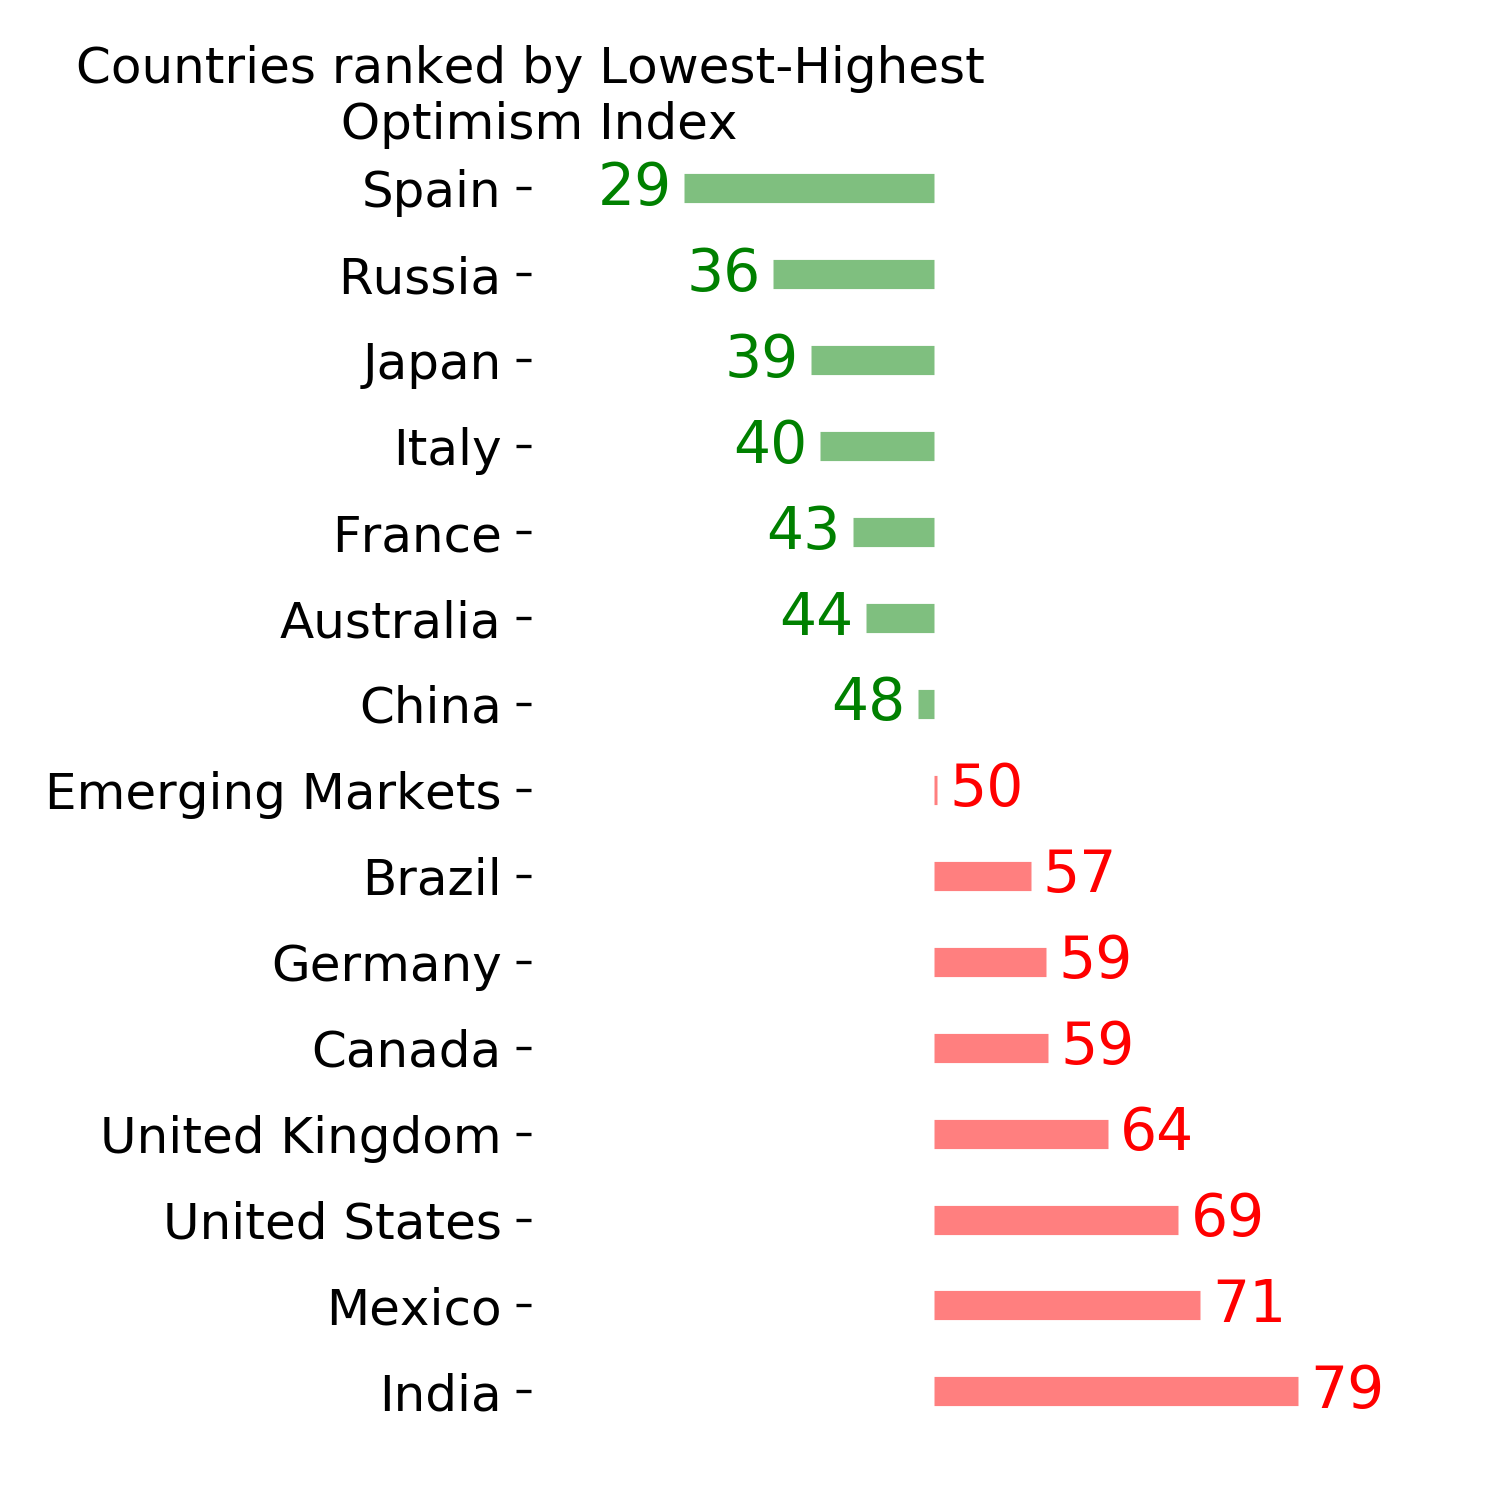
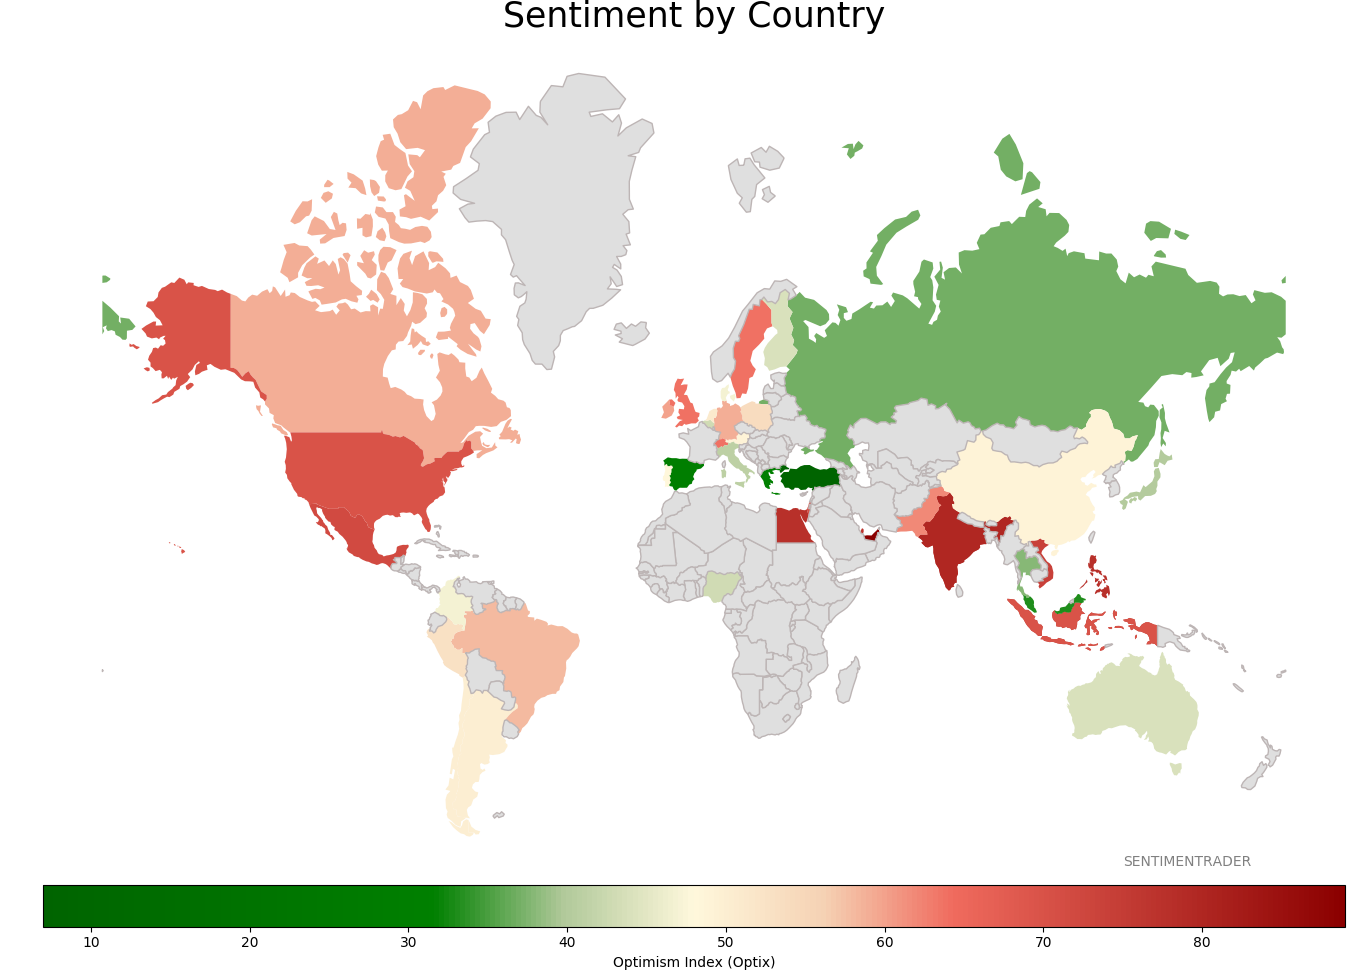
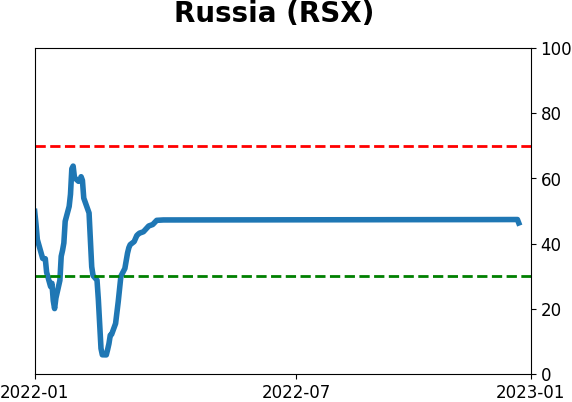
Sentiment Around The World
|
|
|
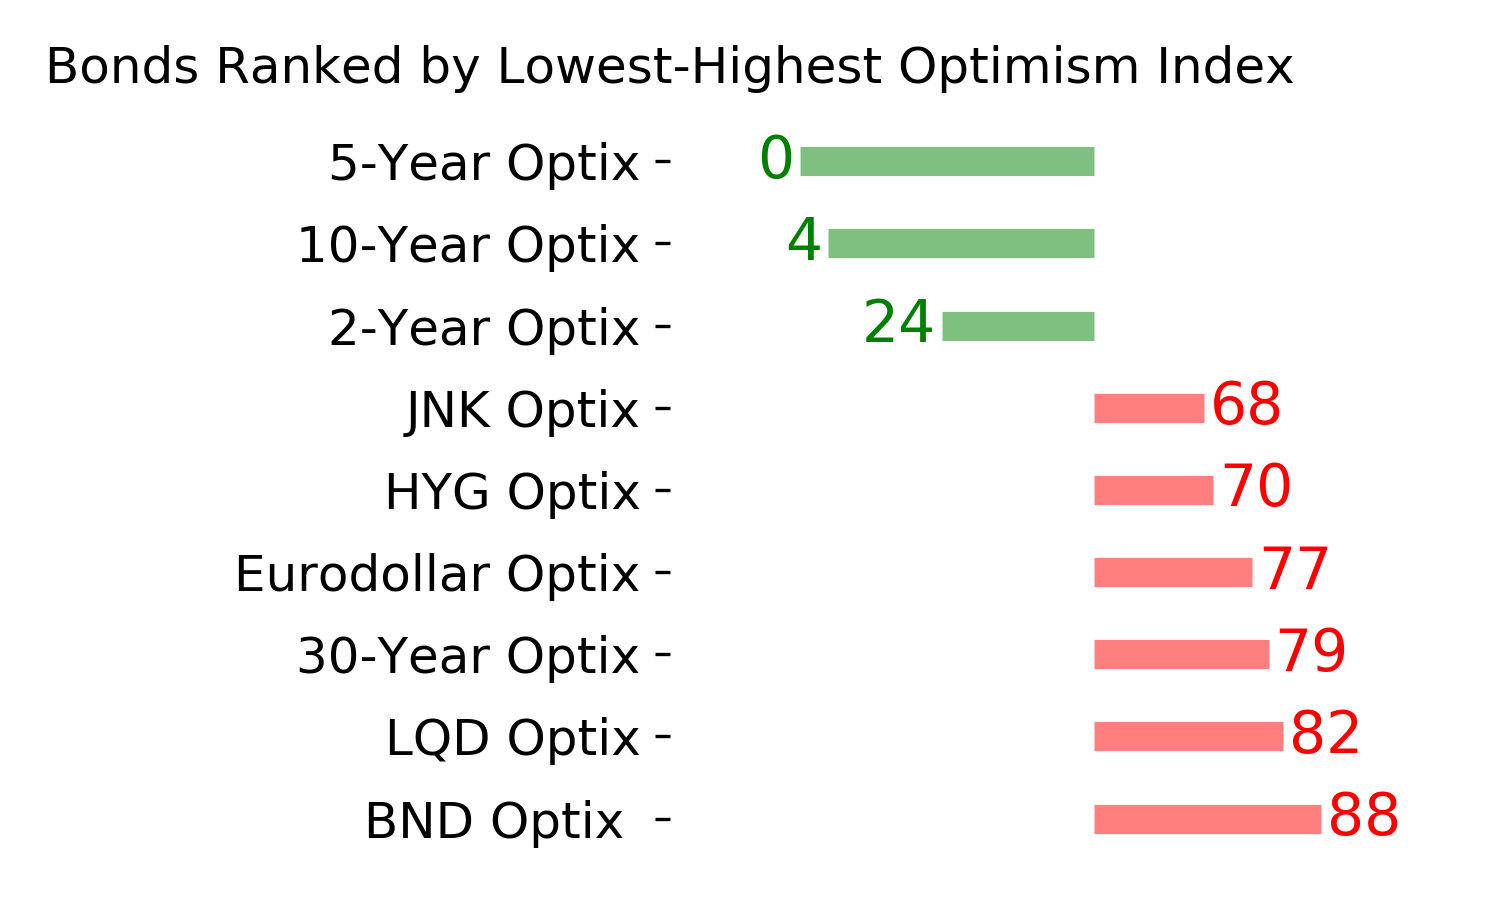
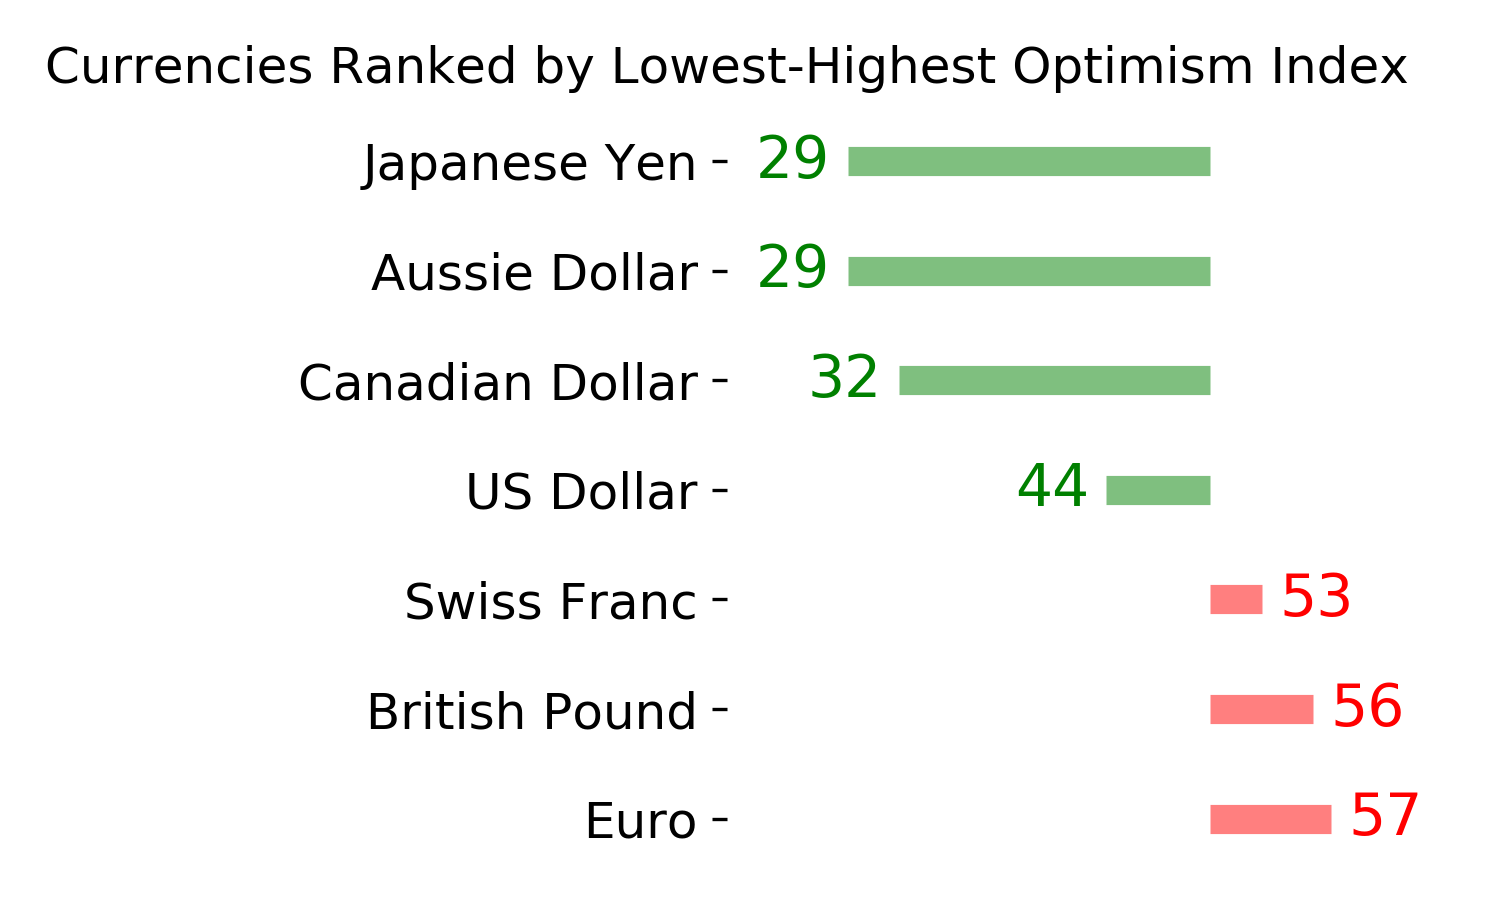
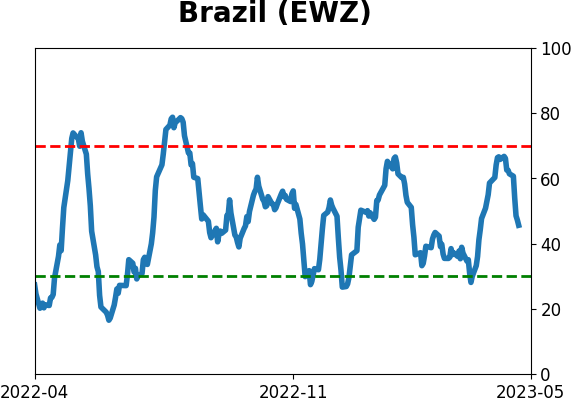
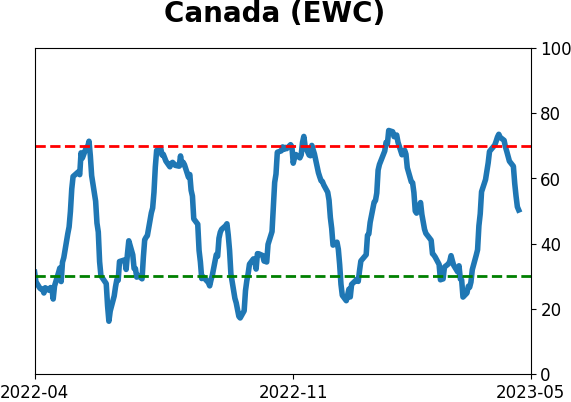
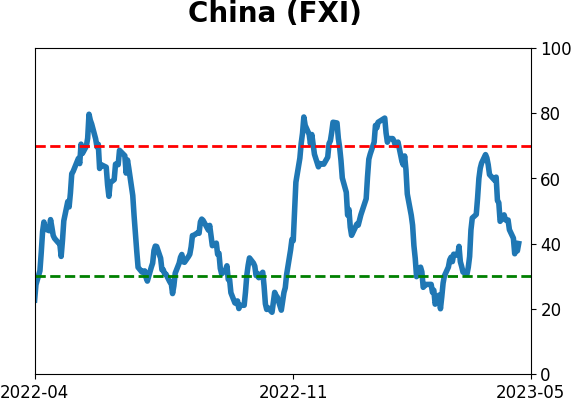
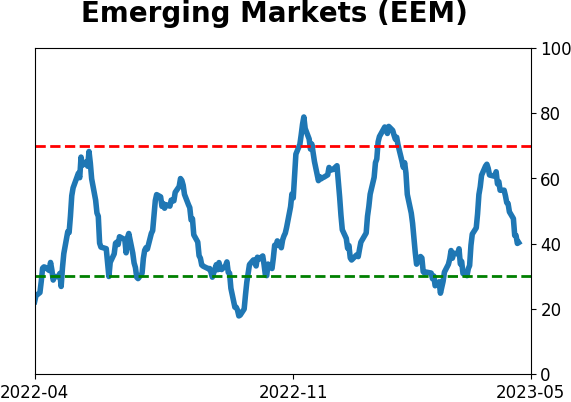
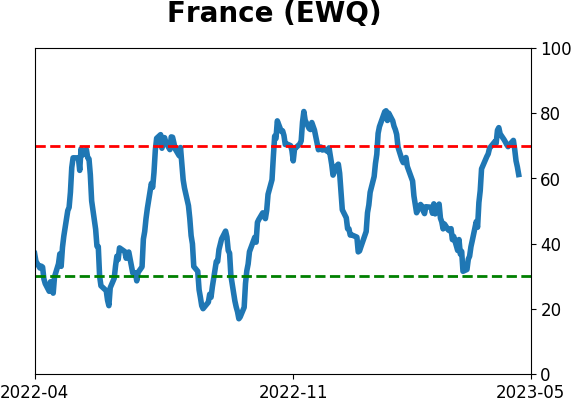
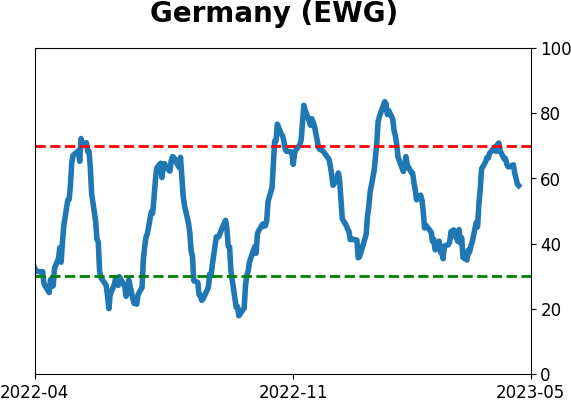
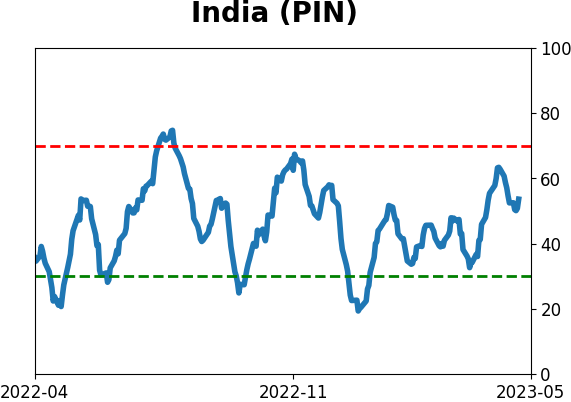
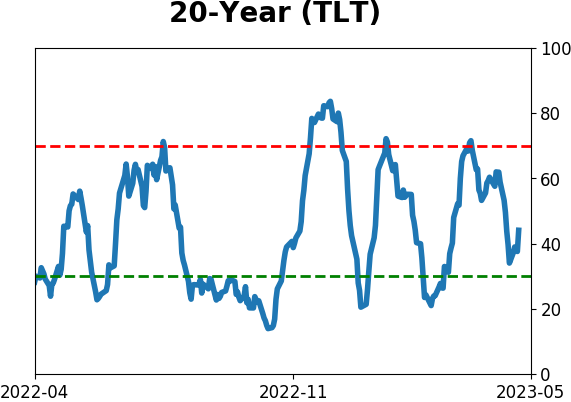
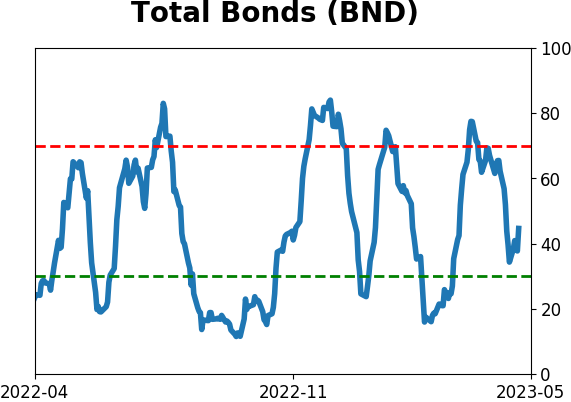
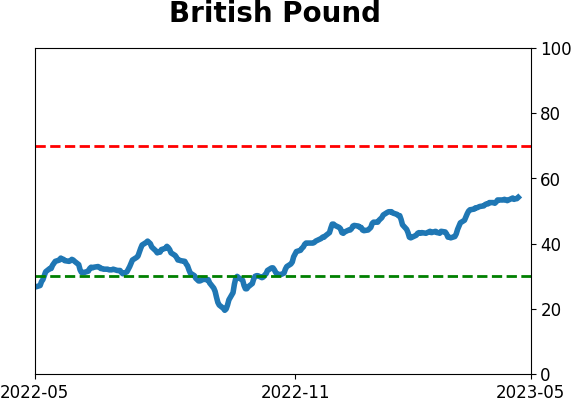
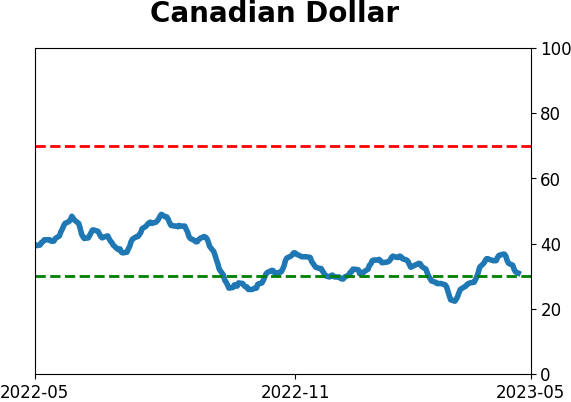
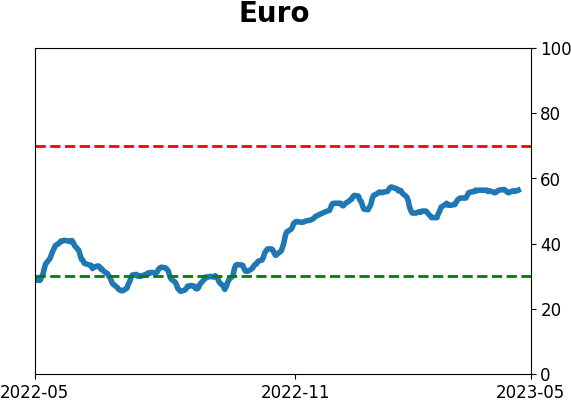
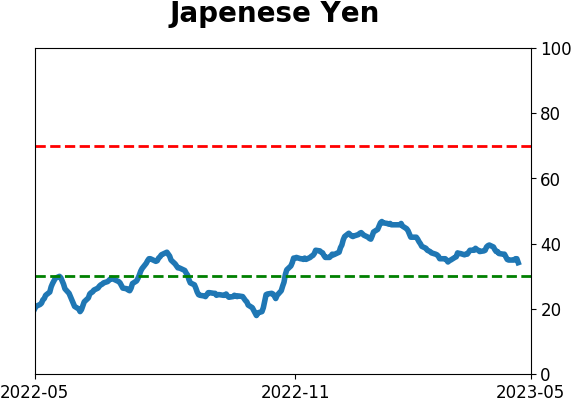
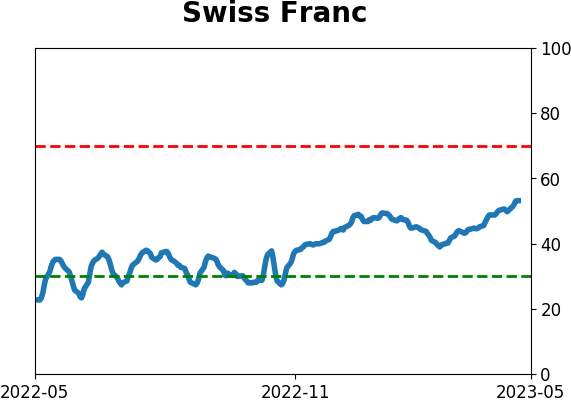
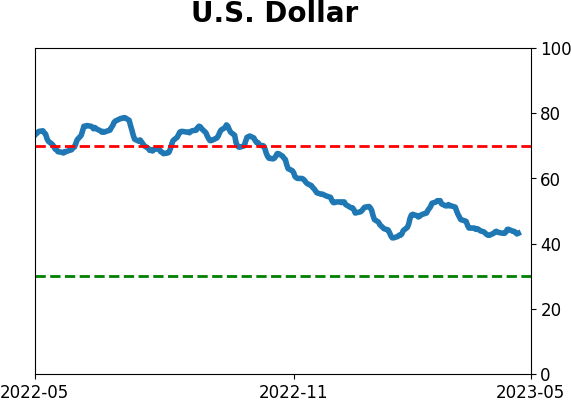
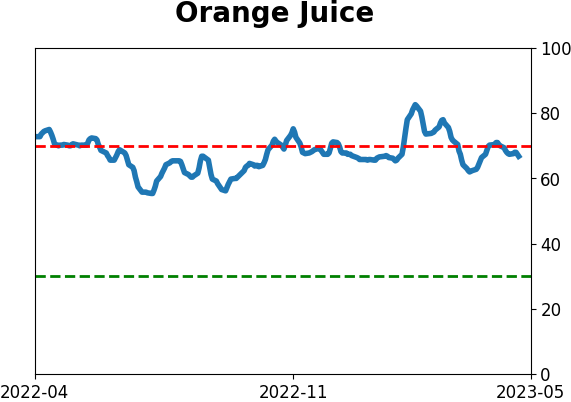
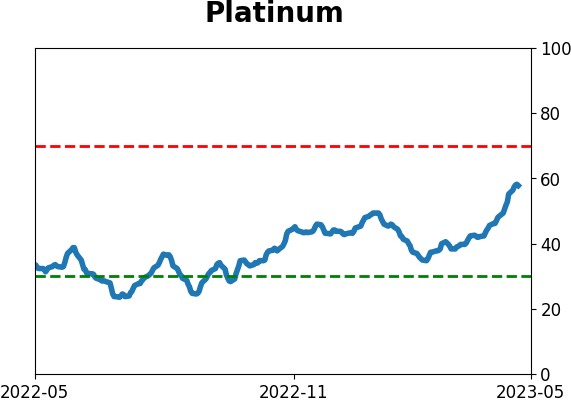
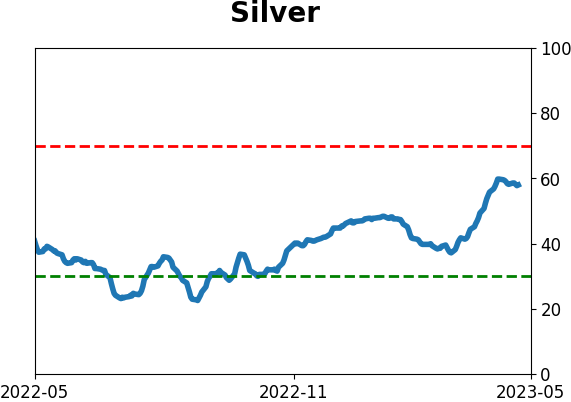
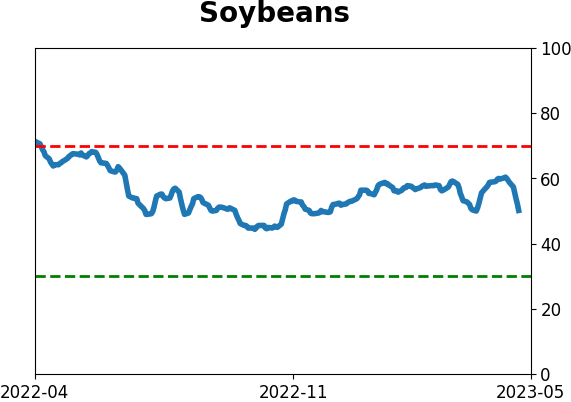
Optimism Index Thumbnails
|
|
|
|
|
|
|
|
|
|
|
|
|
|
|
|
|
|
|
|
|