Headlines
|
|
Selling in Shanghai shows signs of panic:
Chinese stocks have been among the world's worst performers lately, and this week did not help. Entering mid-week, there was a rush of panic selling, and a variety of breadth metrics showed wholesale and indiscriminate selling pressure. This has preceded positive, but weak, returns.
|
Smart / Dumb Money Confidence
|
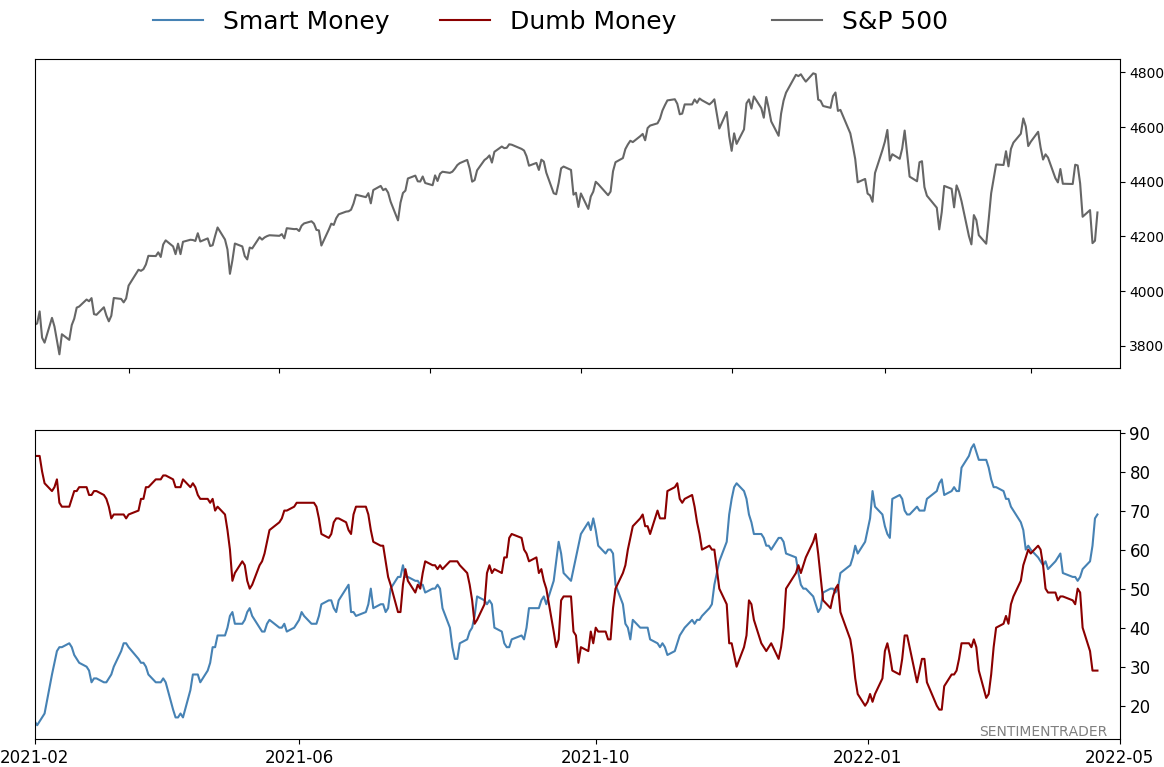
Smart Money Confidence: 69%
Dumb Money Confidence: 29%
|
|
Risk Levels
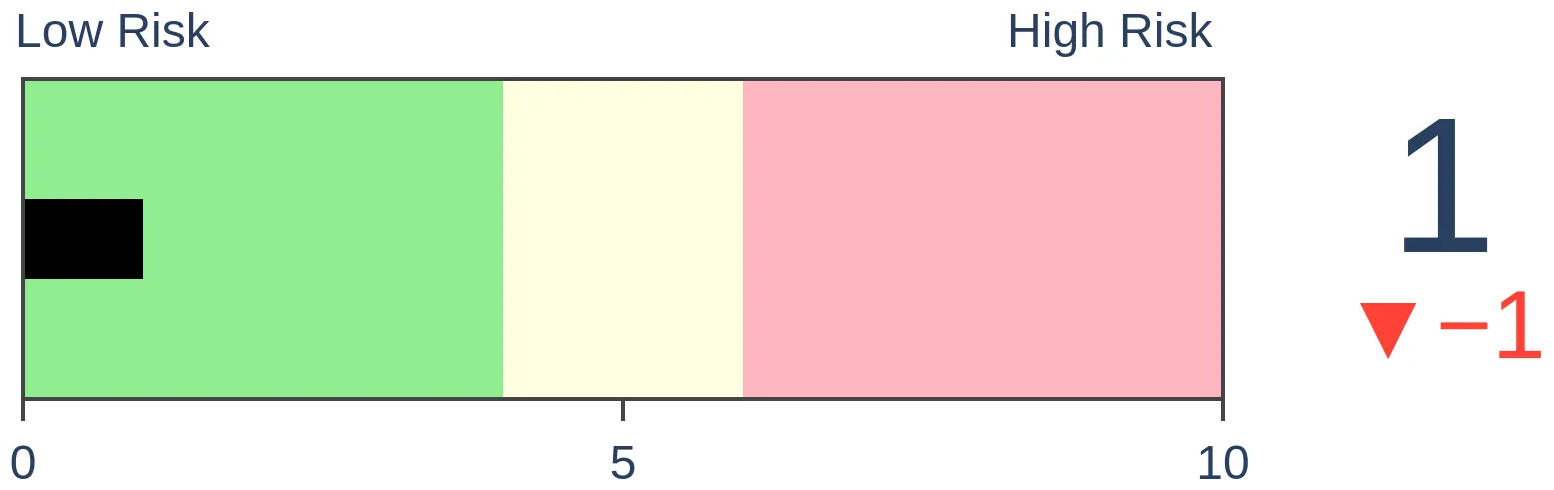
Stocks Short-Term
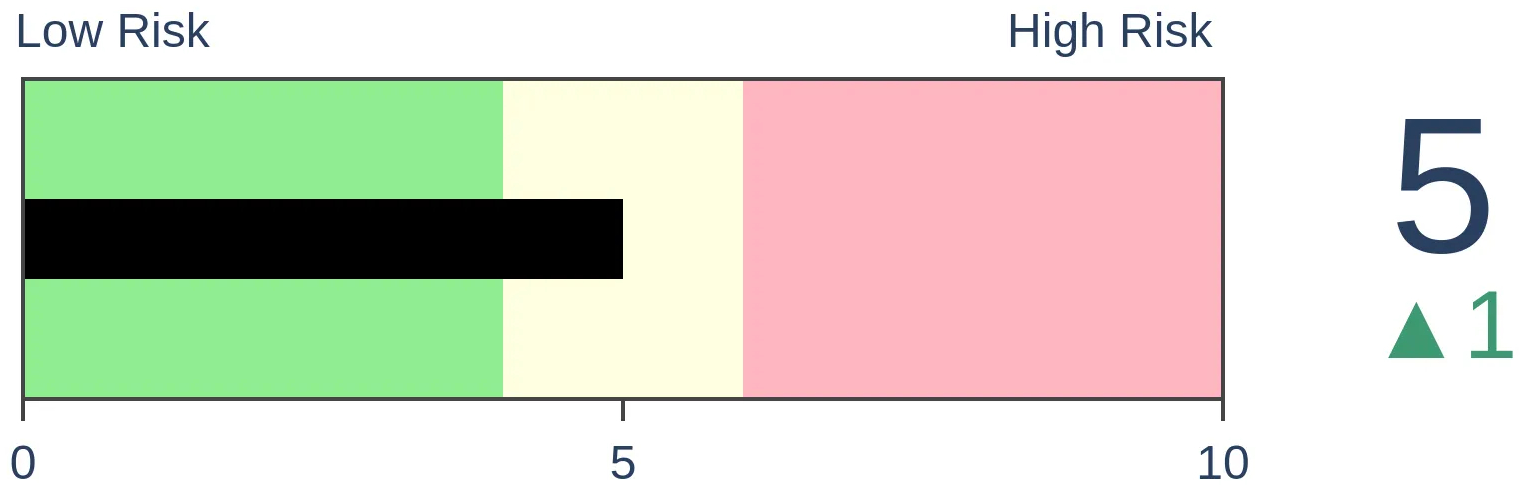
|
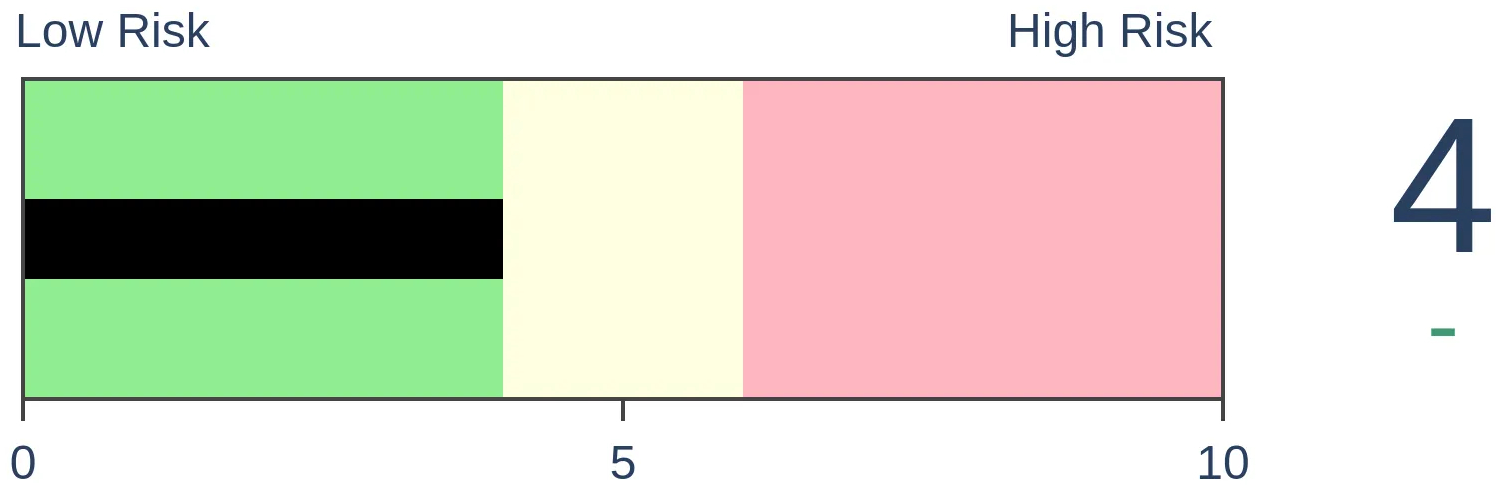
Stocks Medium-Term
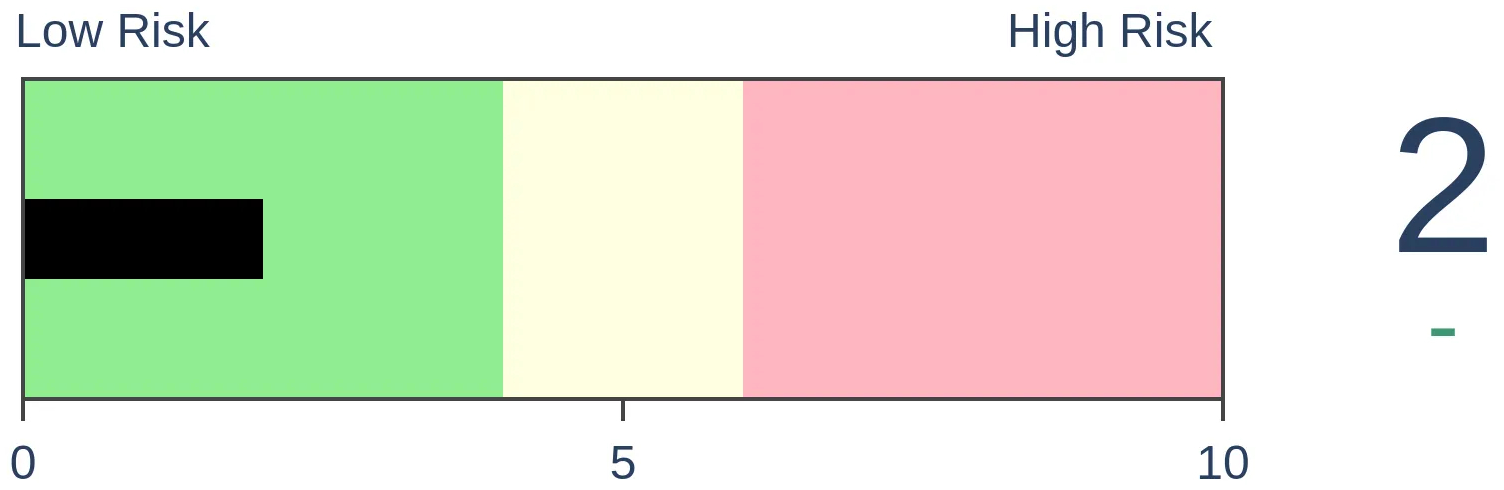
|
|
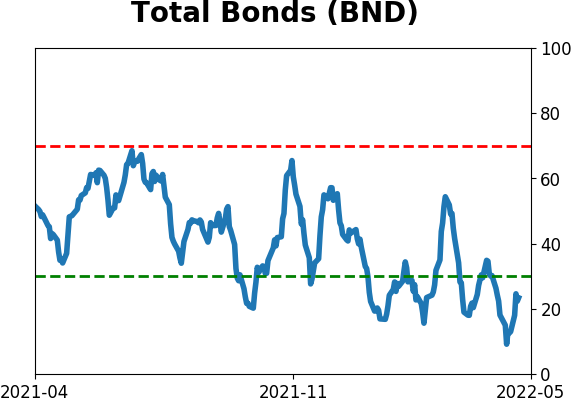
Bonds
|
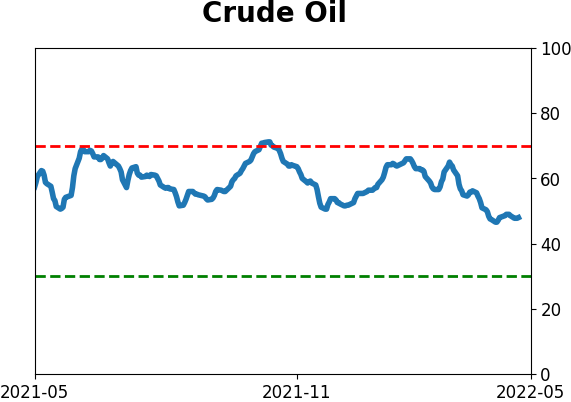
Crude Oil
|
|
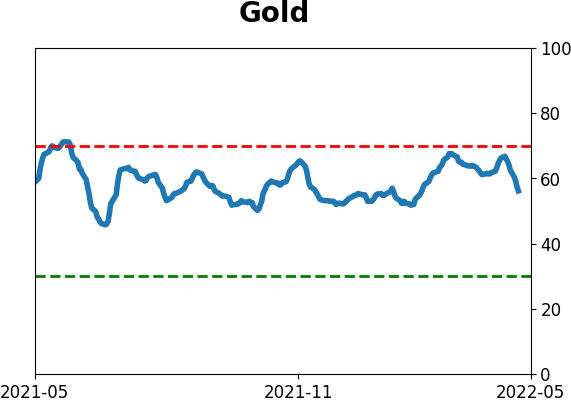
Gold

|
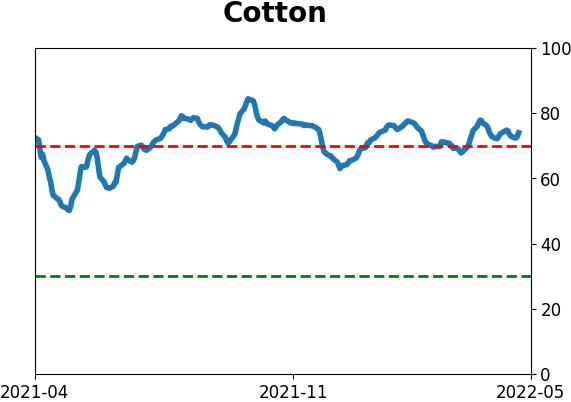
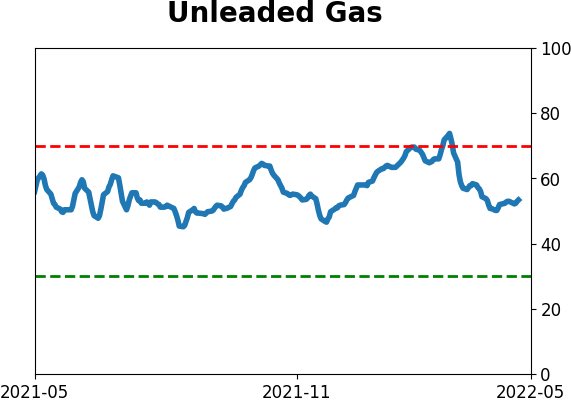
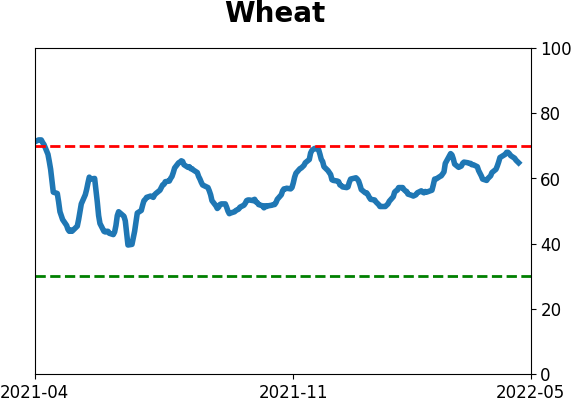
Agriculture

|
|
Research
By Jason Goepfert
BOTTOM LINE
Chinese stocks have been among the world's worst performers lately, and this week did not help. Entering mid-week, there was a rush of panic selling, and a variety of breadth metrics showed wholesale and indiscriminate selling pressure. This has preceded positive, but weak, returns.
FORECAST / TIMEFRAME
None
|
Key points:
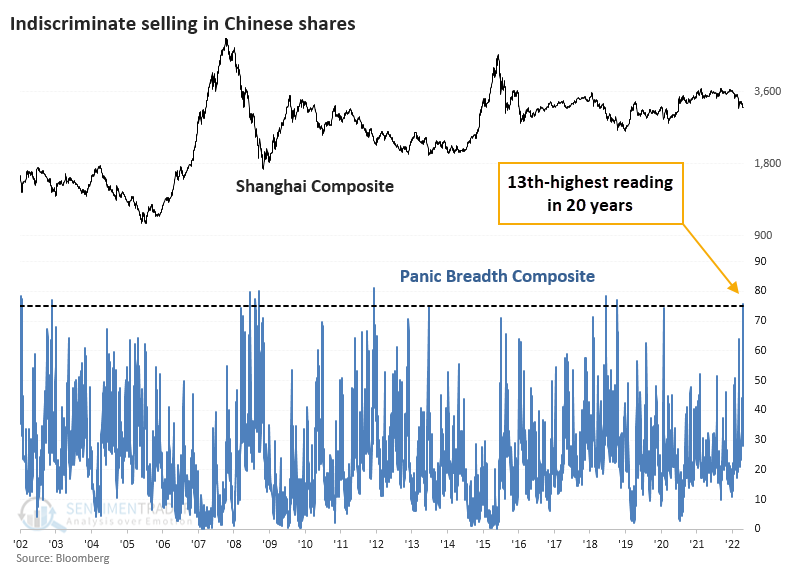
- Stocks in the Shanghai Composite are heavily oversold, spiking a Panic Breadth Composite
- This week, the breadth indicator jumped to the 13th-highest reading in the past 20 years
- Chinese stocks don't respond consistently to oversold readings, but it will help if investors buy the dip this week
Investors in Chinese stocks are panicking
The impression among investors is that issues in China have gone from manageable to concerning to uninvestable. As they are wont to do, investors are selling first and letting the smoke clear.
Heading into midweek, that market has seen wholesale and indiscriminate selling pressure. As we did with Brazilian stocks last October, we can compile a Panic Breadth Composite that looks at eight indicators measuring the level of selling among stocks in the Shanghai Composite. All of them are more than one standard deviation above their average over the past 20 years.
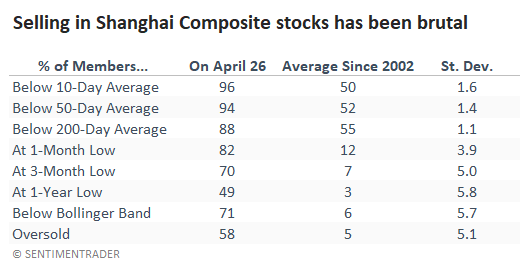
Using these metrics, the Panic Breadth Composite just spiked to the 13th-highest reading out of 4,927 days since 2002.
Over the years, we've noted how this market stands out relative to most other major global markets. It just doesn't seem to respond well to extremes. There was a panic spike in the Hang Seng last September, and while that market rallied more than 8% in the weeks ahead, it promptly failed.
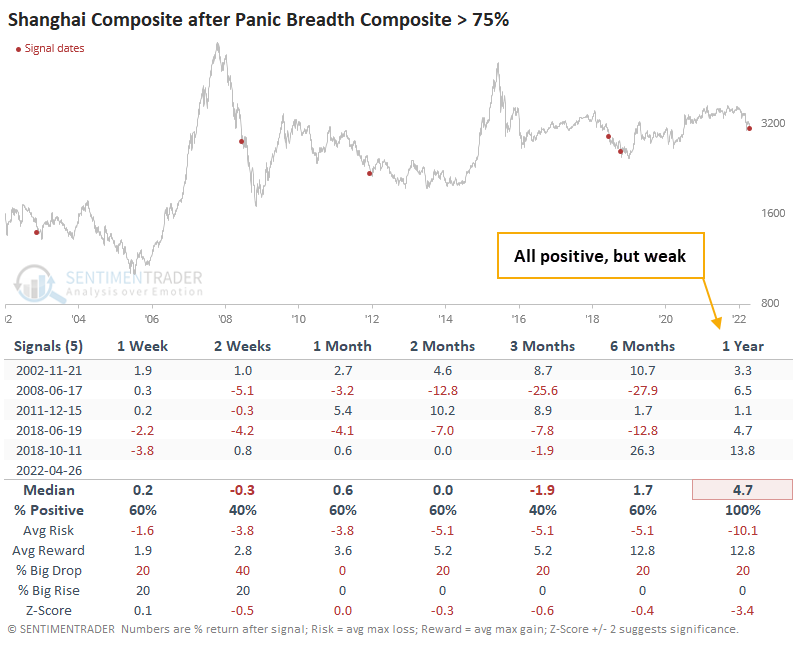
Similar extremes led to positive but weak returns
The table below shows the Shanghai Composite index returns after spikes above 75% in the Panic Breadth Composite. While three spikes preceded impressive rebounds in the months ahead, two were clear failures. They all led to positive one-year returns, but the average gain was unimpressive.
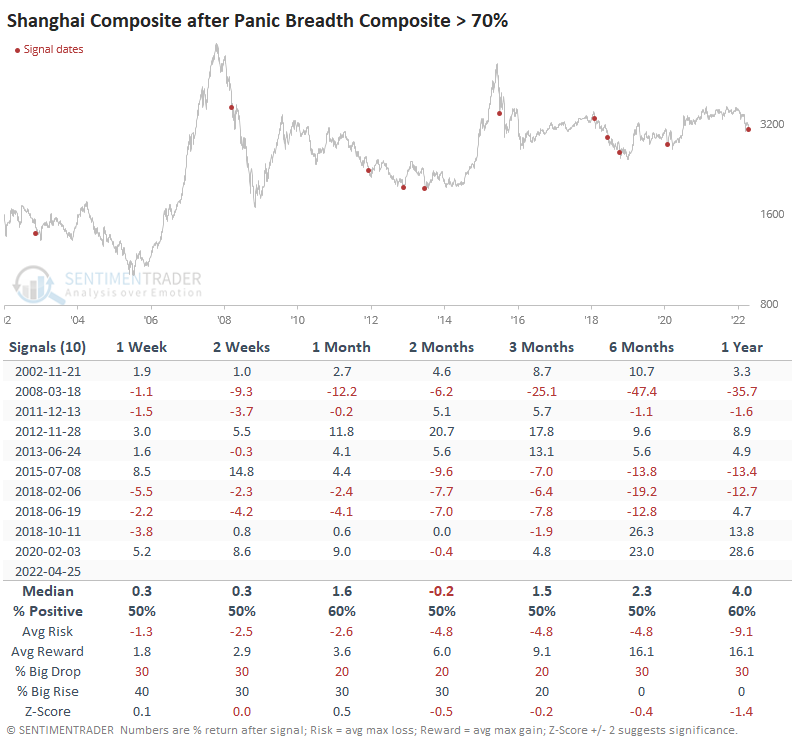
The overall theme was the same if we relaxed the panic threshold to 70% to generate more signals.
One bright spot - how investors behaved in the very short term gave a good clue as to whether risk appetite would return or not. Of the five times the Shanghai rallied over the next week, it also showed a positive return a year later four times. Of the five times it lost ground over the next week, it also showed a loss a year later three times (one of the positive returns was minimal, and the index showed a double-digit loss in the interim).
This suggests that if confidence returns to these stocks in the days ahead and investors resume a risk-on attitude, a buy-the-tip mentality may persist. It's always iffy to rely on a short-term guide to predict long-term returns, so there's that caveat.
What the research tells us...
Among losses in major global indexes over the past week or two, Chinese stocks stand out as suffering among the worst losses. Unlike most markets, this one has not consistently responded to extreme oversold readings, so we can't rely just on the recent selling as a contrarian buy signal. It will help if the Shanghai Composite rallies in the week ahead as a sign that investors feel the market is investable and risk appetite may return.
Indicators at Extremes
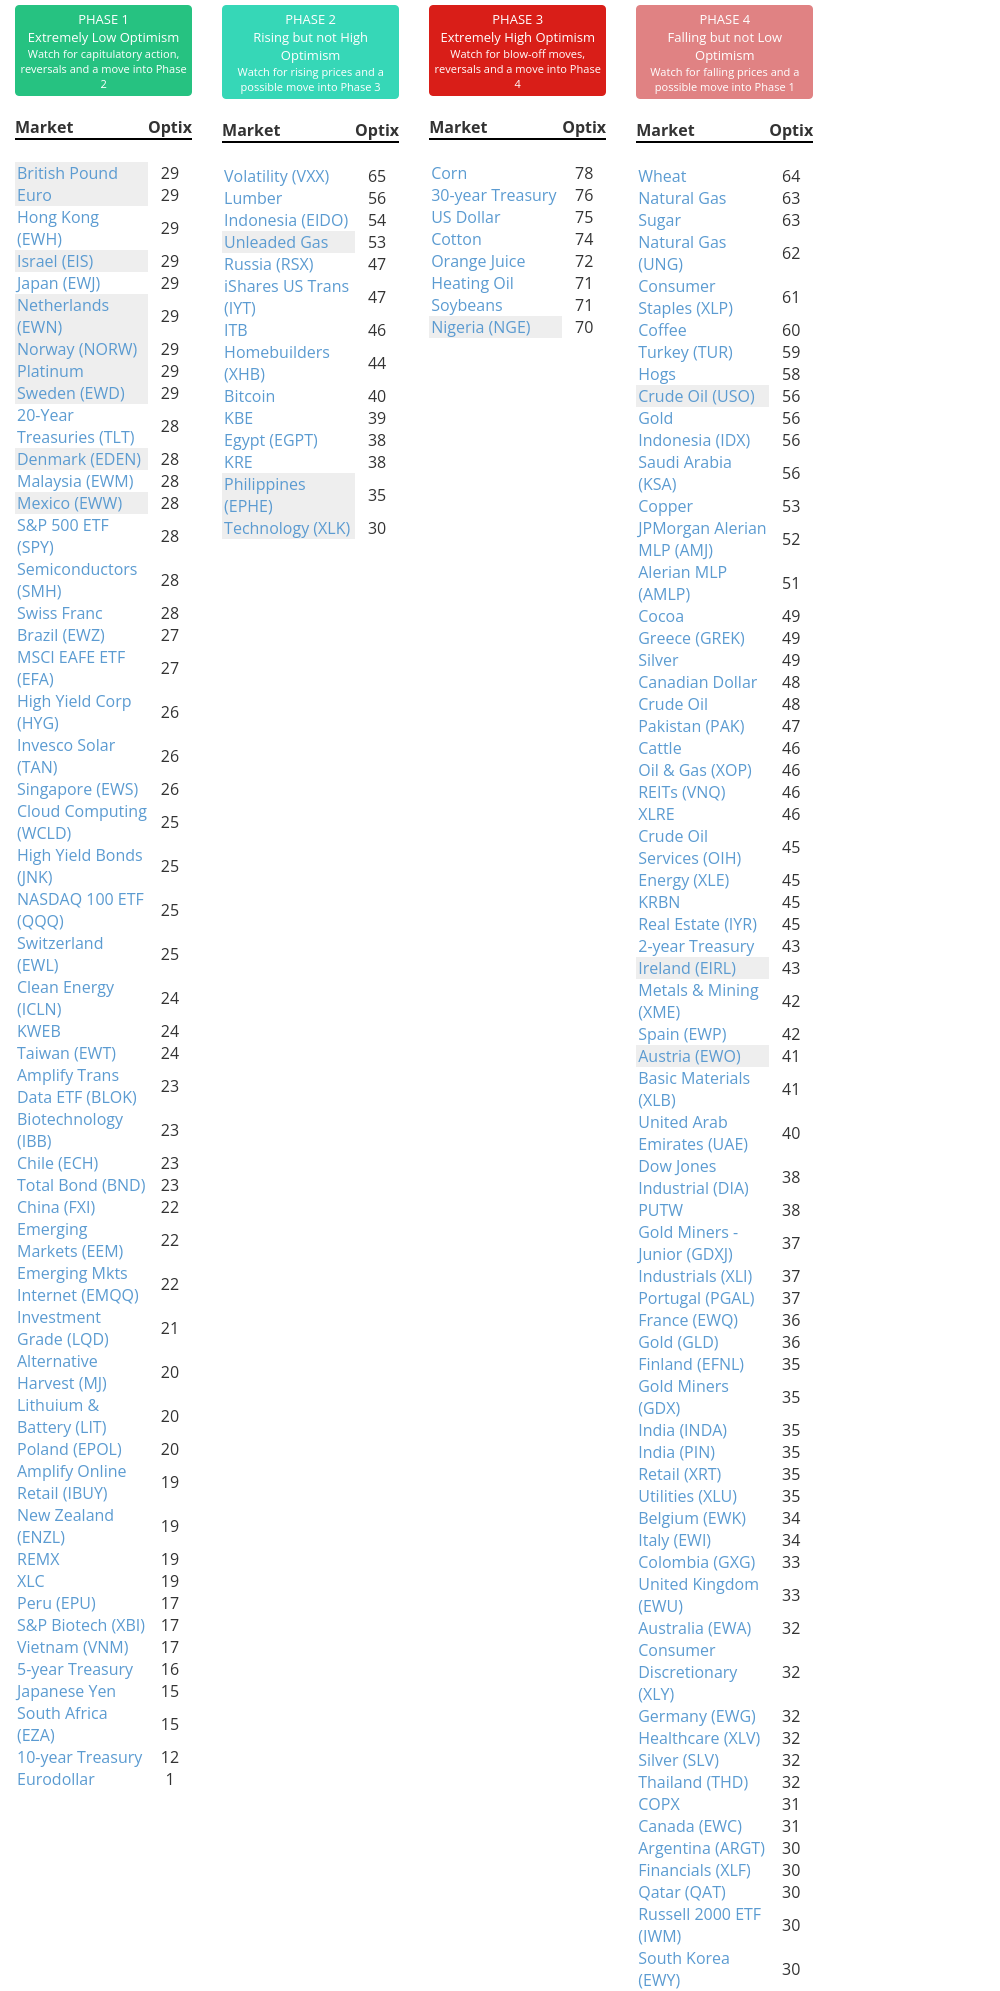
Phase Table
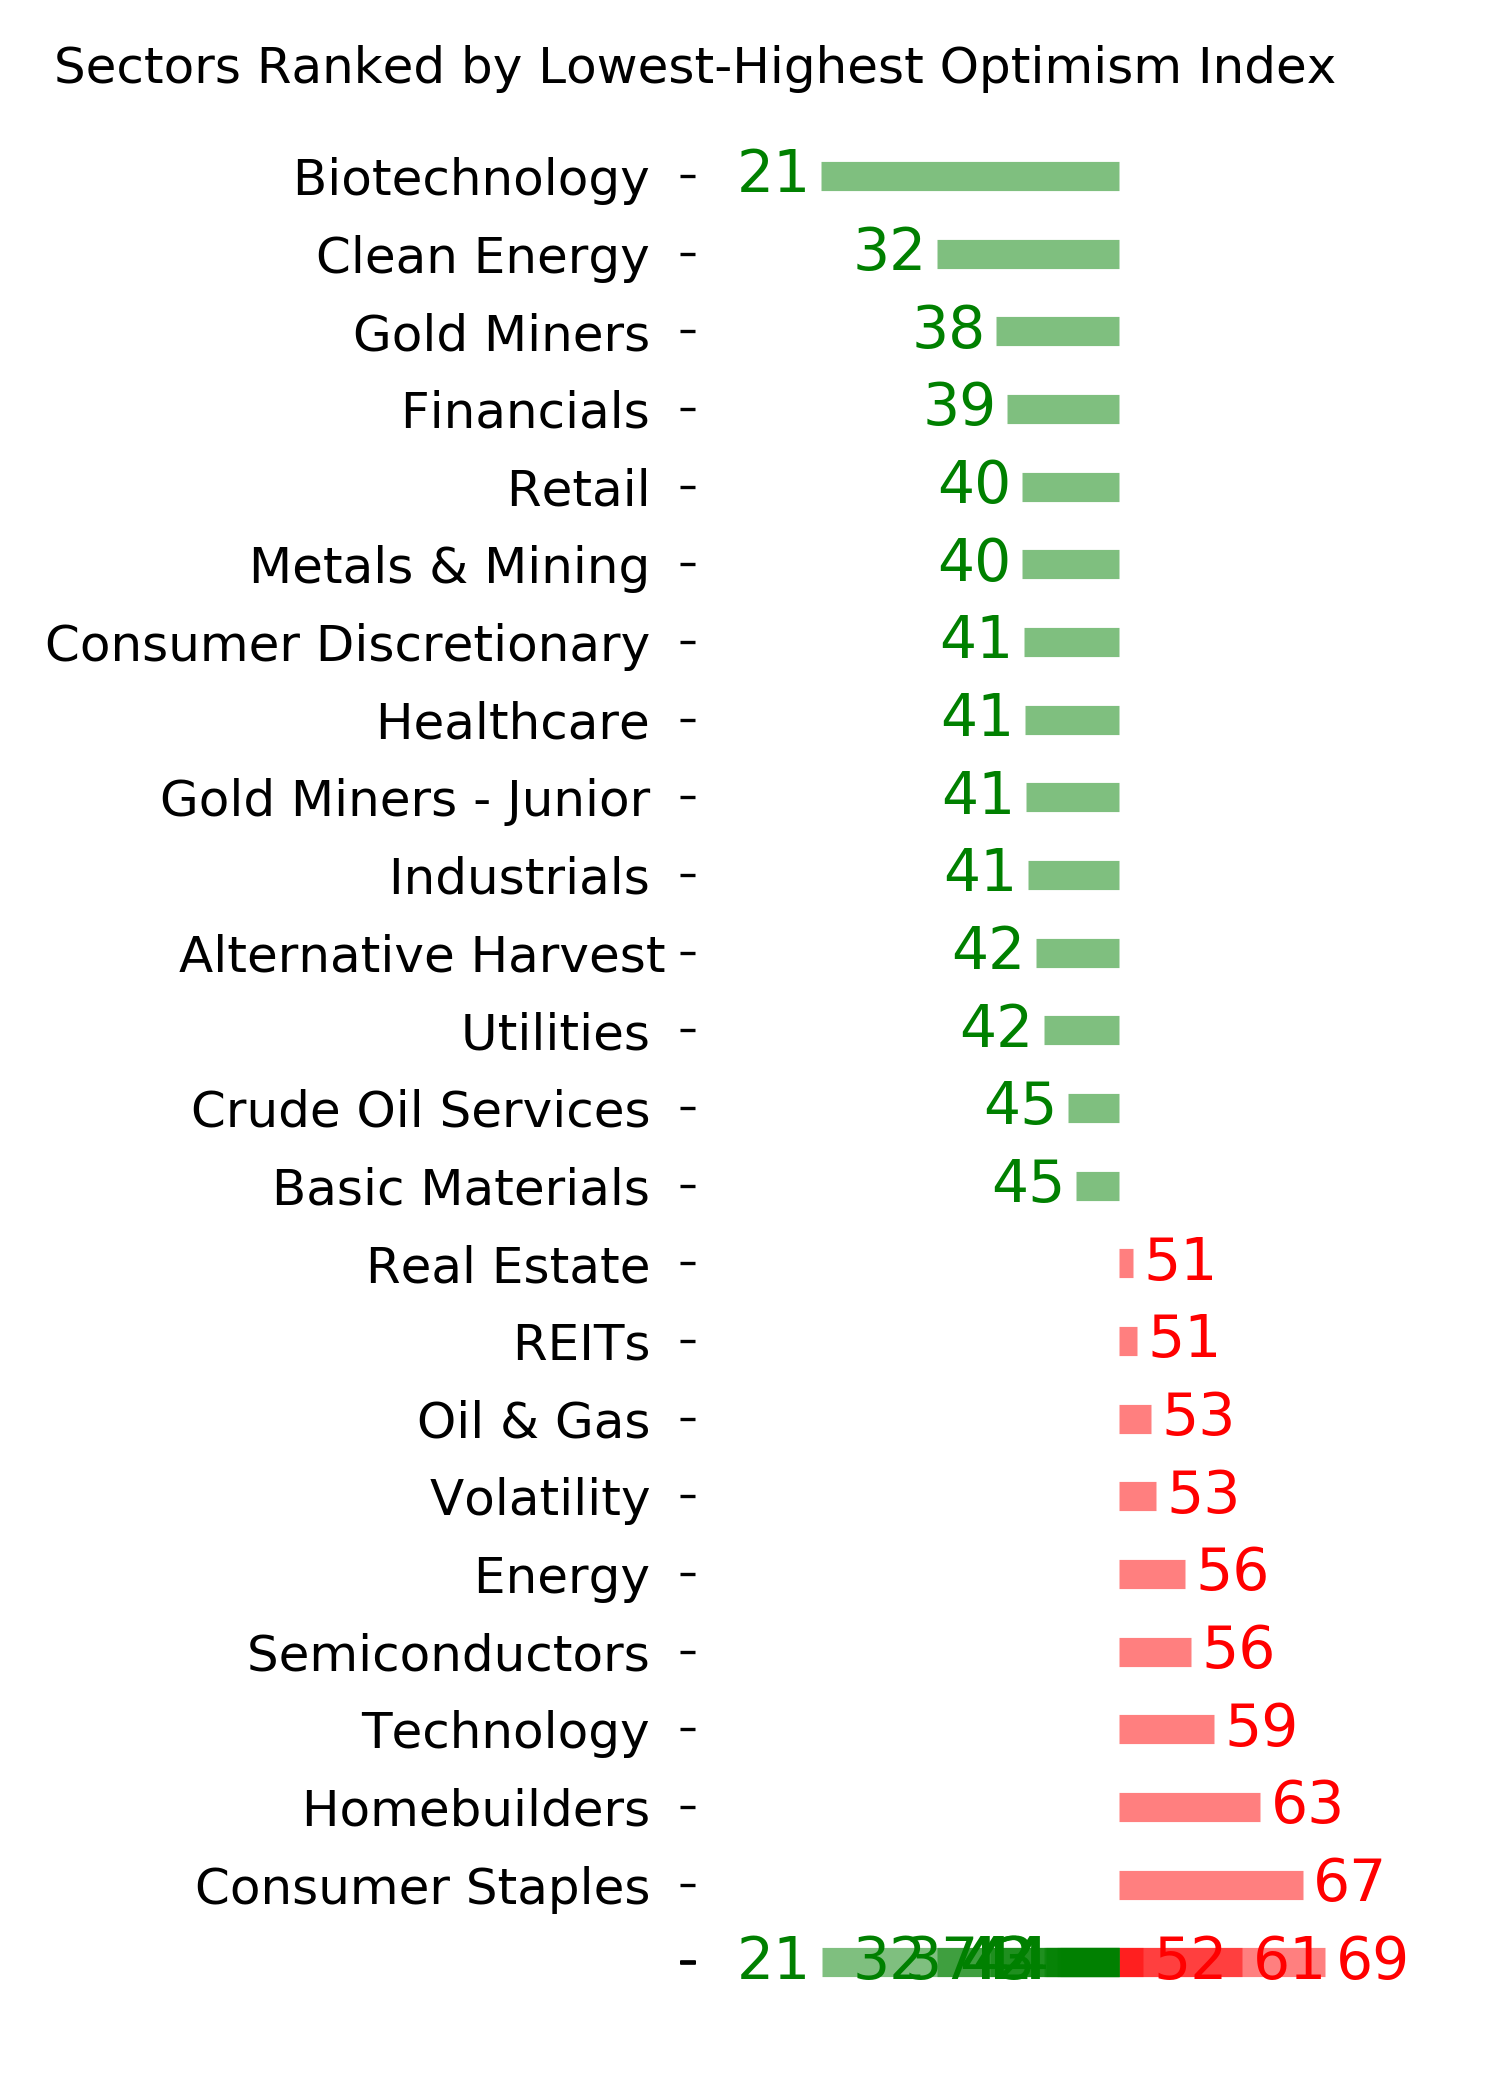
Ranks
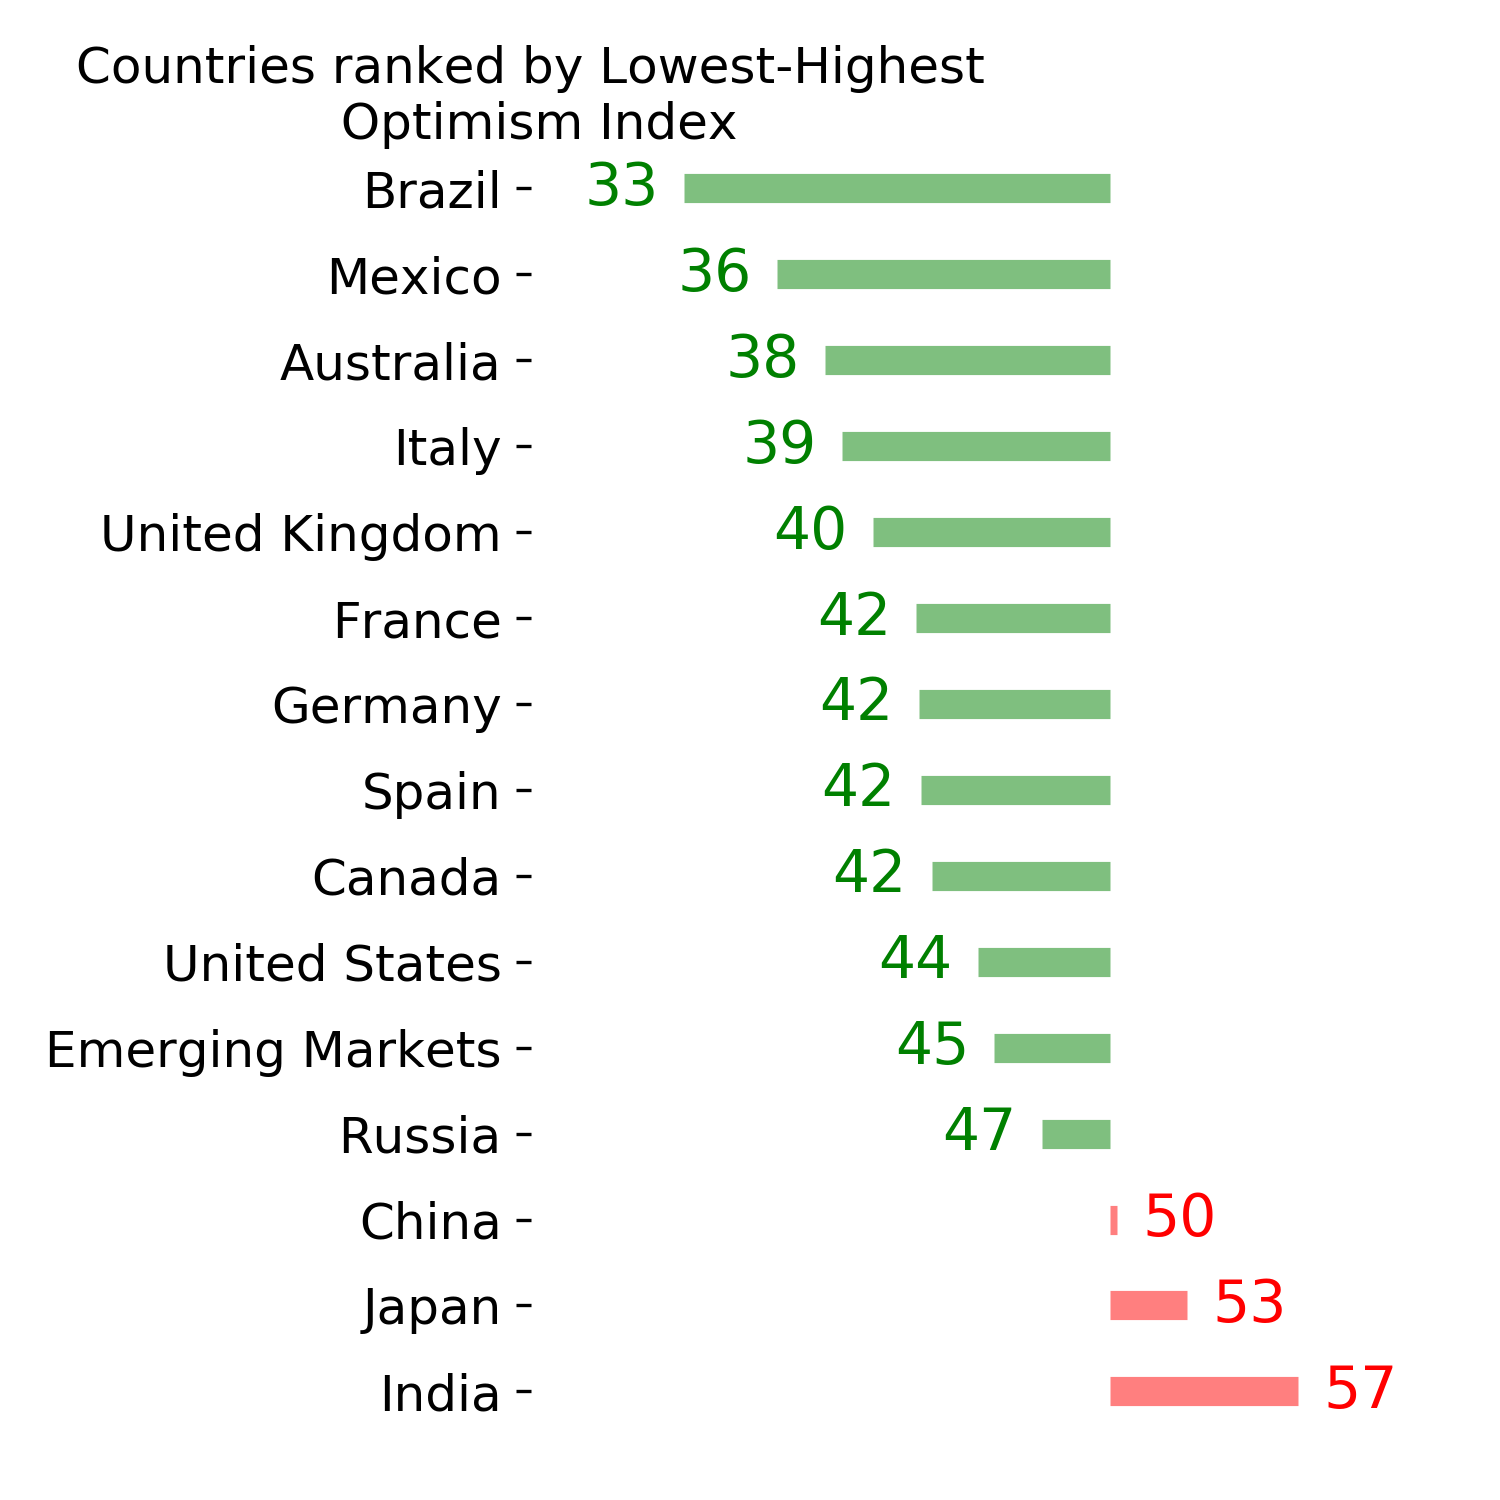
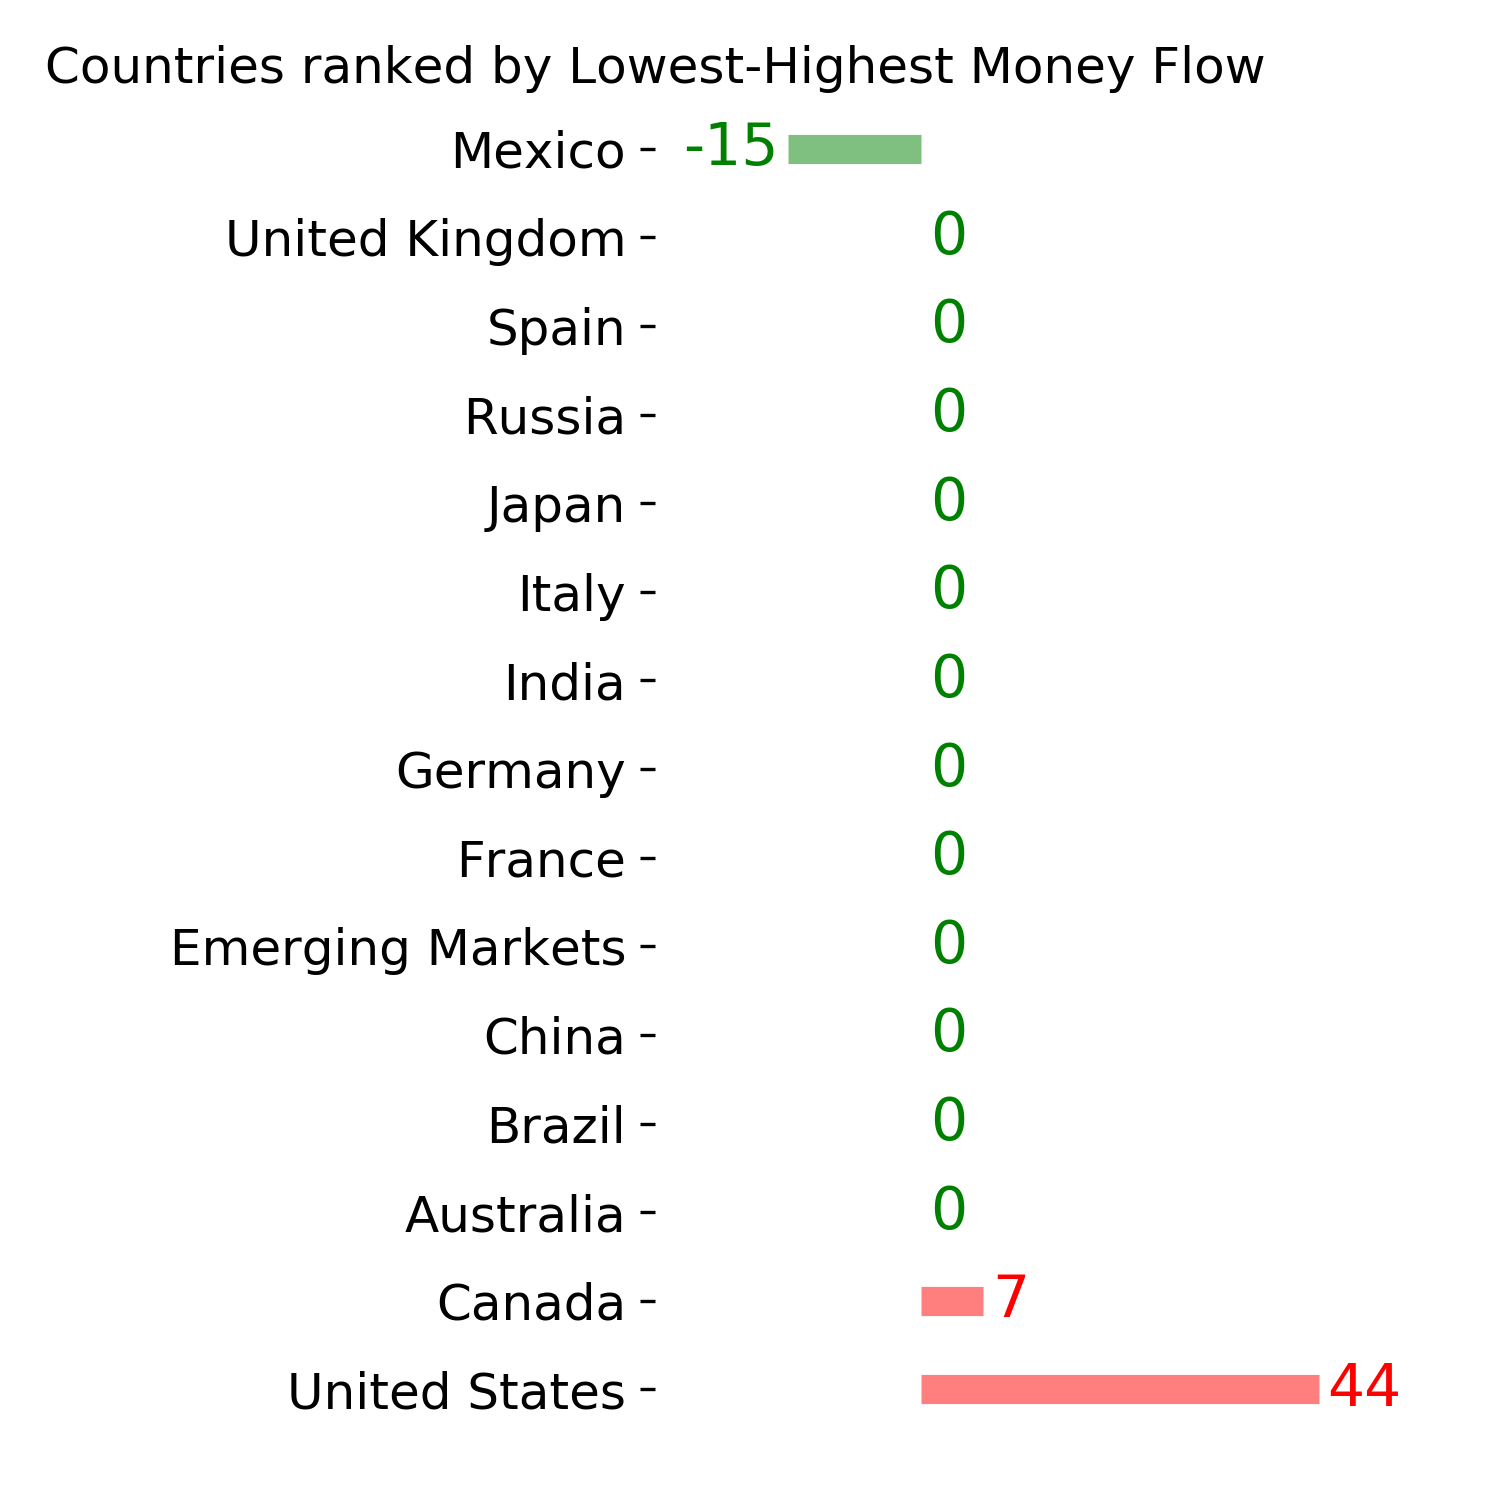
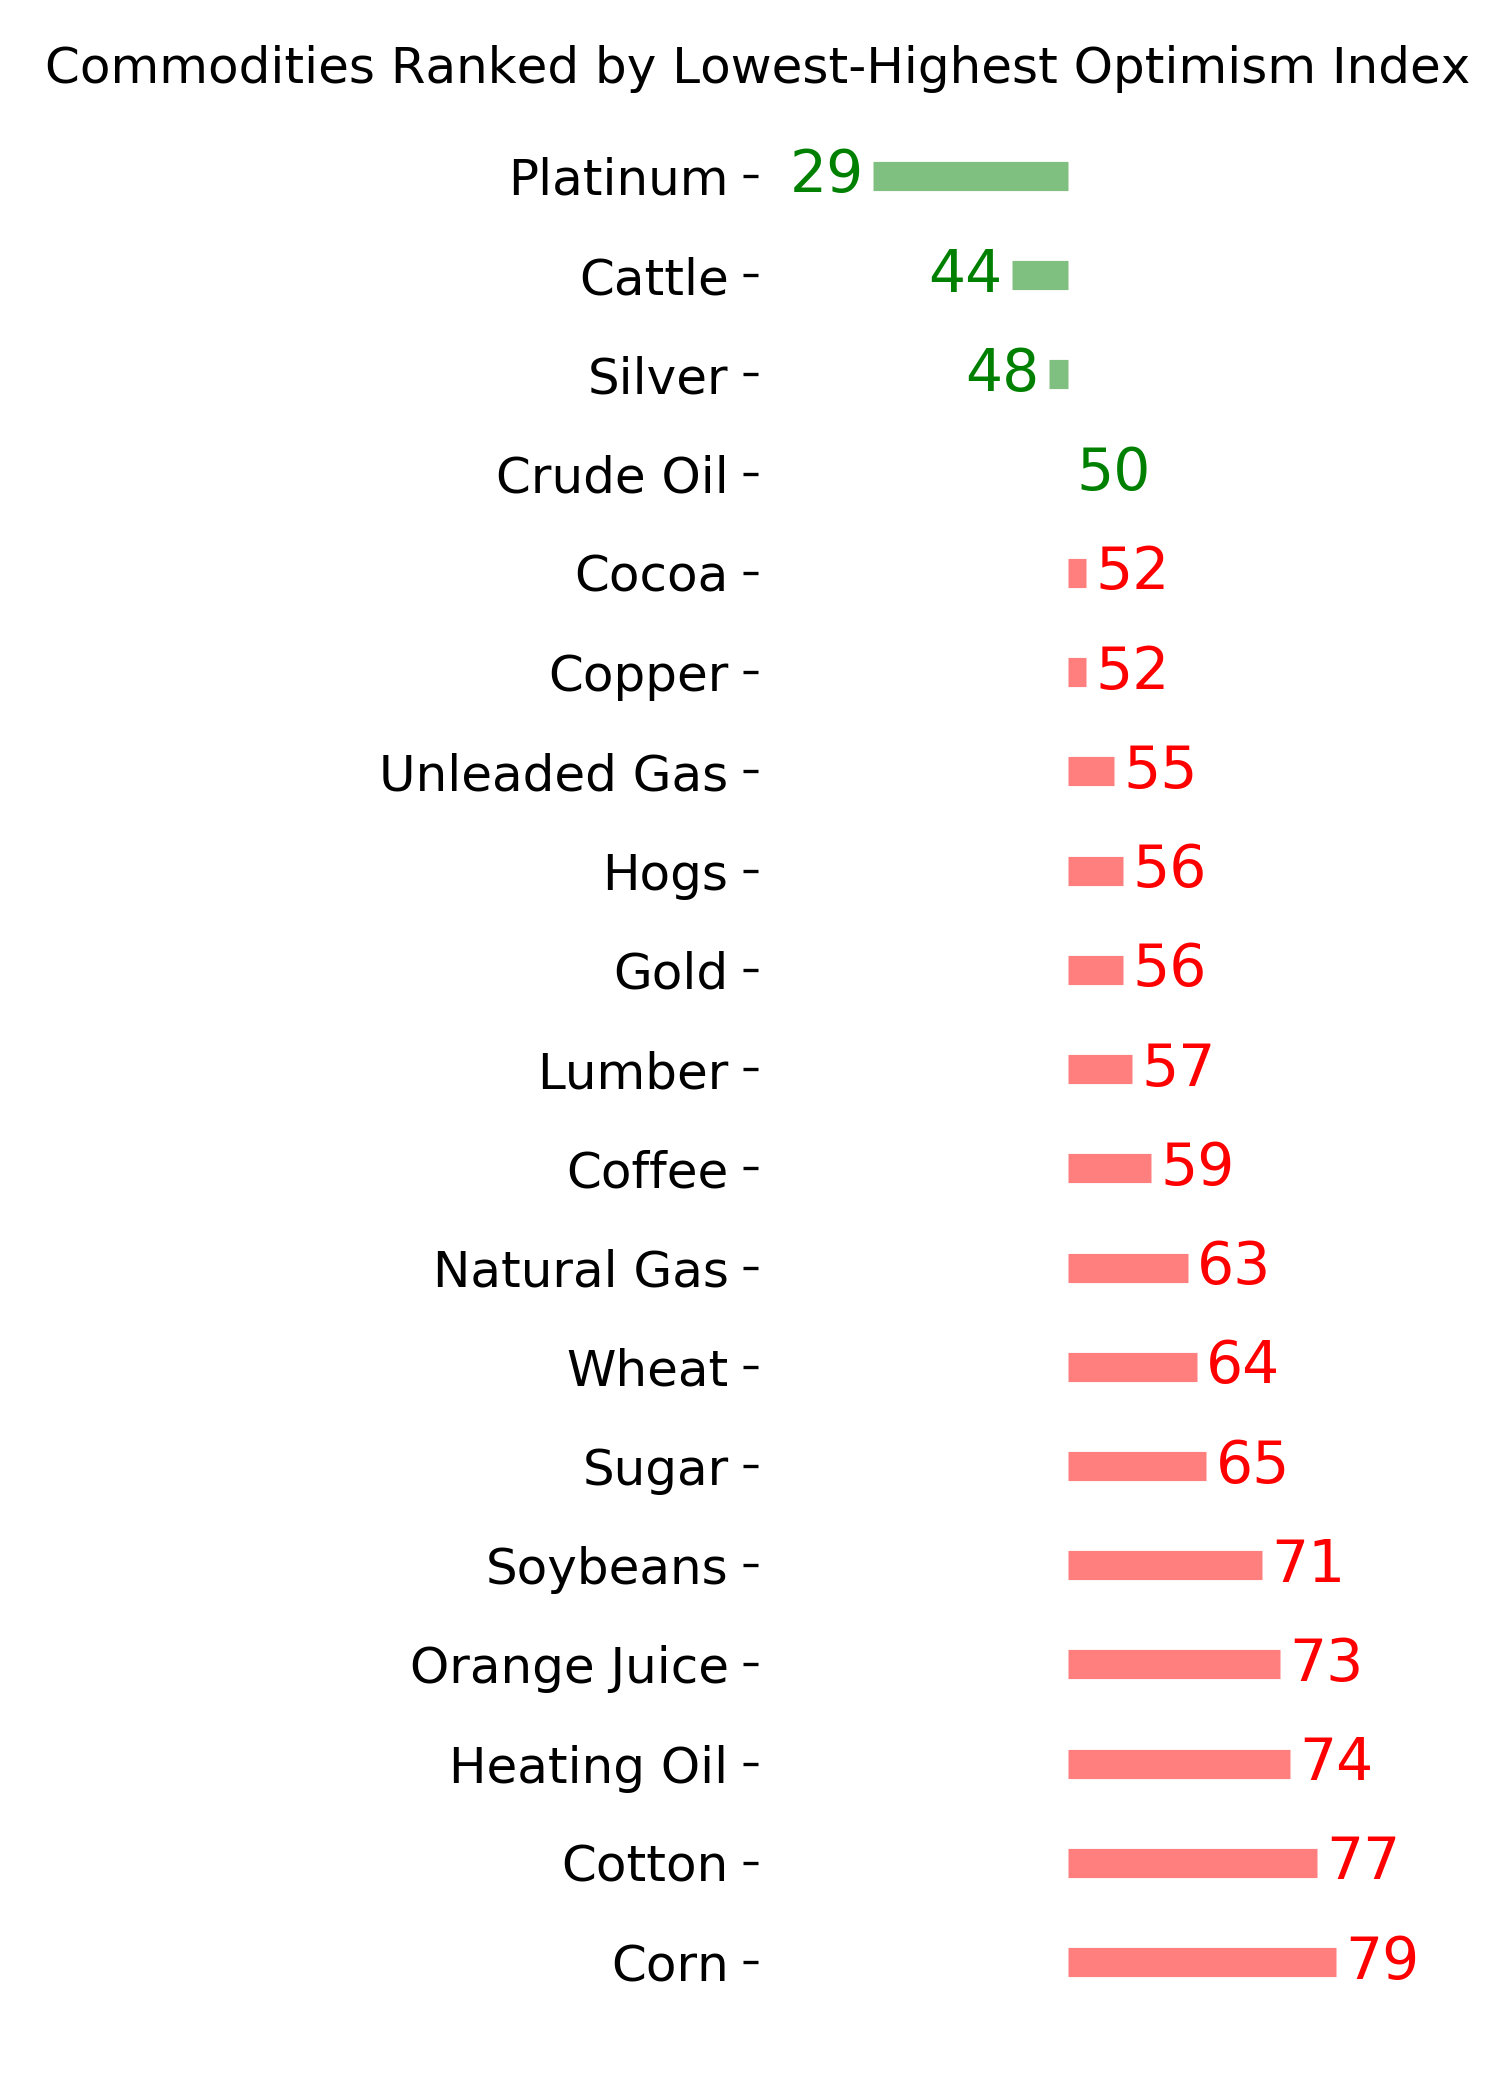
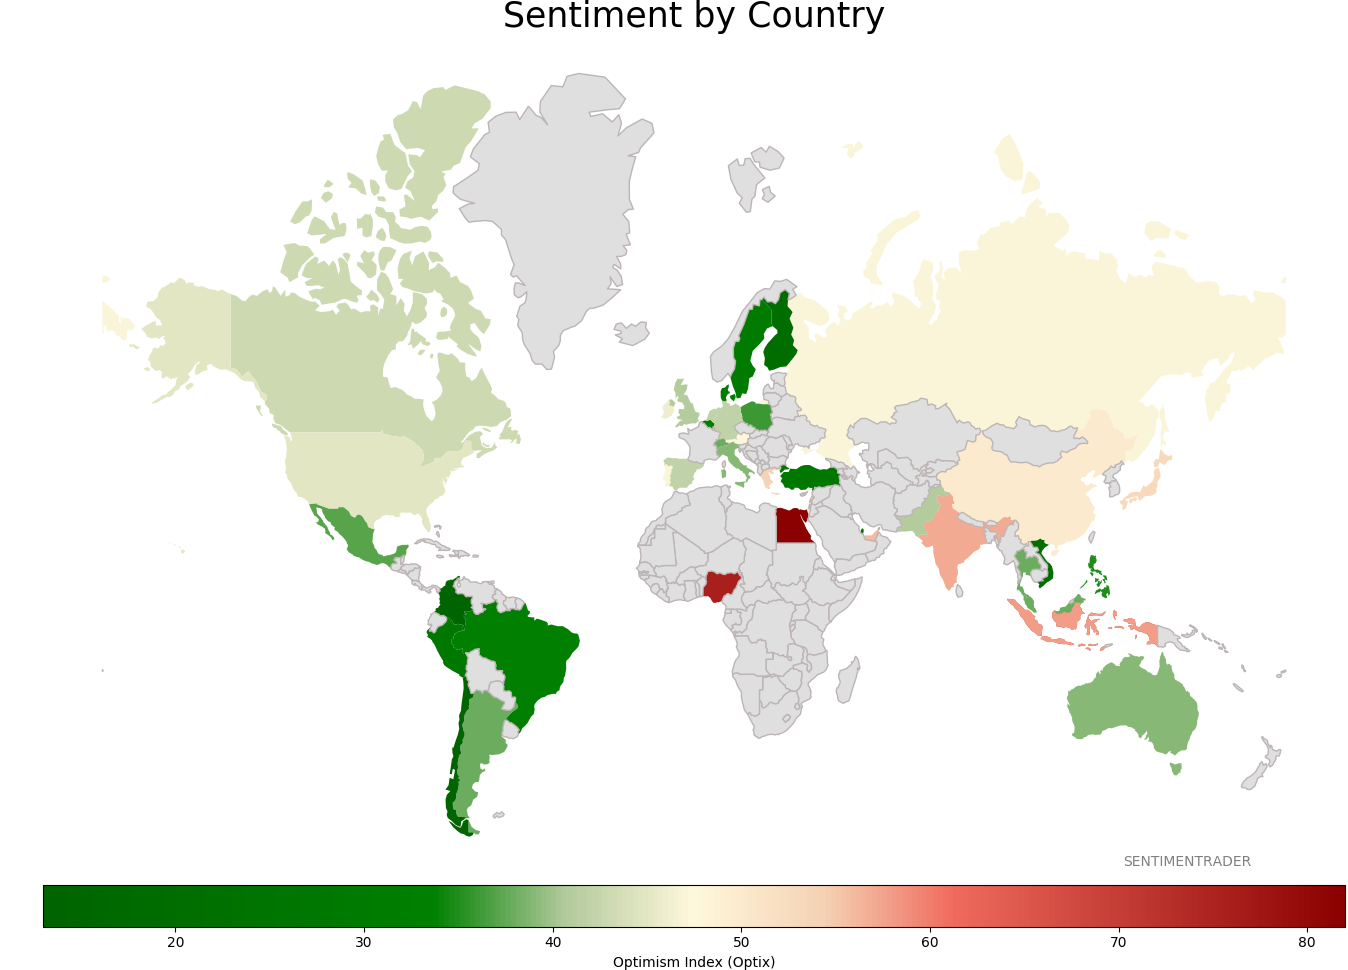
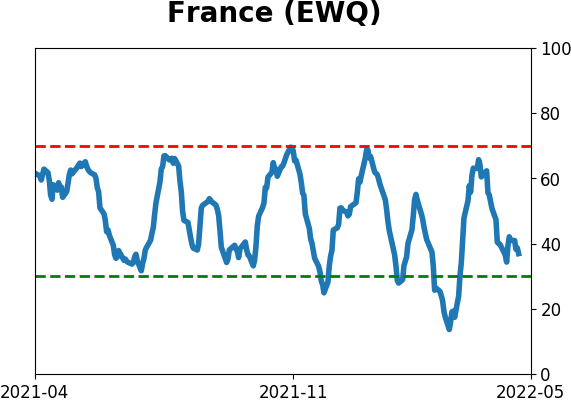
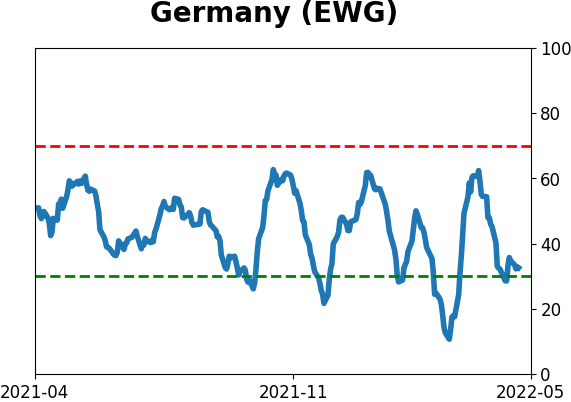
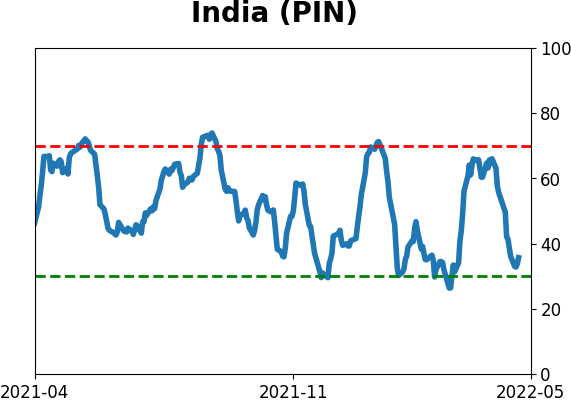
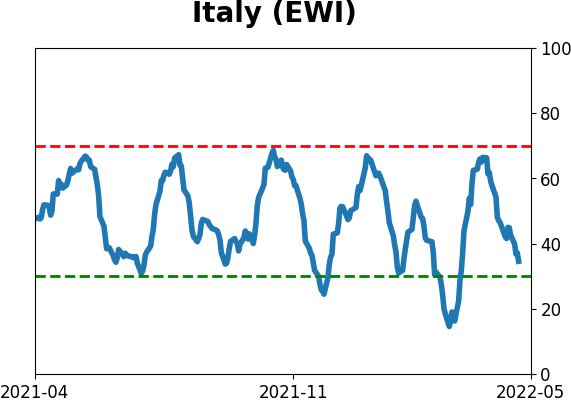
Sentiment Around The World
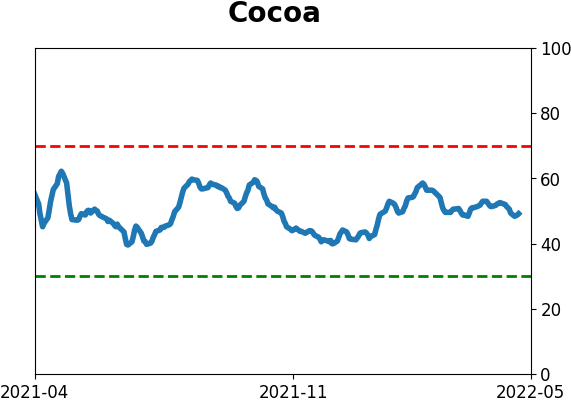
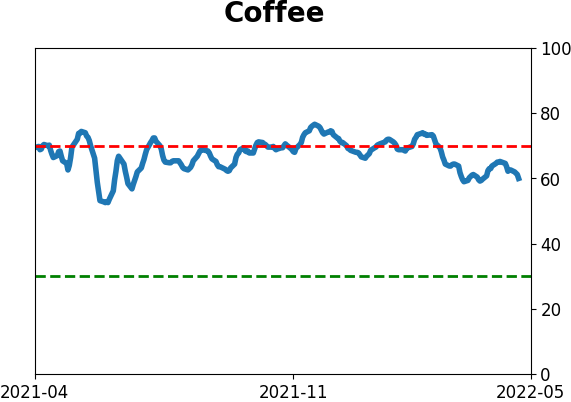
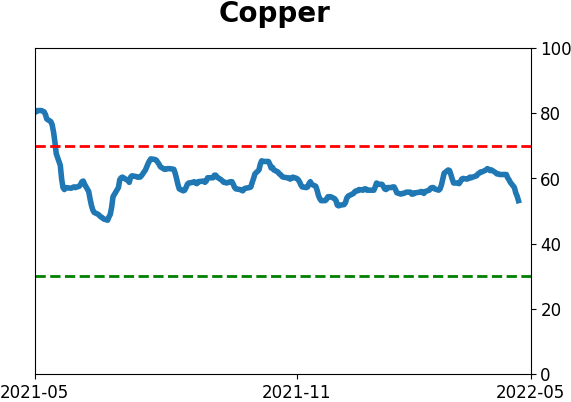
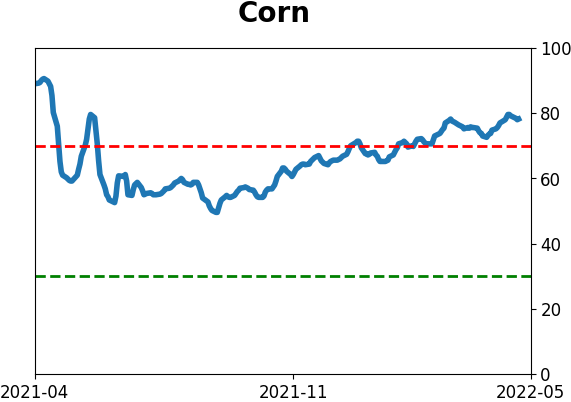
Optimism Index Thumbnails
|
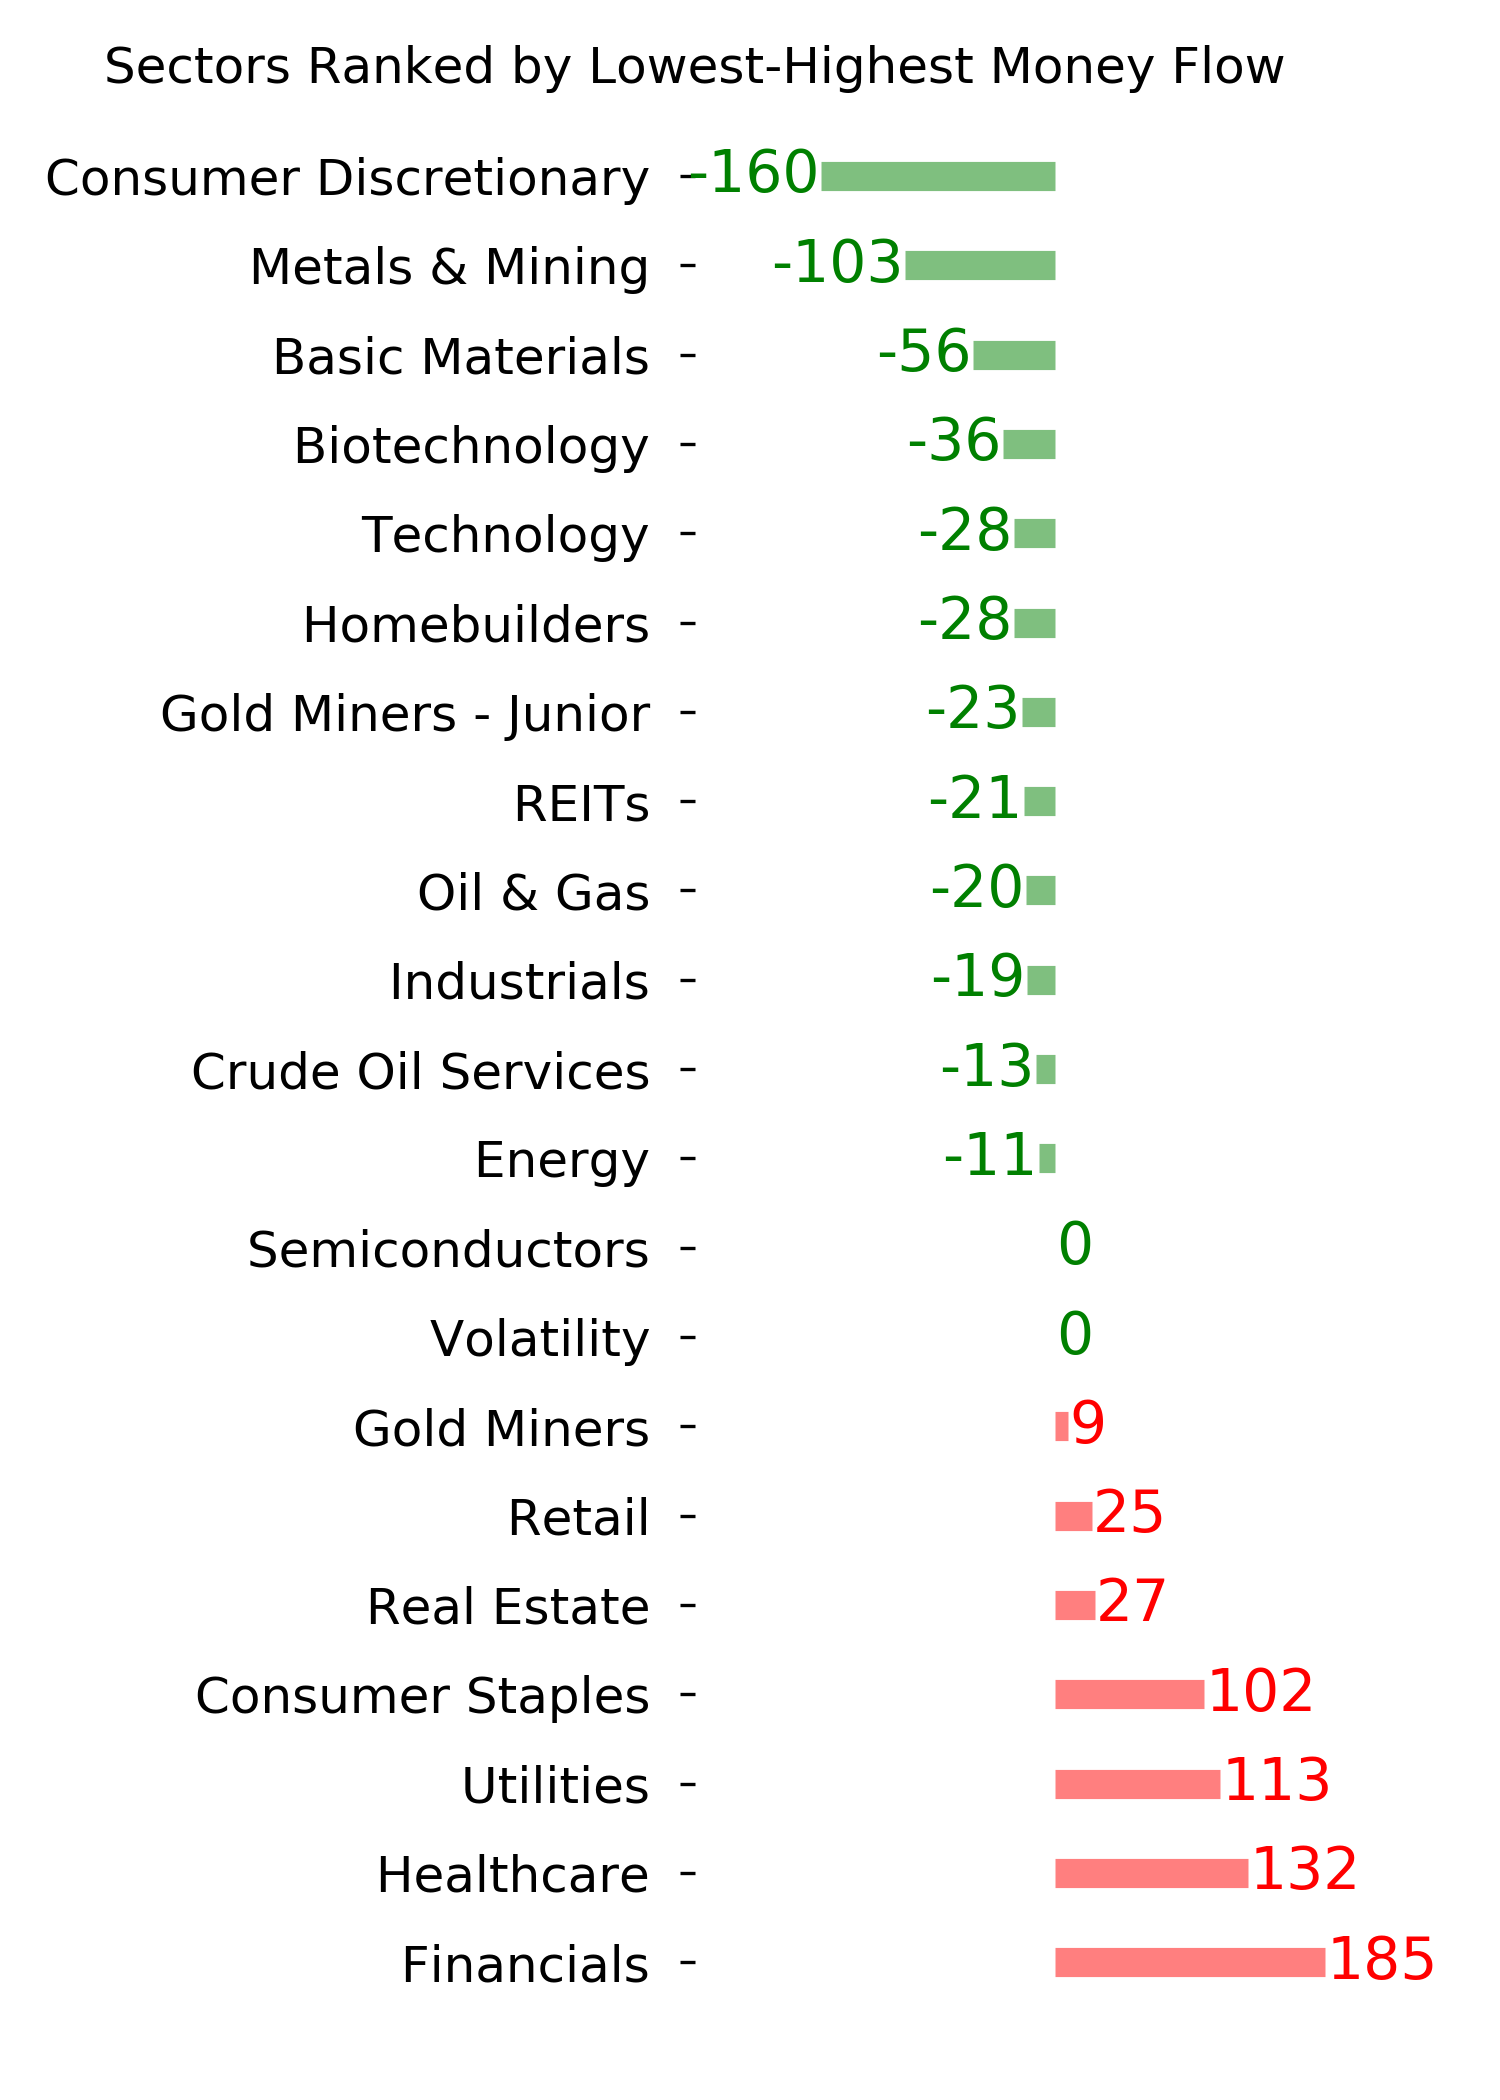
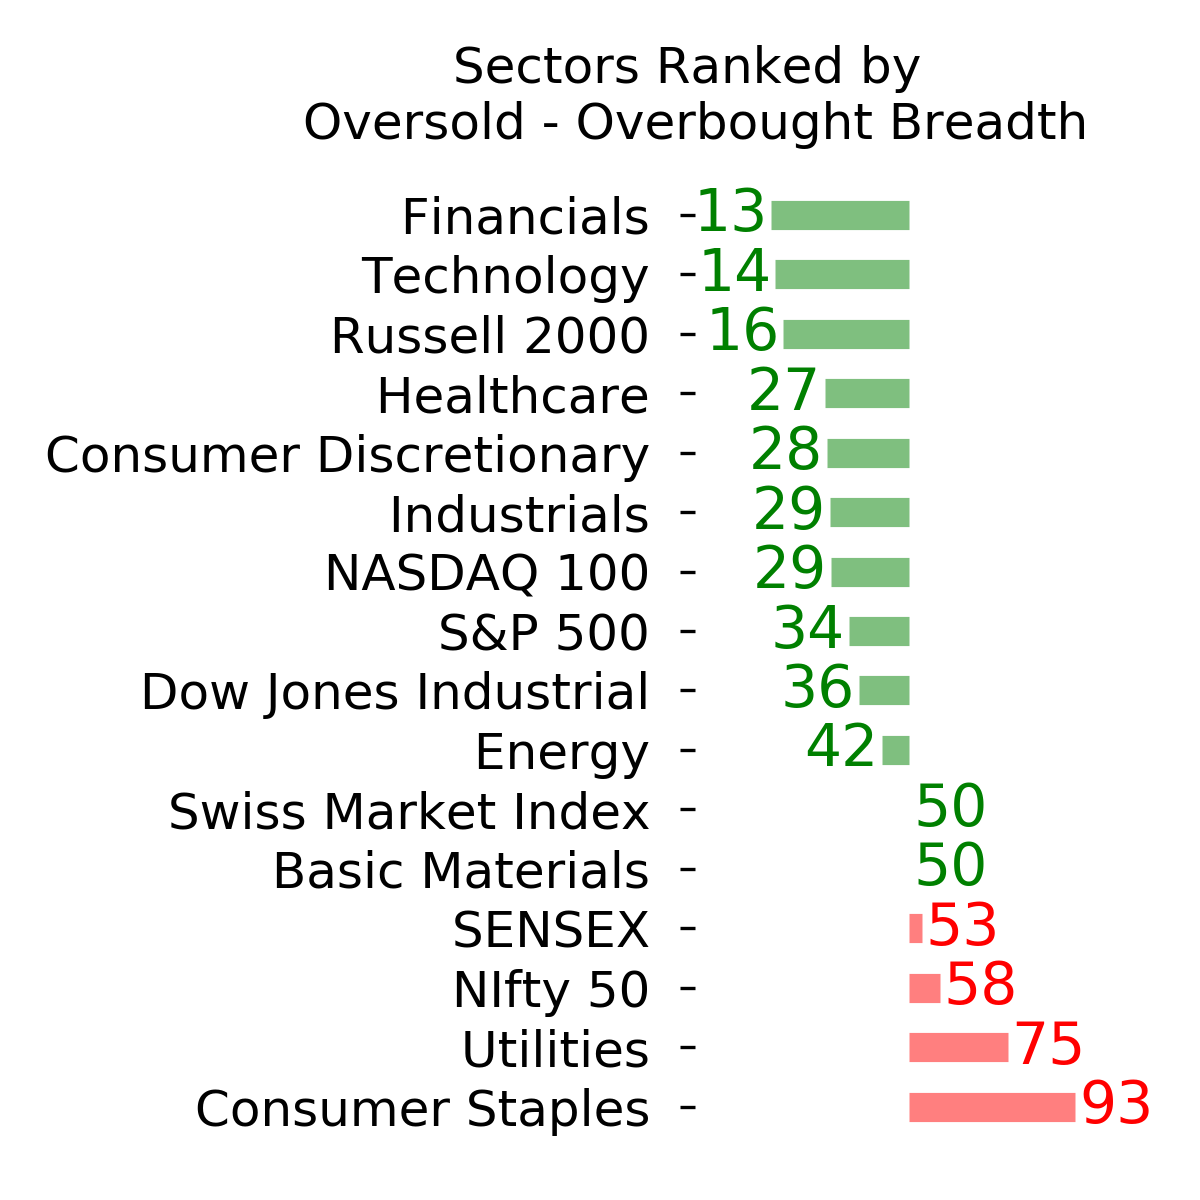
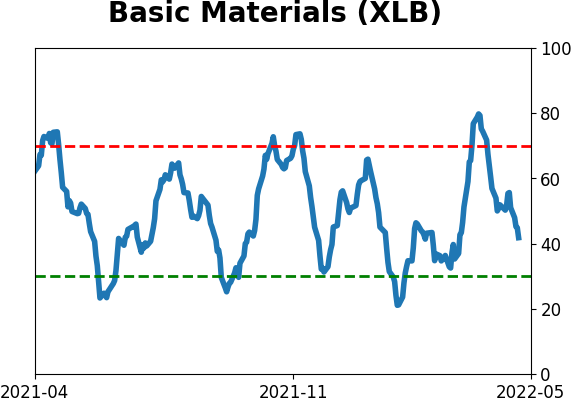
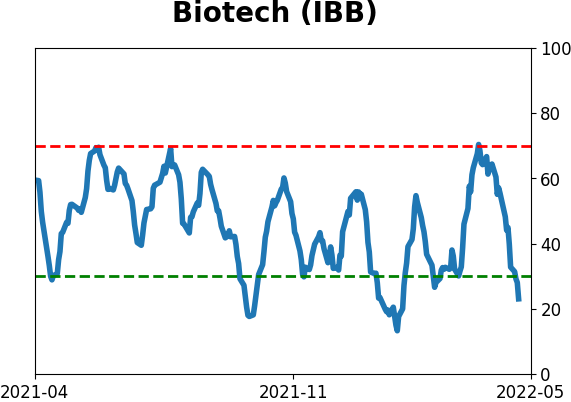
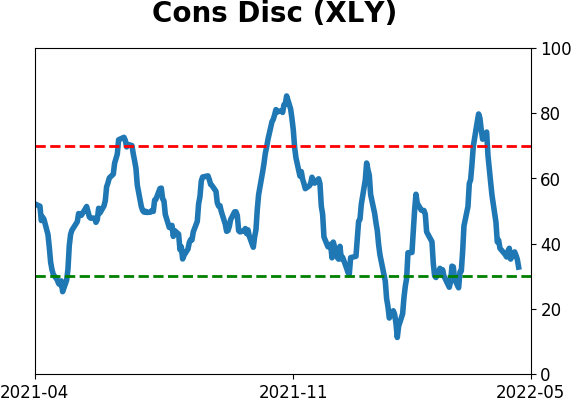
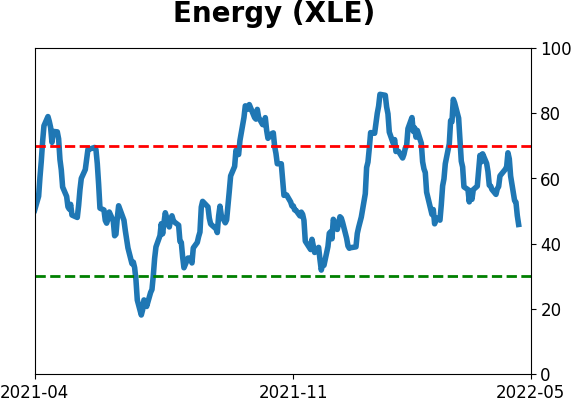
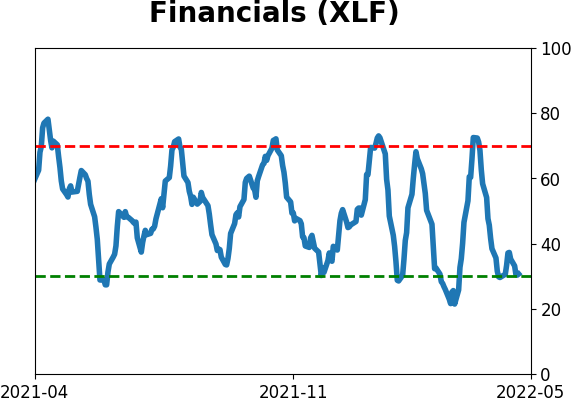
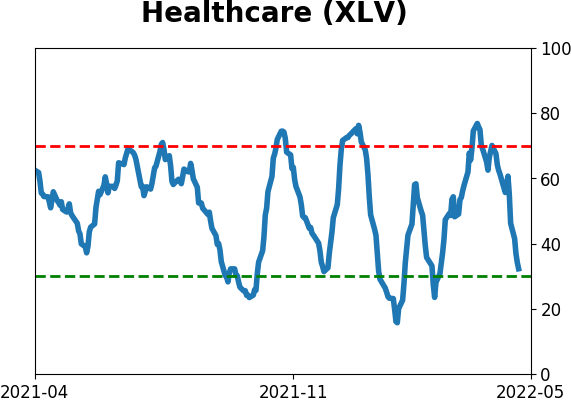
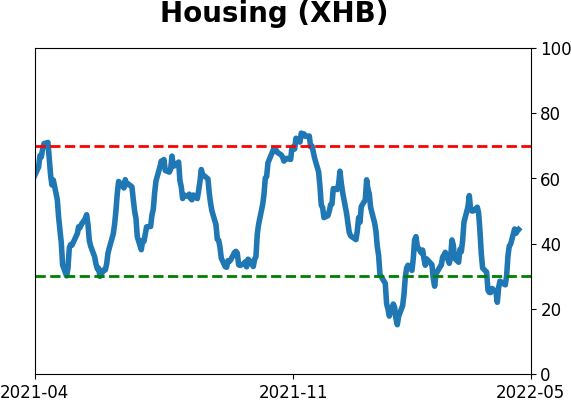
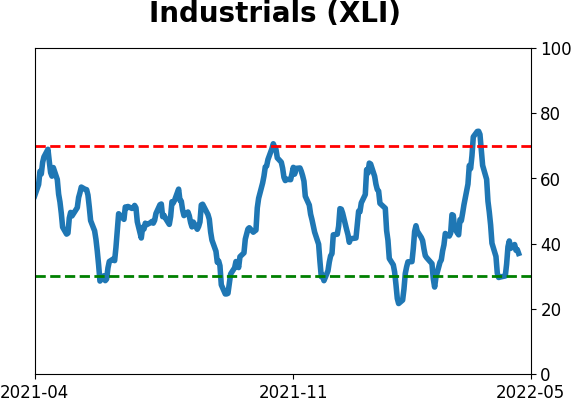
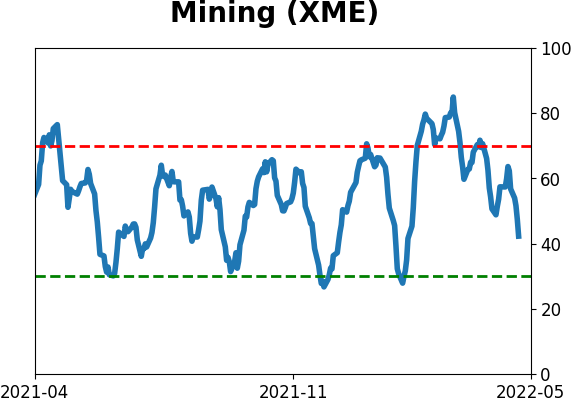
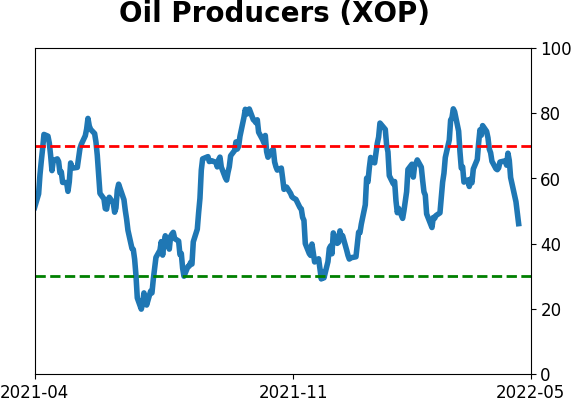
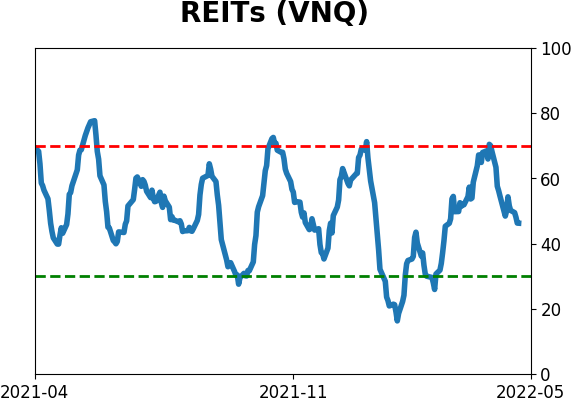
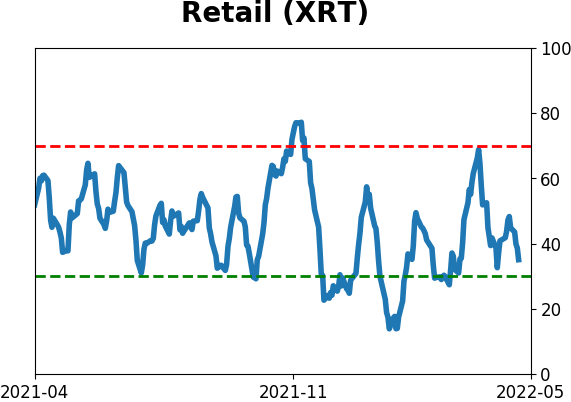
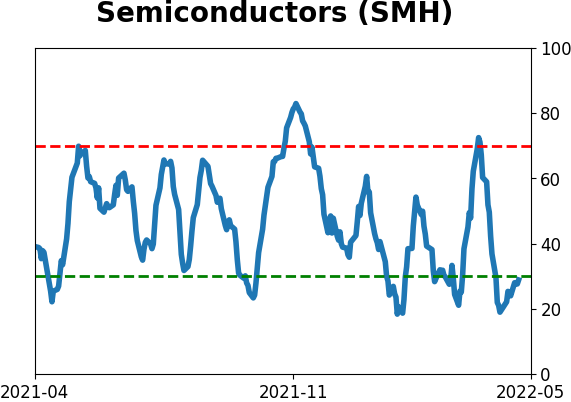
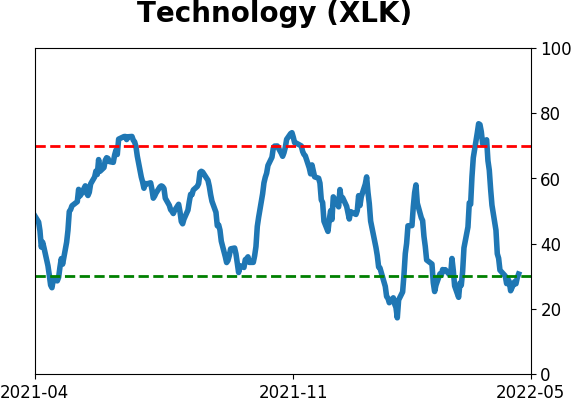
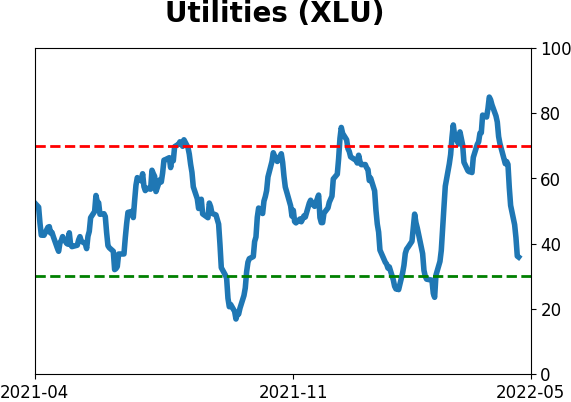
Sector ETF's - 10-Day Moving Average
|
|
|
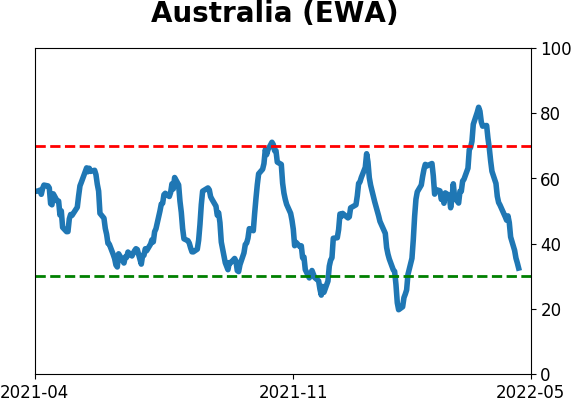
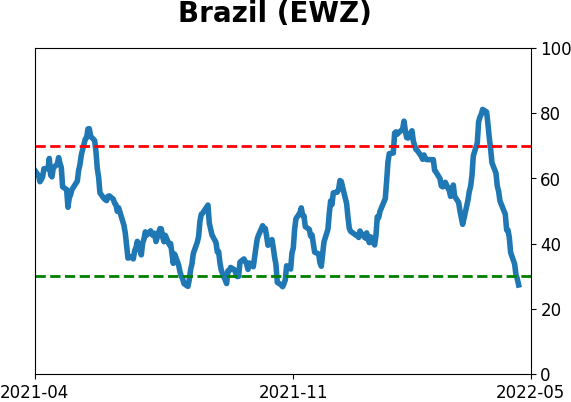
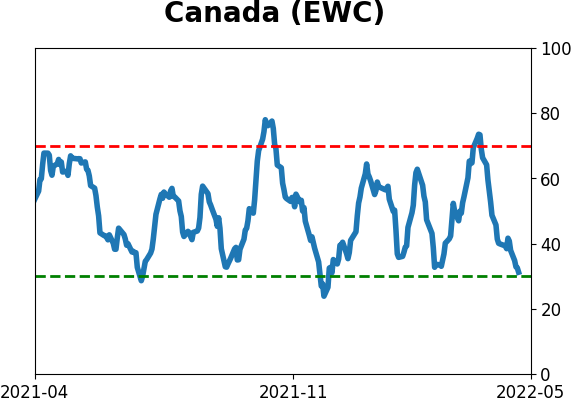
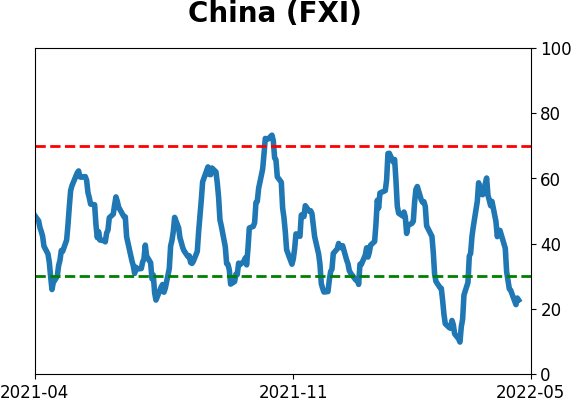
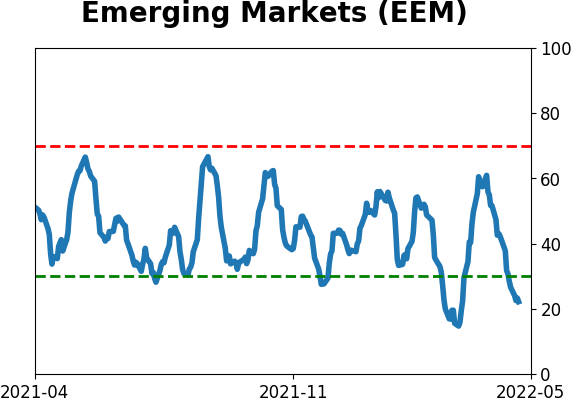
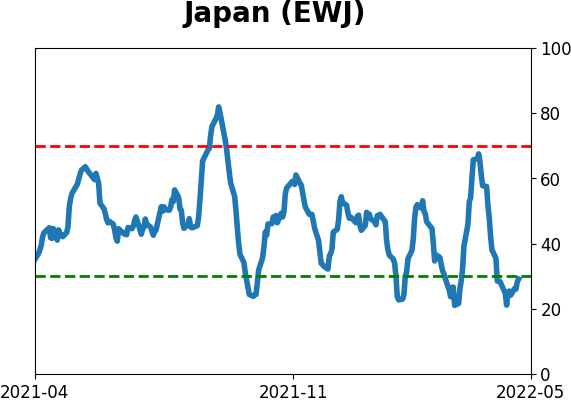
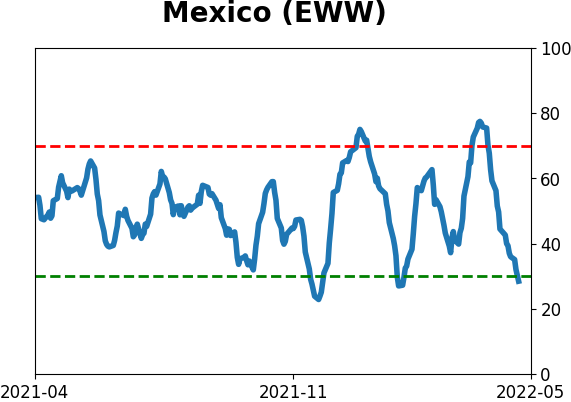
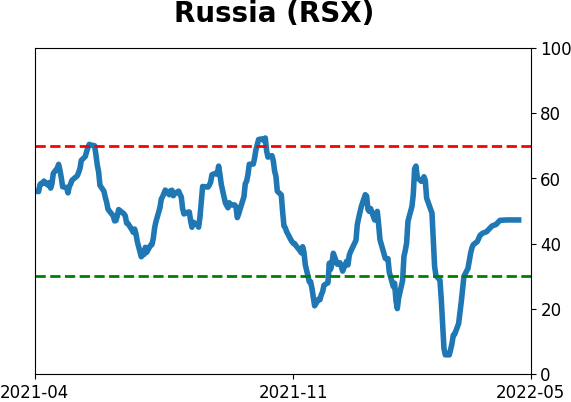
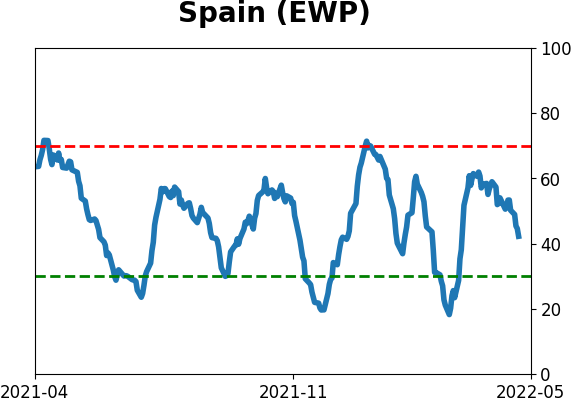
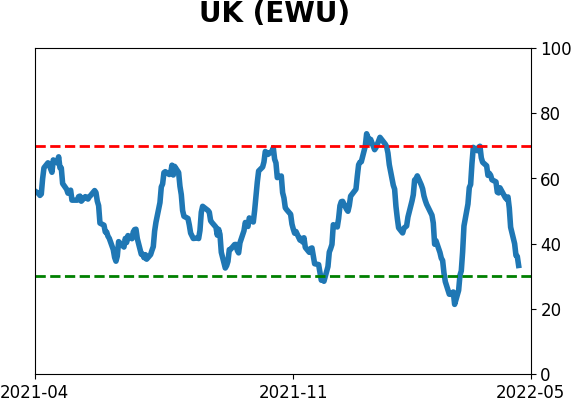
Country ETF's - 10-Day Moving Average
|
|
|
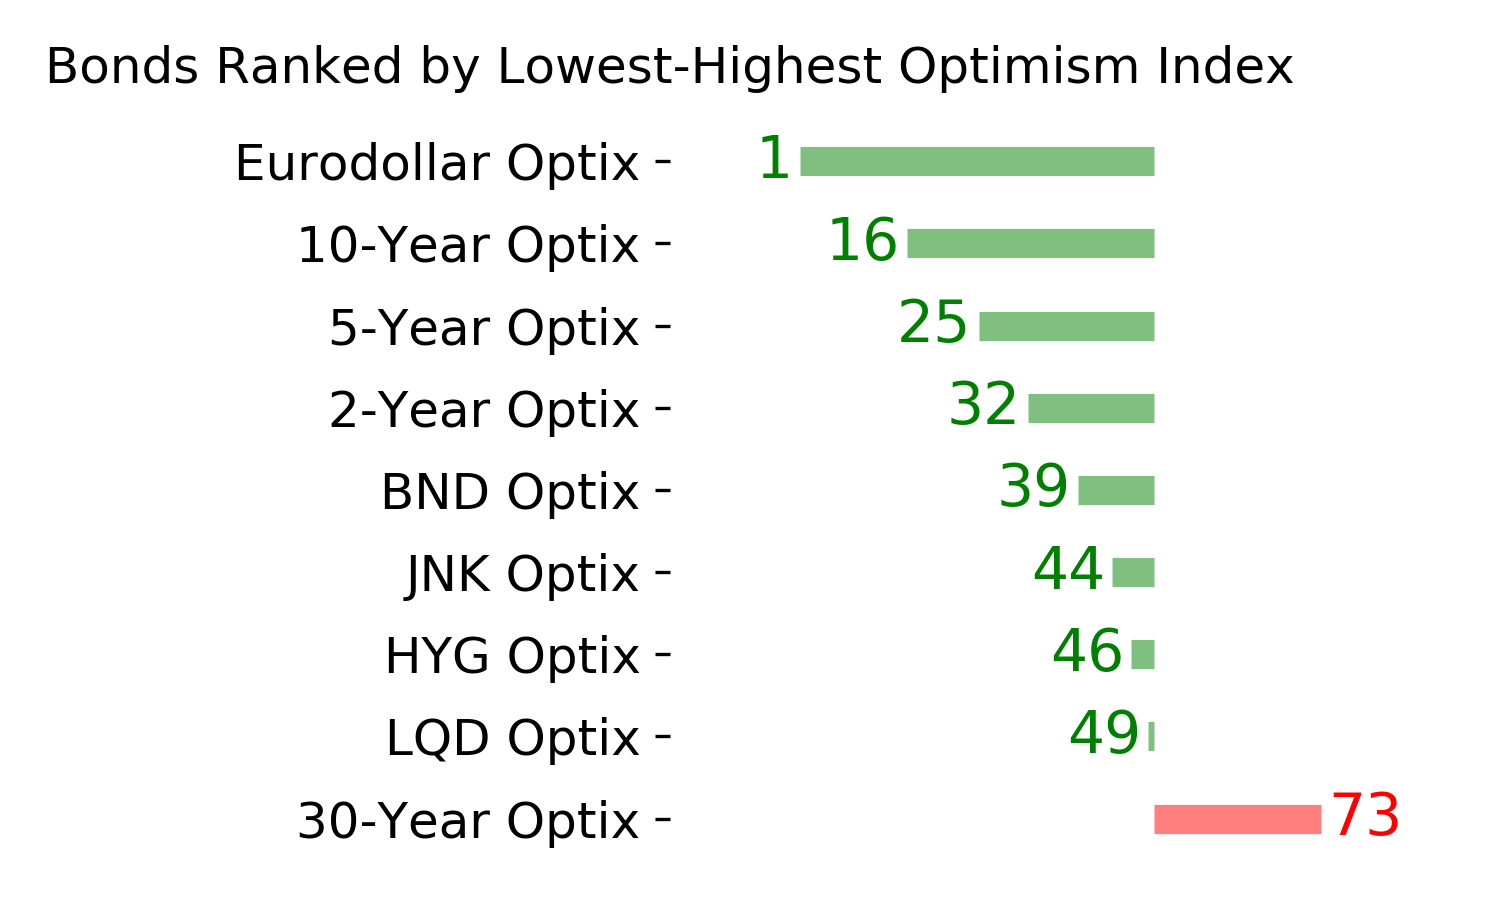
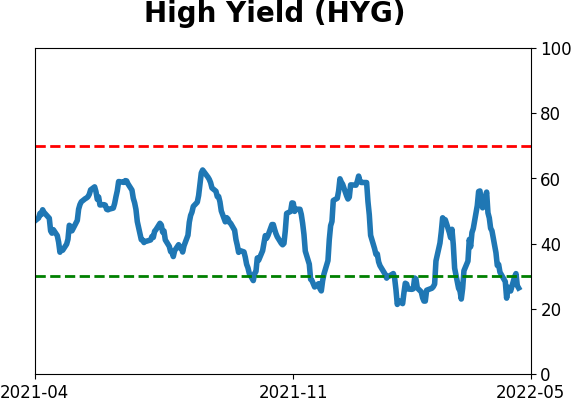
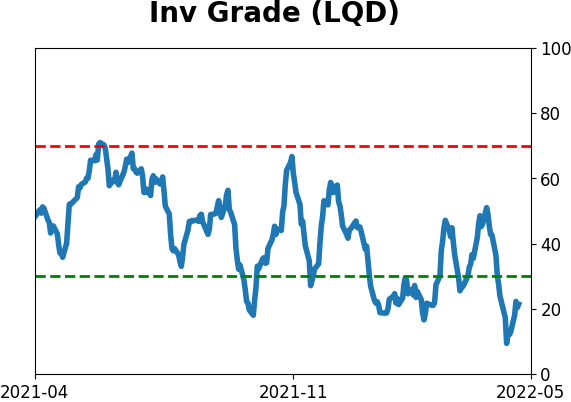
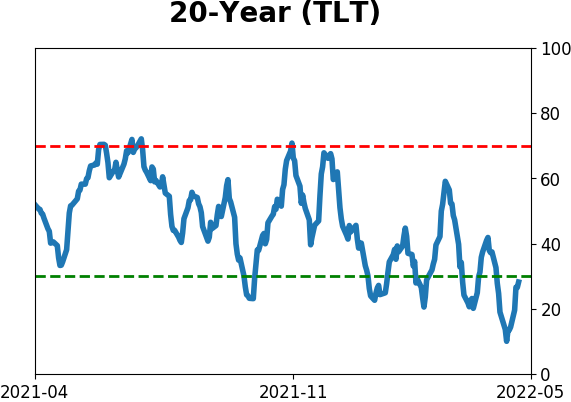
Bond ETF's - 10-Day Moving Average
|
|
|
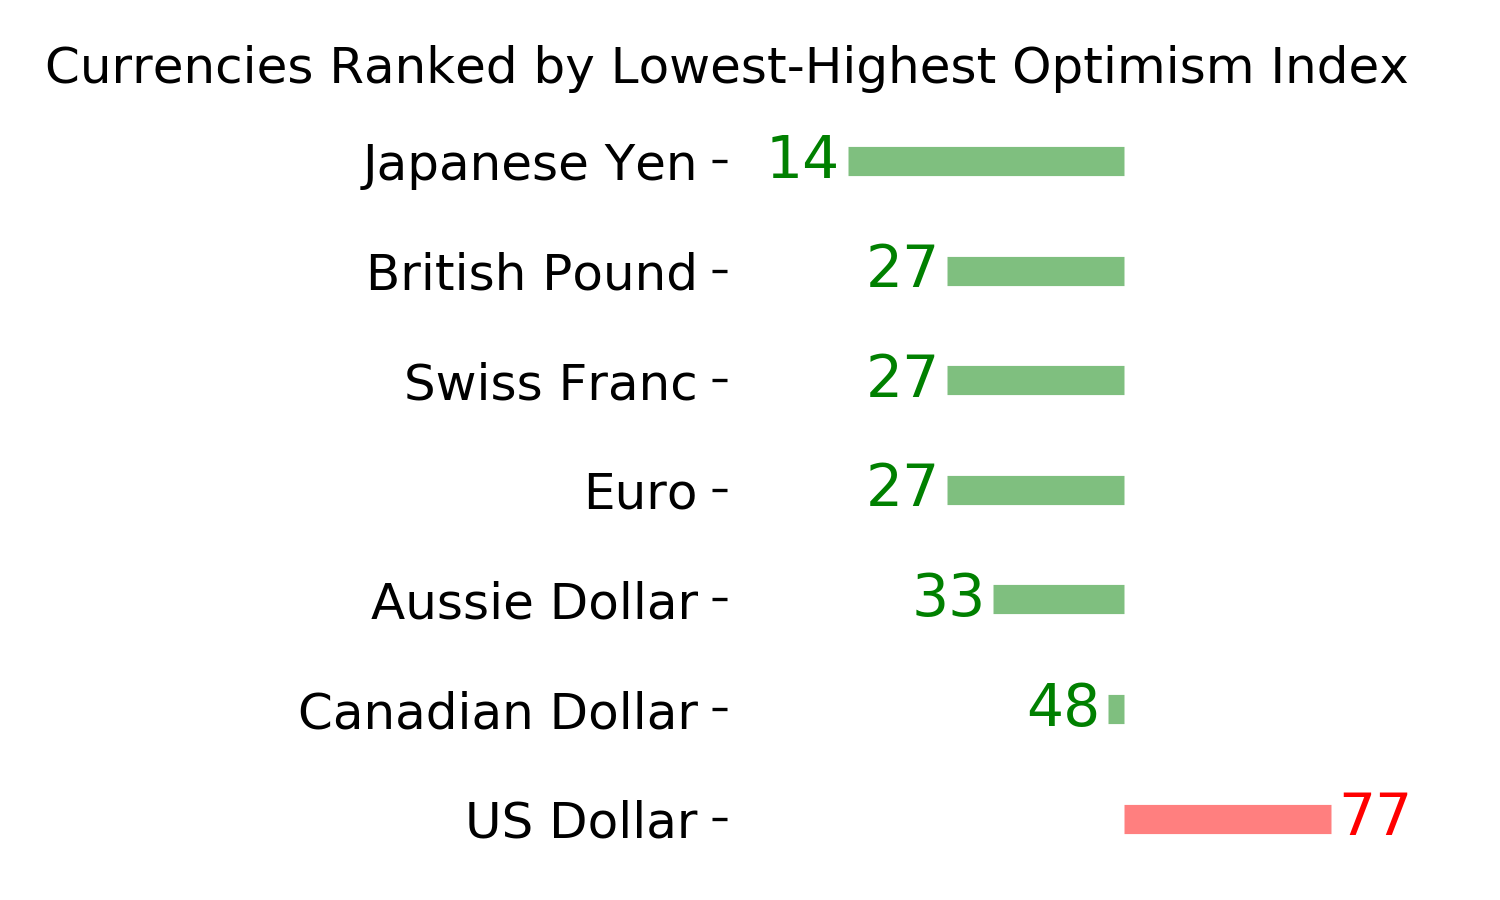
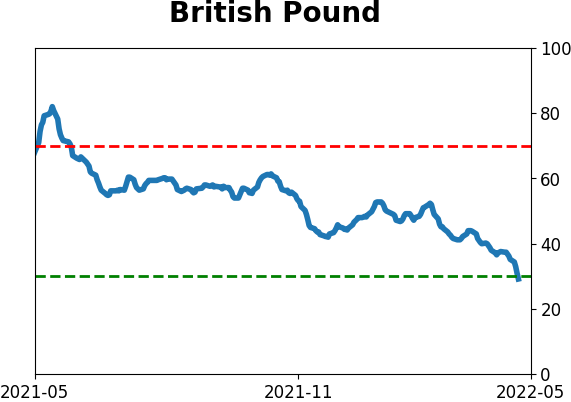
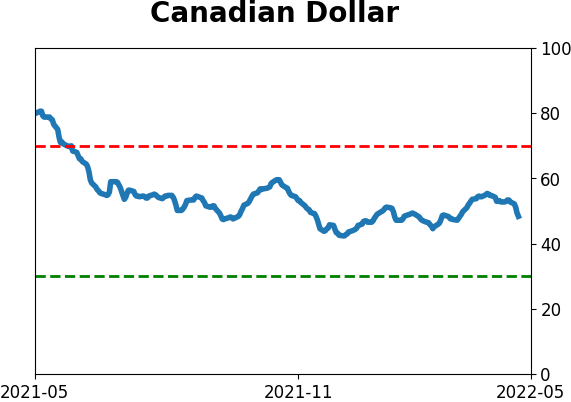
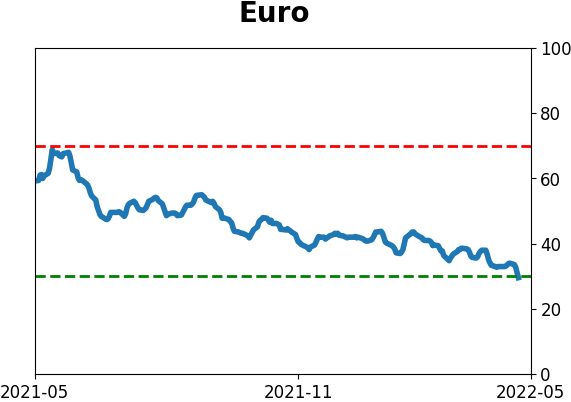
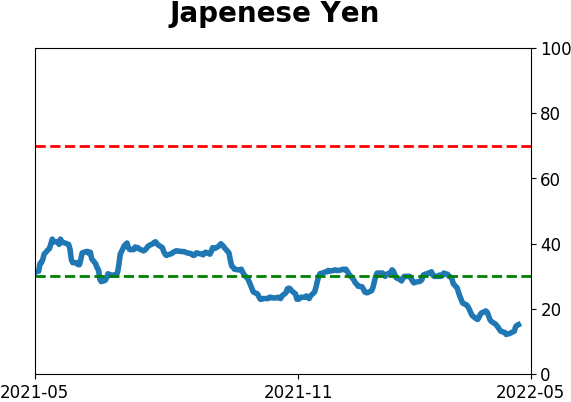
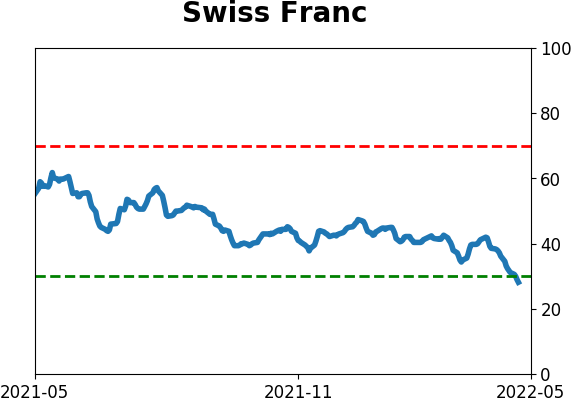
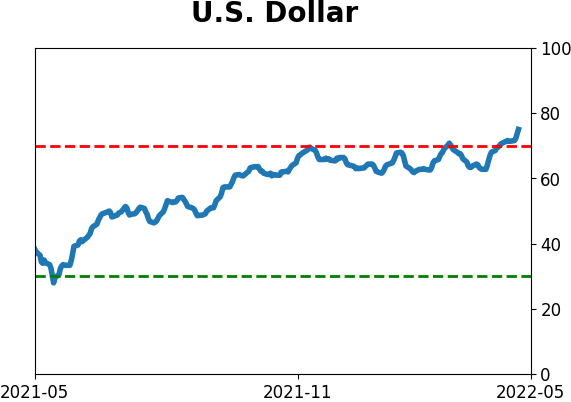
Currency ETF's - 5-Day Moving Average
|
|
|
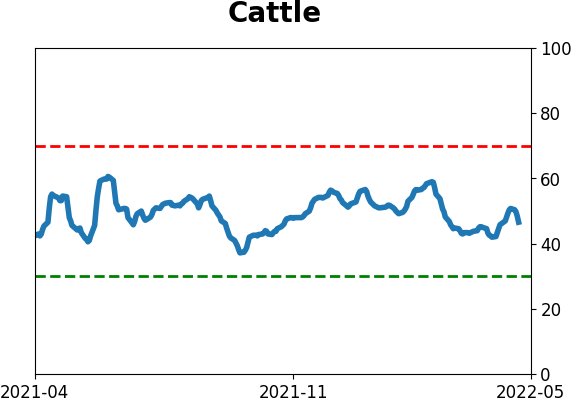
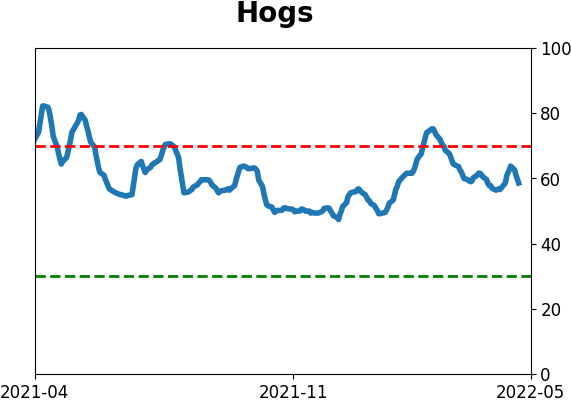
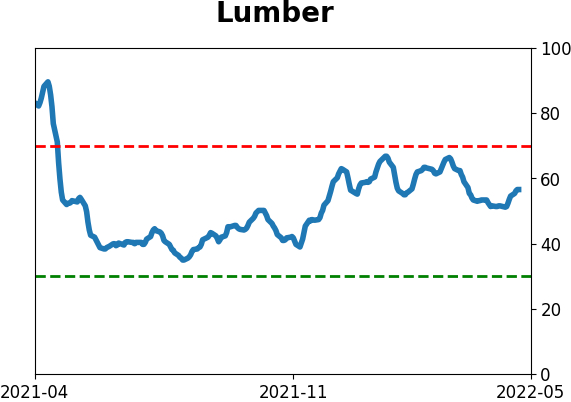
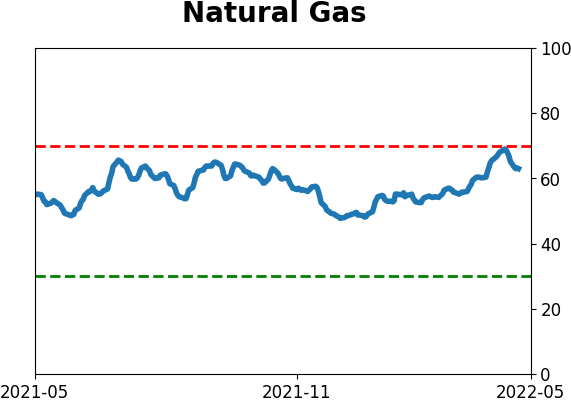
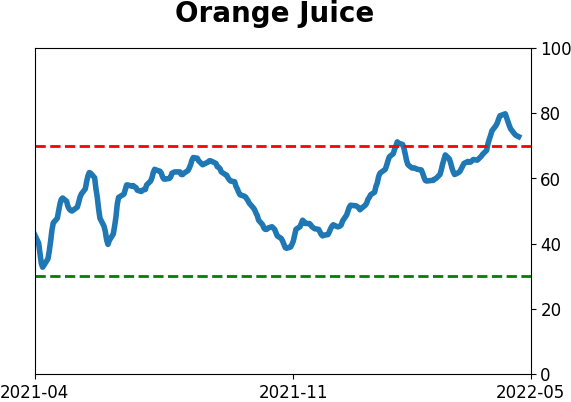
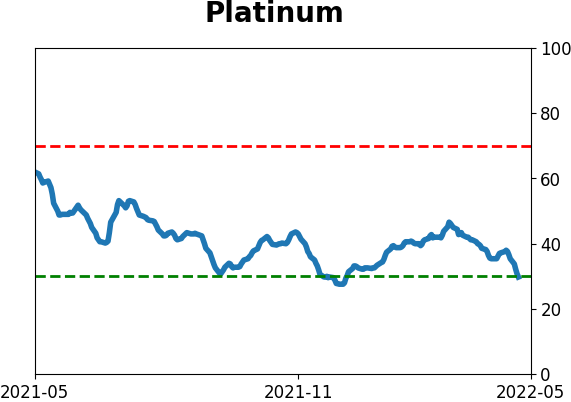
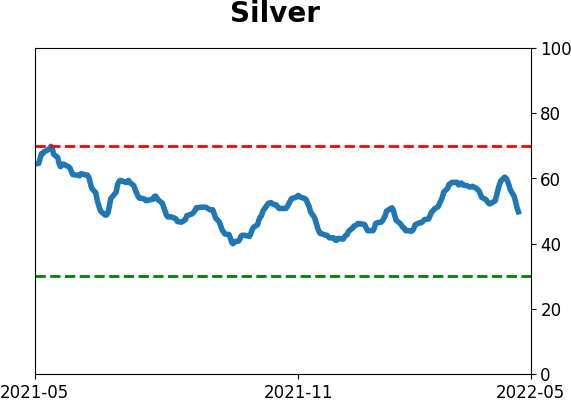
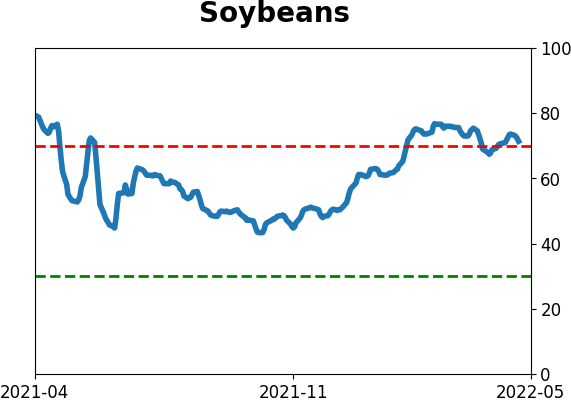
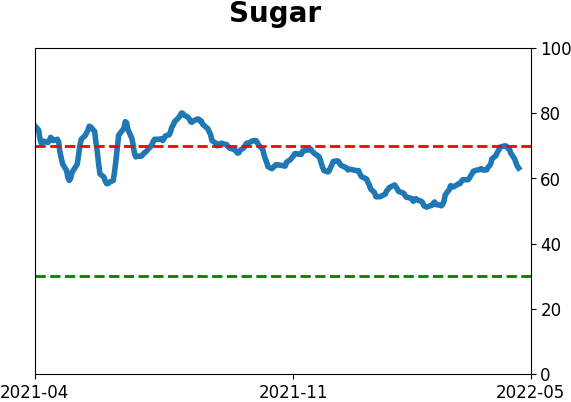
Commodity ETF's - 5-Day Moving Average
|
|