Headlines
|
|
Three sectors to be wary of in spring:
One of the keys to investment success is allocating capital when and where the probability of success is greatest and avoiding the opposite. This piece highlights three sectors that tend to show weakness as spring unfolds.
|
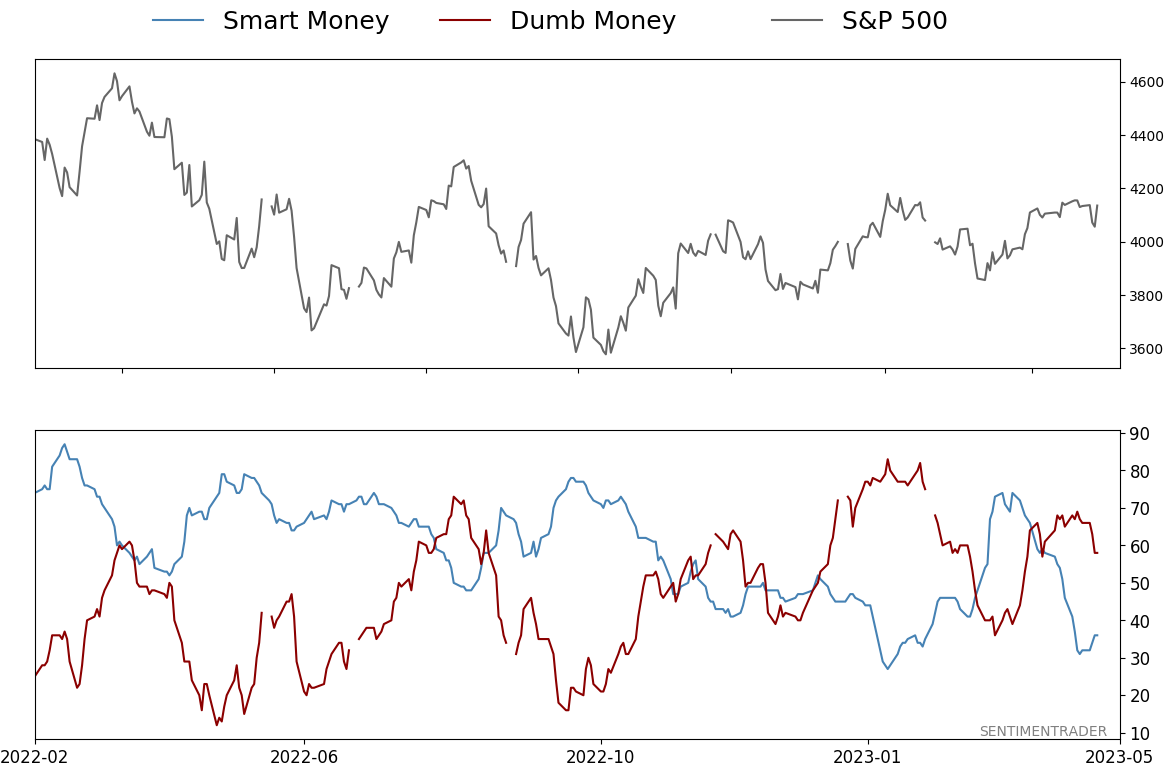
Smart / Dumb Money Confidence
|
Smart Money Confidence: 36%
Dumb Money Confidence: 58%
|
|
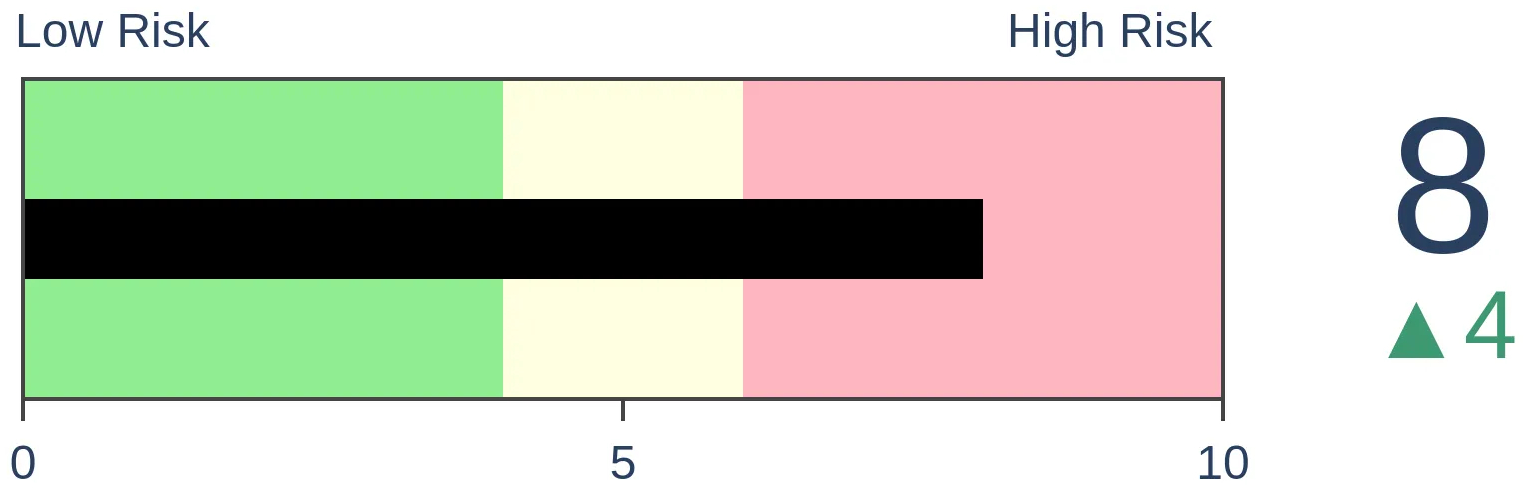
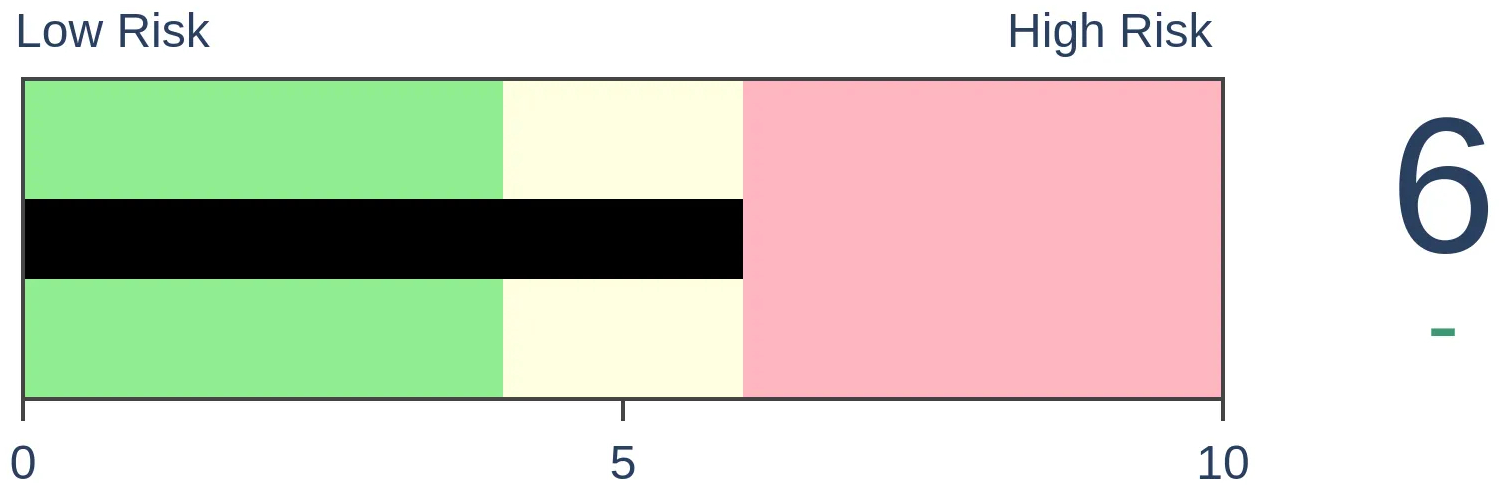
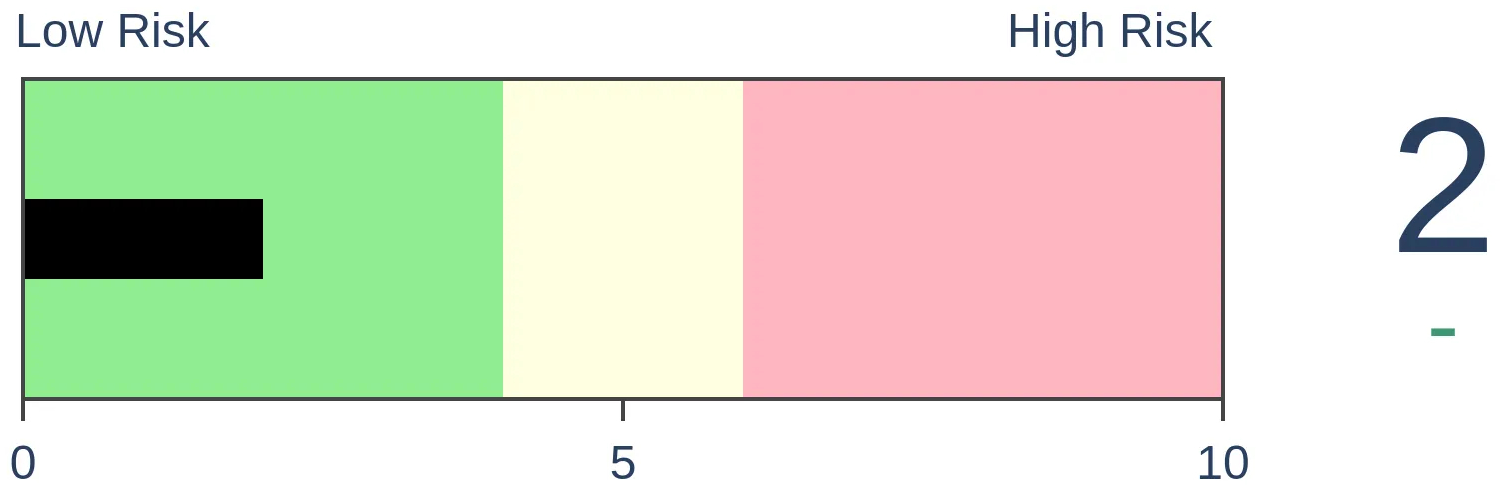
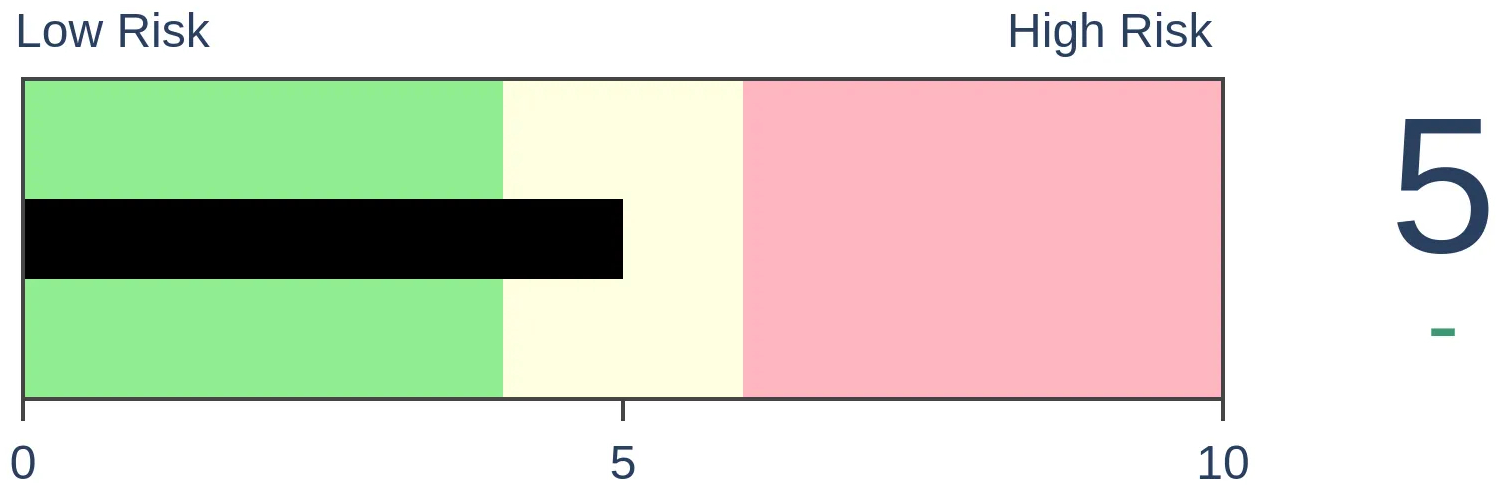
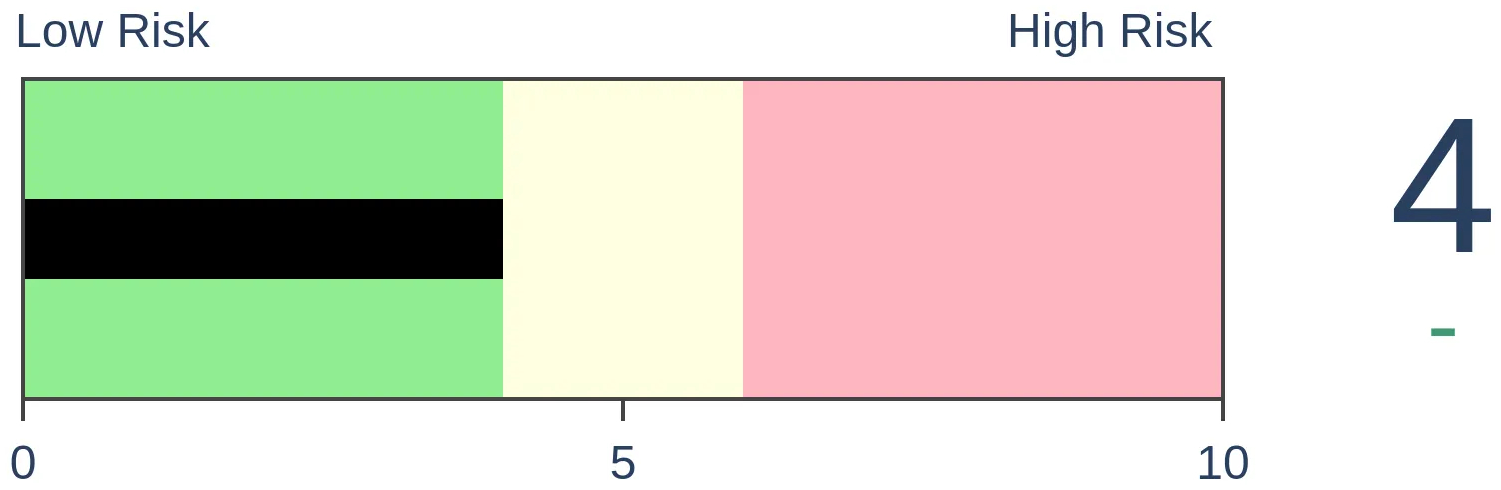
Risk Levels
Stocks Short-Term
|
Stocks Medium-Term
|
|
Bonds
|
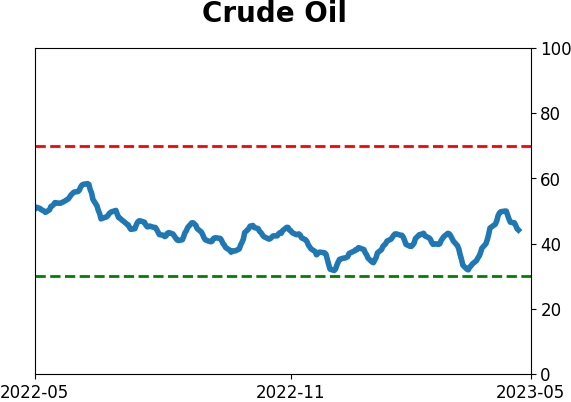
Crude Oil
|
|
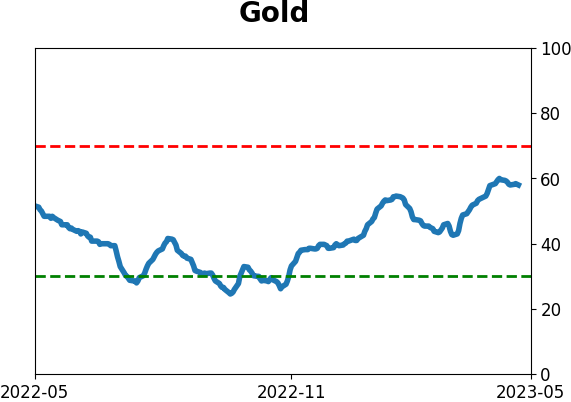
Gold
|
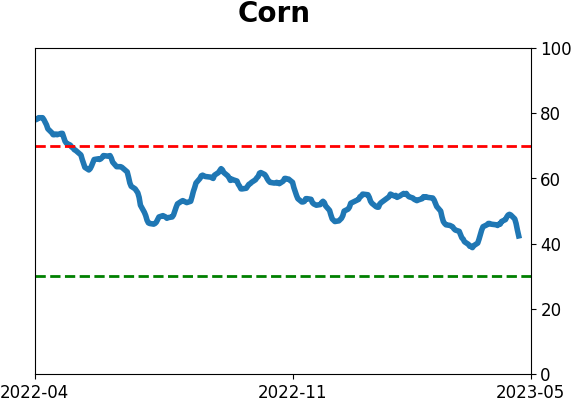
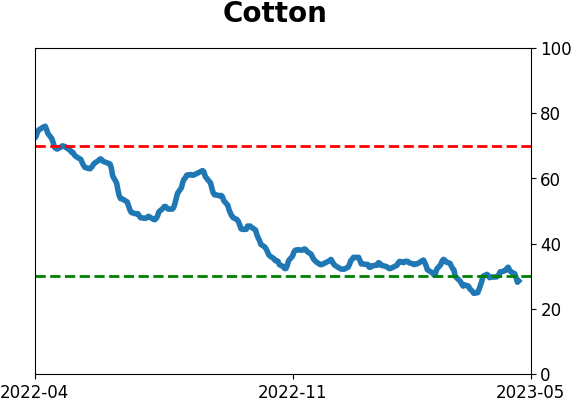
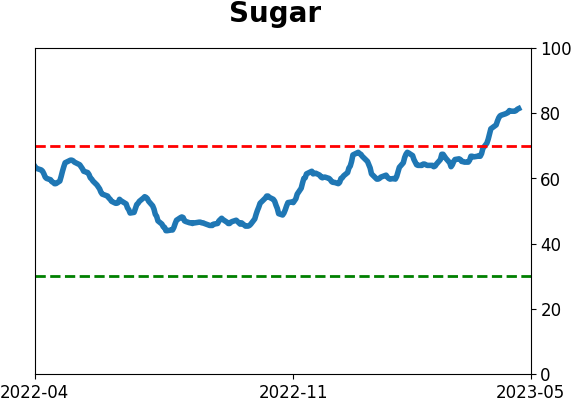
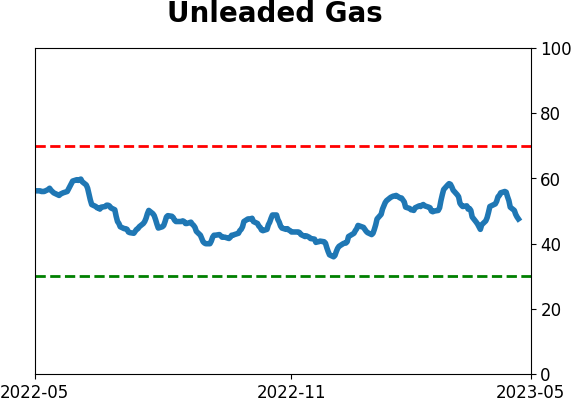
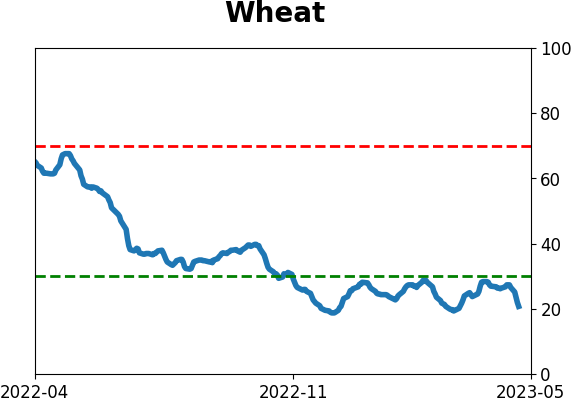
Agriculture

|
|
Research
By Jay Kaeppel
BOTTOM LINE
One of the keys to investment success is allocating capital when and where the probability of success is greatest and avoiding the opposite. This piece highlights three sectors that tend to show weakness as spring unfolds.
FORECAST / TIMEFRAME
None
|
Key points
- Seasonal trends do not "predict" what will happen, but they can be useful in helping to decide where best to allocate capital
- Specific sectors tend to show weakness during early to mid spring
- Biotech, home builders, and emerging markets fit this category
Biotech (ticker IBB)
The chart below displays the annual seasonal trend for iShares Biotechnology ETF (ticker IBB). The period from Trading Day of Year (TDY) #80 through TDY #113 is highlighted in the red box.
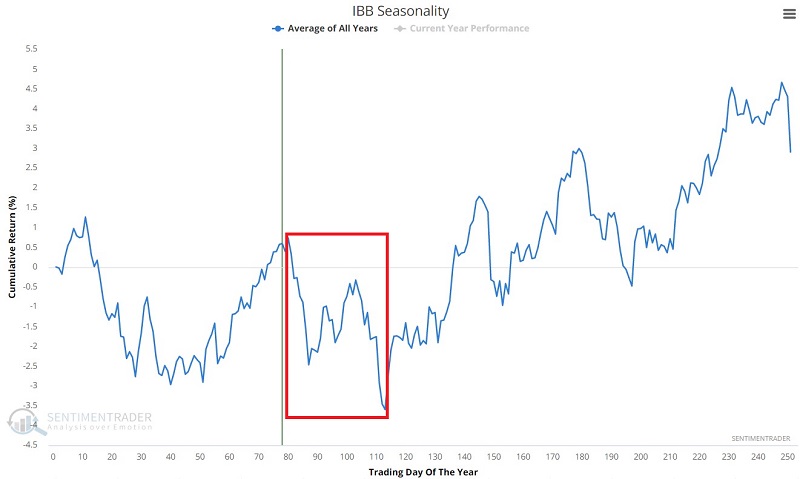
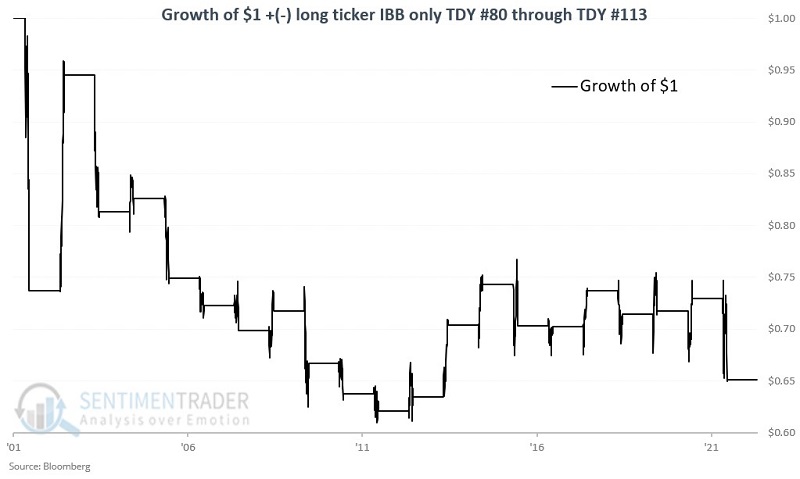
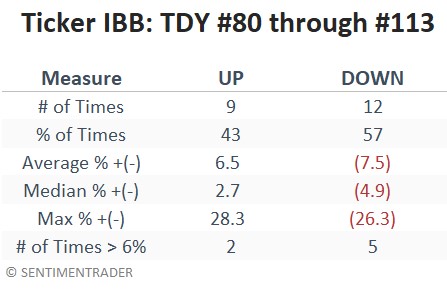
For 2023, this period extends from the close on 2023-04-27 through 2023-06-14. The chart below displays the growth of $1 invested in ticker IBB only during the TDY #80 through TDY #113 period since 2002. The table summarizes IBB's performance.
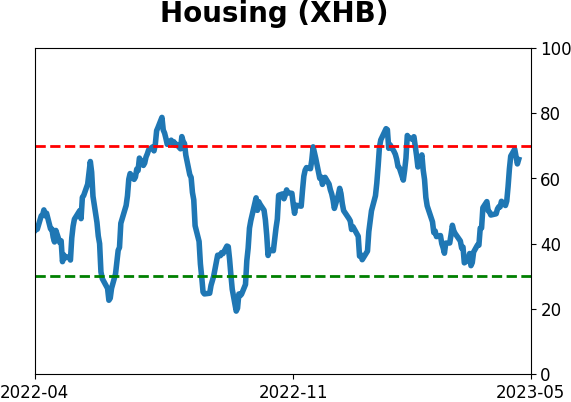
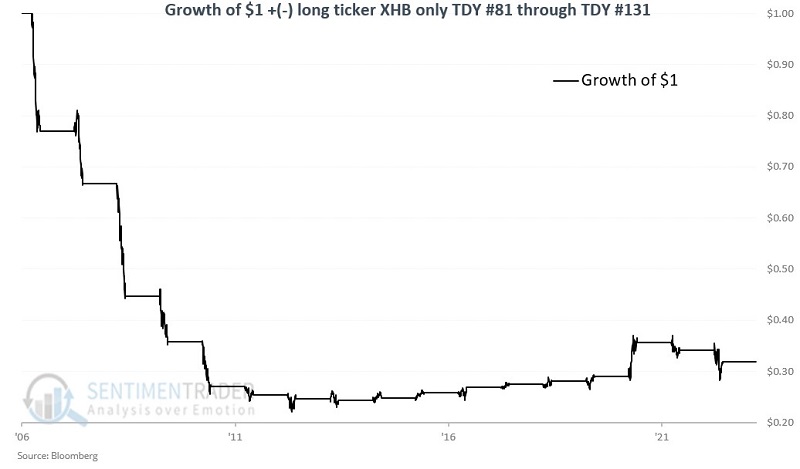
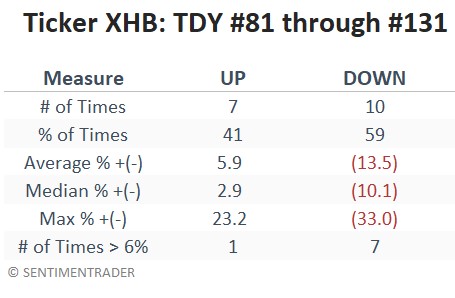
Home Builders (ticker XHB)
The chart below displays the annual seasonal trend for SPDR S&P Homebuilders ETF (ticker XHB). The period from Trading Day of Year (TDY) #81 through TDY #131 is highlighted in the red box.
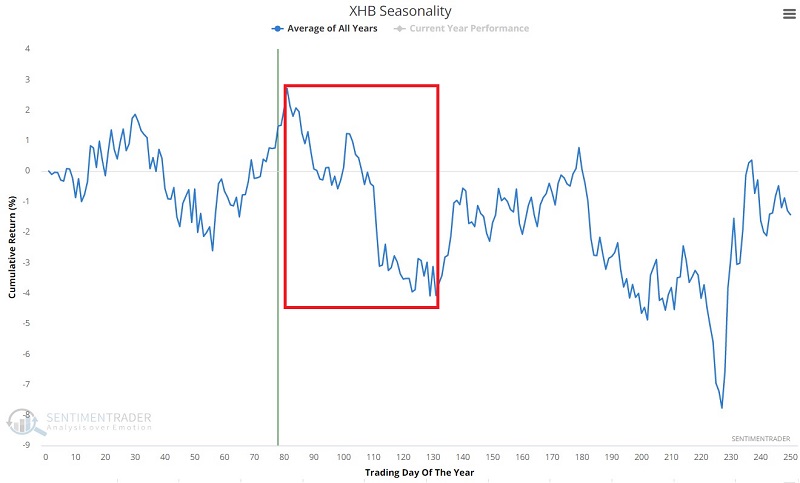
For 2023, this period extends from the close on 2023-04-28 through 2023-07-11. The chart below displays the growth of $1 invested in ticker XHB only during the TDY #81 through TDY #131 period since 2006. The table summarizes XHB's performance.
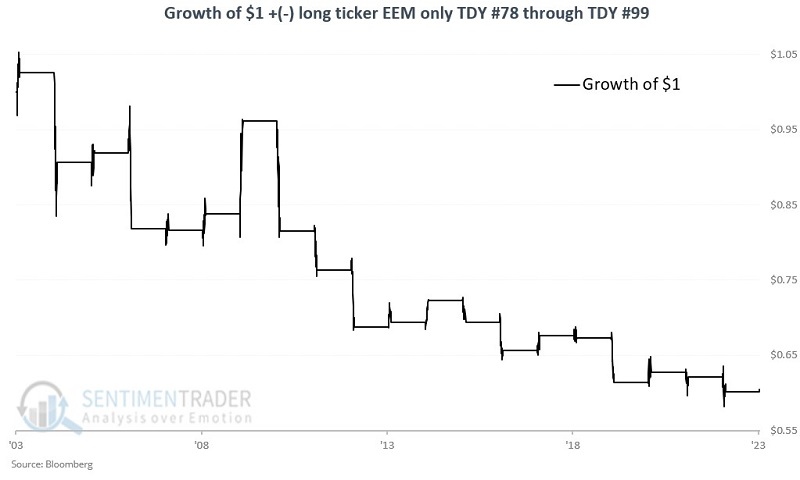
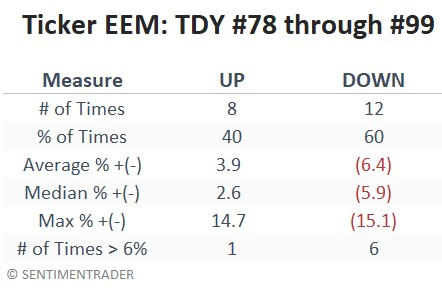
Emerging Markets (ticker EEM)
The chart below displays the annual seasonal trend for iShares MSCI Emerging Markets ETF (ticker EEM). The period from Trading Day of Year (TDY) #78 through TDY #99 is highlighted in the red box.
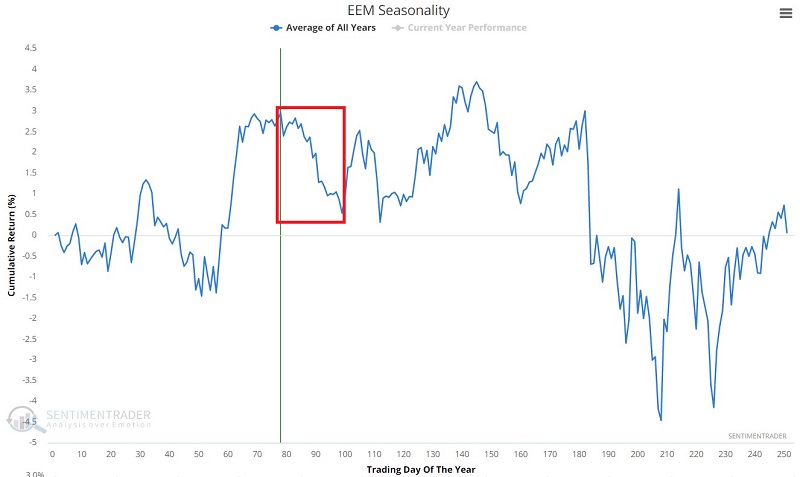
For 2023, this period extends from the close on 2023-04-25 through 2023-05-24. The chart below displays the growth of $1 invested in ticker EEM only during the TDY #78 through TDY #99 period since 2003. The table summarizes EEM performance.
What the research tells us…
None of the sectors highlighted above have performed uniformly bearish every year during the spring period. However, they all showed gains less than 50% of the time, and in each case, the down years performed overall much worse than the up years. The real question for investors is not, "Will these seasonal trends play out unfavorably in 2023?" The real question for investors is, "Are these good places to allocate capital right now?"
Indicators at Extremes
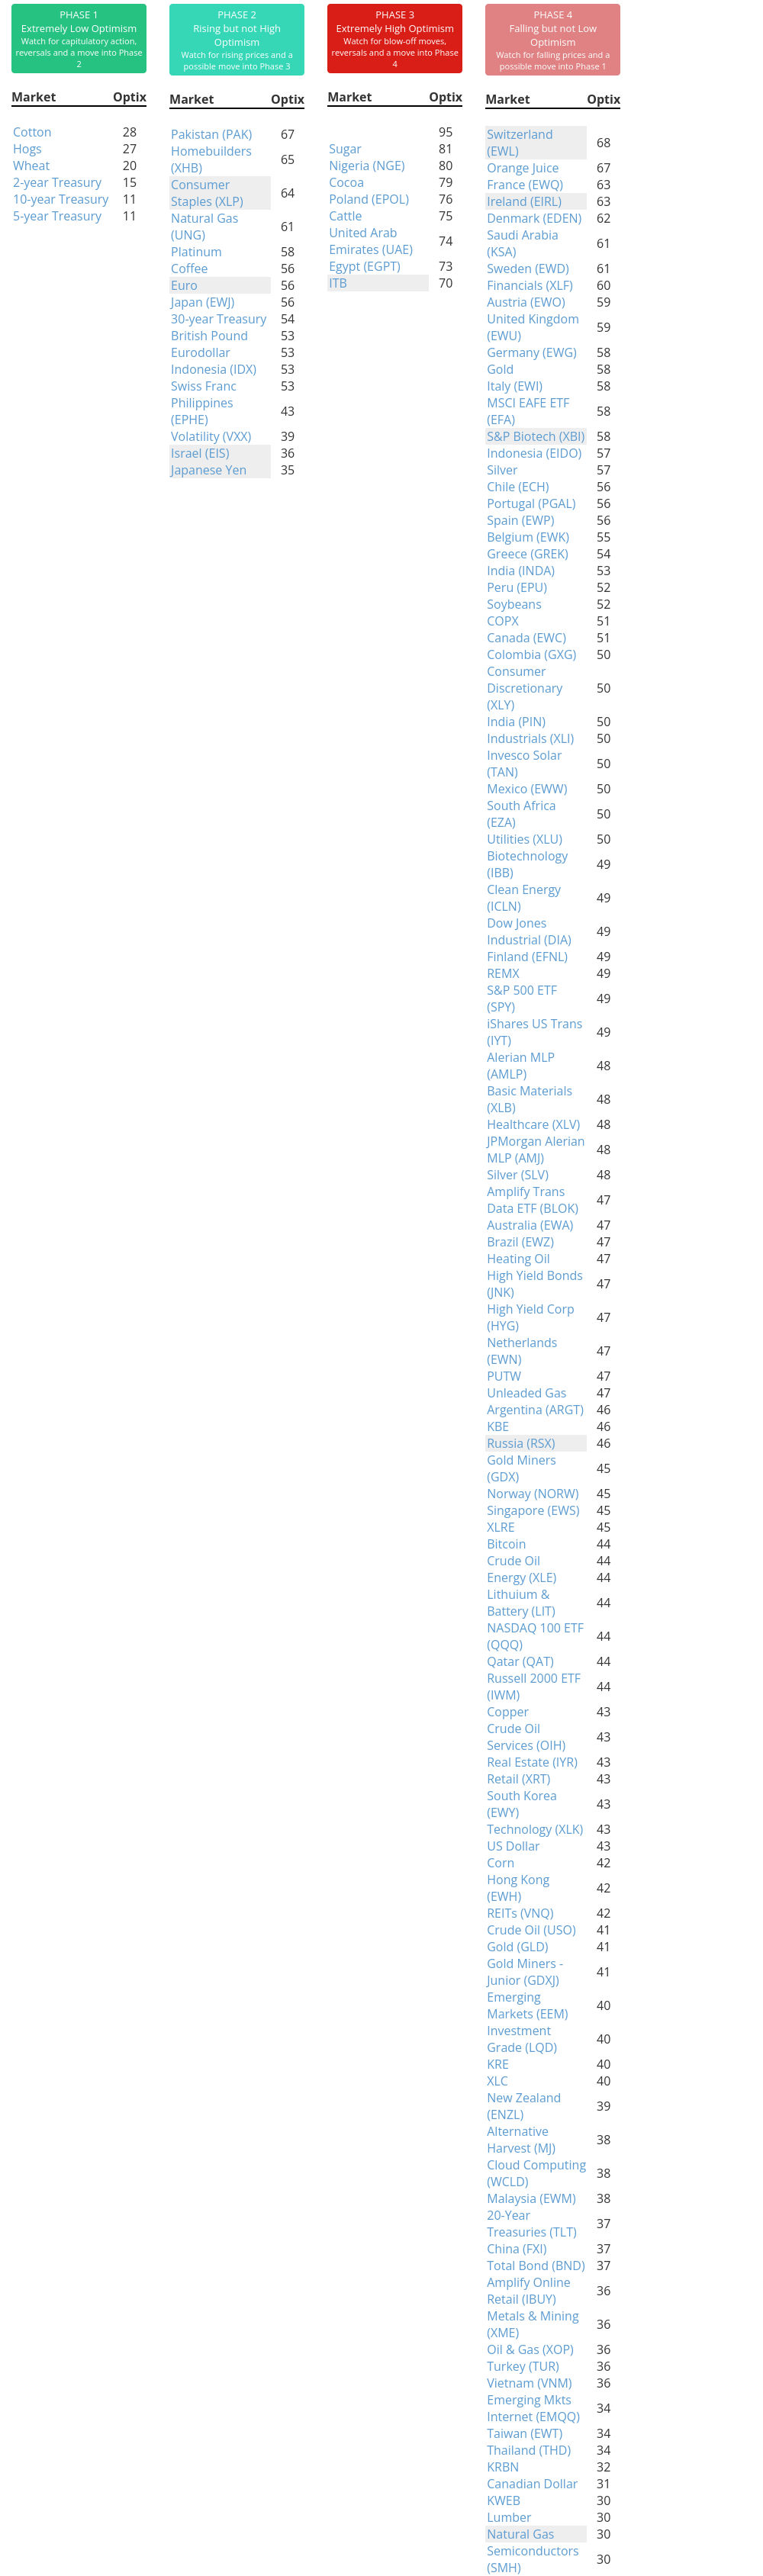
Phase Table
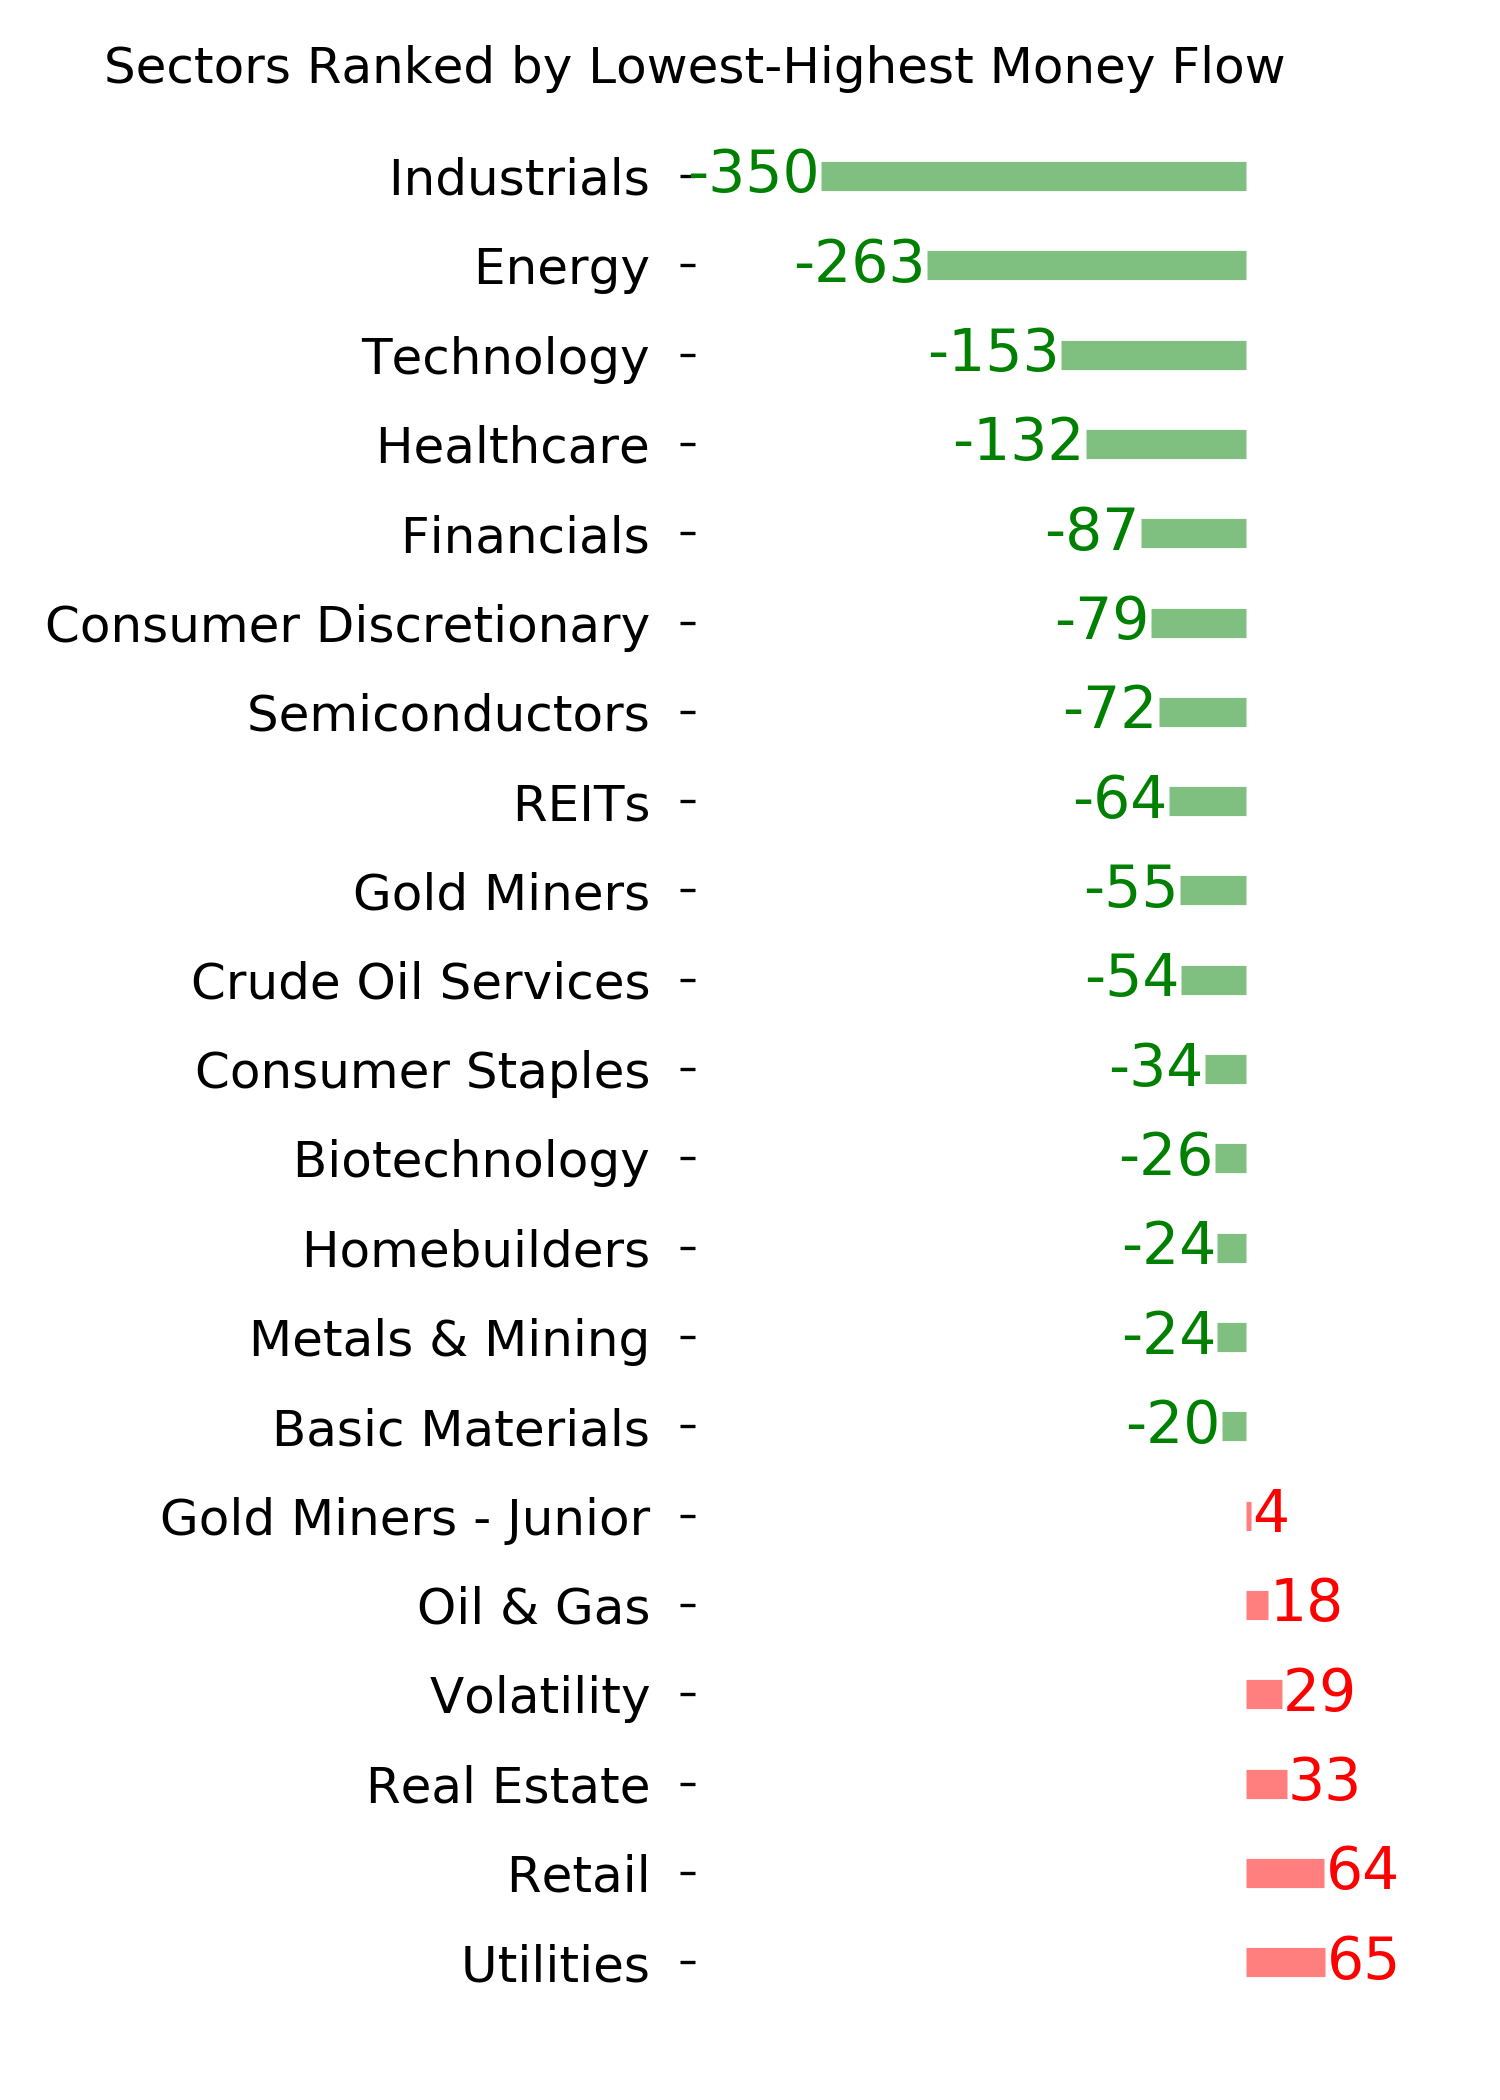
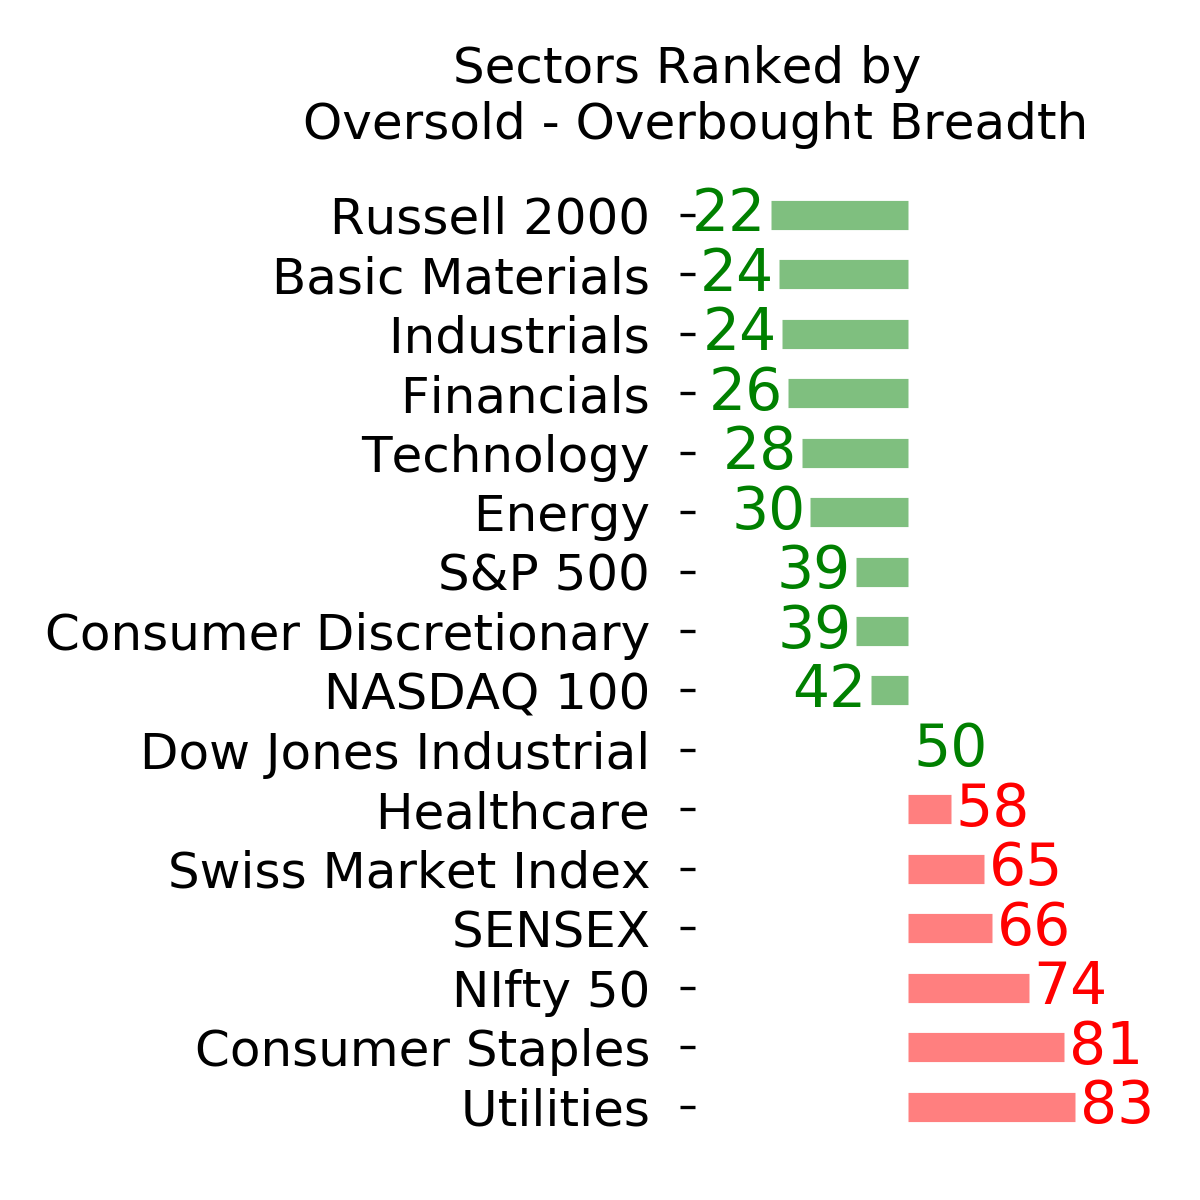
Ranks
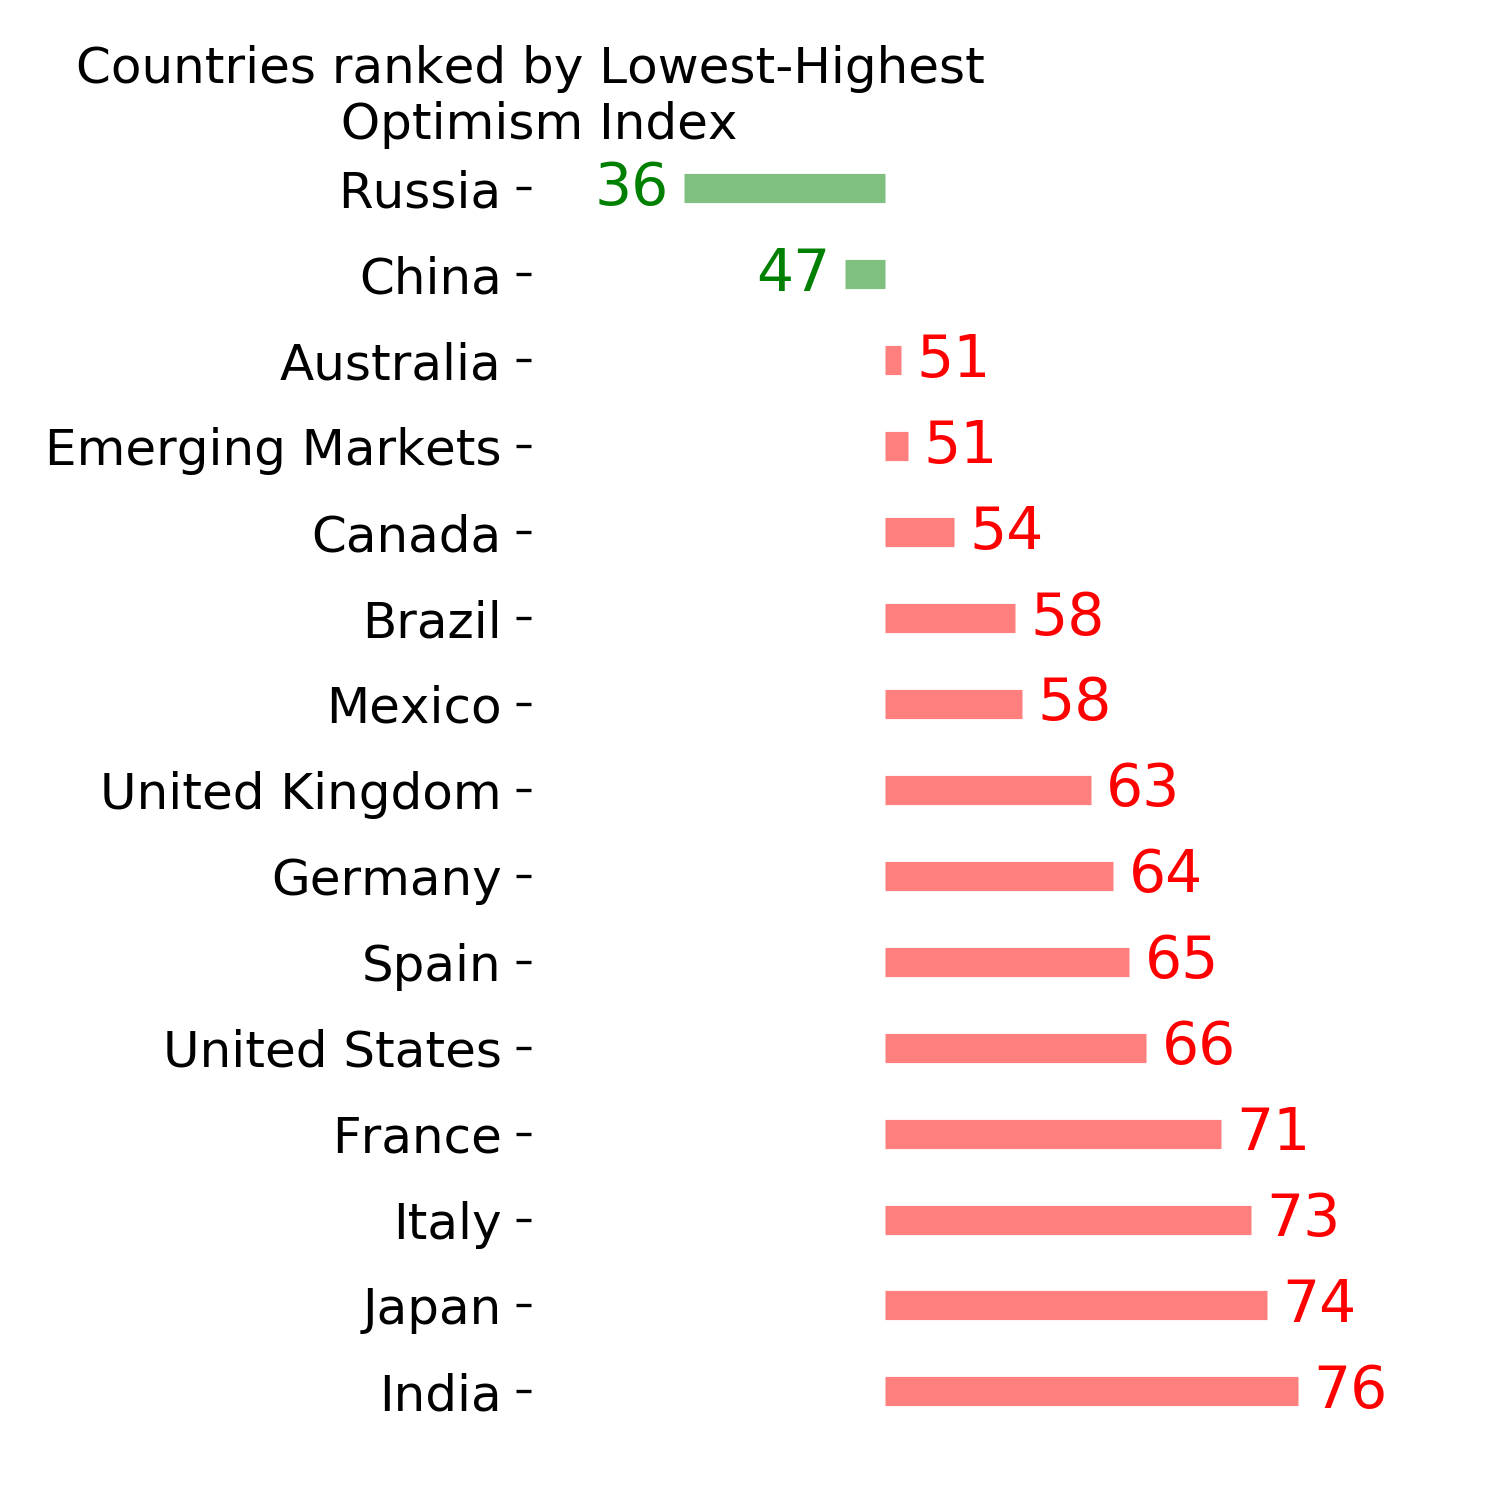
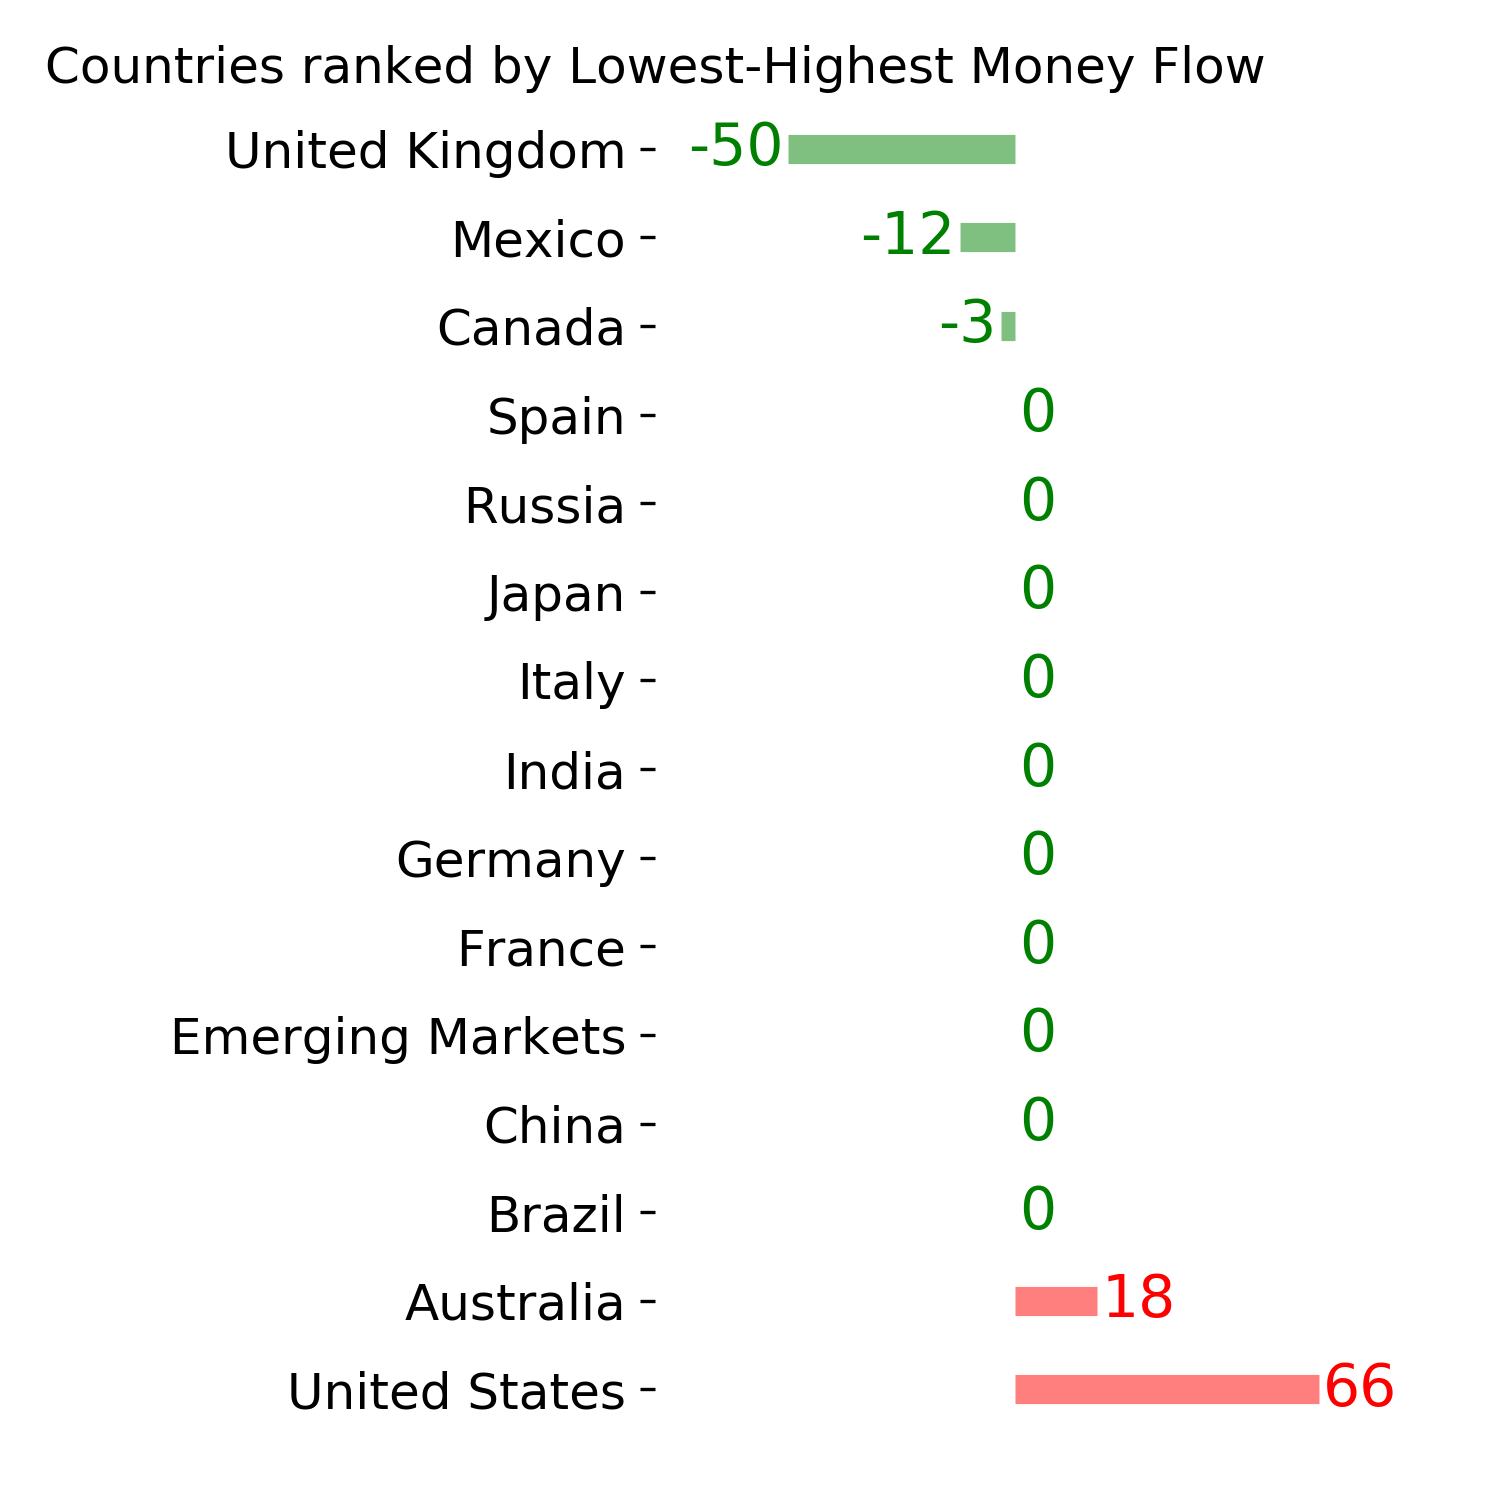
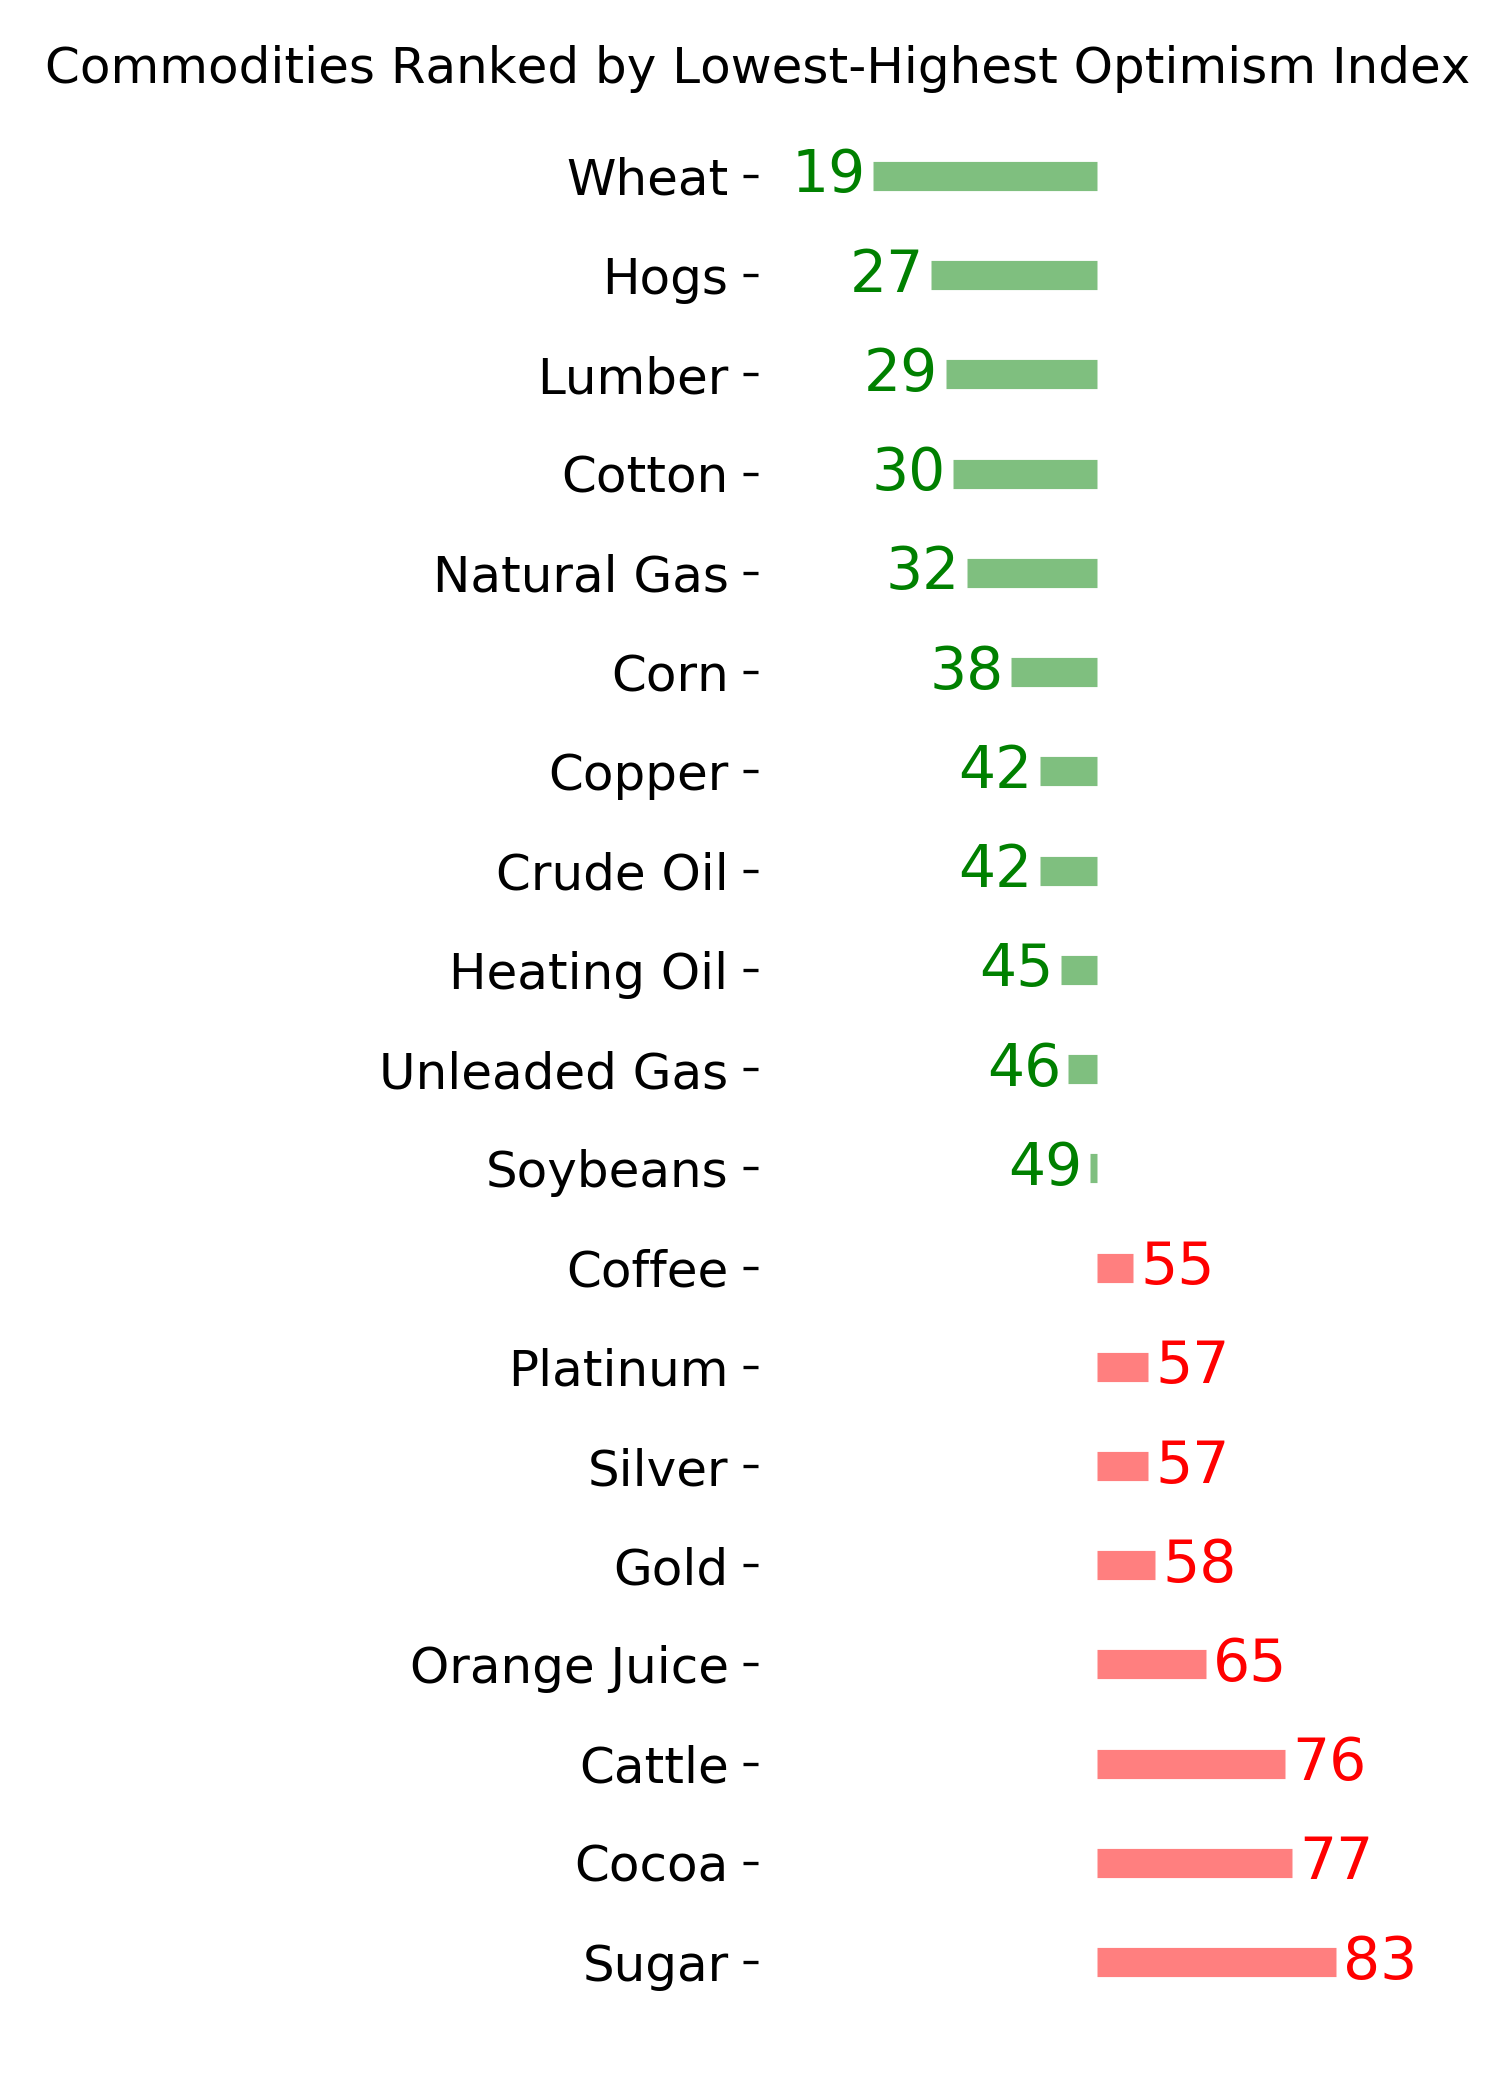
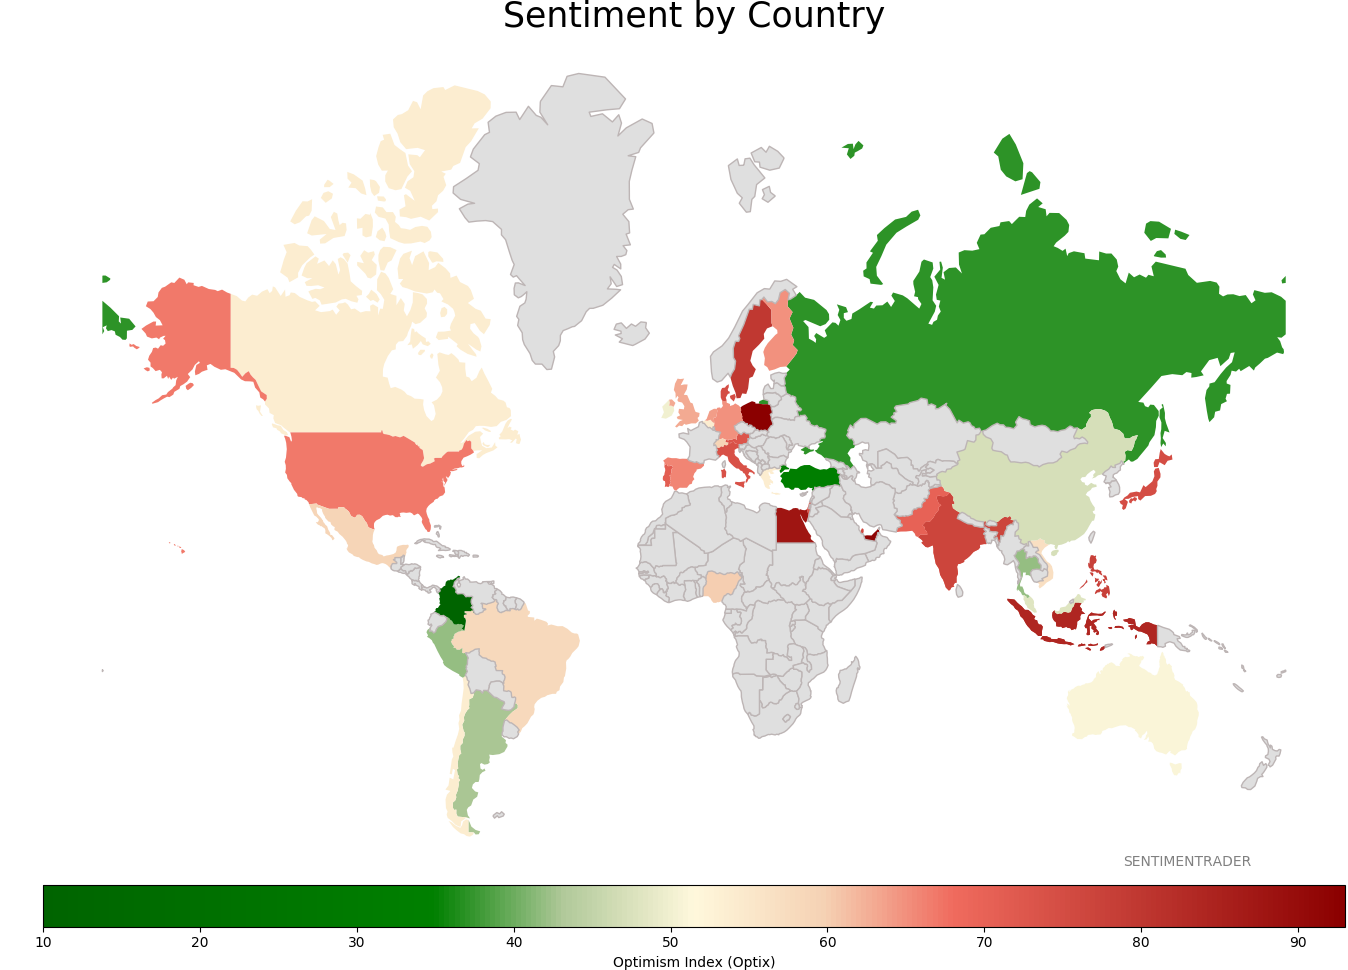
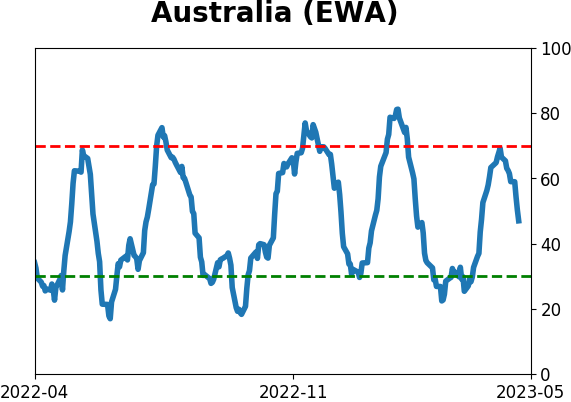
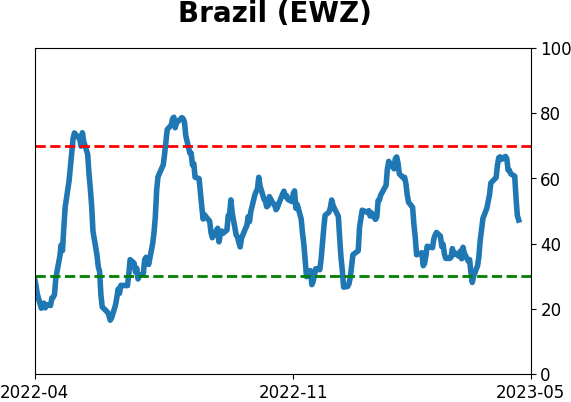
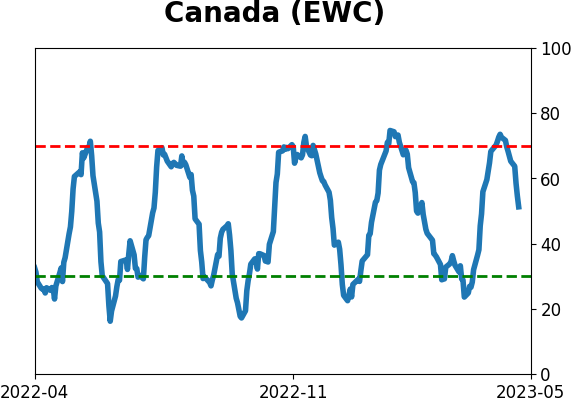
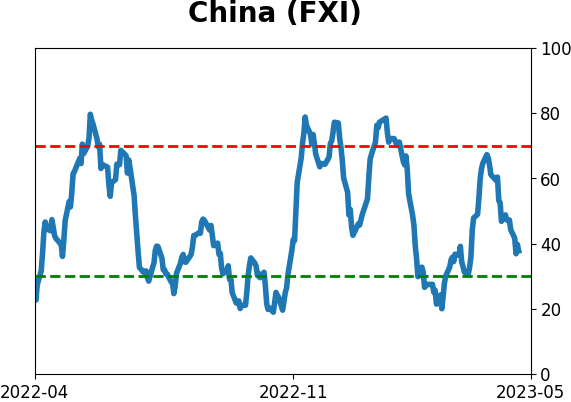
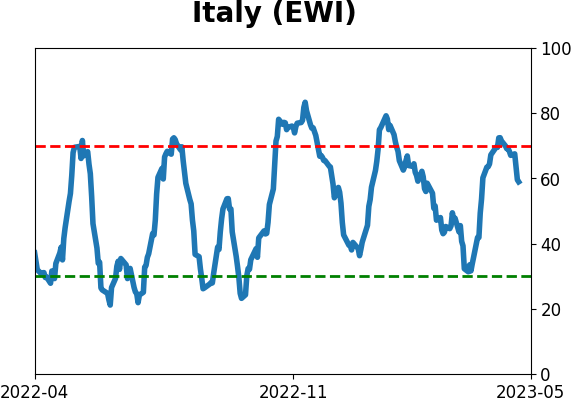
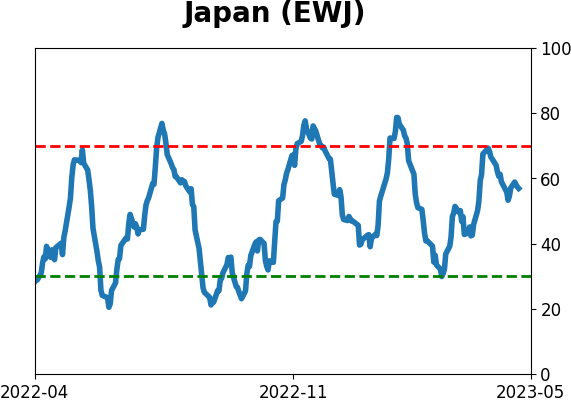
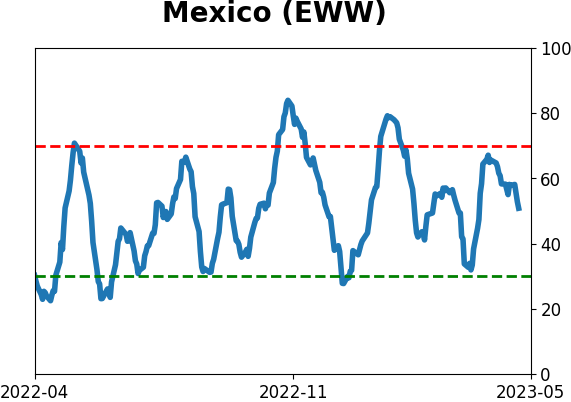
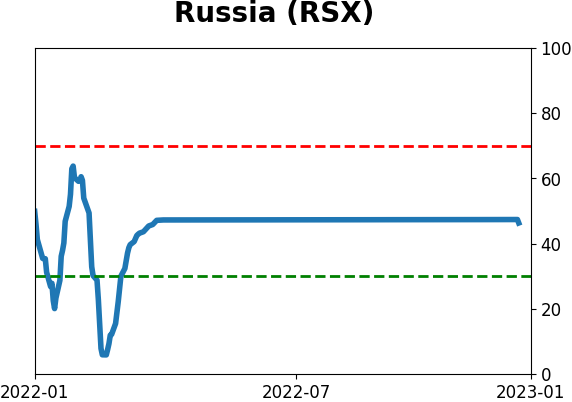
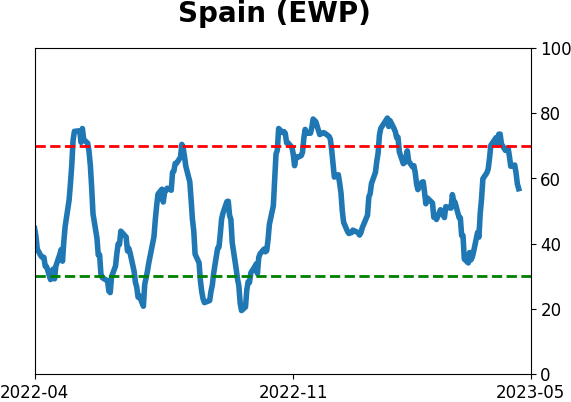
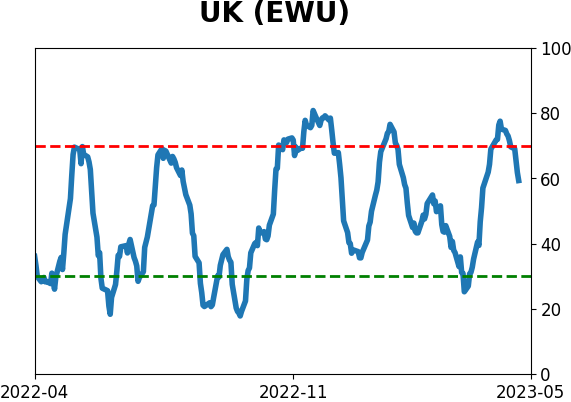
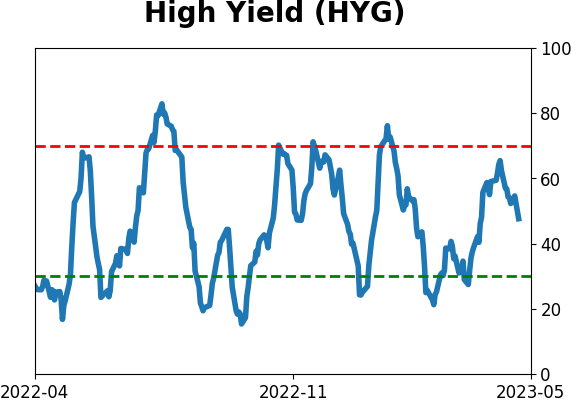
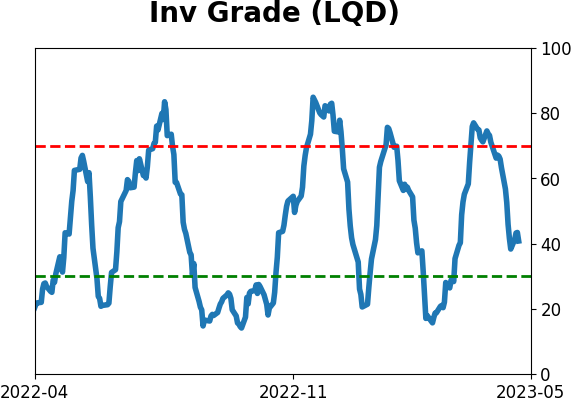
Sentiment Around The World
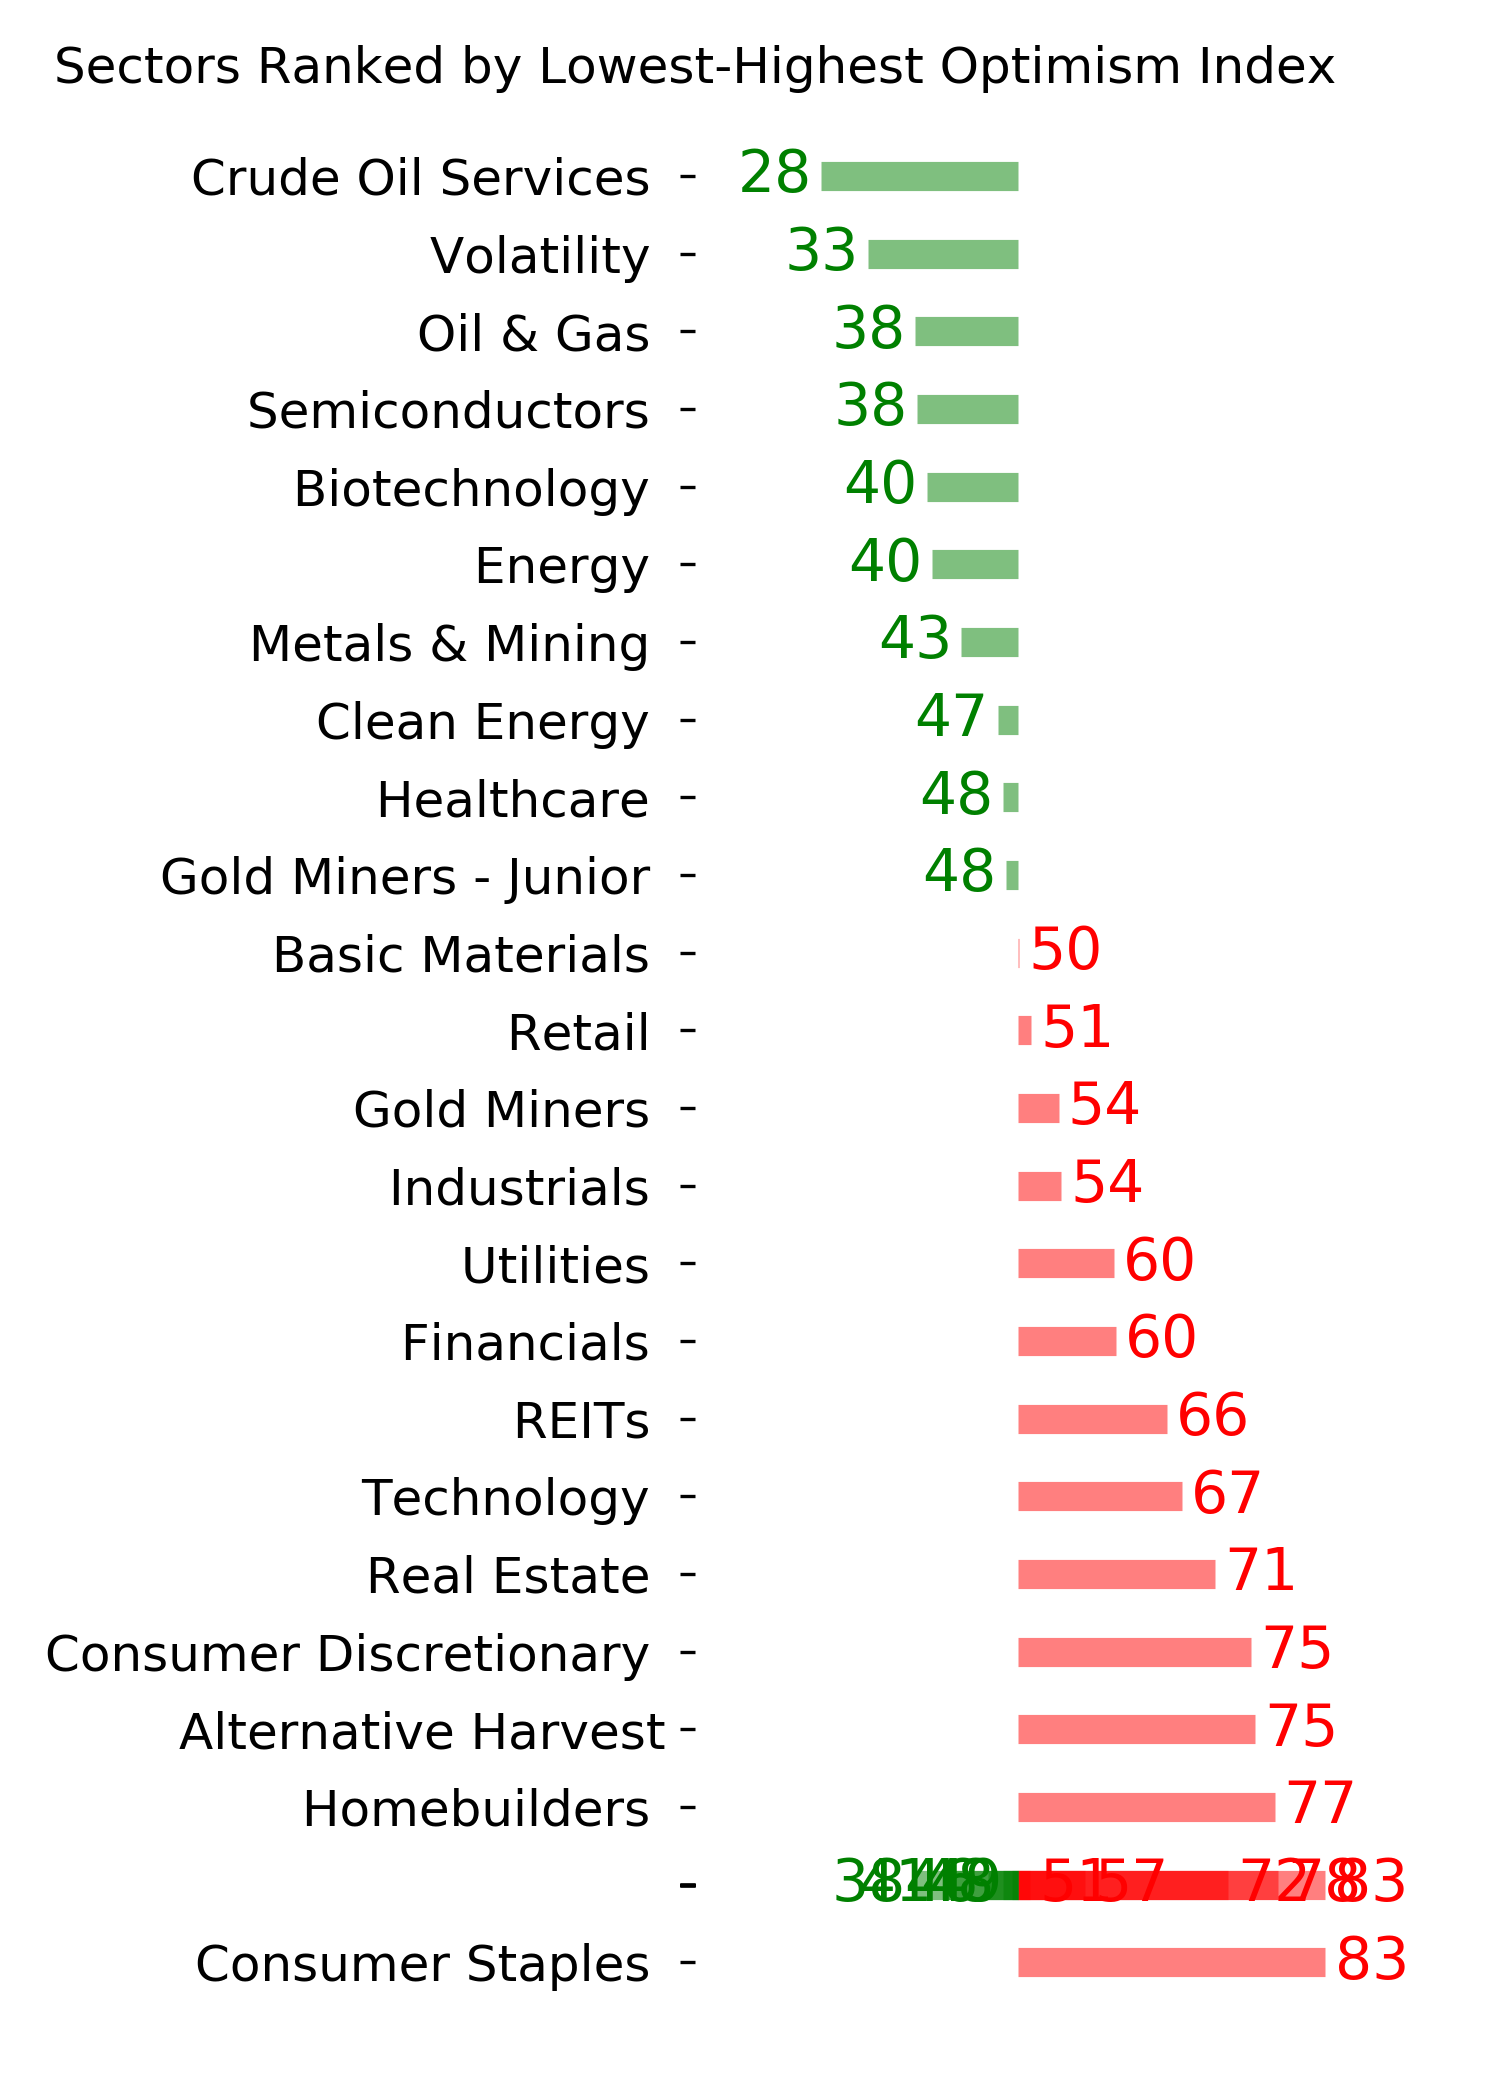
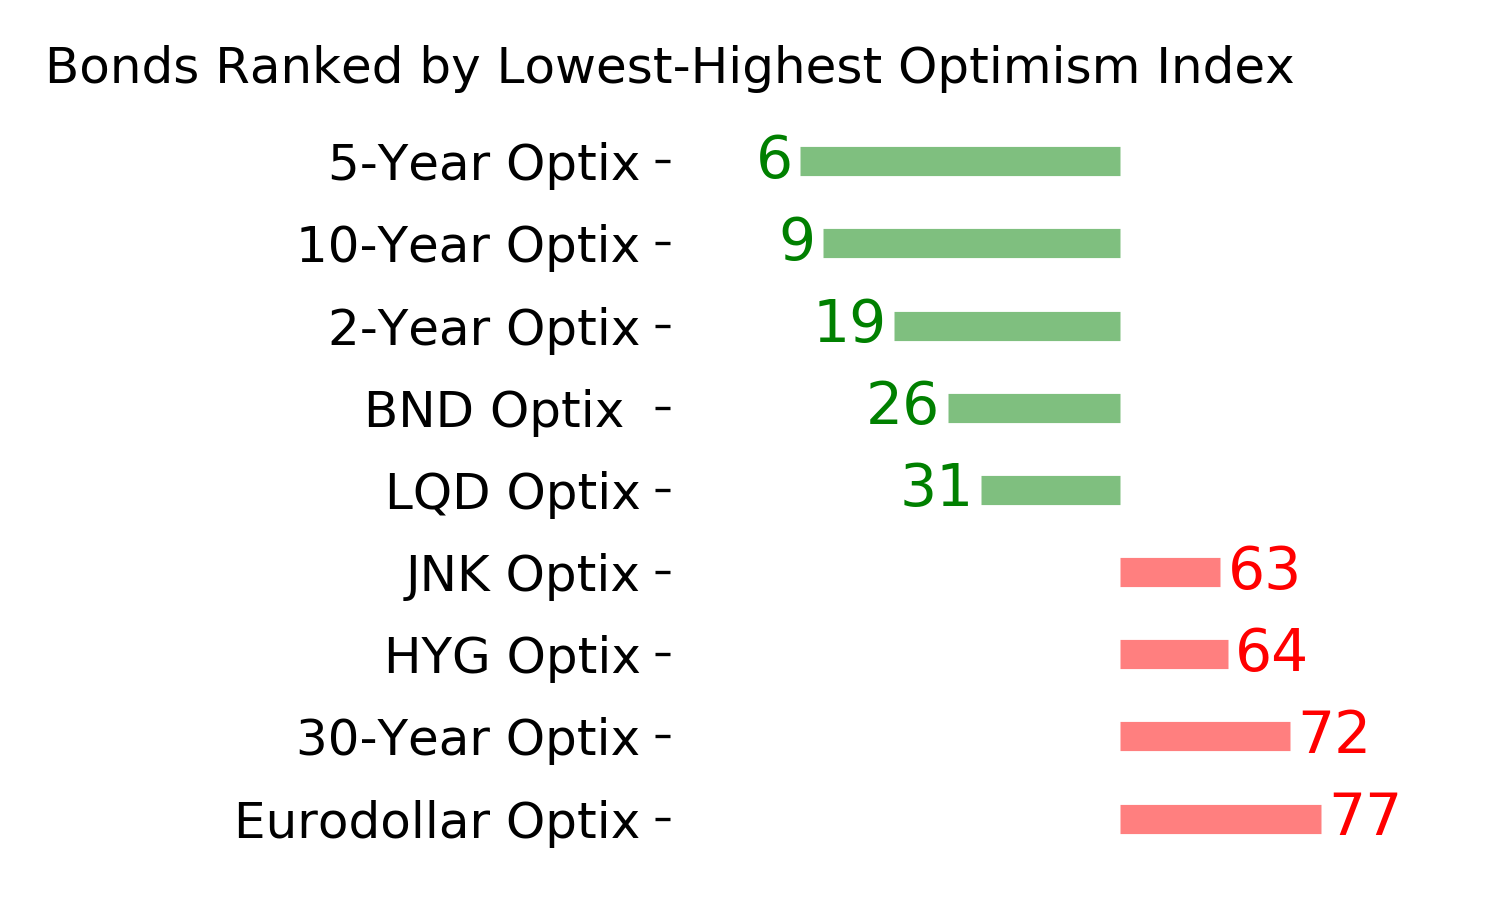
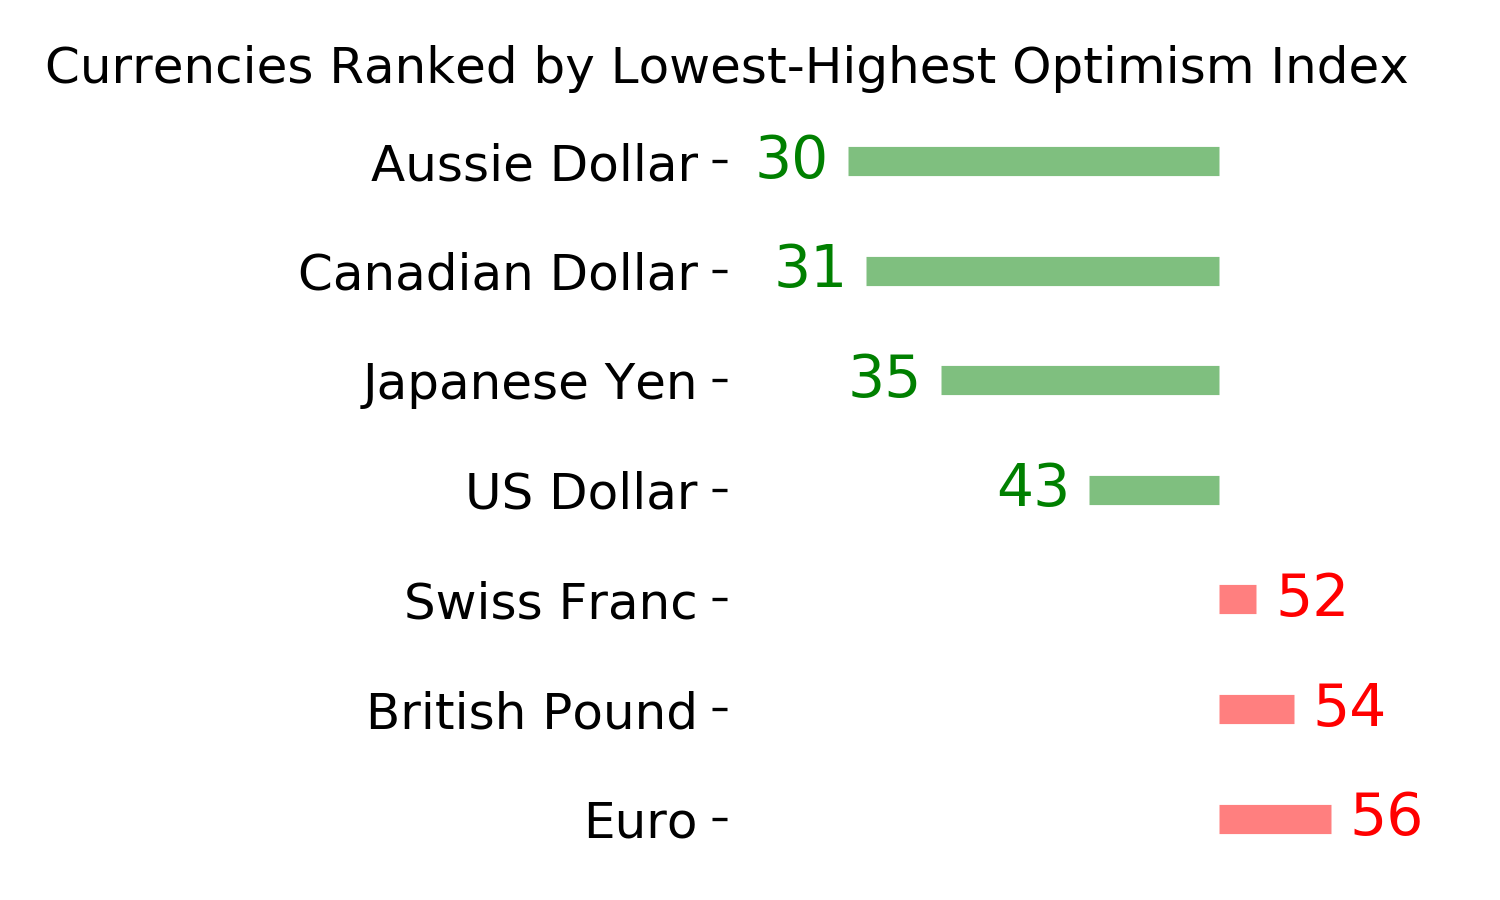
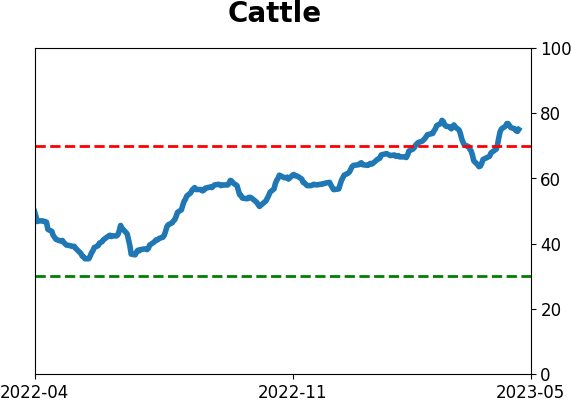
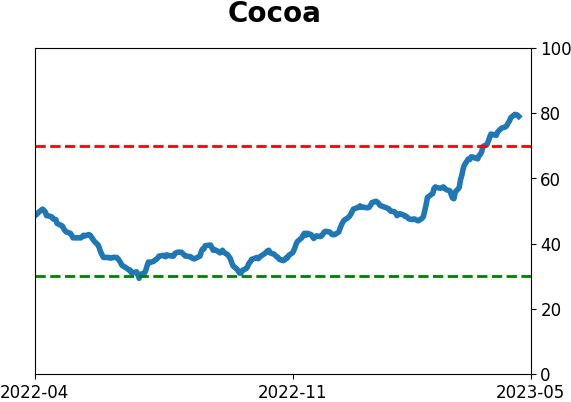
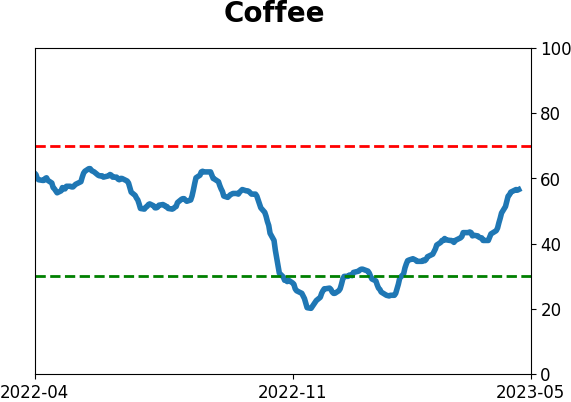
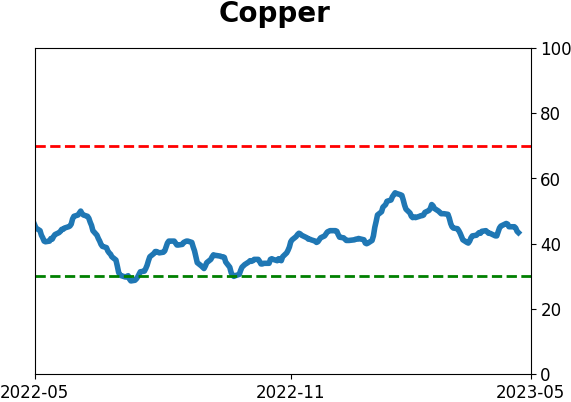
Optimism Index Thumbnails
|
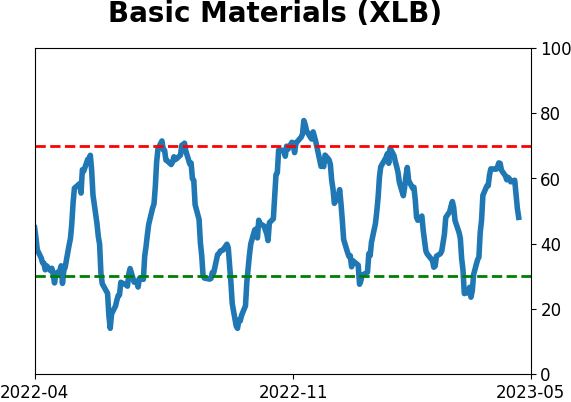
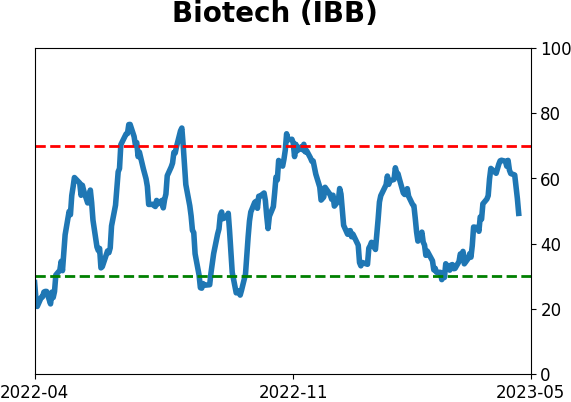
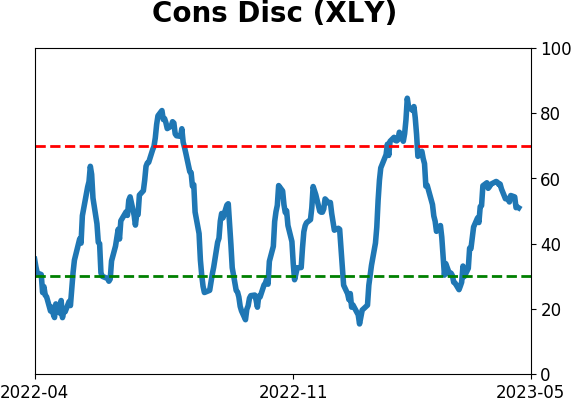
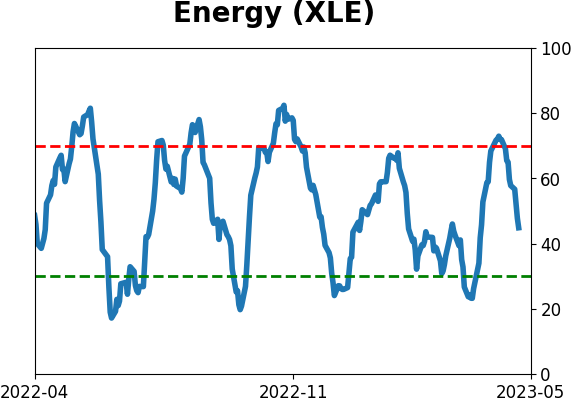
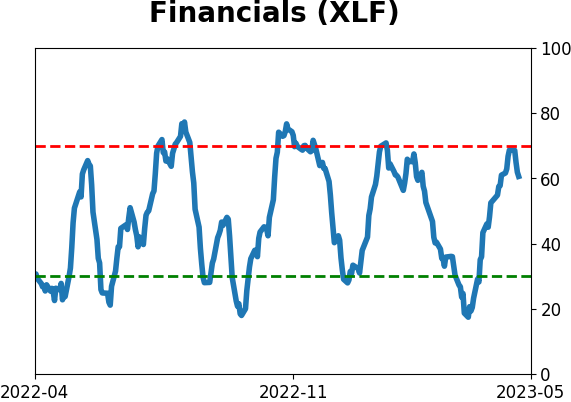
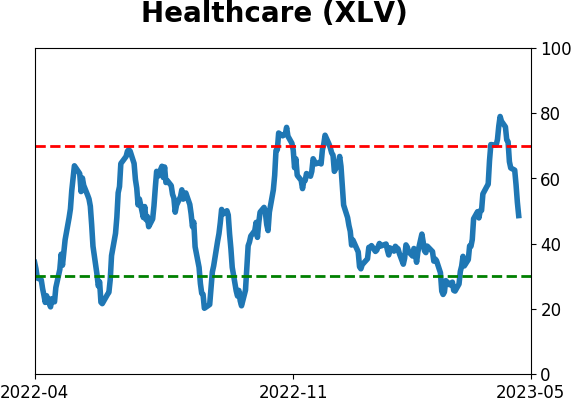
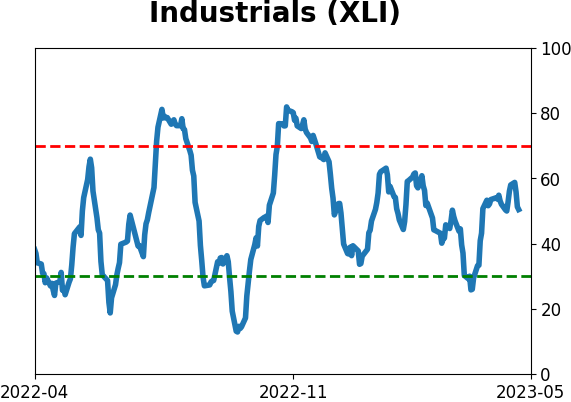
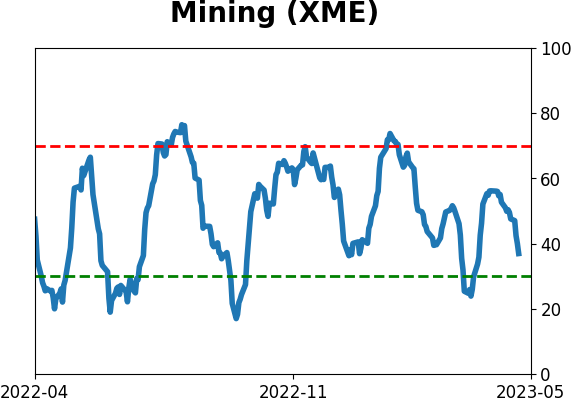
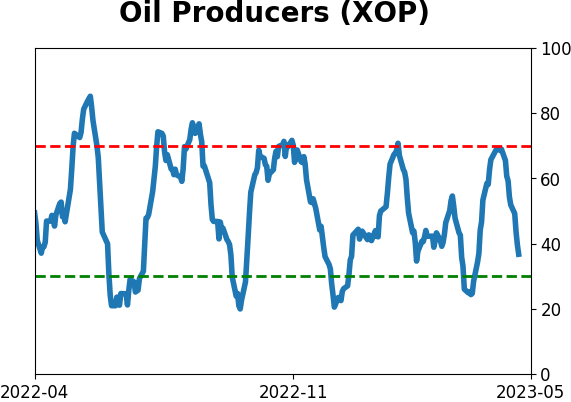
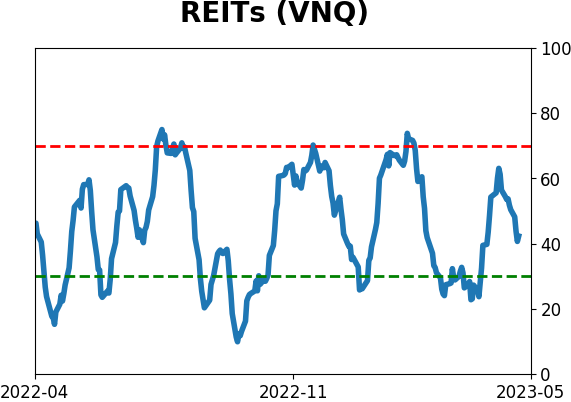
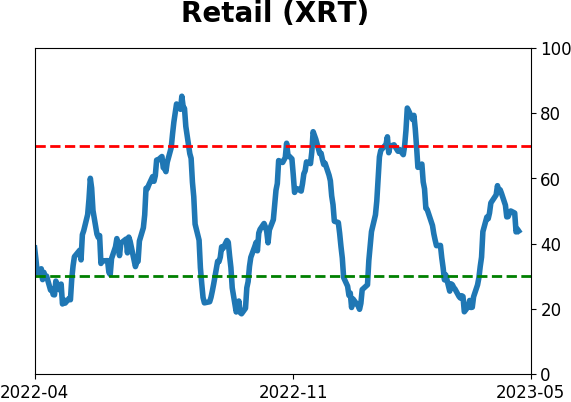
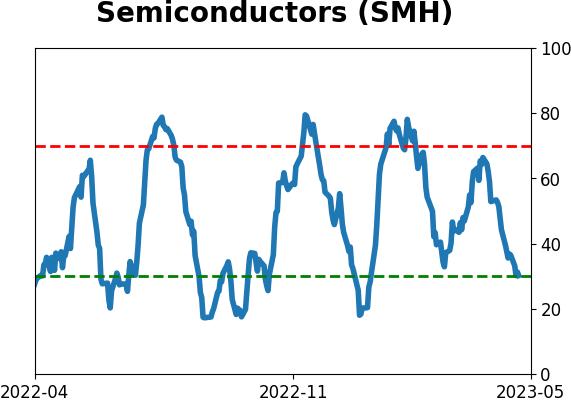
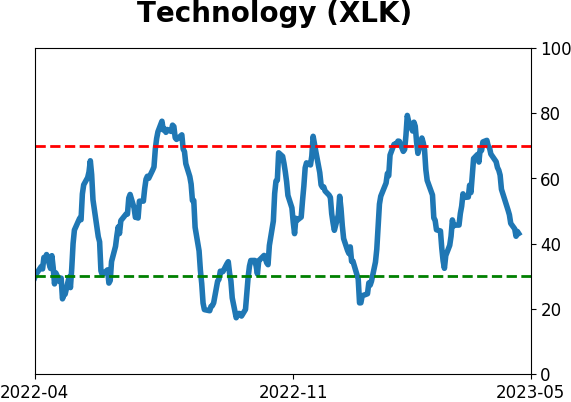
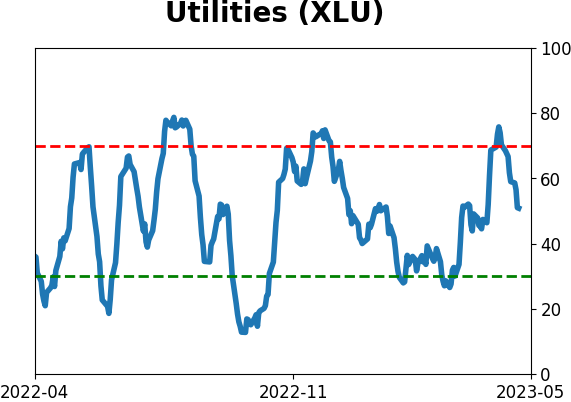
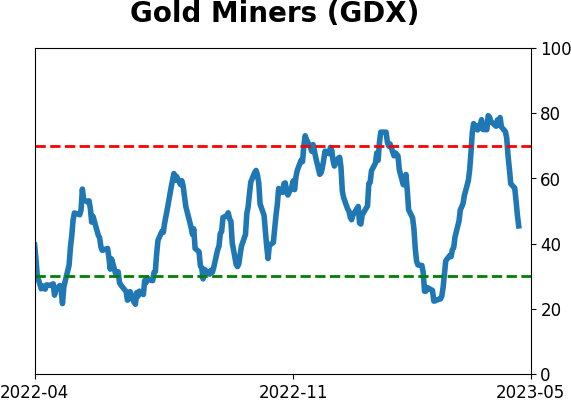
Sector ETF's - 10-Day Moving Average
|
|
|
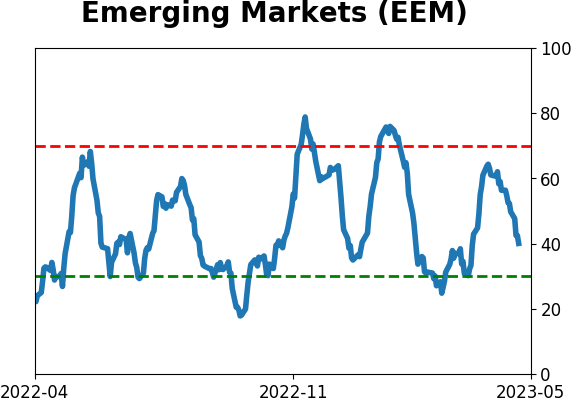
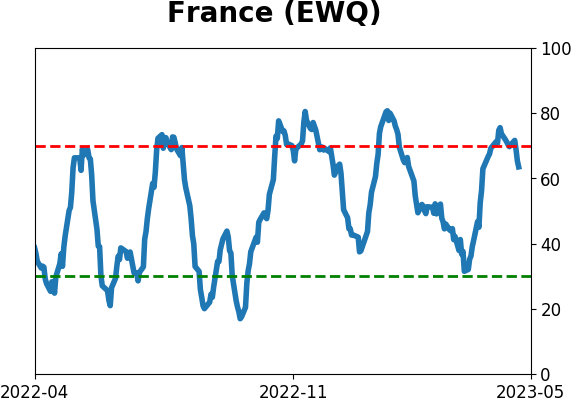
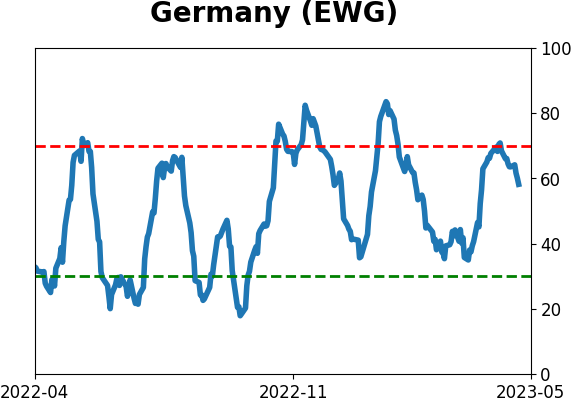
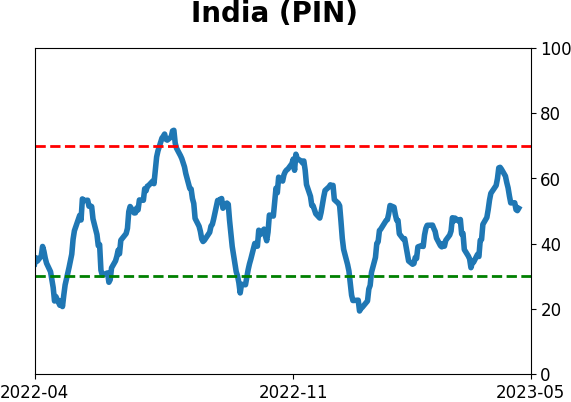
Country ETF's - 10-Day Moving Average
|
|
|
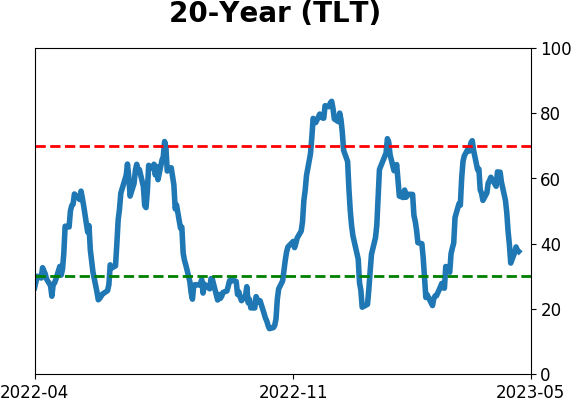
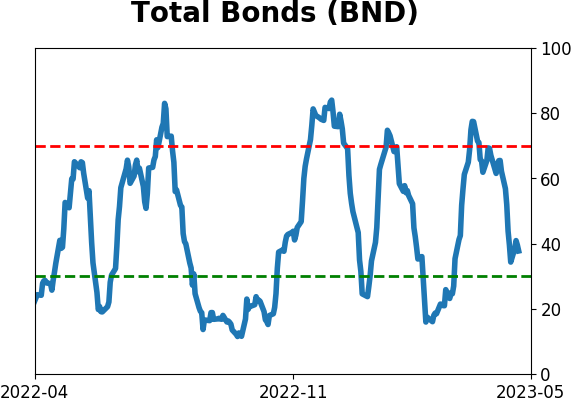
Bond ETF's - 10-Day Moving Average
|
|
|
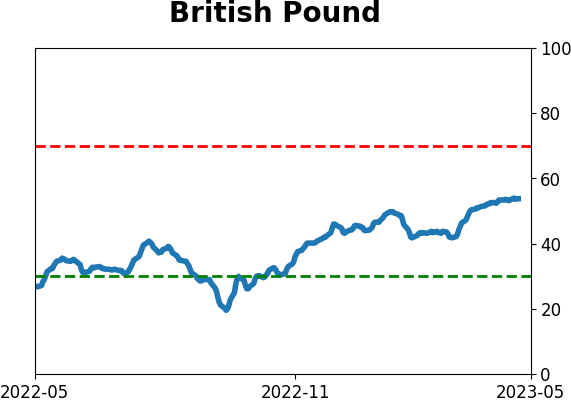
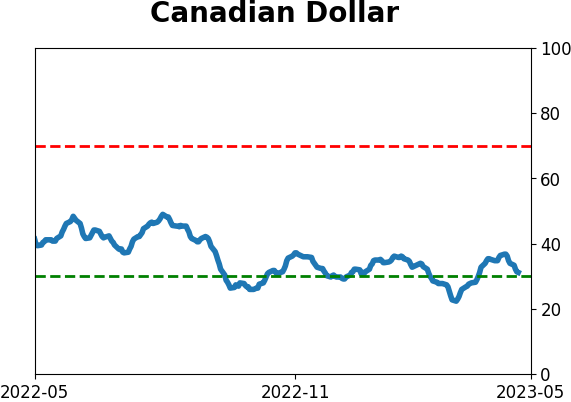
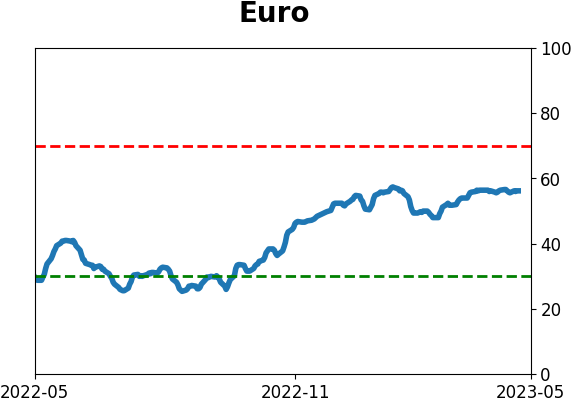
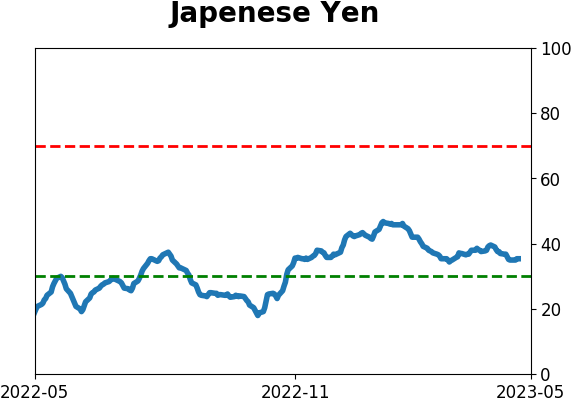
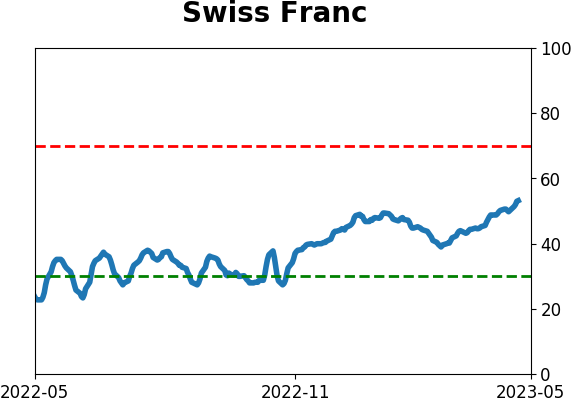
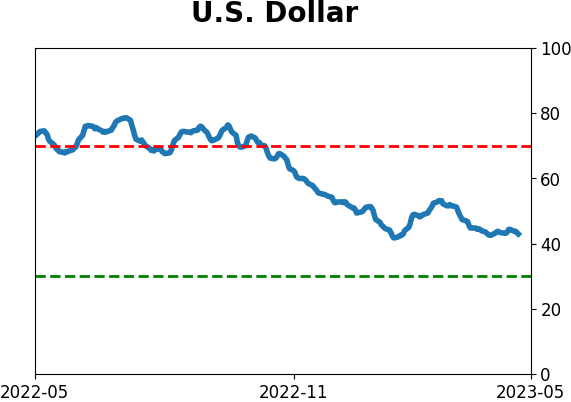
Currency ETF's - 5-Day Moving Average
|
|
|
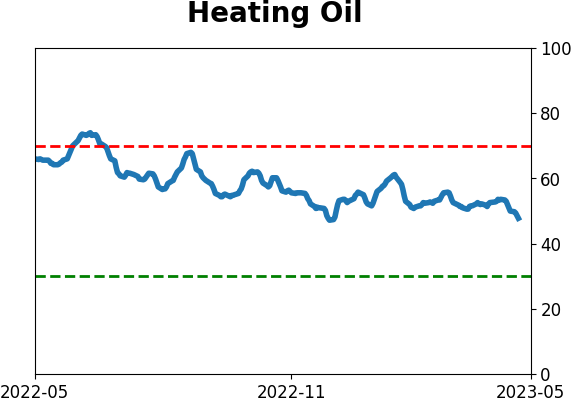
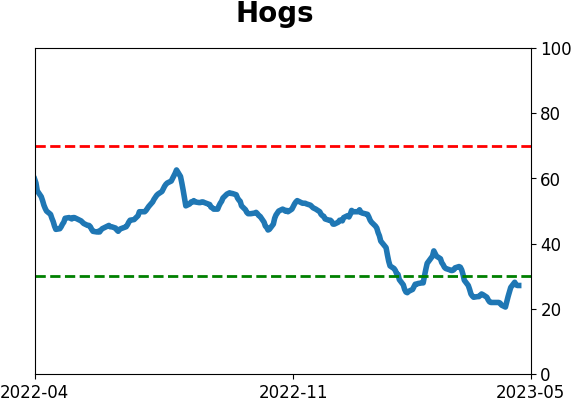
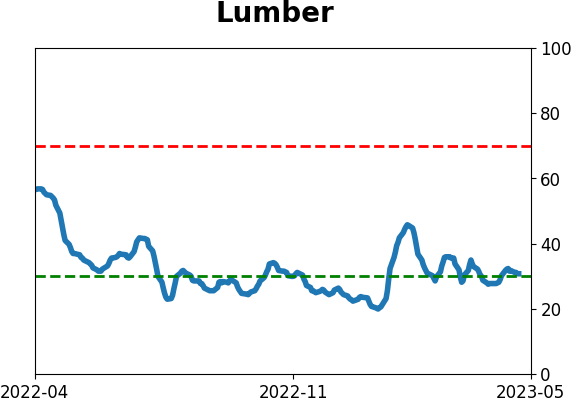
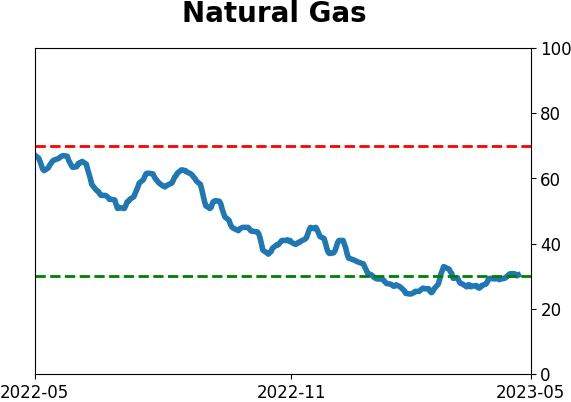
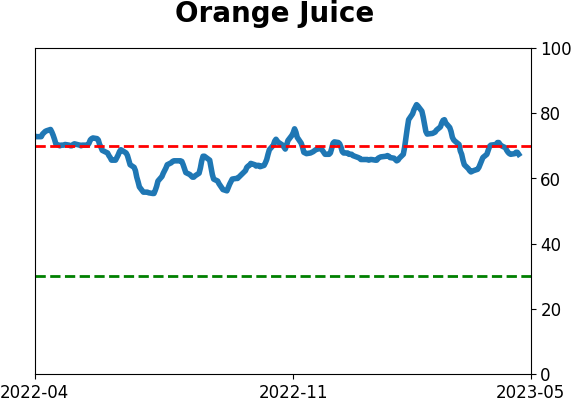
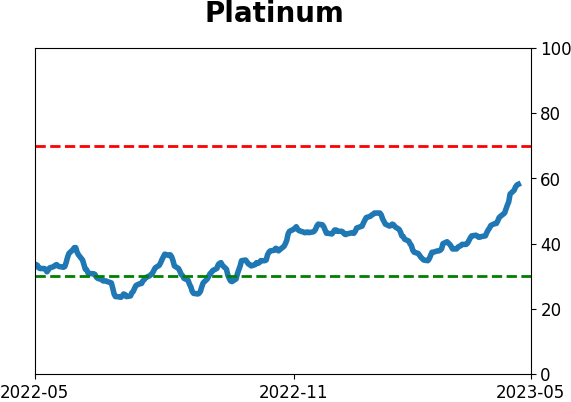
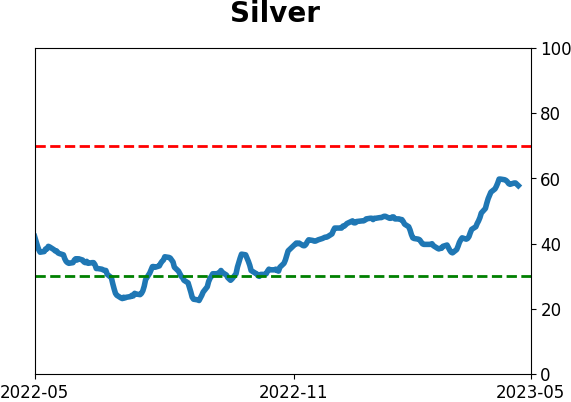
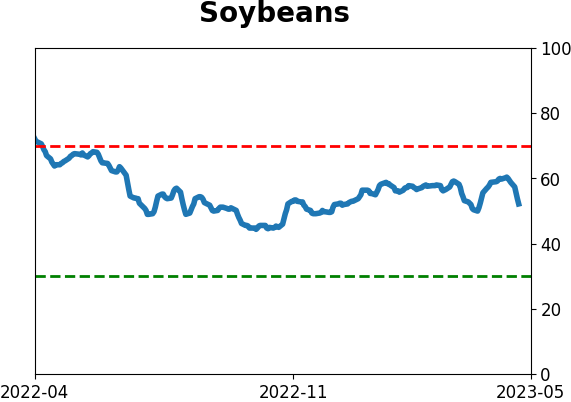
Commodity ETF's - 5-Day Moving Average
|
|