Headlines
|
|
The Equity Risk Premium and Stock Bond Ratio headwinds:
The ratio between stocks and bonds is finally starting to come back after recently reaching an extreme level. The moves in both markets helped to push the Equity Risk Premium to the lowest level in a decade. The combination of both factors should be a modest negative for stocks in the shorter-term.
|
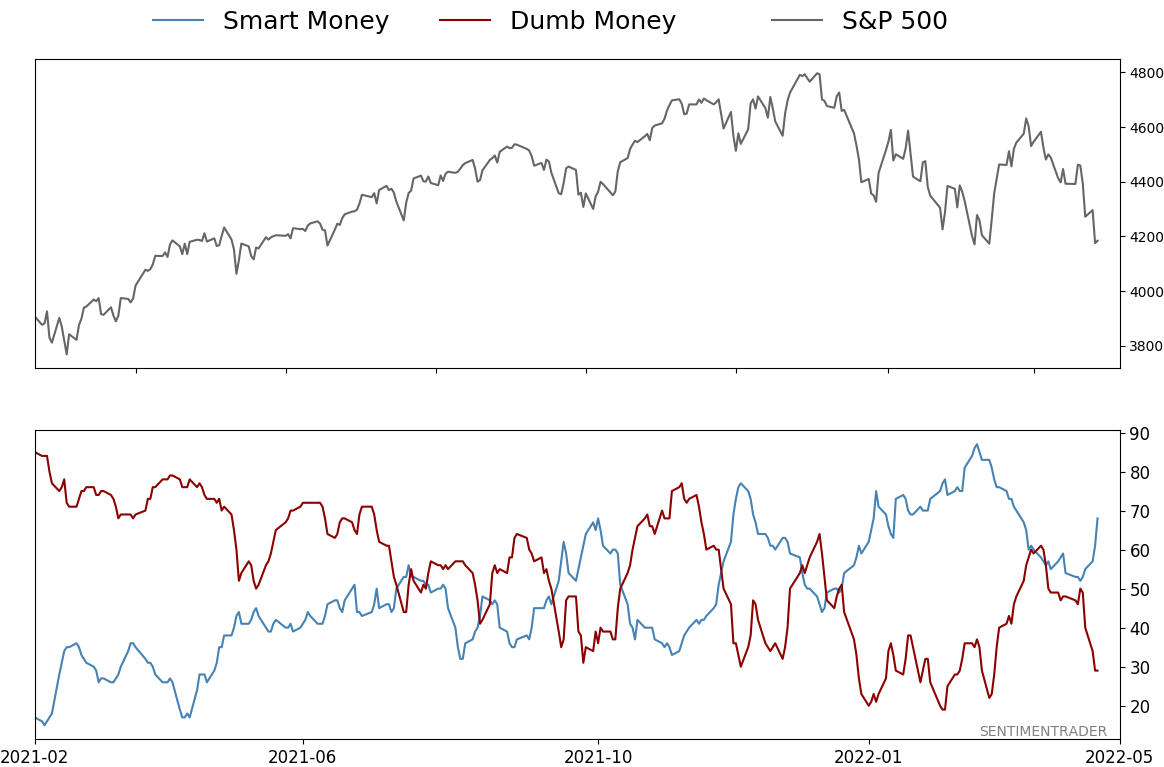
Smart / Dumb Money Confidence
|
Smart Money Confidence: 68%
Dumb Money Confidence: 29%
|
|
Risk Levels
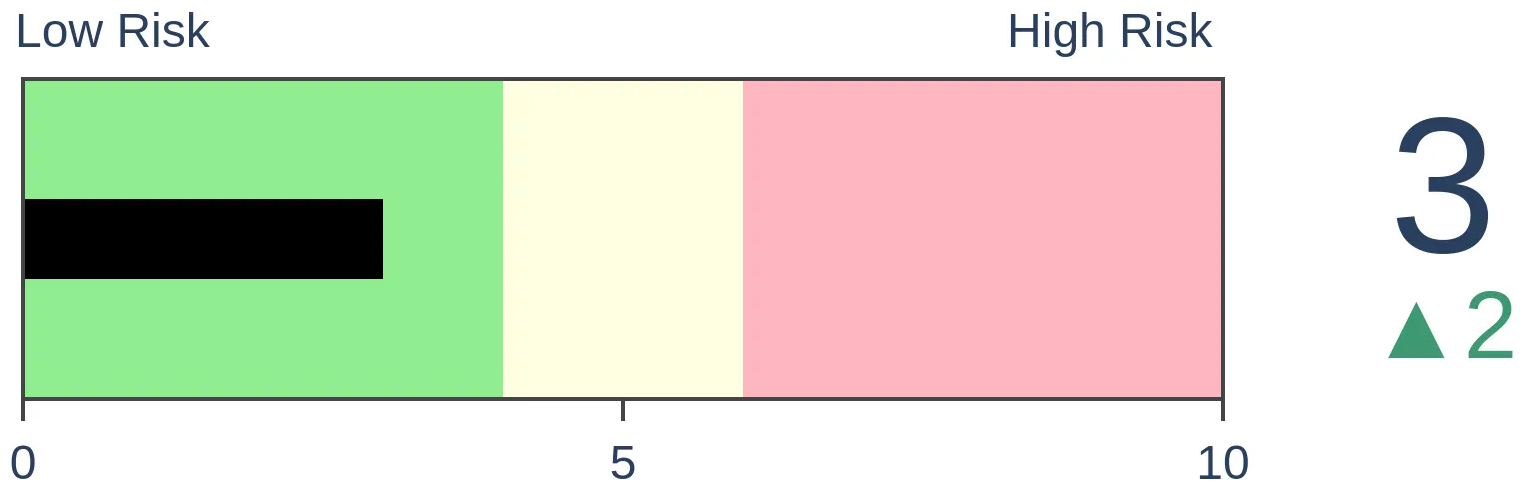
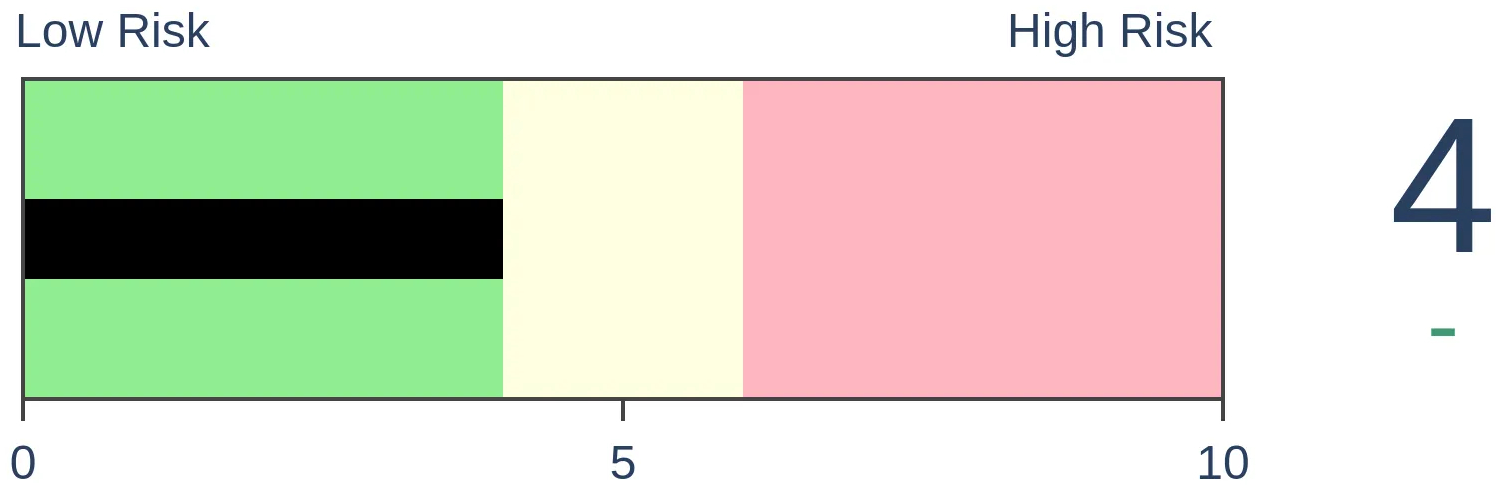
Stocks Short-Term
|
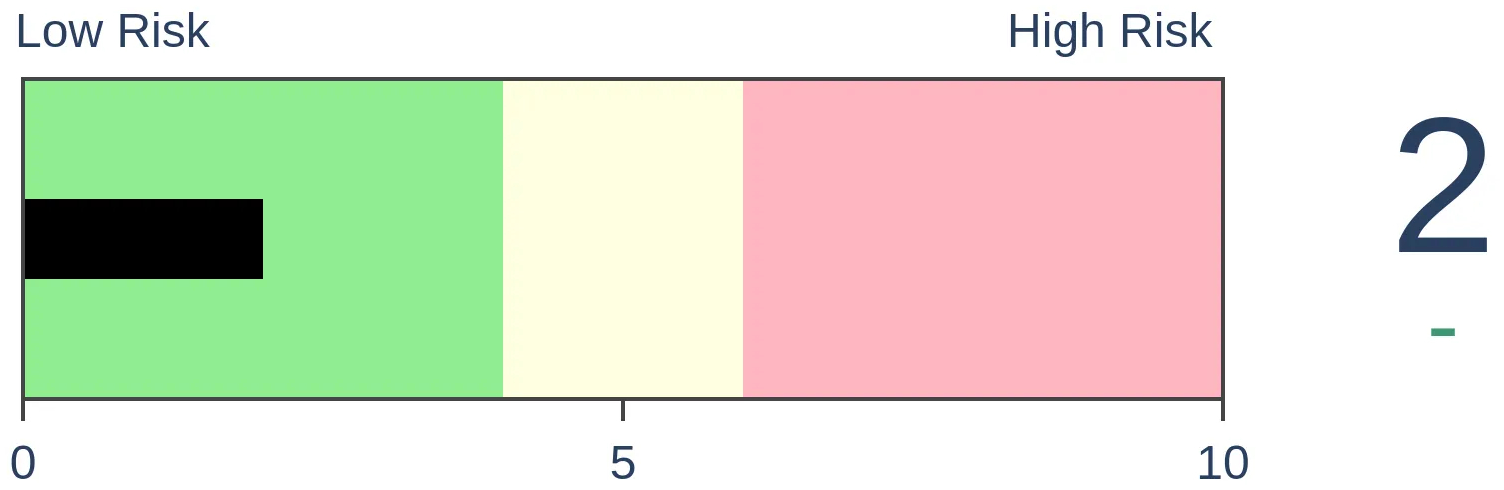
Stocks Medium-Term
|
|
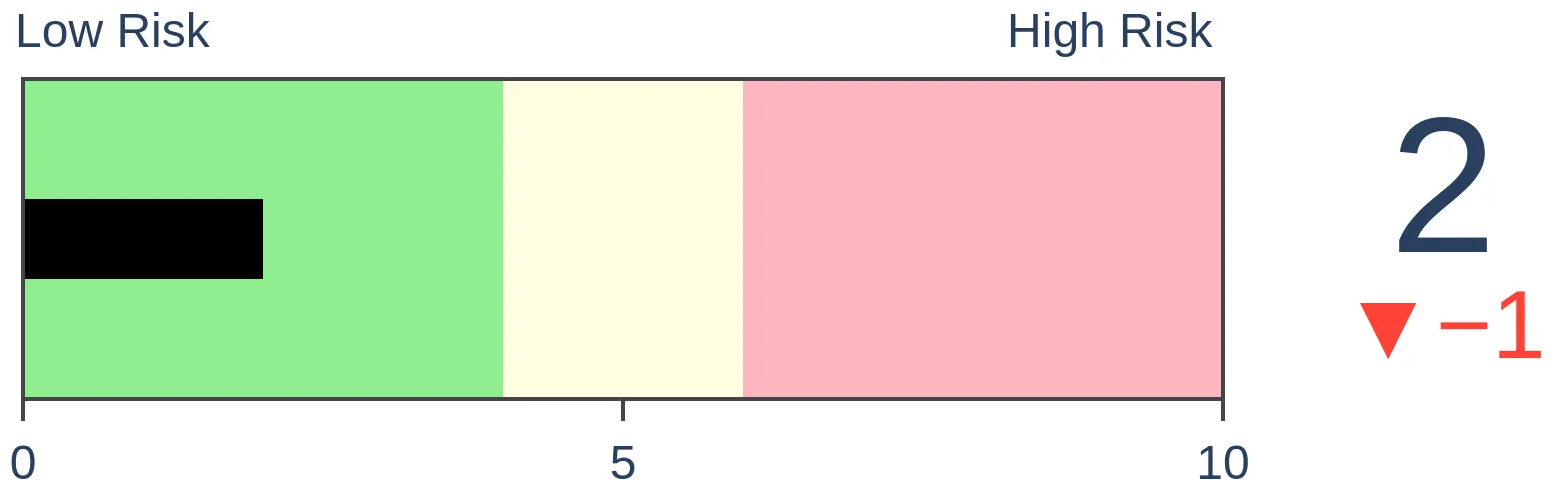
Bonds
|
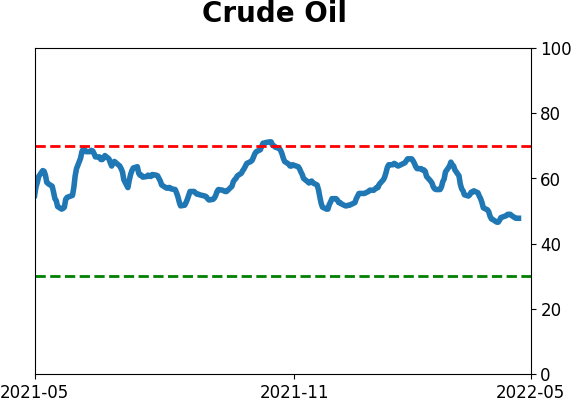
Crude Oil
|
|
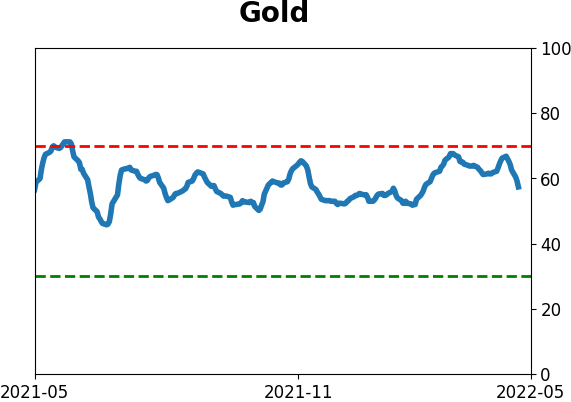
Gold

|
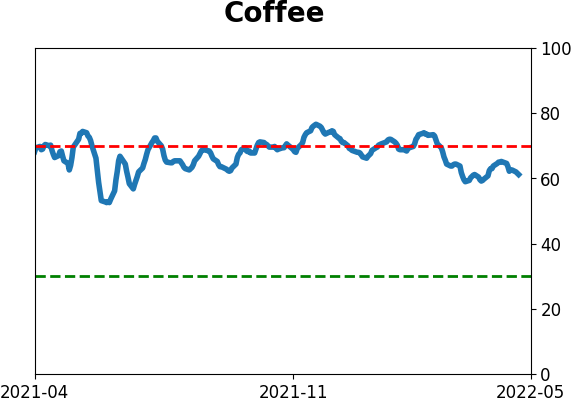
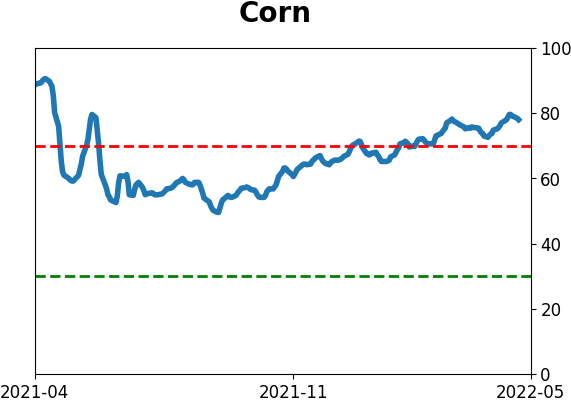
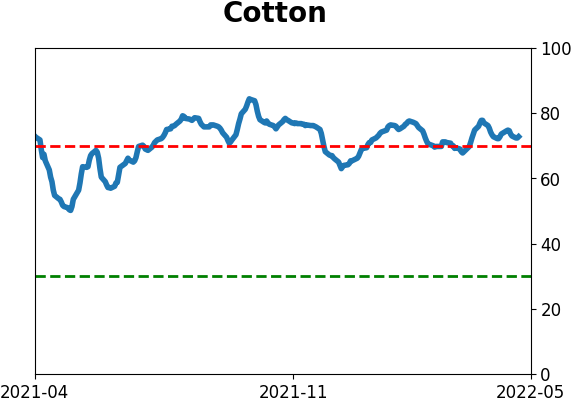
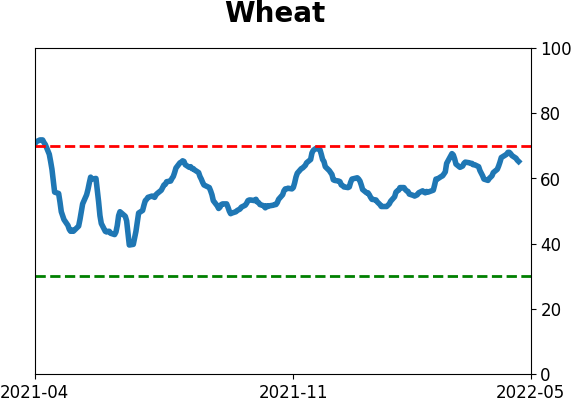
Agriculture

|
|
Research
By Jason Goepfert
BOTTOM LINE
The ratio between stocks and bonds is finally starting to come back after recently reaching an extreme level. The moves in both markets helped to push the Equity Risk Premium to the lowest level in a decade. The combination of both factors should be a modest negative for stocks in the shorter-term.
FORECAST / TIMEFRAME
None
|
Key points:
- The ratio between stocks and bonds is reversing after reaching a historic extreme
- Moves in stocks and bonds have shrunk the premium that equity investors had been earning
- Similar combinations of the two factors have led to poor shorter-term returns in the S&P 500
Stocks are still stretched (relatively)
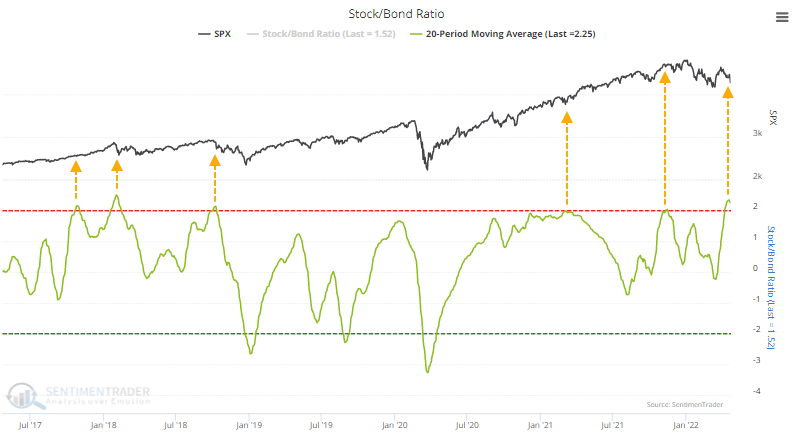
Over the past couple of days, stocks have pulled back and the bond market has enjoyed a slight reprieve from massive selling pressure. The historical ratio between the two markets has eased back a bit.
Even so, the 20-day average of the Stock/Bond Ratio is only now curling down from an extreme level well above 2.0. When this ratio moves more than +/- 2 standard deviations, it often coincides with extremes in the S&P 500 (like any indicator, it's not perfect).
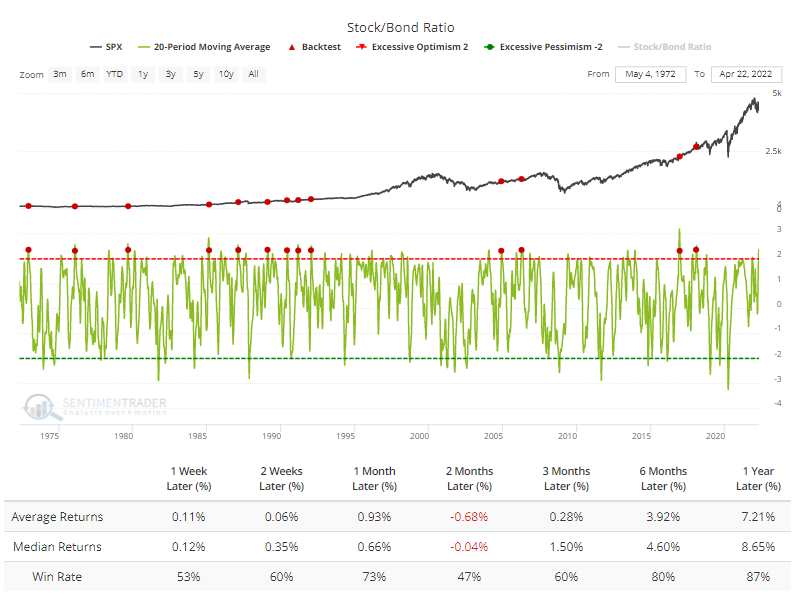
The Backtest Engine shows that when the ratio reversed down from such a high level, the S&P 500 showed a negative average return over the next two months. After that, returns normalized.
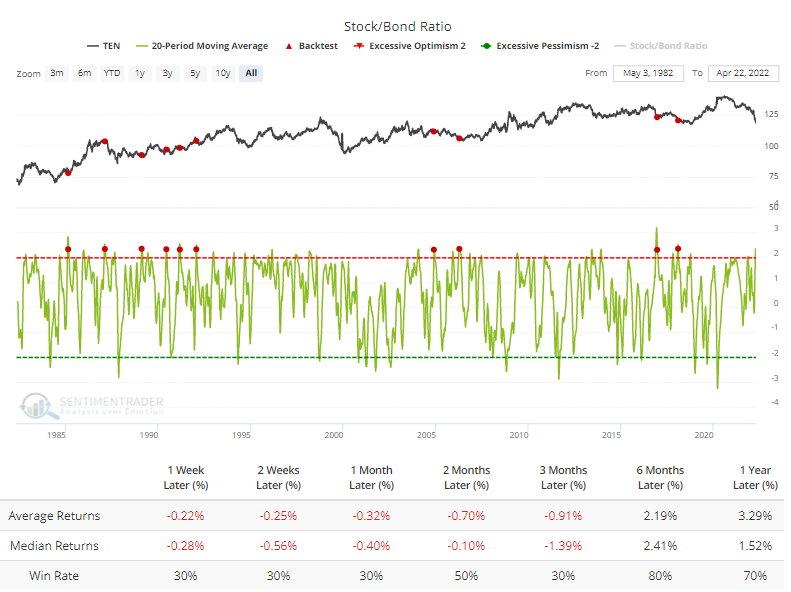
In the decades that we've been following this, we've noted several times that the indicator tends to be a much better indicator for the stock market than the bond market. It makes sense to think that if the ratio reverses, then that should mean that bonds are rallying. But the Backtest Engine shows that 10-year Treasury futures showed very weak short- to medium-term returns.
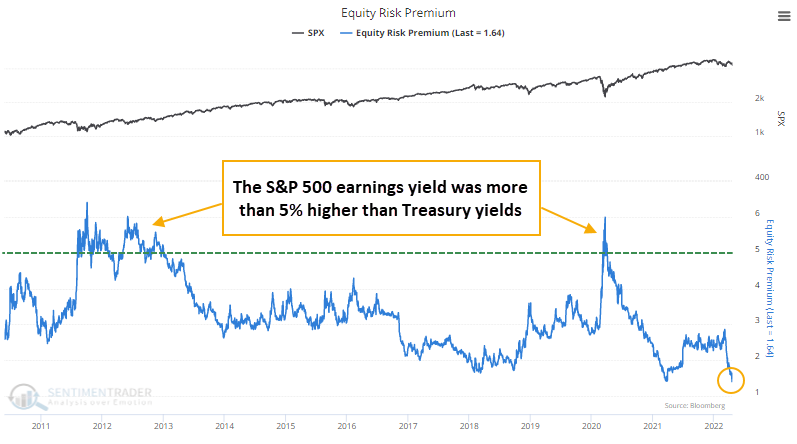
The Risk Premium is shrinking
Thanks to the volatile moves in both the stock and bond markets, the S&P 500's earnings yield has declined relative to the yield on 10-year Treasuries. That pushed the Equity Risk Premium (ERP) to its lowest level since 2010. This is a stark change from some of the important lows of the past decade when the S&P earnings yield was 4% or more than Treasuries.
The quick shrinking of the ERP suggests that equity investors have less incentive to feel TINA (There Is No Alternative). Per the Wall Street Journal:
"We witnessed real rates explode higher, almost touching positive territory in the 10-year space, leaving equities extremely vulnerable," said Brian Bost, co-head of equity derivatives at Barclays. "‘There is no alternative' is no longer a justification to hide out in equities."
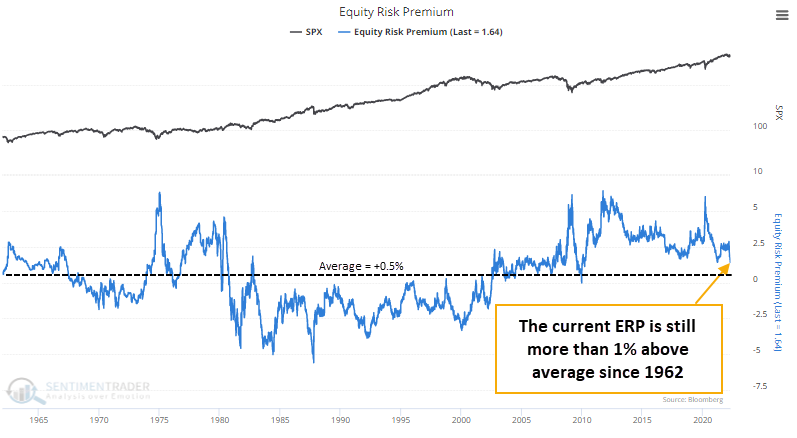
While it sounds like a valid excuse to sell stocks, context is important. When we zoom out, maybe there's not a good reason to panic.
The current ERP of +1.6% is still well above the average of +0.5% over the past 60 years. From 1980 through 2002, the ERP spent almost the entire time in negative territory. Only when it moved below -2.5% did stocks really struggle.
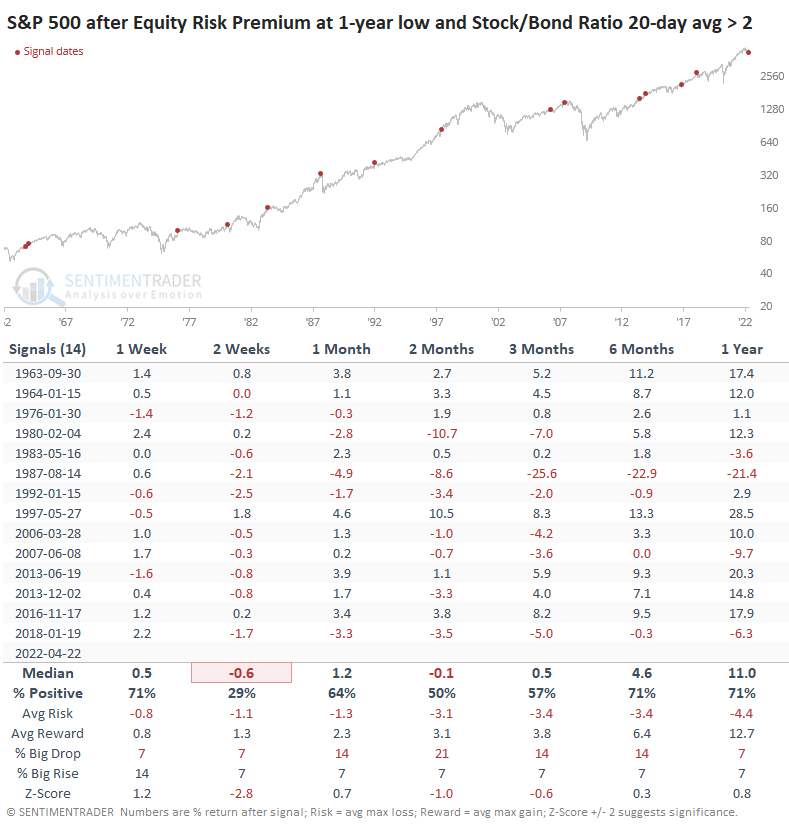
A relatively low ERP and stretched Stock/Bond Ratio
While the absolute level of the Equity Risk Premium may not be an issue, it did recently drop to a one-year low at the same time that the Stock/Bond Ratio was extreme. When the ERP was at a low and the Stock/Bond Ratio 20-day average was above 2, stocks suffered. Up to two months later, the S&P 500 showed a negative median return, though long-term returns were decent (except for 1987).
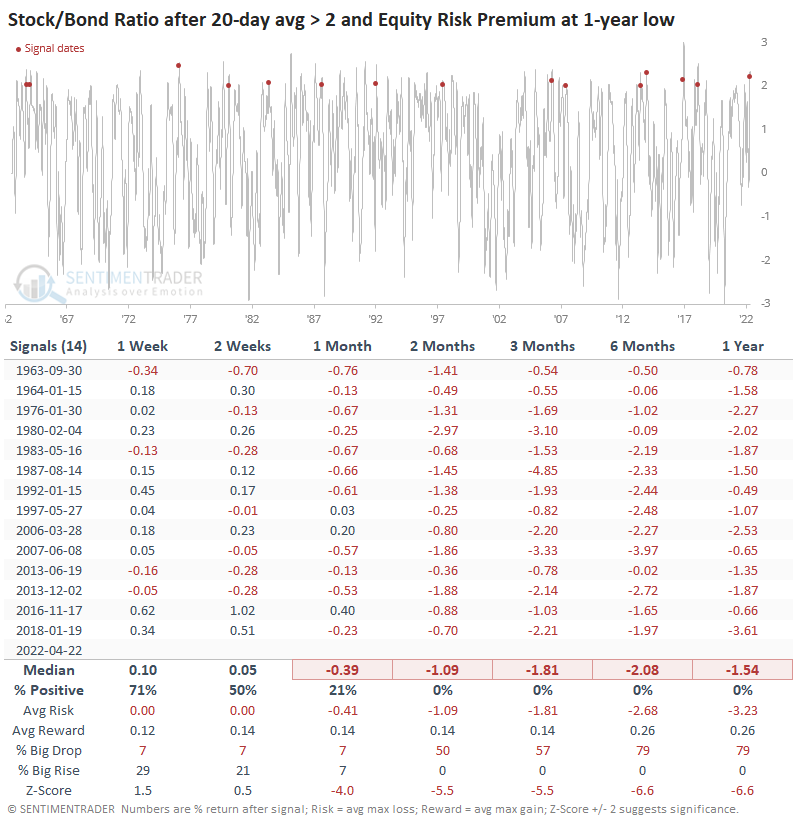
The Stock/Bond Ratio declined over the medium- to long-term every time, suggesting that the two markets showed a strong tendency to mean-revert. While that doesn't mean positive or negative absolute returns, in general, it would suggest stocks relaxing while bonds enjoyed a reprieve.
What the research tells us...
Markets have been exceptionally volatile across the board. There has been no good place to hide, other than a smattering of defensive sectors. For broad index investors, it's been a brutal lesson in the reality of markets. While equity investors now face a market that's less attractive on a relative basis to some competing markets, it's not even remotely to a point that has historically caused trouble. On a shorter-term basis, it's more of a worry, especially given the stretched ratio between stocks and bonds.
Indicators at Extremes
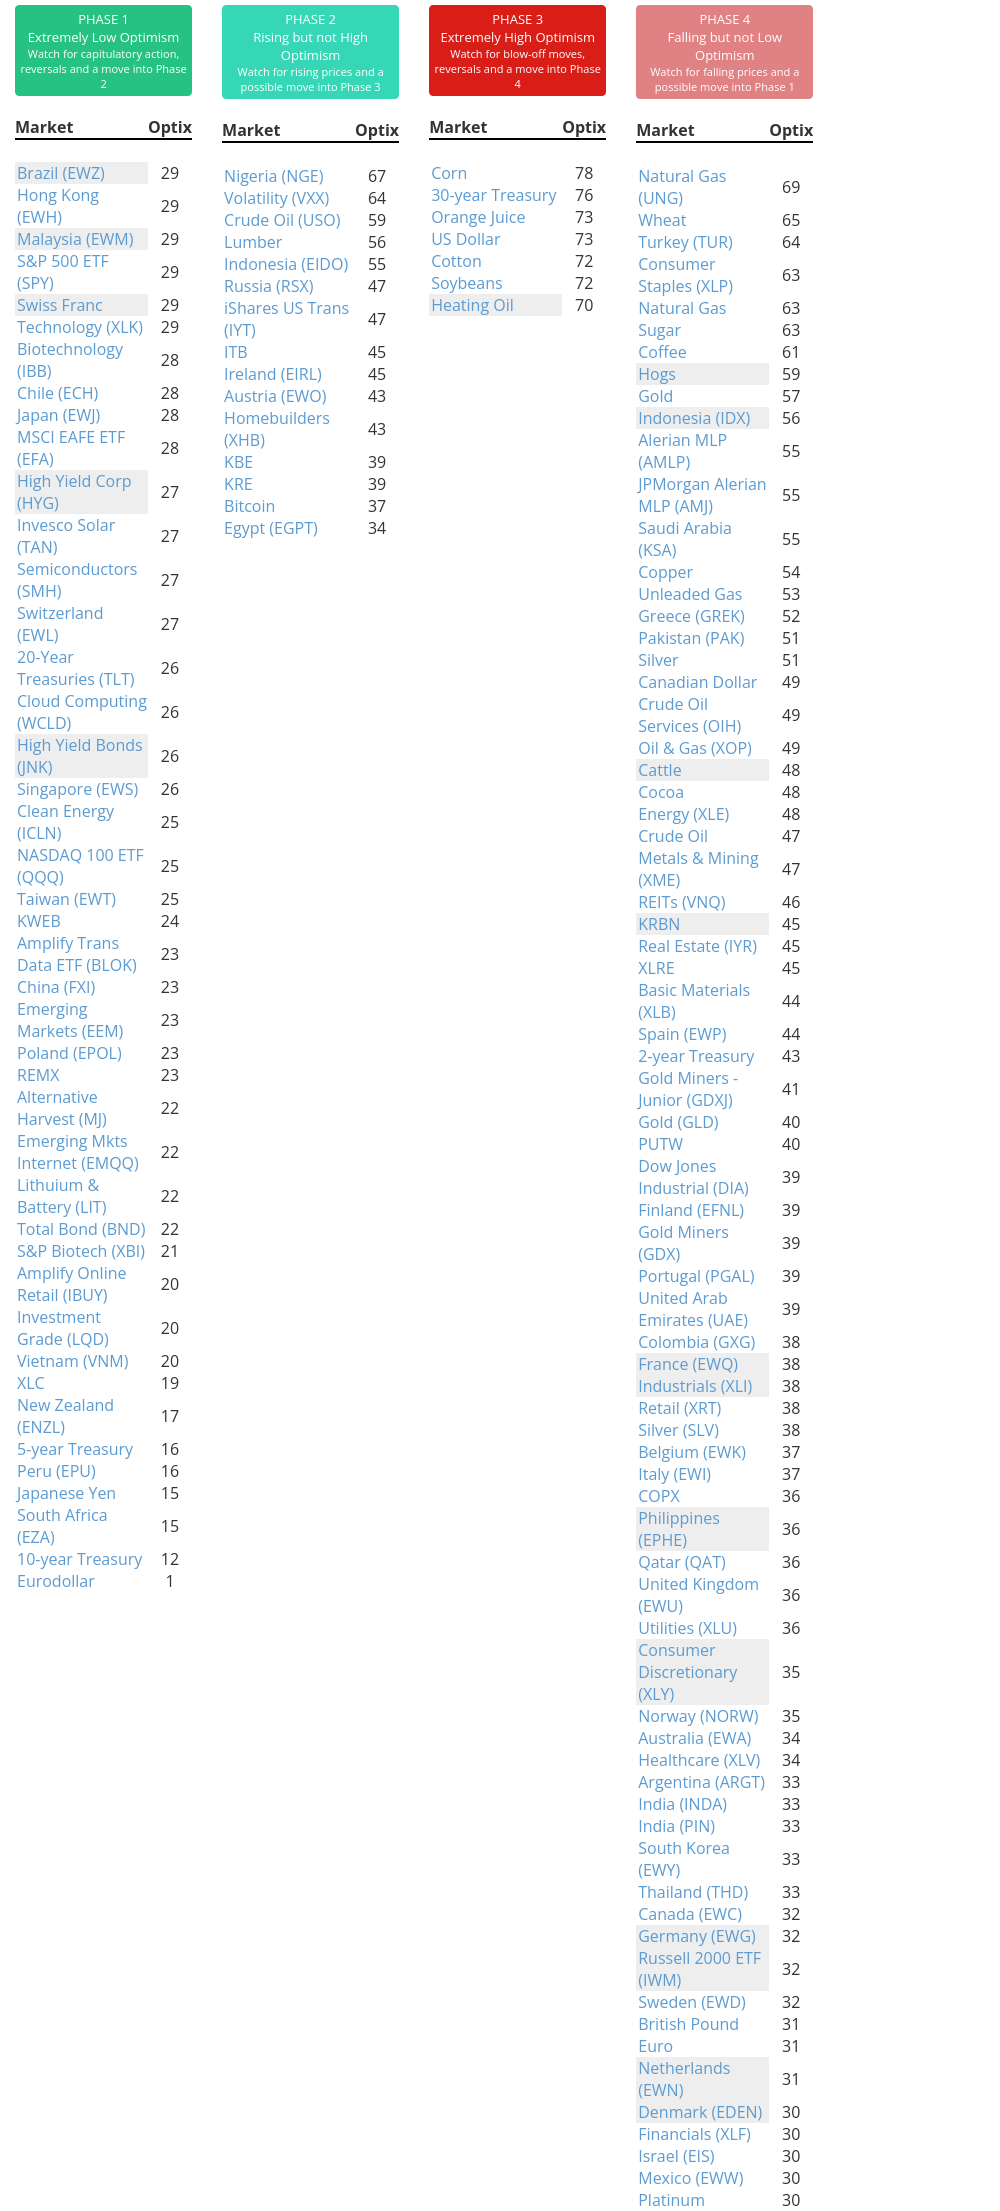
Phase Table
Ranks
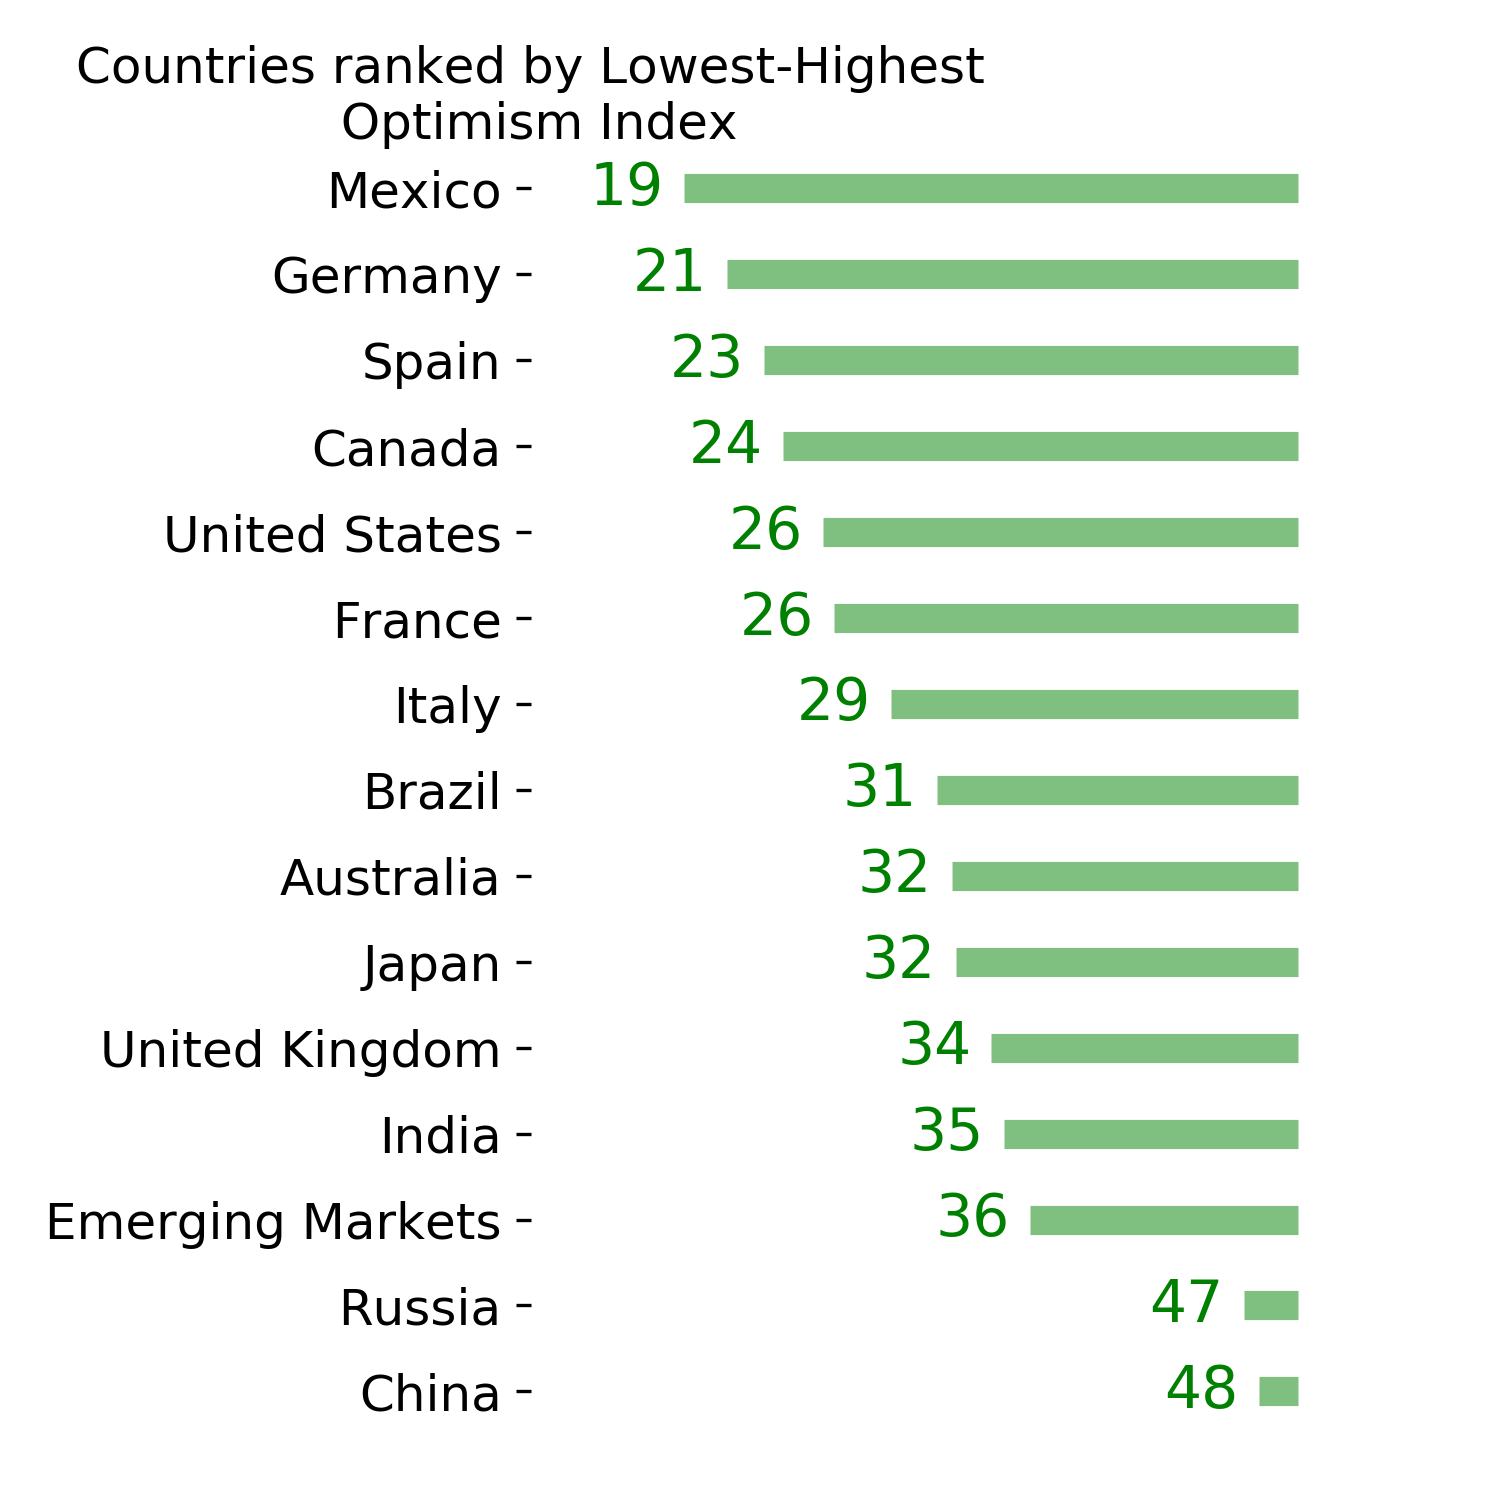
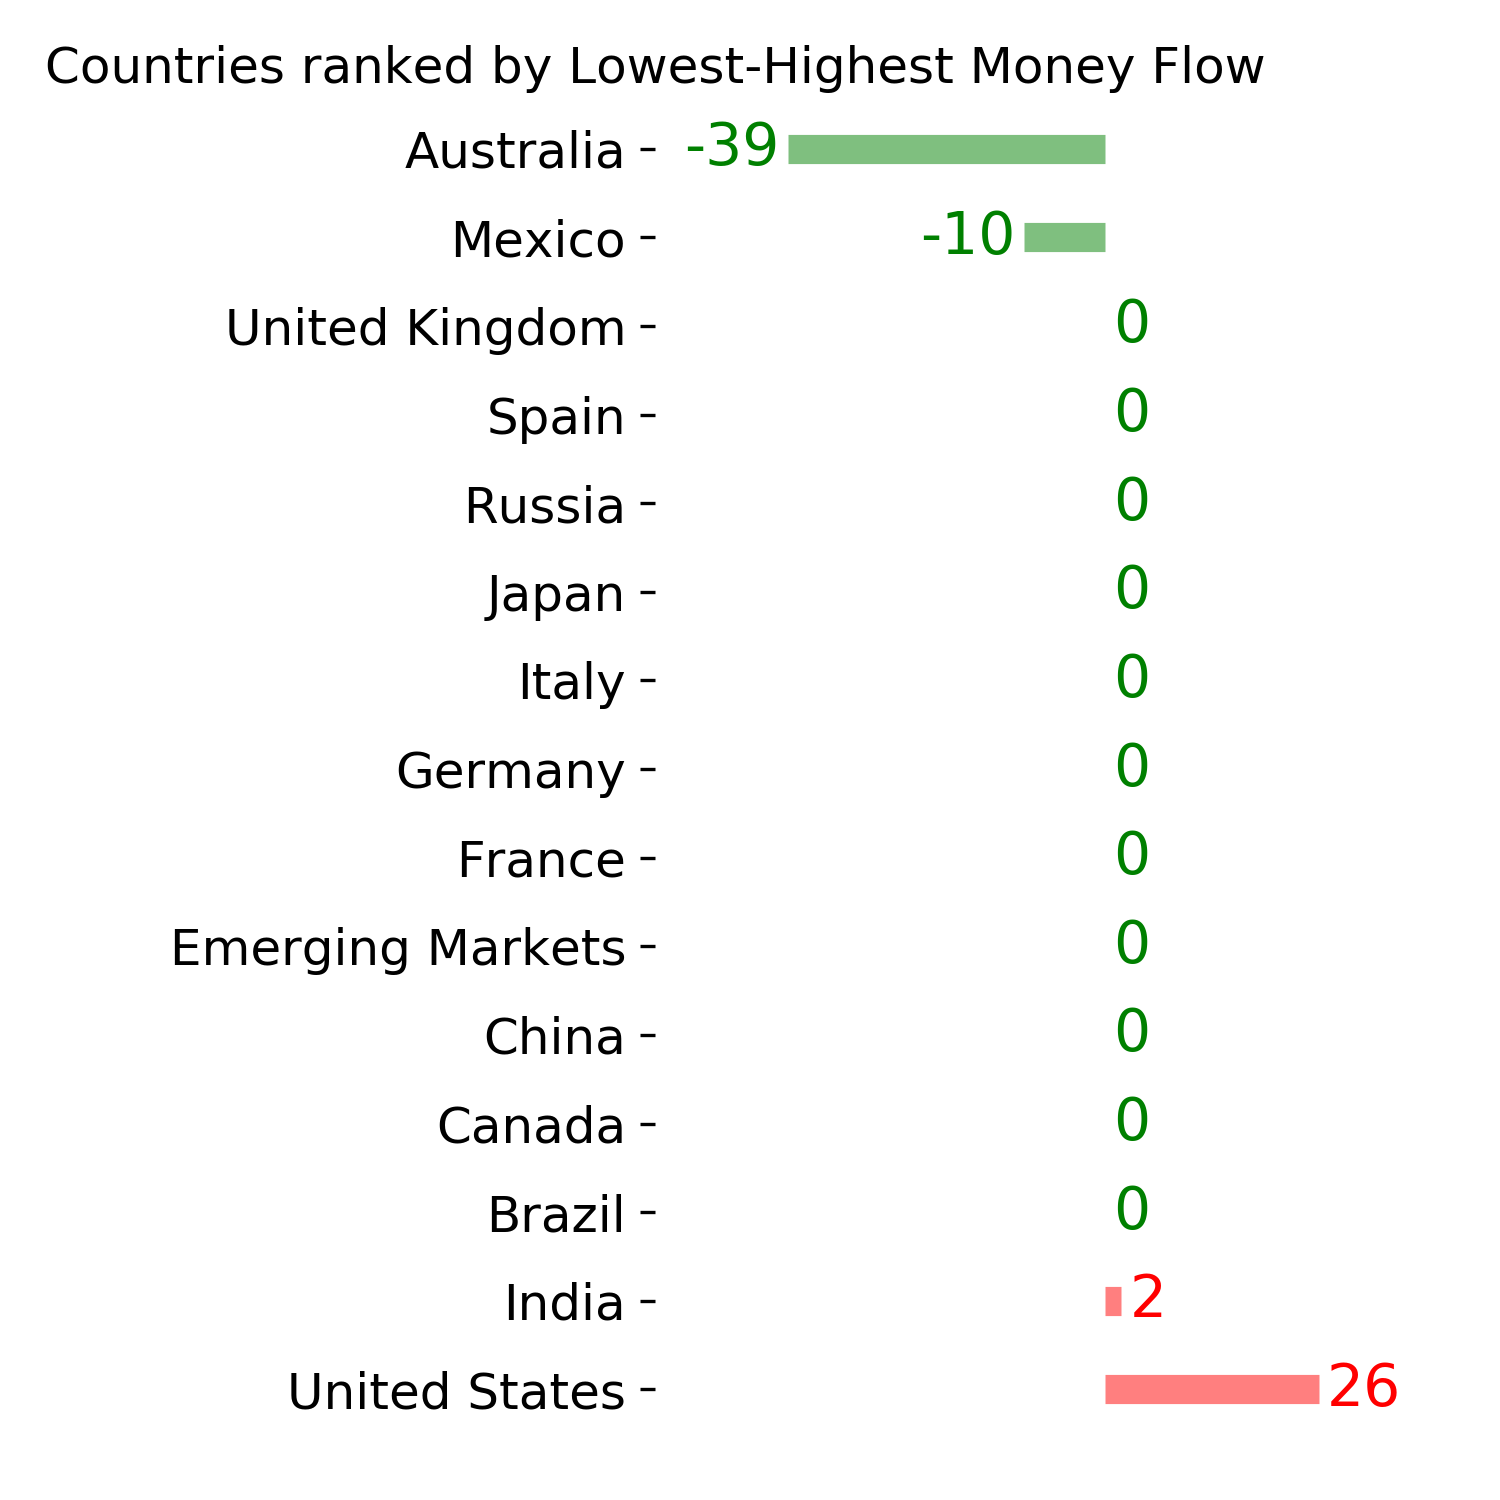
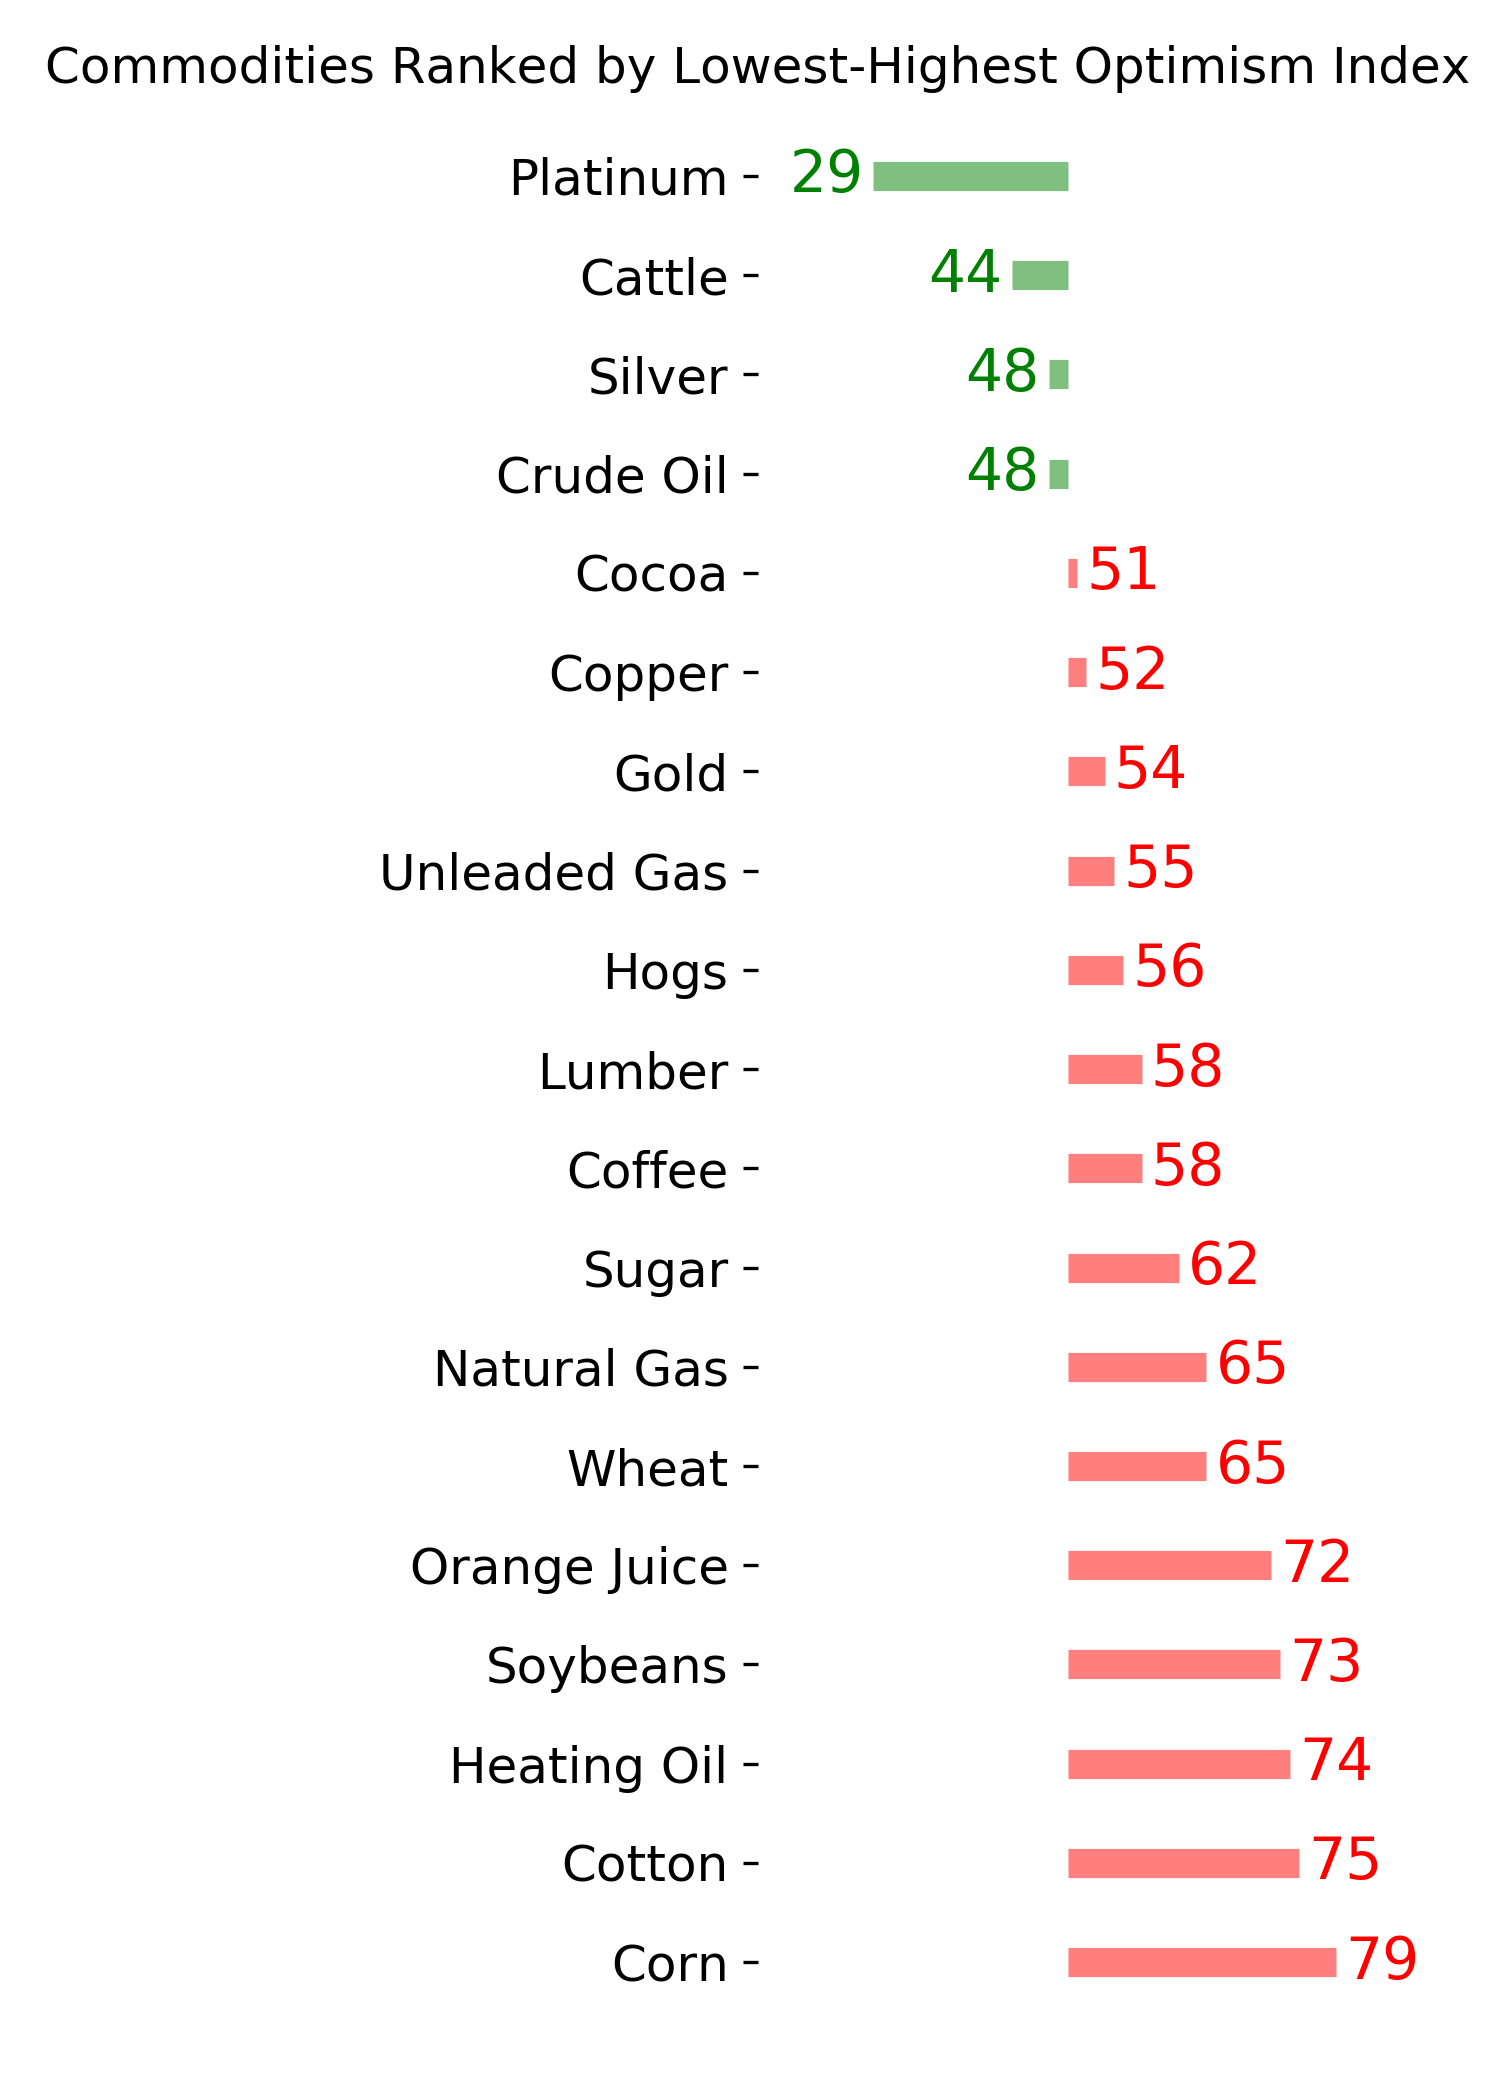
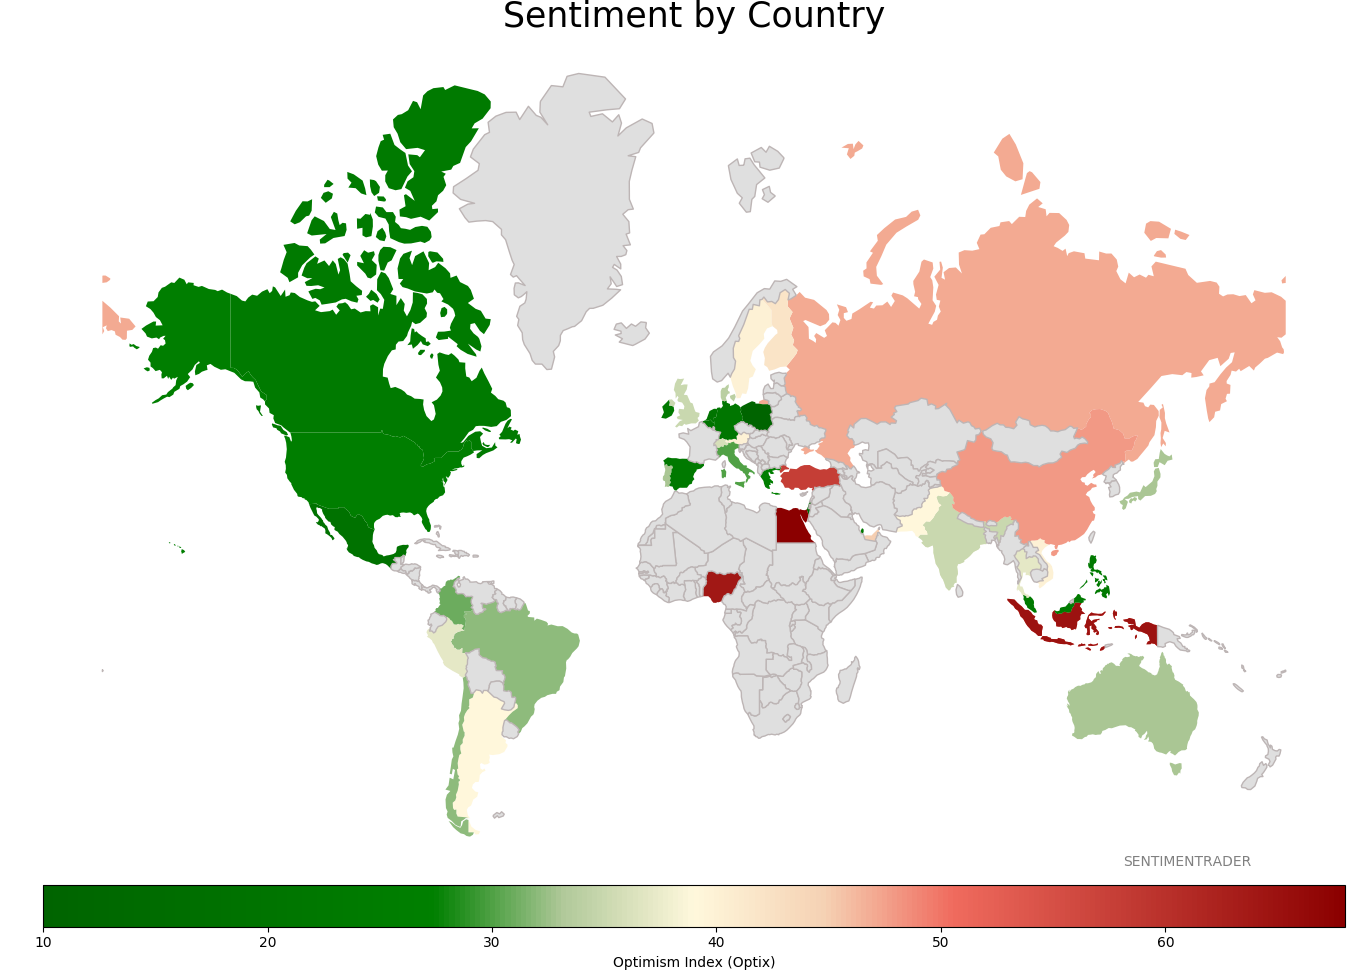
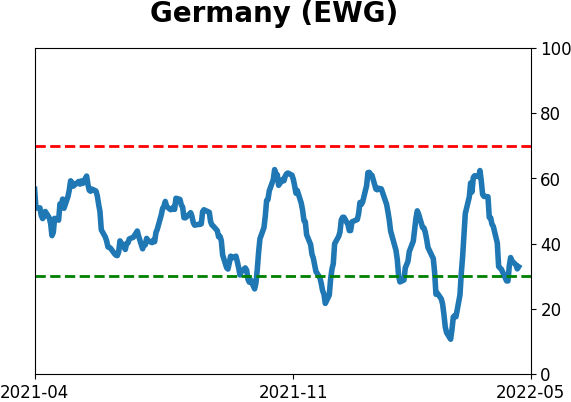
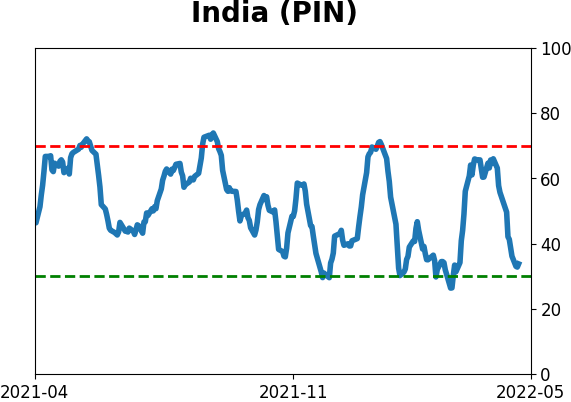
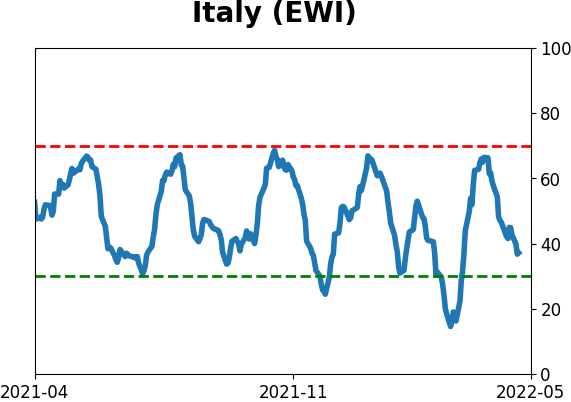
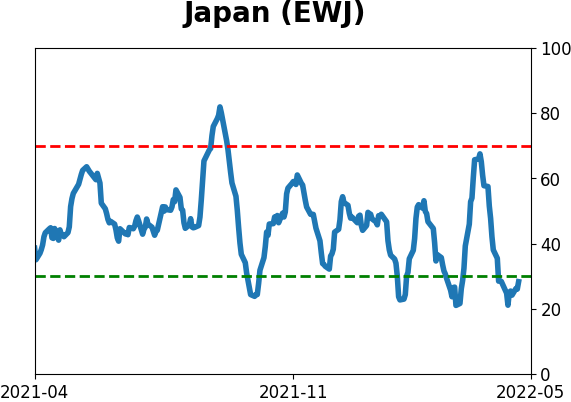
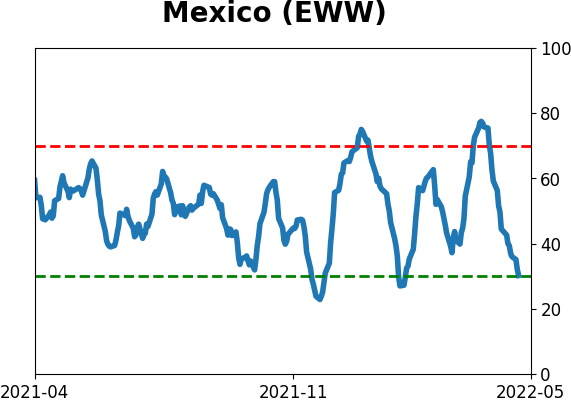
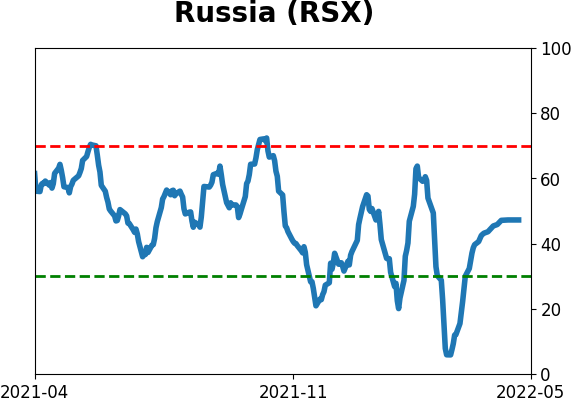
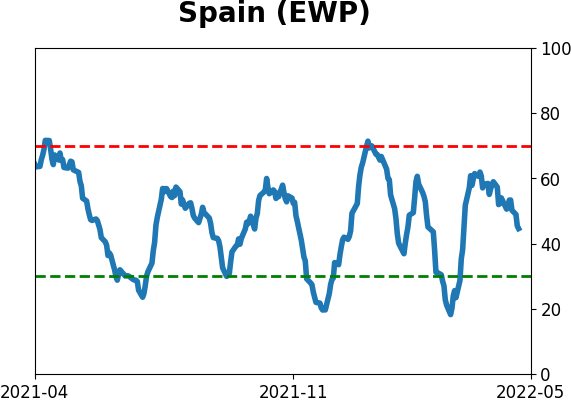
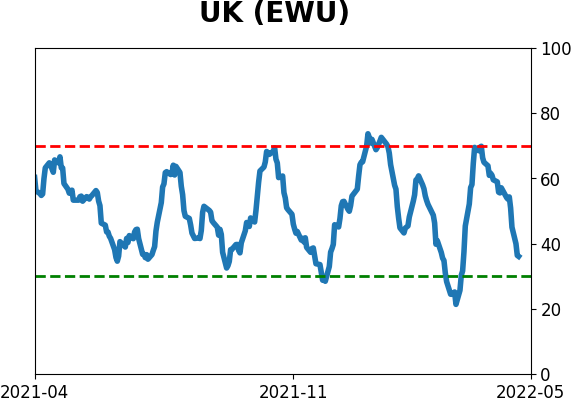
Sentiment Around The World
Optimism Index Thumbnails
|
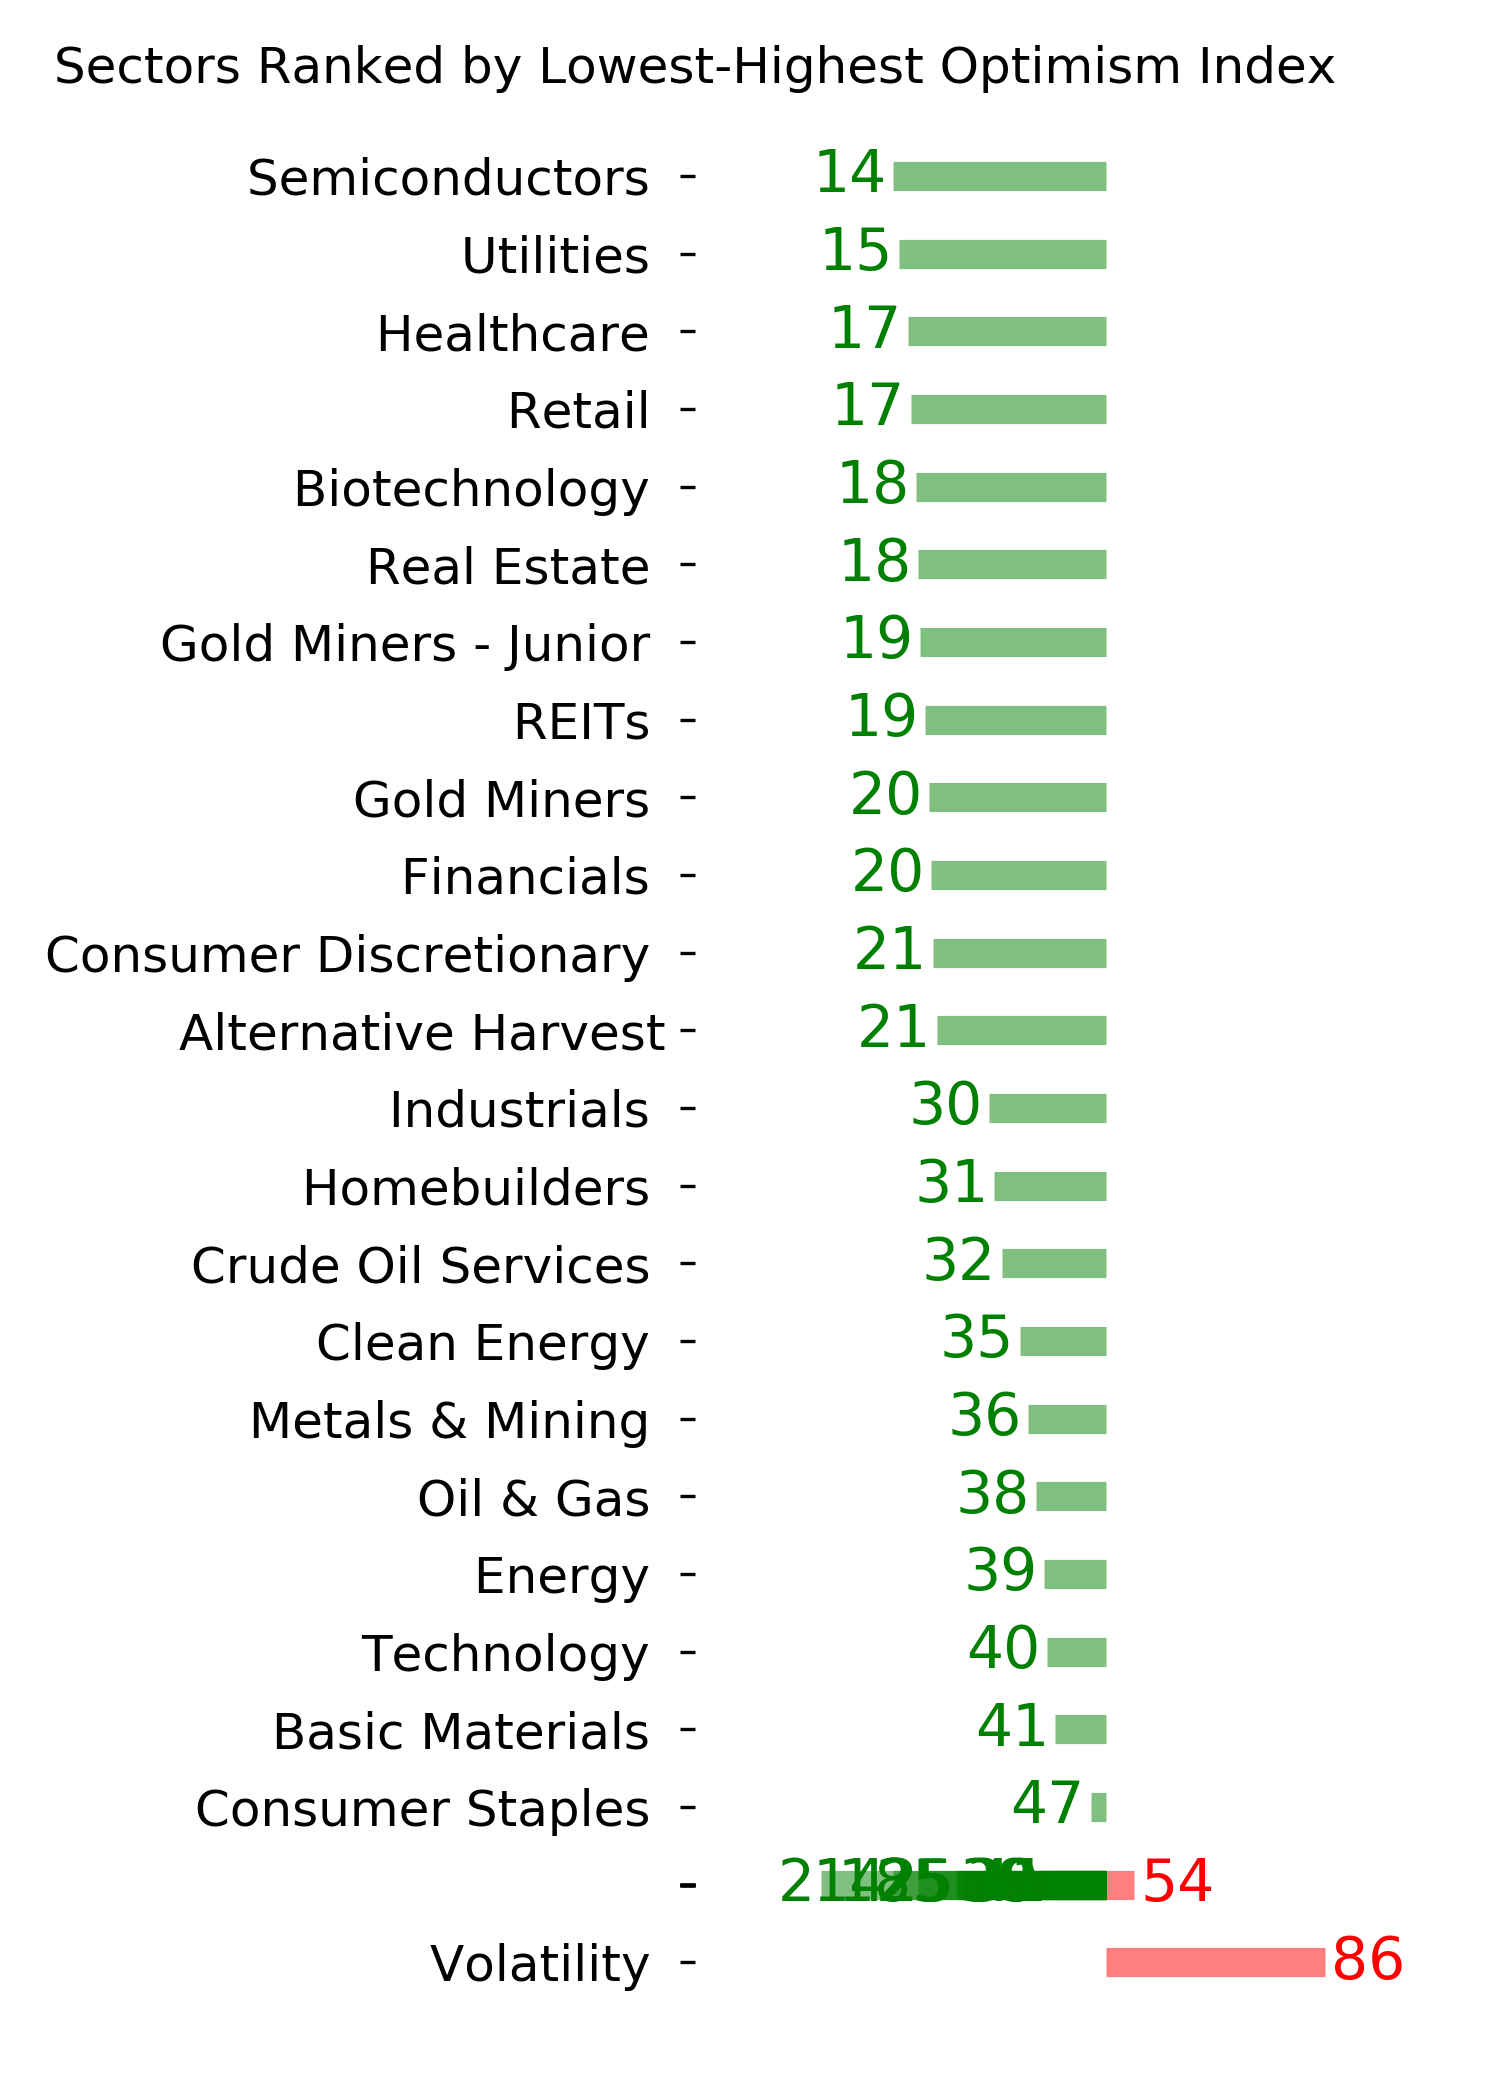
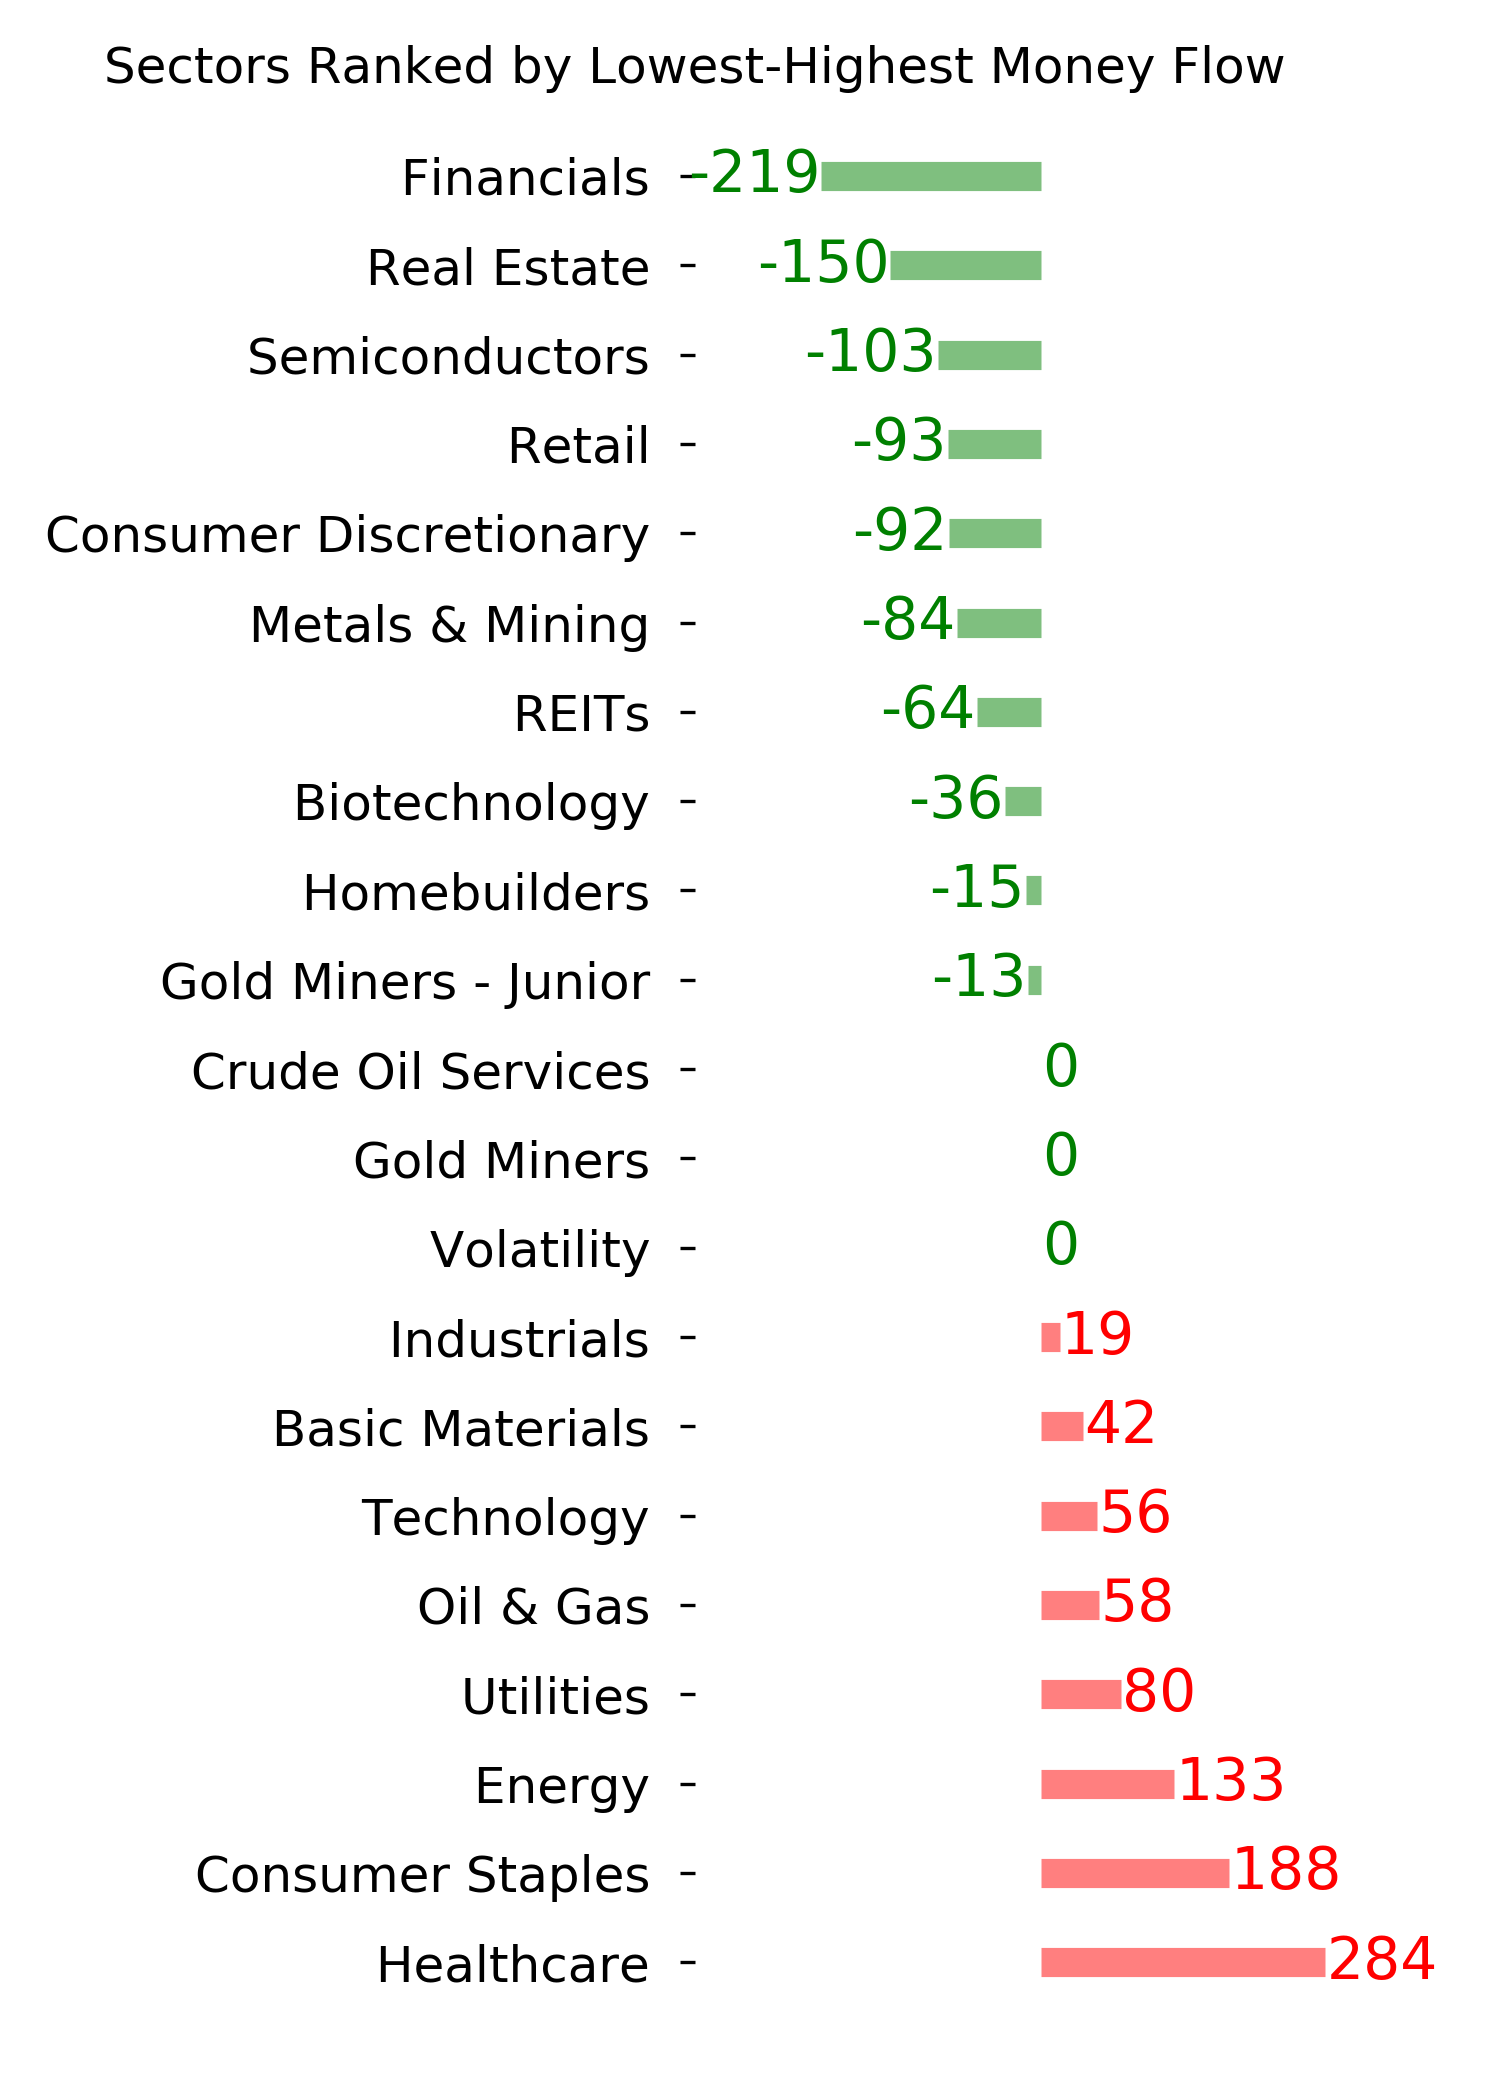
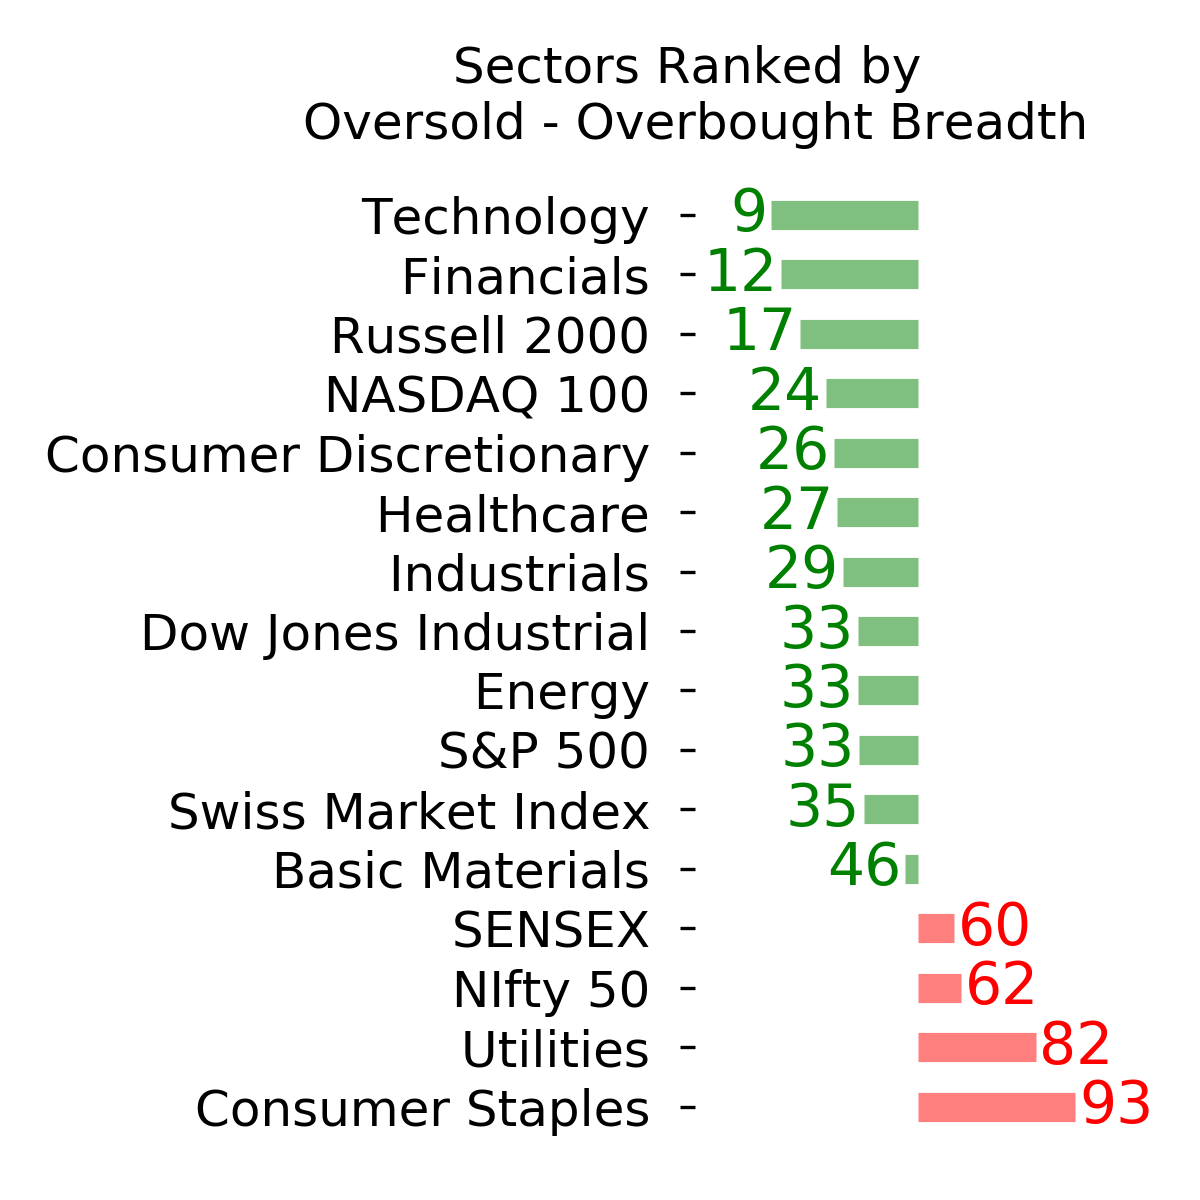
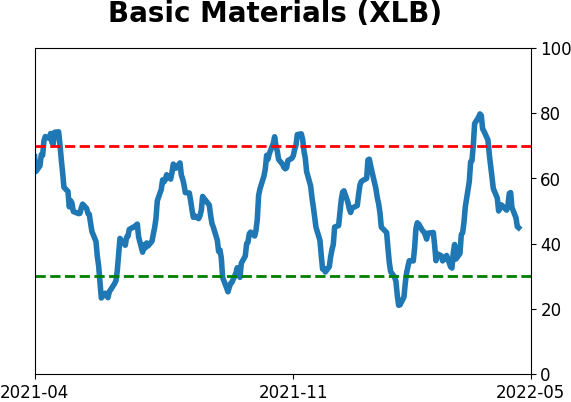
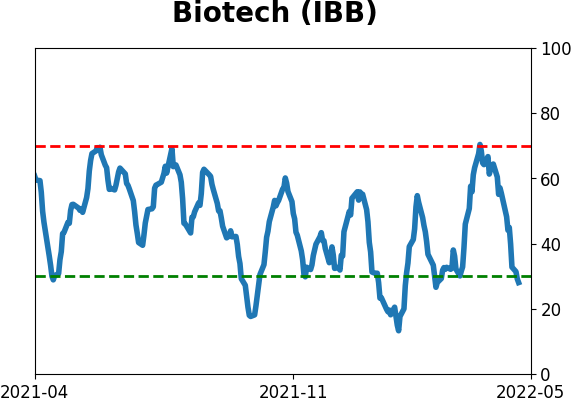
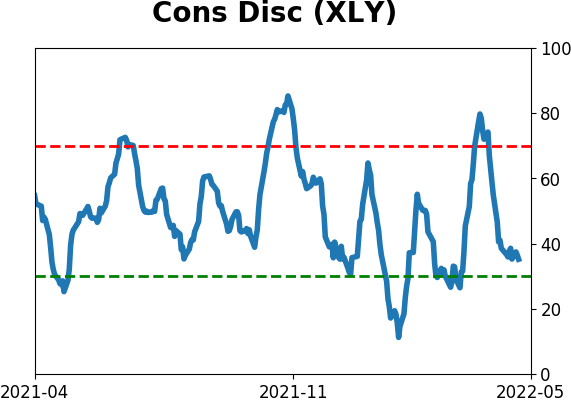
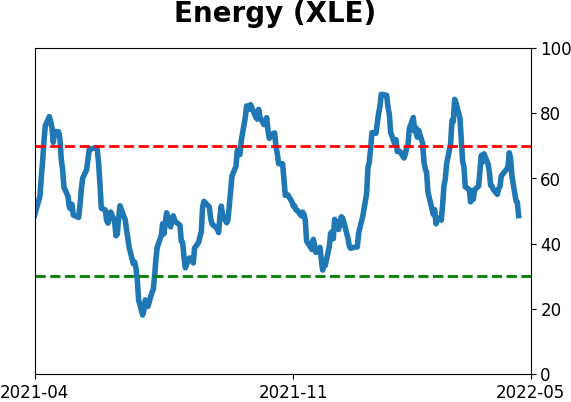
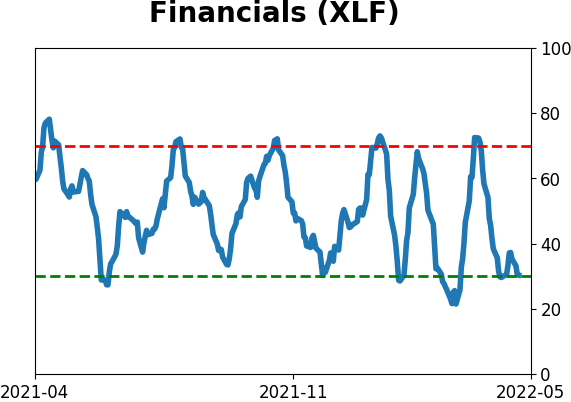
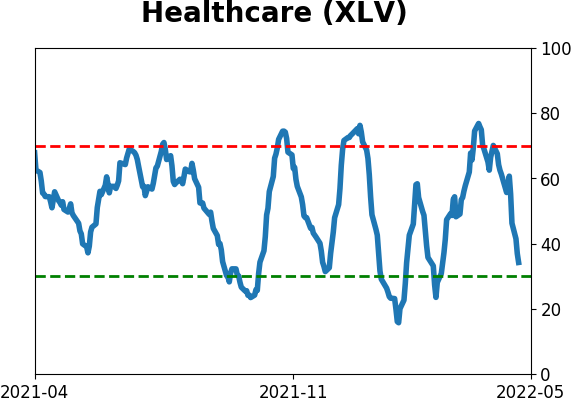
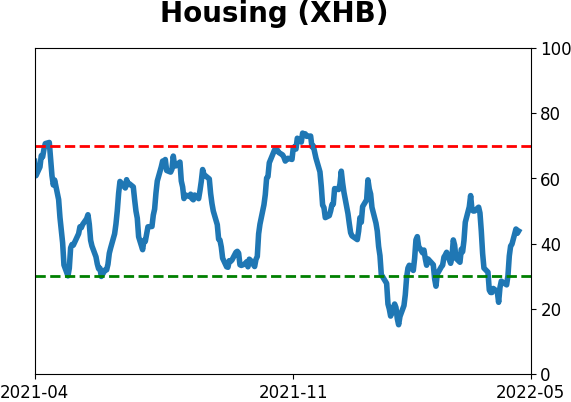
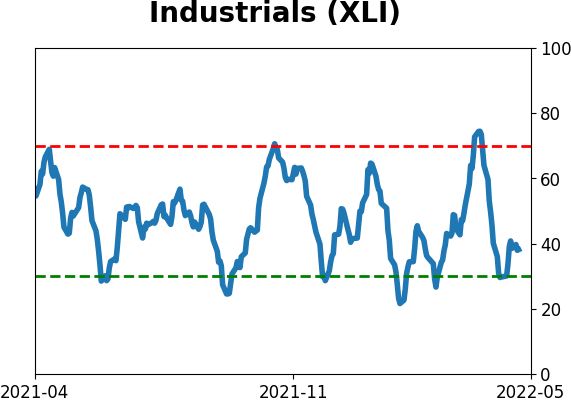
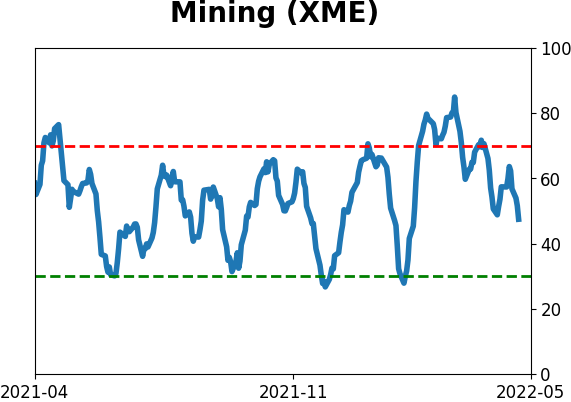
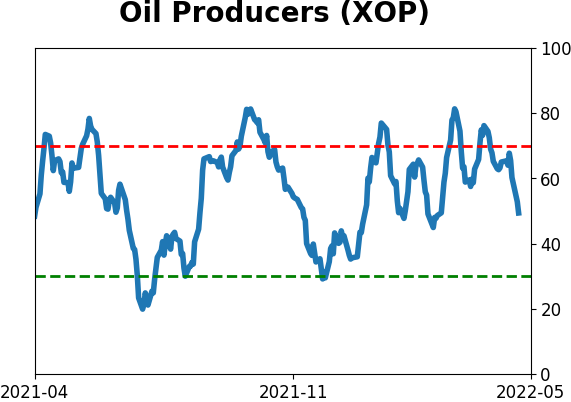
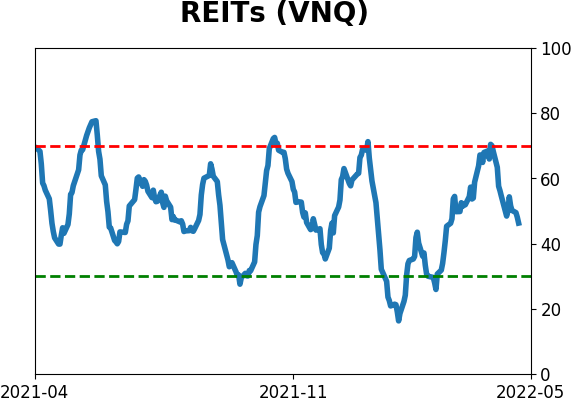
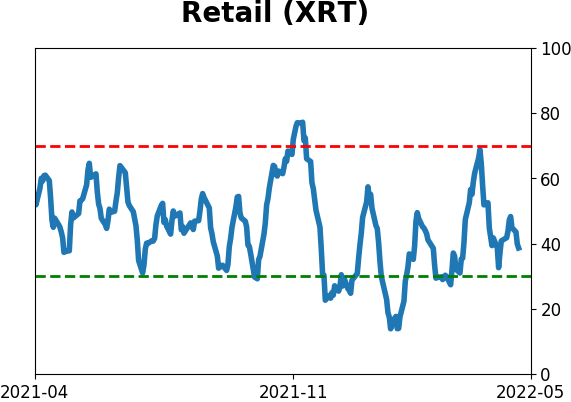
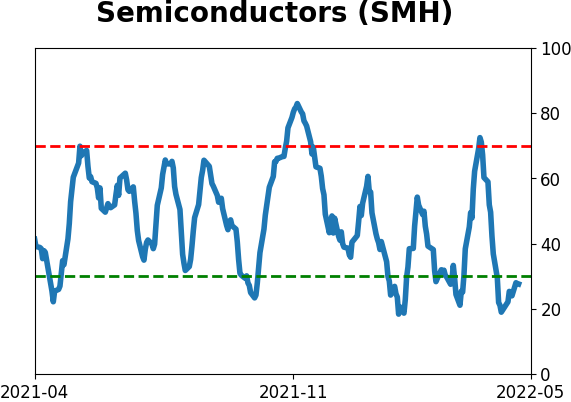
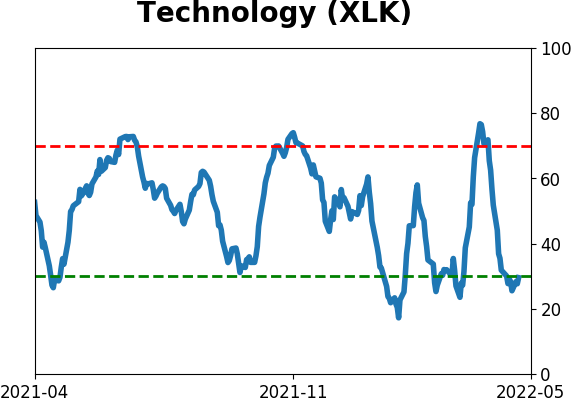
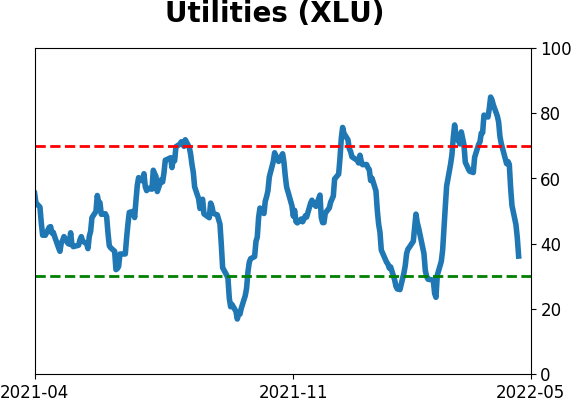
Sector ETF's - 10-Day Moving Average
|
|
|
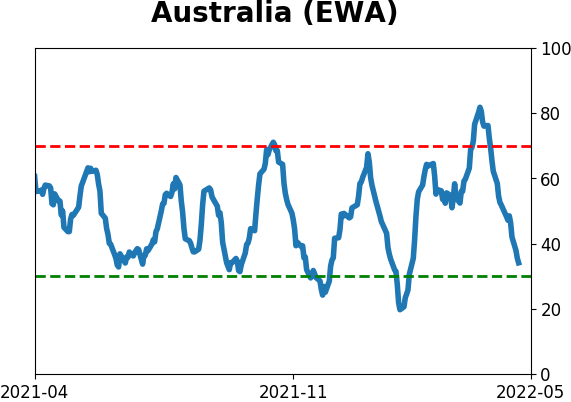
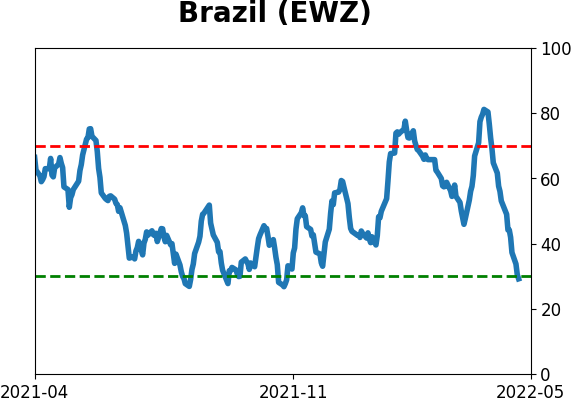
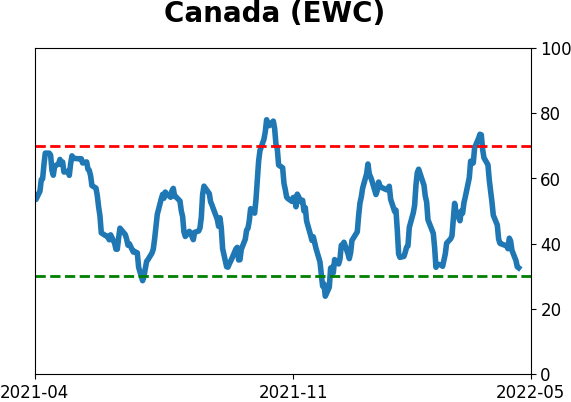
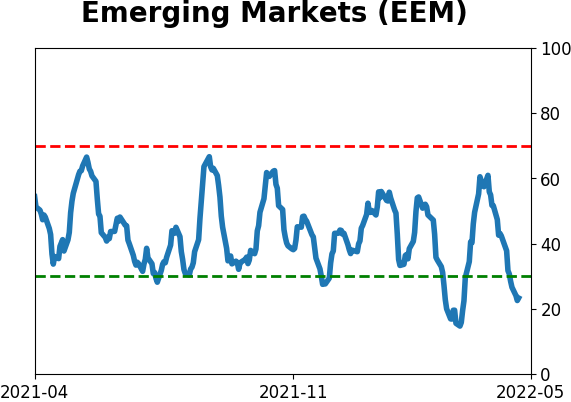
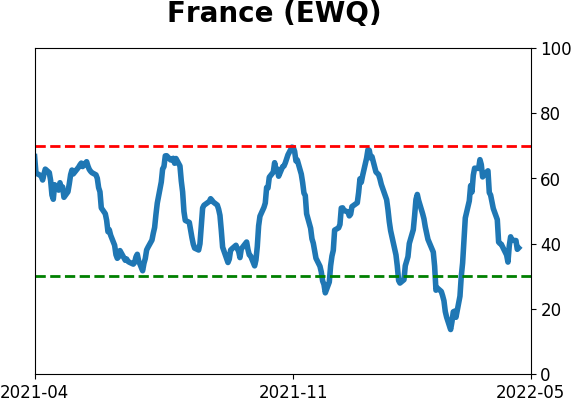
Country ETF's - 10-Day Moving Average
|
|
|
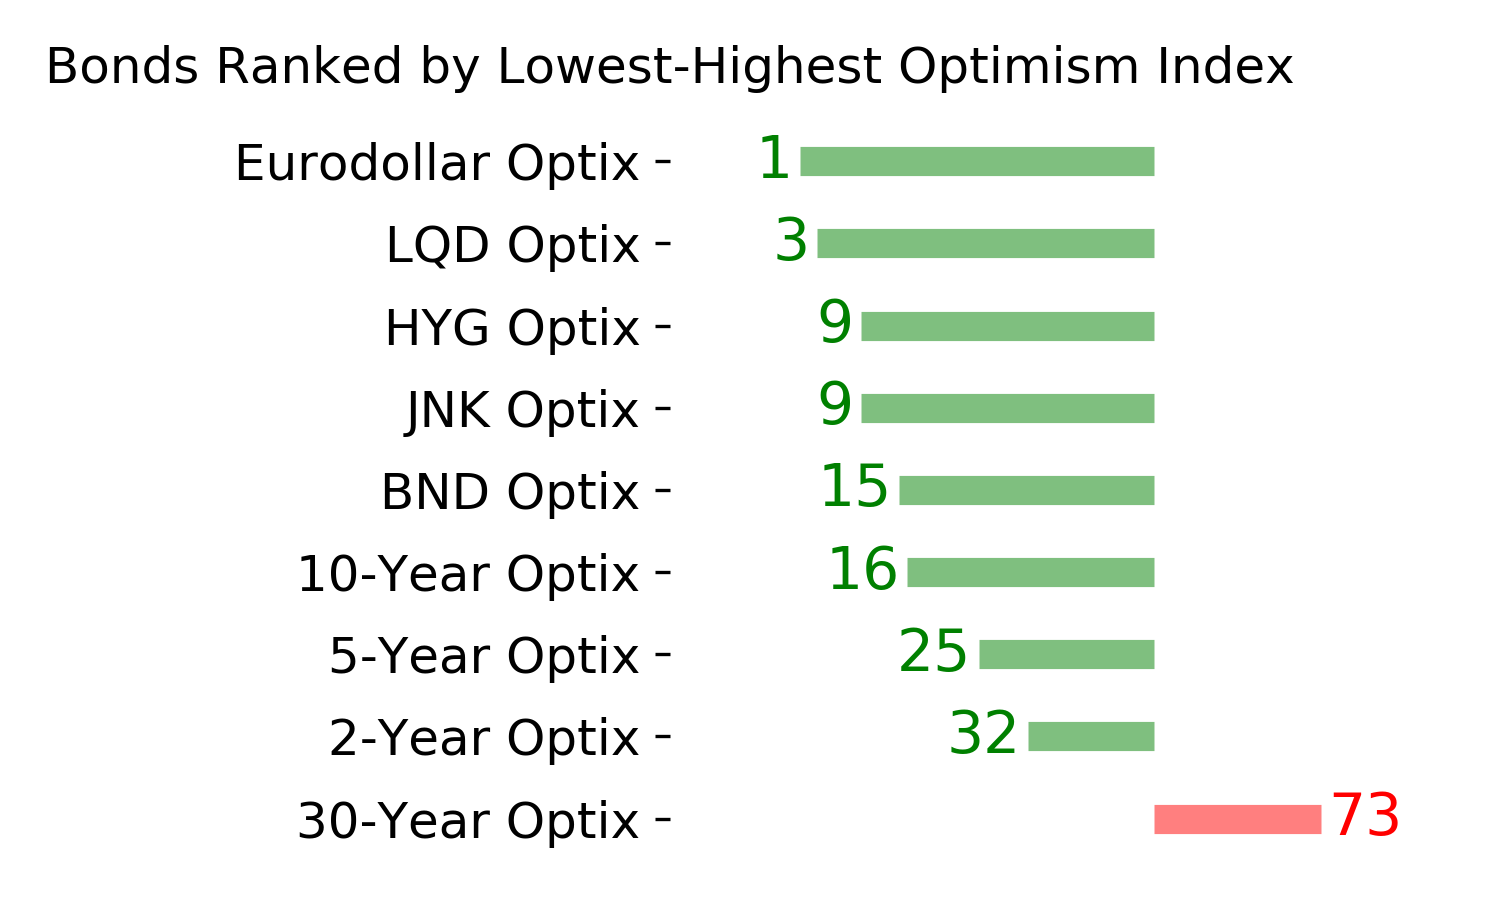
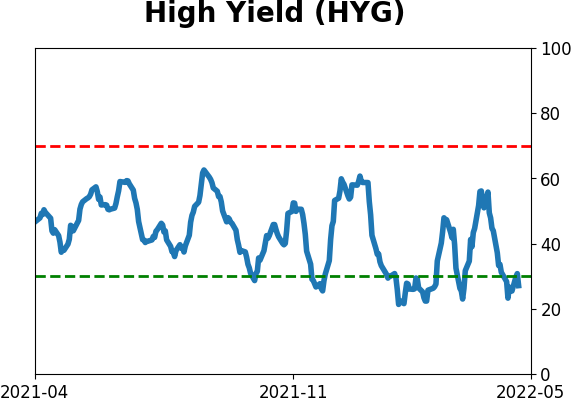
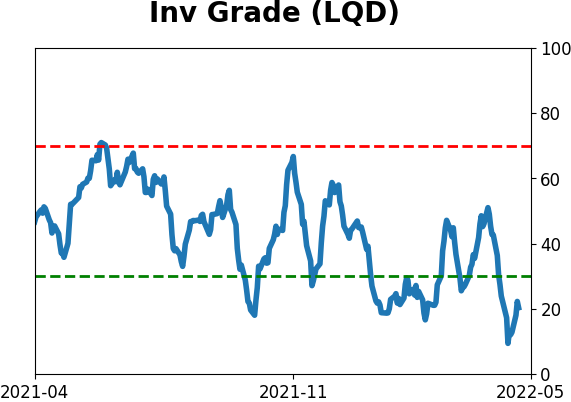
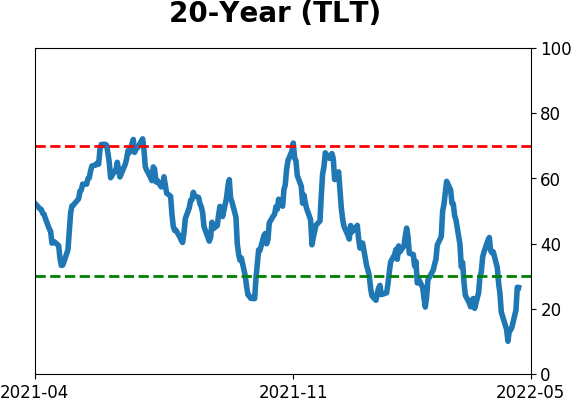
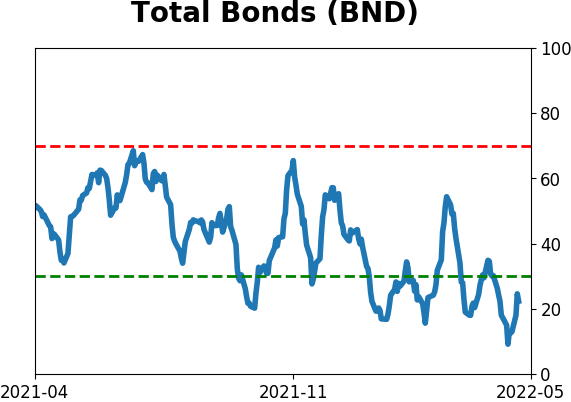
Bond ETF's - 10-Day Moving Average
|
|
|
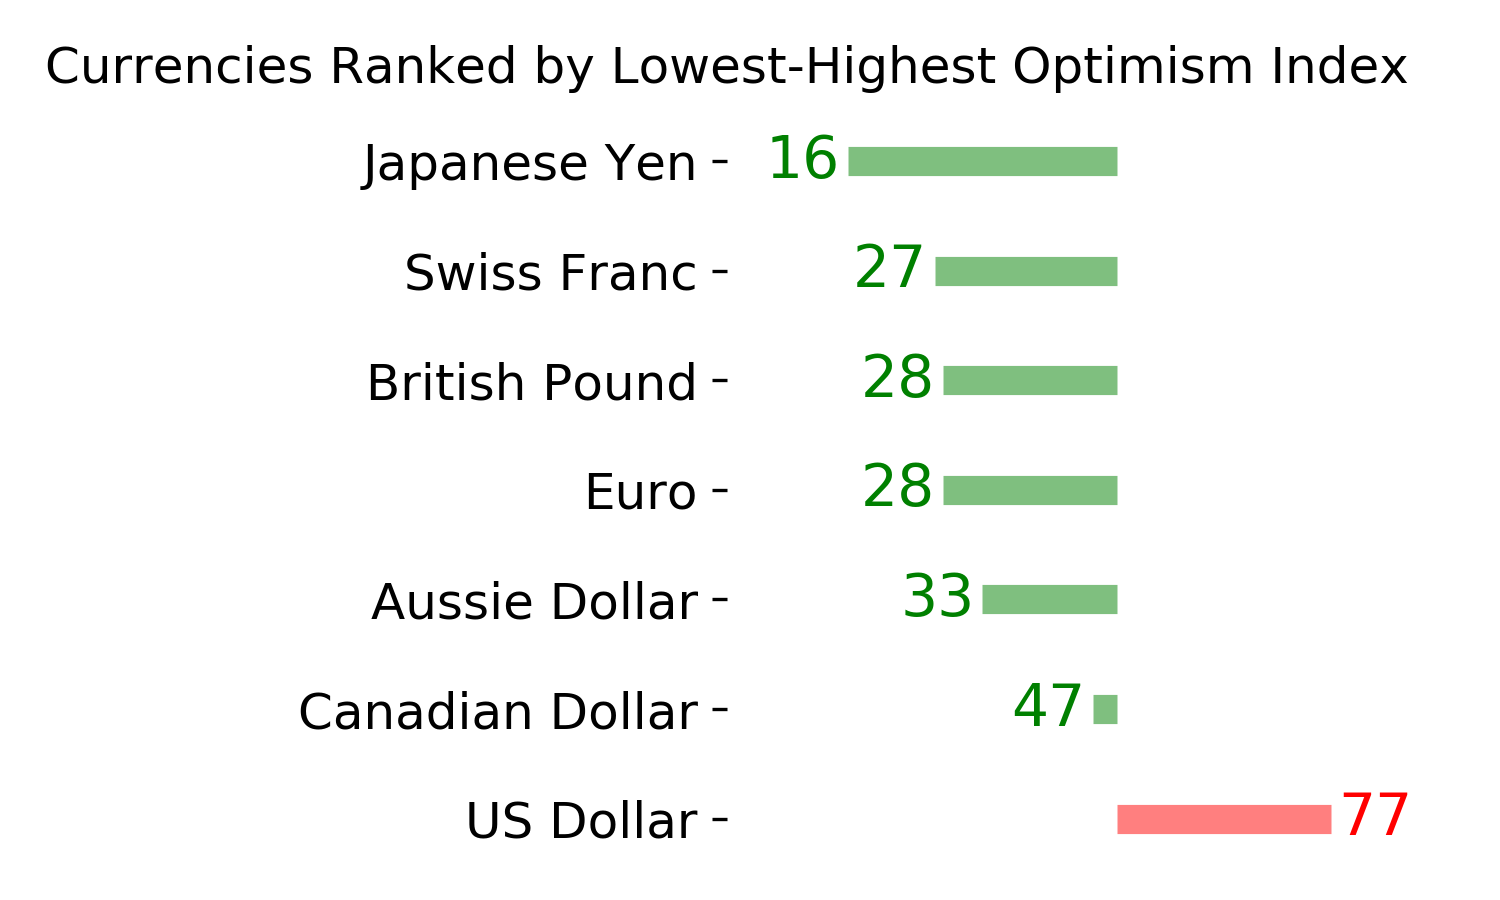
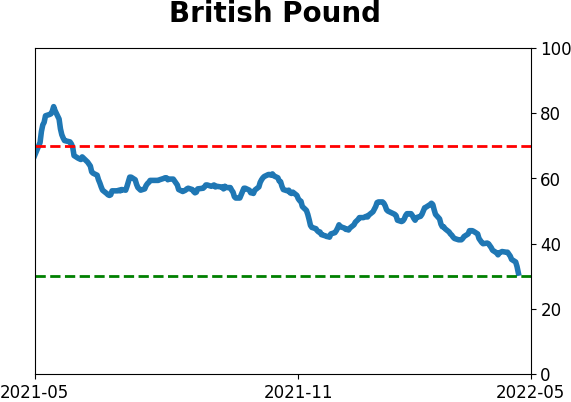
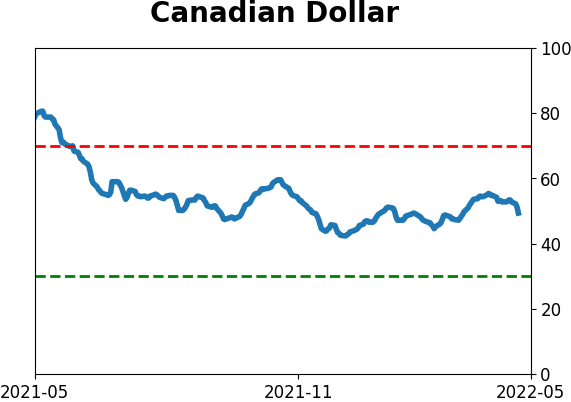
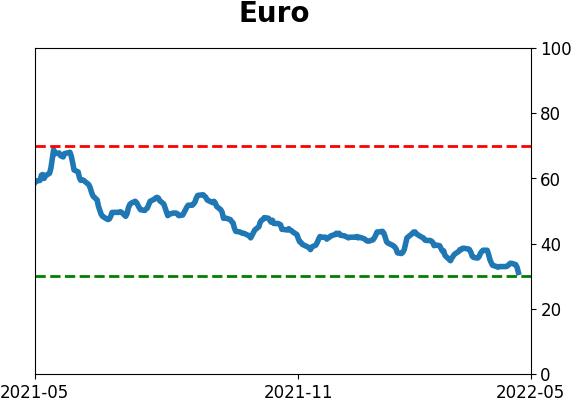
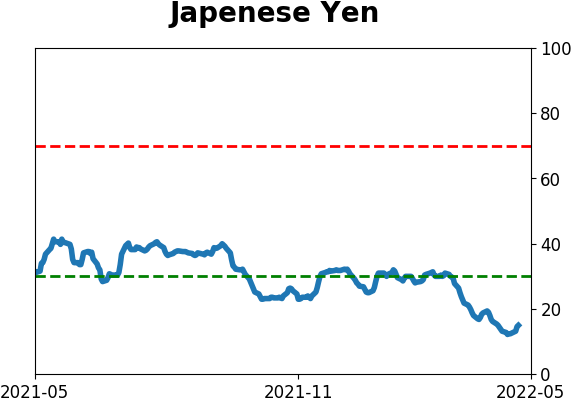
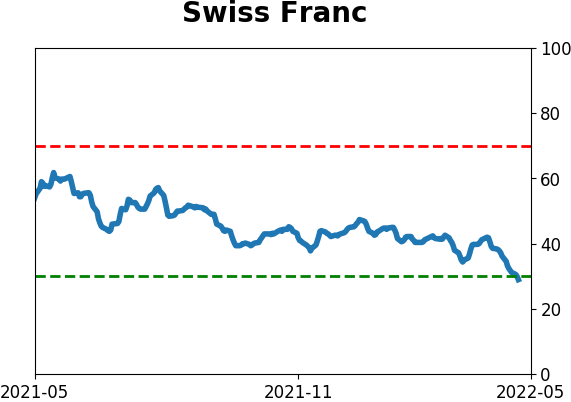
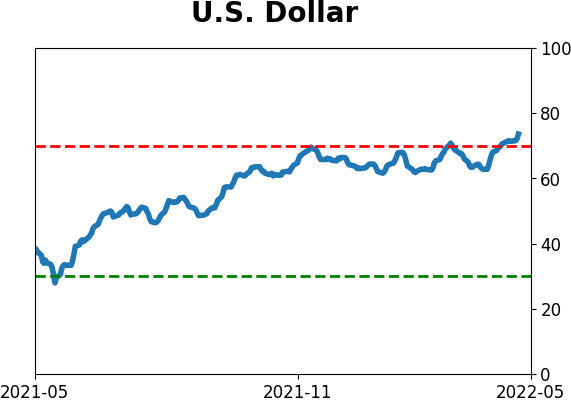
Currency ETF's - 5-Day Moving Average
|
|
|
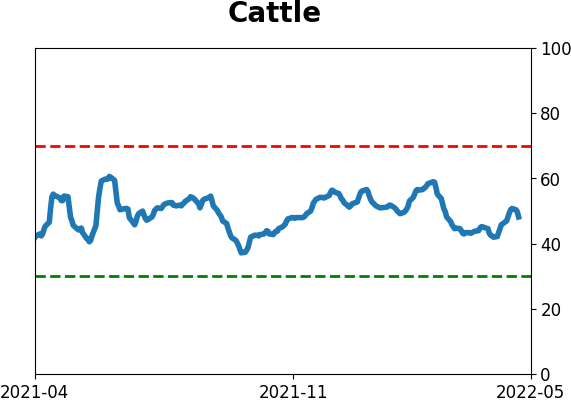
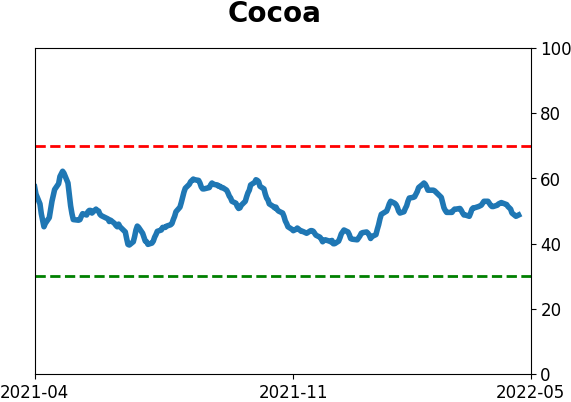
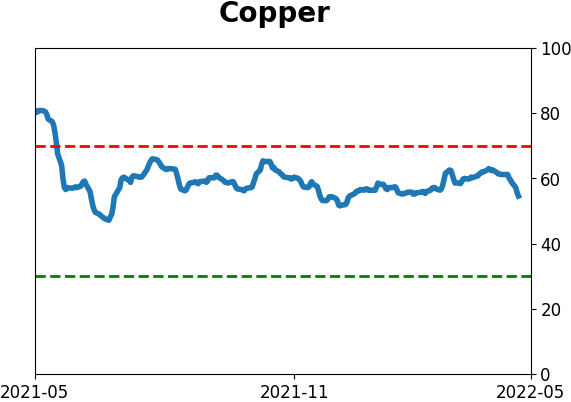
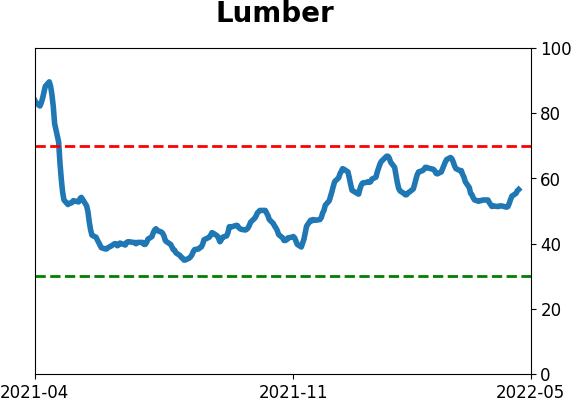
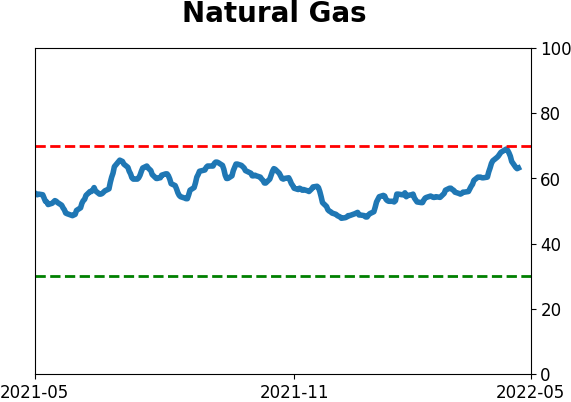
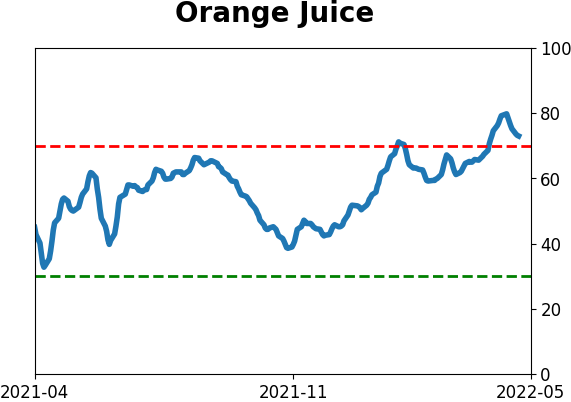
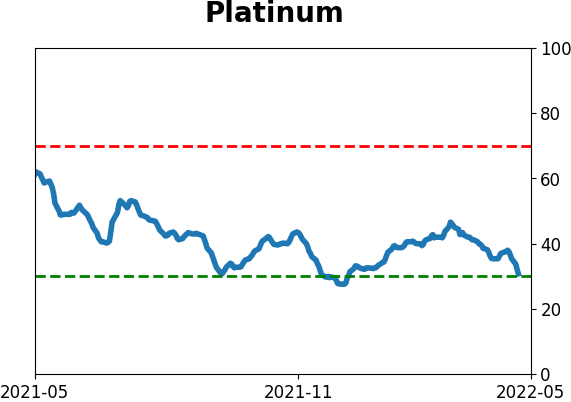
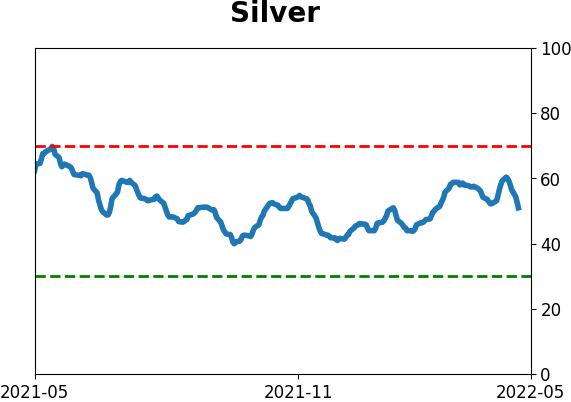
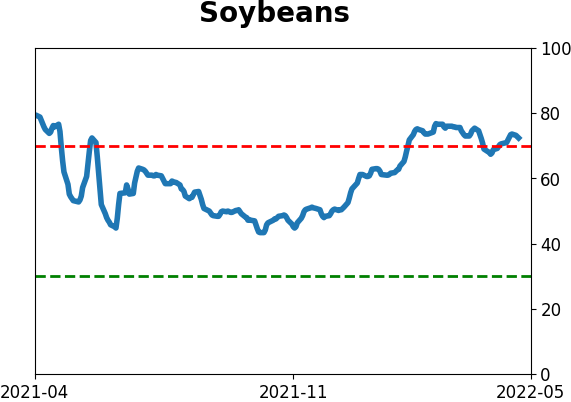
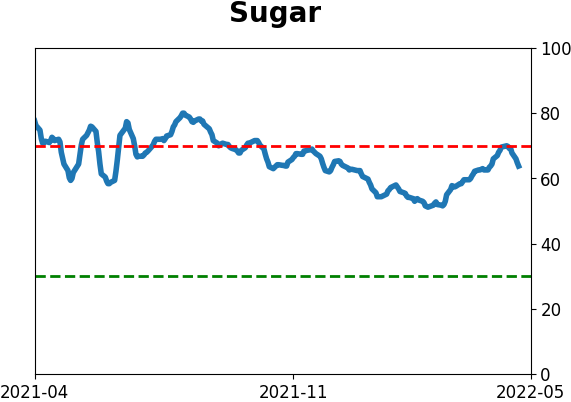
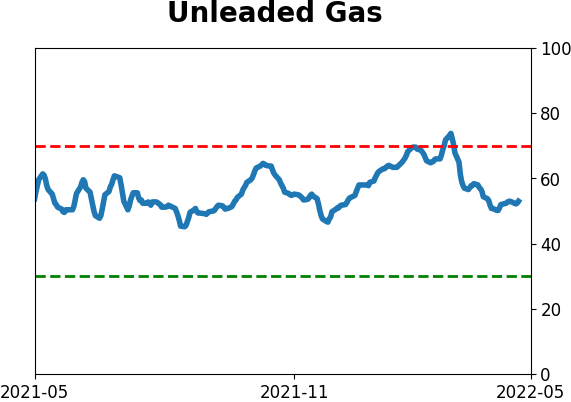
Commodity ETF's - 5-Day Moving Average
|
|