Headlines
|
|
TradingEdge Weekly for Apr 26 - Finally a pullback, oversold conditions, surging sectors:
This week, we saw that the most important equity index in the world finally fell into pullback territory. That generated quite a bit of anxiety and triggered a number of oversold conditions. Sectors like technology and financials registered many oversold stocks. Financials and staples stocks then surged off those conditions. Overall financial conditions remain exceptionally loose, a tailwind for stocks.
|
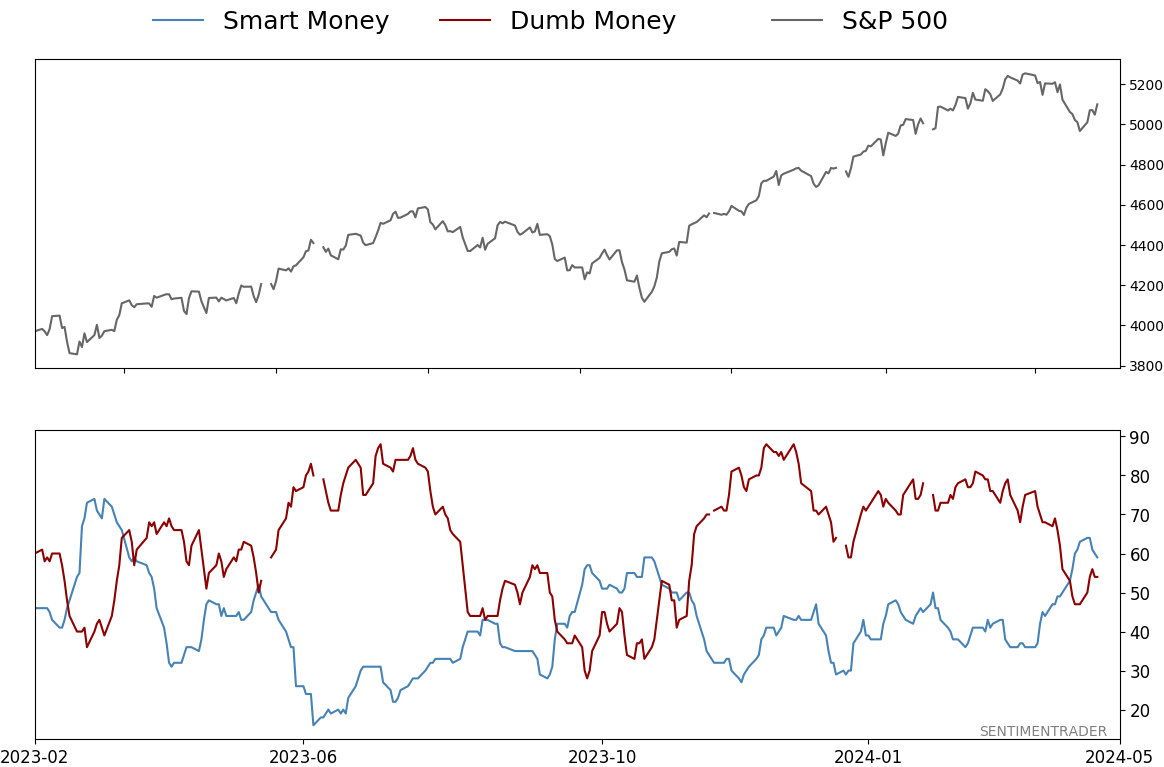
Smart / Dumb Money Confidence
|
Smart Money Confidence: 59%
Dumb Money Confidence: 54%
|
|
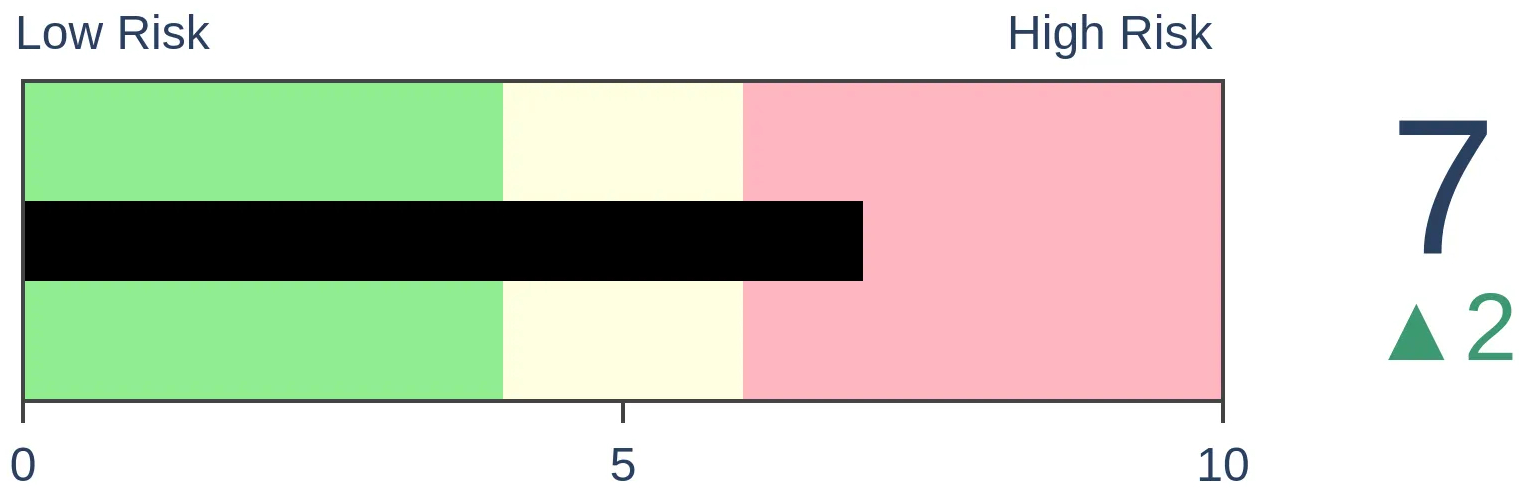
Risk Levels
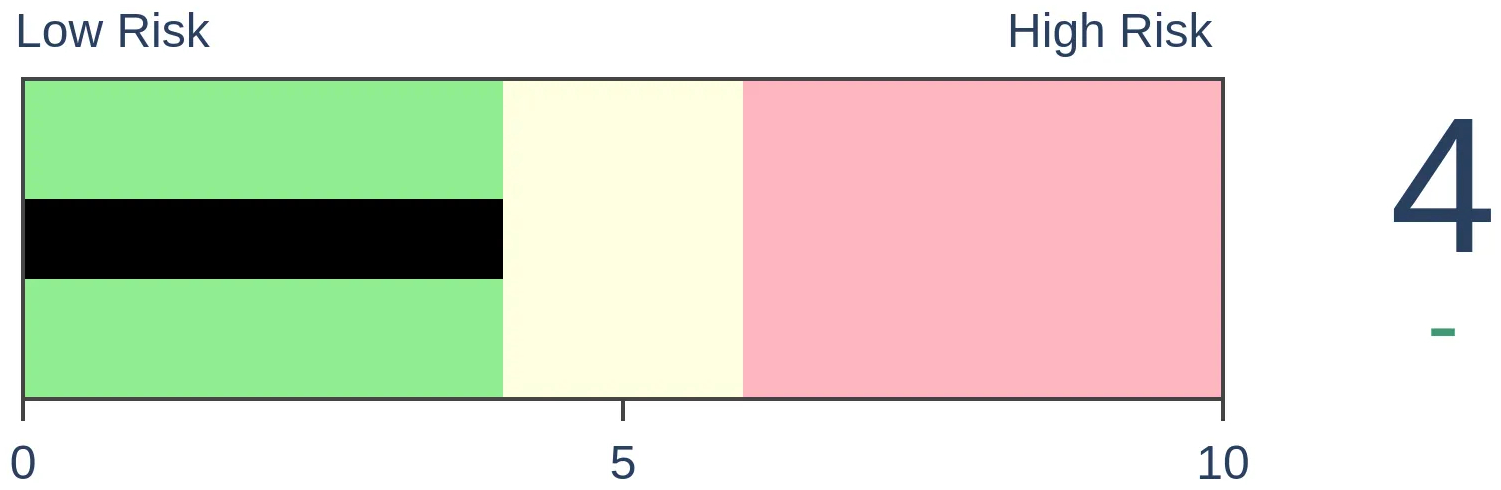
Stocks Short-Term
|
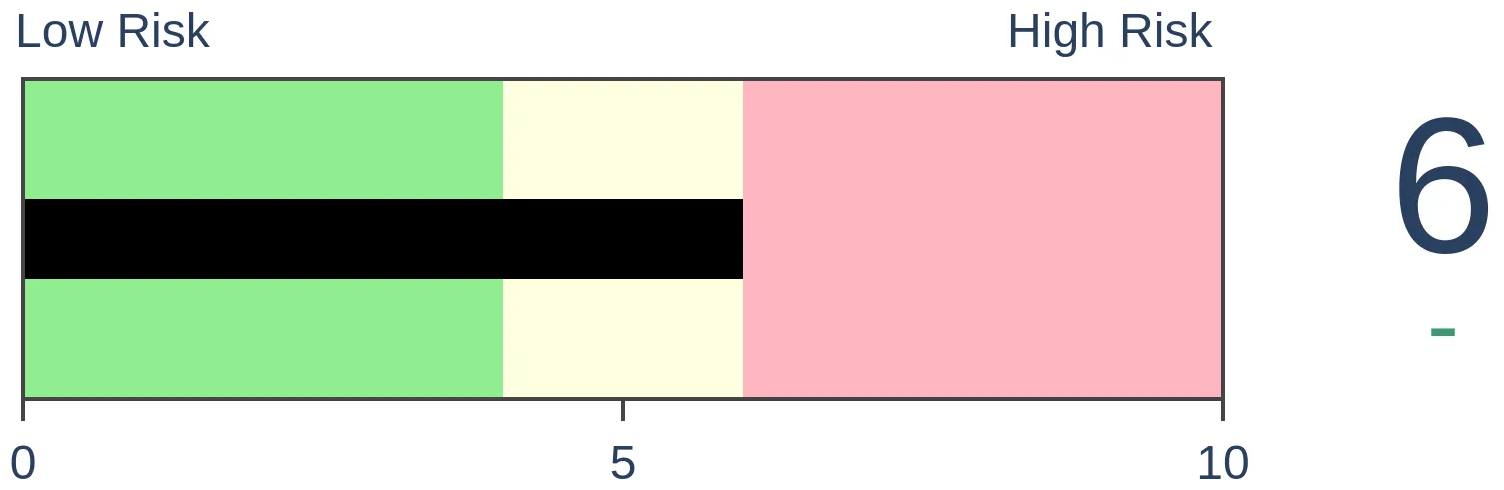
Stocks Medium-Term

|
|
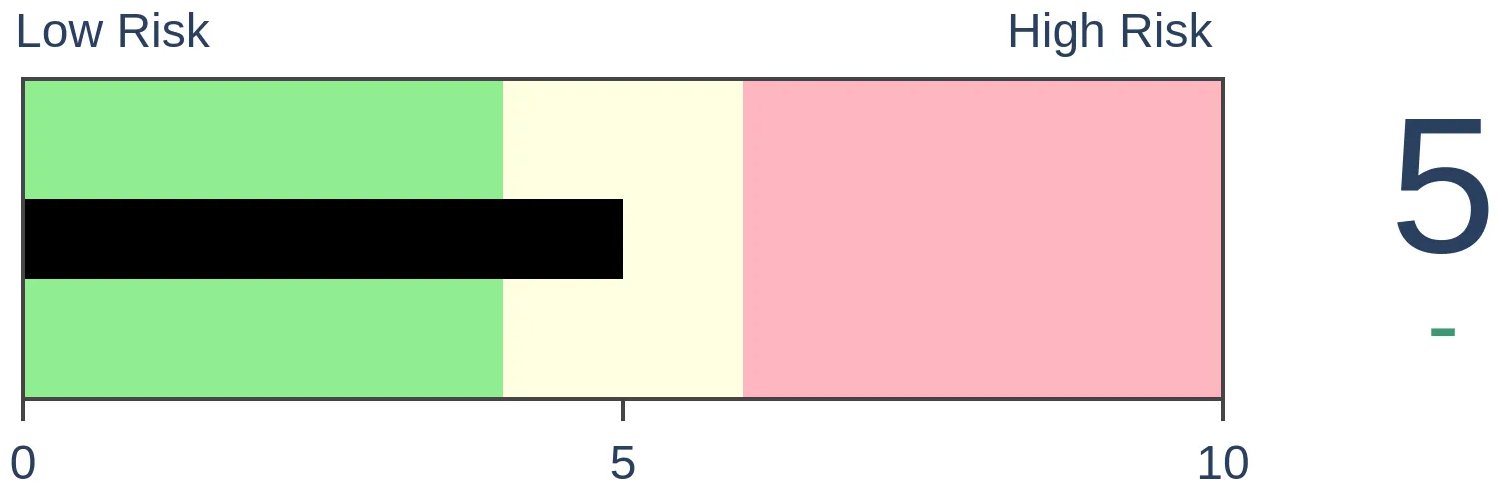
Bonds

|
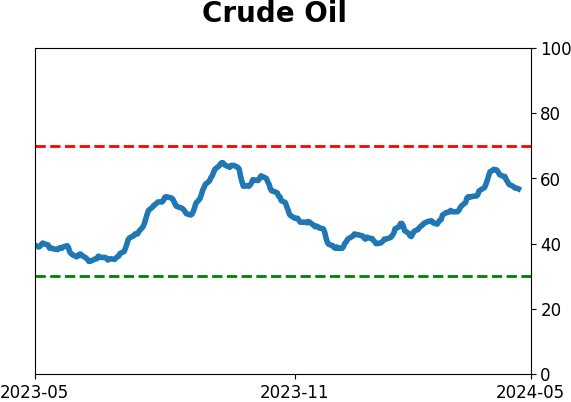
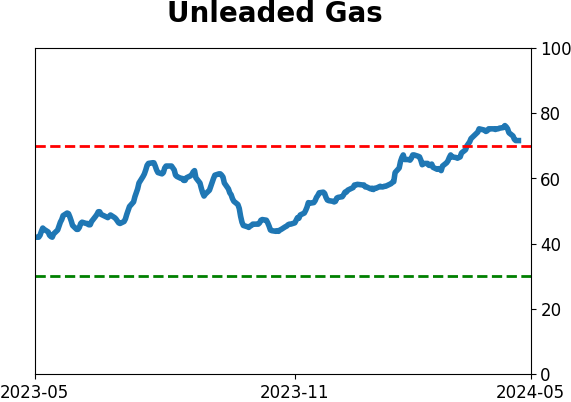
Crude Oil
|
|
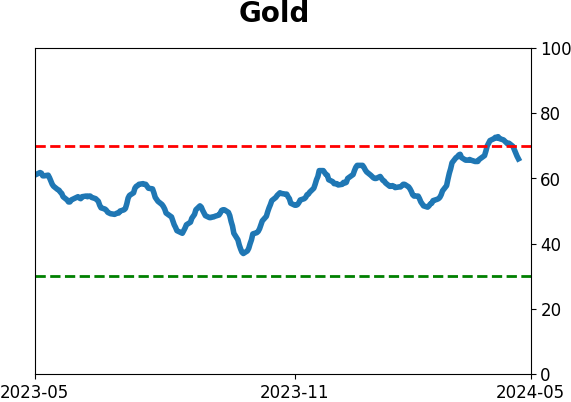
Gold
|
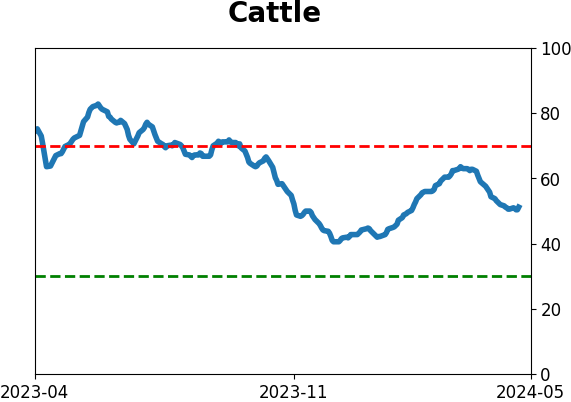
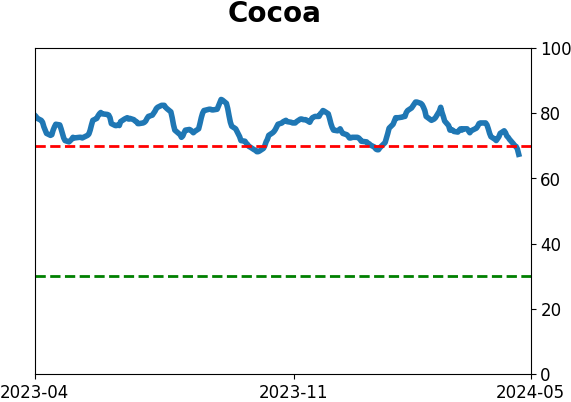
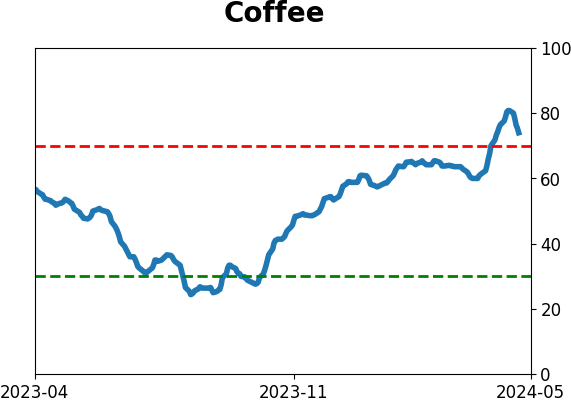
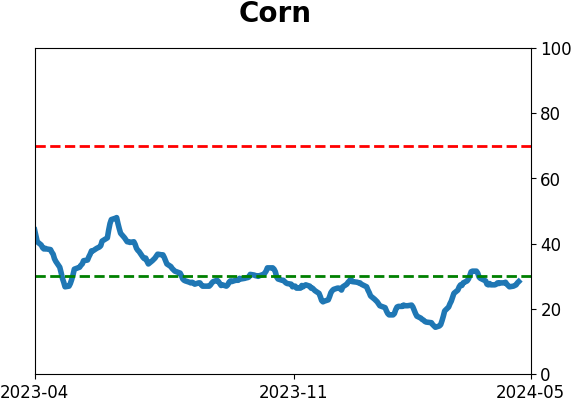
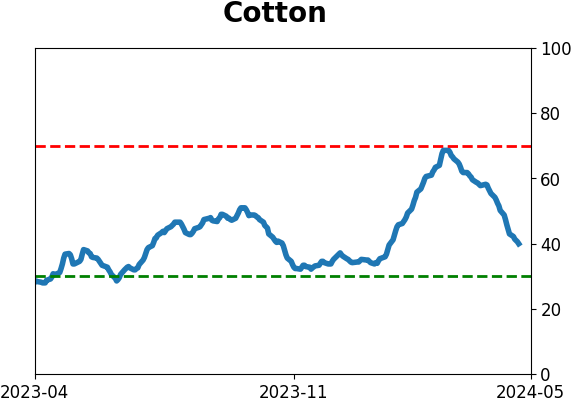
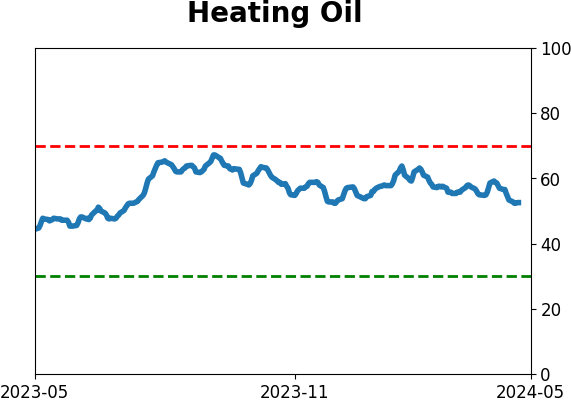
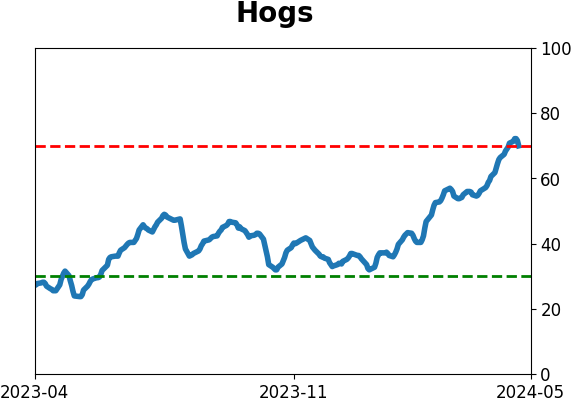
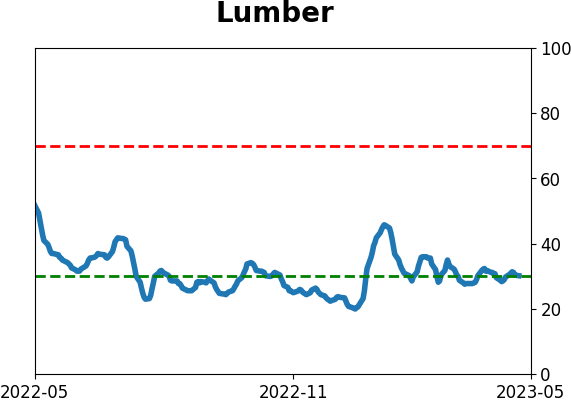
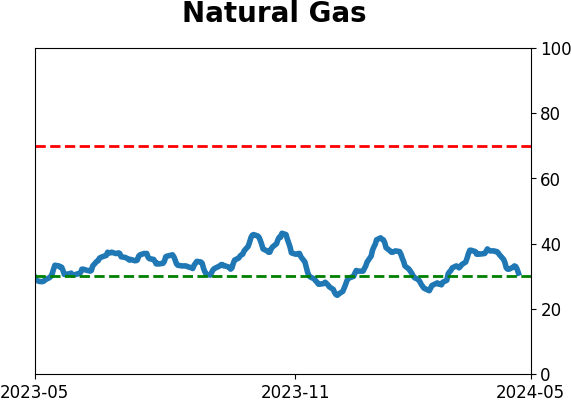
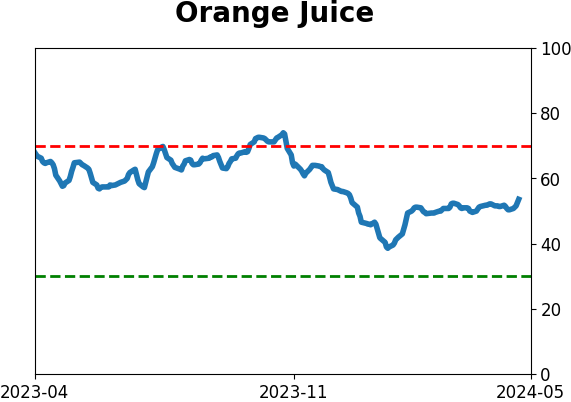
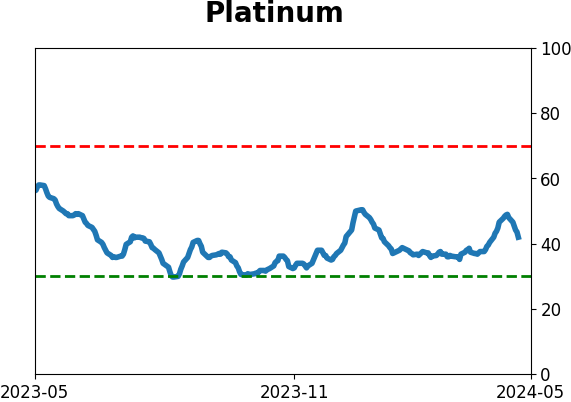
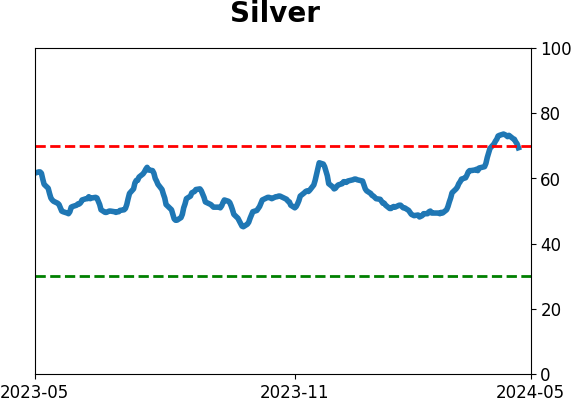
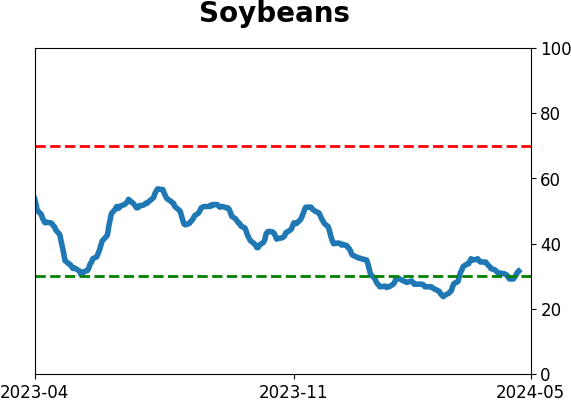
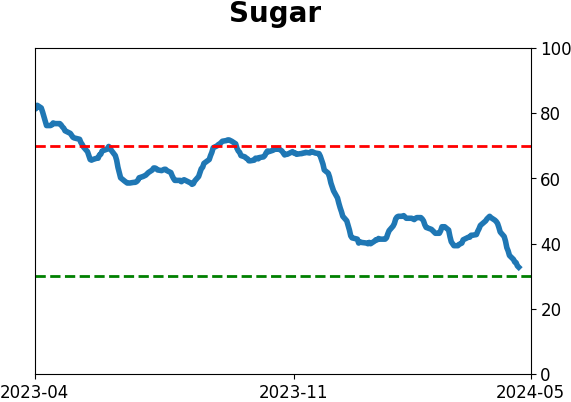
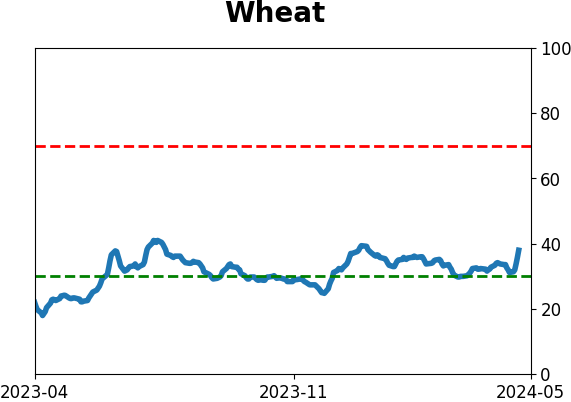
Agriculture
|
|
Research
By Jason Goepfert
BOTTOM LINE
This week, we saw that the most important equity index in the world finally fell into pullback territory. That generated quite a bit of anxiety and triggered a number of oversold conditions. Sectors like technology and financials registered many oversold stocks. Financials and staples stocks then surged off those conditions. Overall financial conditions remain exceptionally loose, a tailwind for stocks.
FORECAST / TIMEFRAME
None
|
Key points:
- The S&P 500 fell into pullback territory for the first time in months
- There were ample signs of oversold conditions
- Financial conditions remain very loose
- Most tech stocks hit oversold levels
- Consumer staples surged, triggering a thrust signal
- Financial stocks surged, as well, coming off an oversold condition in an uptrend
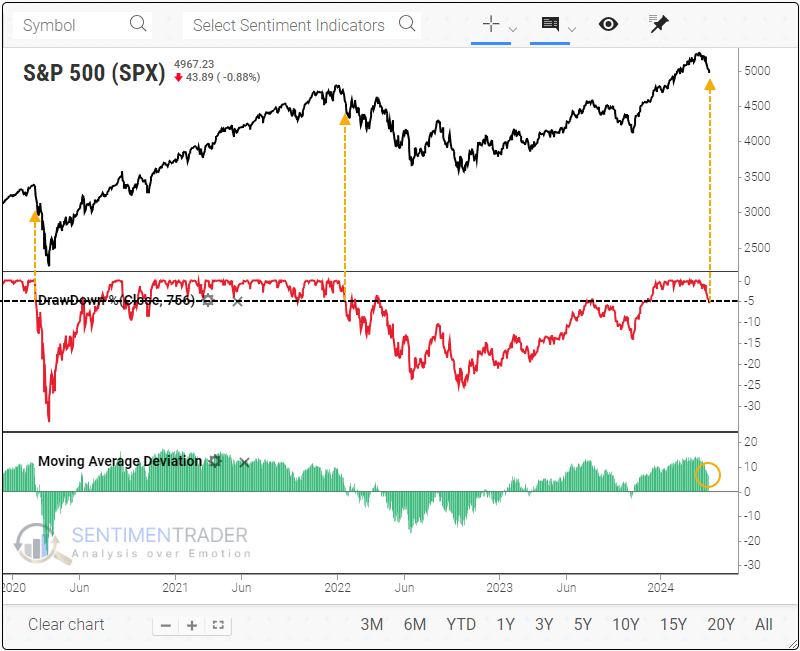
Pullback from an extended trend
For the first time in six months, average investors are facing meaningful losses. The most benchmarked index in the world has finally entered pullback territory of more than 5% off its record high.
And if one wishes to cherry-pick periods of disaster, one could point to two recent initial pullbacks that spilled over into crushing losses for anyone with a short- to medium-term time frame.
When looking at S&P 500 history since 1928, there have been 67 times when the index cycled from an all-time high to a 5% pullback. After most of those, the index recovered without too much more in the way of losses.
When we look at S&P returns after quicker-than-average pullbacks, they were pretty positive, especially over the next month when it rebounded 83% of the time. What's even more notable about the current pullback is that it was quick but came from an extended run. Even after dropping 5% from its high, the index was still more than 5% above its 200-day moving average. When we further filter the quick signals to only those when the S&P was at least 5% above its average at the time of pulling back, returns improved further.
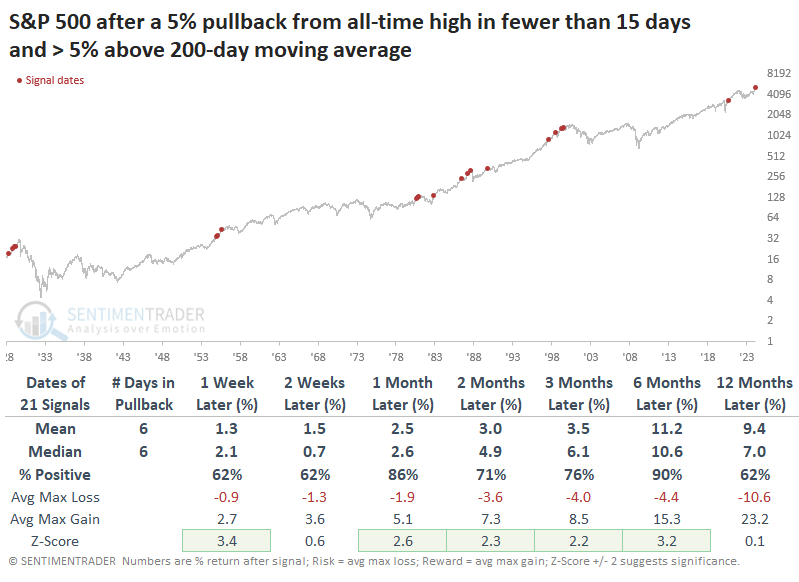
Over the next six months, the S&P rallied 19 out of 21 times. One of those losses was temporary and quickly erased, and it was positive in all earlier time frames. The only actual failure was in 1987 when the index tumbled into the Black Monday crash.
Oversold in an uptrend
For now, the S&P 500 Index remains in an uptrend above its 200-day moving average. Jay noted that at the same time, a variety of indicators are flashing oversold signals.
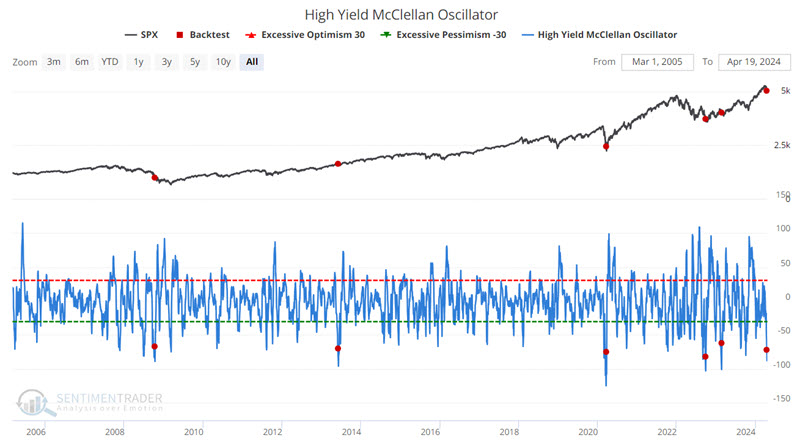
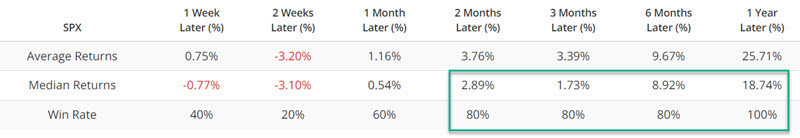
The chart below highlights those dates when the High Yield McClellan Oscillator crossed above -88 (thus indicating a reversal from a deeply oversold condition). The latest signal occurred on 2024-04-17. Recoveries from oversold conditions in high-yield bonds were a consistently positive sign for medium- to long-term returns in the S&P 500.
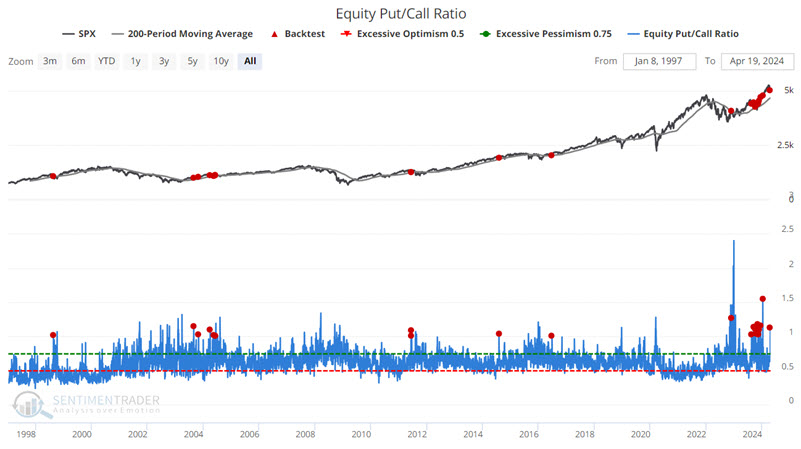
The pullback generated some heavy hedging activity. The chart below highlights those dates when the Equity Put/Call Ratio crosses above 1.00 while the S&P 500 is above its 200-day moving average. Again, such displays of potential fear preceded above-average returns for the S&P in the months ahead.
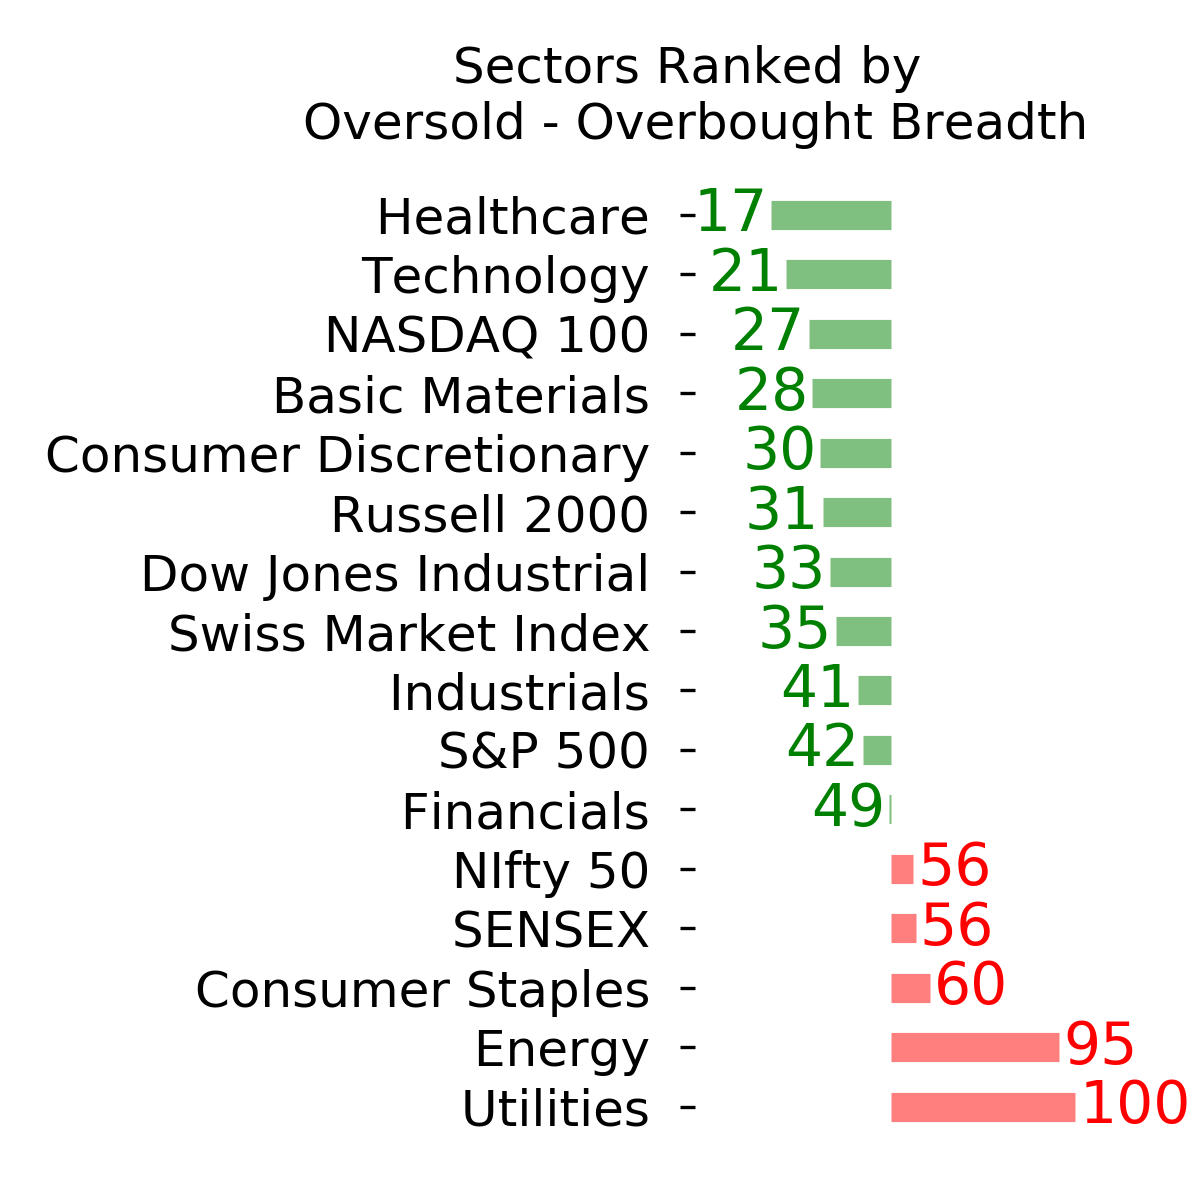
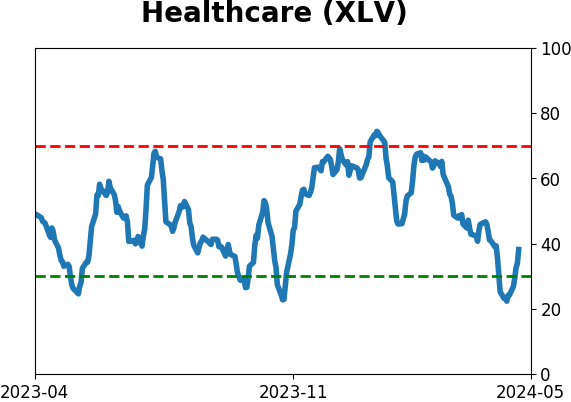
Jay also looked at oversold signals in healthcare and technology stocks, both of which pointed to higher prices for broader indexes like the S&P 500.
Loose financial conditions
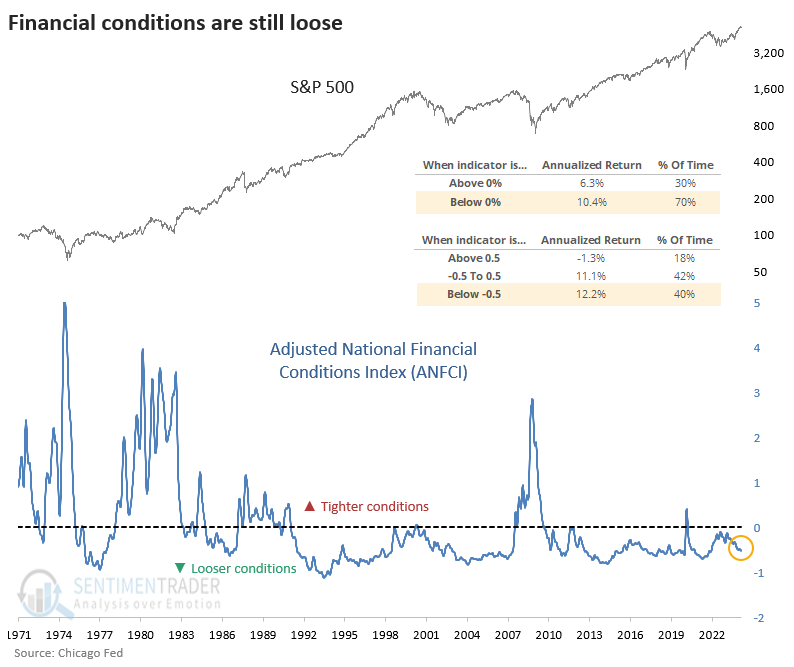
One of the first places that looming disaster will appear in economic reports is tightening financial conditions. There are many such measures, but most follow a similar methodology. They look at broad groups of financial, economic, and credit indicators to determine whether overall conditions are getting better (looser) or worse (tighter).
In the latest release of the Chicago Fed version, the vast majority of inputs are not only looser than average, they are loosening more than tightening.
The chart below shows the ANFCI against the S&P 500 over the past 50 years. The chart shows that when the index is below zero, the S&P 500 has returned an annualized +10.4%, versus only +6.3% when the index is above zero. And when it is below -0.5, which it was as of the latest reading, the return rises further to +12.2%. When it was above +0.5, the S&P's returns cratered to -1.3%. So, it's no surprise that the looser the conditions, the better it was for stocks.
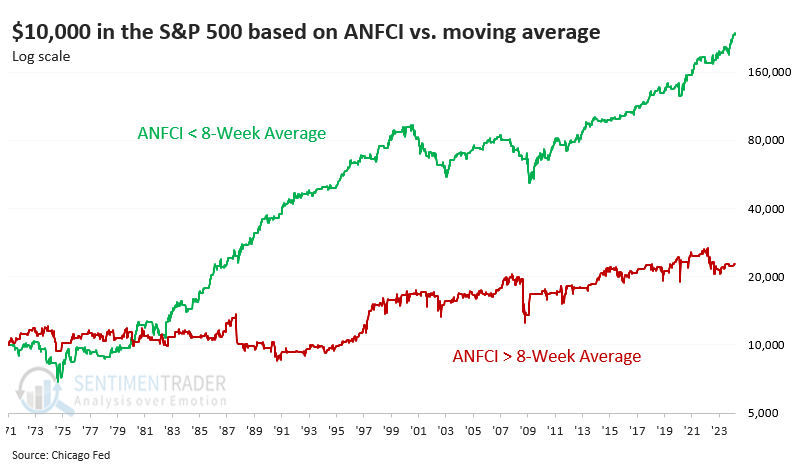
Let's test what happens if we hold the S&P for the next week only if the ANFCI is below its 8-week average (showing loosening financial conditions). We'll sit in cash if it's above its 8-week average (tightening conditions). We're assuming no return on cash.
Using this method, an investor's $10,000 would have turned into $233,022 during loosening conditions but only $22,683 when conditions tightened. They would have still suffered some drastic drawdowns, so it's not like it was a no-risk ride to utopia. However, it is a reminder that as long as conditions are loose - especially if the trend is still loosening - forward returns tend to be drastically better.
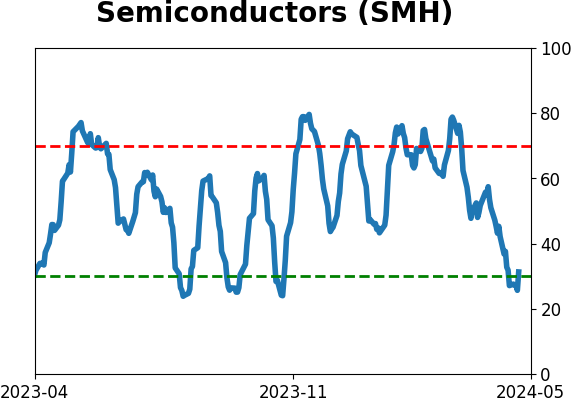
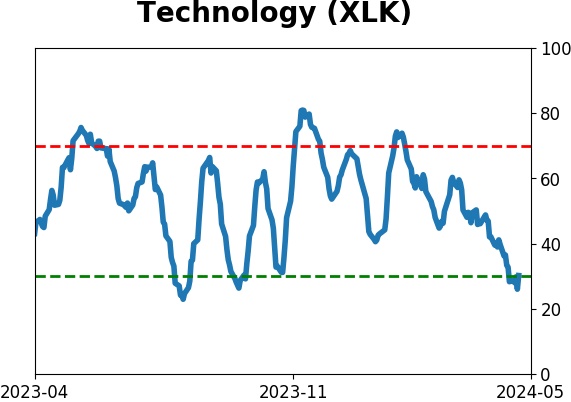
Oversold tech
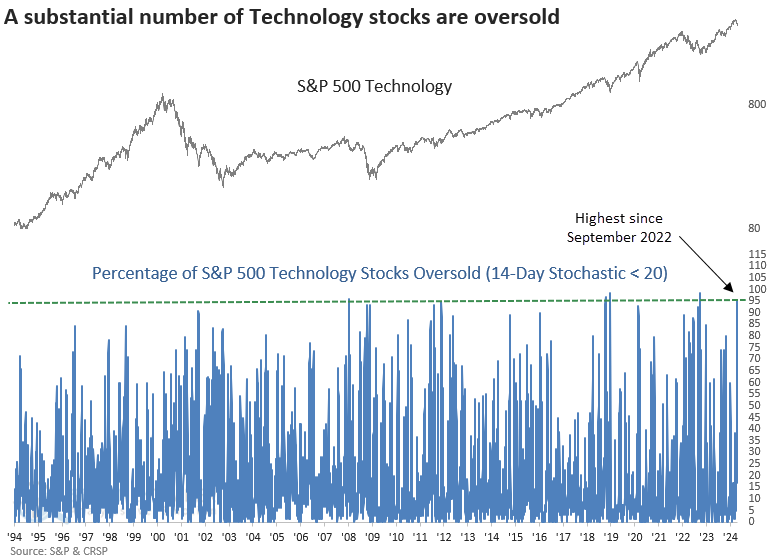
Dean showed that technology stocks reaching an oversold status increased to one of the highest levels in history. Similar oversold conditions suggest the sector could be in the penalty box over the next month.
On Friday, the proportion of S&P 500 Technology stocks hitting oversold levels, as indicated by their 14-day stochastic readings dropping below 20, surged past 95%, a phenomenon observed merely 17 times since 1953.
When the percentage of S&P 500 Technology stocks reaching an oversold status exceeds 95%, the sector tended to bounce back over the subsequent week. However, it was most likely a countertrend move in a corrective phase, as indicated by the negative outlook over the two-week horizon. Twelve months later, the sector saw gains 81% of the time, though it wasn't entirely immune to significant risks.
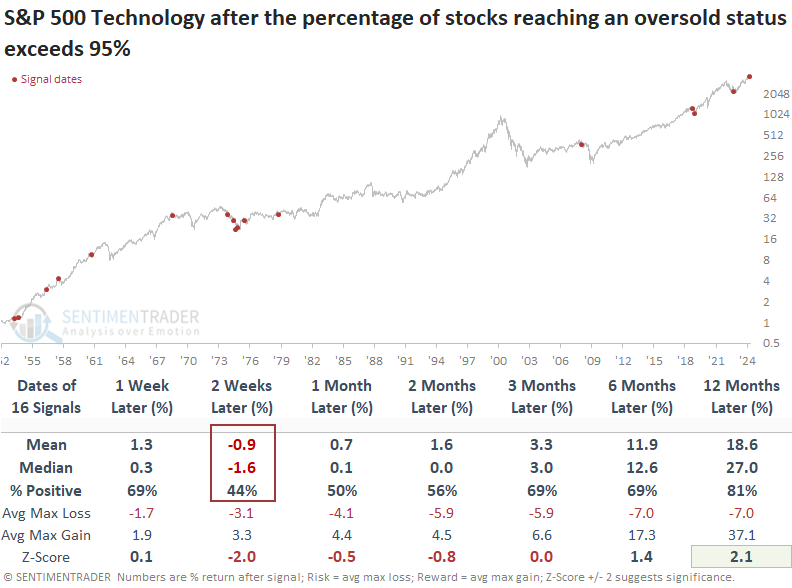
Following precedents occurring within 10% of a high, like now, we see a stagnant outlook over the ensuing month. A year later, the sector was higher every time, albeit with a small sample size, comprised mainly of older instances.
The significant downside price action in the S&P 500 Technology sector triggered one of the most severe shifts in history for a composite model that measures relative trends. For only the 14th time since 1971, a Composite Relative Trend Model score declined by 12 points over one week. A substantial relative trend score change like the one triggered on Friday has produced mostly negative returns for the S&P 500 Technology sector.
Staples surged
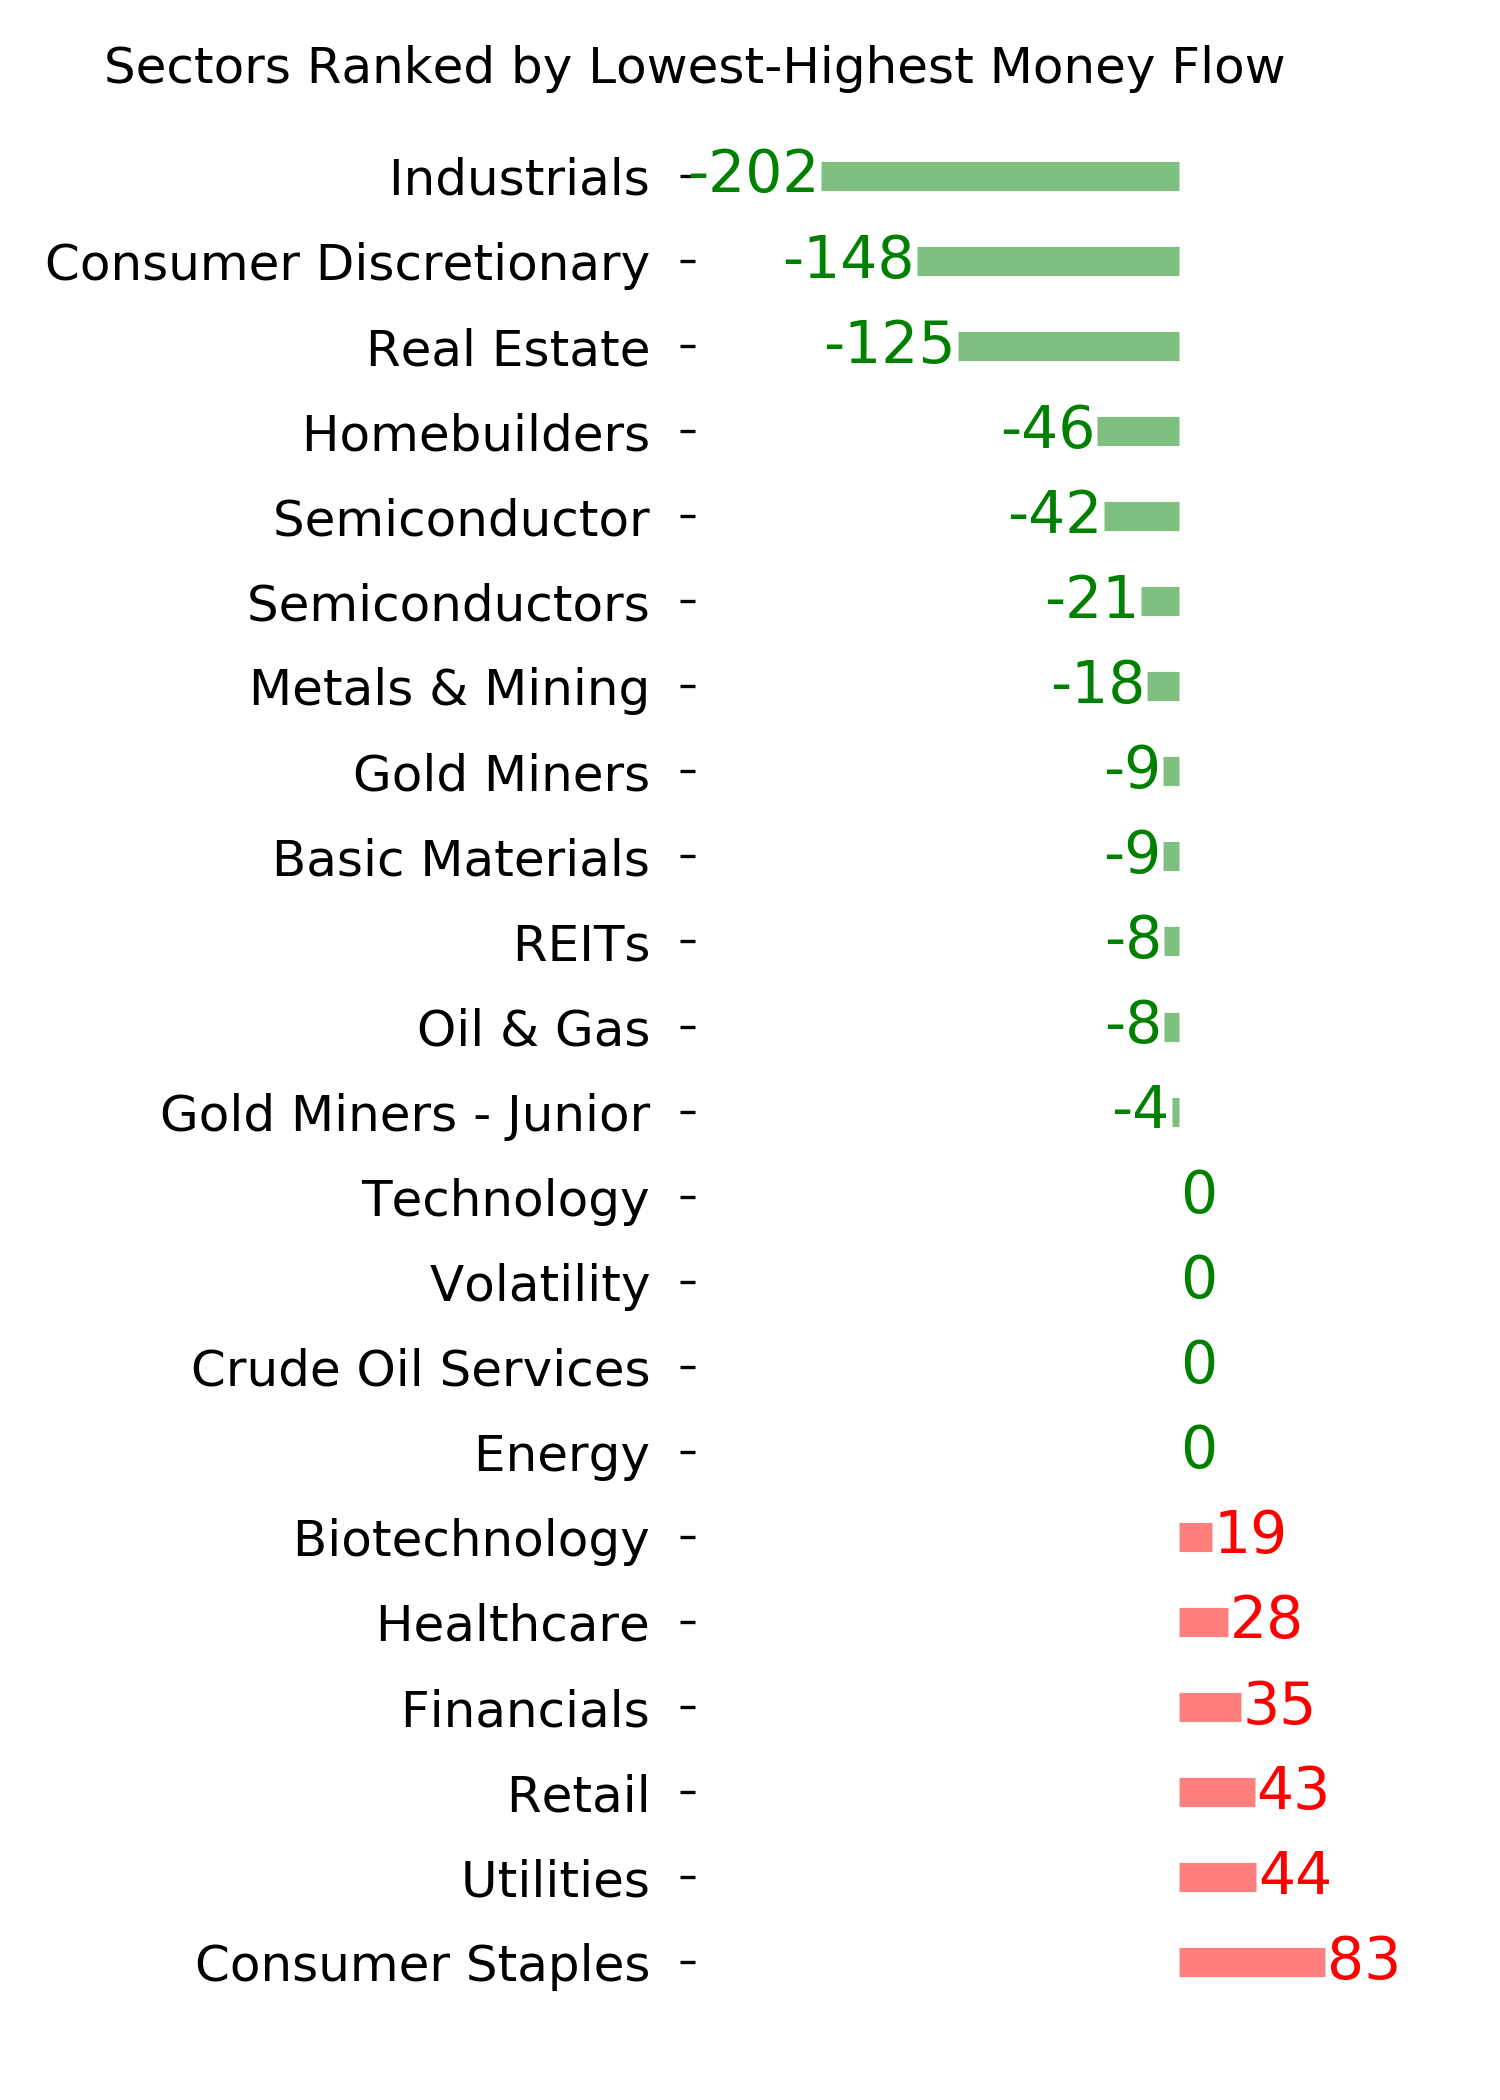
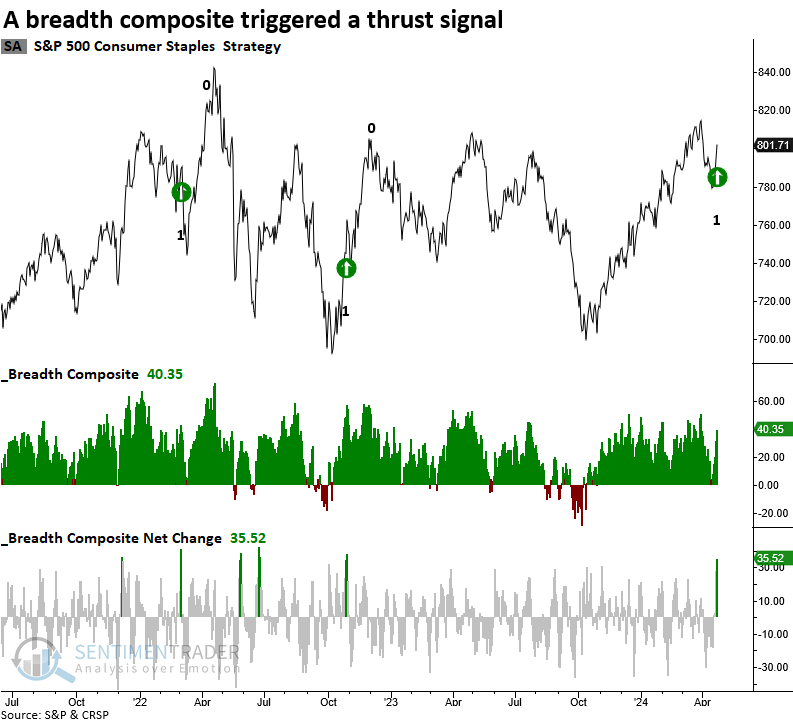
The Consumer Staples sector triggered a breadth composite net change thrust signal. Dean noted that similar thrusts produced excellent returns and win rates across all time frames.
Despite initially tracking the downward trajectory of major indices like the S&P 500 in recent weeks, defensive sectors such as Consumer Staples and Utilities exhibited signs of resilience early last week. One of the sectors, Consumer Staples, triggered a thrust signal when the five-day net change for a breadth composite surged by 35%.
Following a breadth composite net change thrust signal, the Consumer staples sector exhibited excellent returns and win rates over all time horizons. Additionally, the one-month horizon has shown a gain for 13 consecutive signals.
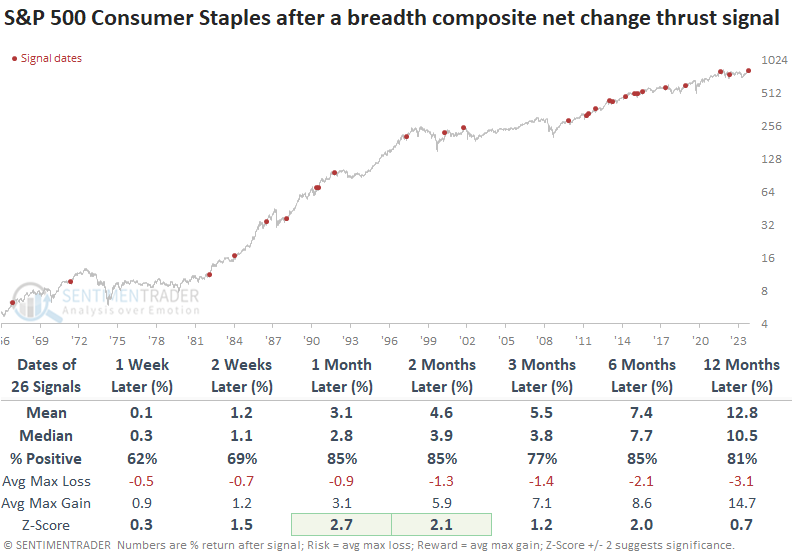
Over the subsequent one- and two-month horizons, the Staples sector outperformed the S&P 500. Unsurprisingly, the traditionally defensive group lagged the world's most benchmarked index over long-term horizons.
This most recent signal occurred with the S&P 500 down less than 5% from its recent high. After similar precedents, win rates improved across all but one horizon. While median returns improved in some cases, it's crucial to remember that these signals triggered near highs, where returns tend to be lower than instances coming out of significant corrections or bear markets.
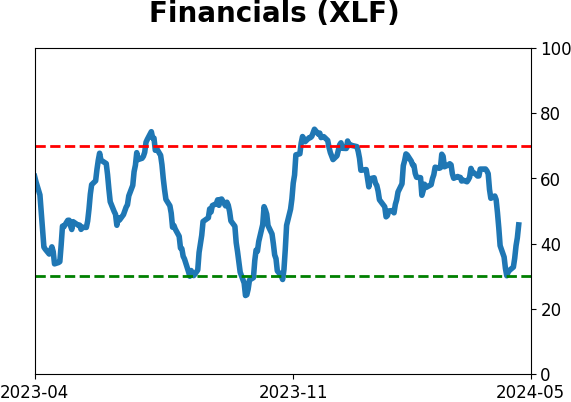
Financials surged, too
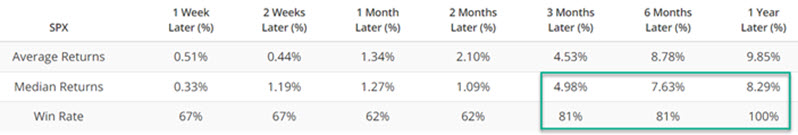
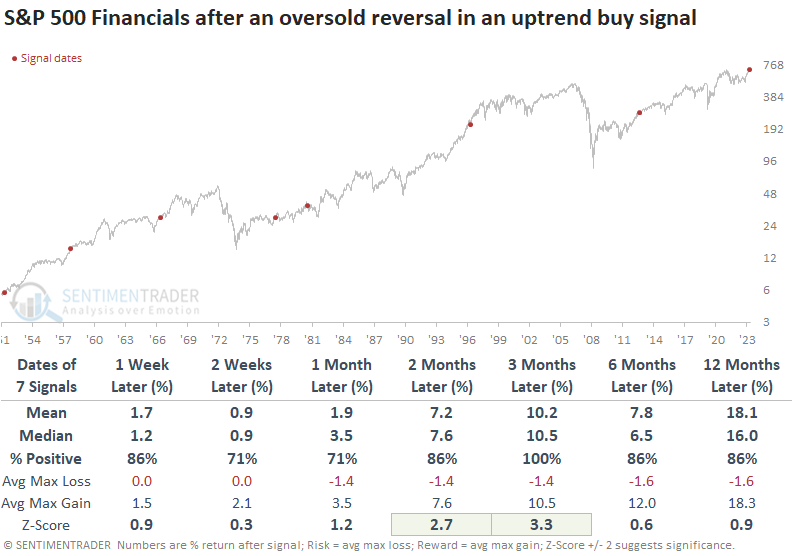
Dean also noted the S&P 500 Financials sector surged from an oversold condition within the context of favorable trends. Similar reversals saw the sector rally 100% of the time over three months and 86% of the time a year later.
Last week, most S&P 500 stocks reached an oversold status, setting up potential thrust or reversal signals. The S&P 500 Financials triggered a bullish signal when the percentage of stocks trading above their 10-day average surged above 80%, following more than 80% of the issues achieving an oversold condition. This surge from an oversold status occurred within the context of more than 80% of members closing above their 200-day average (an 80-80-80 signal).
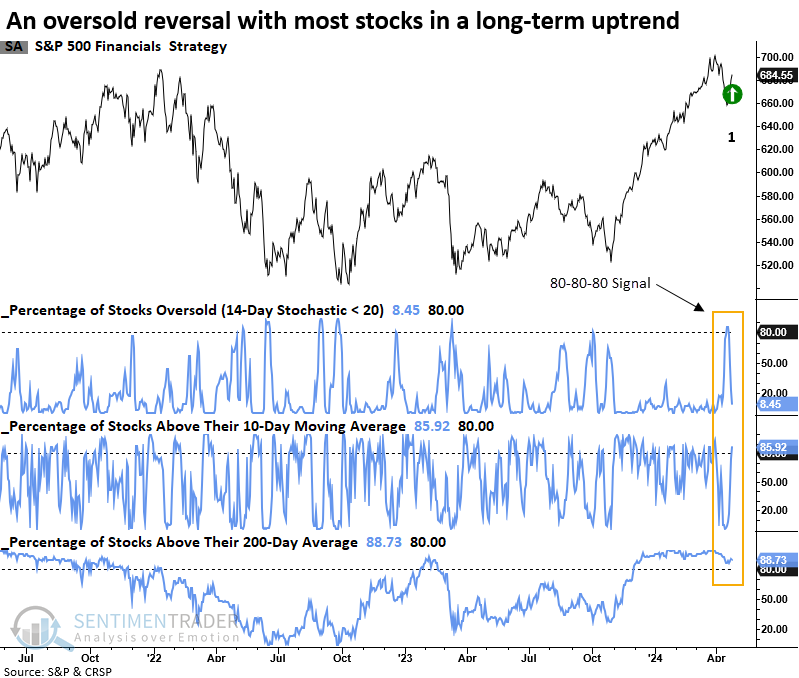
When financial sector stocks reach an oversold status and subsequently surge within the context of most stocks exhibiting long-term uptrends, the outlook for S&P 500 Financials suggests the prior uptrend resumes.
Over the following three months, S&P 500 Financials rallied 100% of the time, with a median return that displayed significance relative to returns over the study period. A year later, the sector was higher in all but one case.
If we lower the threshold for the percentage of S&P 500 Financial sector stocks reaching an oversold status and the percentage above the 200-day from 80% to 70% to capture a larger sample size, the outlook for financials remains favorable, with the sector rising 83% of the time over the subsequent three and twelve months. Over the subsequent year, S&P 500 Financials outperformed the S&P 500 index in all but a single time frame.
About TradingEdge Weekly...
The goal of TradingEdge Weekly is to summarize some of the research published to SentimenTrader over the past week. Sometimes there is a lot to digest, and this summary highlights the highest conviction or most compelling ideas we discussed. This is NOT the published research; rather, it pulls out some of the most relevant parts. It includes links to the published research for convenience, and if you don't subscribe to those products, it will present the options for access.
Indicators at Extremes
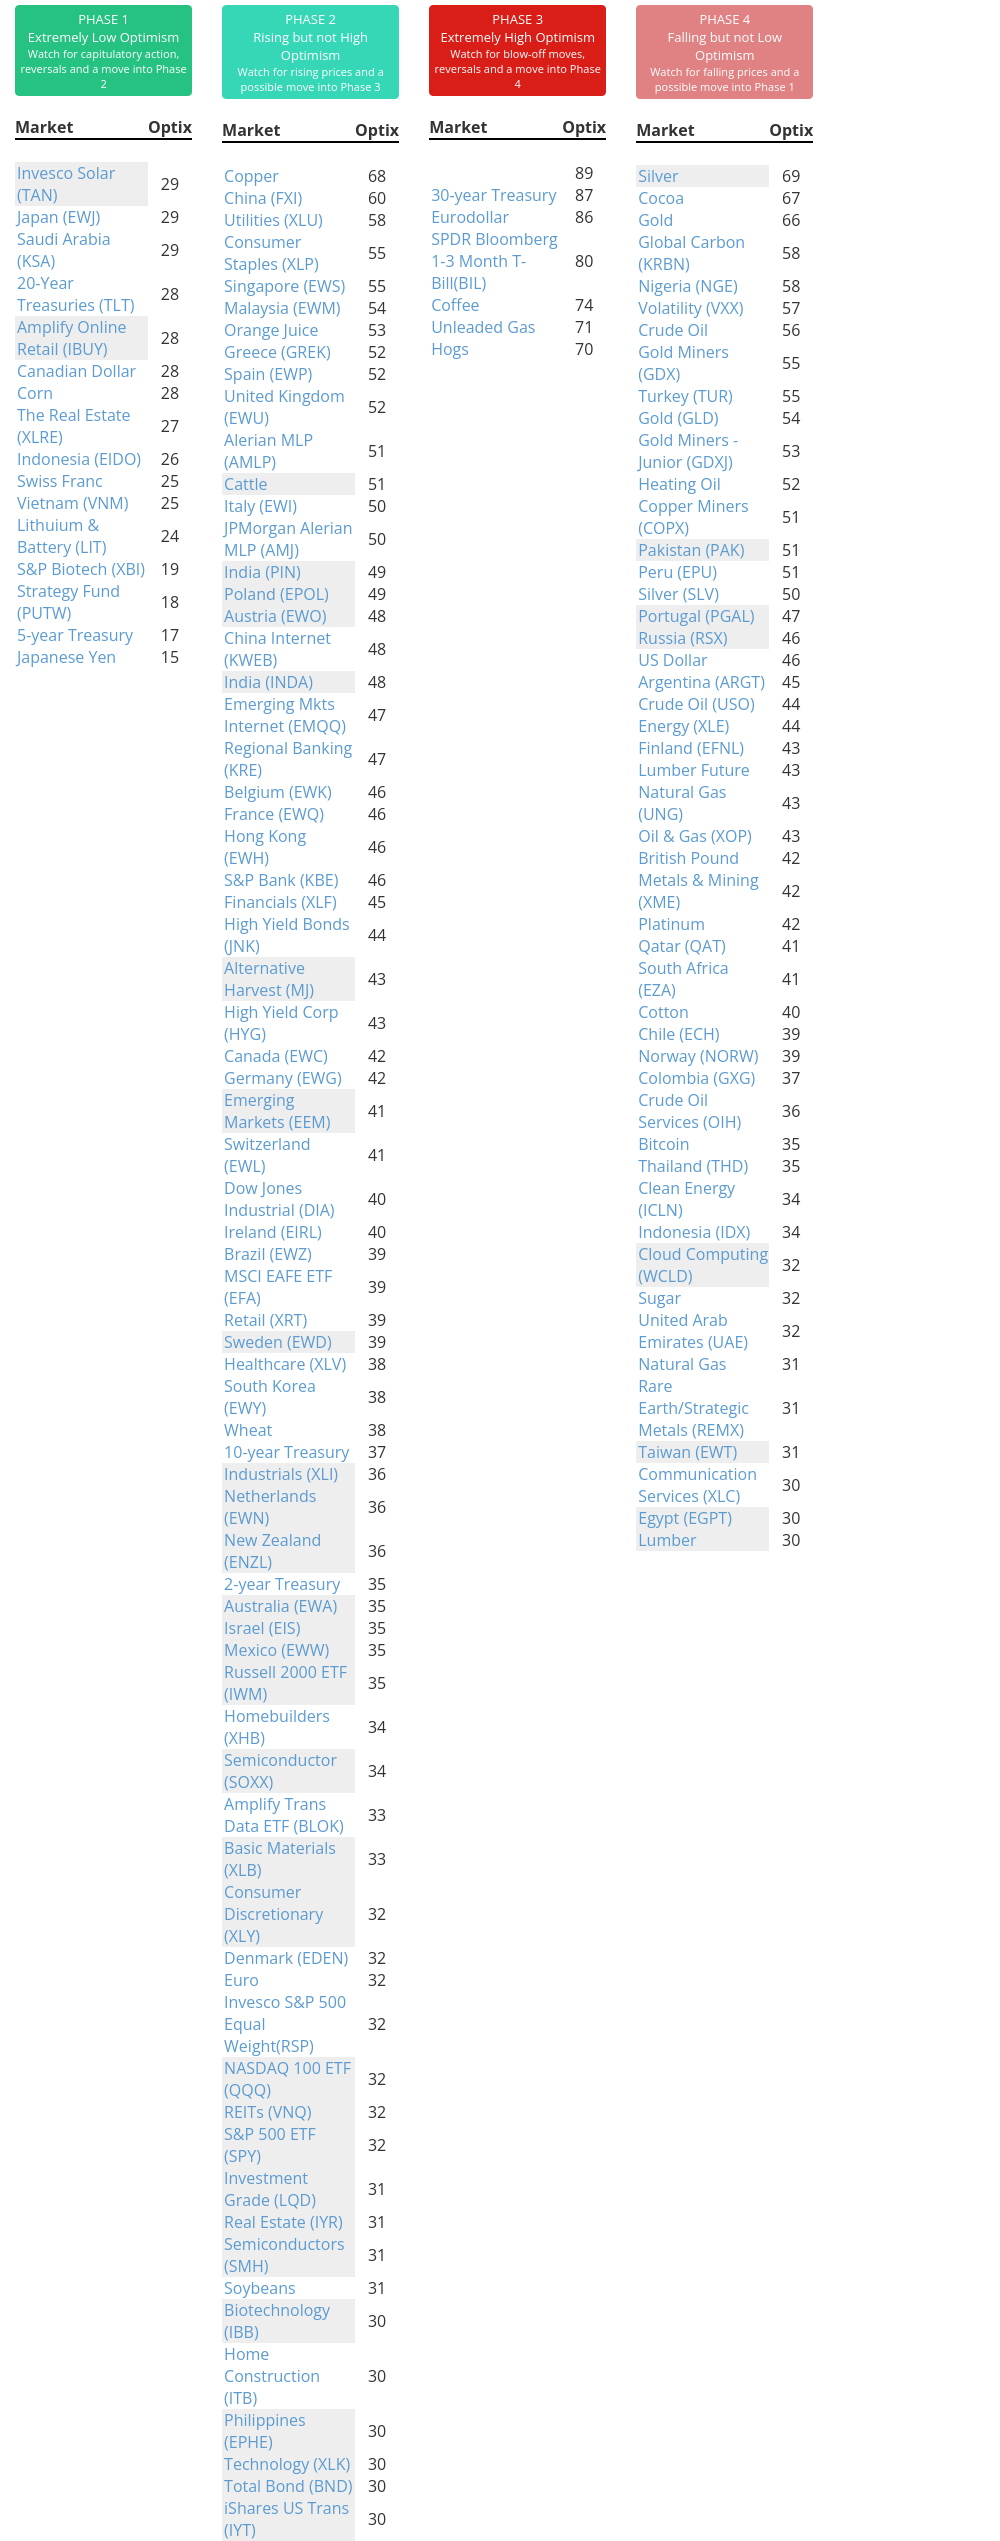
Phase Table
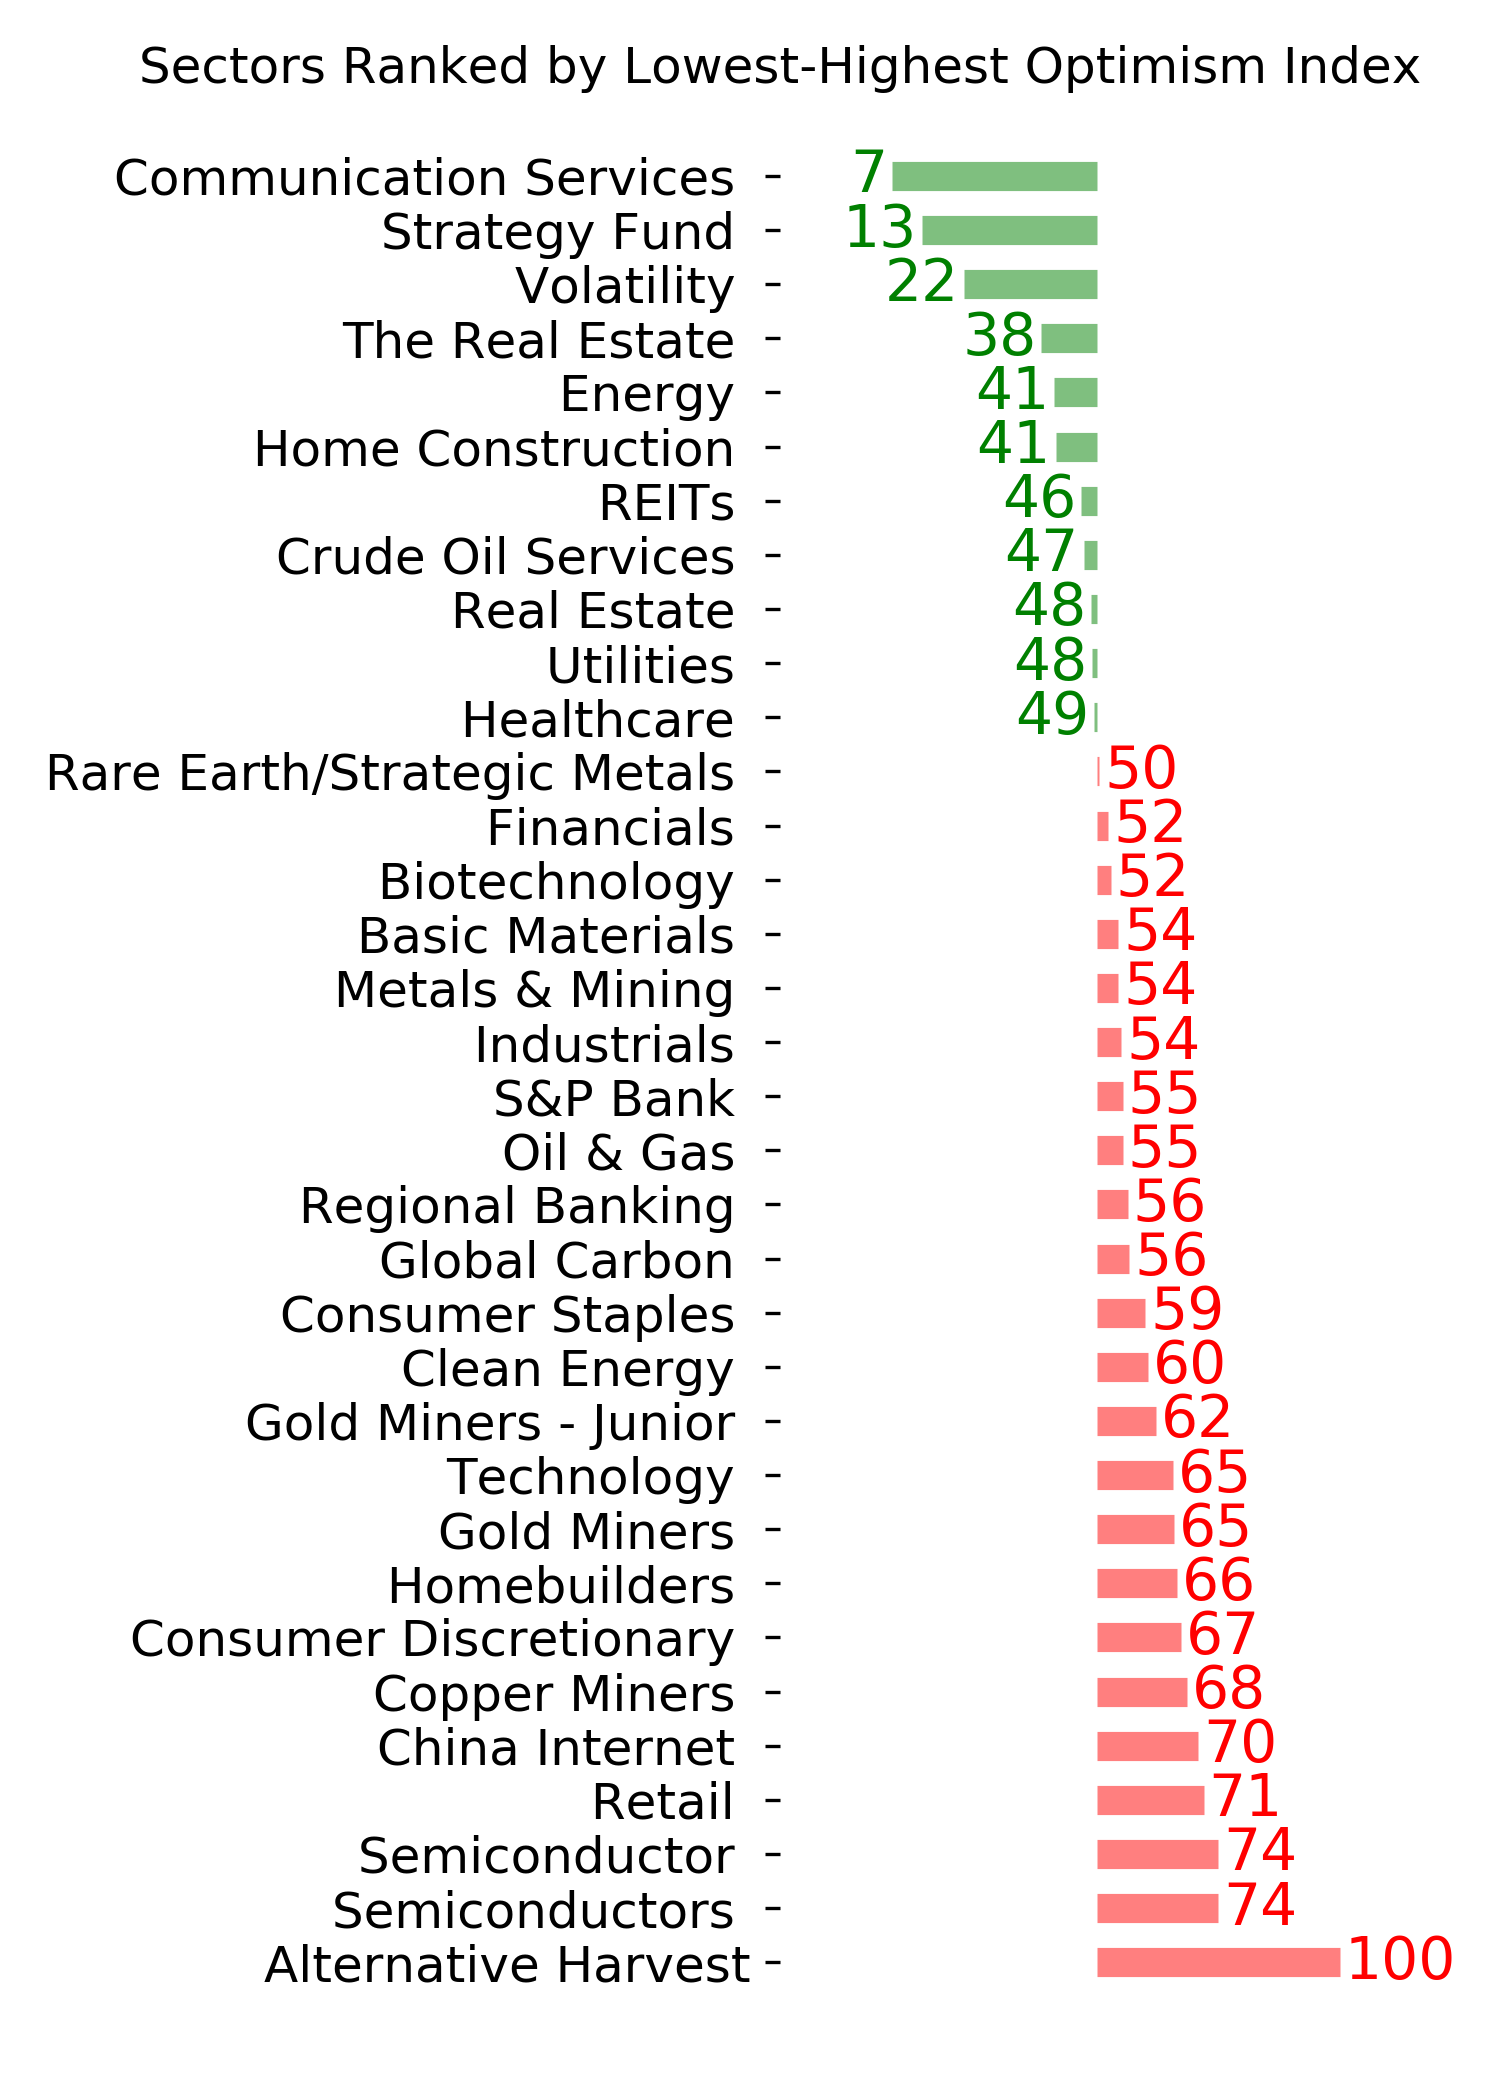
Ranks
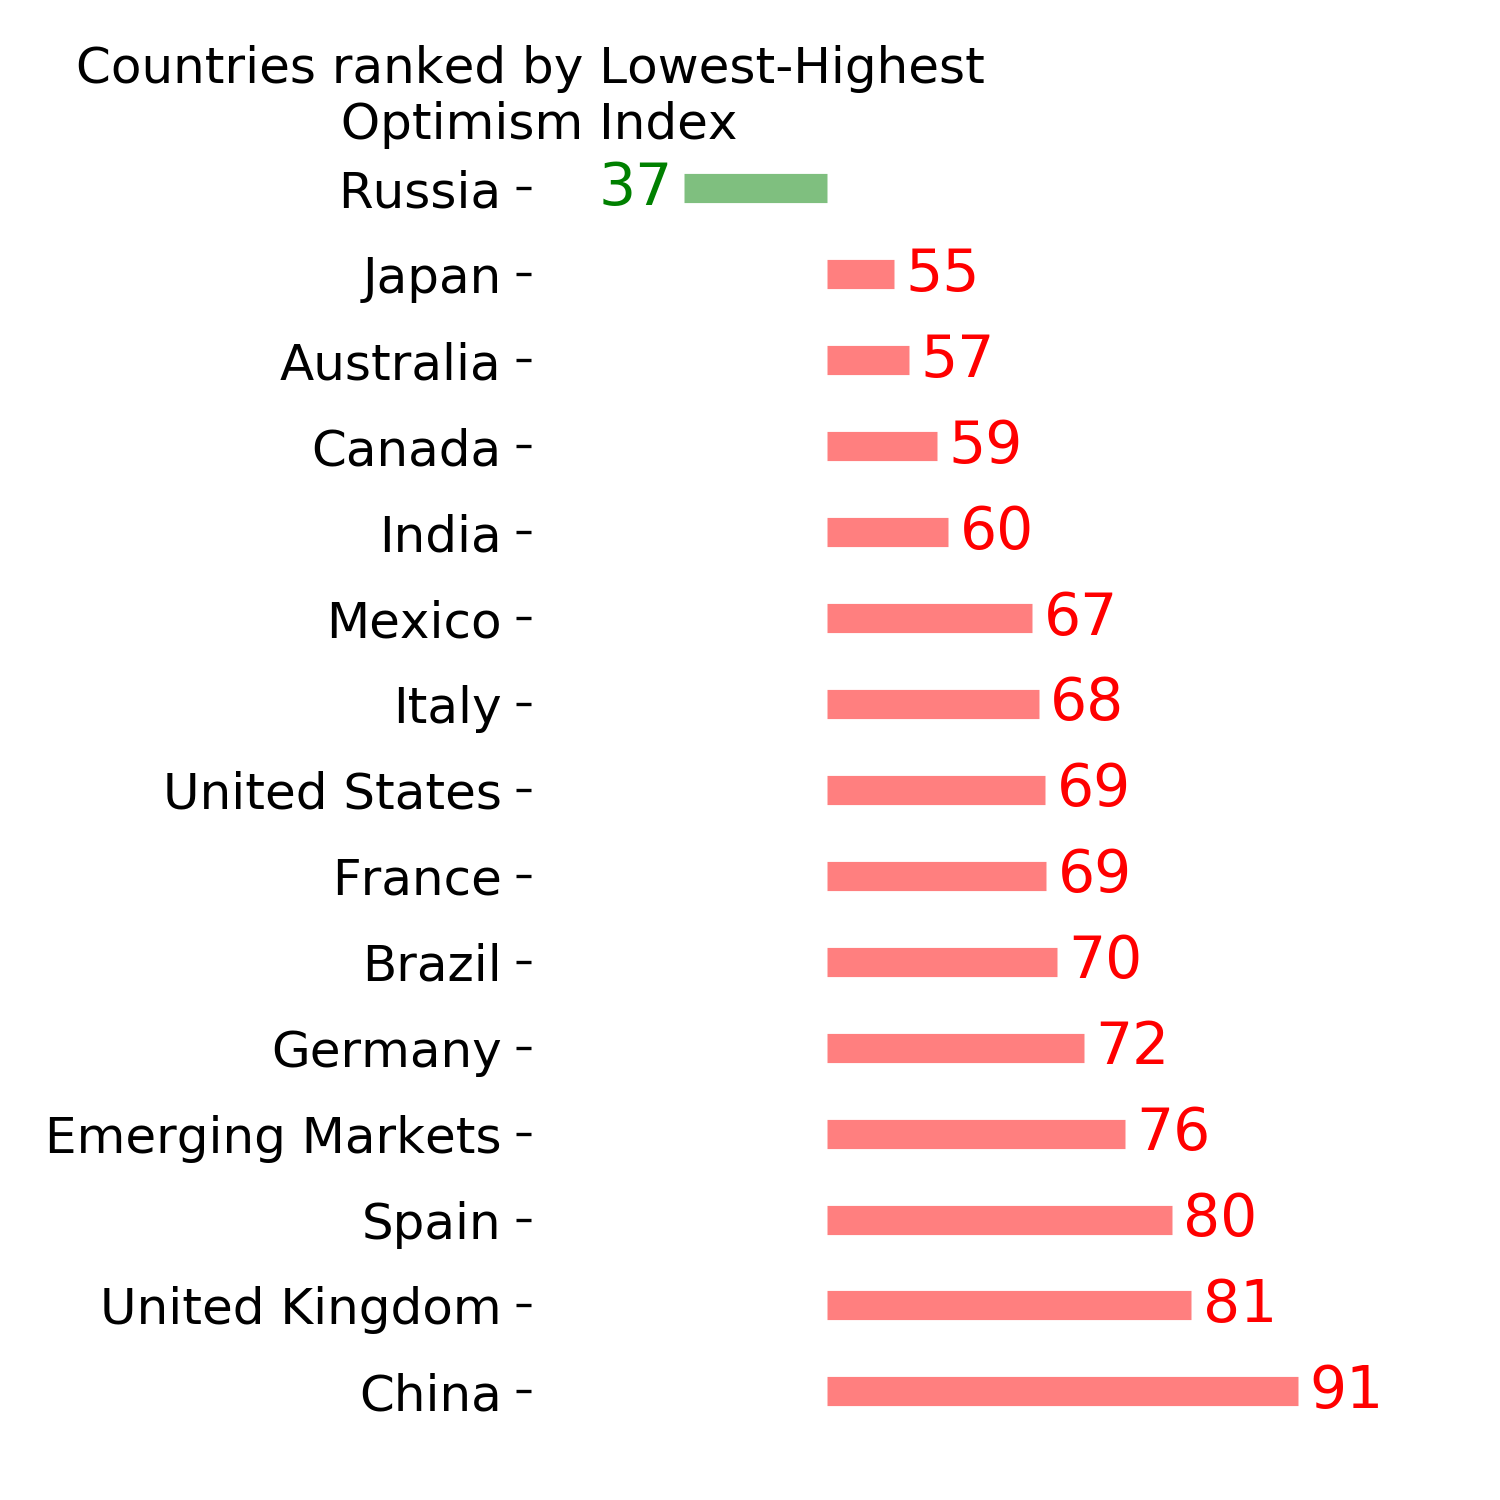
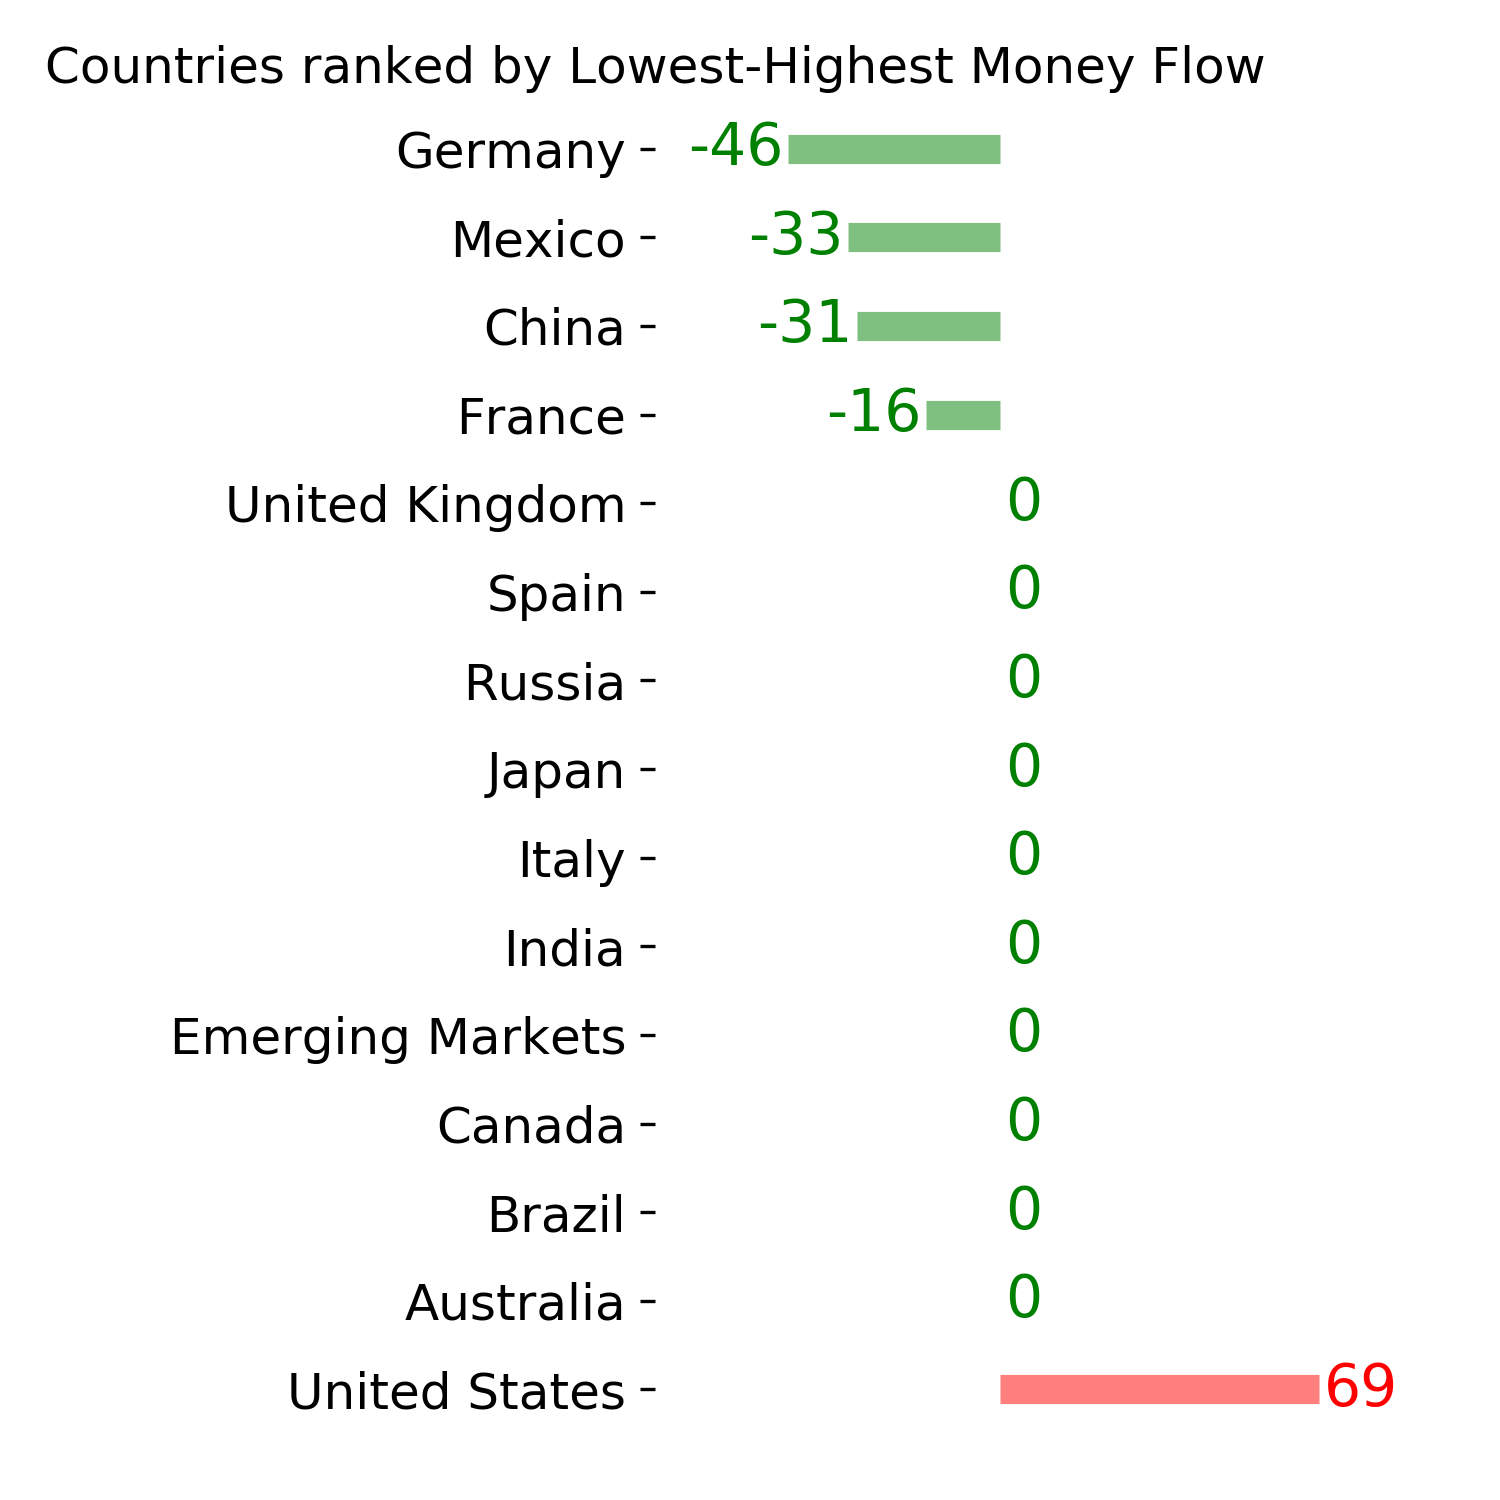
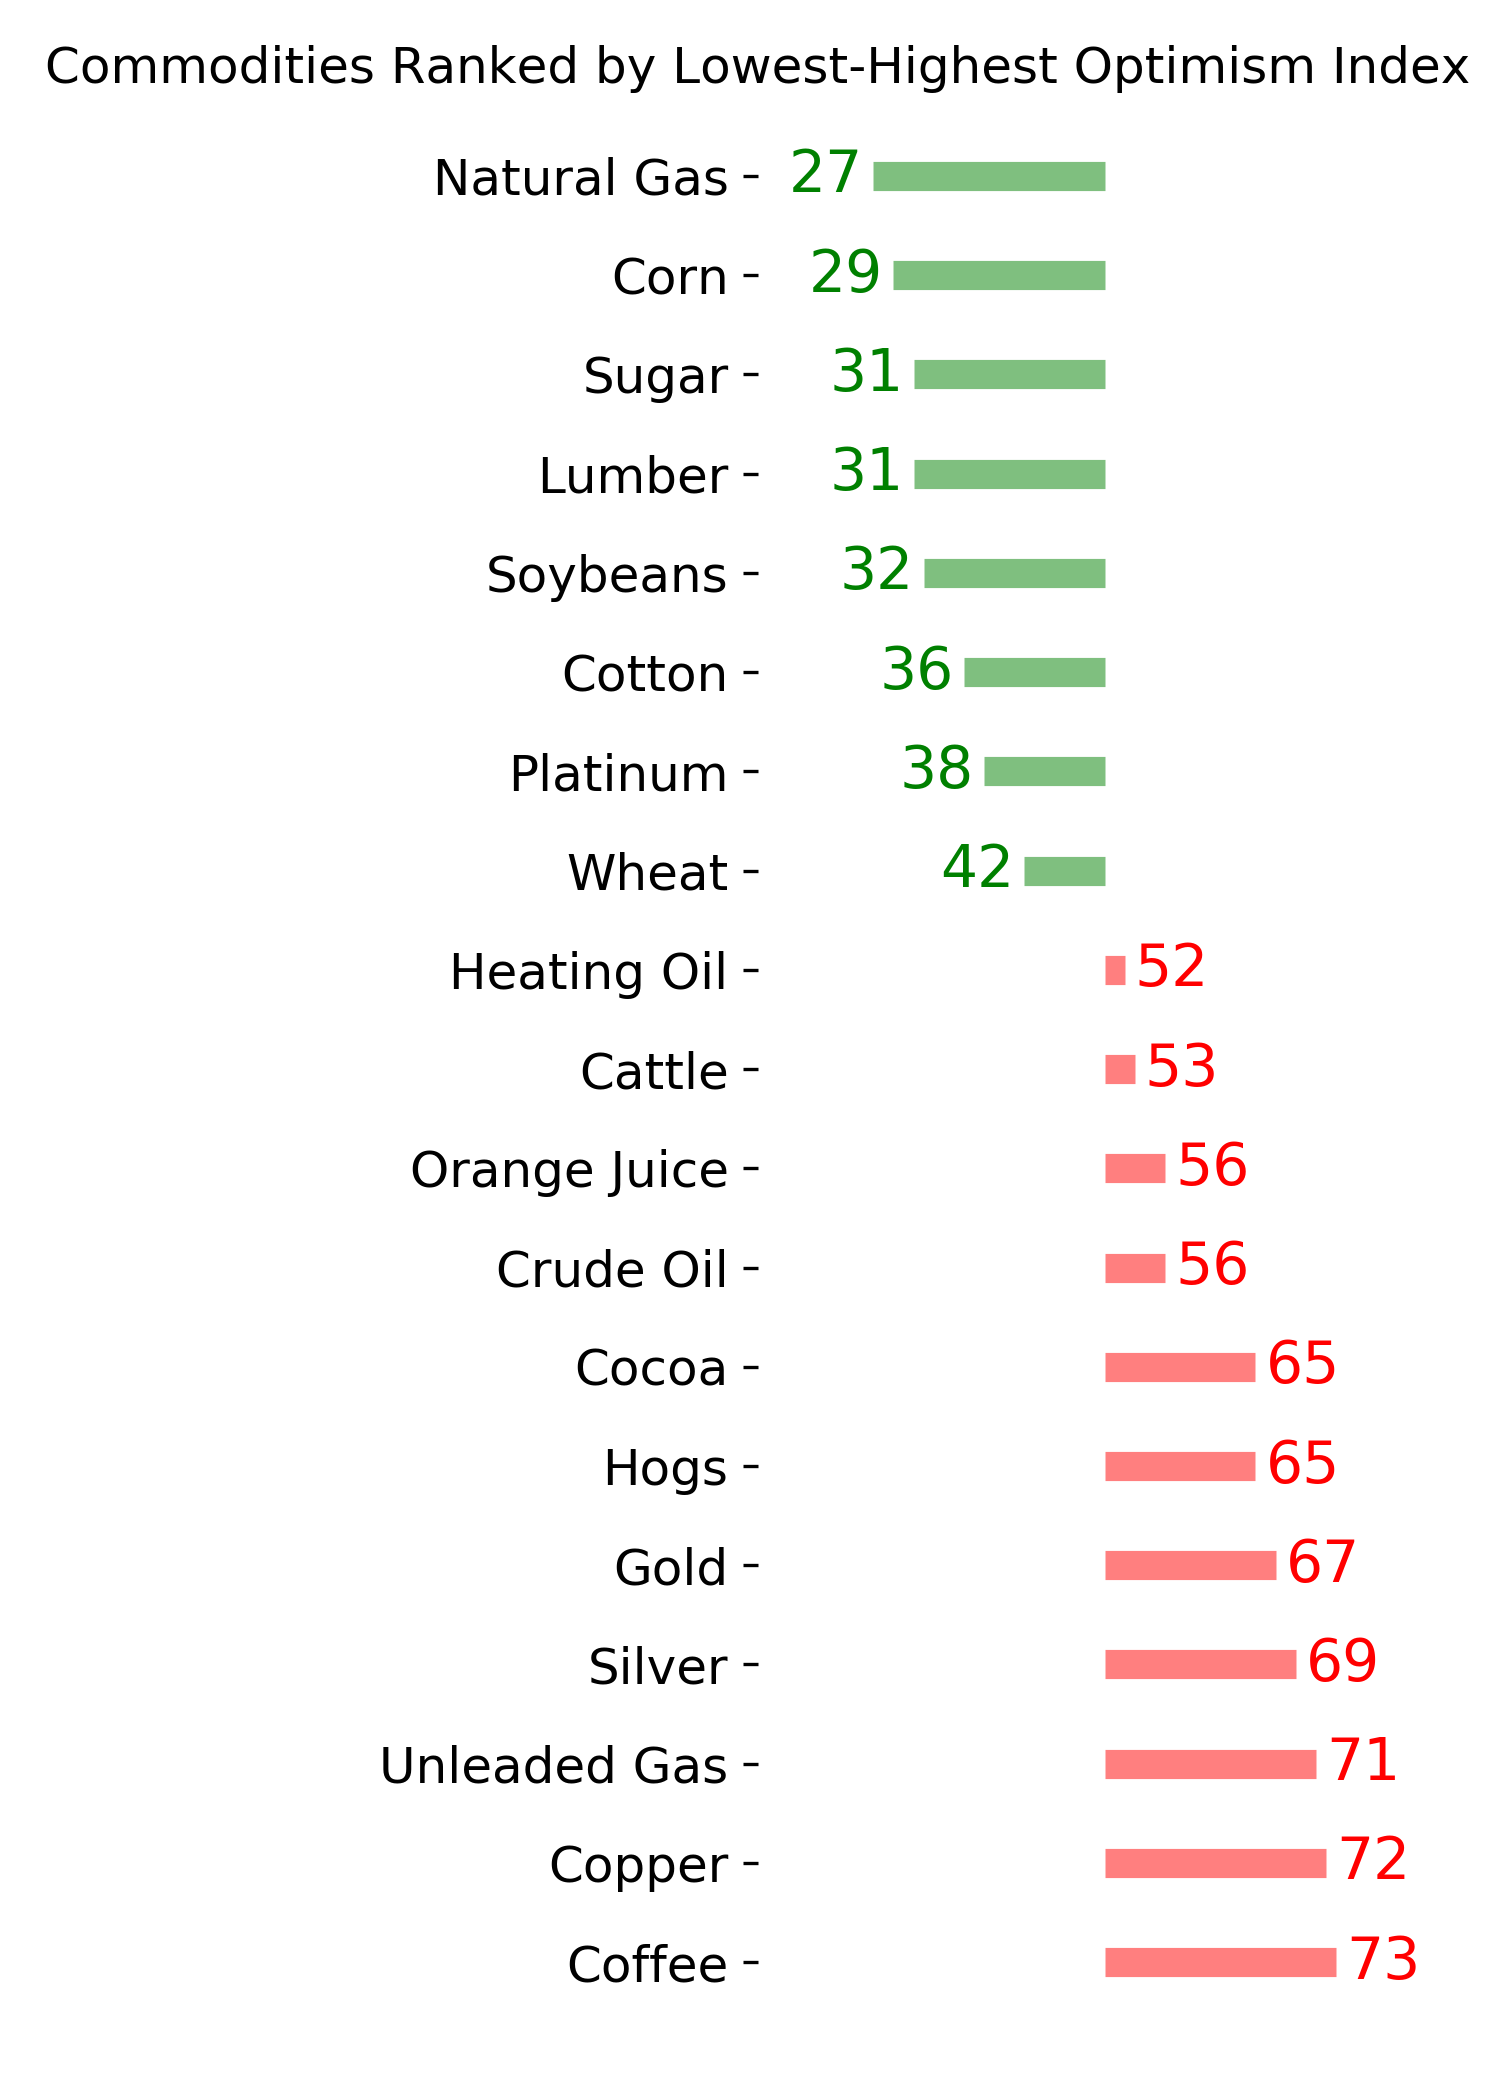
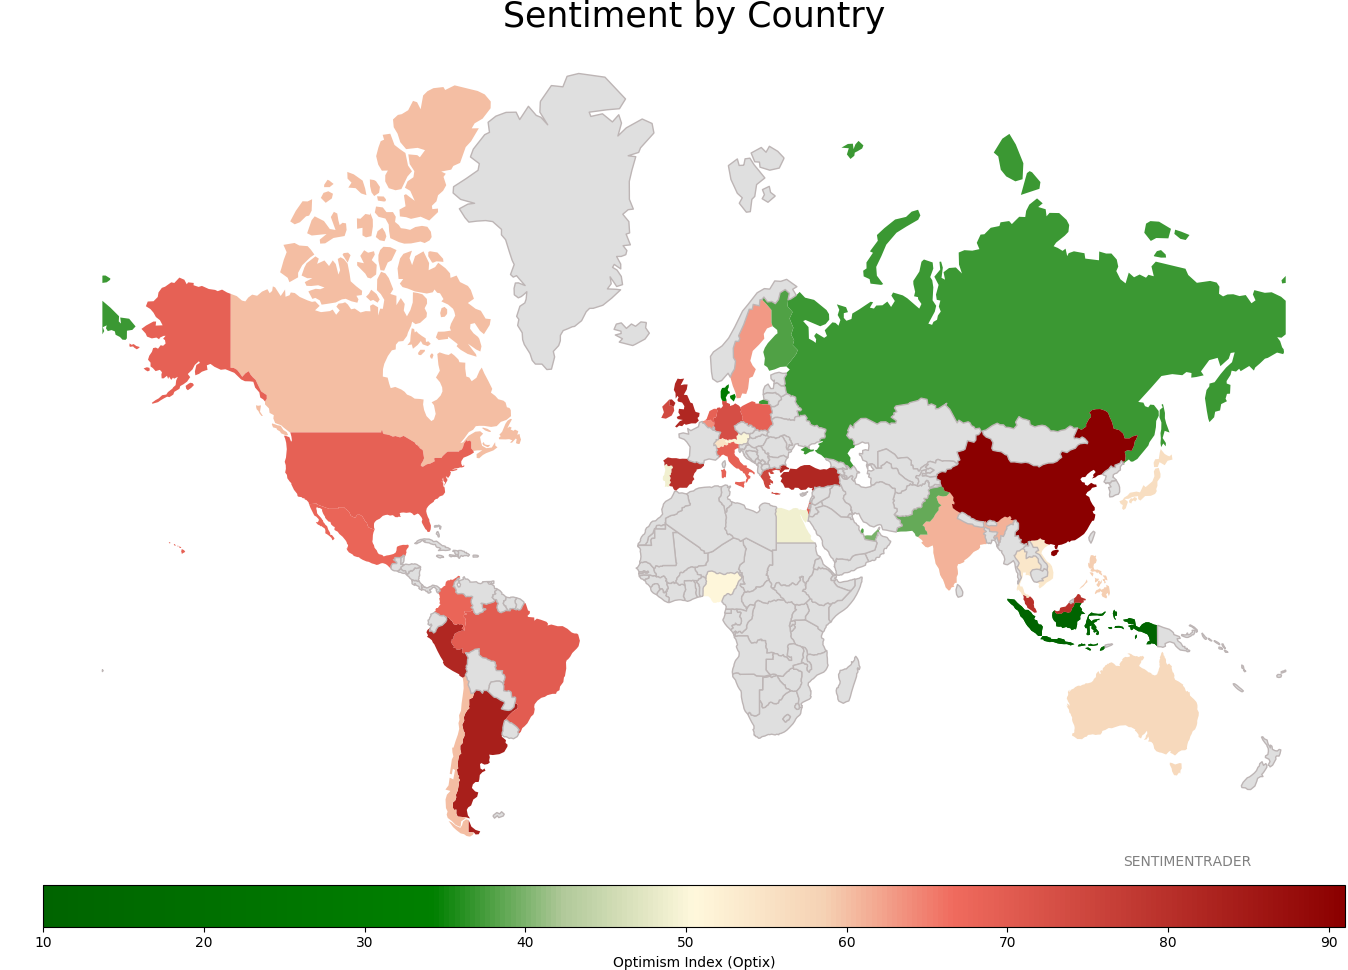
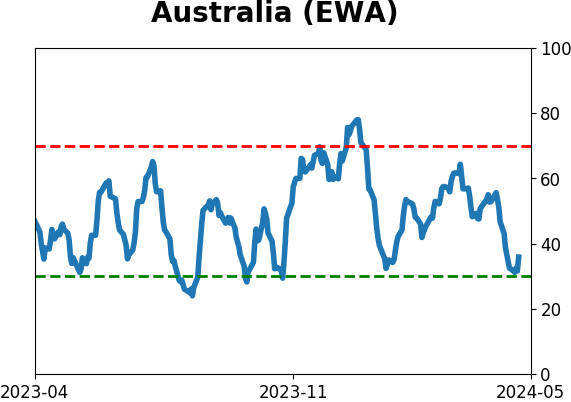
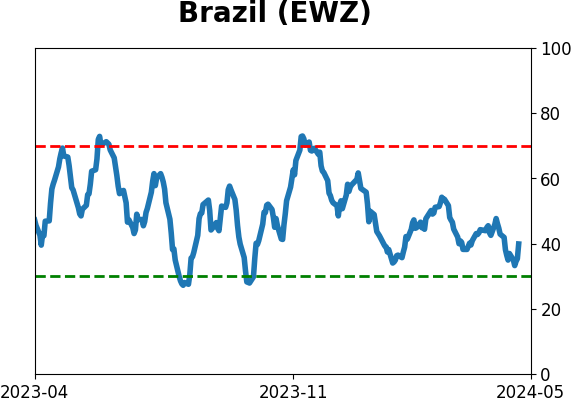
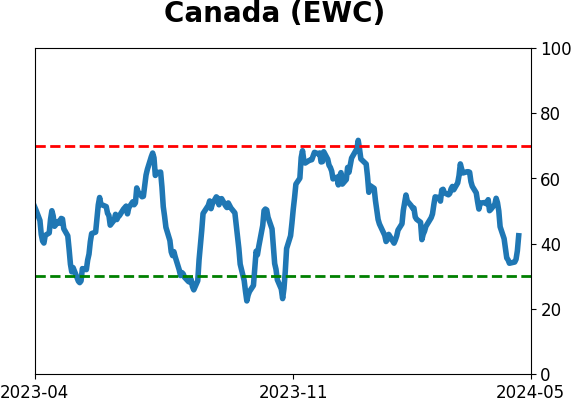
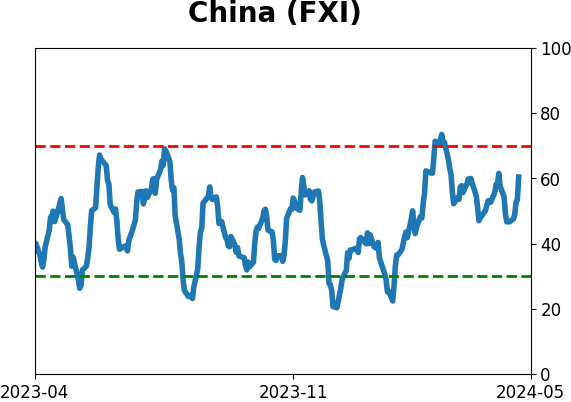
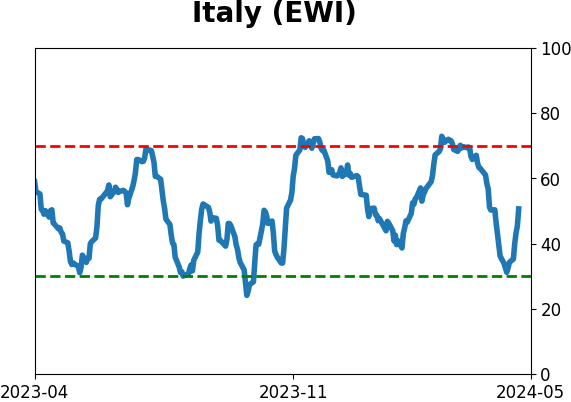
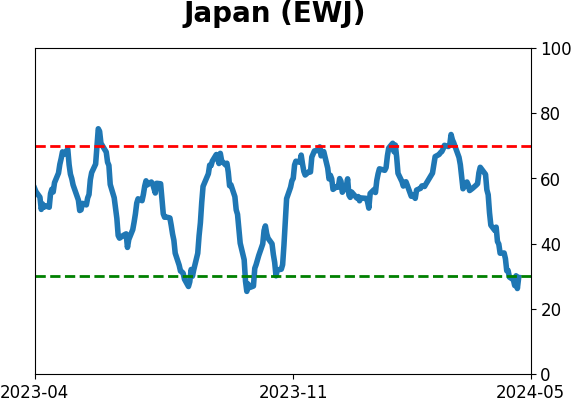
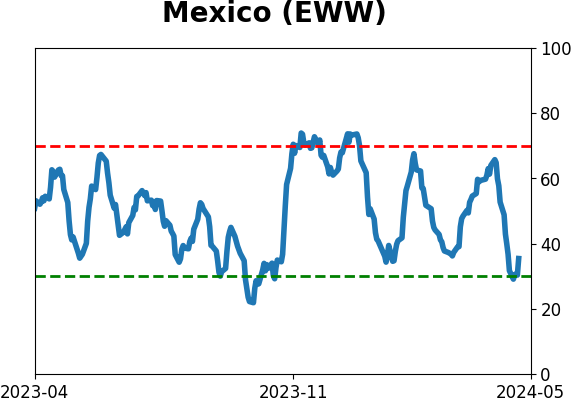
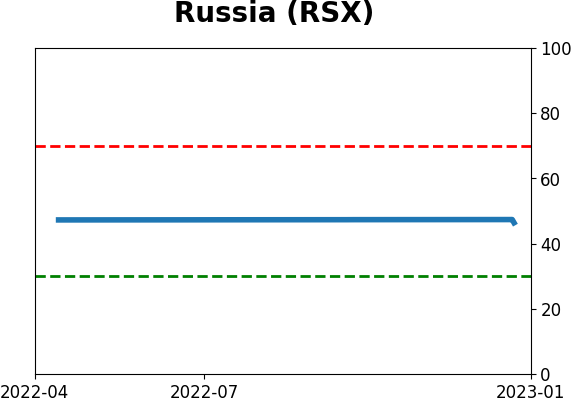
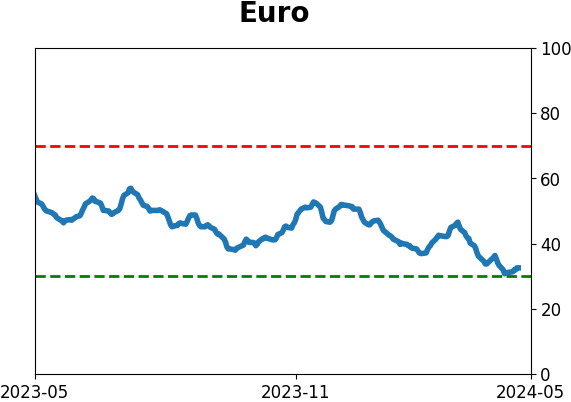
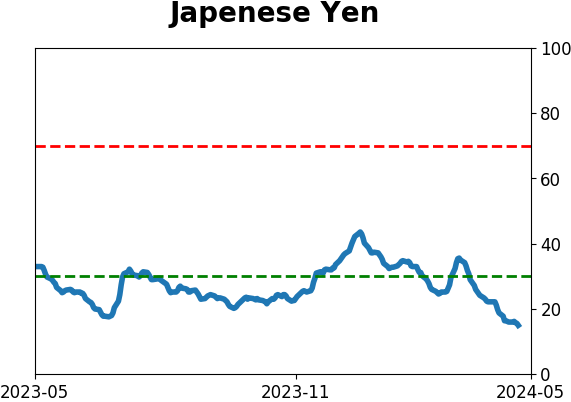
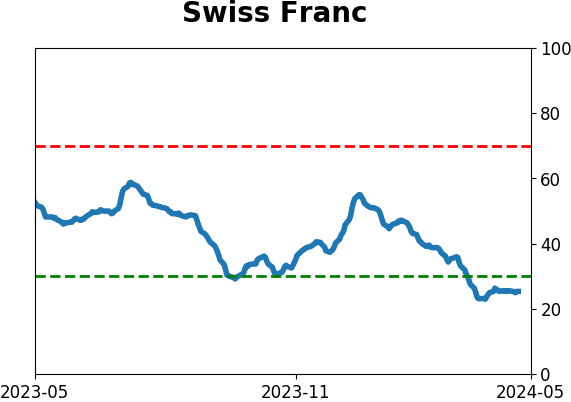
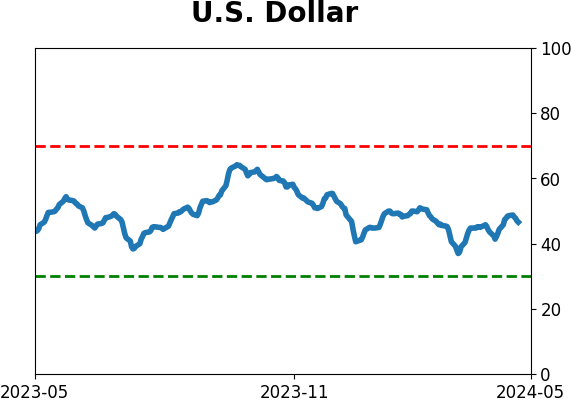
Sentiment Around The World
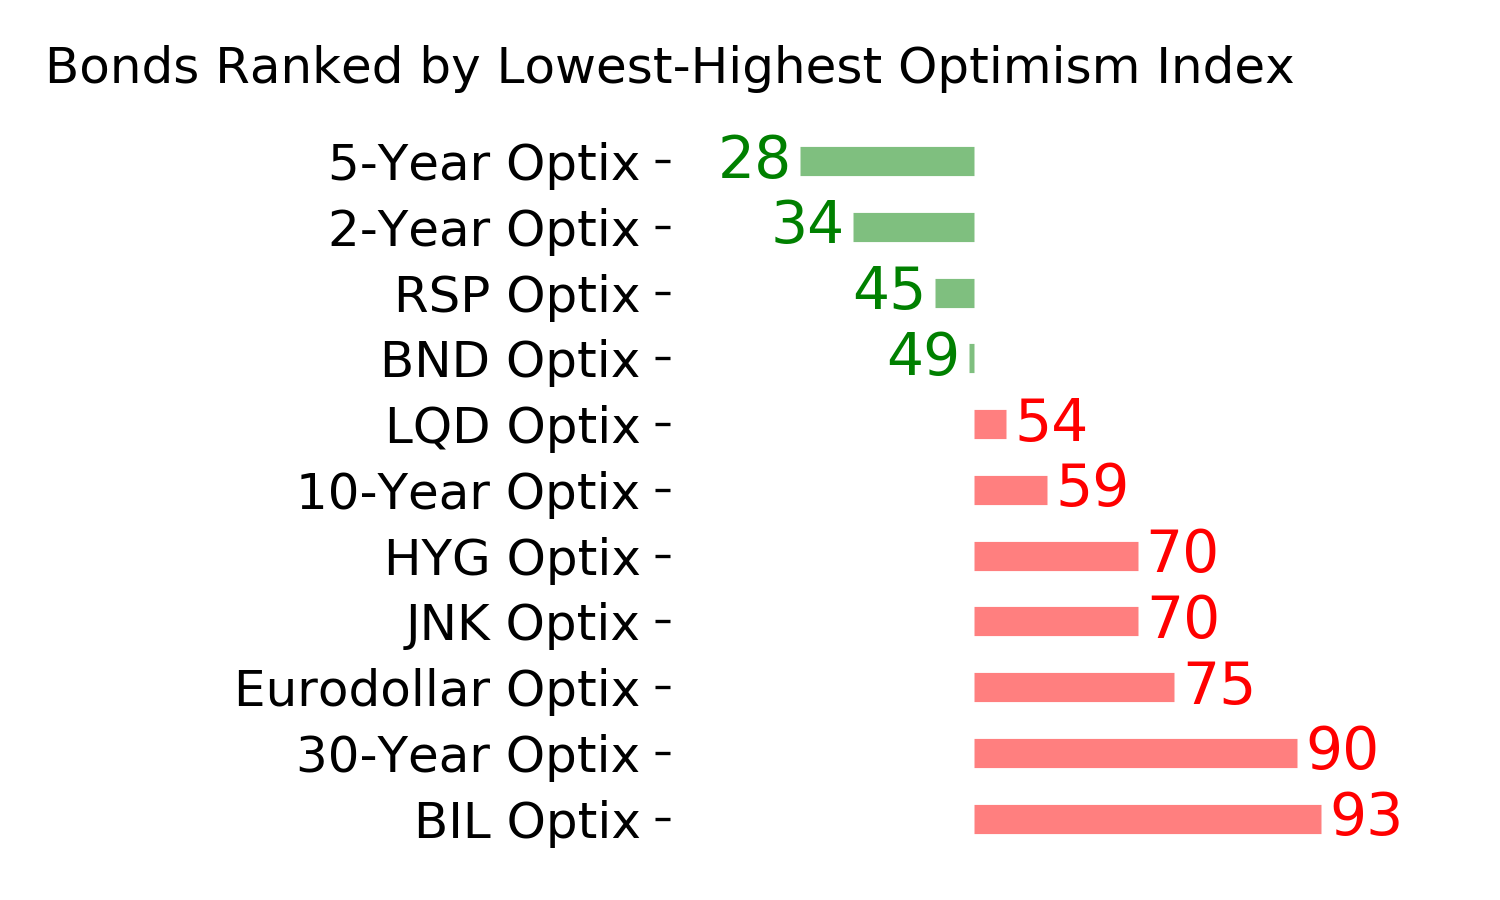
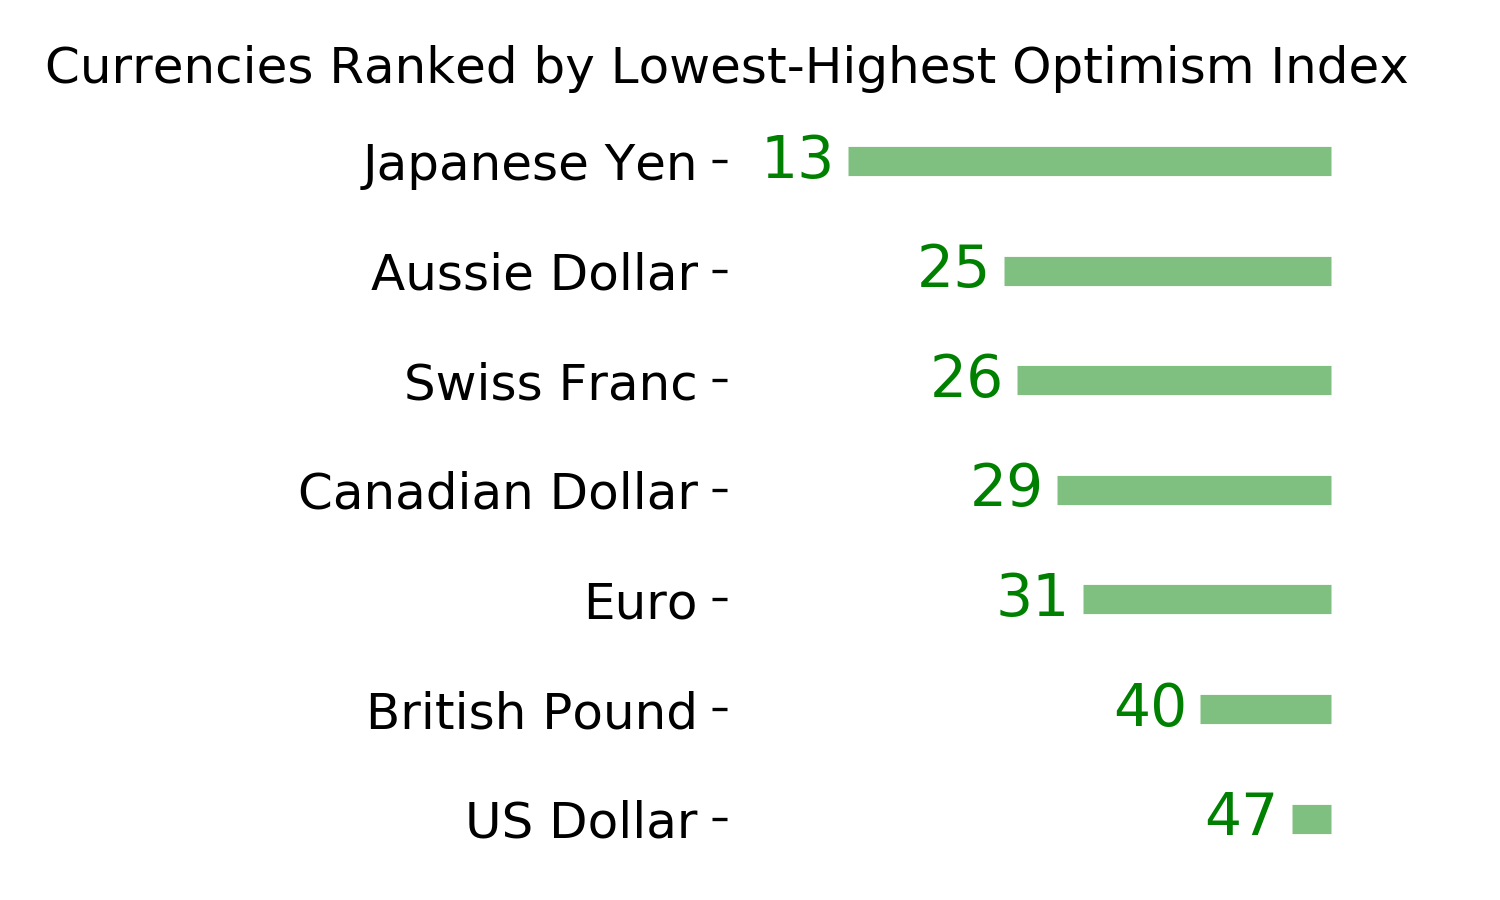
Optimism Index Thumbnails
|
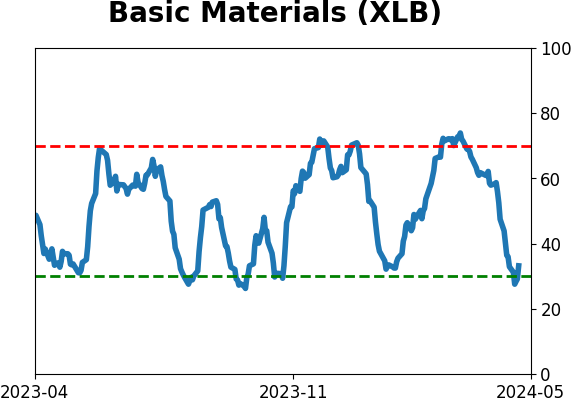
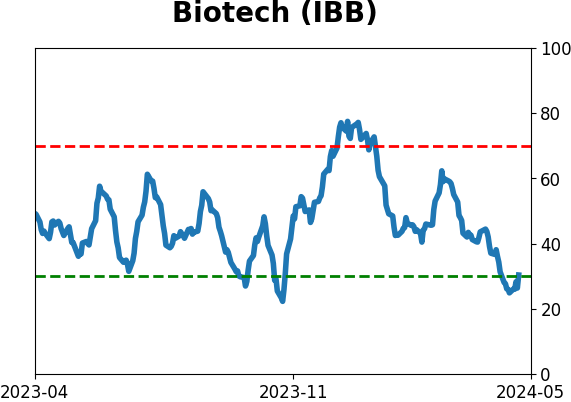
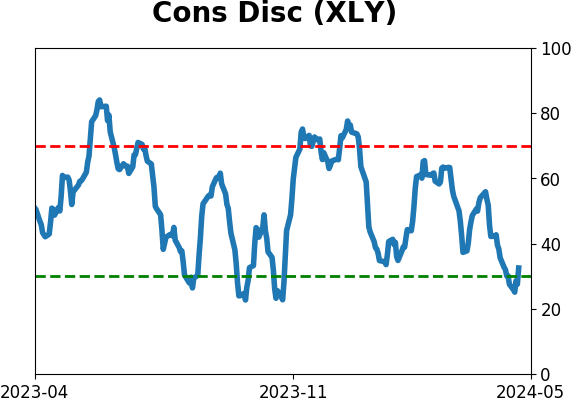
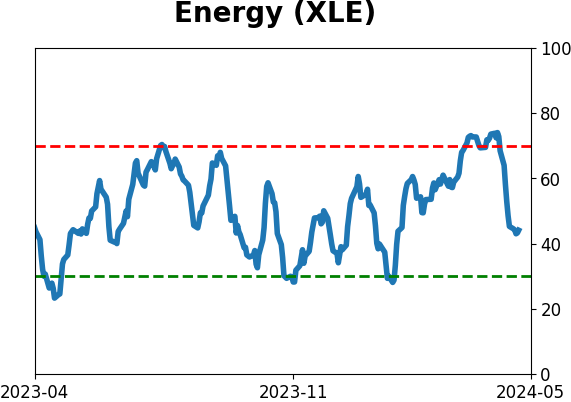
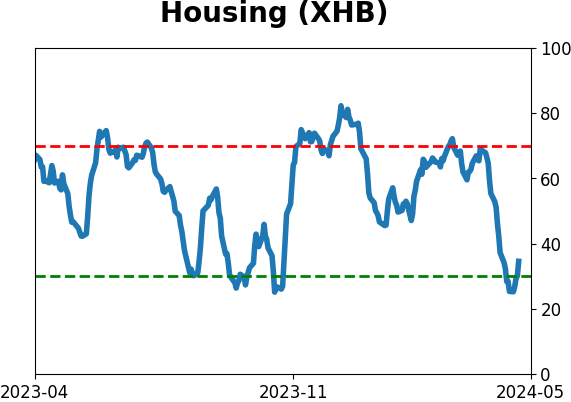
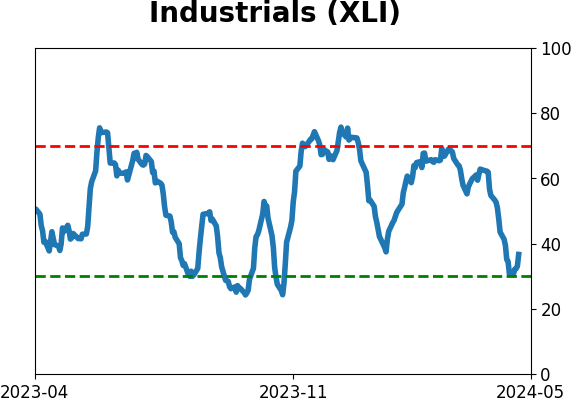
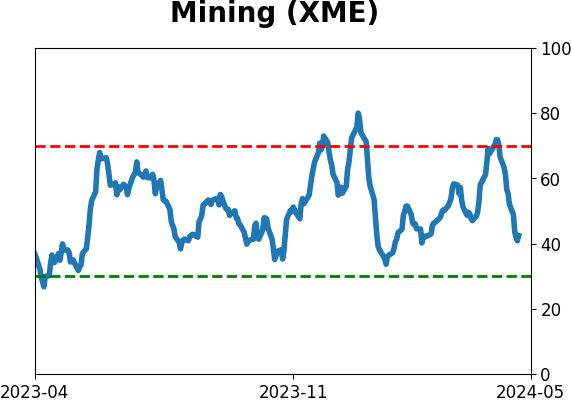
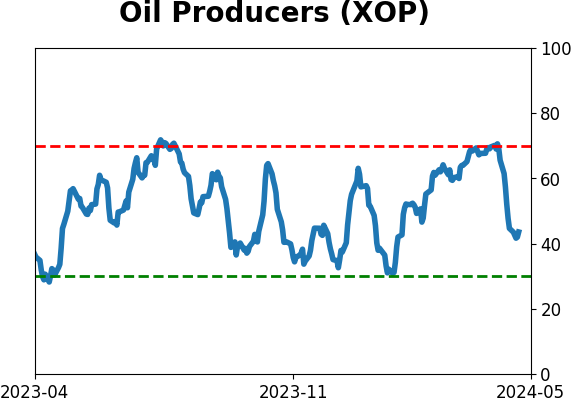
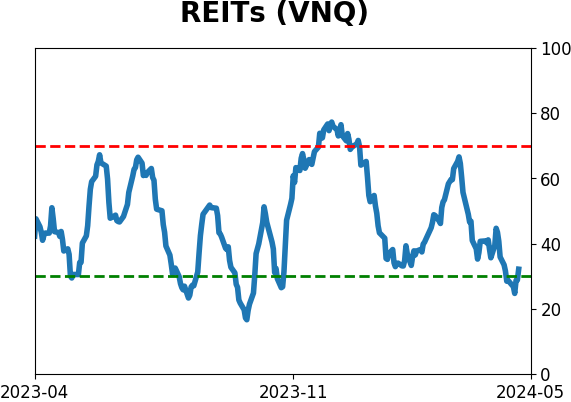
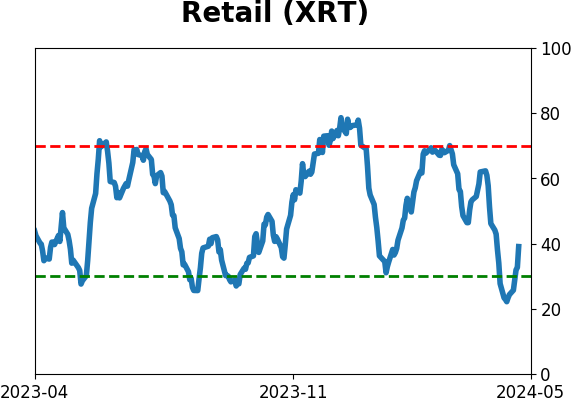
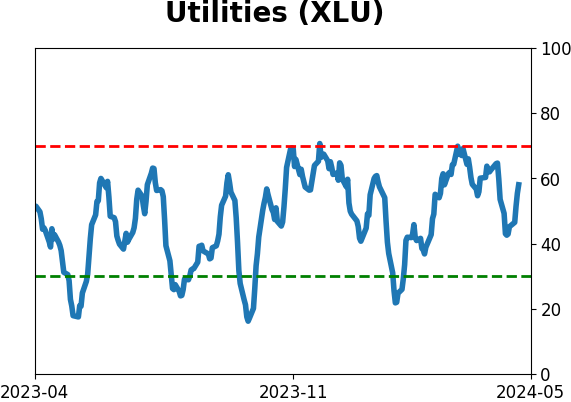
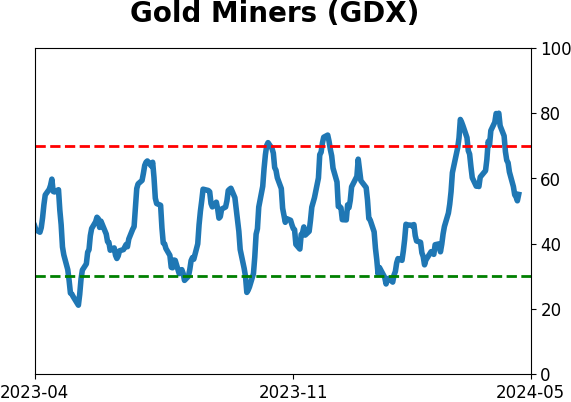
Sector ETF's - 10-Day Moving Average
|
|
|
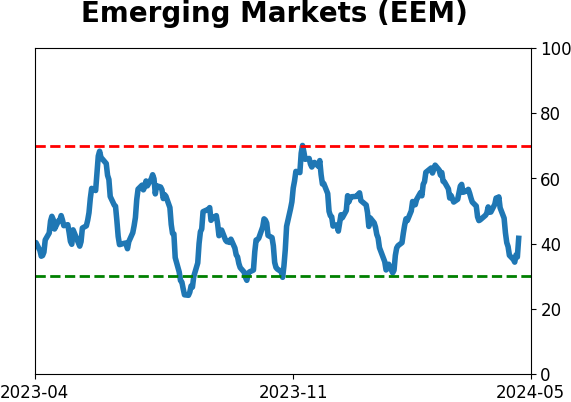
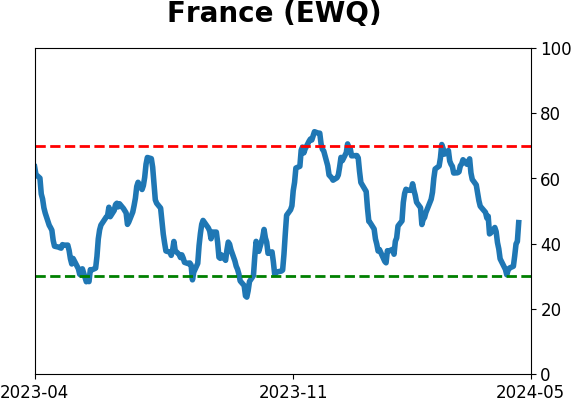
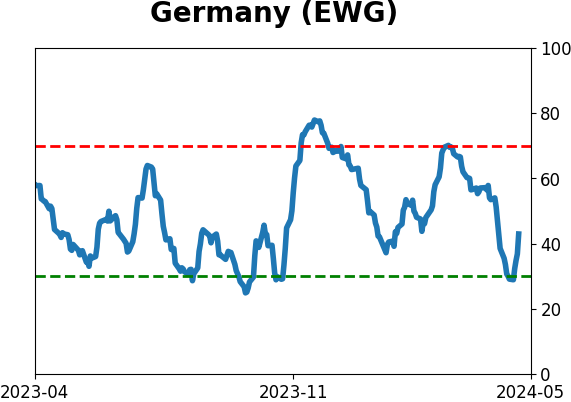
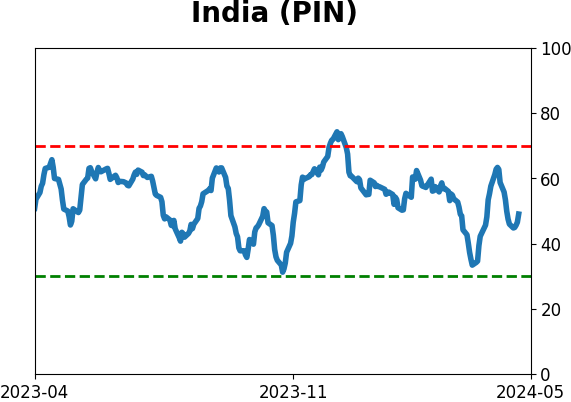
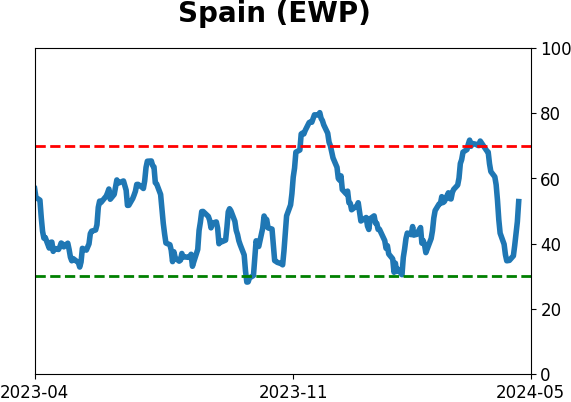
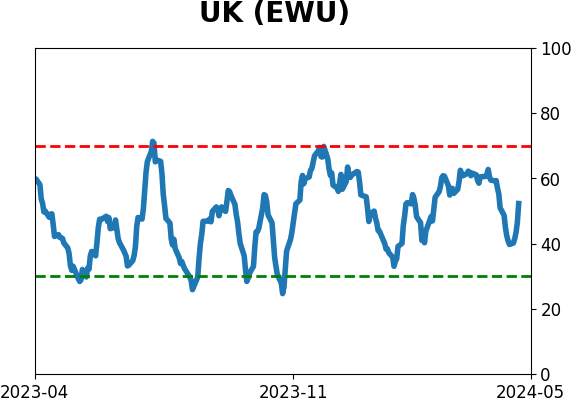
Country ETF's - 10-Day Moving Average
|
|
|
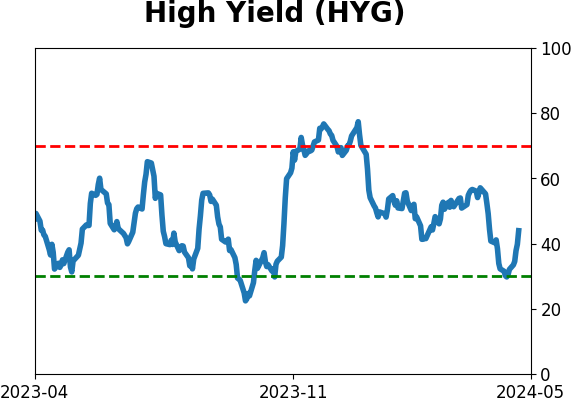
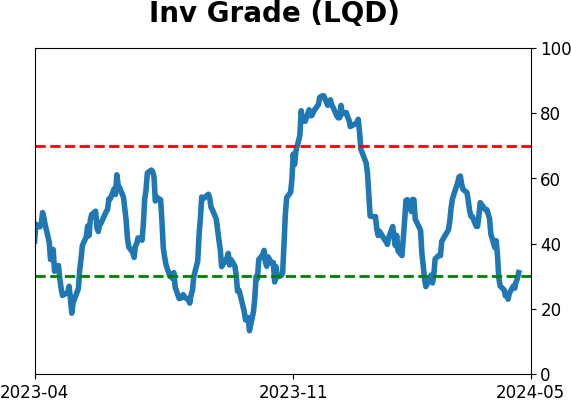
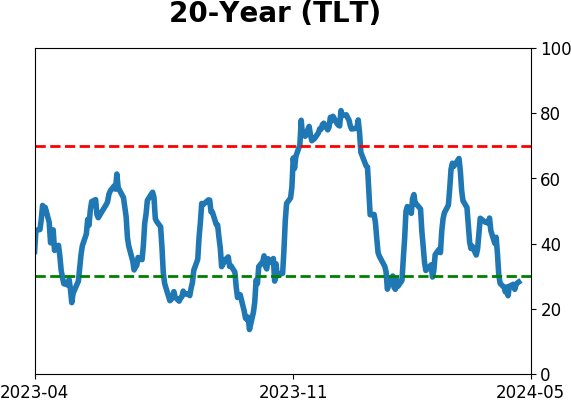
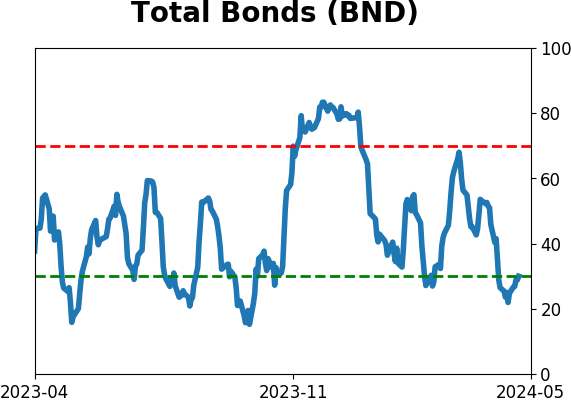
Bond ETF's - 10-Day Moving Average
|
|
|
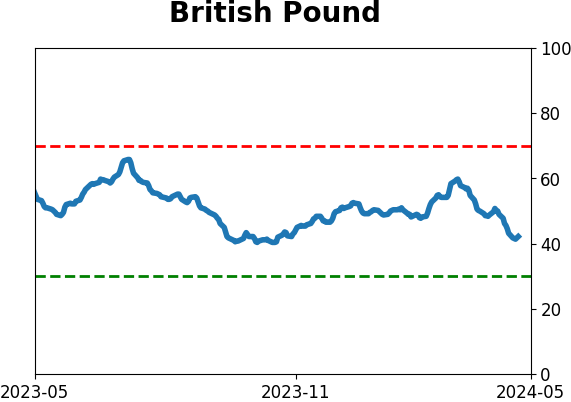
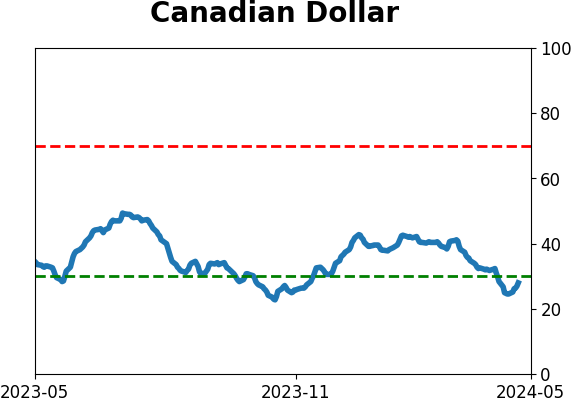
Currency ETF's - 5-Day Moving Average
|
|
|
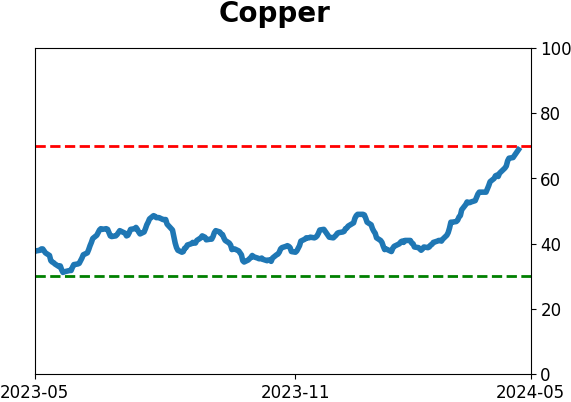
Commodity ETF's - 5-Day Moving Average
|
|