Headlines
|
|
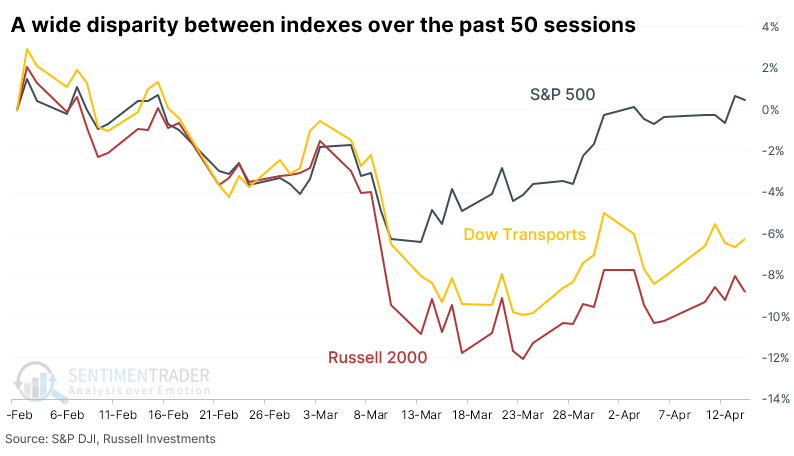
Transports and Small Caps stumble as the S&P holds steady:
Among the many worries for investors is that a couple of cyclical sectors, Transportation and Small-Cap stocks, tanked in recent months even while the S&P 500 held steady. Since 1928, this is one of the widest divergences between the market and those indexes. While the worry sounds good in theory, in practice it has not been consistently successful.
|
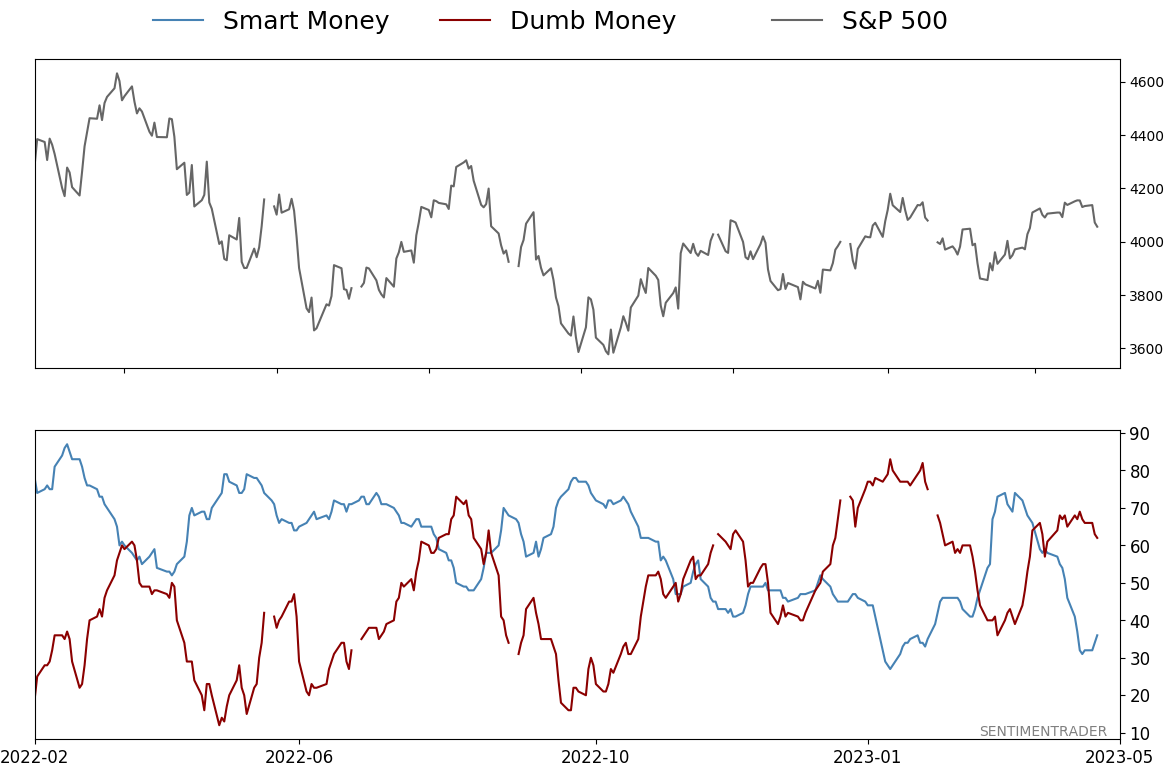
Smart / Dumb Money Confidence
|
Smart Money Confidence: 36%
Dumb Money Confidence: 62%
|
|
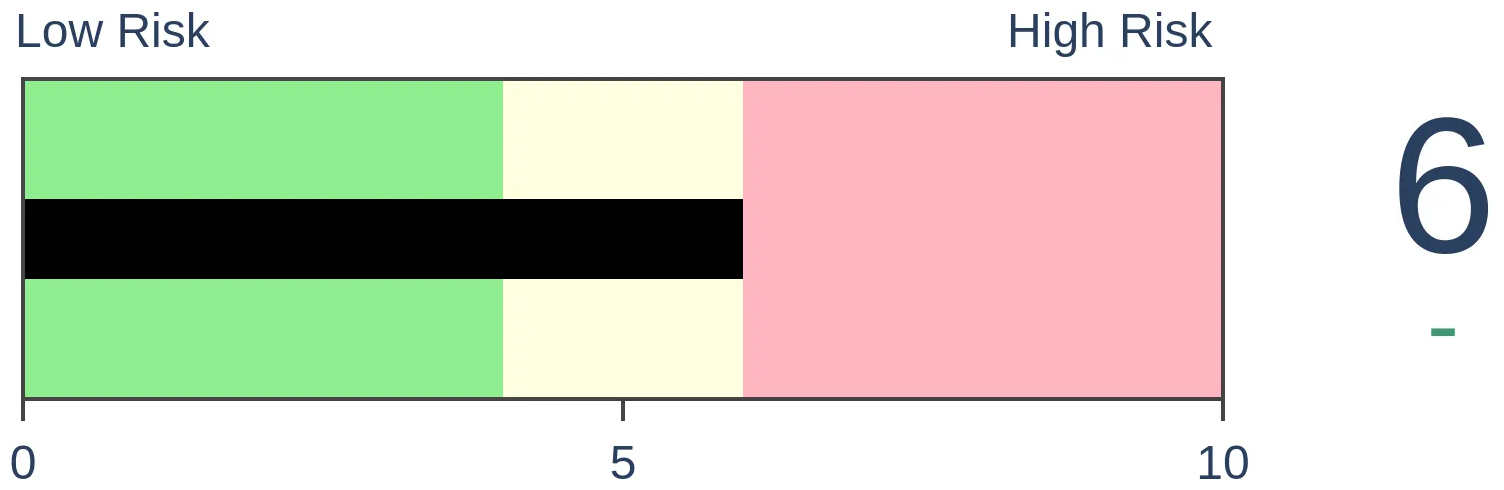
Risk Levels
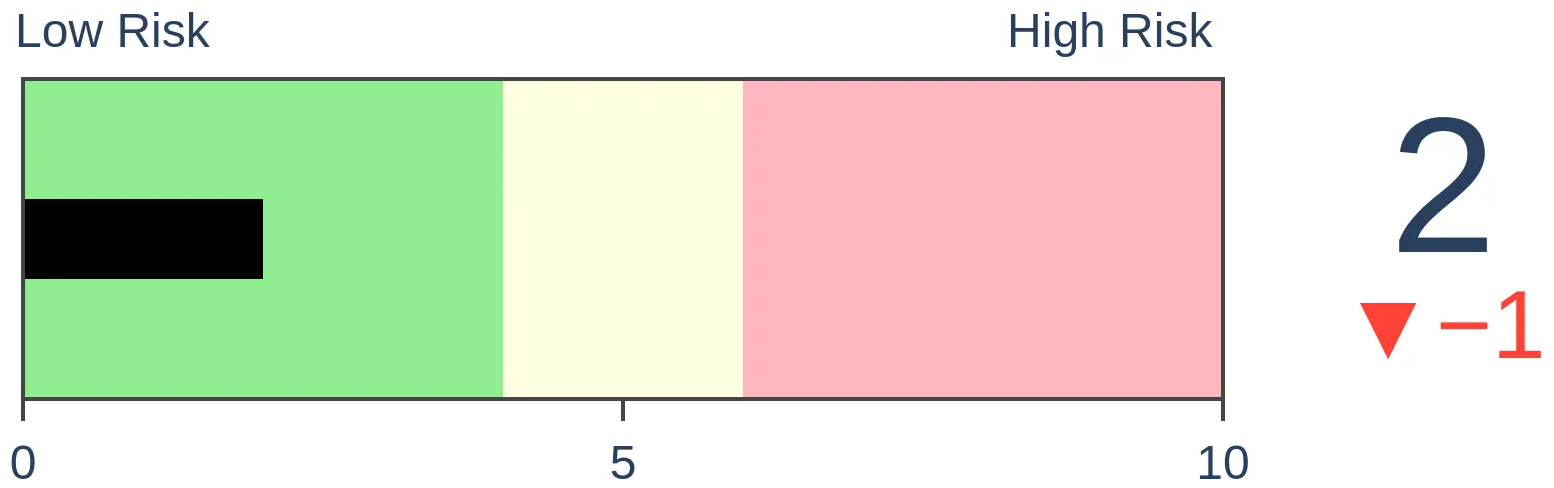
Stocks Short-Term

|
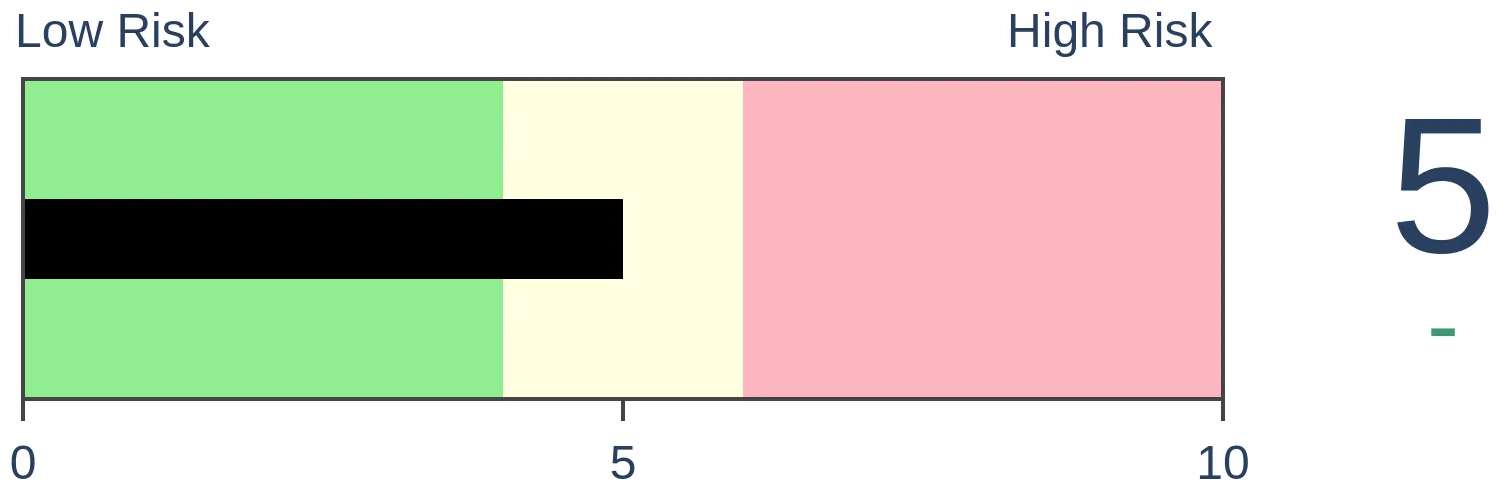
Stocks Medium-Term
|
|
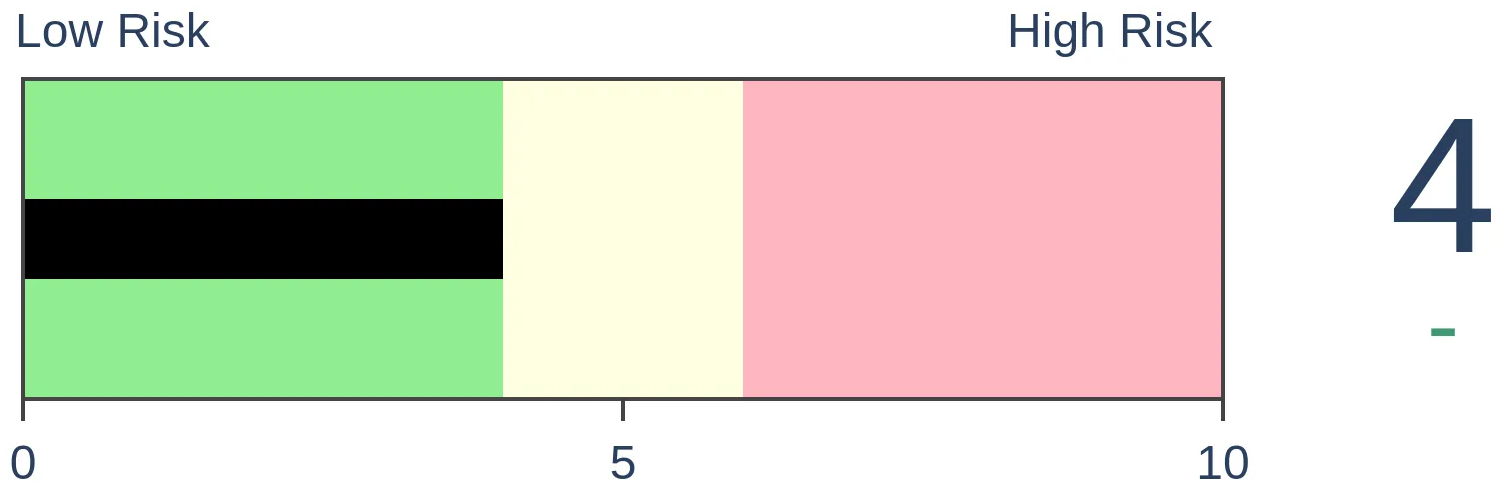
Bonds
|
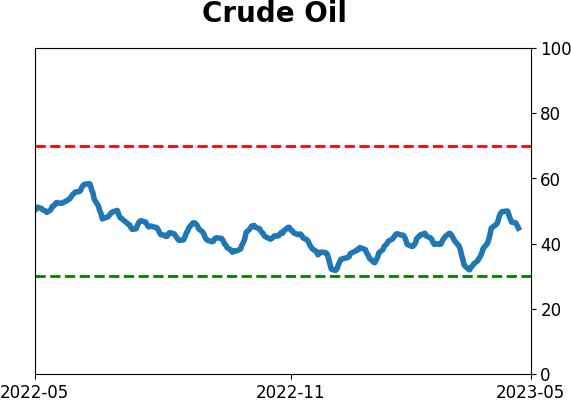
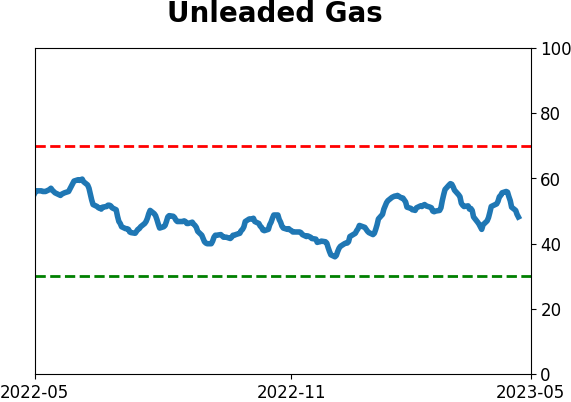
Crude Oil
|
|
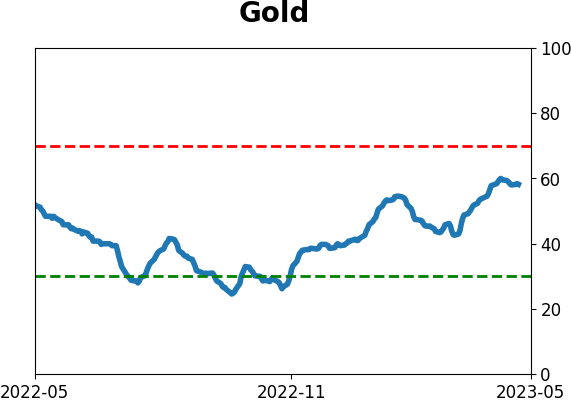
Gold
|
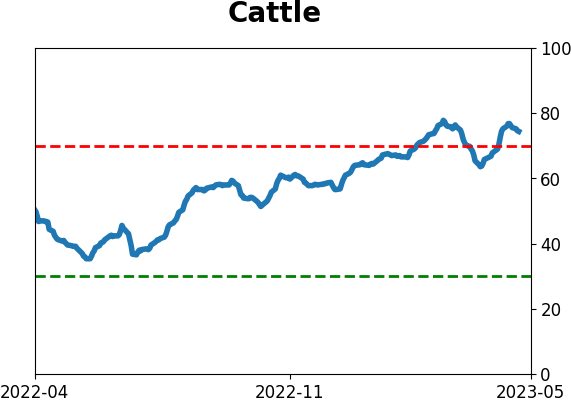
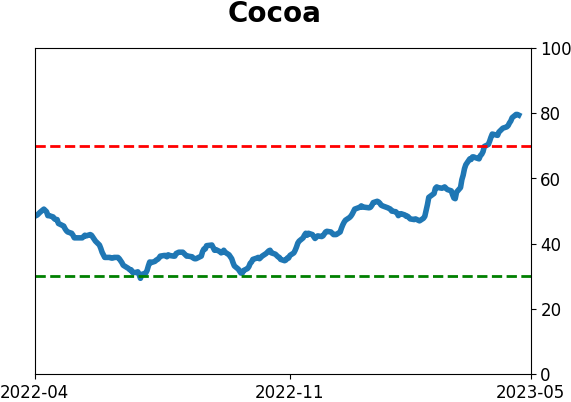
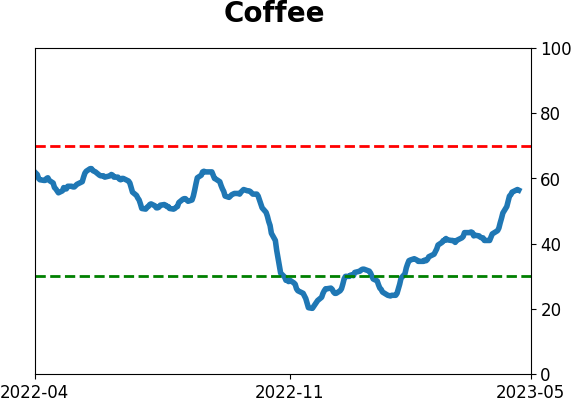
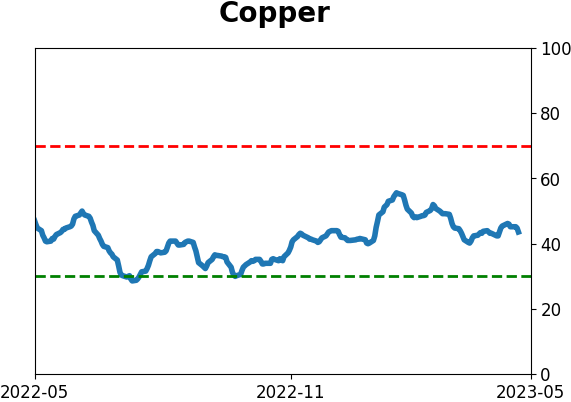
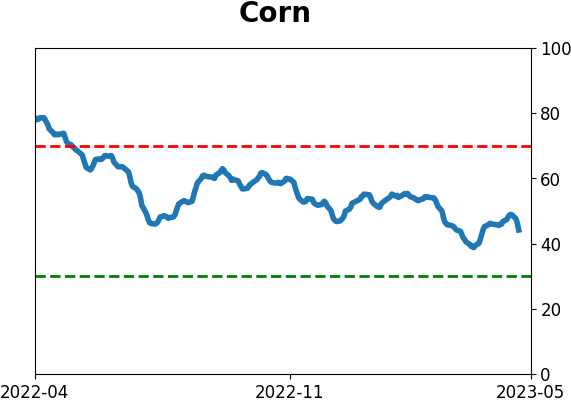
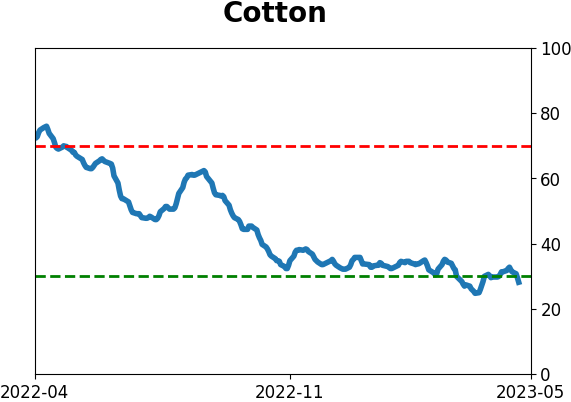
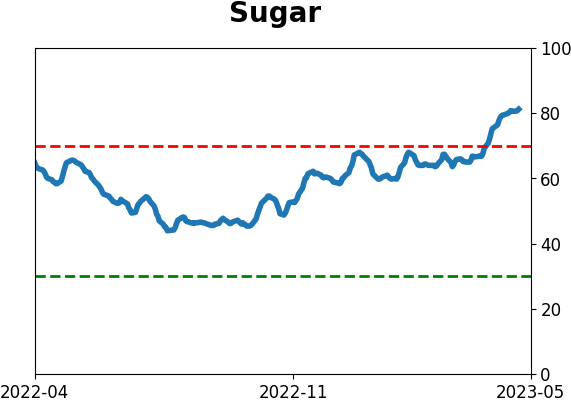
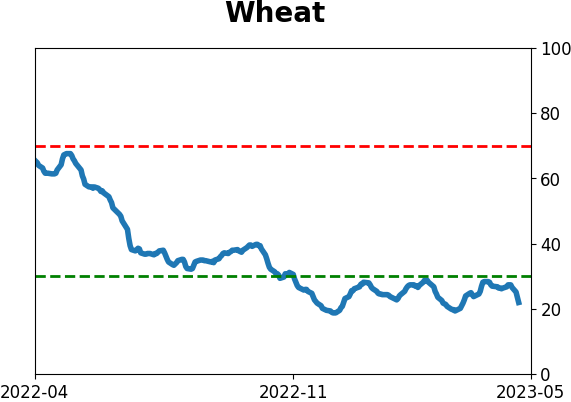
Agriculture

|
|
Research
By Jason Goepfert
BOTTOM LINE
Among the many worries for investors is that a couple of cyclical sectors, Transportation and Small-Cap stocks, tanked in recent months even while the S&P 500 held steady. Since 1928, this is one of the widest divergences between the market and those indexes. While the worry sounds good in theory, in practice it has not been consistently successful.
FORECAST / TIMEFRAME
None
|
Key points:
- Over 50 days, the S&P 500 sported a positive return while Transports and Small-Caps plunged
- This is one of the widest divergences between the market and those indexes since 1928
- Similar behavior led to mostly positive returns for the S&P, less so for the other indexes
The S&P 500 has held up while a couple of cyclical sectors tanked
Some cyclical sectors have been lagging, creating yet another worry for investors.
The Wall Street Journal noted that:
Economically sensitive stocks, like those of transportation and small-cap companies, are trailing the broader market, reflecting growing investor concern about a potential recession.
Historically, transportation and small-cap stocks have led in market recoveries but also sold off faster during periods of economic downturns when demand for goods, materials and travel slow.
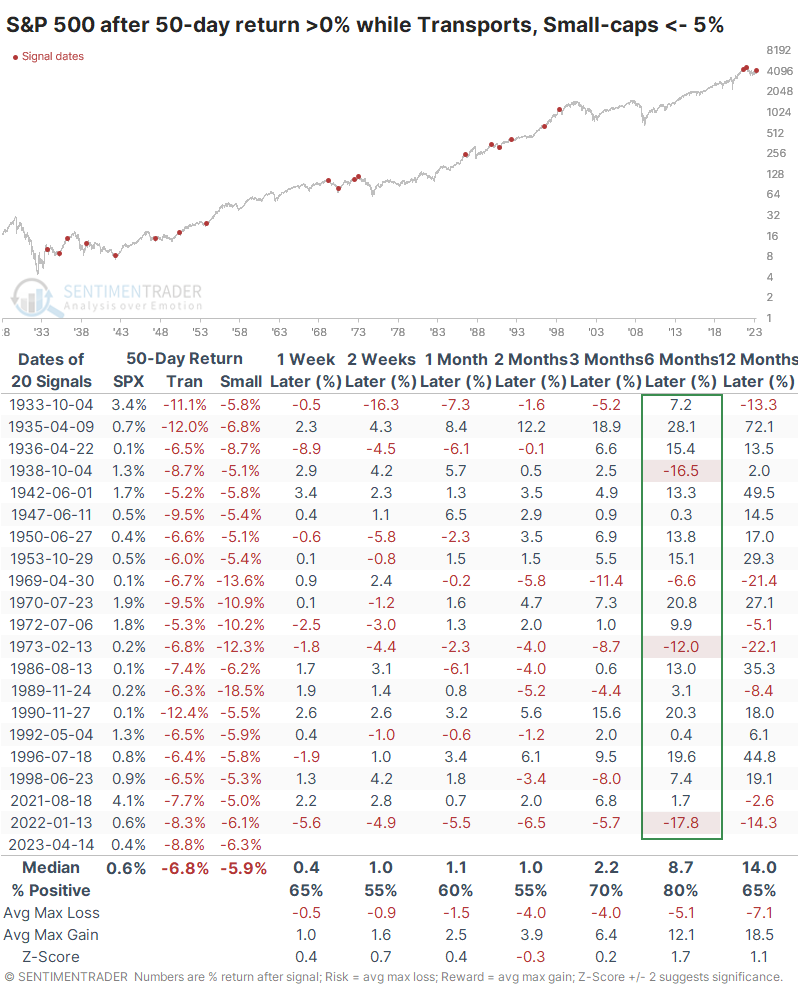
The disparity between the S&P 500, Dow Jones Transportation Average, and the Russell 2000 has been stark over a recent 50-day stretch. The S&P managed a gain while the latter two indexes suffered significant losses.
The disparity was first triggered in mid-April and then got even wider in the days following. The table below shows returns in the S&P 500 after similar behavior since 1928. Due to data limitations, the data use price-only returns for the S&P 500 and Dow Transports but total return (price plus dividends) for Small-Caps.
It turns out that the fears triggered by lagging cyclical indexes like Transports and Small-Caps were not consistently justified. Over the next six months, the S&P rose 80% of the time, with an impressive average return and decent risk/reward profile. The biggest concern is that the few losses were double-digit, and two were sustained for months afterward.
Cyclical sectors were more of a worry
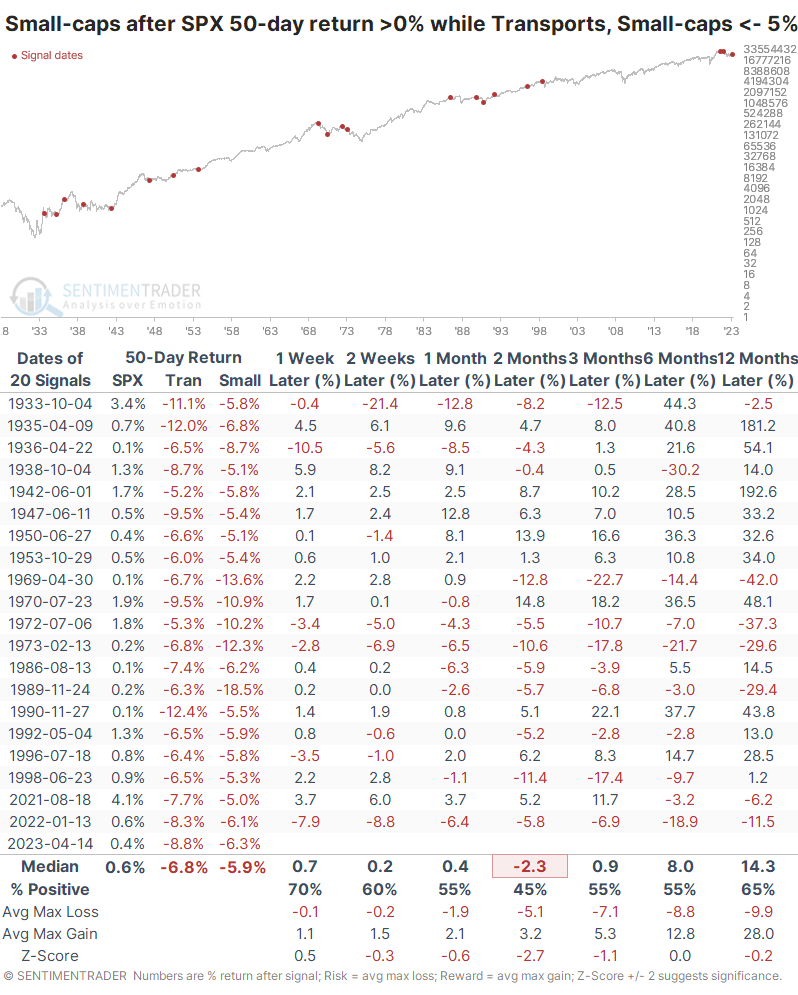
It was more of a worry for Small-Cap stocks, even using total return. Over the next couple of months, Small-Caps showed a negative median return, with risk well above reward. They recovered quite a bit over 6-12 months, but average returns were still at/below random.
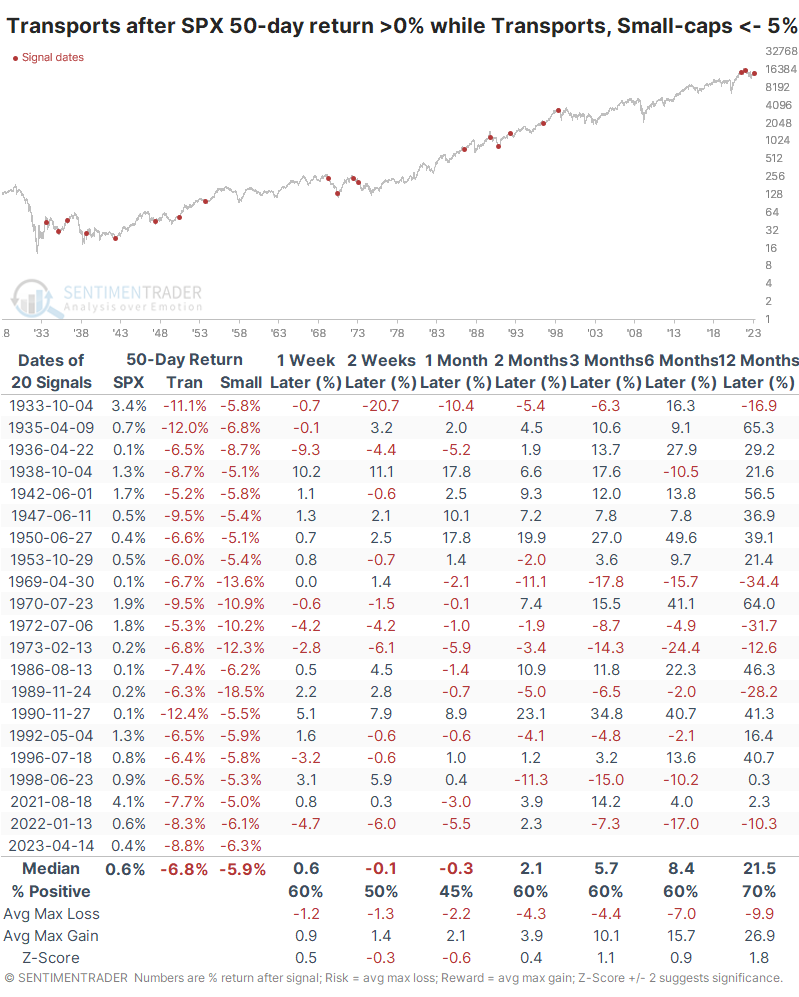
For the Transports, it was more of a mixed bag. They continued to lag over the next month or so, then returns rebounded to above-average levels. They tended to show positive returns less consistently than did the S&P 500, however.
What the research tells us...
We've discussed many investors' worries in recent weeks, some of which can be supported by markets' typical behavior following similar conditions. While the dramatic lag in cyclical sectors like Transports and Small-Caps sounds good in theory, and some cherry-picked examples seemingly support the theory, an objective look at similar conditions does not. Over an extended period and using simple rules, when those two indexes lagged severely, it did not consistently lead to below-average returns in the broader stock market. If anything, it was the opposite.
Indicators at Extremes
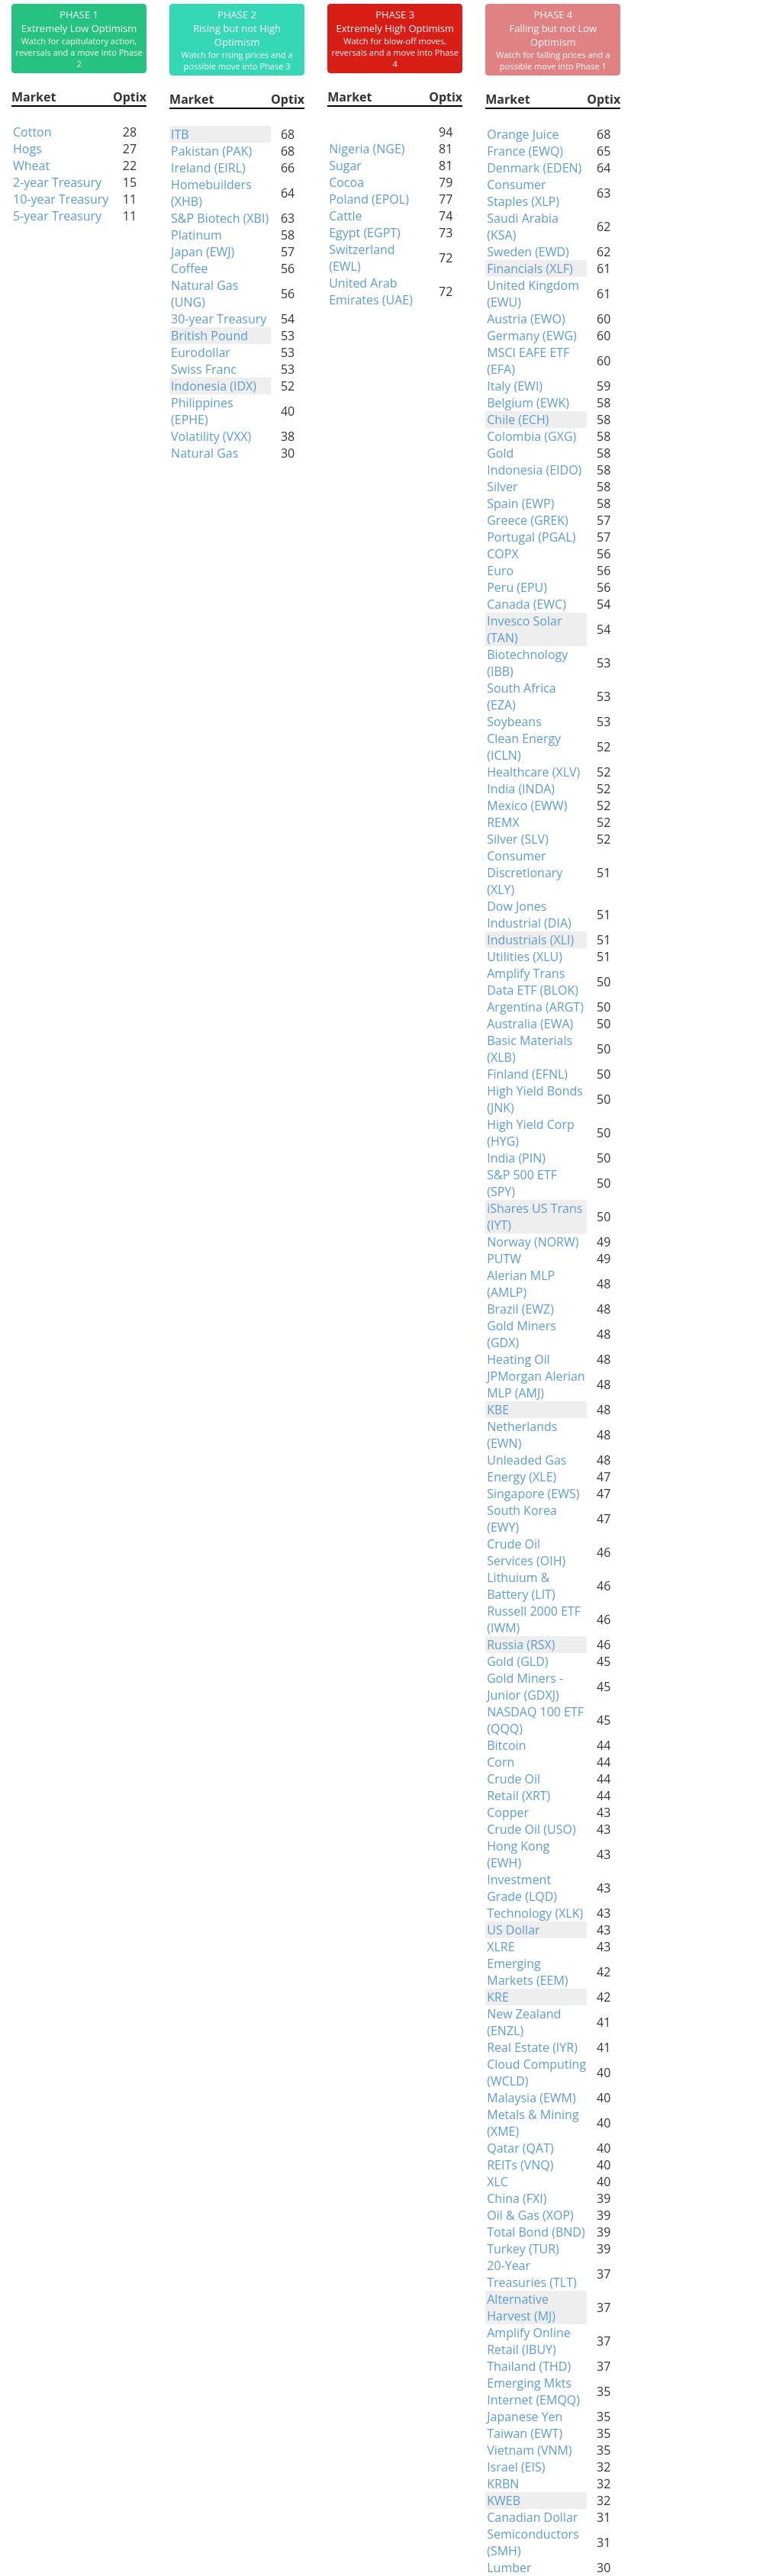
Phase Table
Ranks
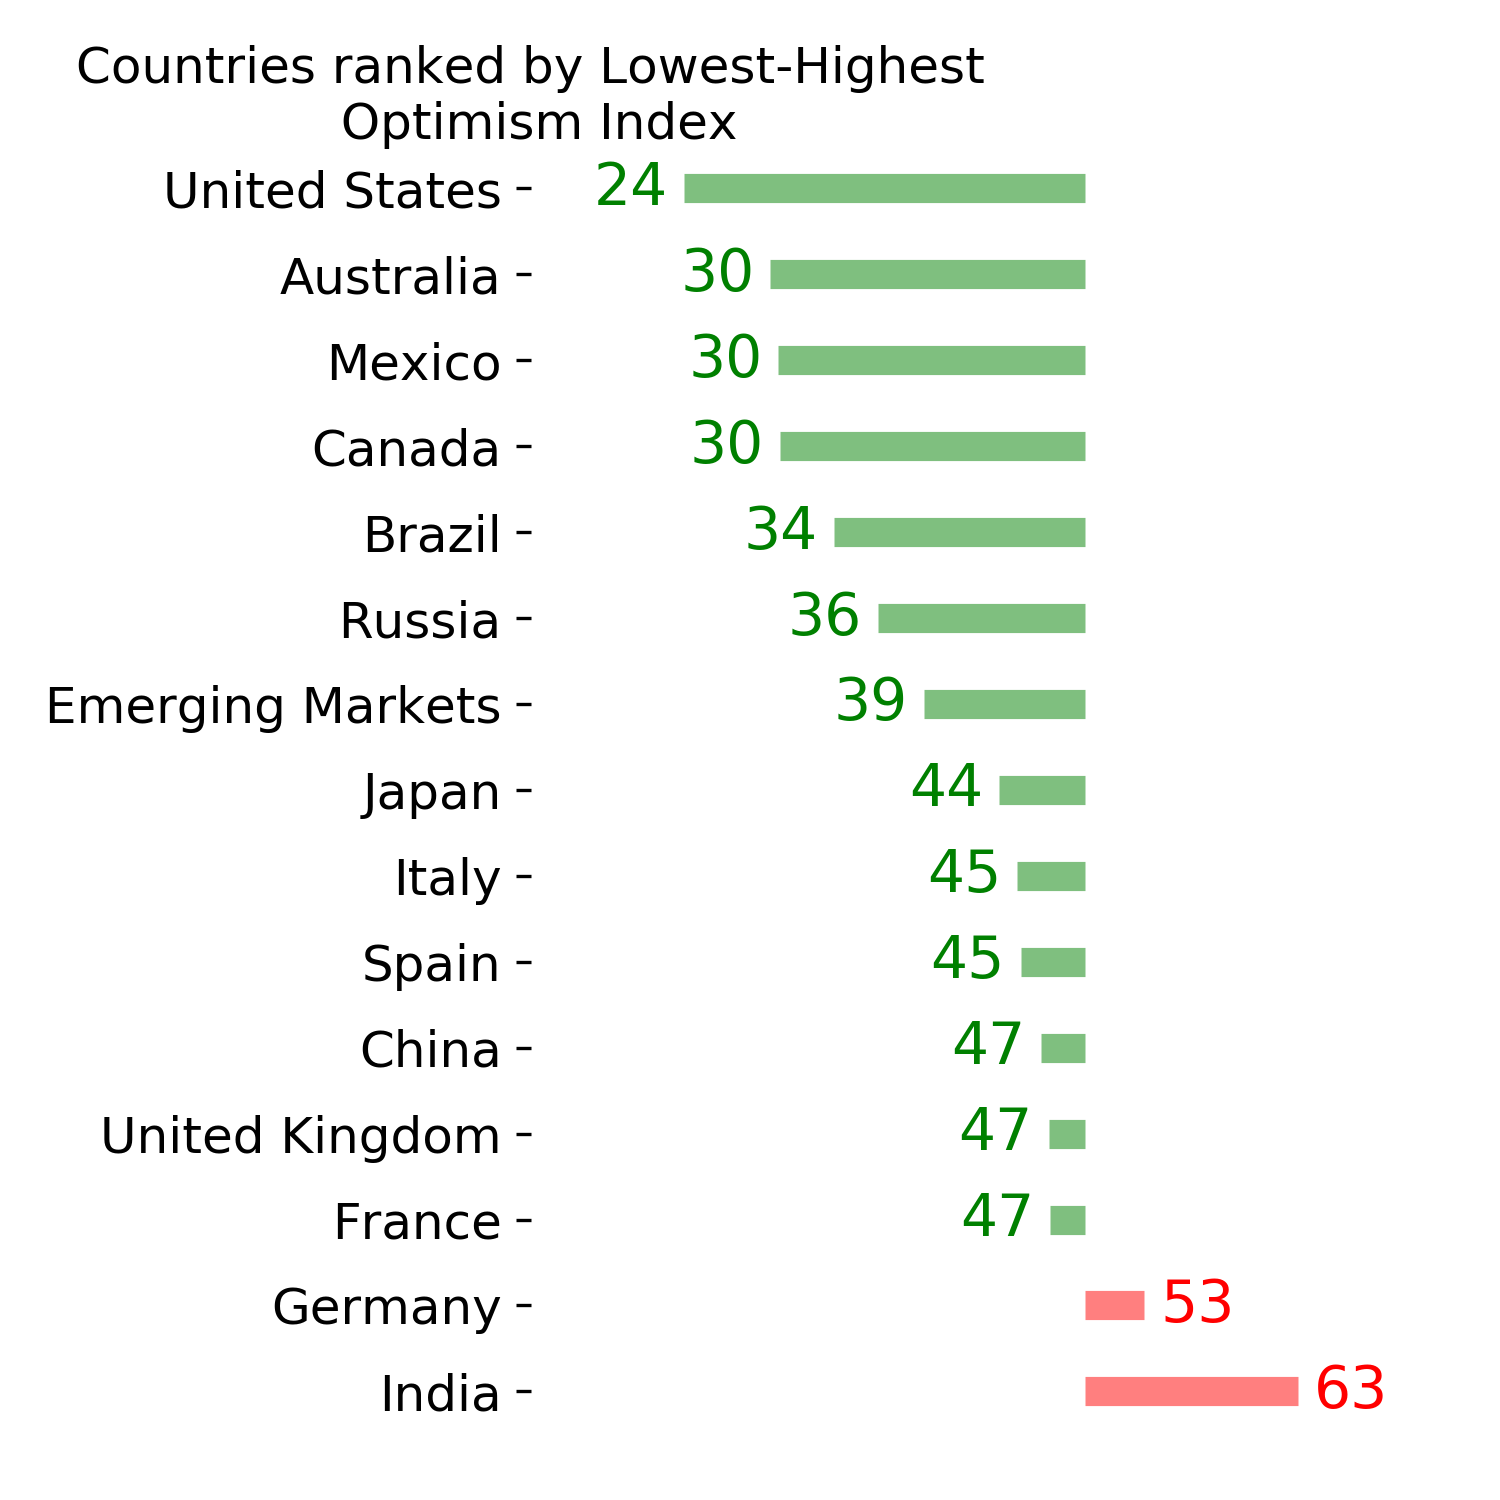
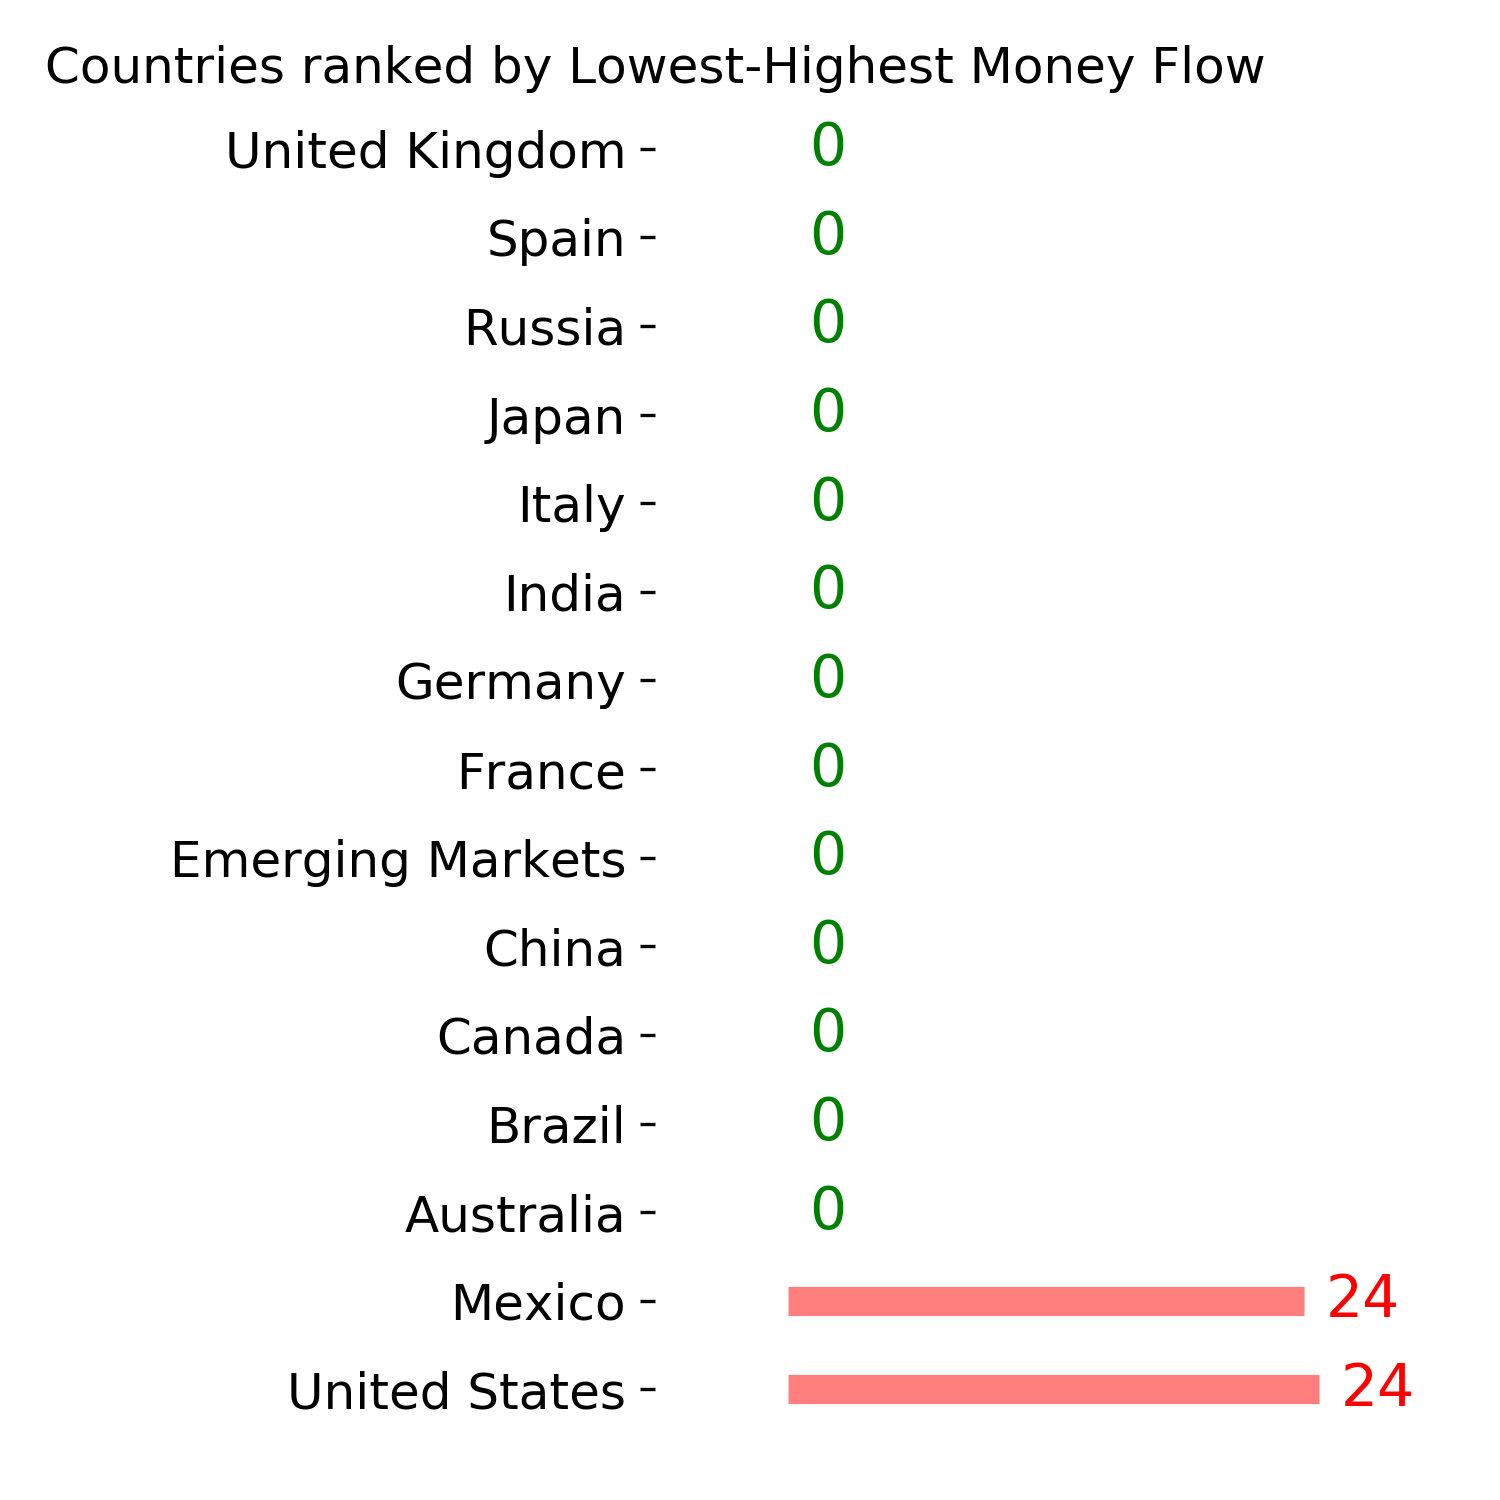
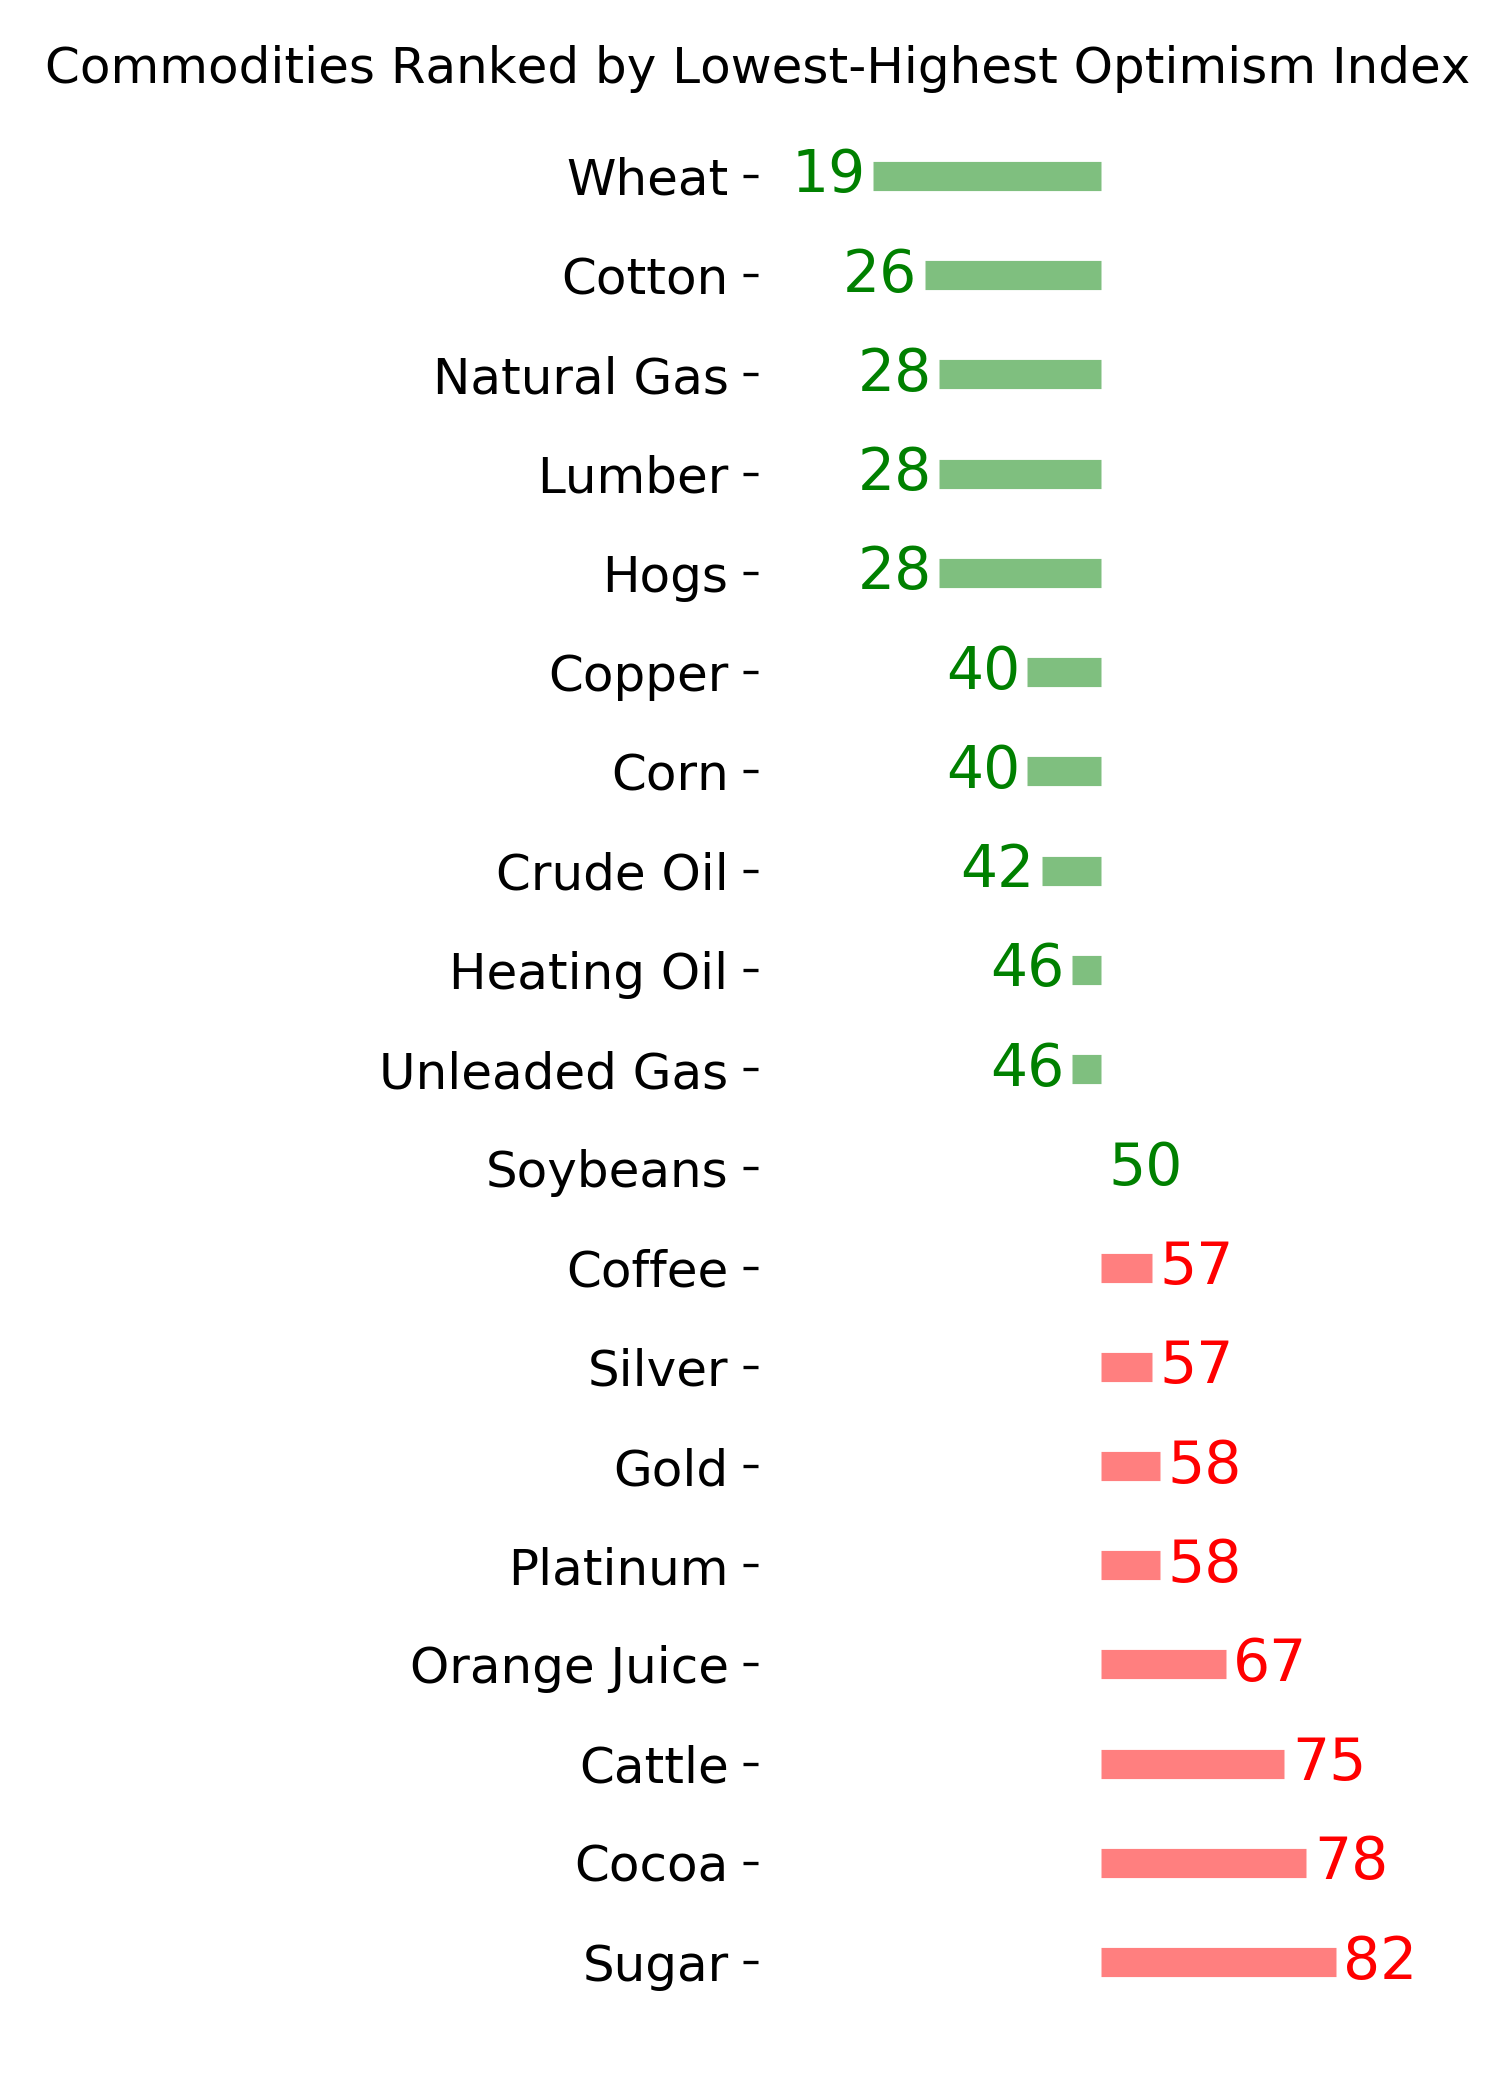
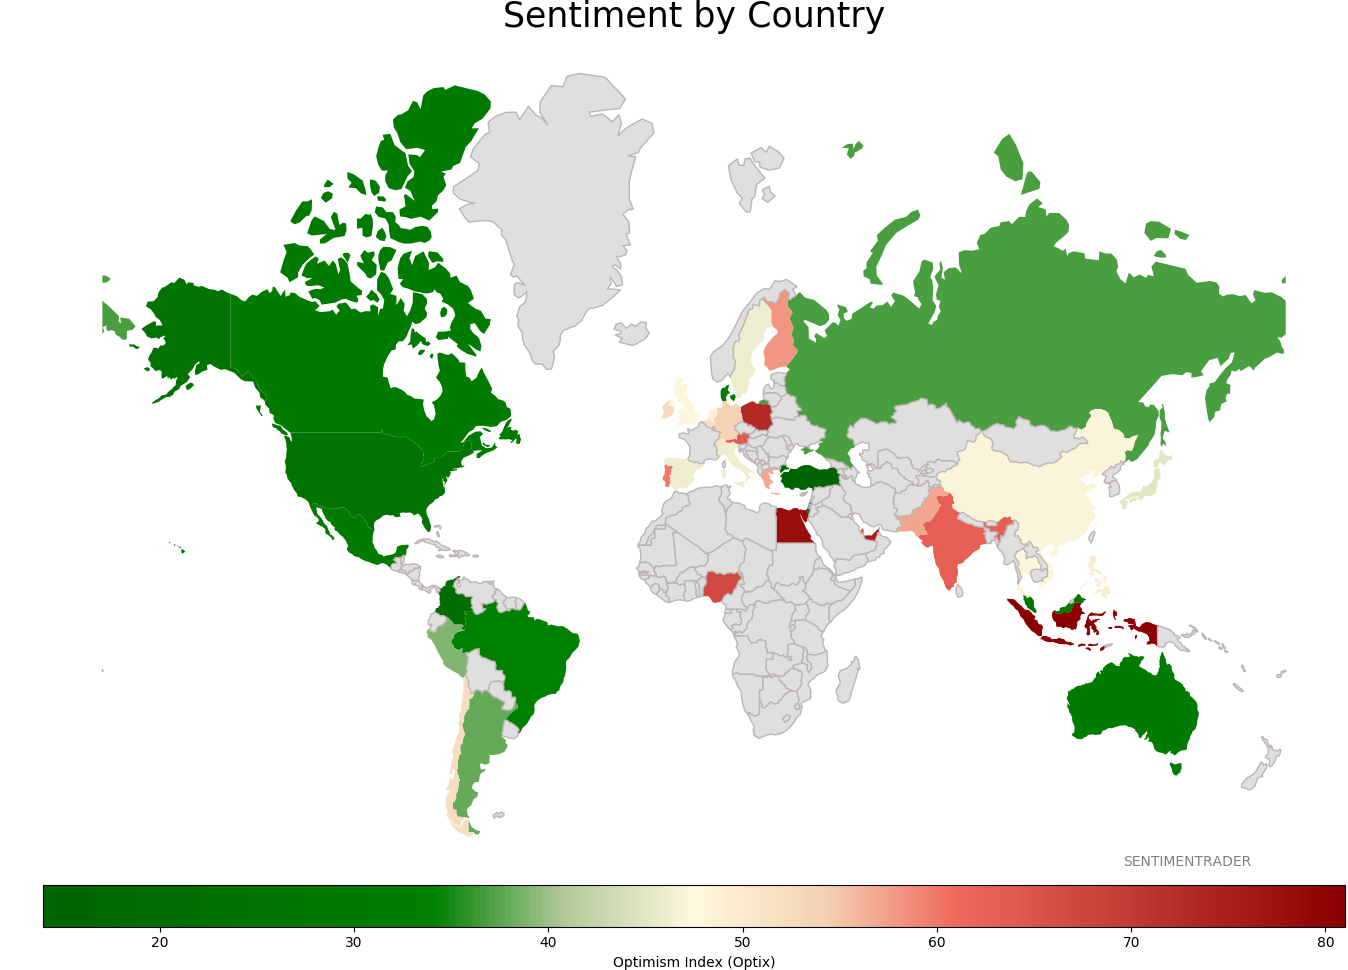
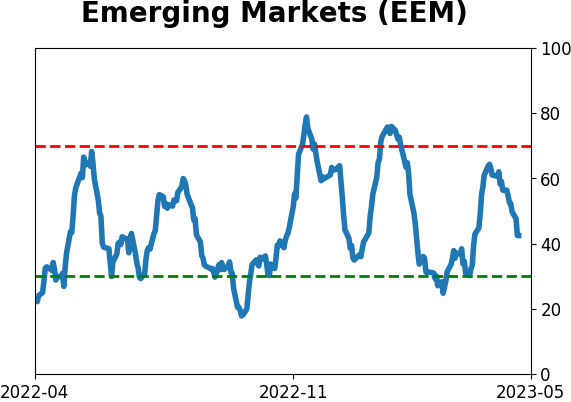
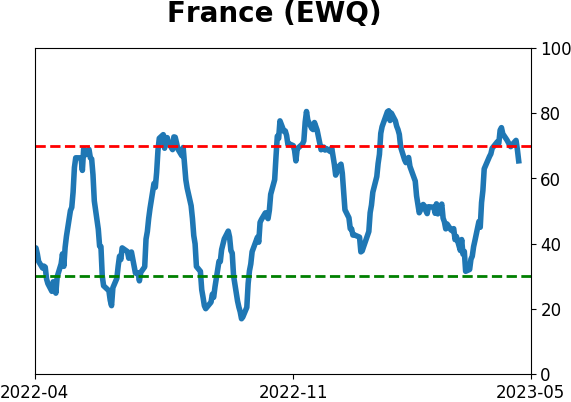
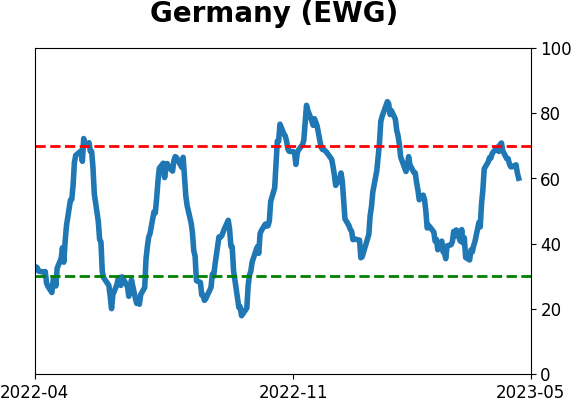
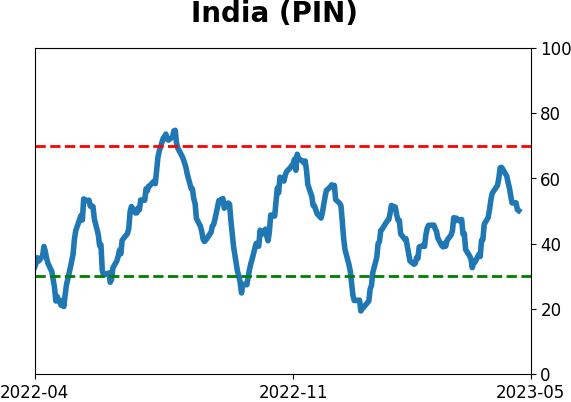
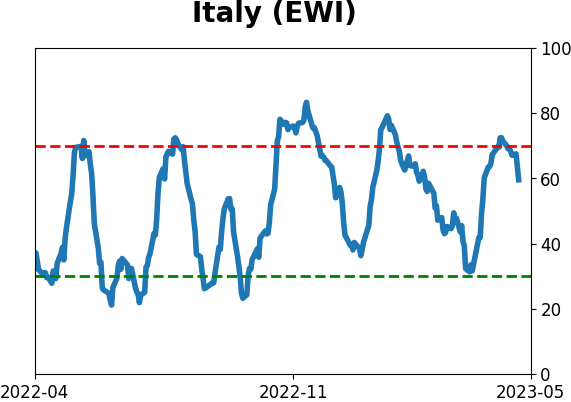
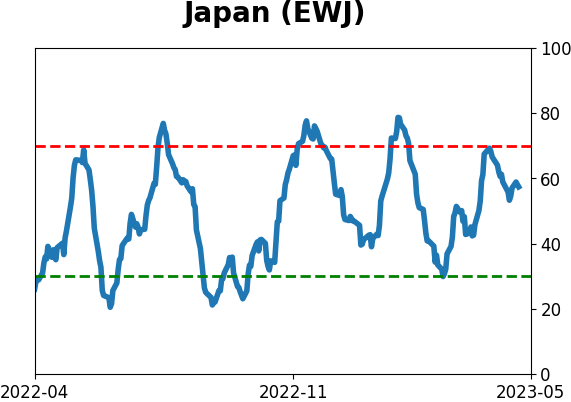
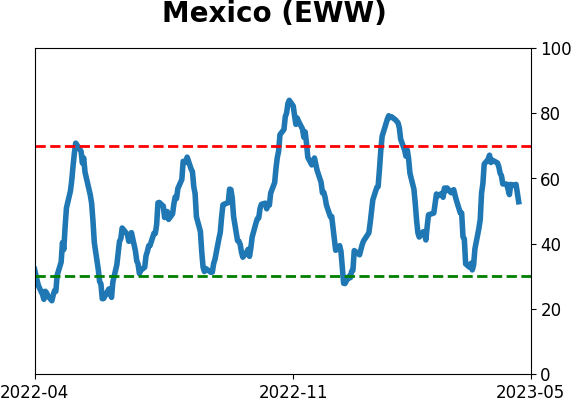
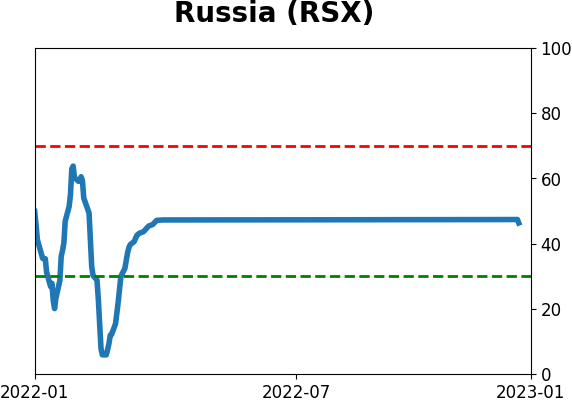
Sentiment Around The World
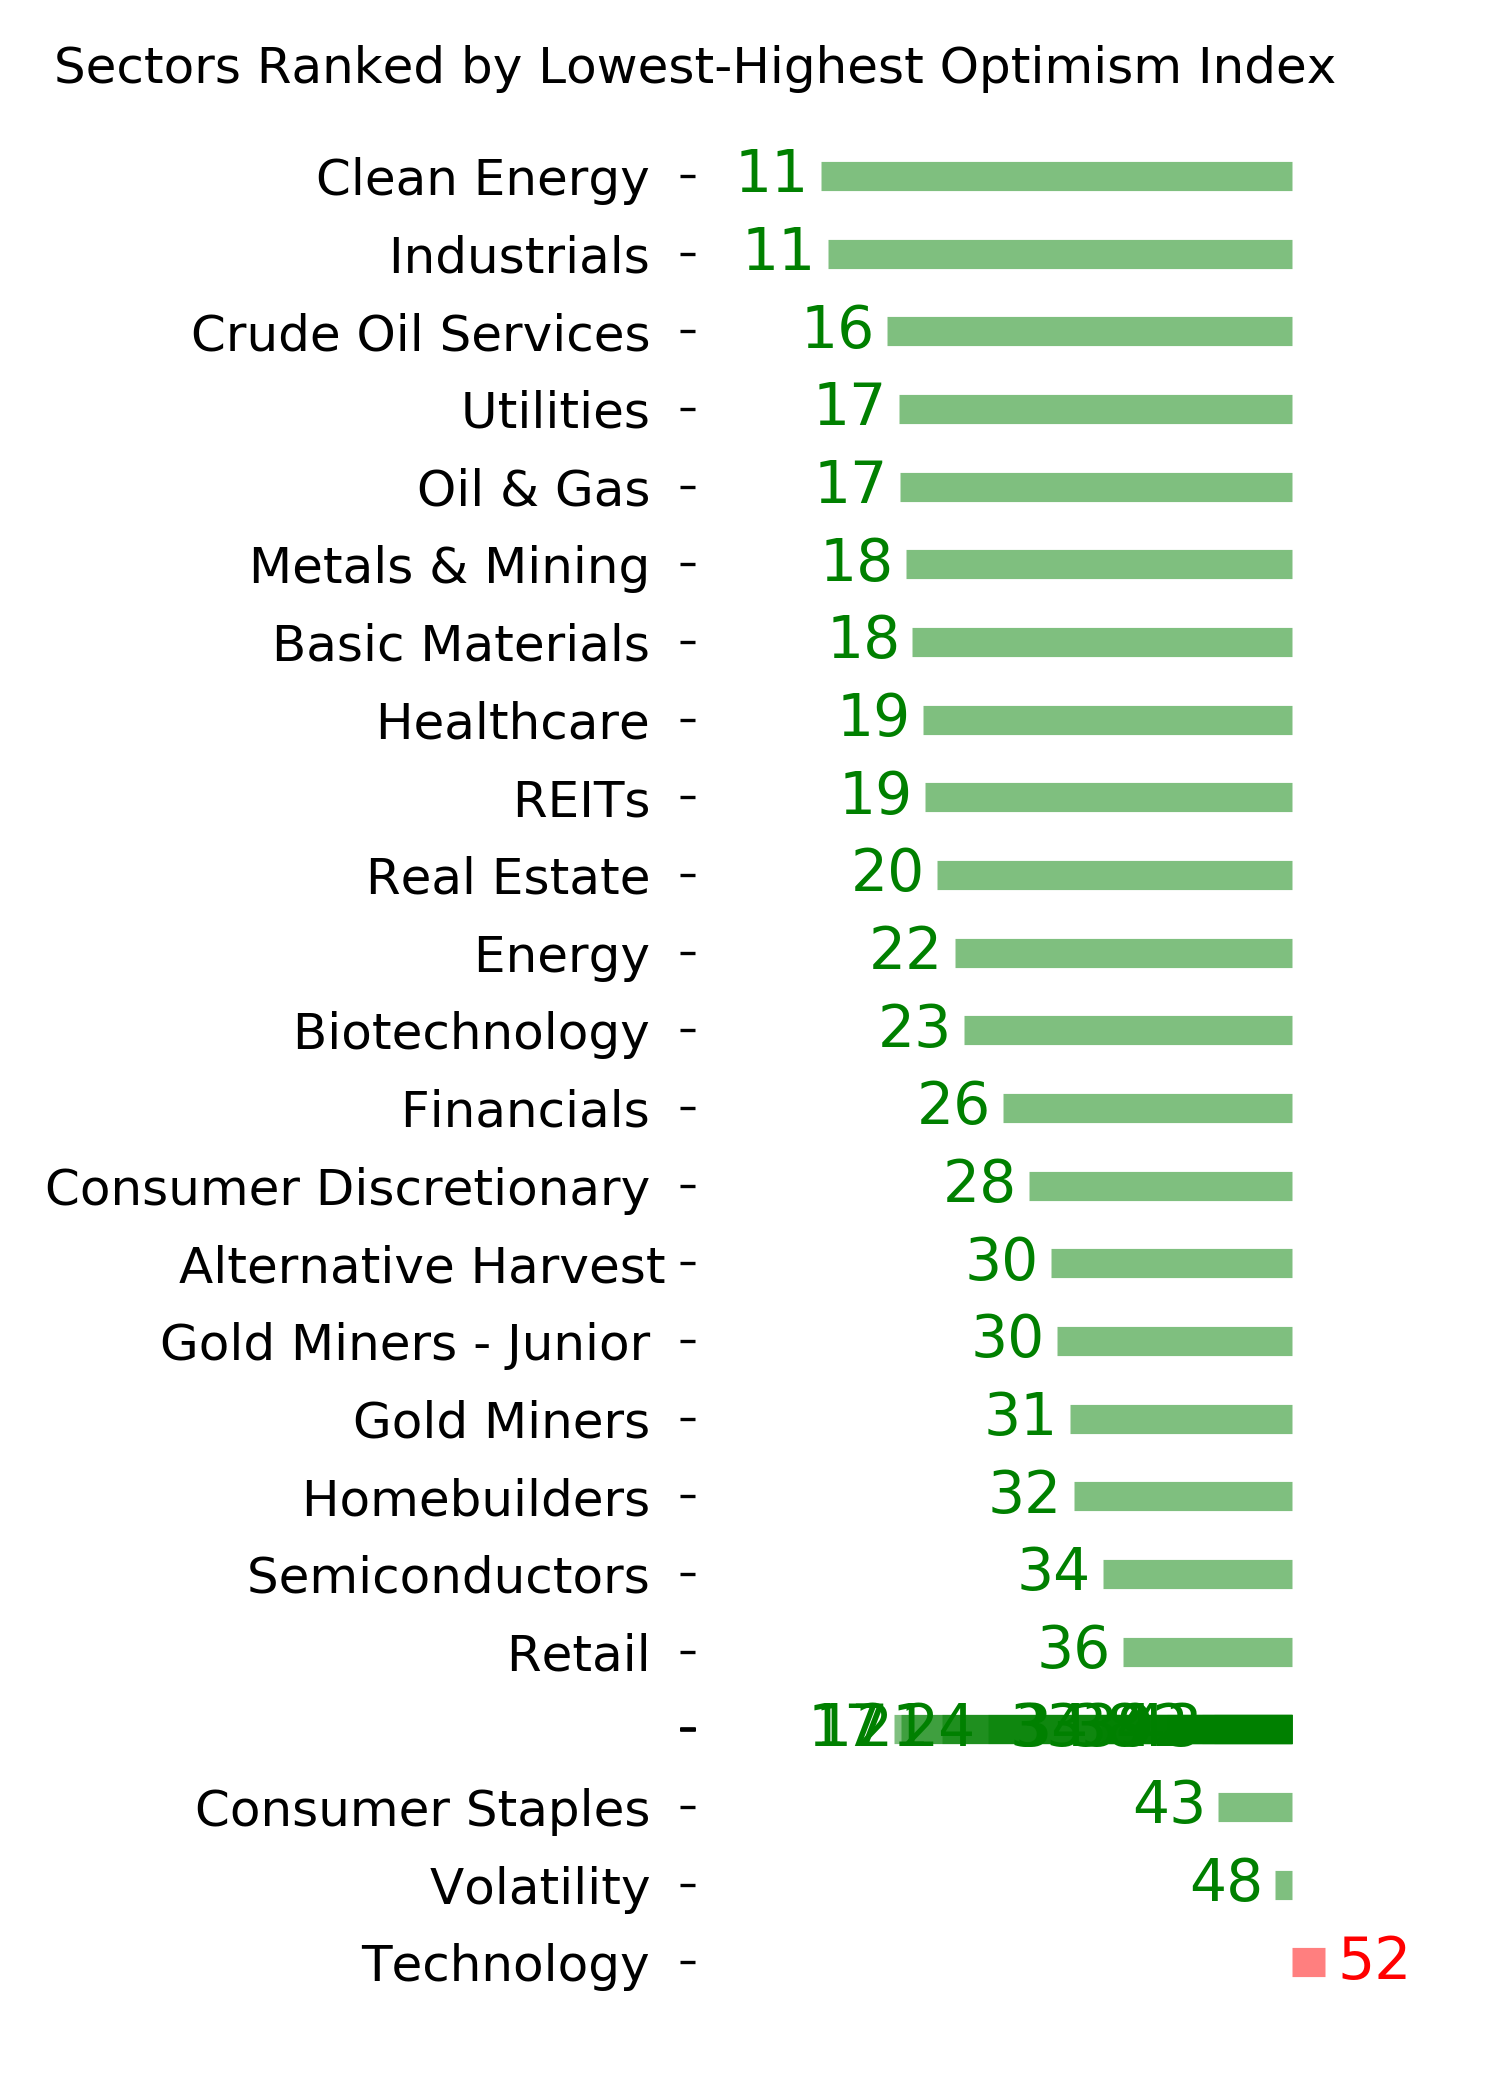
Optimism Index Thumbnails
|
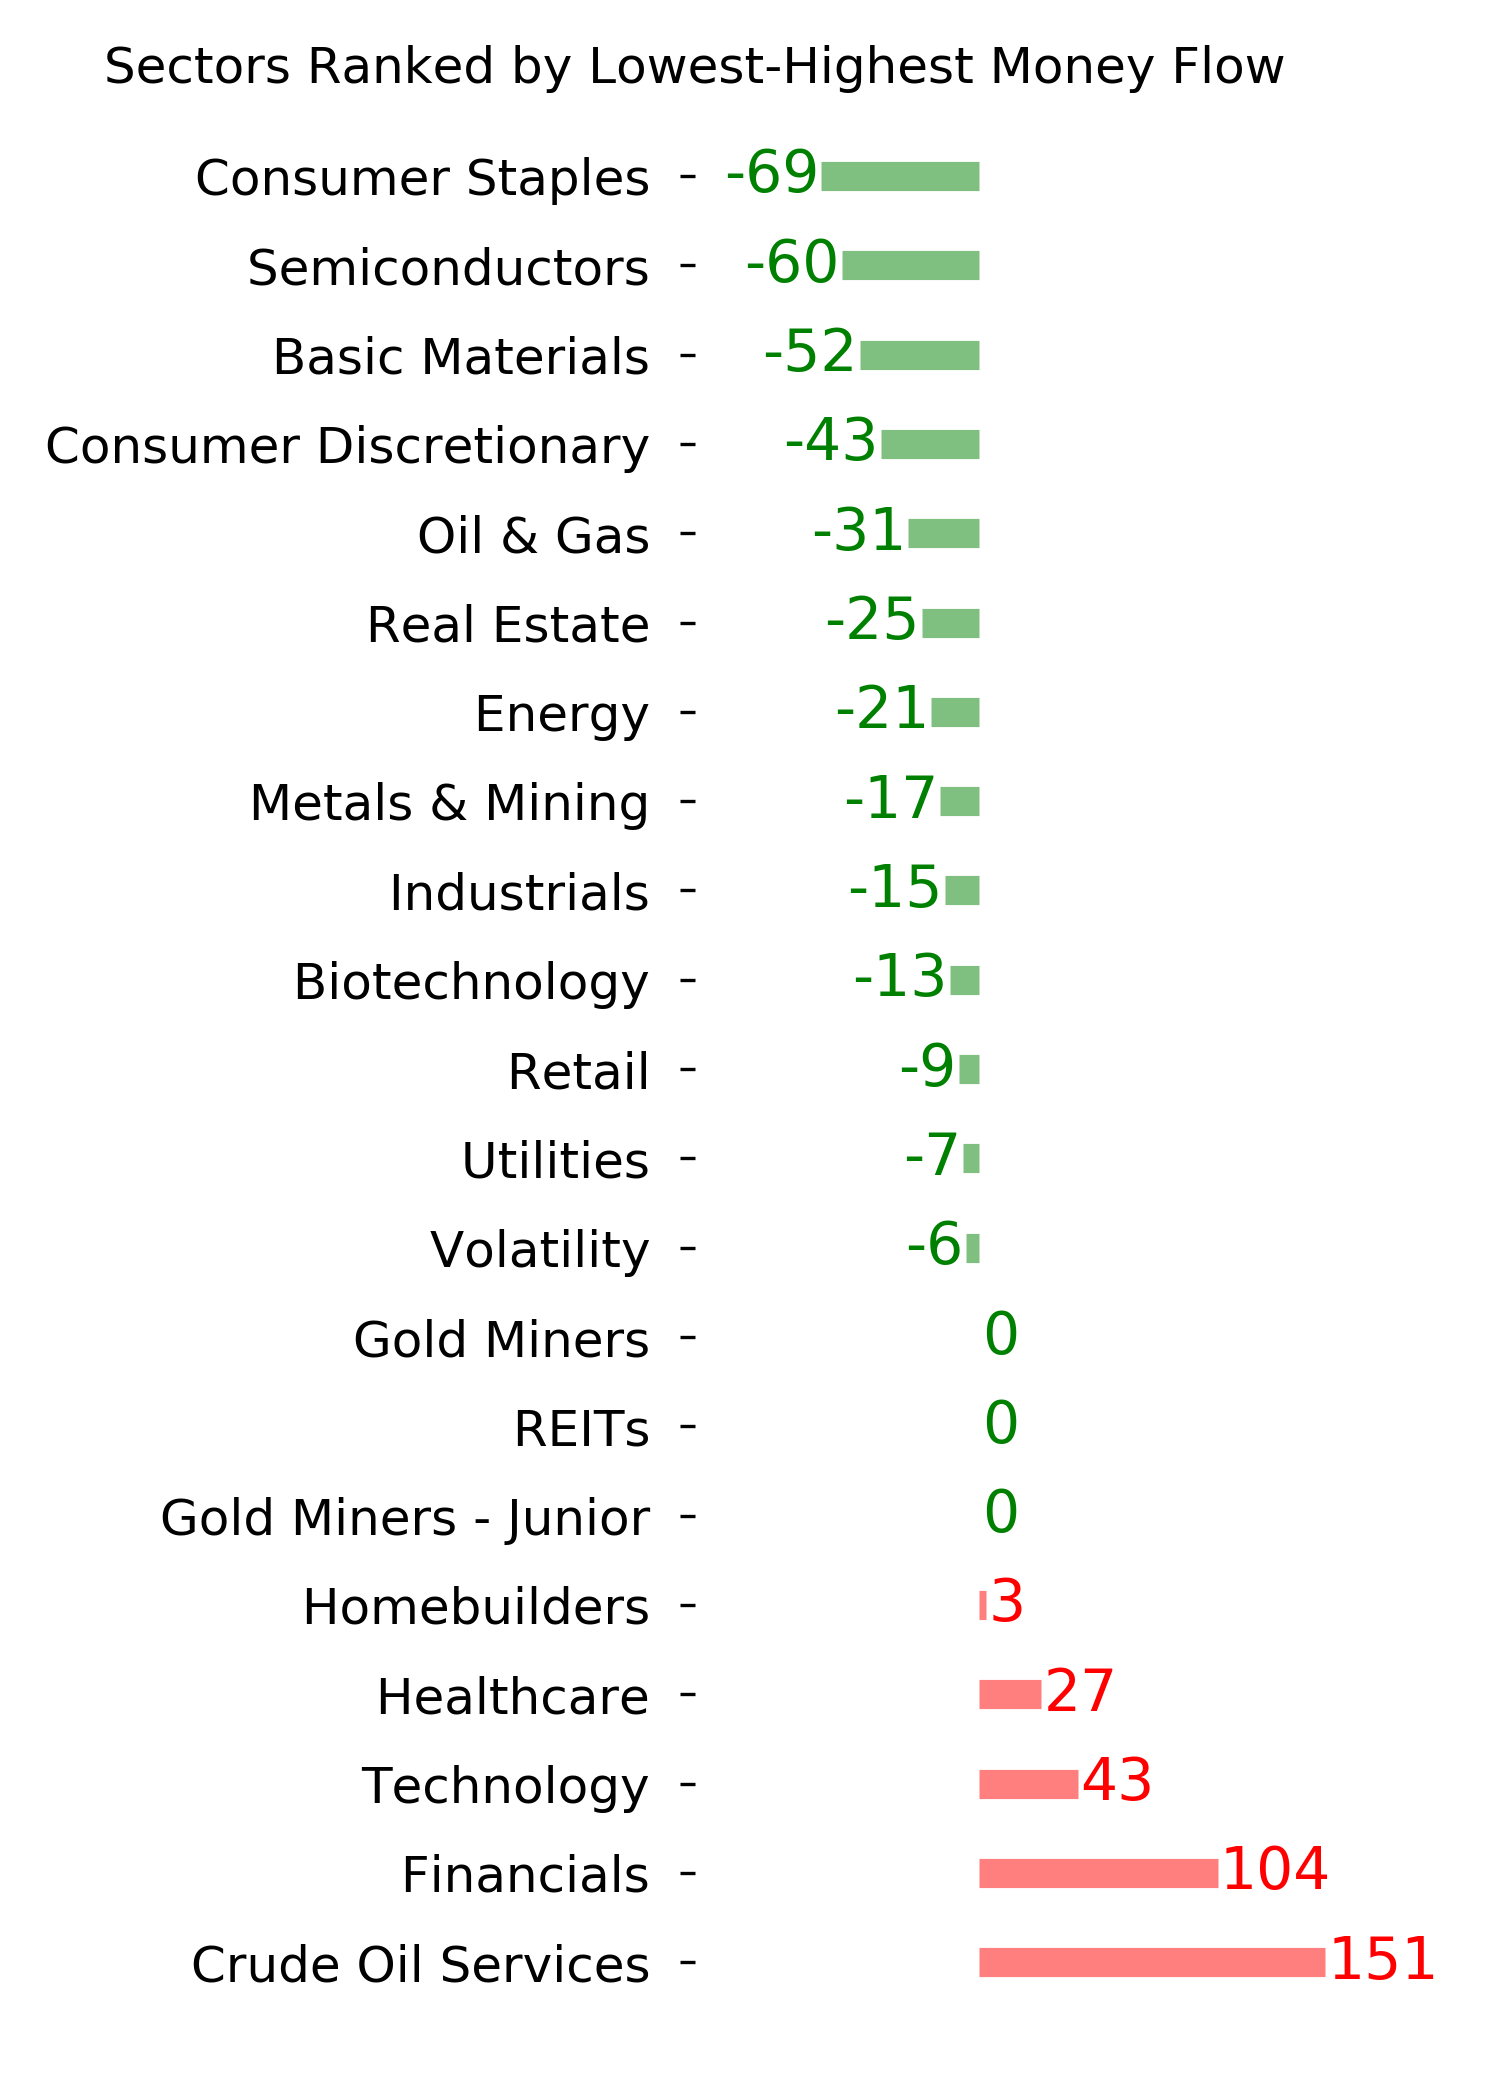
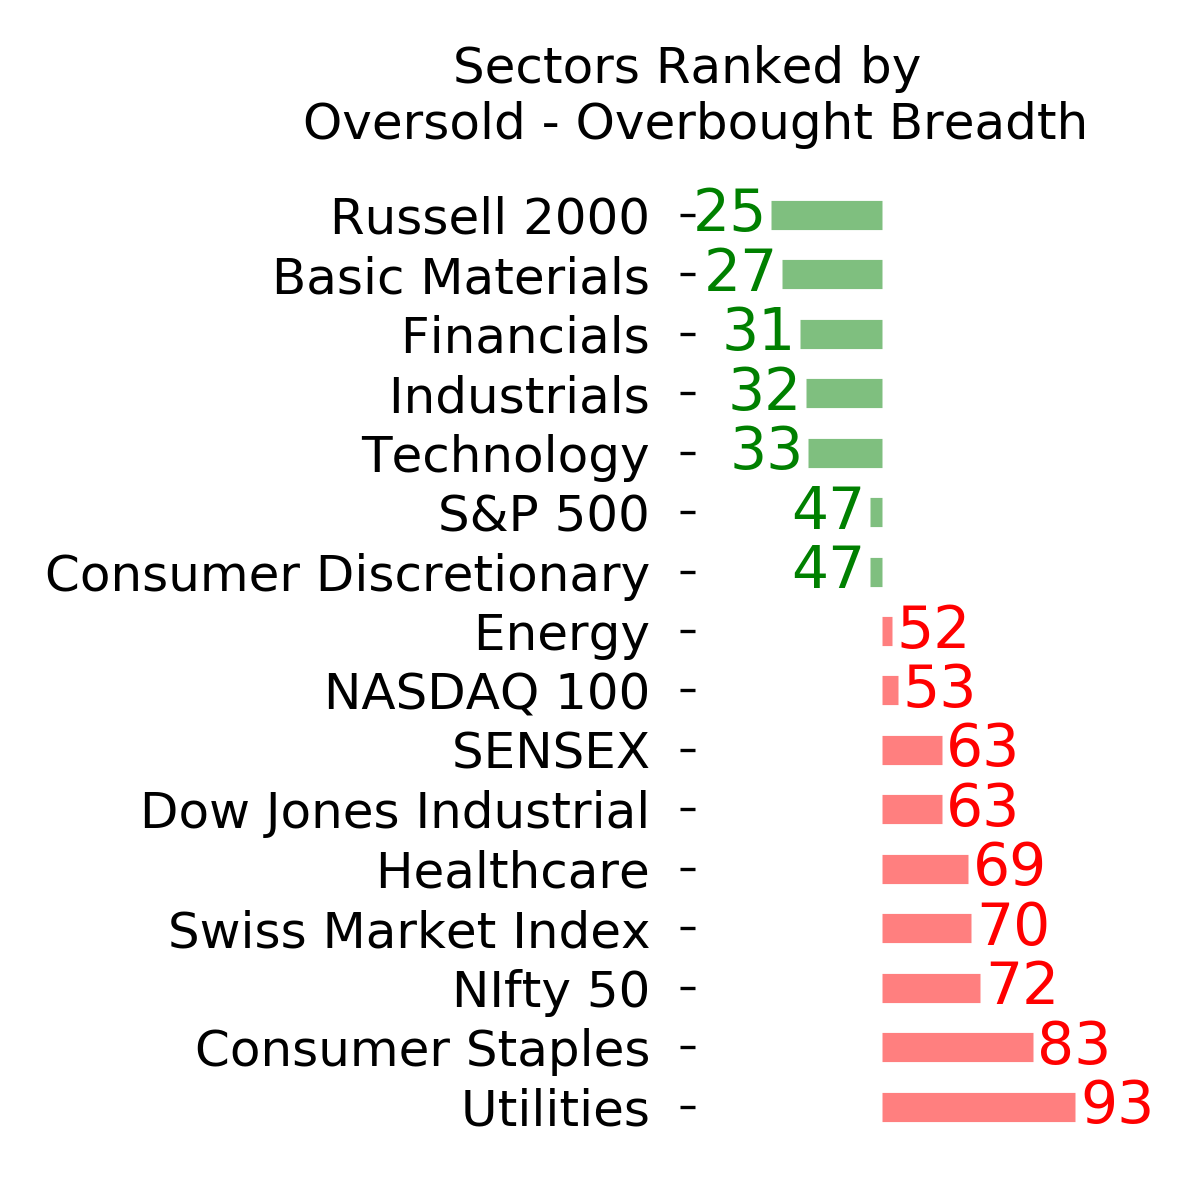
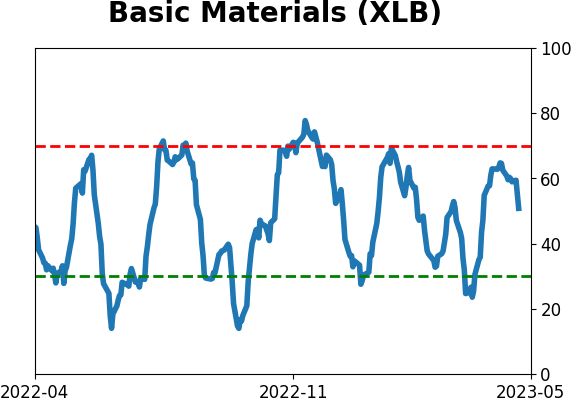
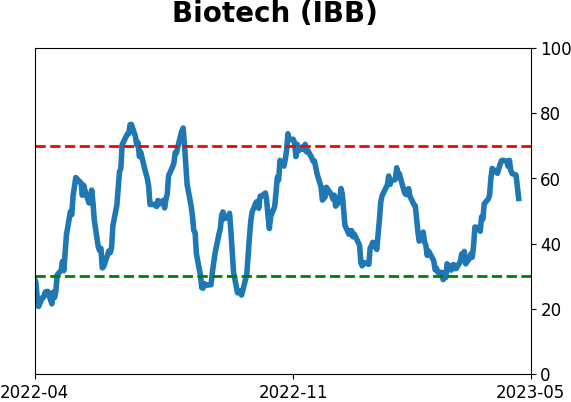
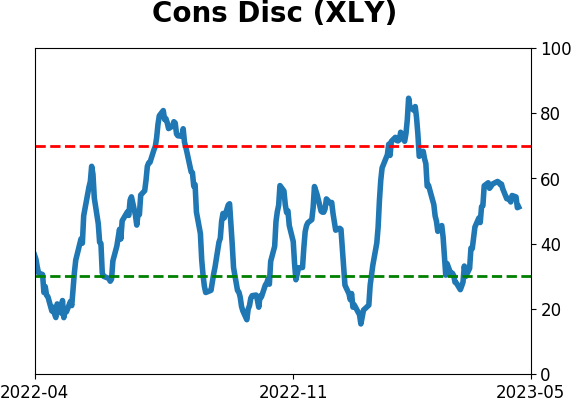
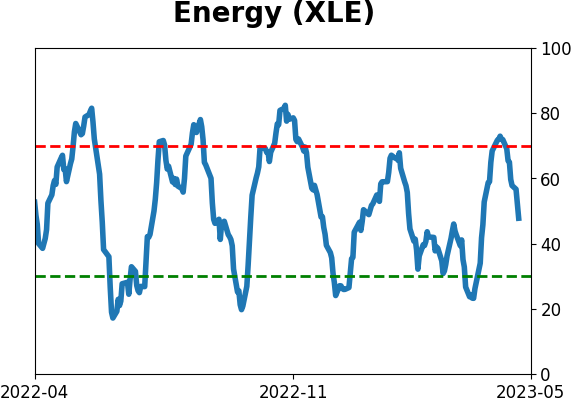
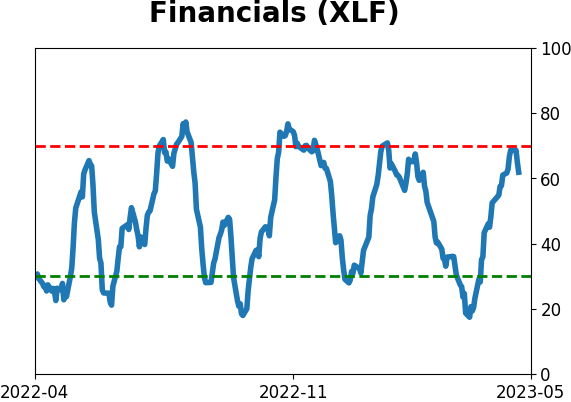
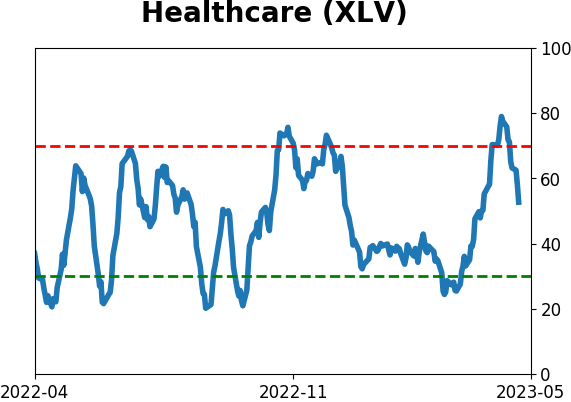
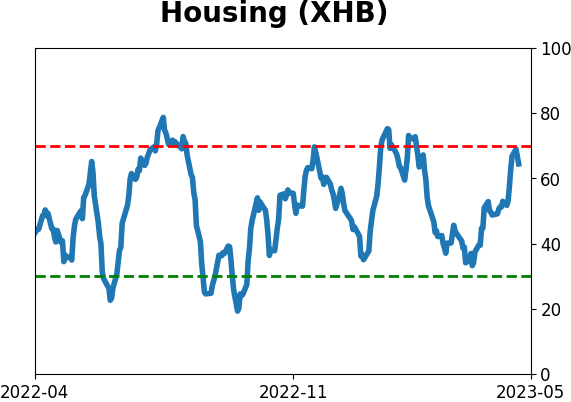
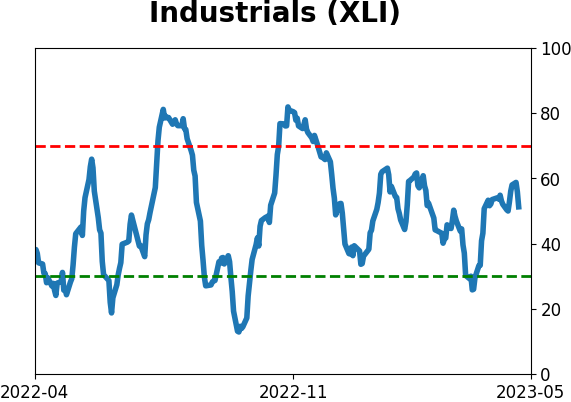
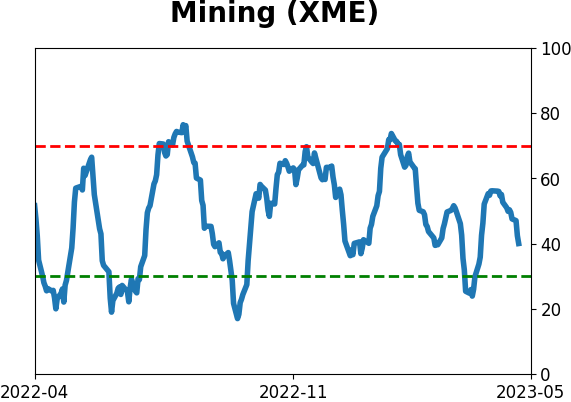
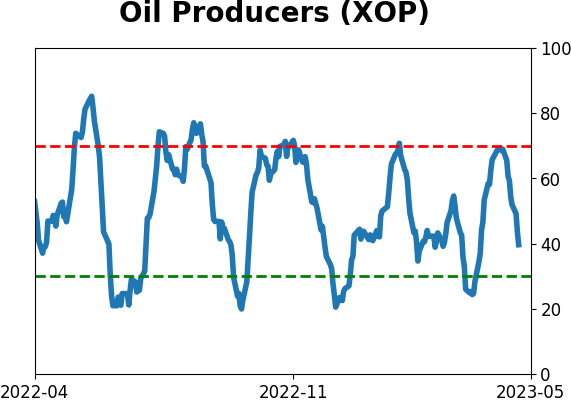
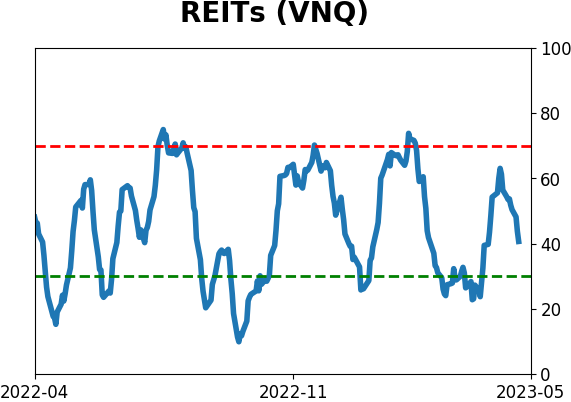
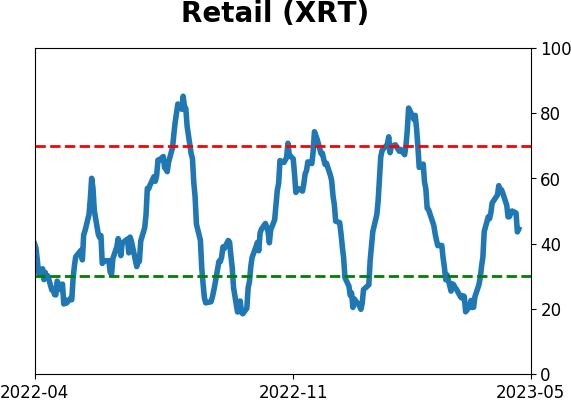
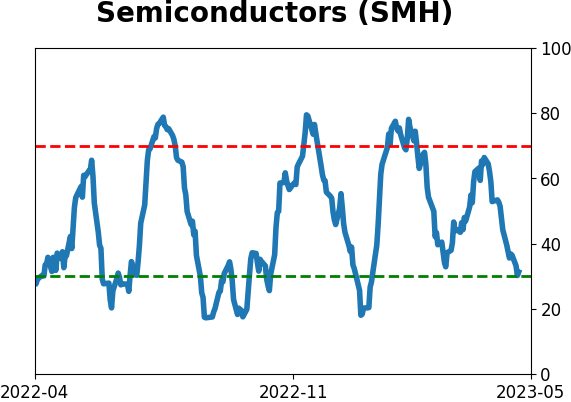
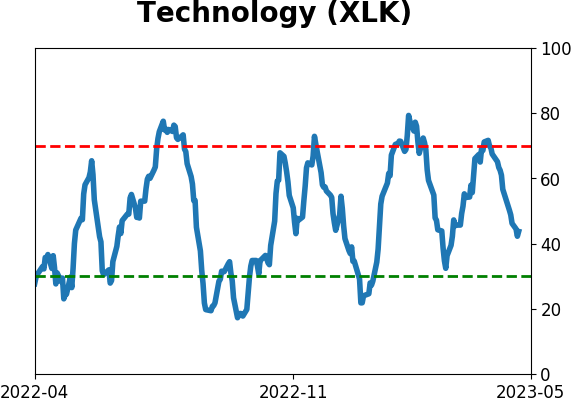
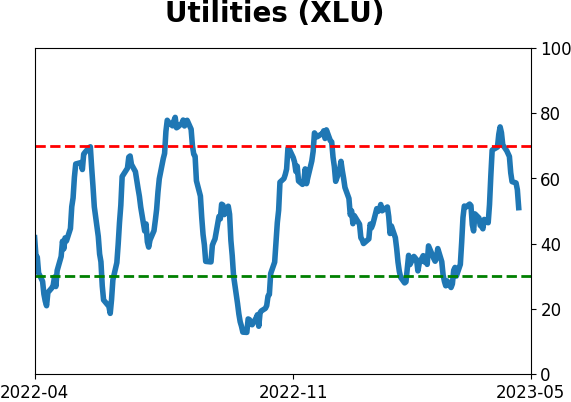
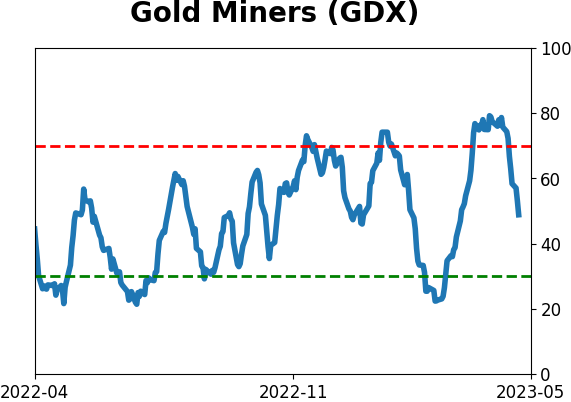
Sector ETF's - 10-Day Moving Average
|
|
|
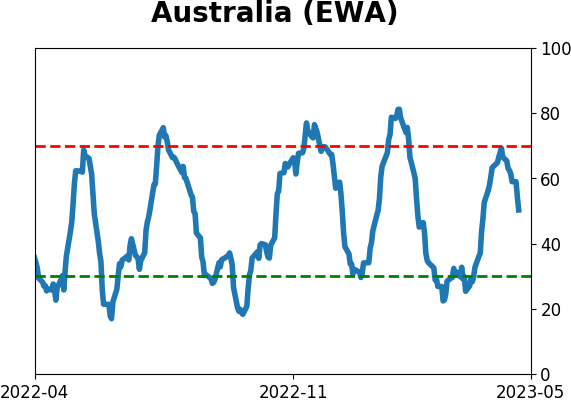
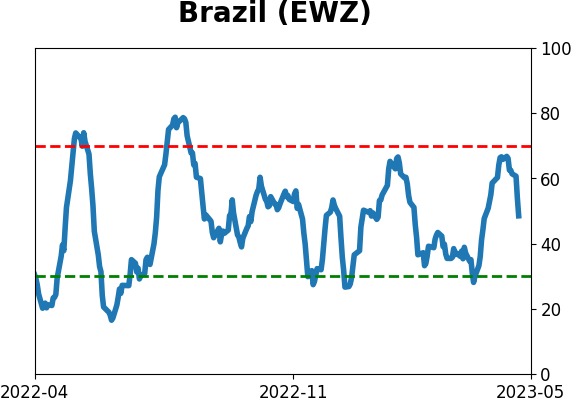
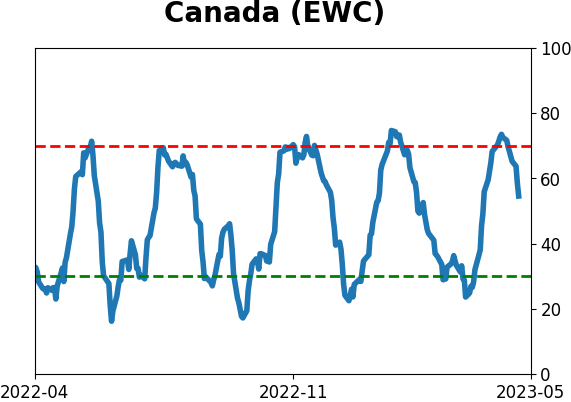
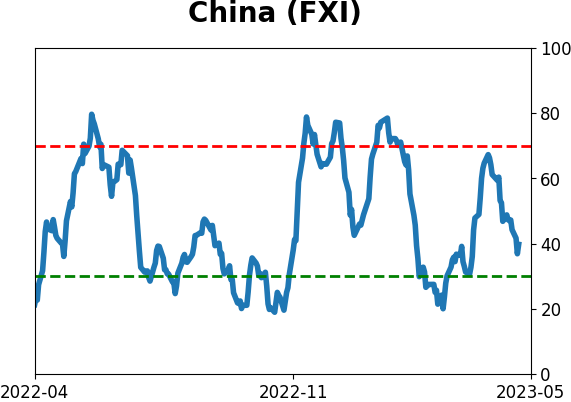
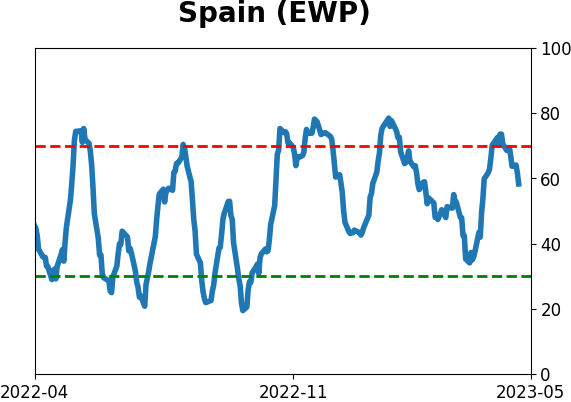
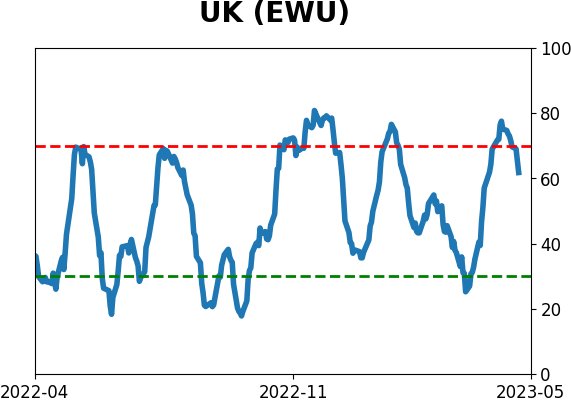
Country ETF's - 10-Day Moving Average
|
|
|
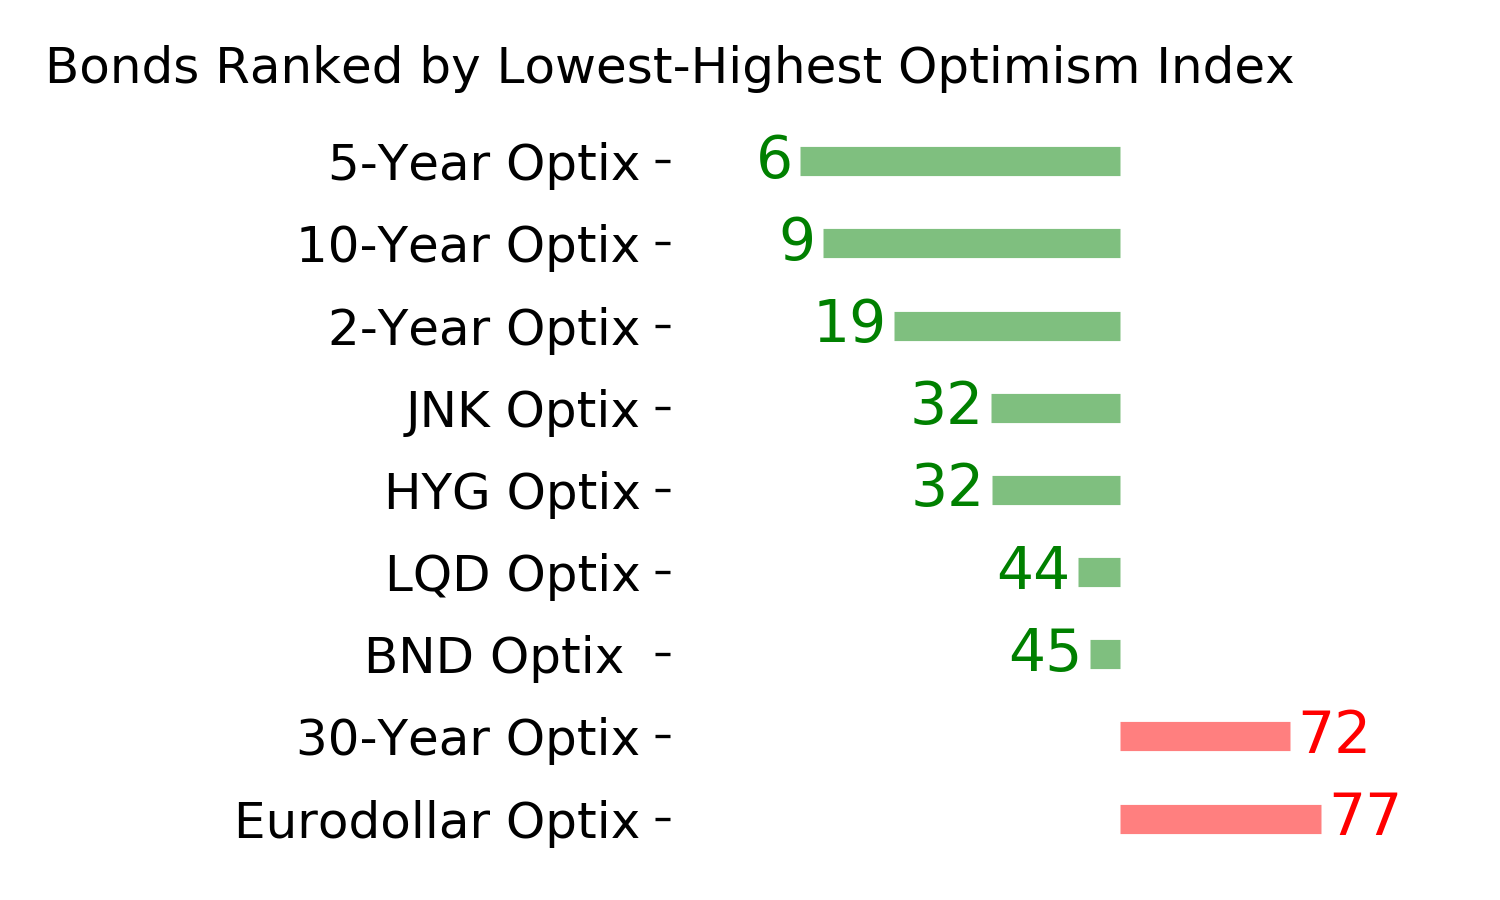
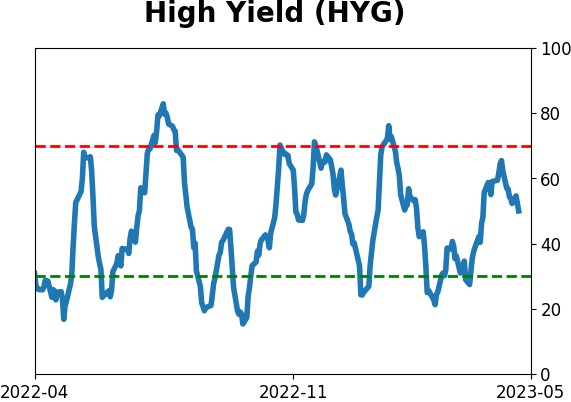
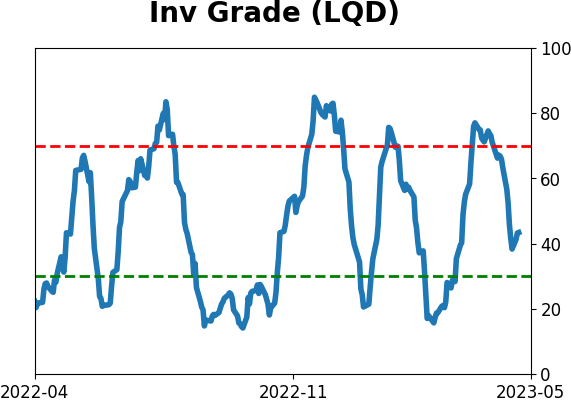
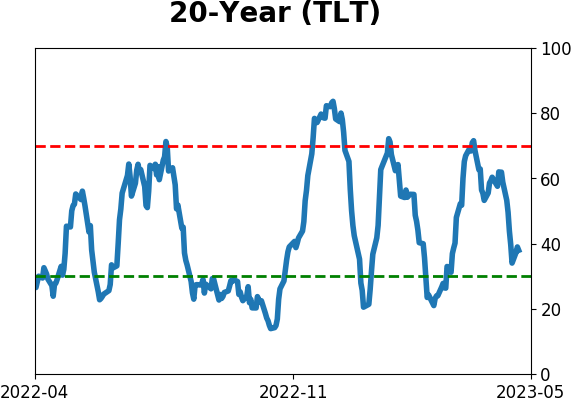
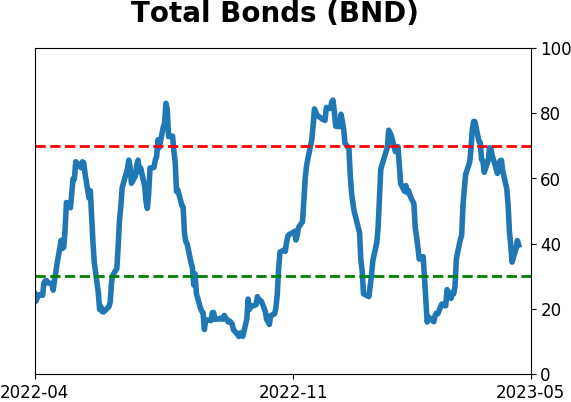
Bond ETF's - 10-Day Moving Average
|
|
|
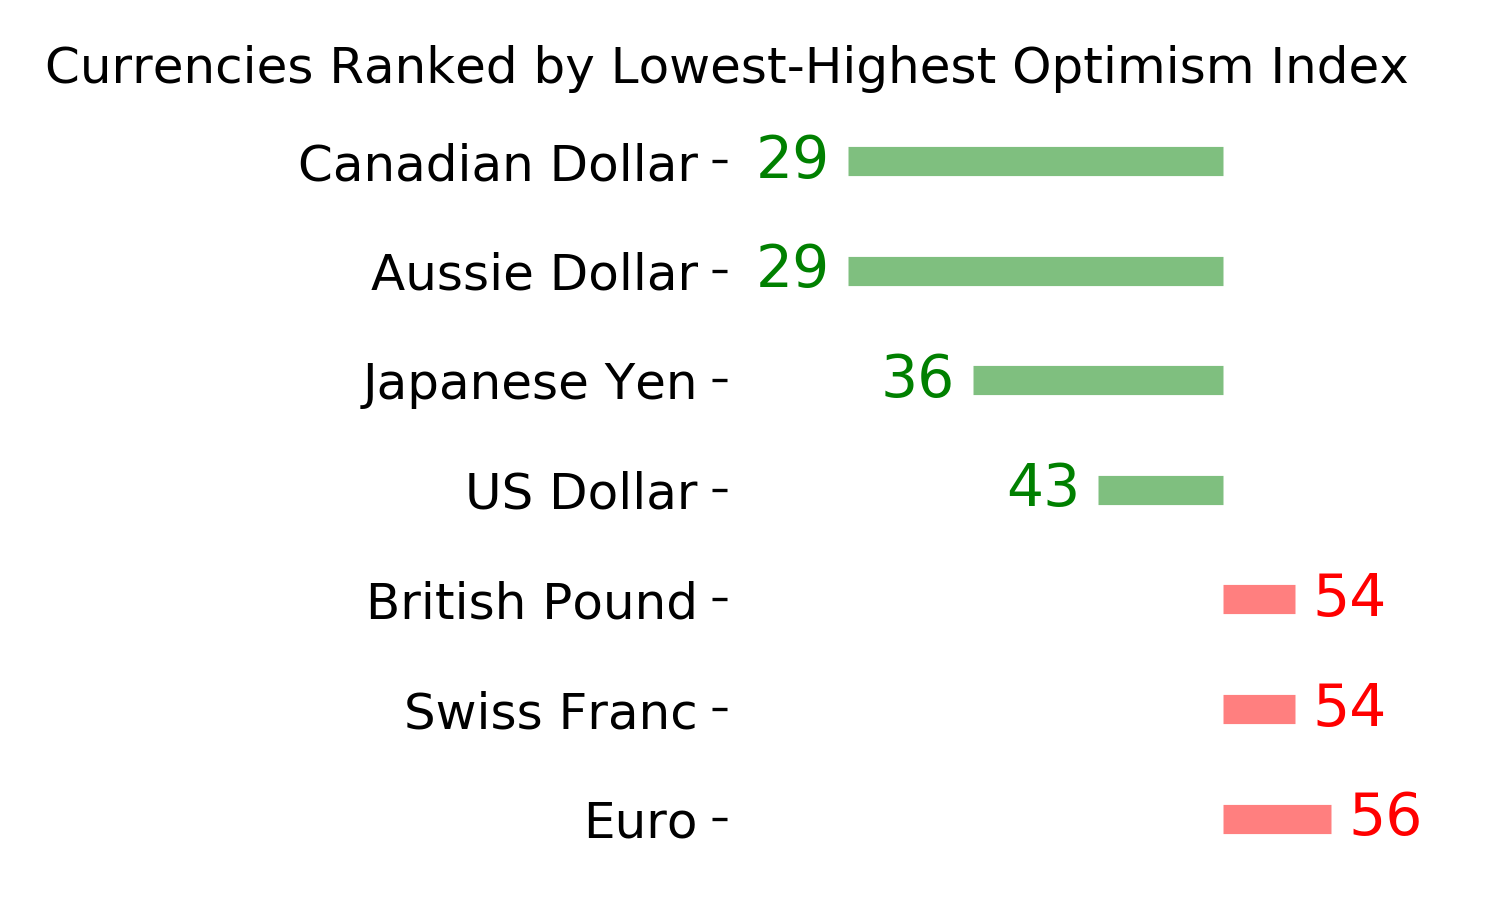
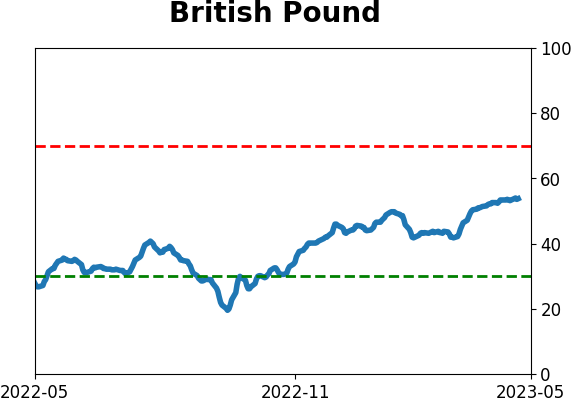
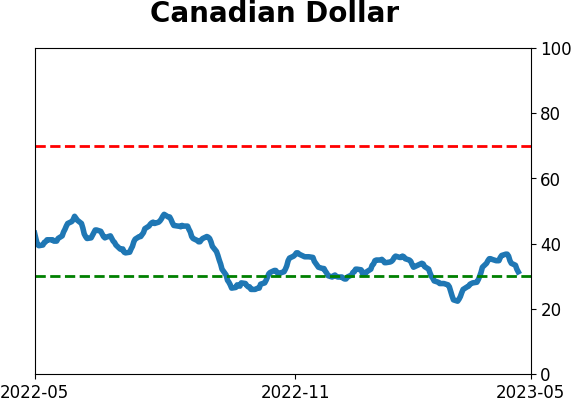
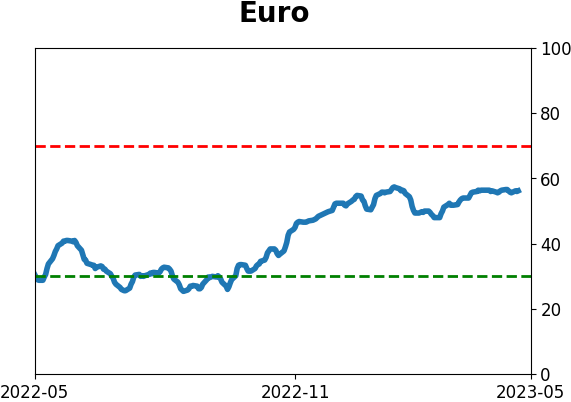
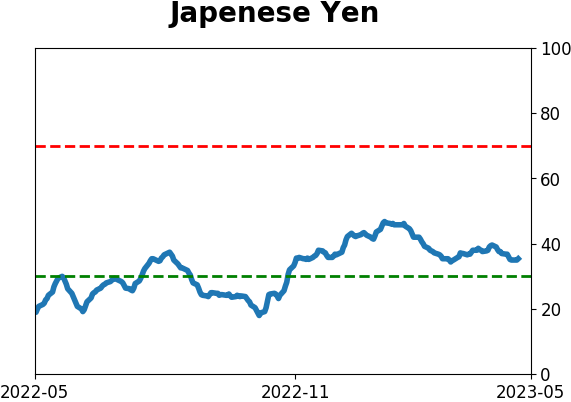
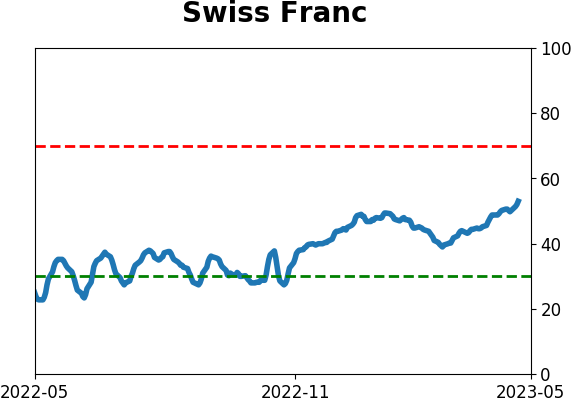
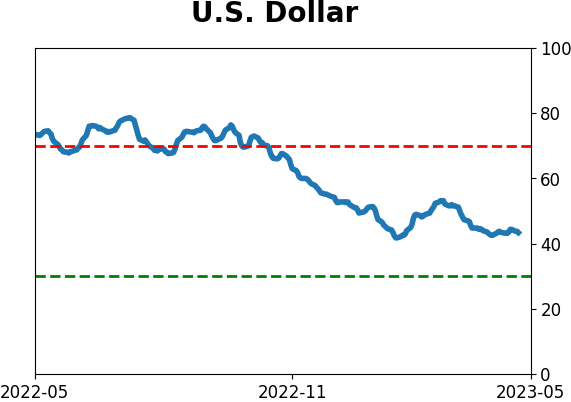
Currency ETF's - 5-Day Moving Average
|
|
|
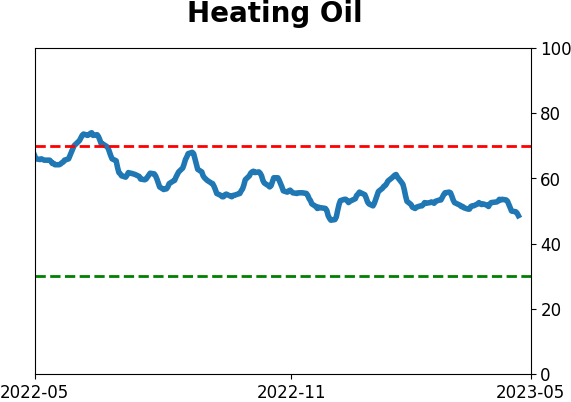
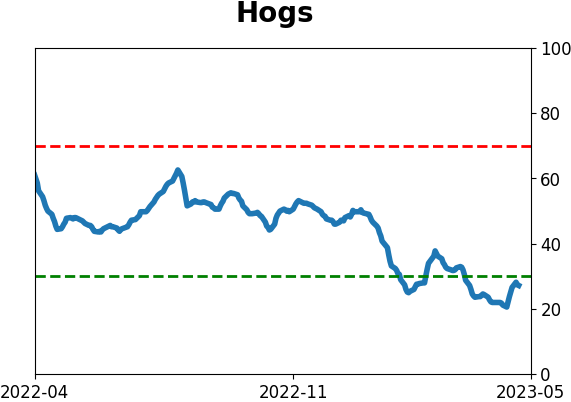
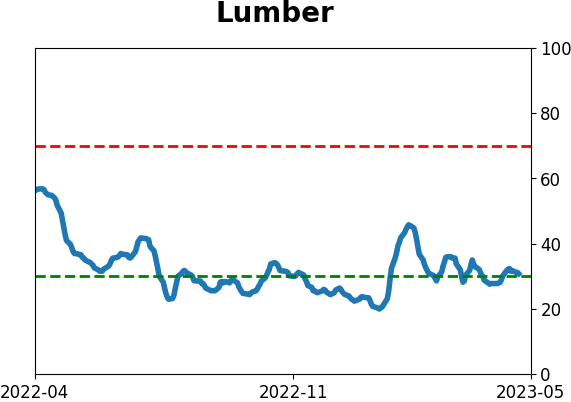
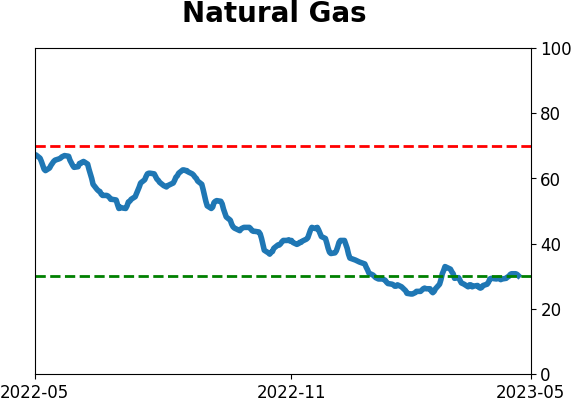
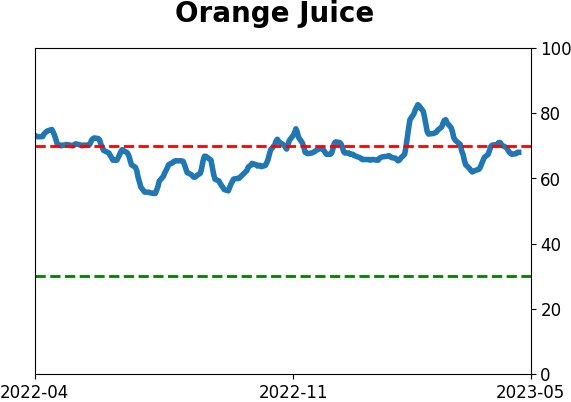
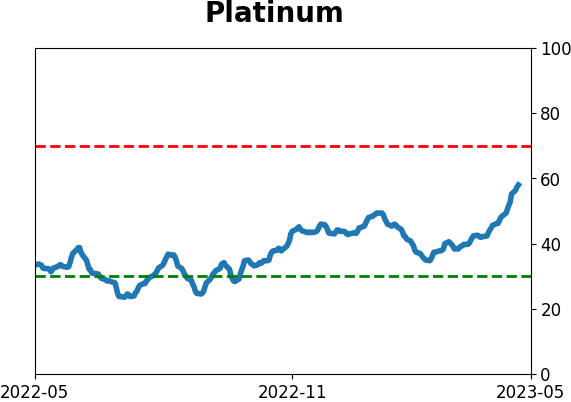
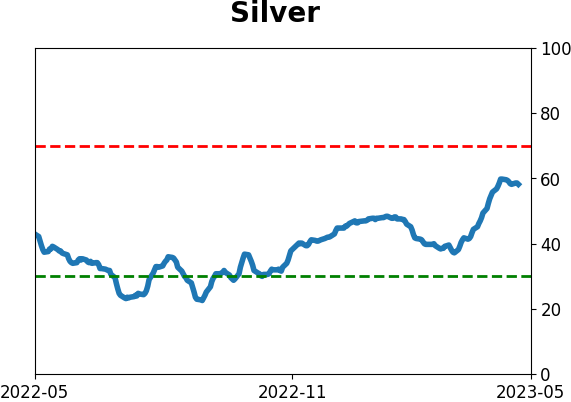
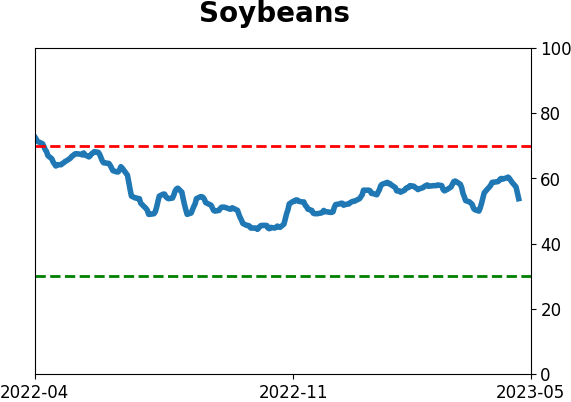
Commodity ETF's - 5-Day Moving Average
|
|