Headlines
|
|
Gold miners have corrected from a major surge:
Gold mining stocks have cycled from extreme oversold to extreme overbought, with fewer than 10% of members trading above their 200-day averages to more than 90% doing so. Similar cycles over the past 40 years had a strong tendency to lead to medium- to long-term gains in gold and mining stocks.
|
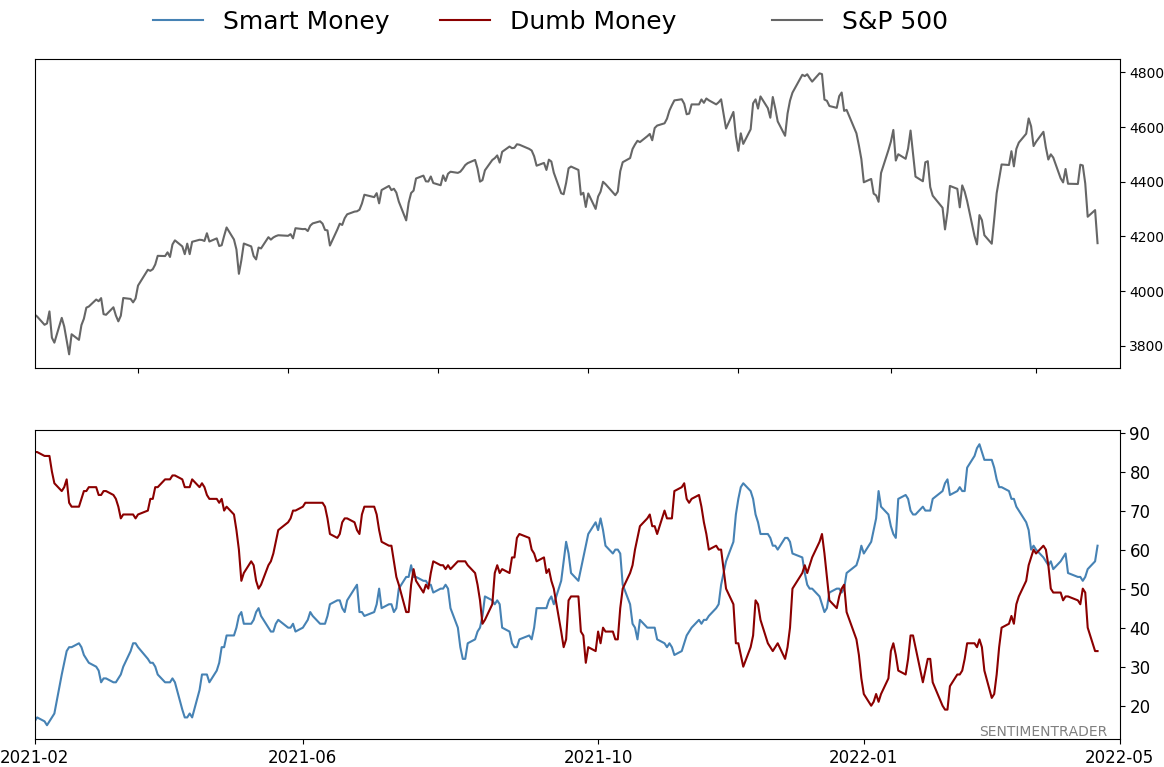
Smart / Dumb Money Confidence
|
Smart Money Confidence: 61%
Dumb Money Confidence: 34%
|
|
Risk Levels
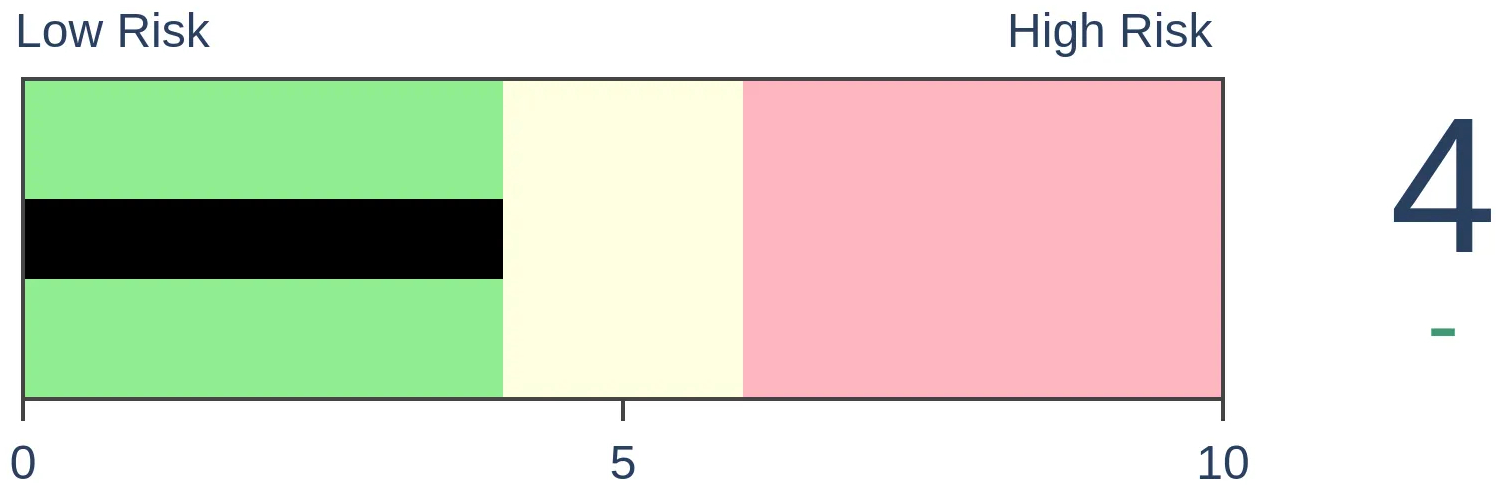
Stocks Short-Term
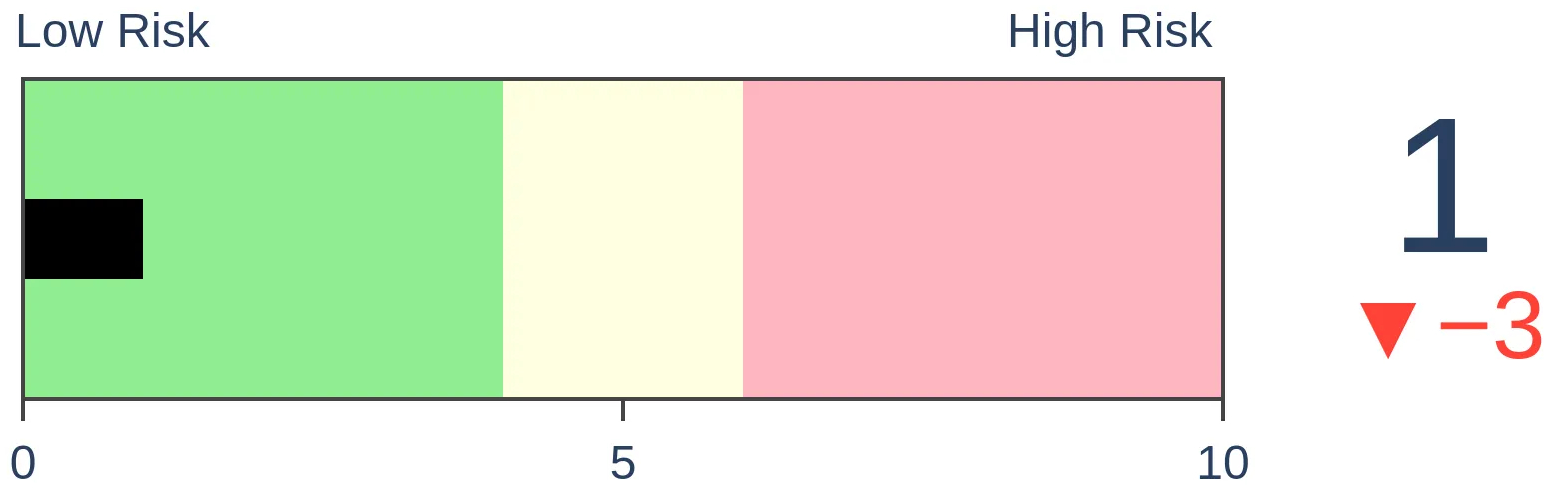
|
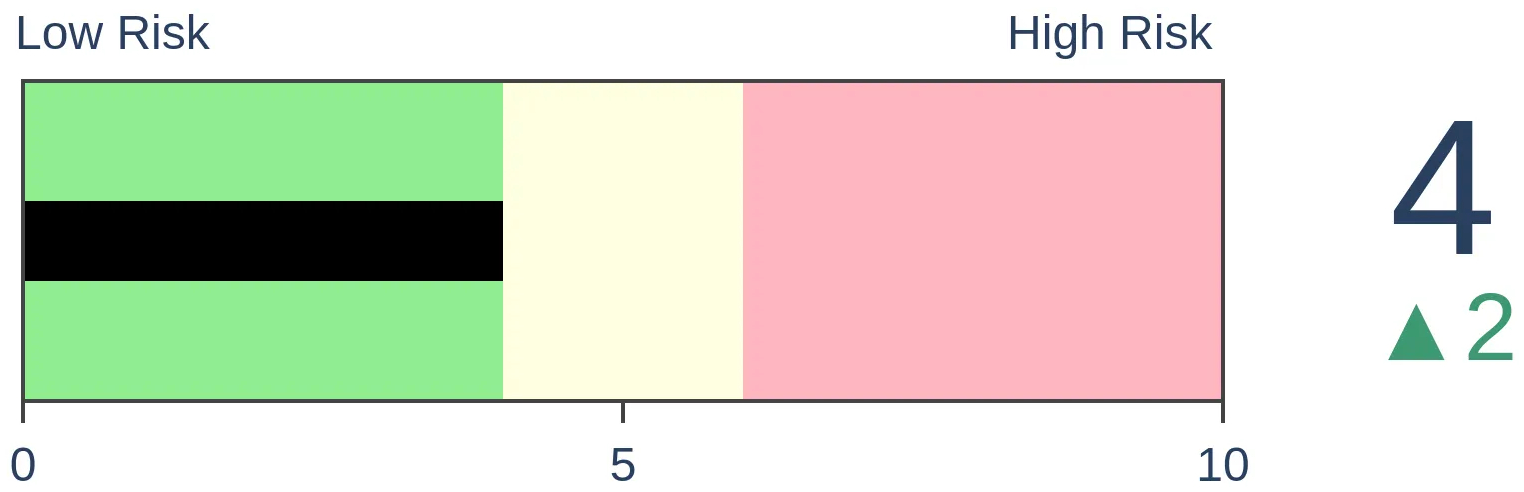
Stocks Medium-Term
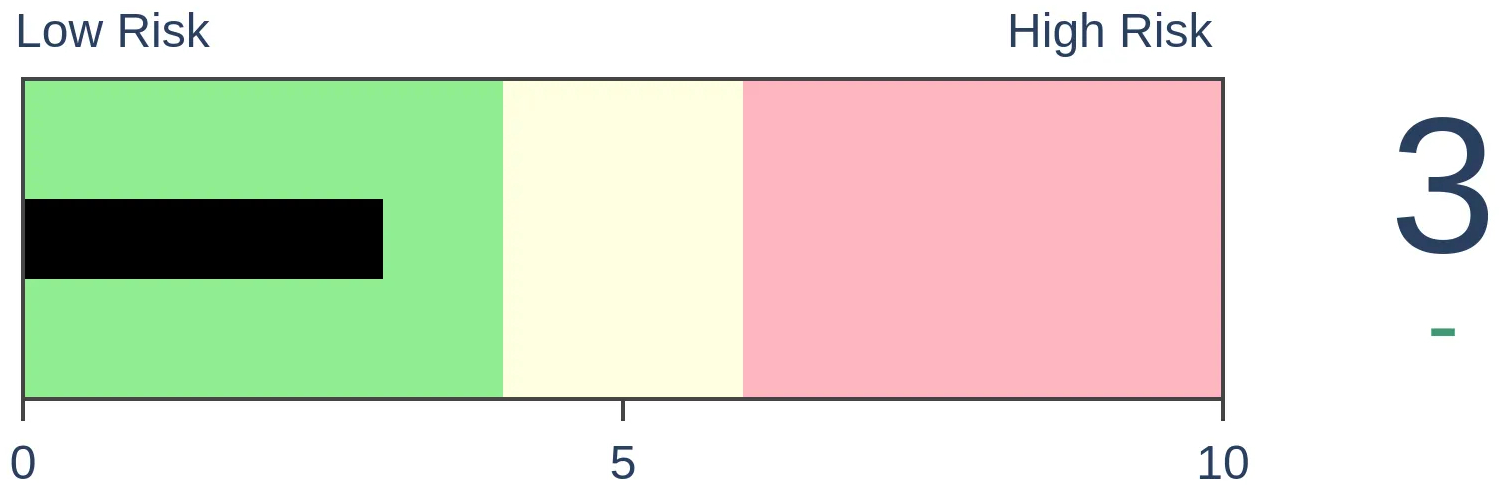
|
|
Bonds
|
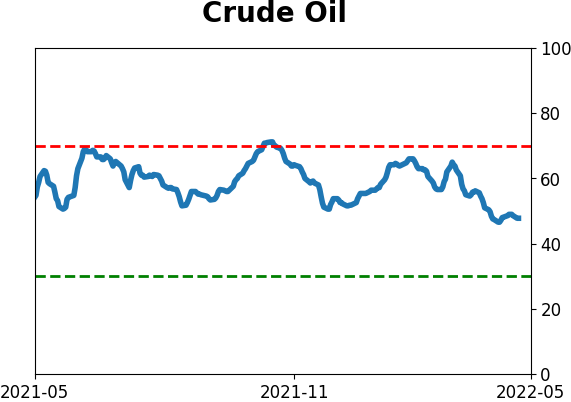
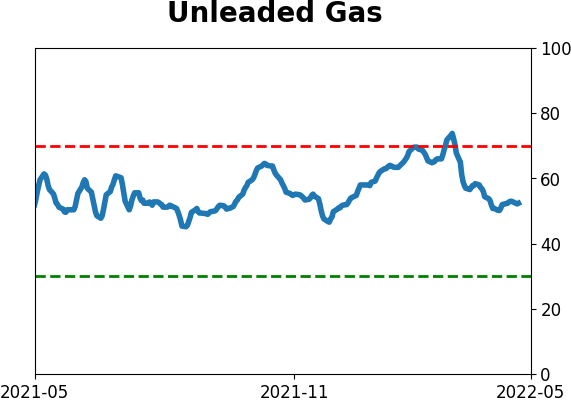
Crude Oil

|
|
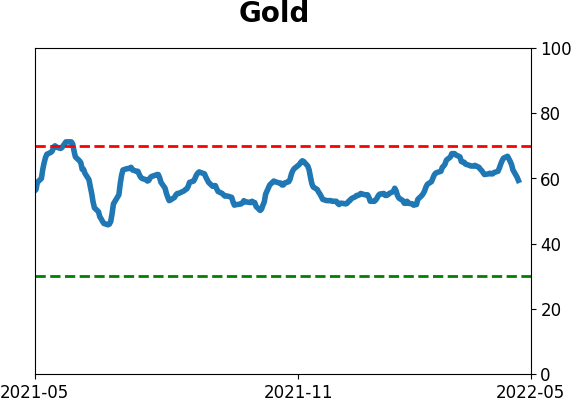
Gold
|
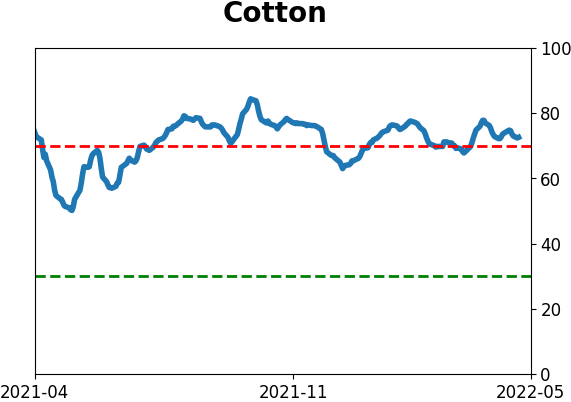
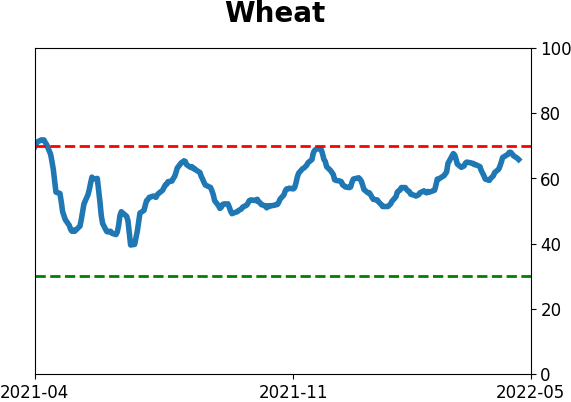
Agriculture

|
|
Research
By Jason Goepfert
BOTTOM LINE
Gold mining stocks have cycled from extreme oversold to extreme overbought, with fewer than 10% of members trading above their 200-day averages to more than 90% doing so. Similar cycles over the past 40 years had a strong tendency to lead to medium- to long-term gains in gold and mining stocks.
FORECAST / TIMEFRAME
GDX -- Up, Long-Term
|
Key points:
- Earlier this year, fewer than 10% of gold mining stocks were trading above their 200-day moving averages
- That surged to more than 90% by last week
- Similar cycles from one extreme to the other tended to precede long-term gains in miners
Gold miners are relaxing from an impressive thrust
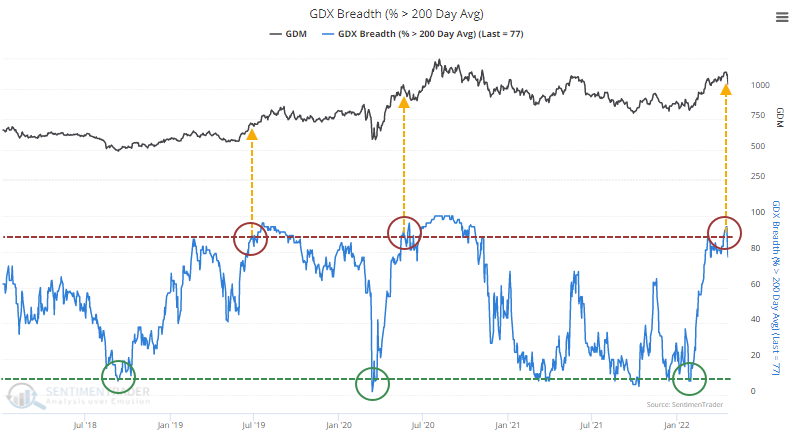
Gold has had a tough time over the past week and is already trading down to a two-month low.
There isn't a perfect correlation between gold and the companies that mine it, but miners tend to move along with the price of gold. Due to what had been an excellent multi-month run, the percentage of gold miners trading above their 200-day moving average surged above 90% last week before pulling back in recent sessions. During structural bear markets, it's rare to see thrusts like this, but this is the 3rd one in the past several years.
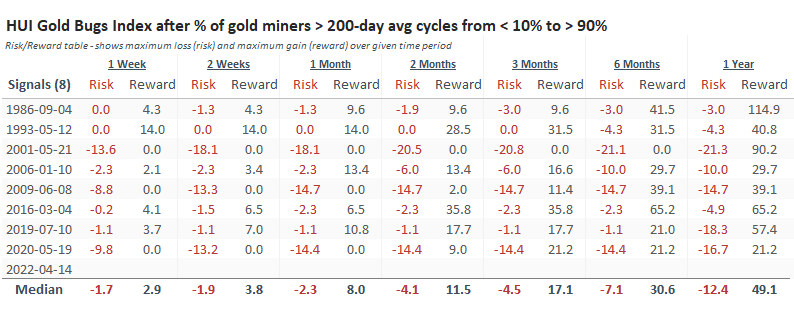
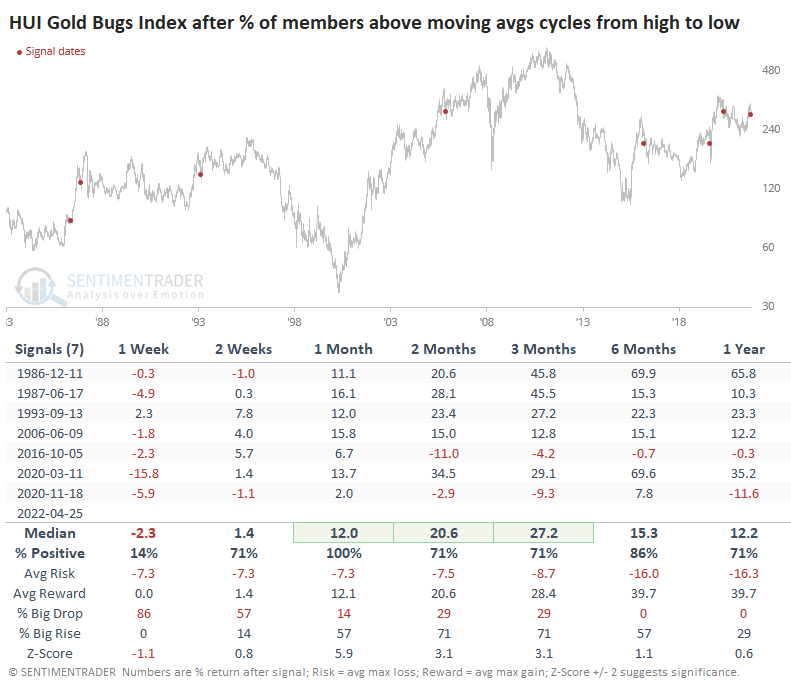
Extreme cycles in long-term trends have led to outstanding long-term returns for mining stocks. The table below shows returns in the HUI Gold Bugs Index over the past 40 years when the percentage of gold mining stocks above their 200-day averages cycled from below 10% to above 90%. Over the next 3-12 months, these stocks showed excellent returns.
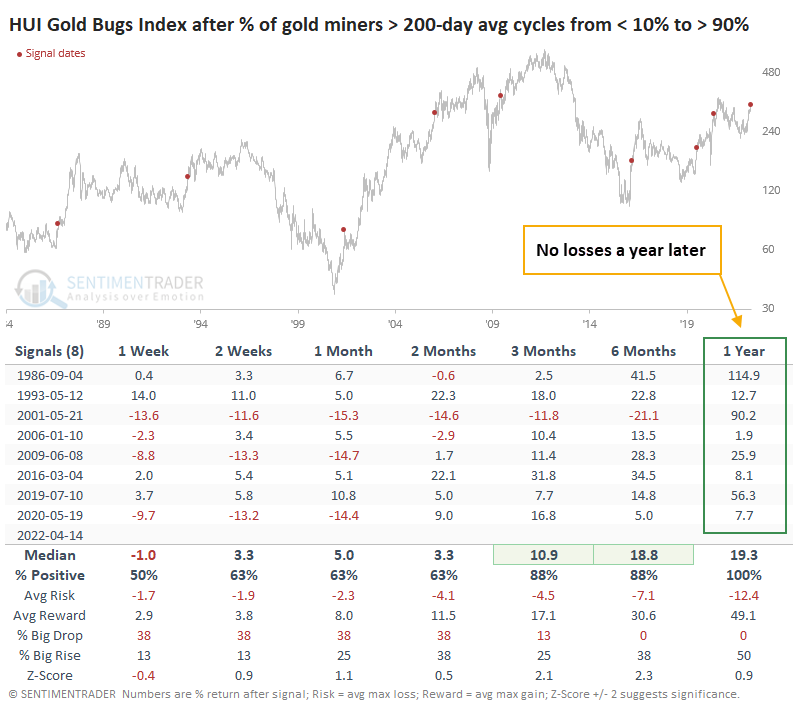
There was quite a bit of volatility, but that's to be expected with a volatile sector. The Risk/Reward Table shows that even with some of the successful signals, investors had to endure double-digit drawdowns at some point. But the minimum upside over the next year was +21.2%.
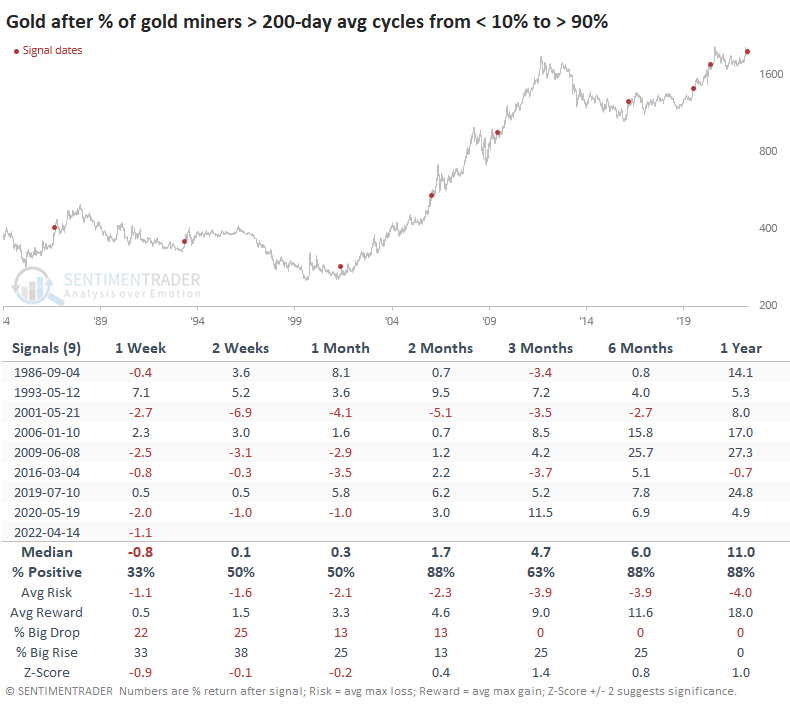
For gold itself, these were also positive signals. While its average returns weren't significantly above random, the metal did show a consistent tendency for gains. When it did lose, the losses were small.
The stocks have already corrected
Since that signal, gold mining stocks have already tumbled. From its high on April 18, Newmont Mining has already dropped nearly 20%.
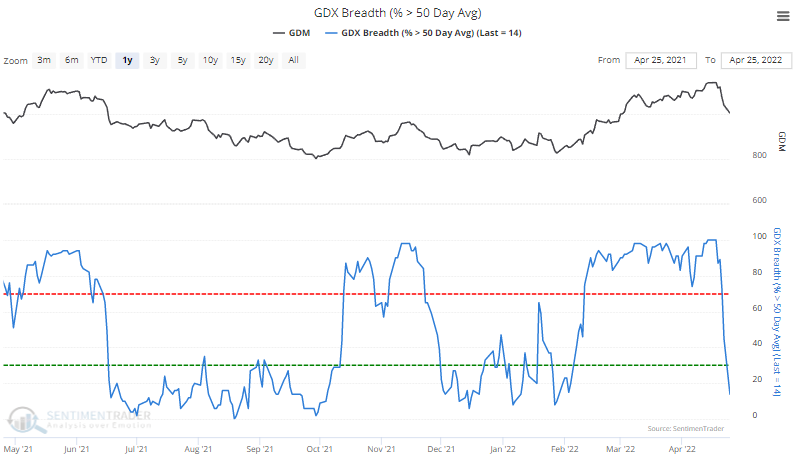
The percentage of miners above their 50-day moving average has plunged from 100% to below 15%.
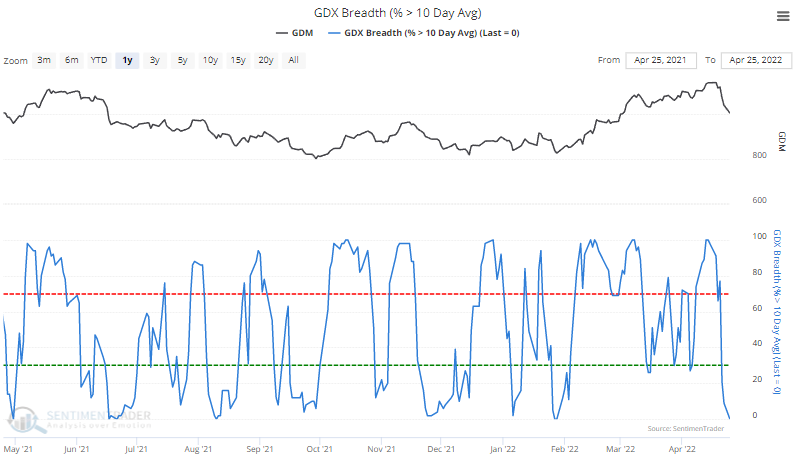
And the percentage trading above their 10-day moving average cycled all the way from 100% to 0%.
The Backtest Engine shows that when an index of gold miners was trading above its rising 200-day moving average and none of its members were above their 10-day average, miners saw losses in the short-term but gains longer-term, with one major exception.
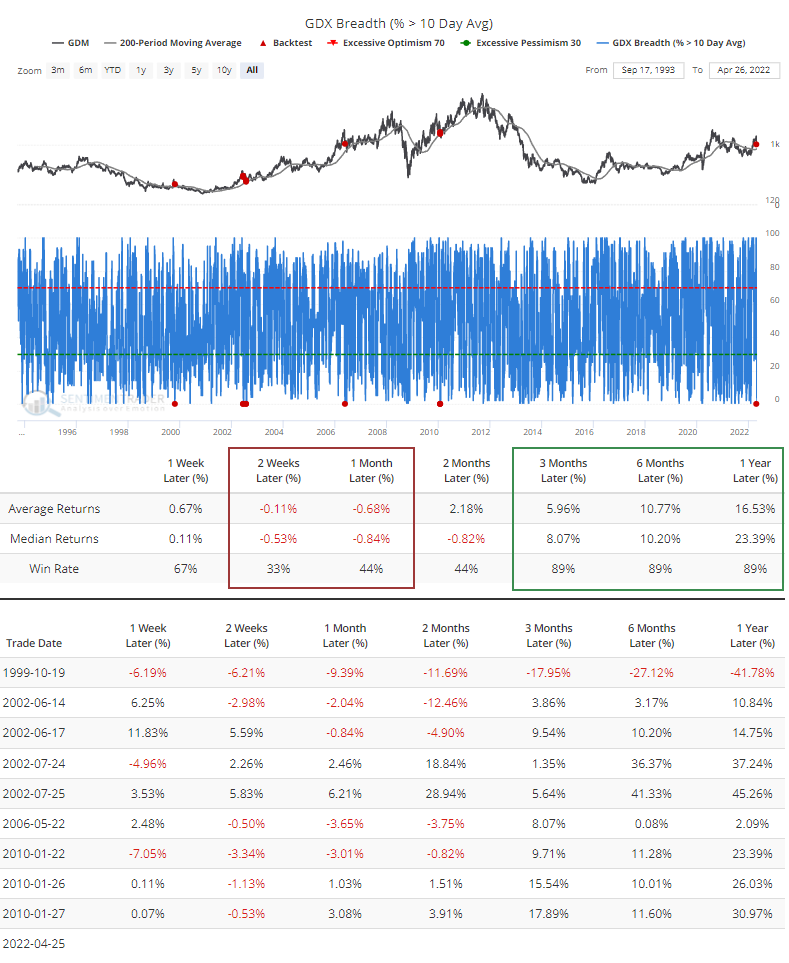
Let's get more specific, using the indicators above. The table below shows every time when more than 95% of miners were above their 10-day average, more than 95% were above their 50-day average, and more than 90% were above their 200-day average. Then there was a pullback and those figures fell to below 5%, 15%, and 80%, respectively.
Here, there were still short-term losses, but medium-term returns improved. Over the medium- to long-term, there was only one loss.
What the research tells us...
Gold, and related equities, have had a terrible week. The metal often generates extreme emotions among its proponents and detractors, and that pendulum can swing wildly in just a matter of days, which we're already seeing. Gold mining stocks have always had a hard time sustaining upside momentum but cycles in breadth like we've just seen had a good track record of preceding medium- to long-term gains. This would suggest that some alleviation of the recent bout of optimism should be temporary, as opposed to a sign that the market has formed a long-term peak.
Indicators at Extremes
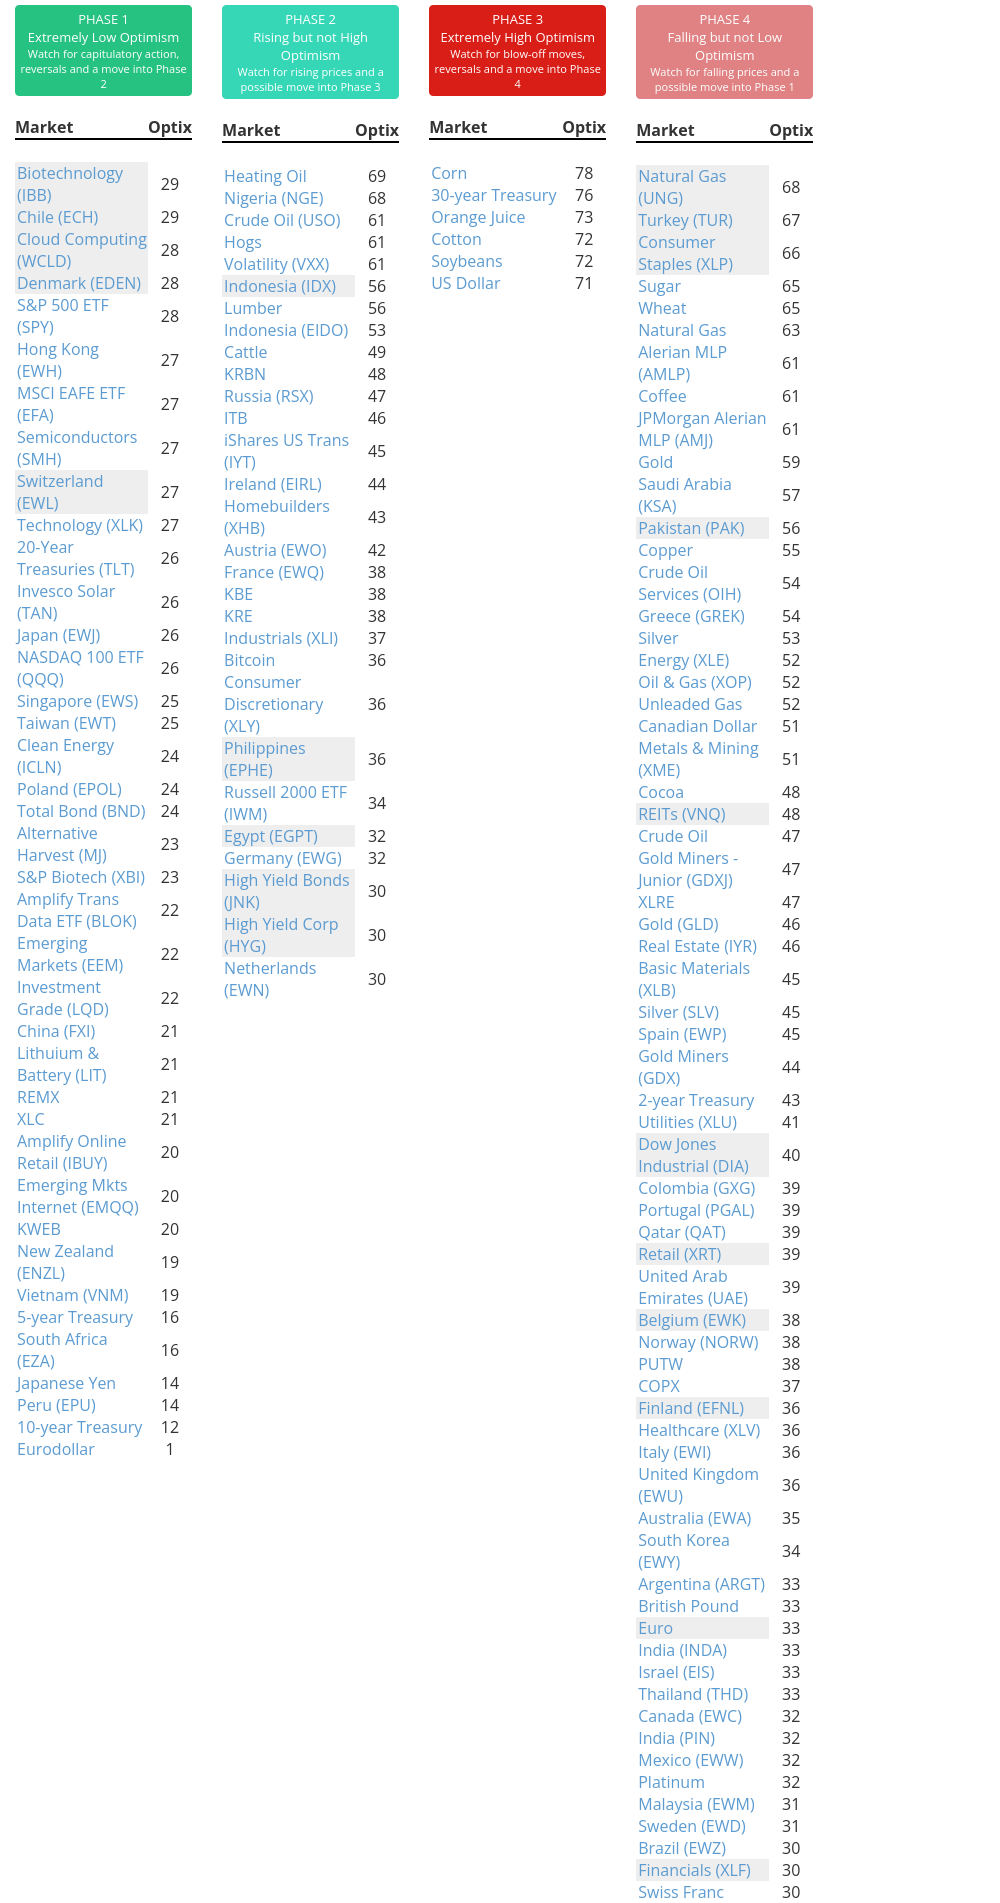
Phase Table
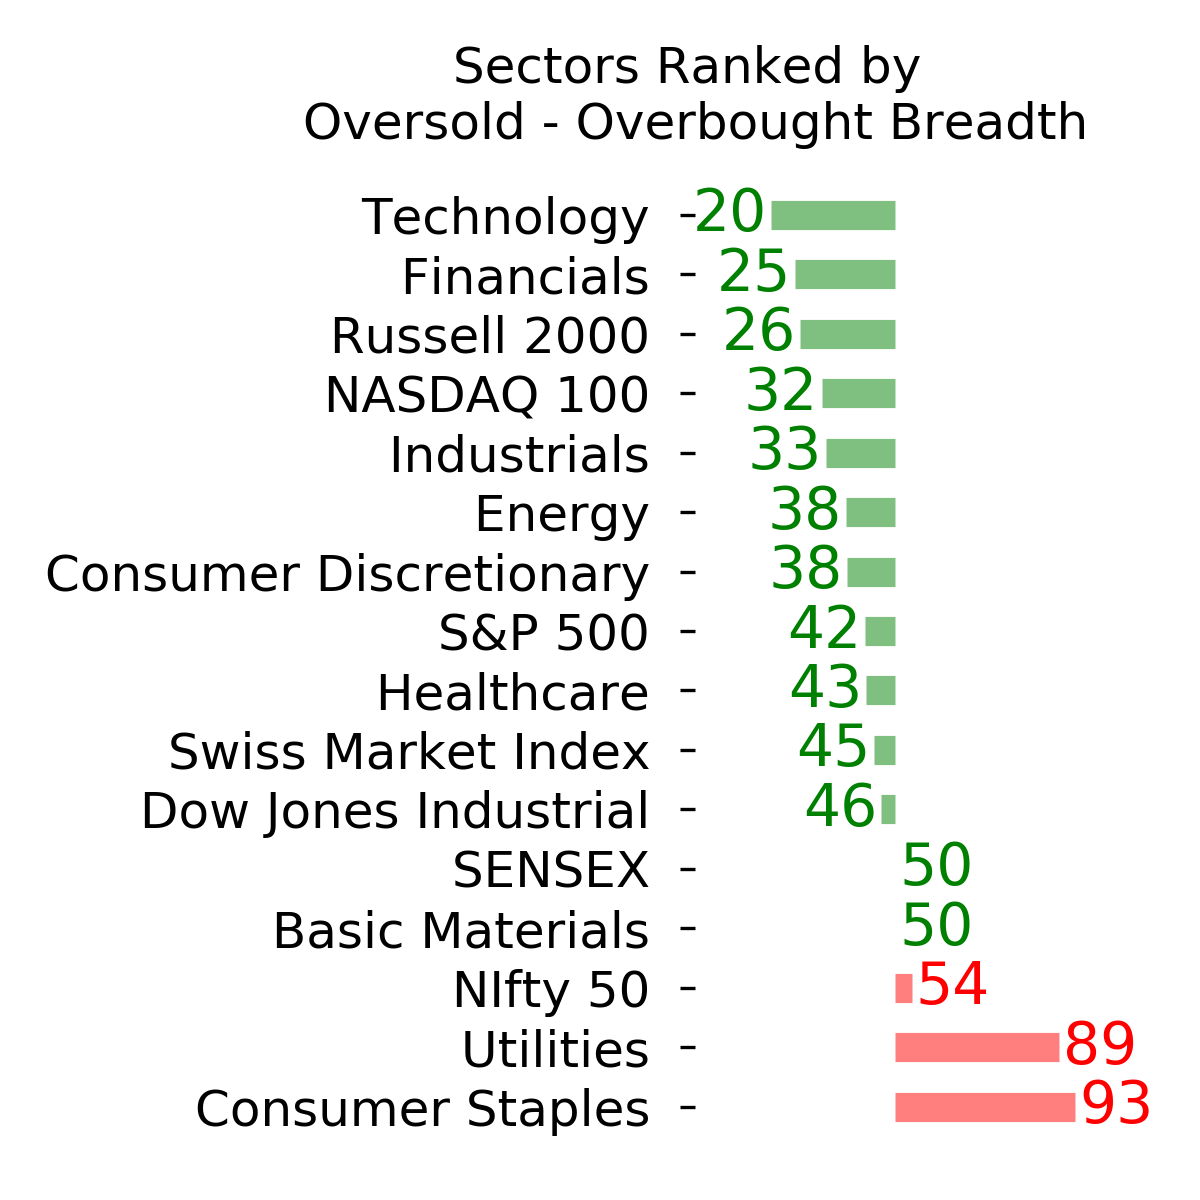
Ranks
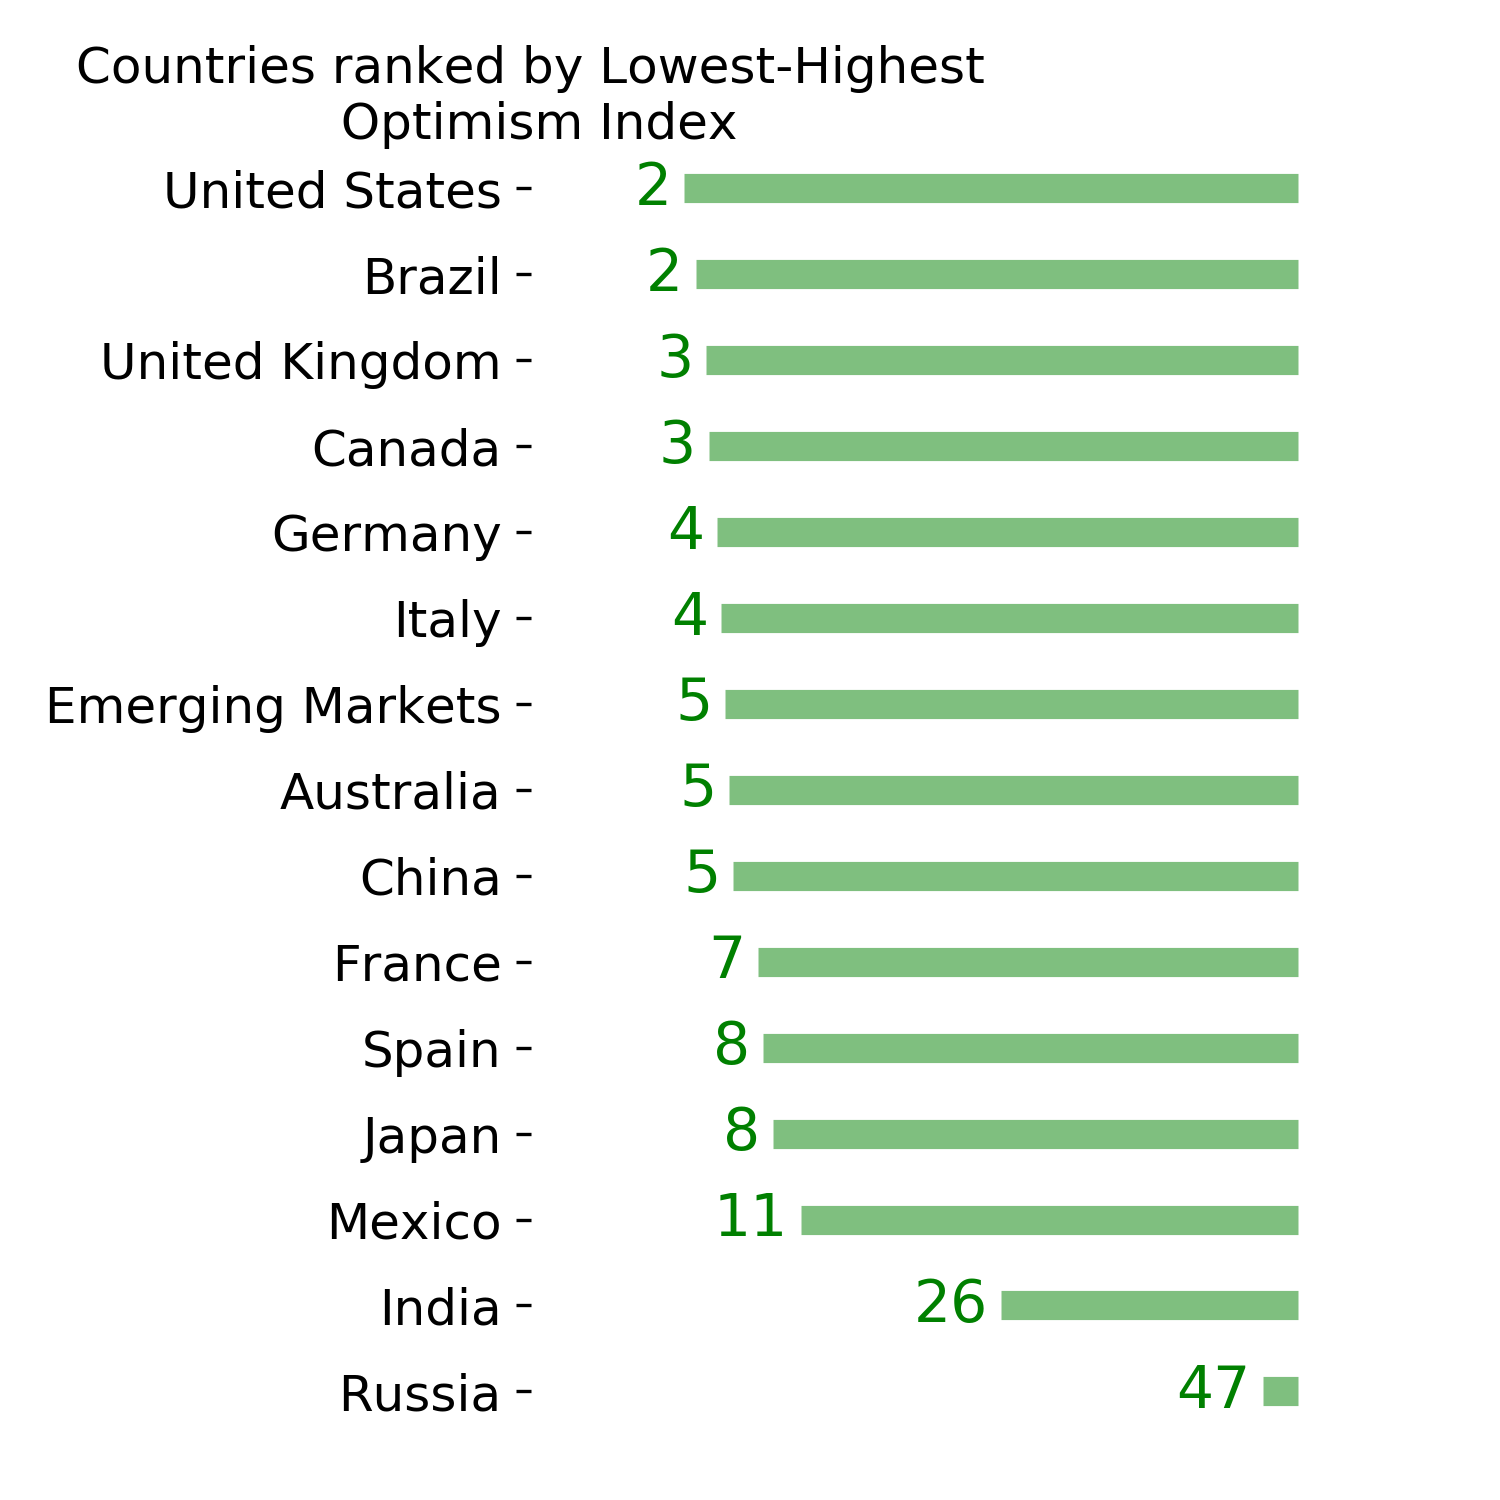
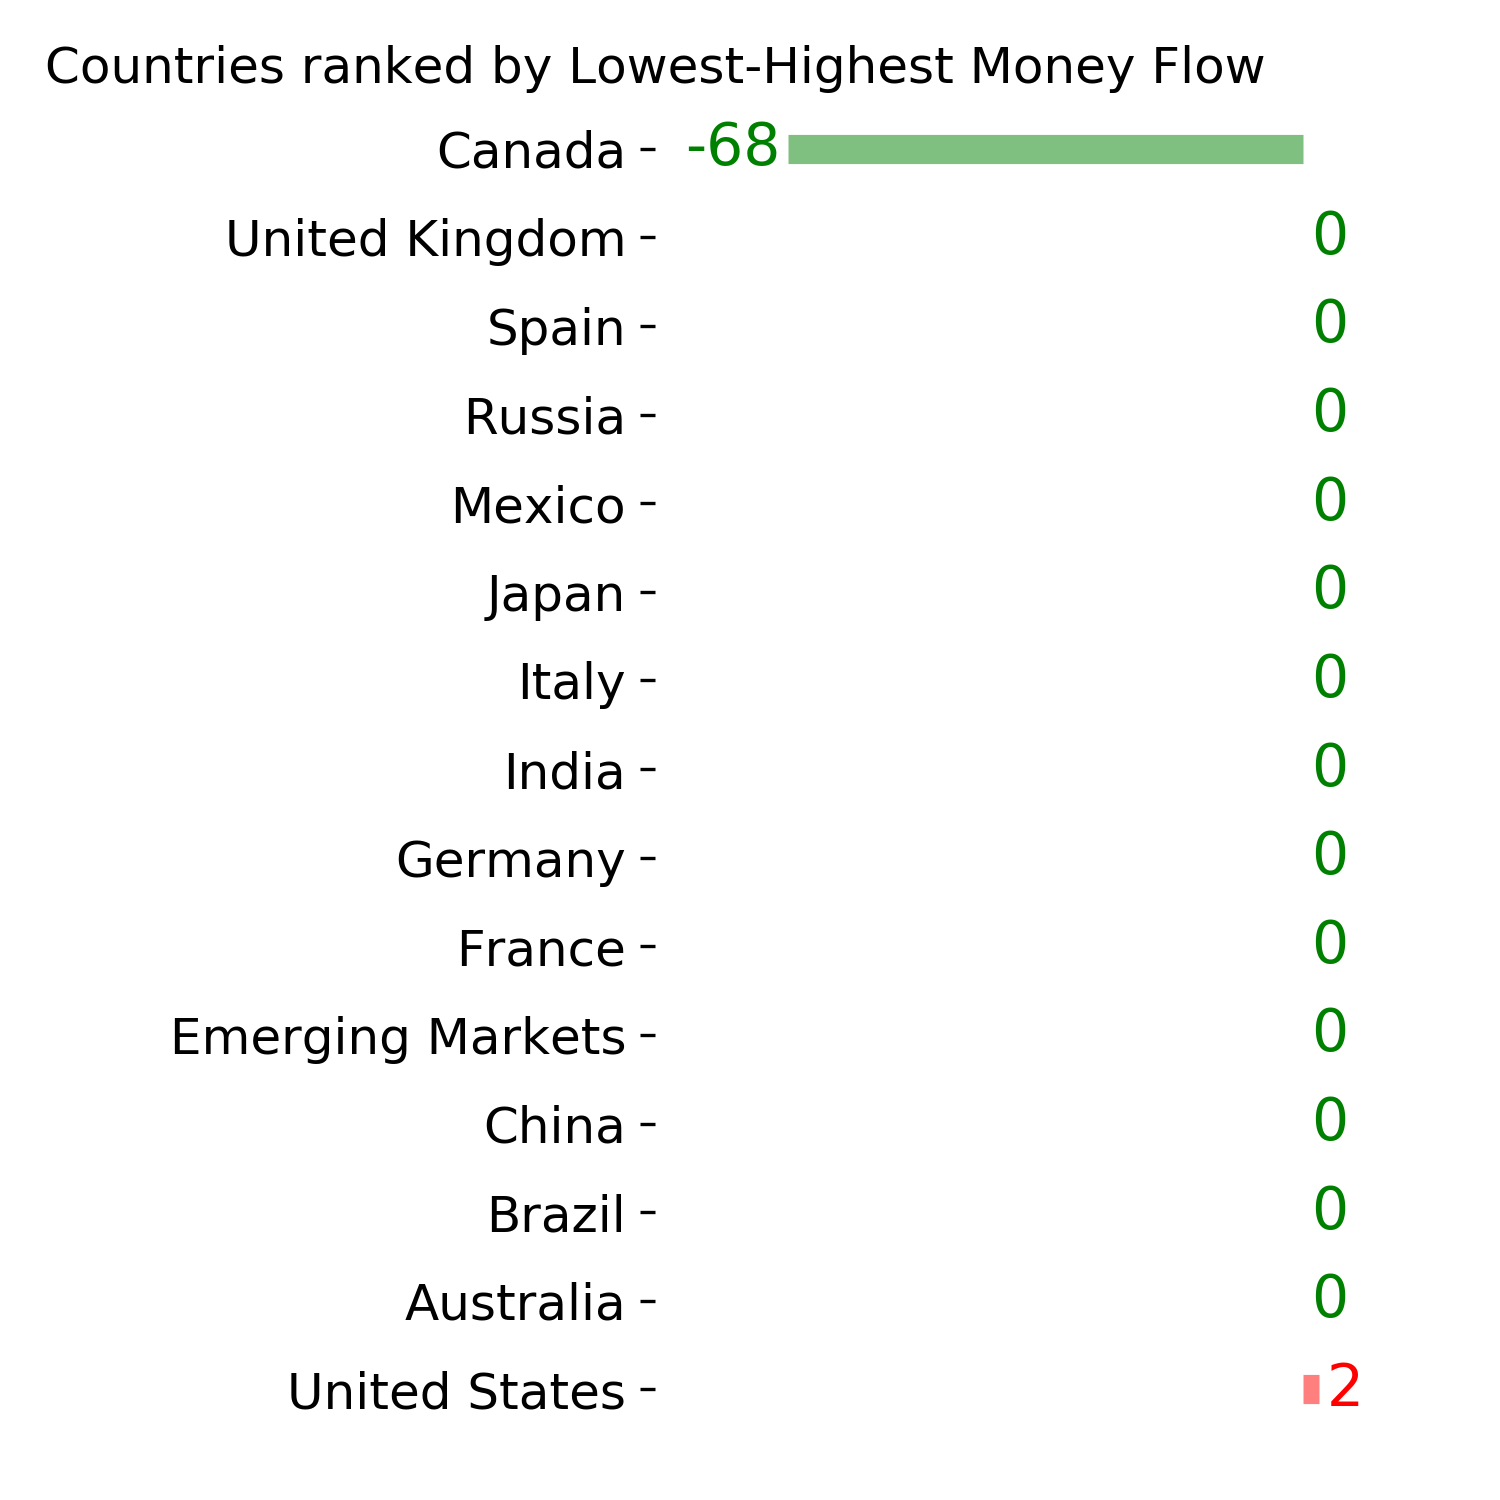
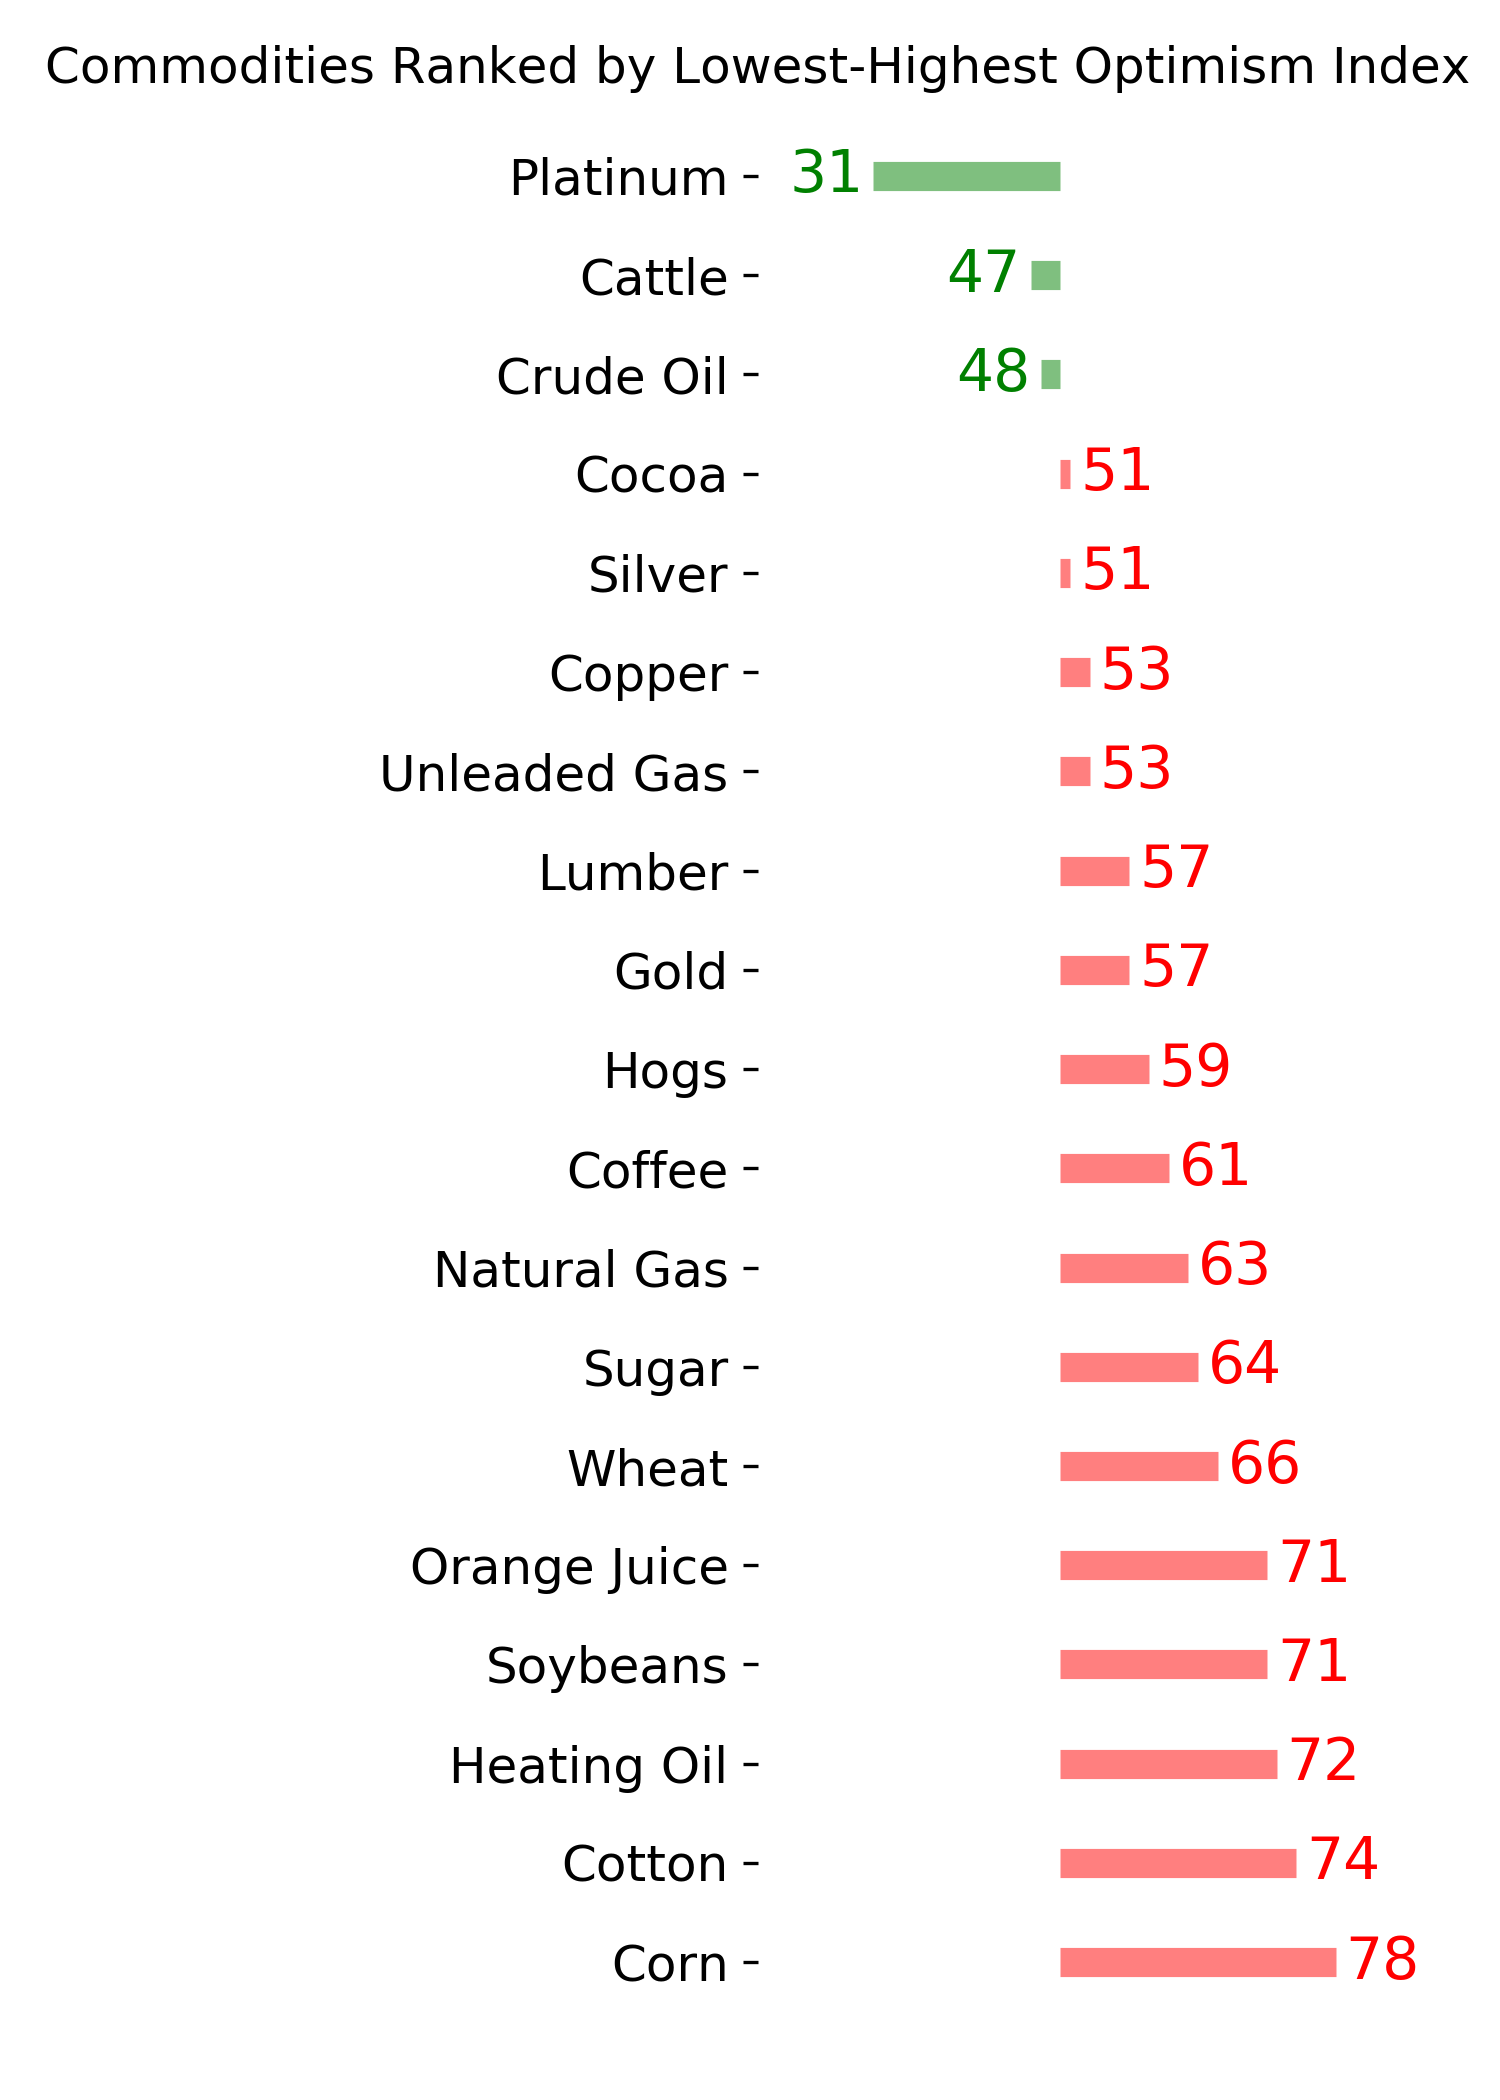
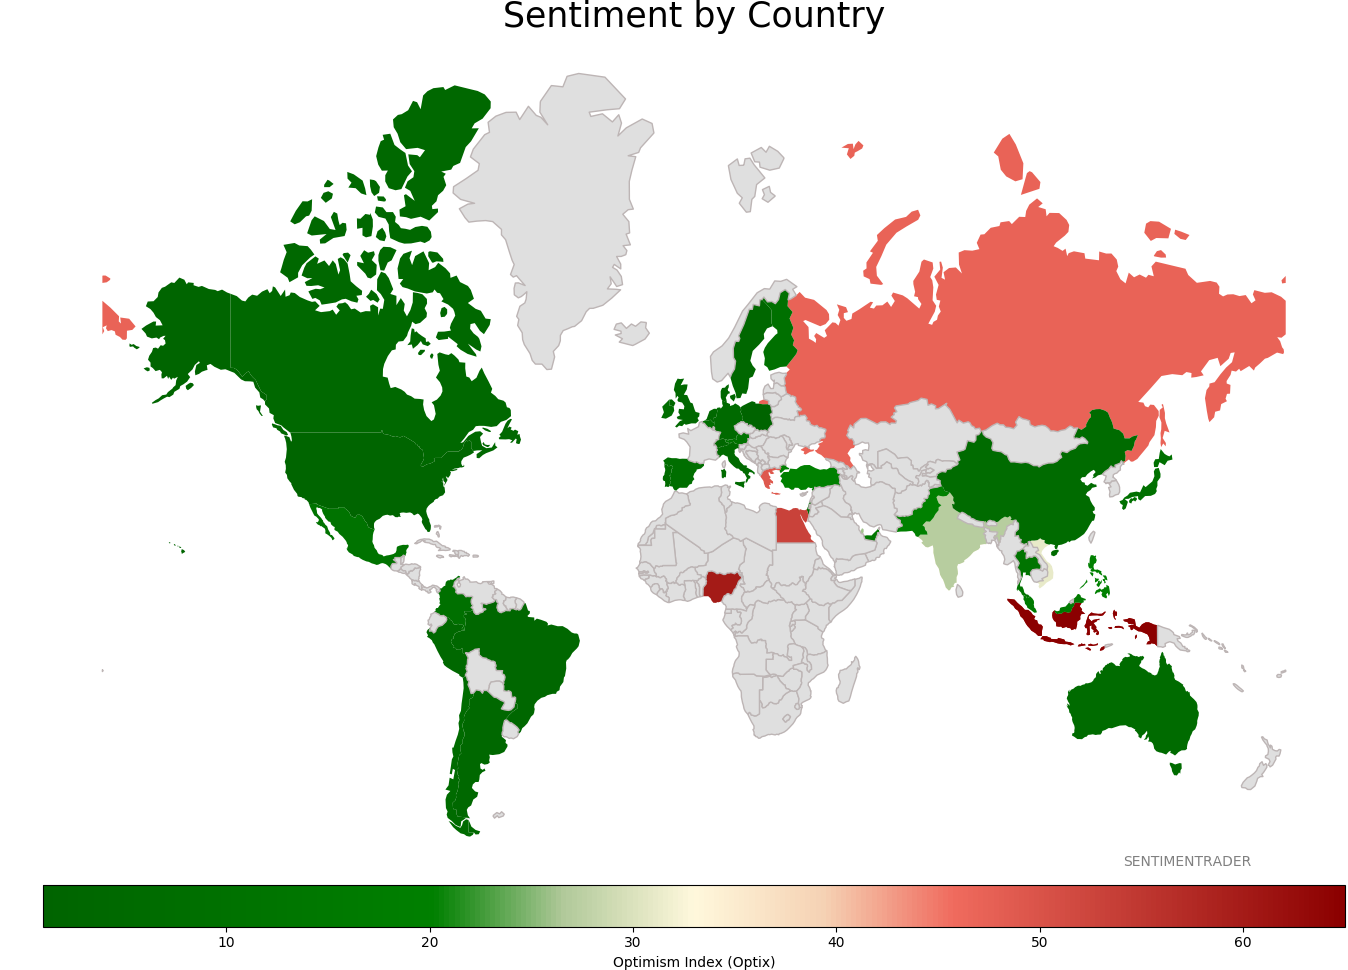
Sentiment Around The World
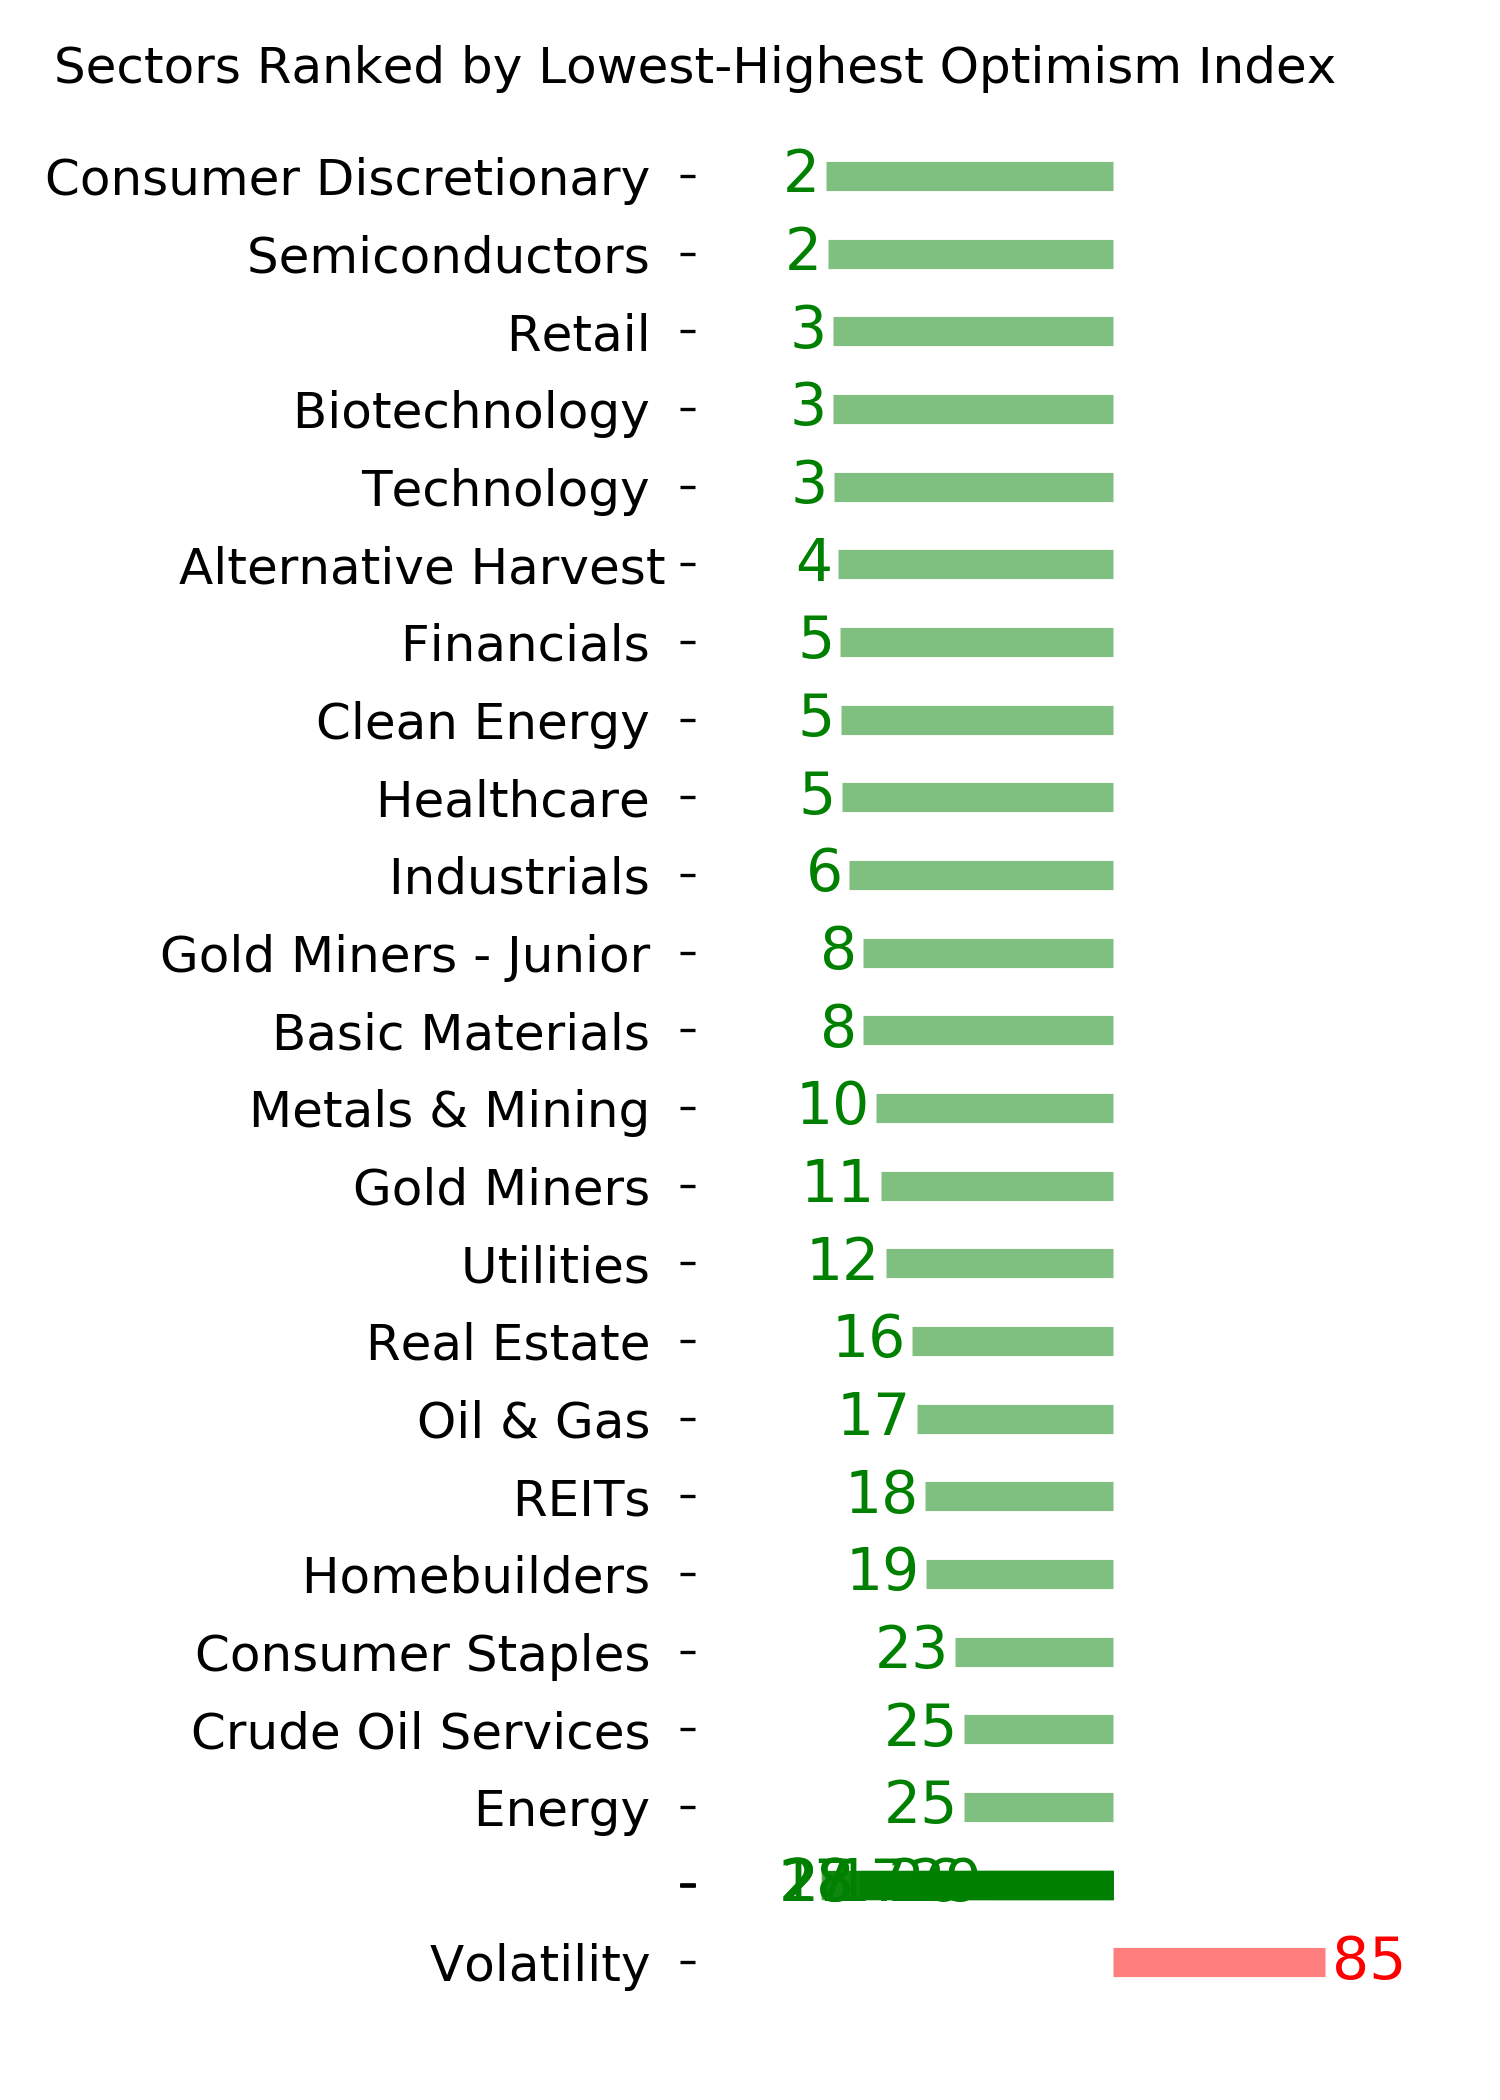
Optimism Index Thumbnails
|
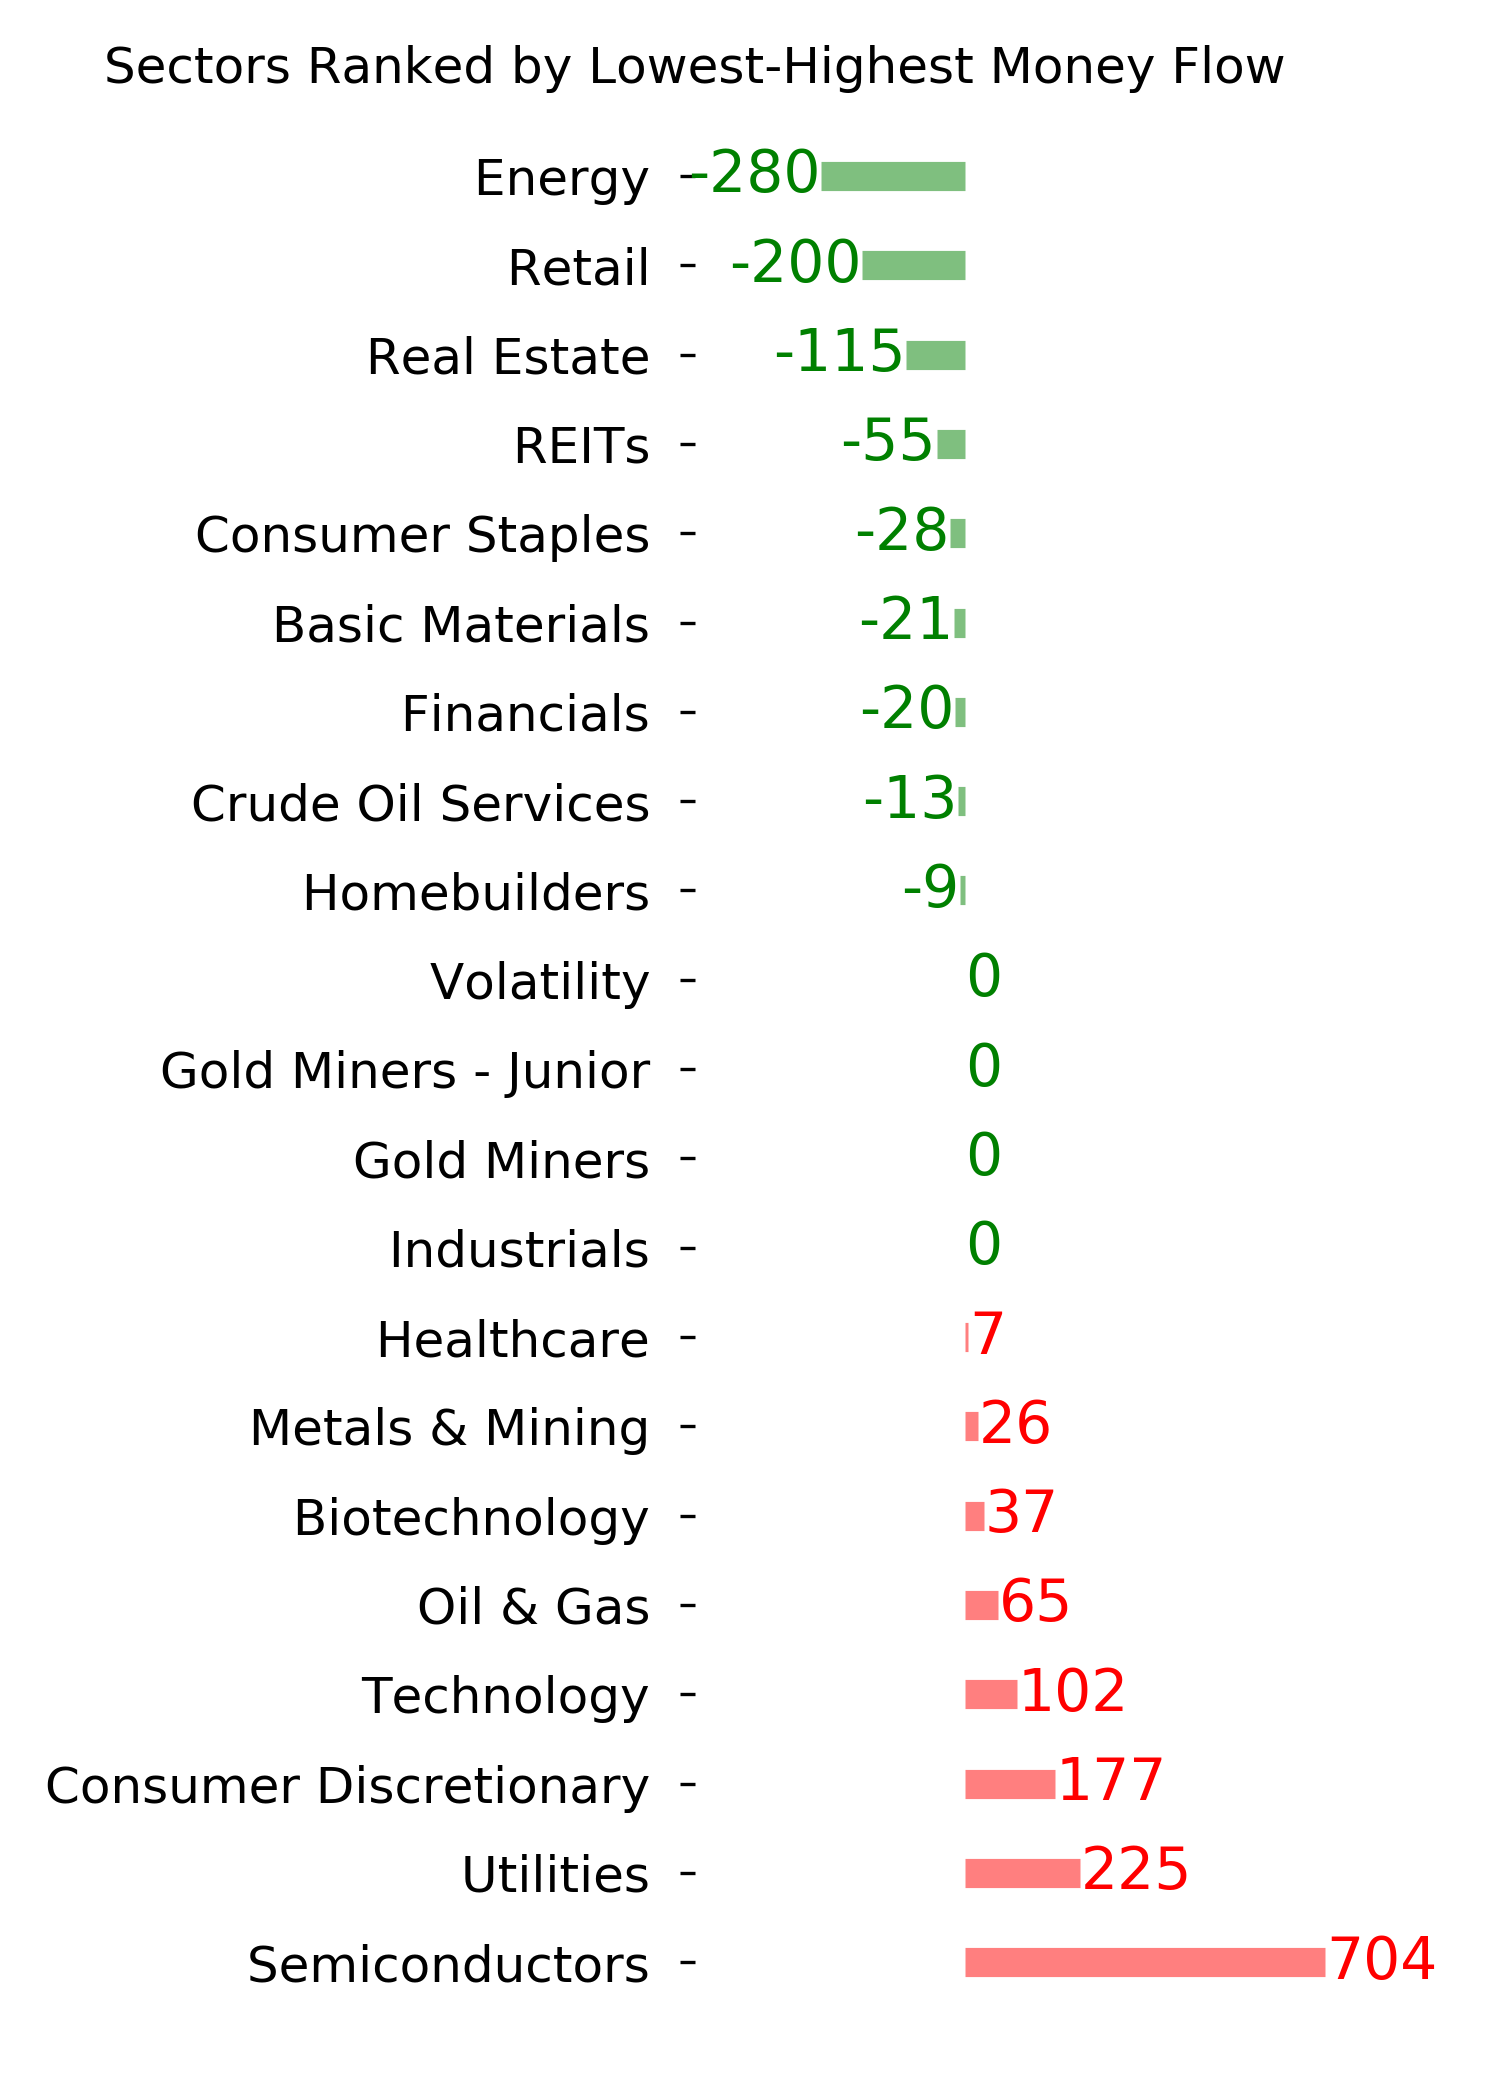
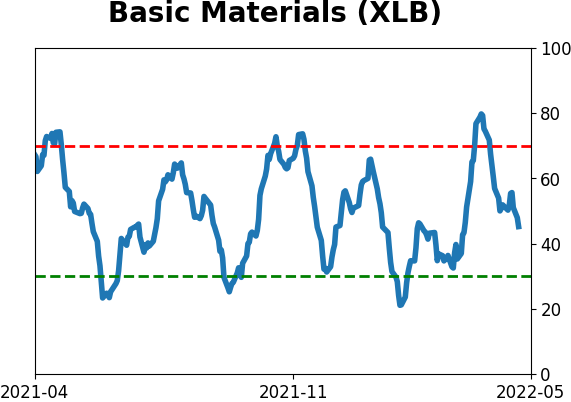
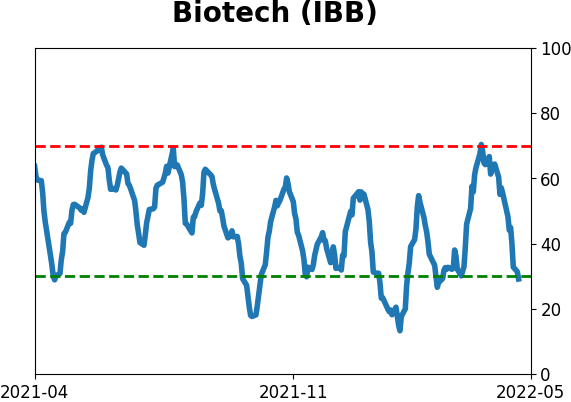
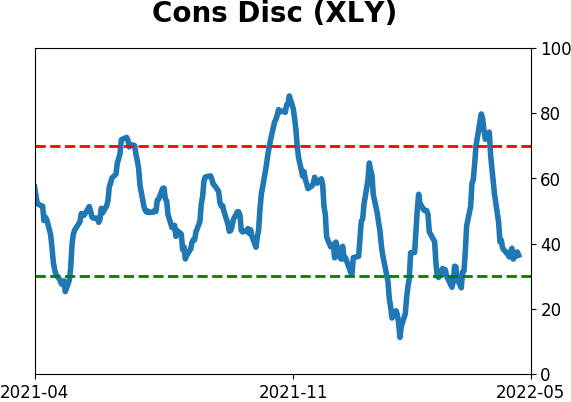
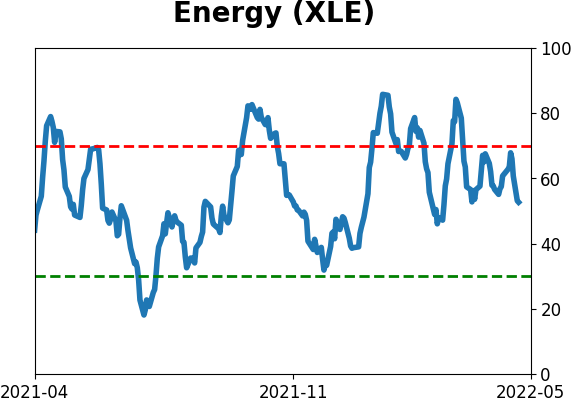
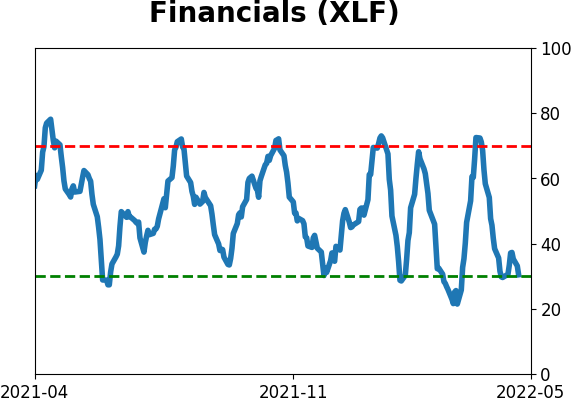
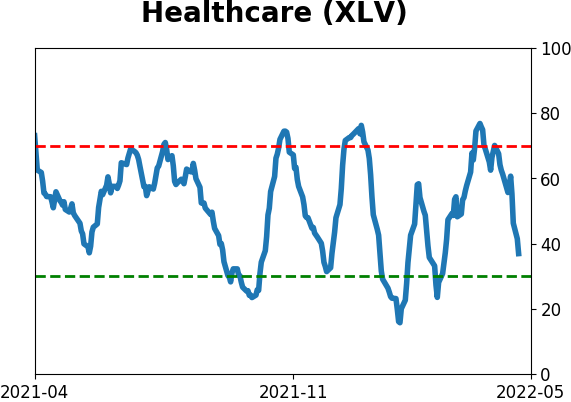
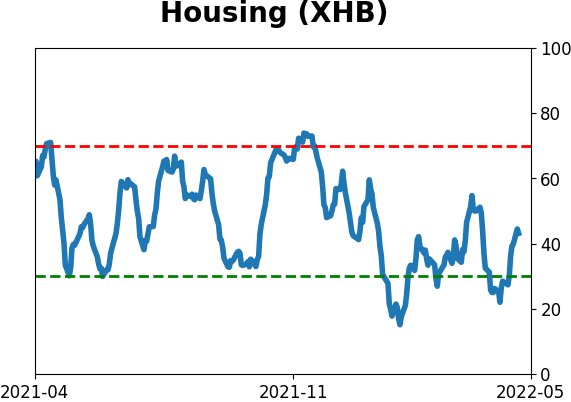
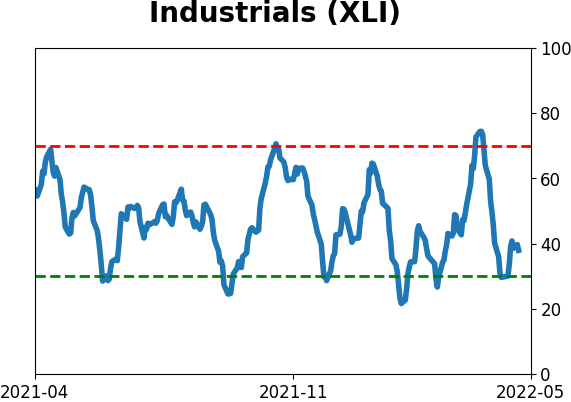
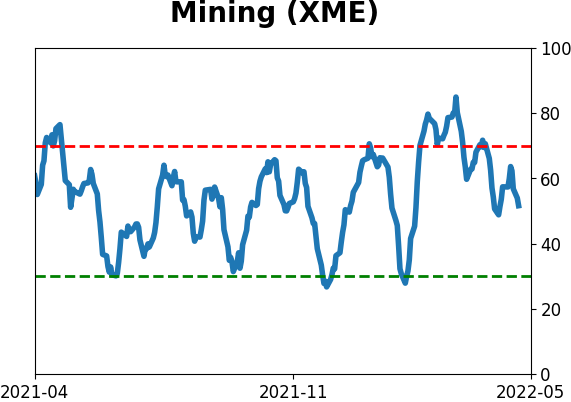
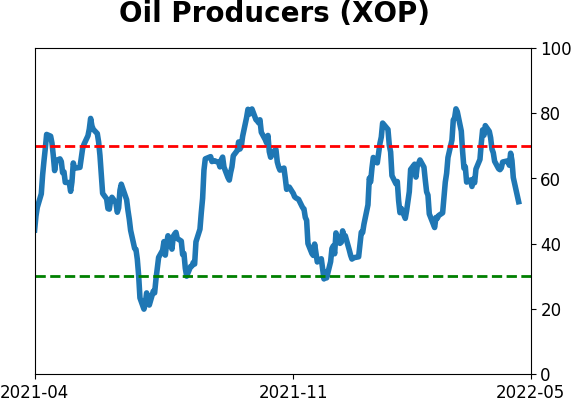
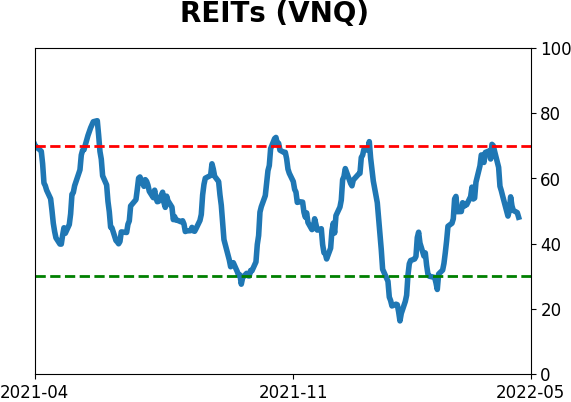
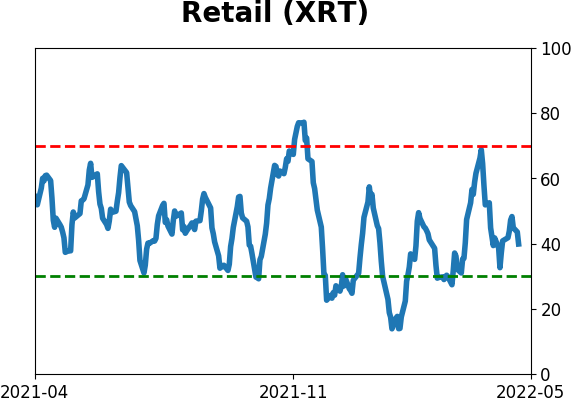
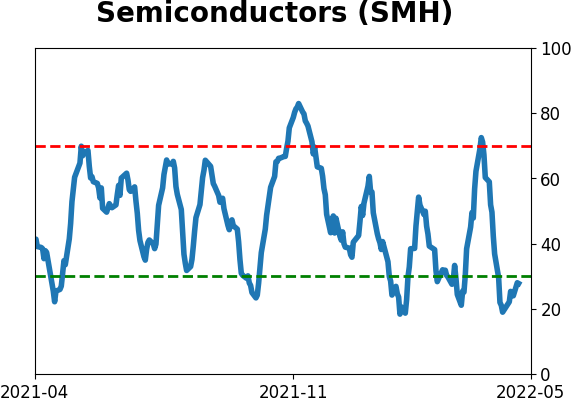
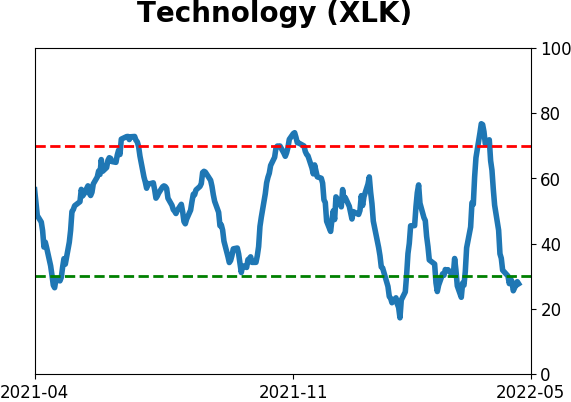
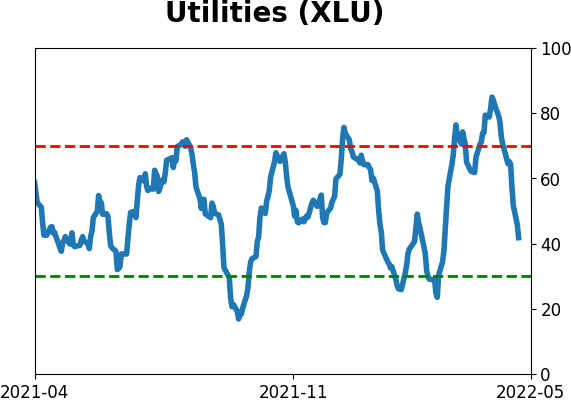
Sector ETF's - 10-Day Moving Average
|
|
|
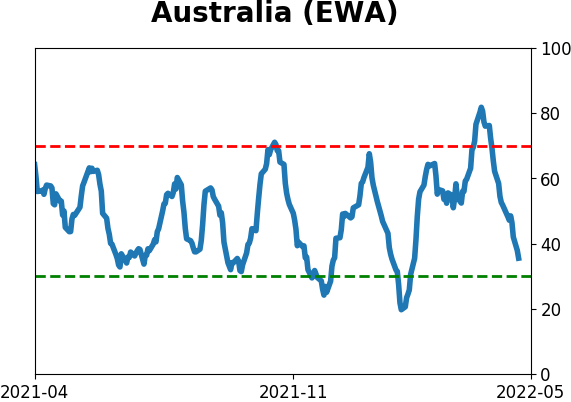
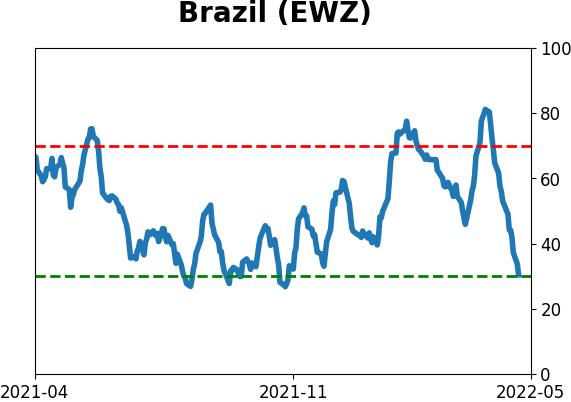
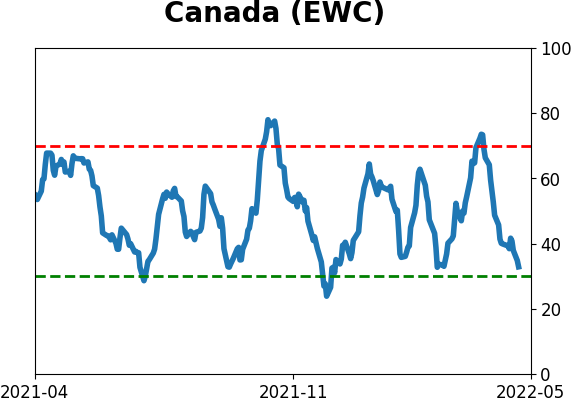
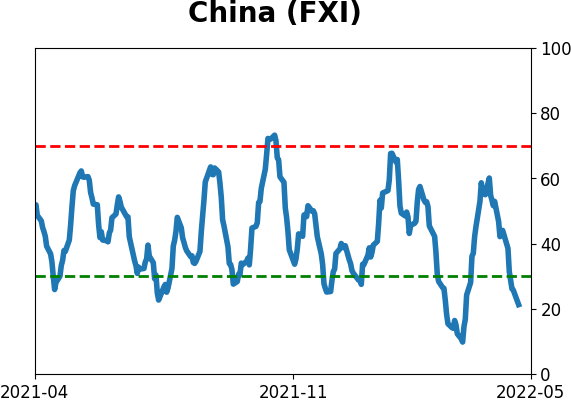
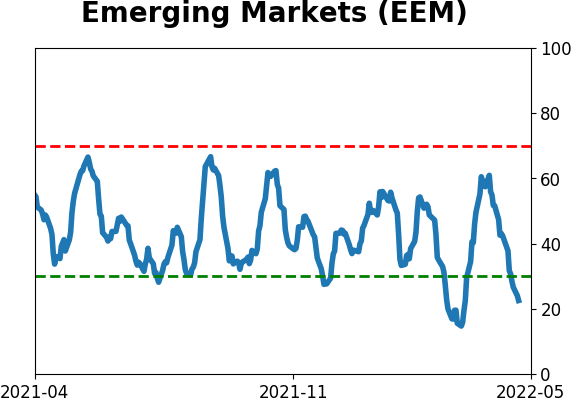
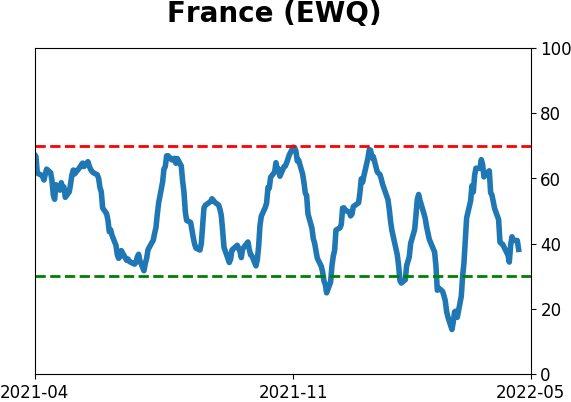
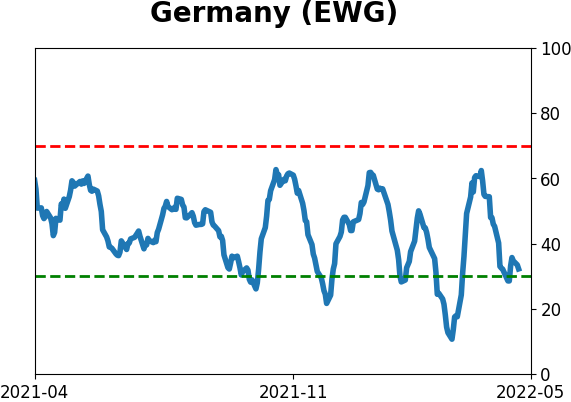
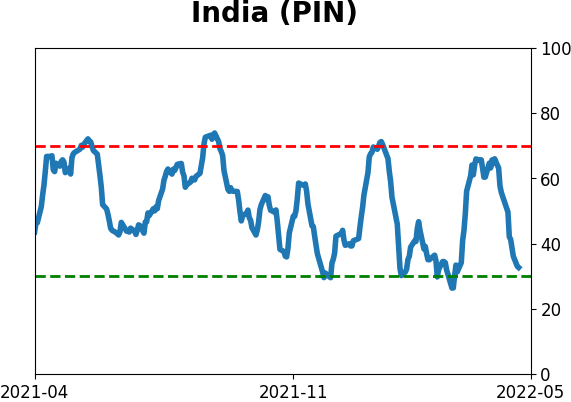
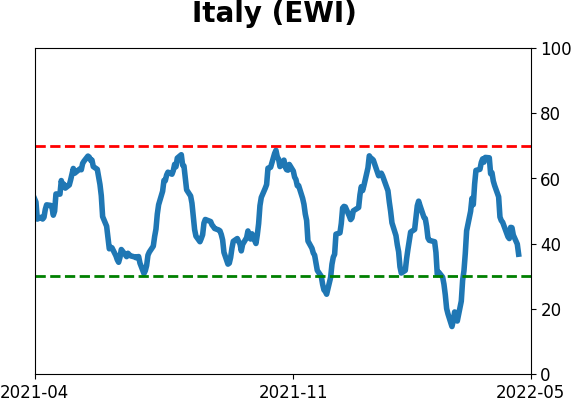
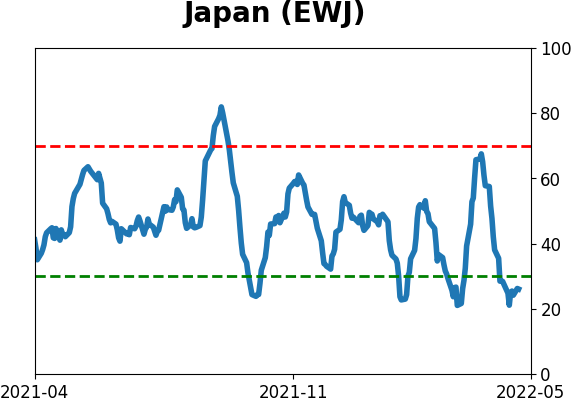
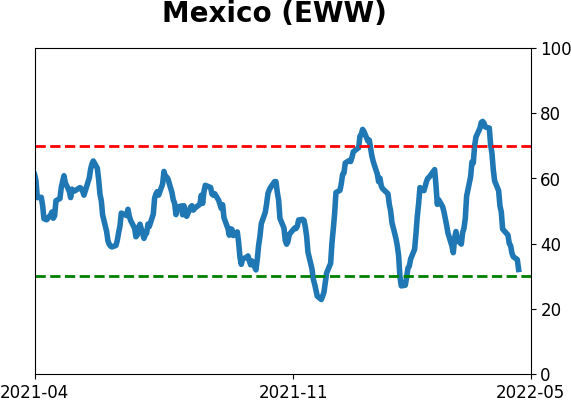
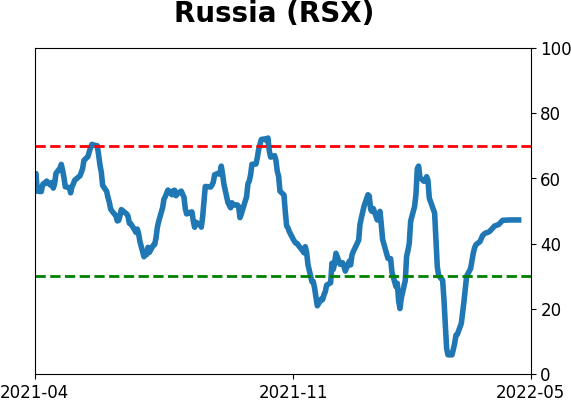
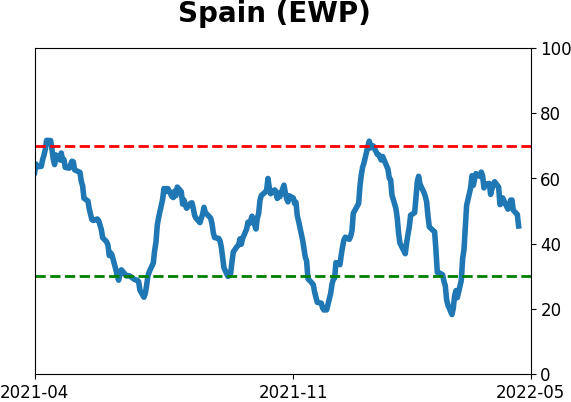
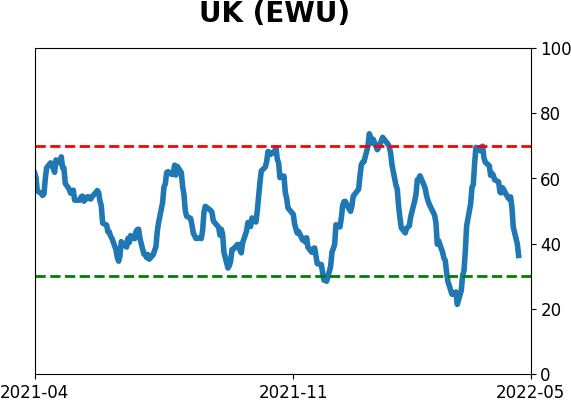
Country ETF's - 10-Day Moving Average
|
|
|
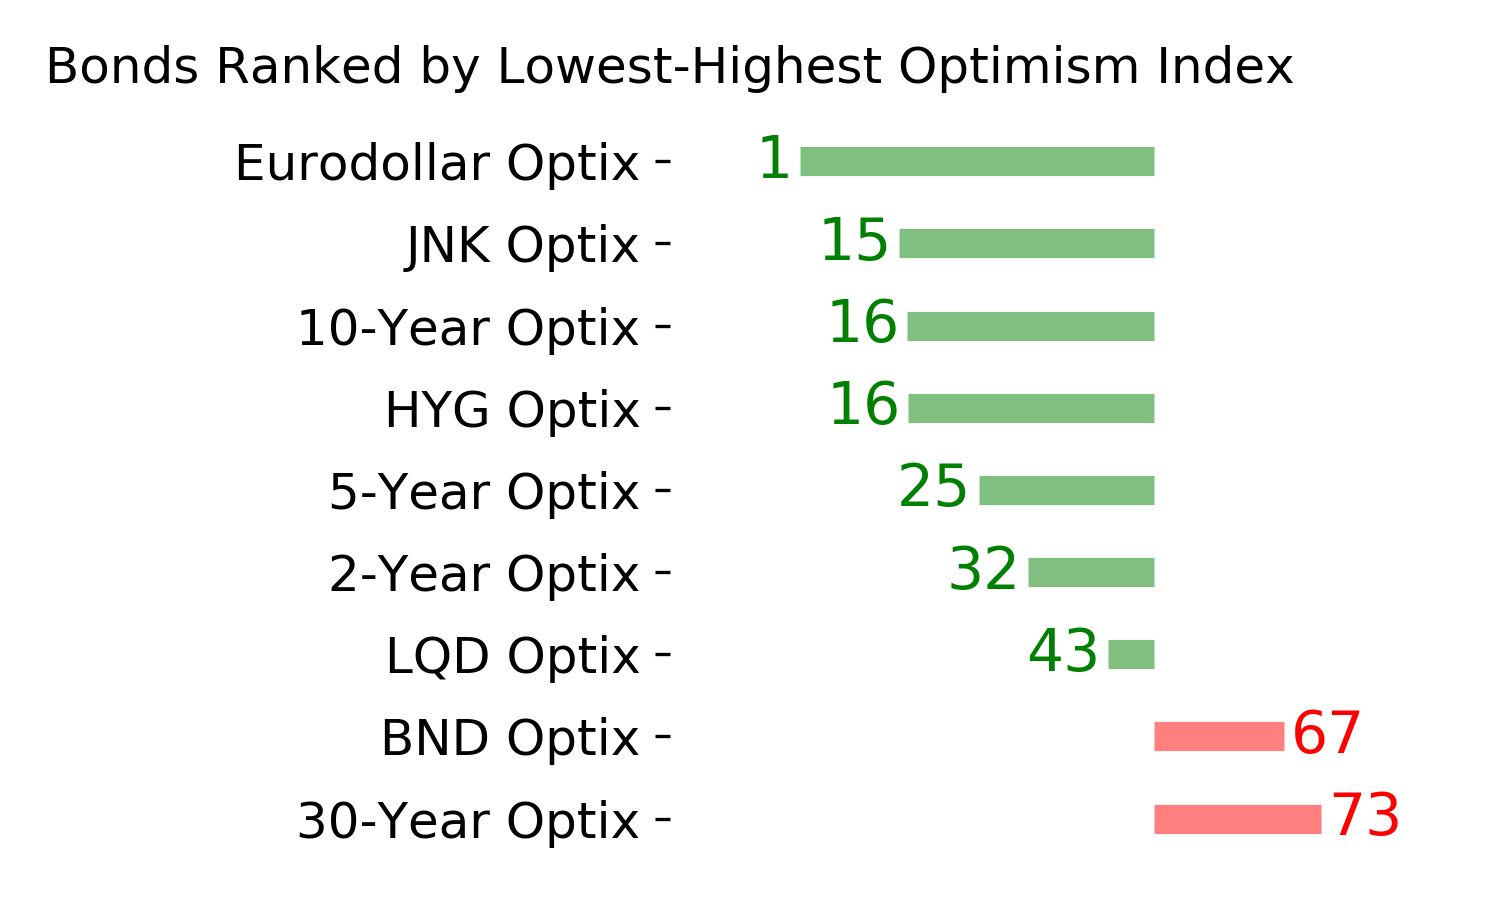
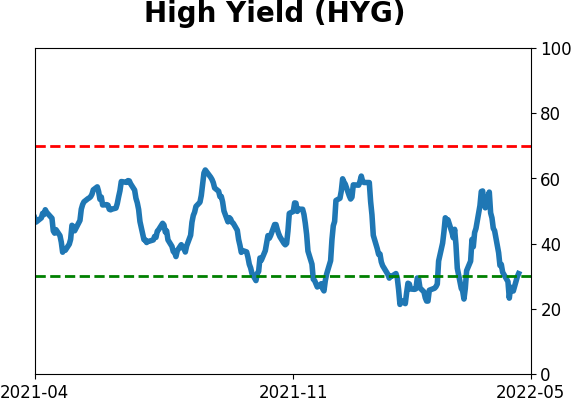
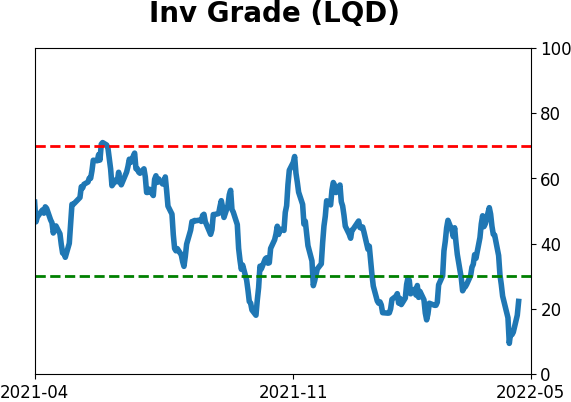
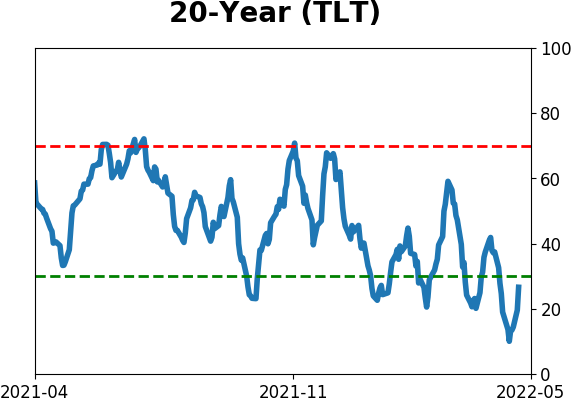
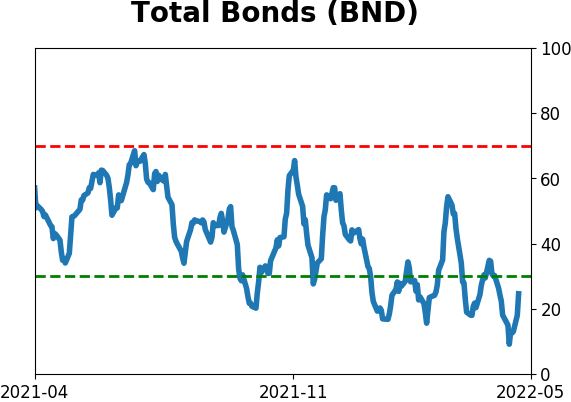
Bond ETF's - 10-Day Moving Average
|
|
|
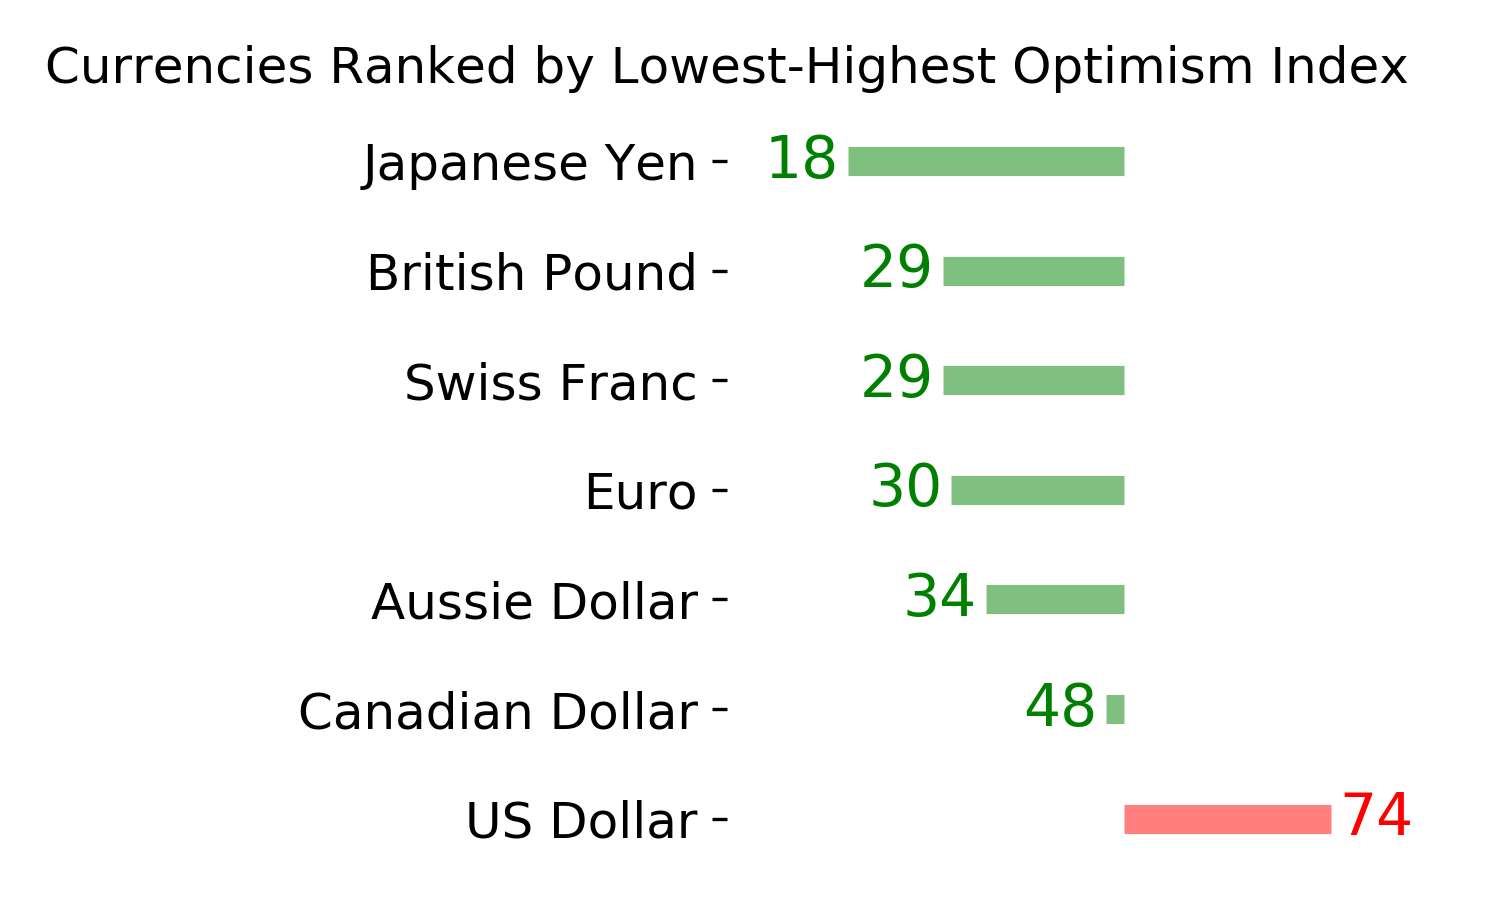
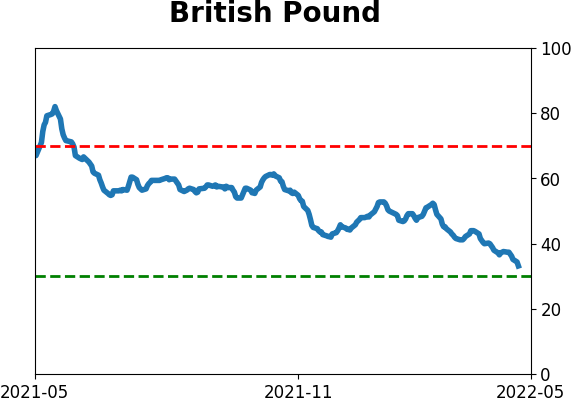
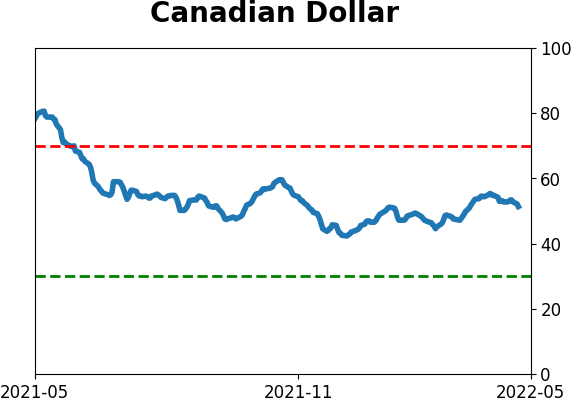
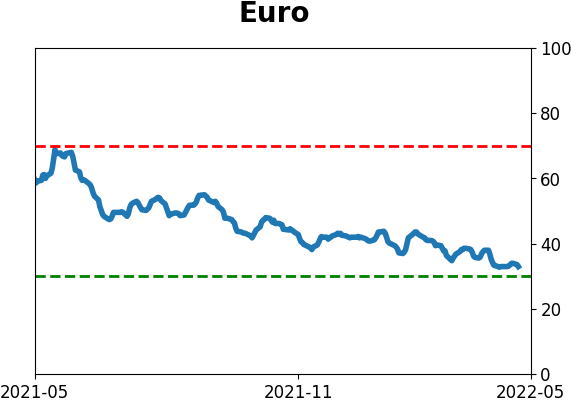
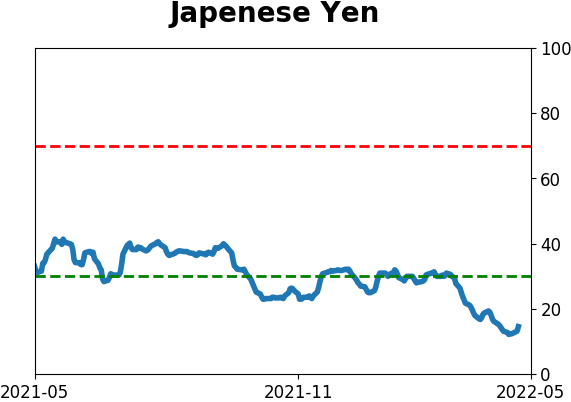
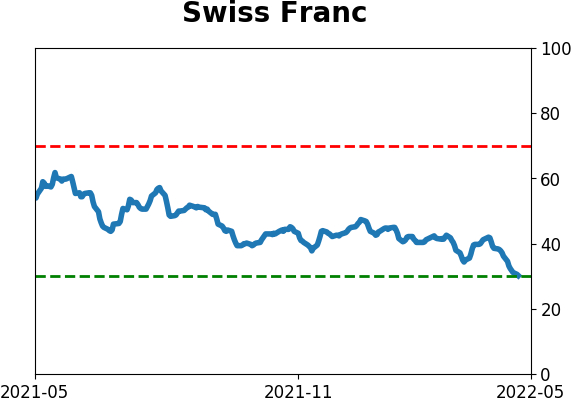
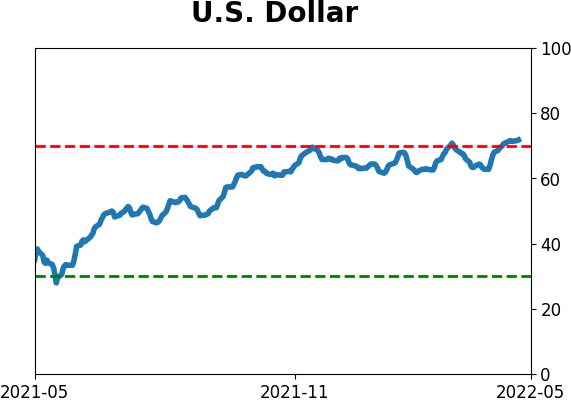
Currency ETF's - 5-Day Moving Average
|
|
|
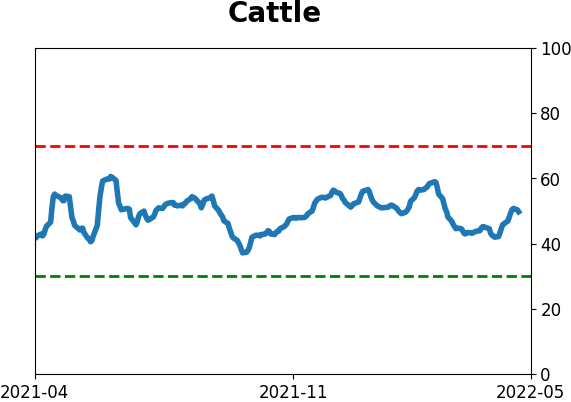
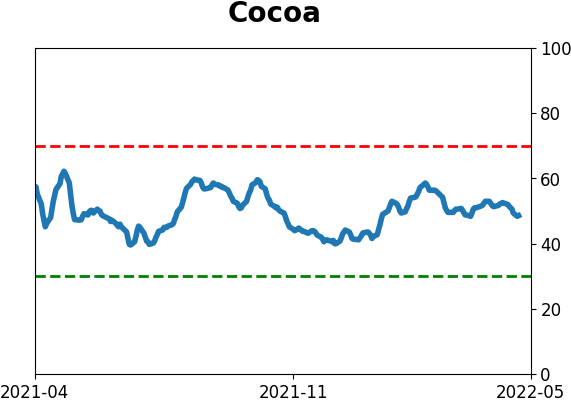
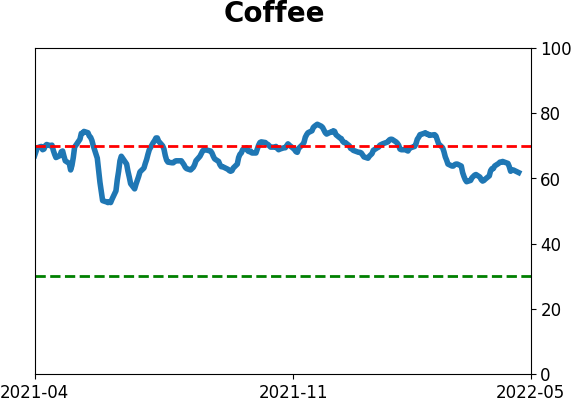
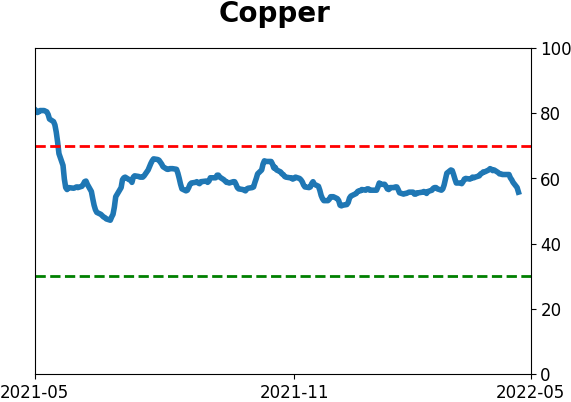
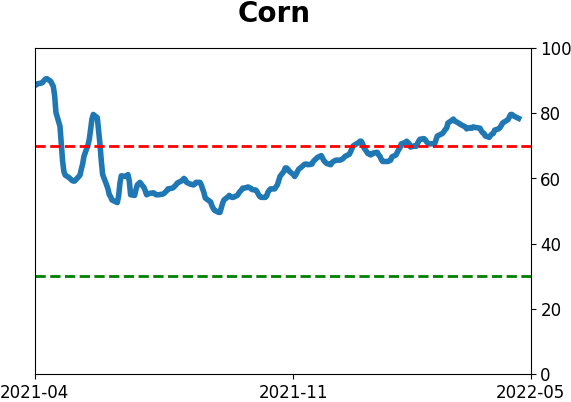
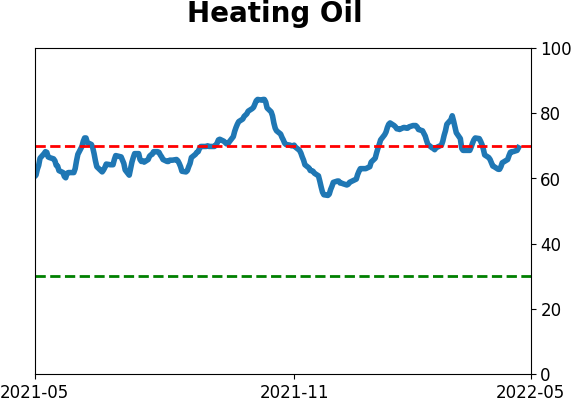
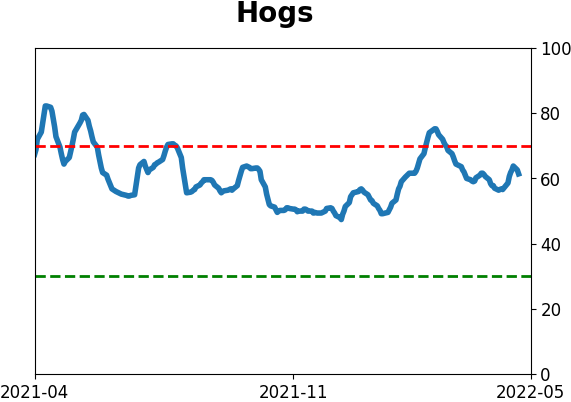
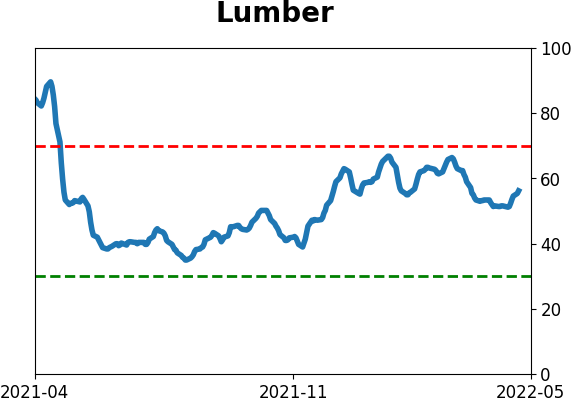
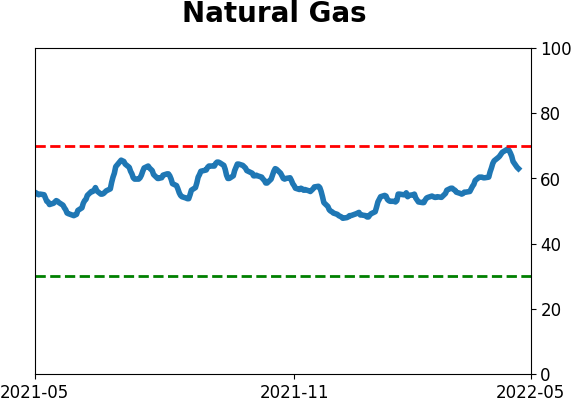
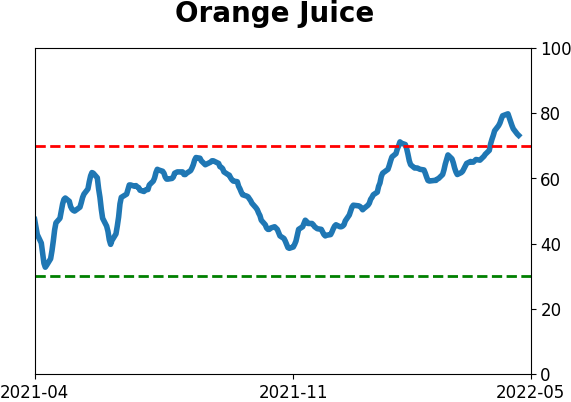
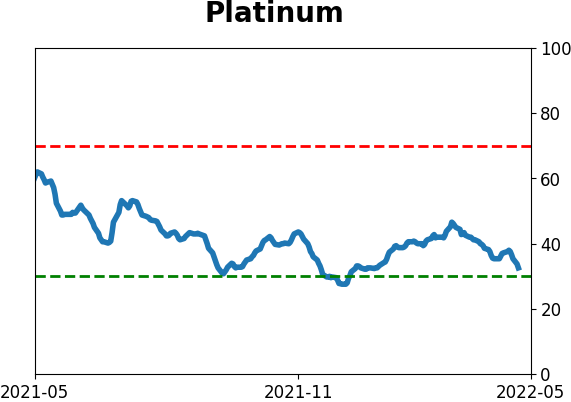
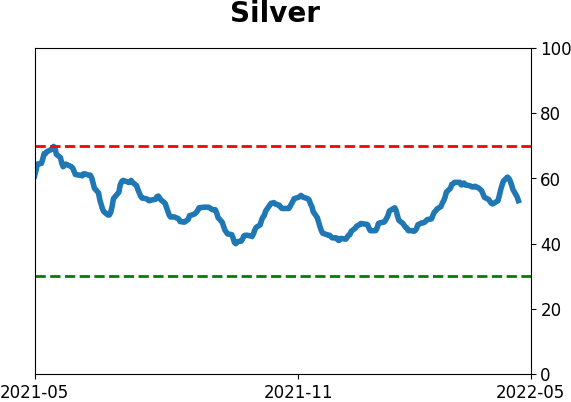
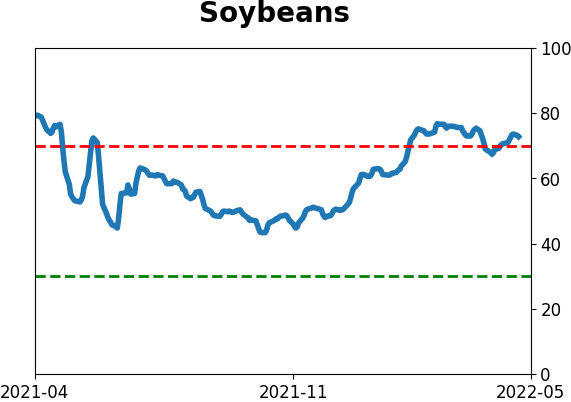
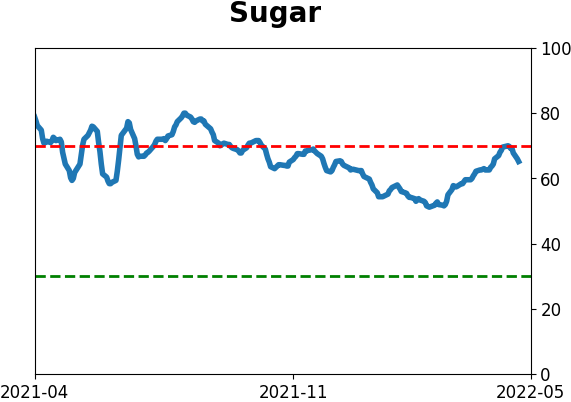
Commodity ETF's - 5-Day Moving Average
|
|