Headlines
|
|
A rare and extremely bullish signal from financials:
Financials triggered a rare oversold reversal signal. Similar precedents saw the S&P 500 Financials sector rally 100% of the time over the subsequent three months.
|
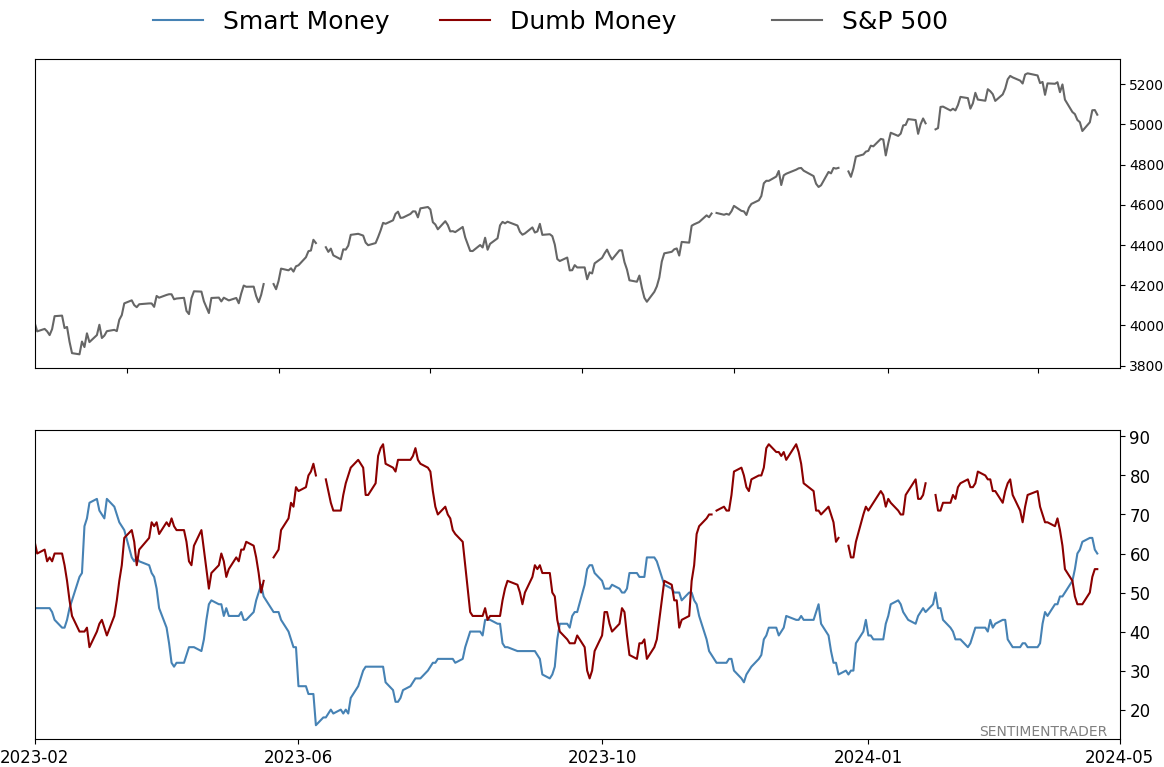
Smart / Dumb Money Confidence
|
Smart Money Confidence: 60%
Dumb Money Confidence: 56%
|
|
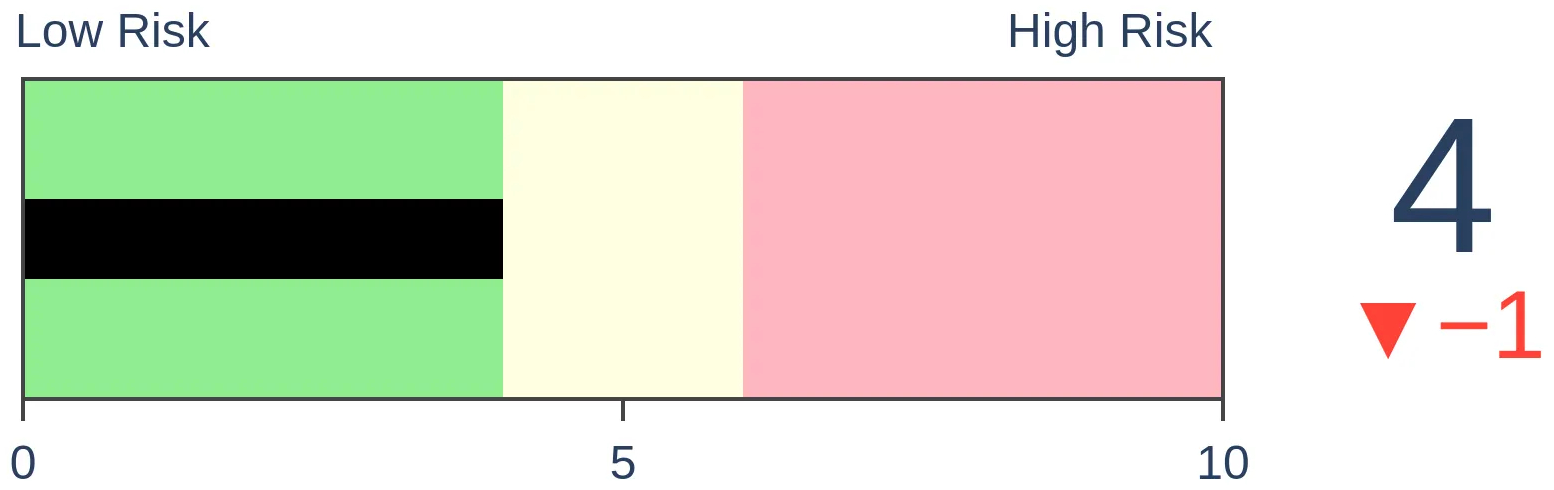
Risk Levels
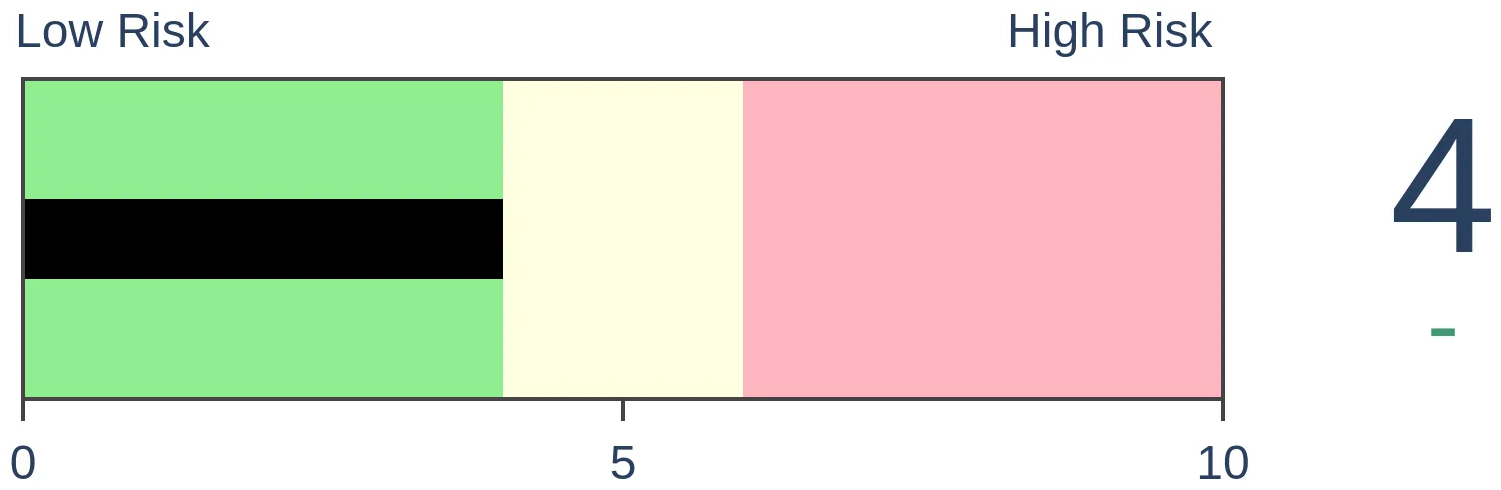
Stocks Short-Term

|
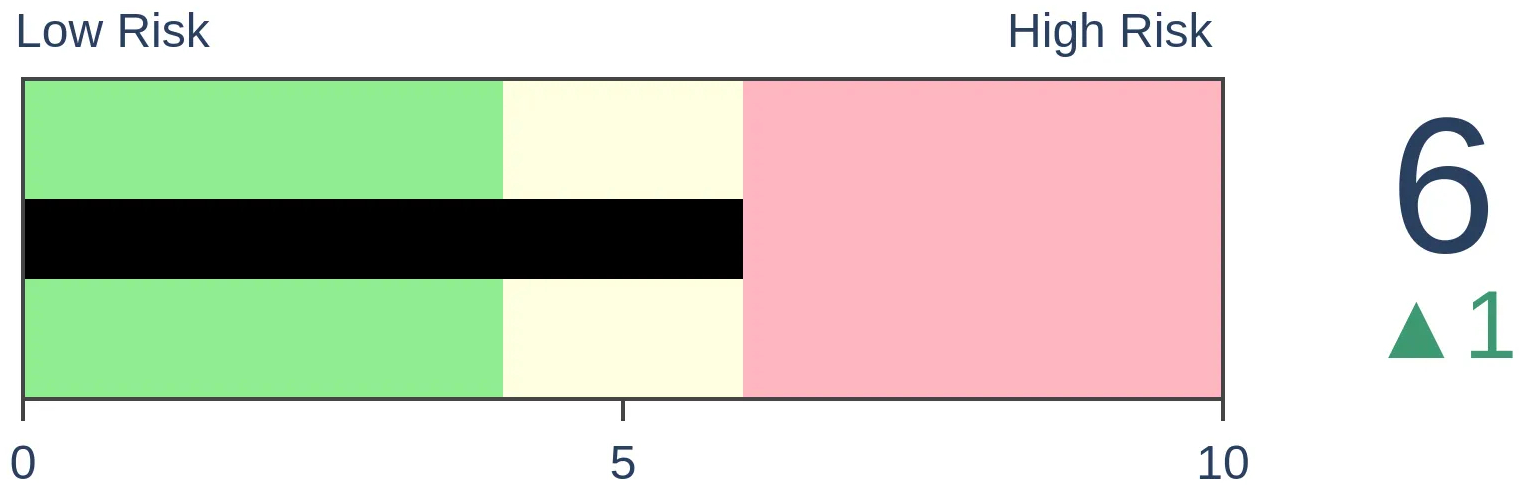
Stocks Medium-Term

|
|
Bonds
|
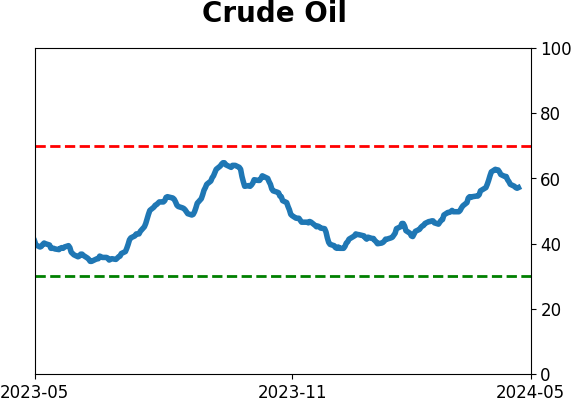
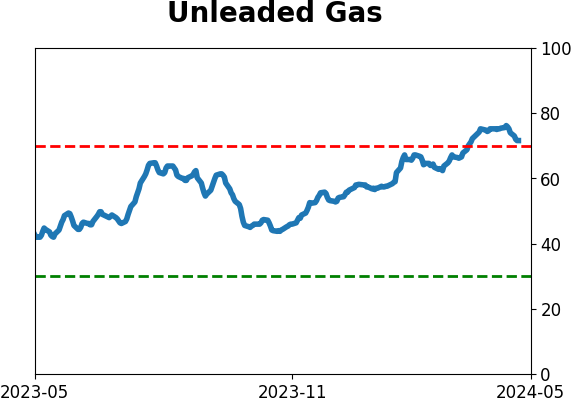
Crude Oil
|
|
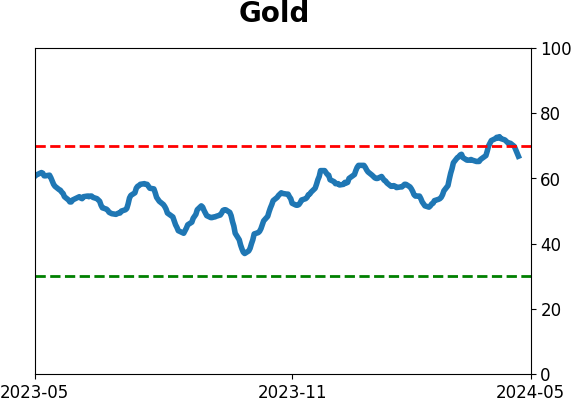
Gold
|
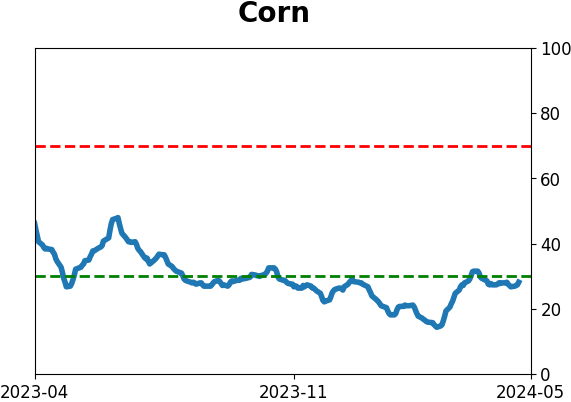
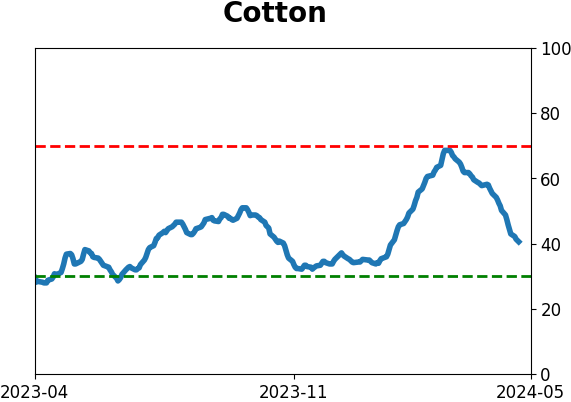
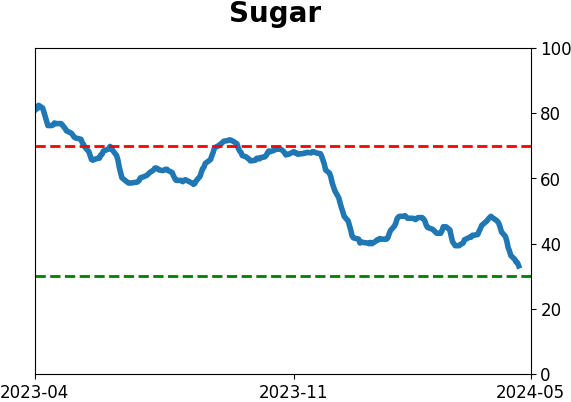
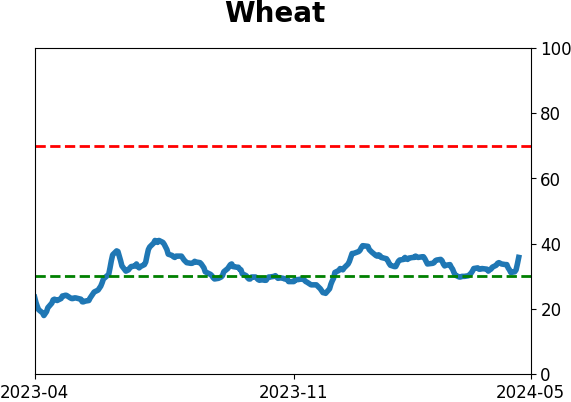
Agriculture
|
|
Research
By Dean Christians
BOTTOM LINE
Financials triggered a rare oversold reversal signal. Similar precedents saw the S&P 500 Financials sector rally 100% of the time over the subsequent three months.
FORECAST / TIMEFRAME
None
|
Key points:
- The S&P 500 Financials sector surged from an oversold condition within the context of favorable trends
- Similar reversals saw the sector rally 100% of the time over three months and 86% of the time a year later
- S&P 500 Financials outperformed the S&P 500 over the following year in all but one horizon
Financials look poised to reestablish their bullish uptrend
As previously addressed in several reports, traders are confronted with a critical decision whenever an oversold condition emerges: Do I buy as prices decline (catch a falling knife) or wait for a reversal? A more favorable risk/reward setup typically occurs by waiting for a reversal.
Last week, most S&P 500 stocks reached an oversold status, setting up potential thrust or reversal signals.
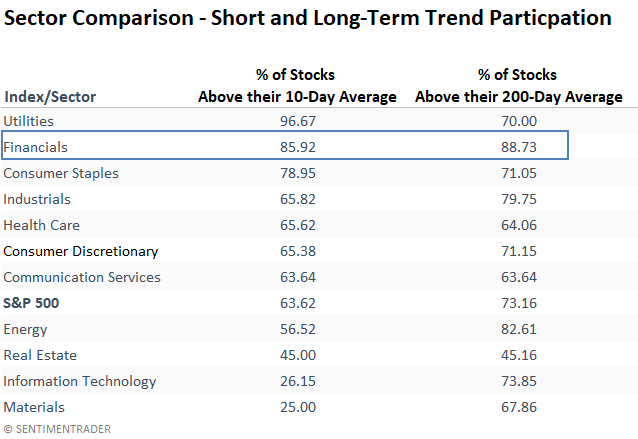
Following a thrust in Consumer Staples, the S&P 500 Financials triggered a bullish signal when the percentage of stocks trading above their 10-day average surged above 80%, following more than 80% of the issues achieving an oversold condition. This surge from an oversold status occurred within the context of more than 80% of members closing above their 200-day average.
I call this setup the 80-80-80 signal.
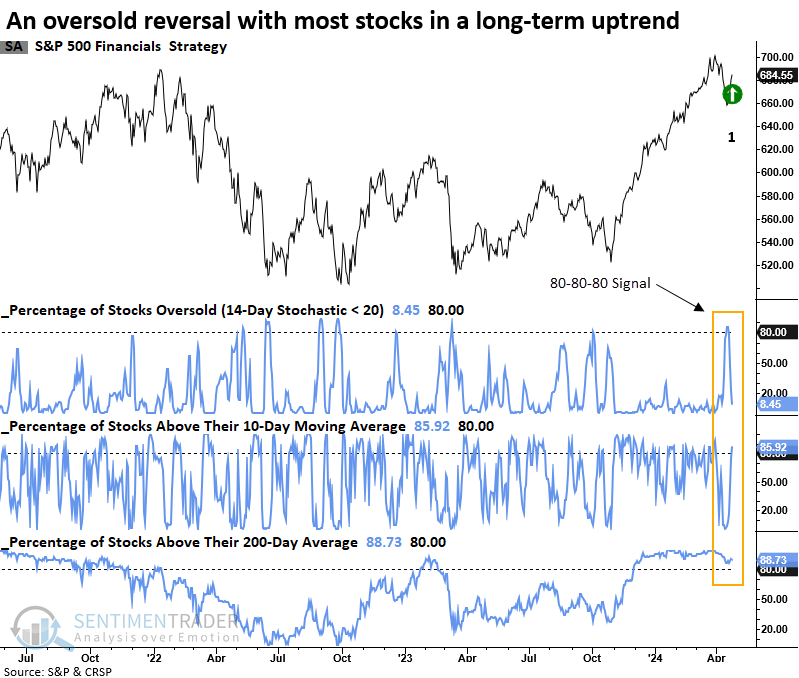
Following Tuesday's session, S&P 500 Utilities and Financials emerged as the sole sectors where the proportion of stocks surpassing their 10-day average soared above 80%. Additionally, Financials are one of two sectors boasting over 80% of their stocks trading above their 200-day averages.
So, Financials are exhibiting excellent short and long-term trends.
Similar reversals from an oversold condition preceded positive returns
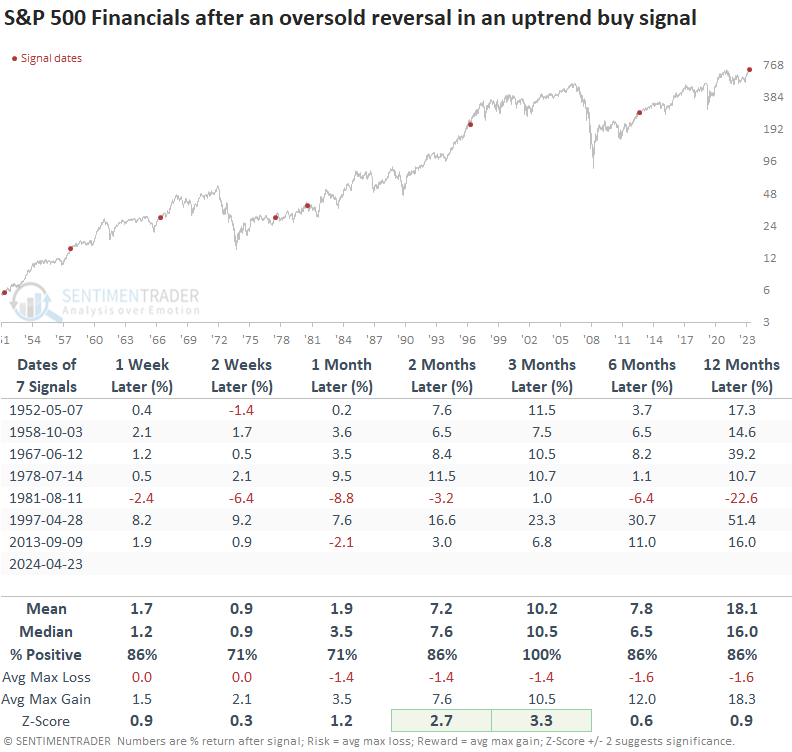
When financial sector stocks reach an oversold status, and subsequently surge within the context of most stocks exhibiting long-term uptrends, the outlook for S&P 500 Financials suggests the prior uptrend resumes.
Over the following three months, S&P 500 Financials rallied 100% of the time, with a median return that displayed significance relative to returns over the study period. A year later, the sector was higher in all but one case.
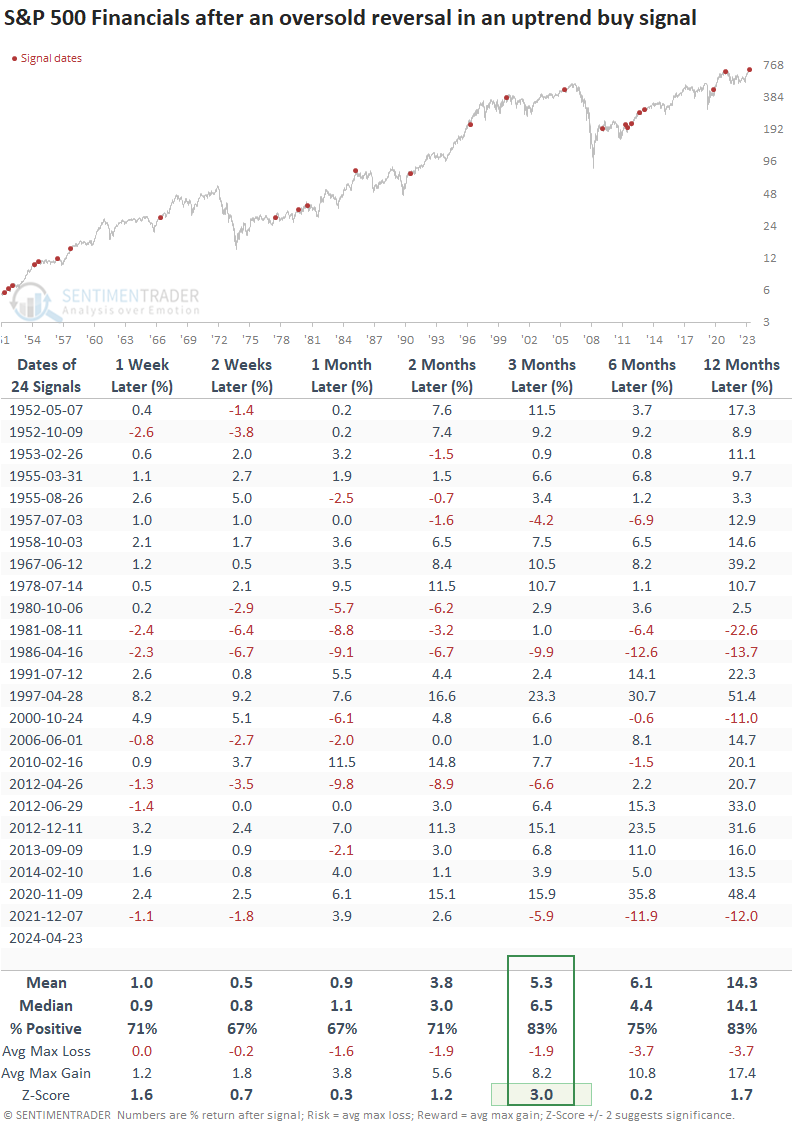
If I lower the threshold for the percentage of S&P 500 Financial sector stocks reaching an oversold status and the percentage above the 200-day from 80% to 70% to capture a larger sample size, the outlook for financials remains favorable, with the sector rising 83% of the time over the subsequent three and twelve months.
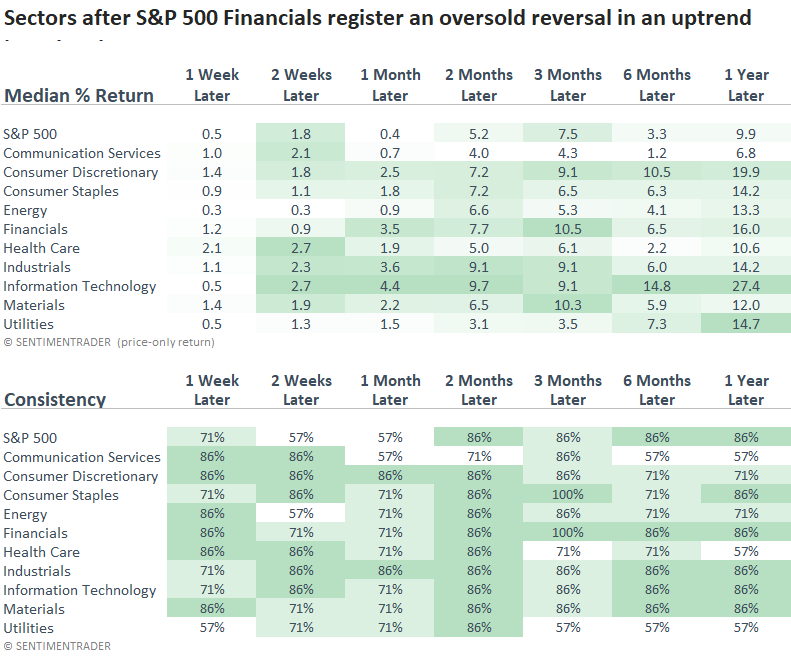
Over the subsequent year, S&P 500 Financials outperformed the S&P 500 index in all but a single time frame. Relative to sectors, it was one of the best performers across most horizons.
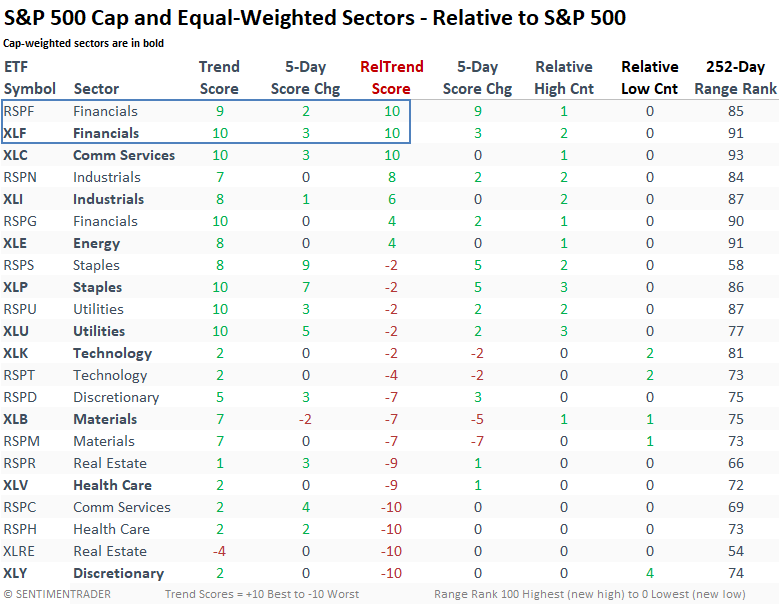
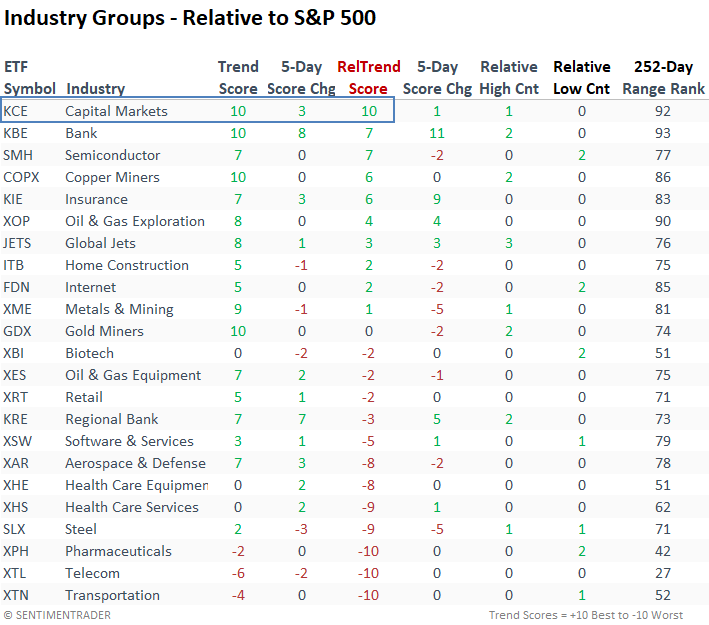
Absolute and relative trend scores
Both the cap and equal-weighted S&P 500 Financials ETFs maintain a perfect relative trend score compared to the S&P 500.
Industry rankings reveal the Capital Markets ETF (KCE) as the sole group boasting a flawless absolute and relative trend score. Furthermore, it's worth mentioning the remarkable relative trend score change in the Bank ETF (KBE) over the last week.
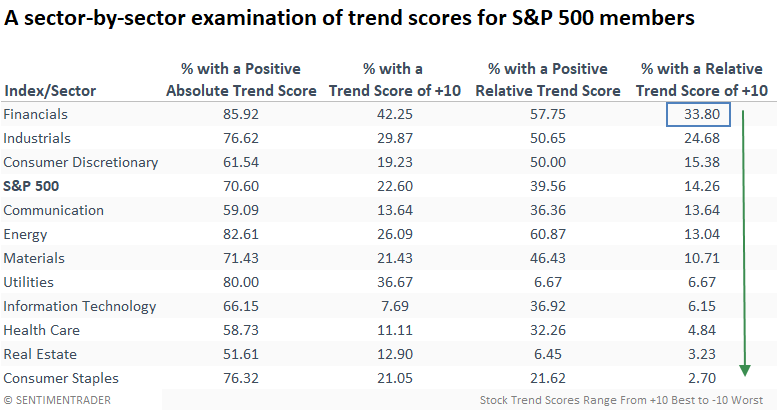
When I analyze the individual stock trends within S&P 500 sectors, I find that one-third of Financial sector stocks sustain a flawless relative trend score of ten, surpassing all other groups.
What the research tells us...
When stocks emerge from a corrective phase, I closely observe which indexes or sectors trigger the first thrust or reversal signal after the drawdown, as they often exhibit a leadership role going forward. Financials, a year-to-date winner, look poised to resume its uptrend after generating an oversold reversal signal this week. Following similar alerts, the S&P 500 Financials displayed a 100% win rate over three months. A year later, the group was higher in all but one case.
Indicators at Extremes
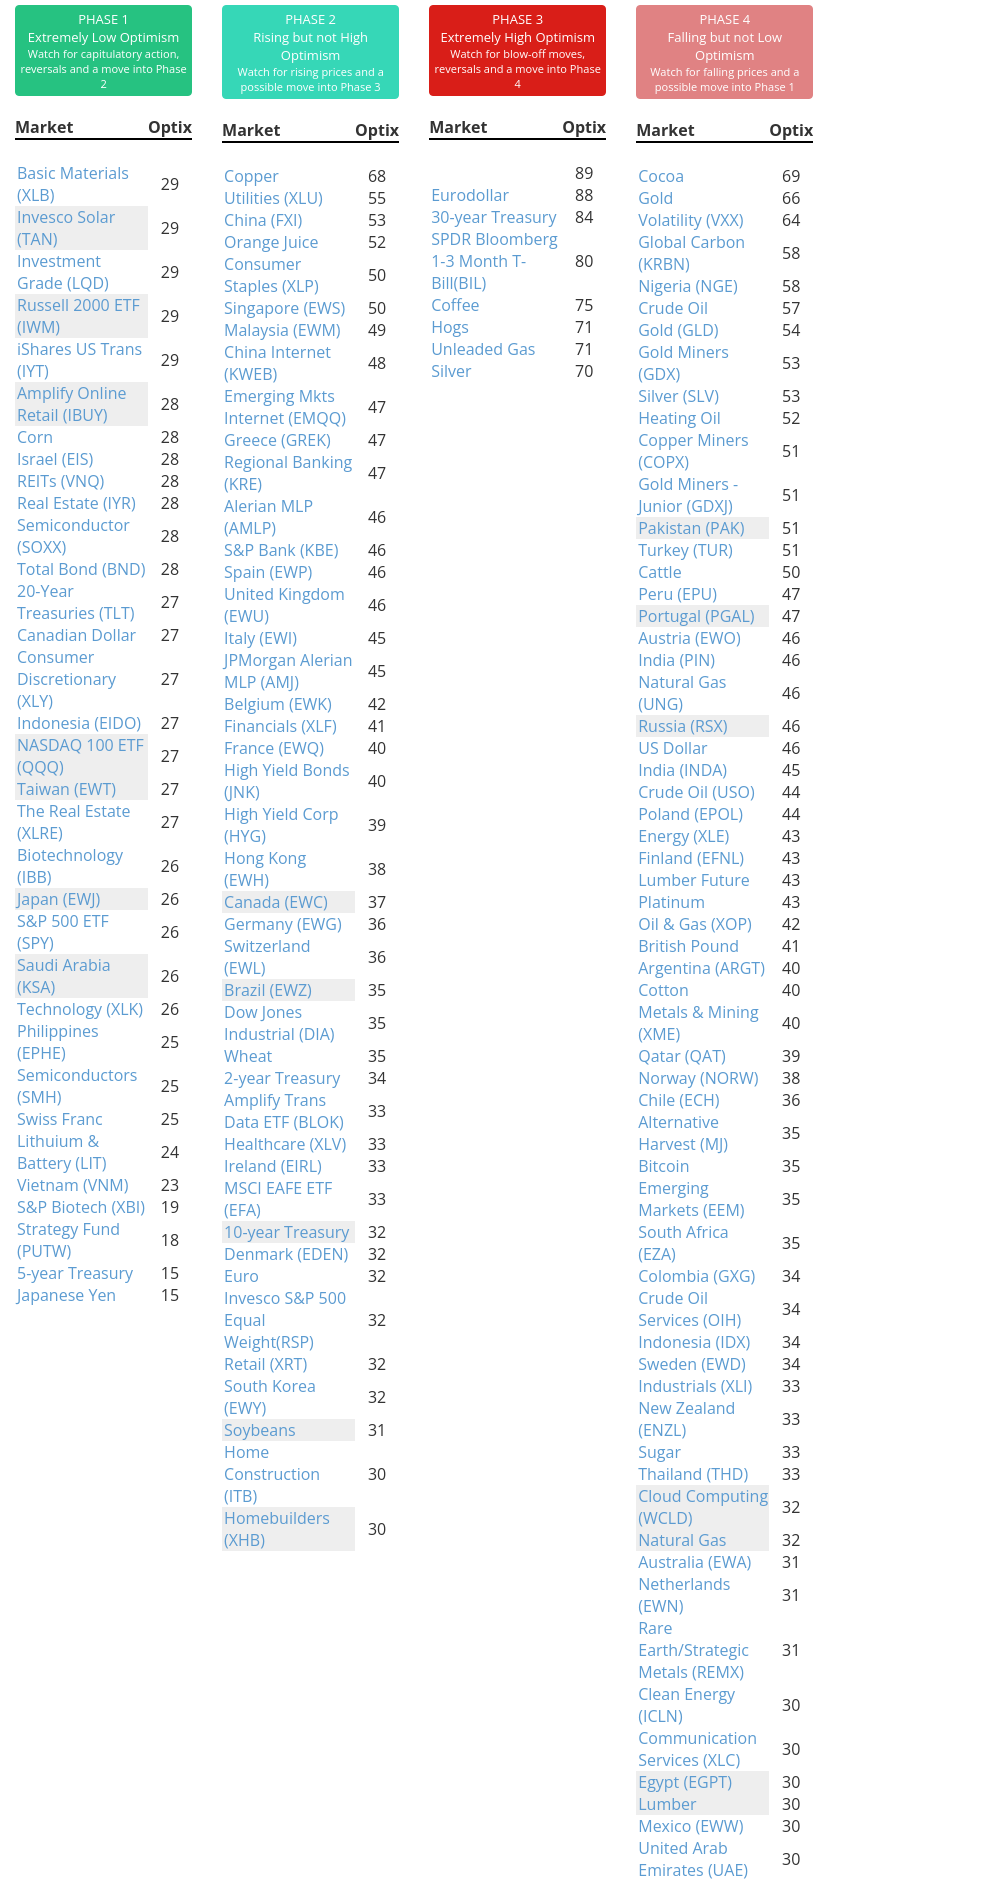
Phase Table
Ranks
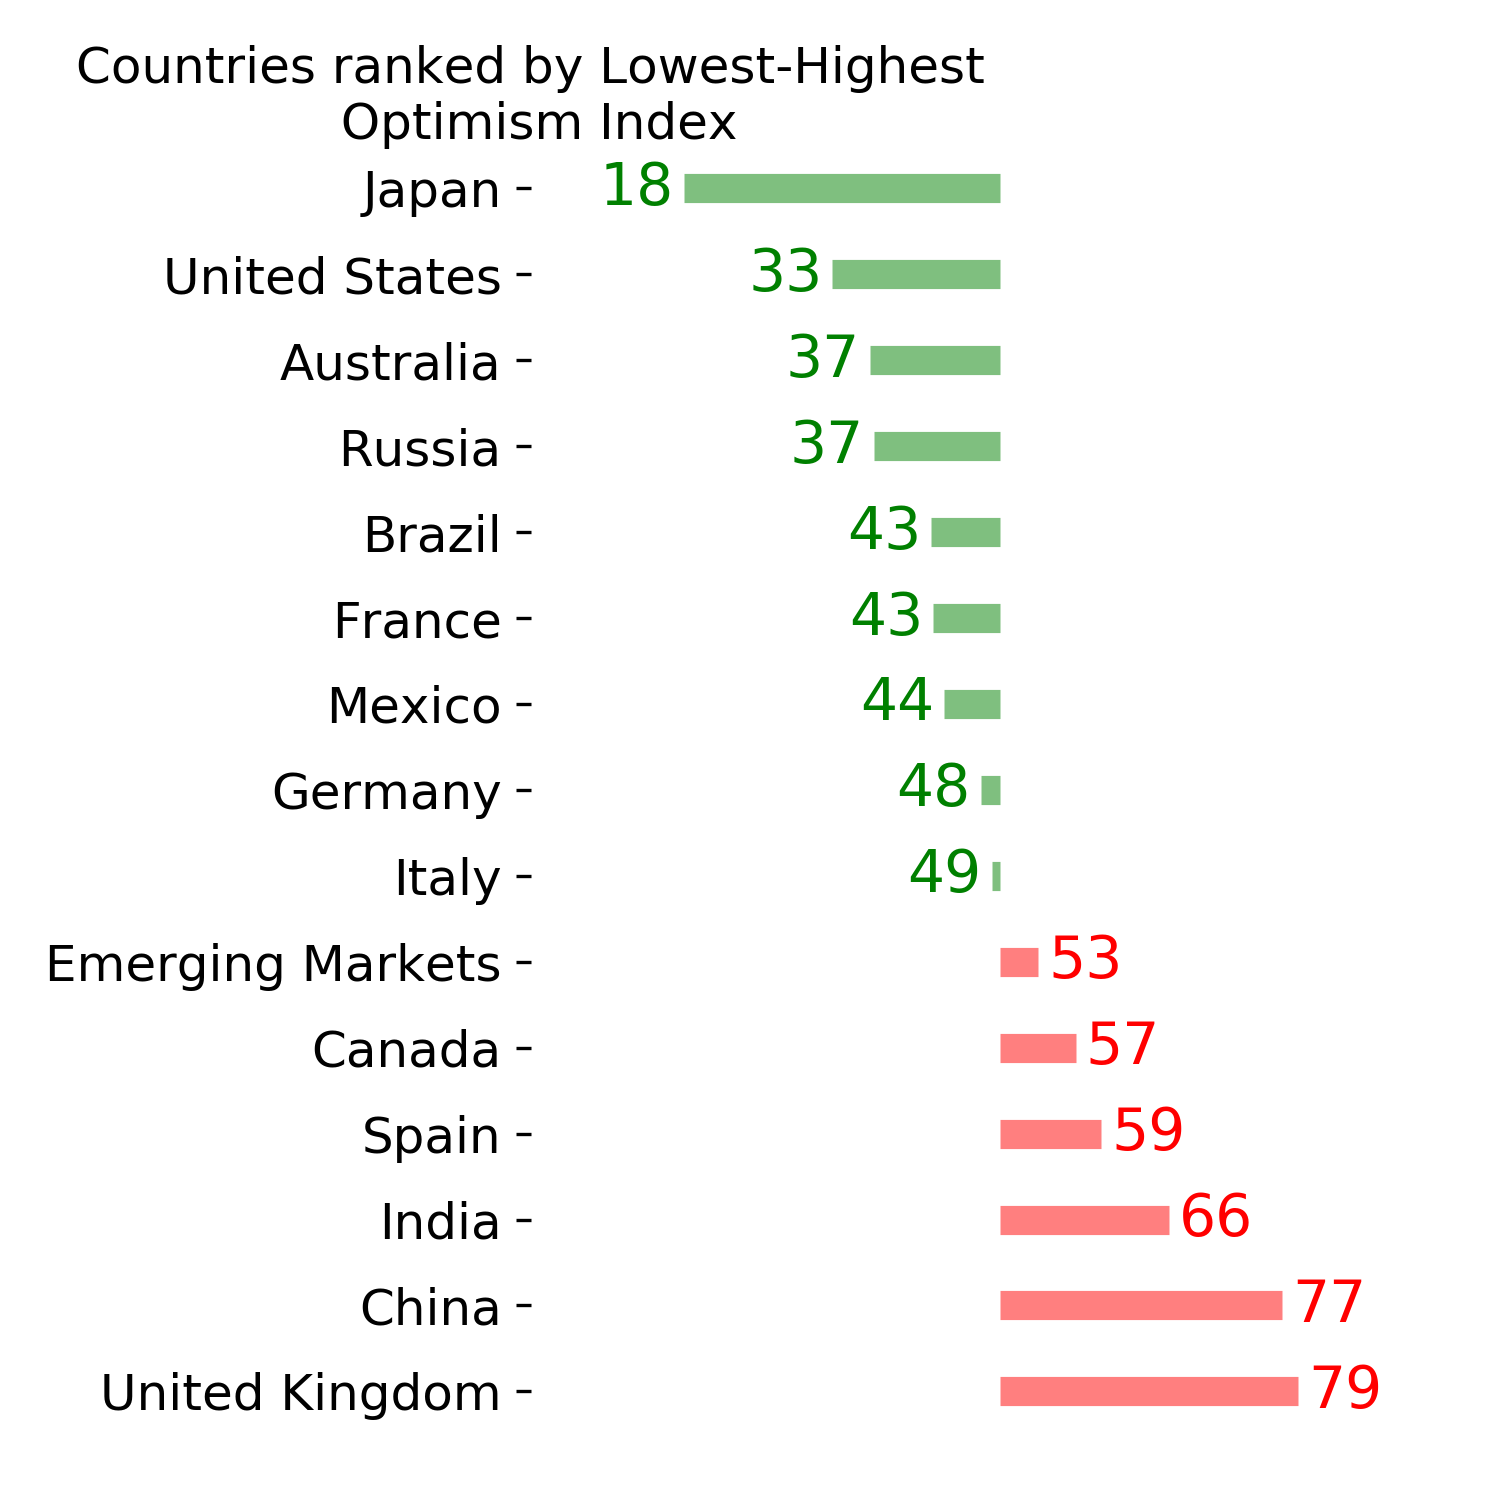
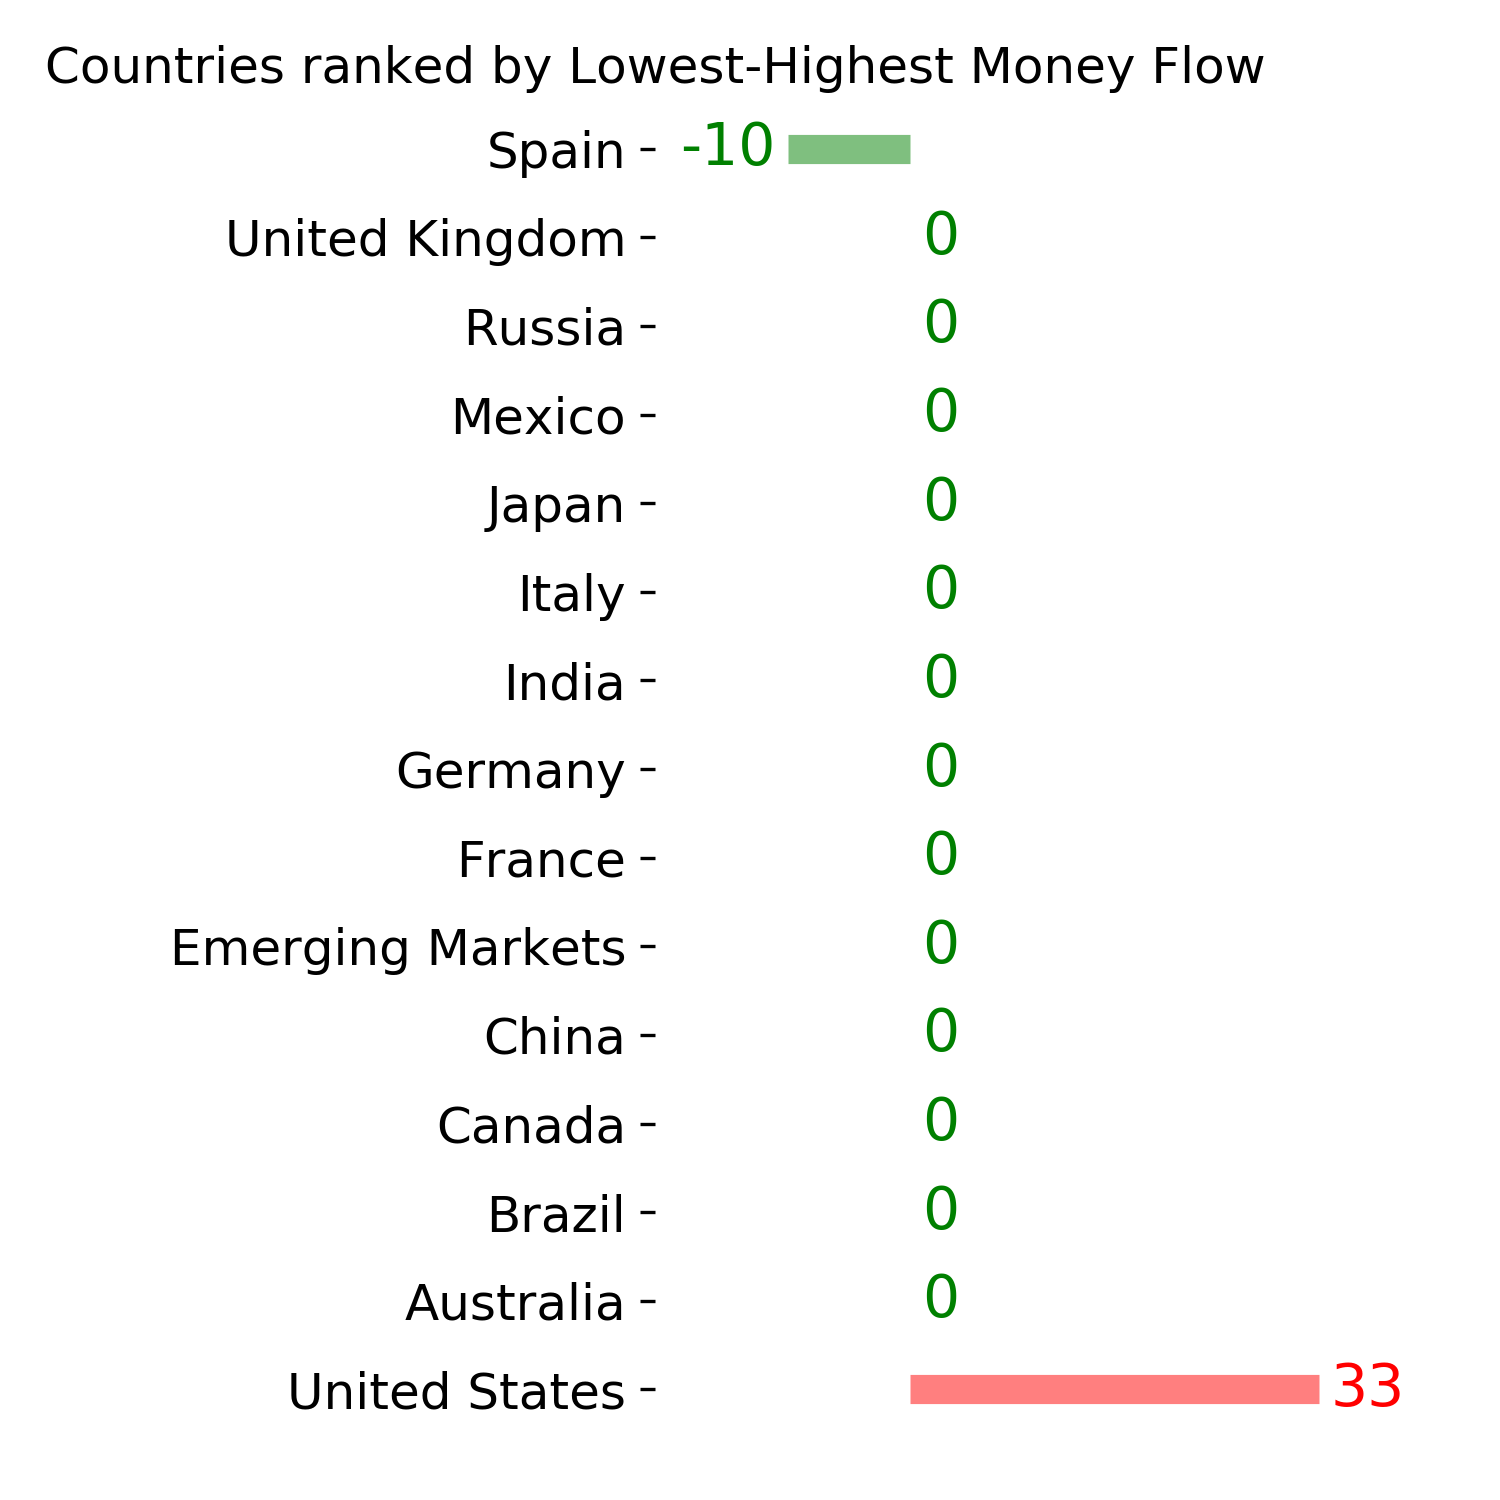
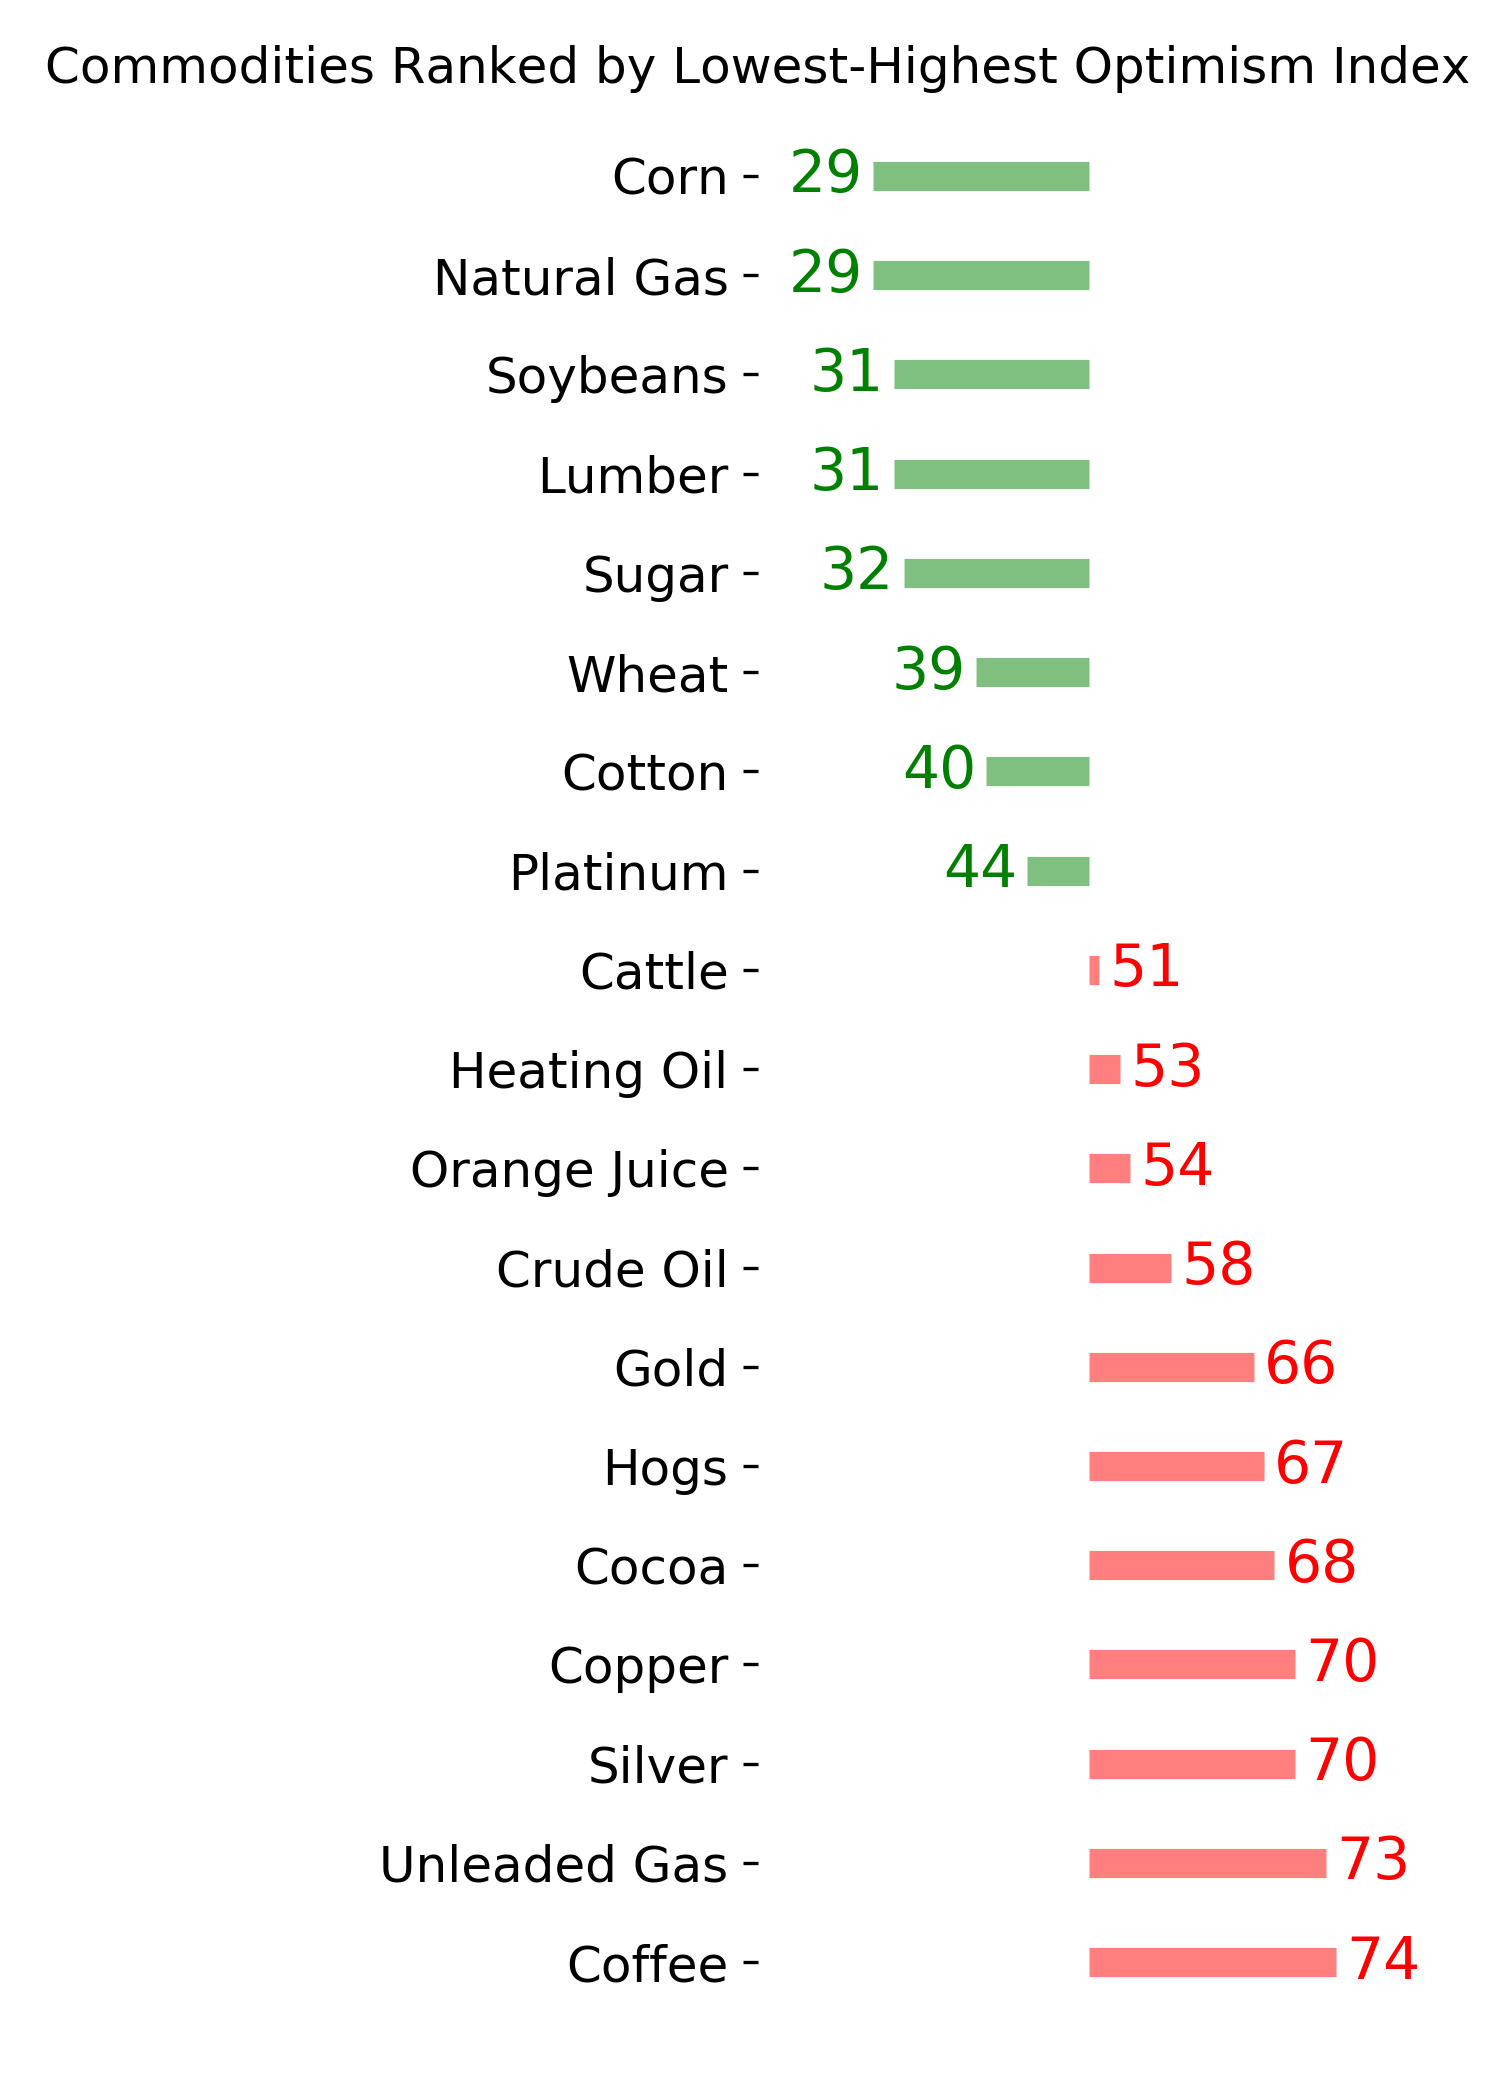
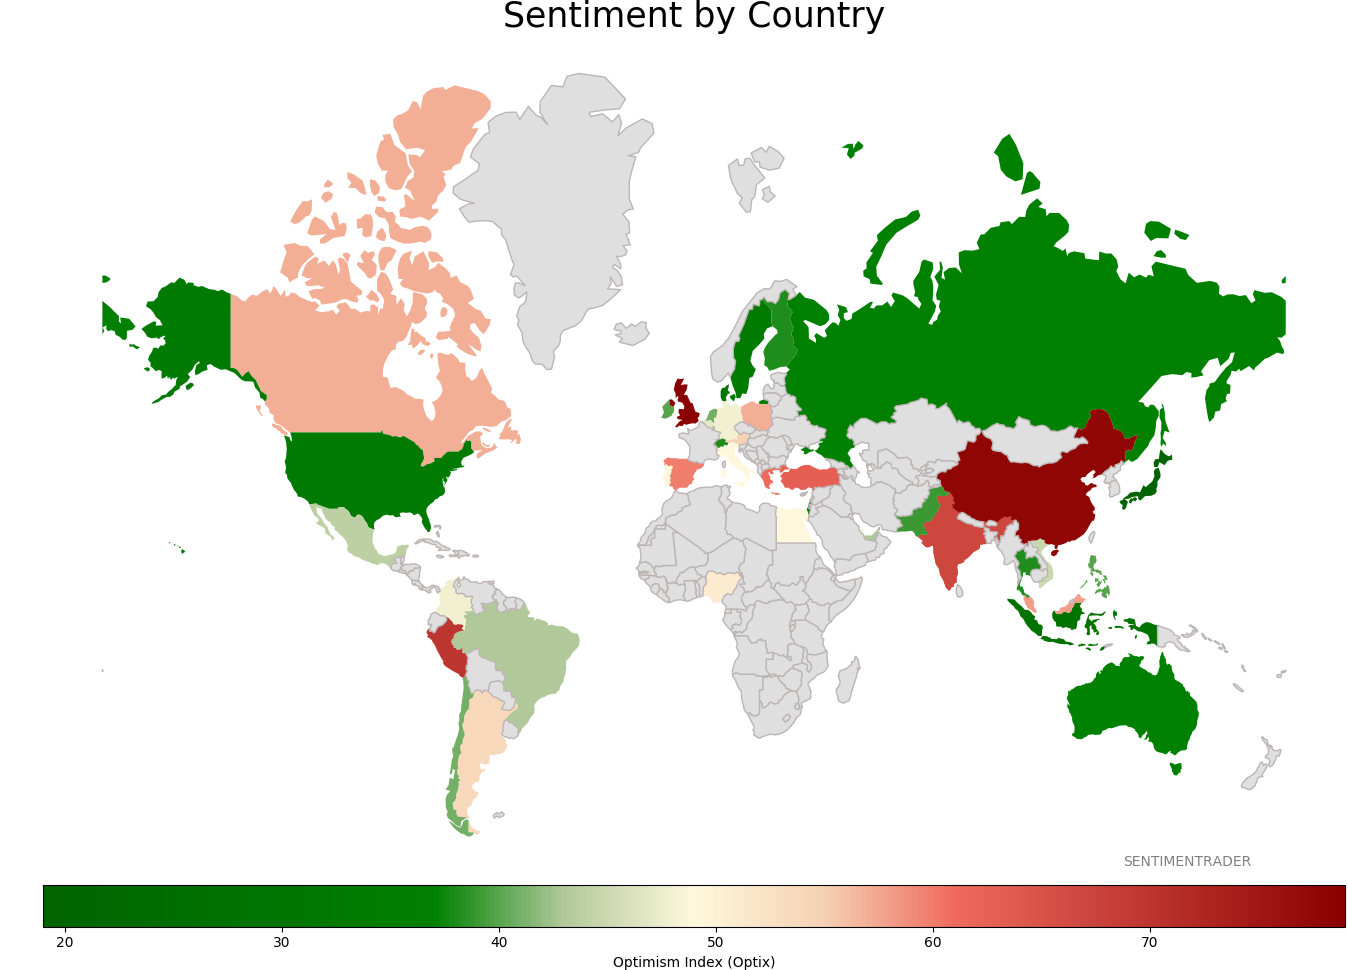
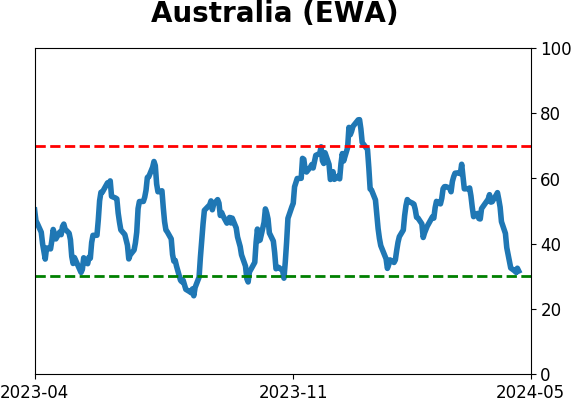
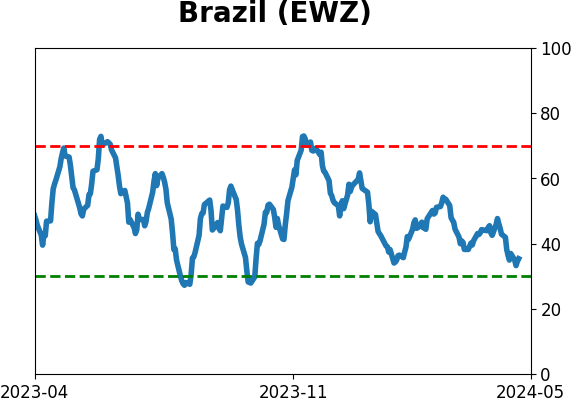
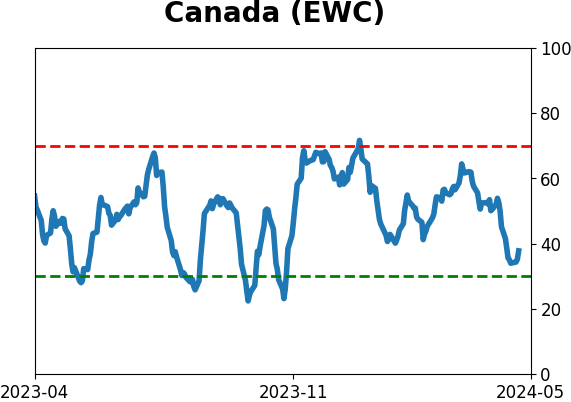
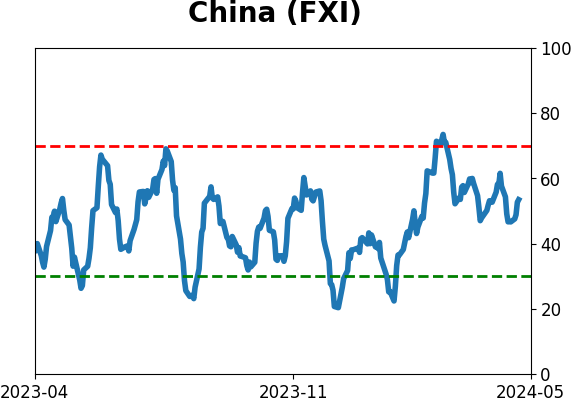
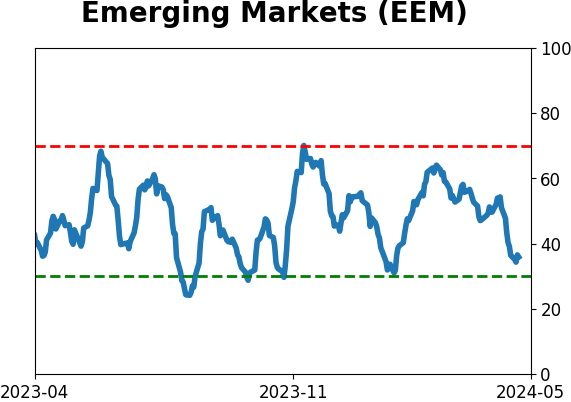
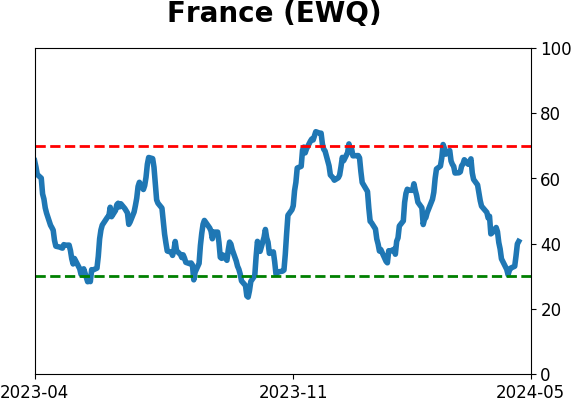
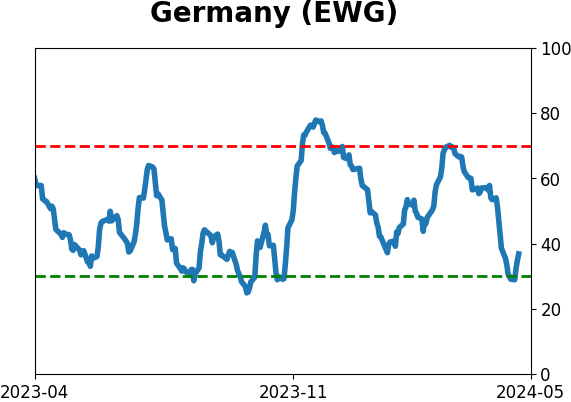
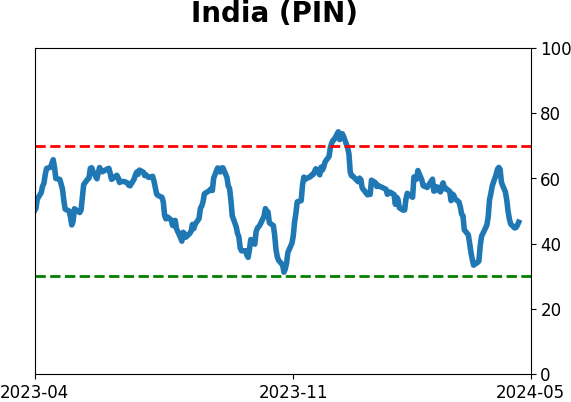
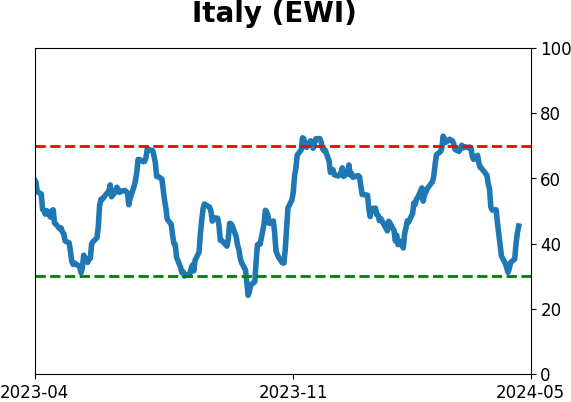
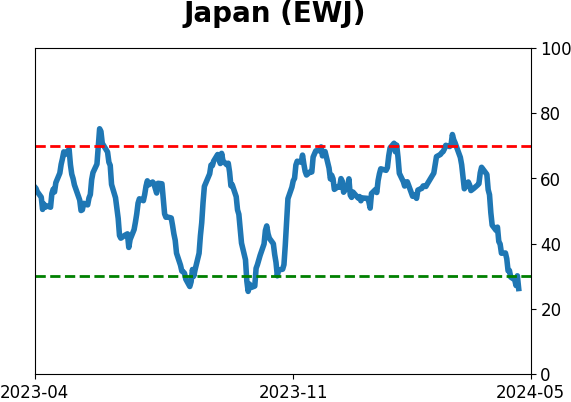
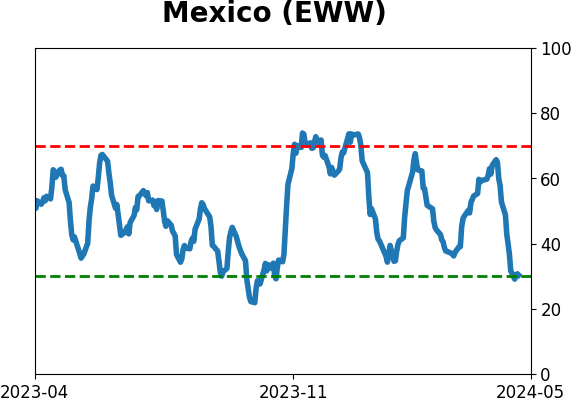
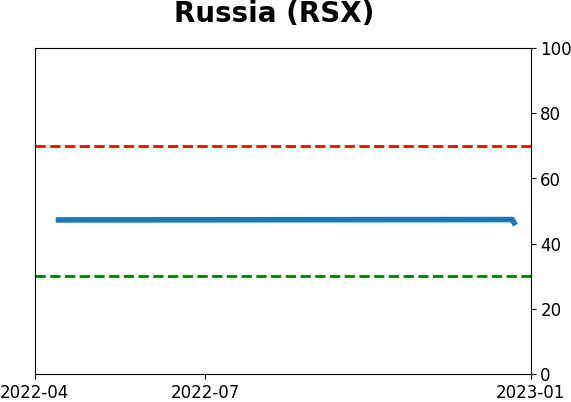
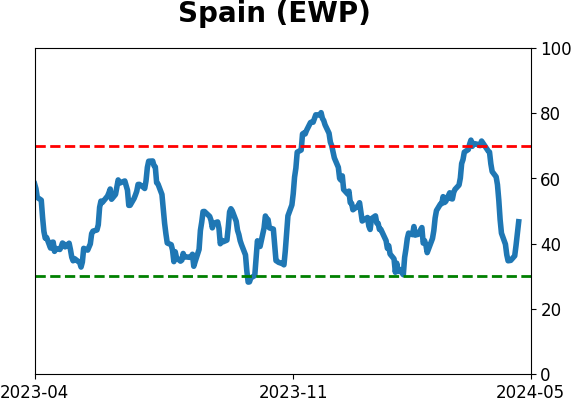
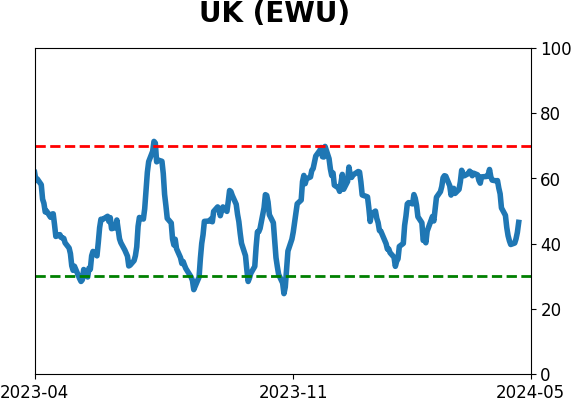
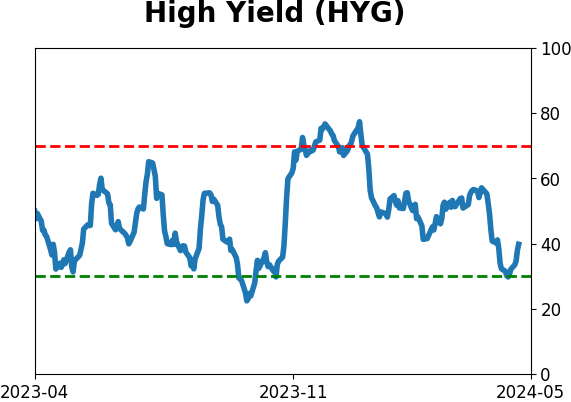
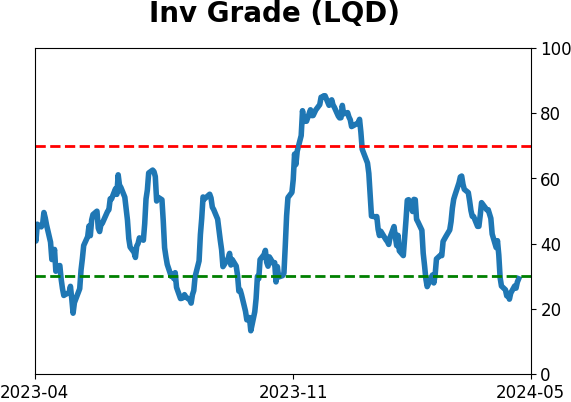
Sentiment Around The World
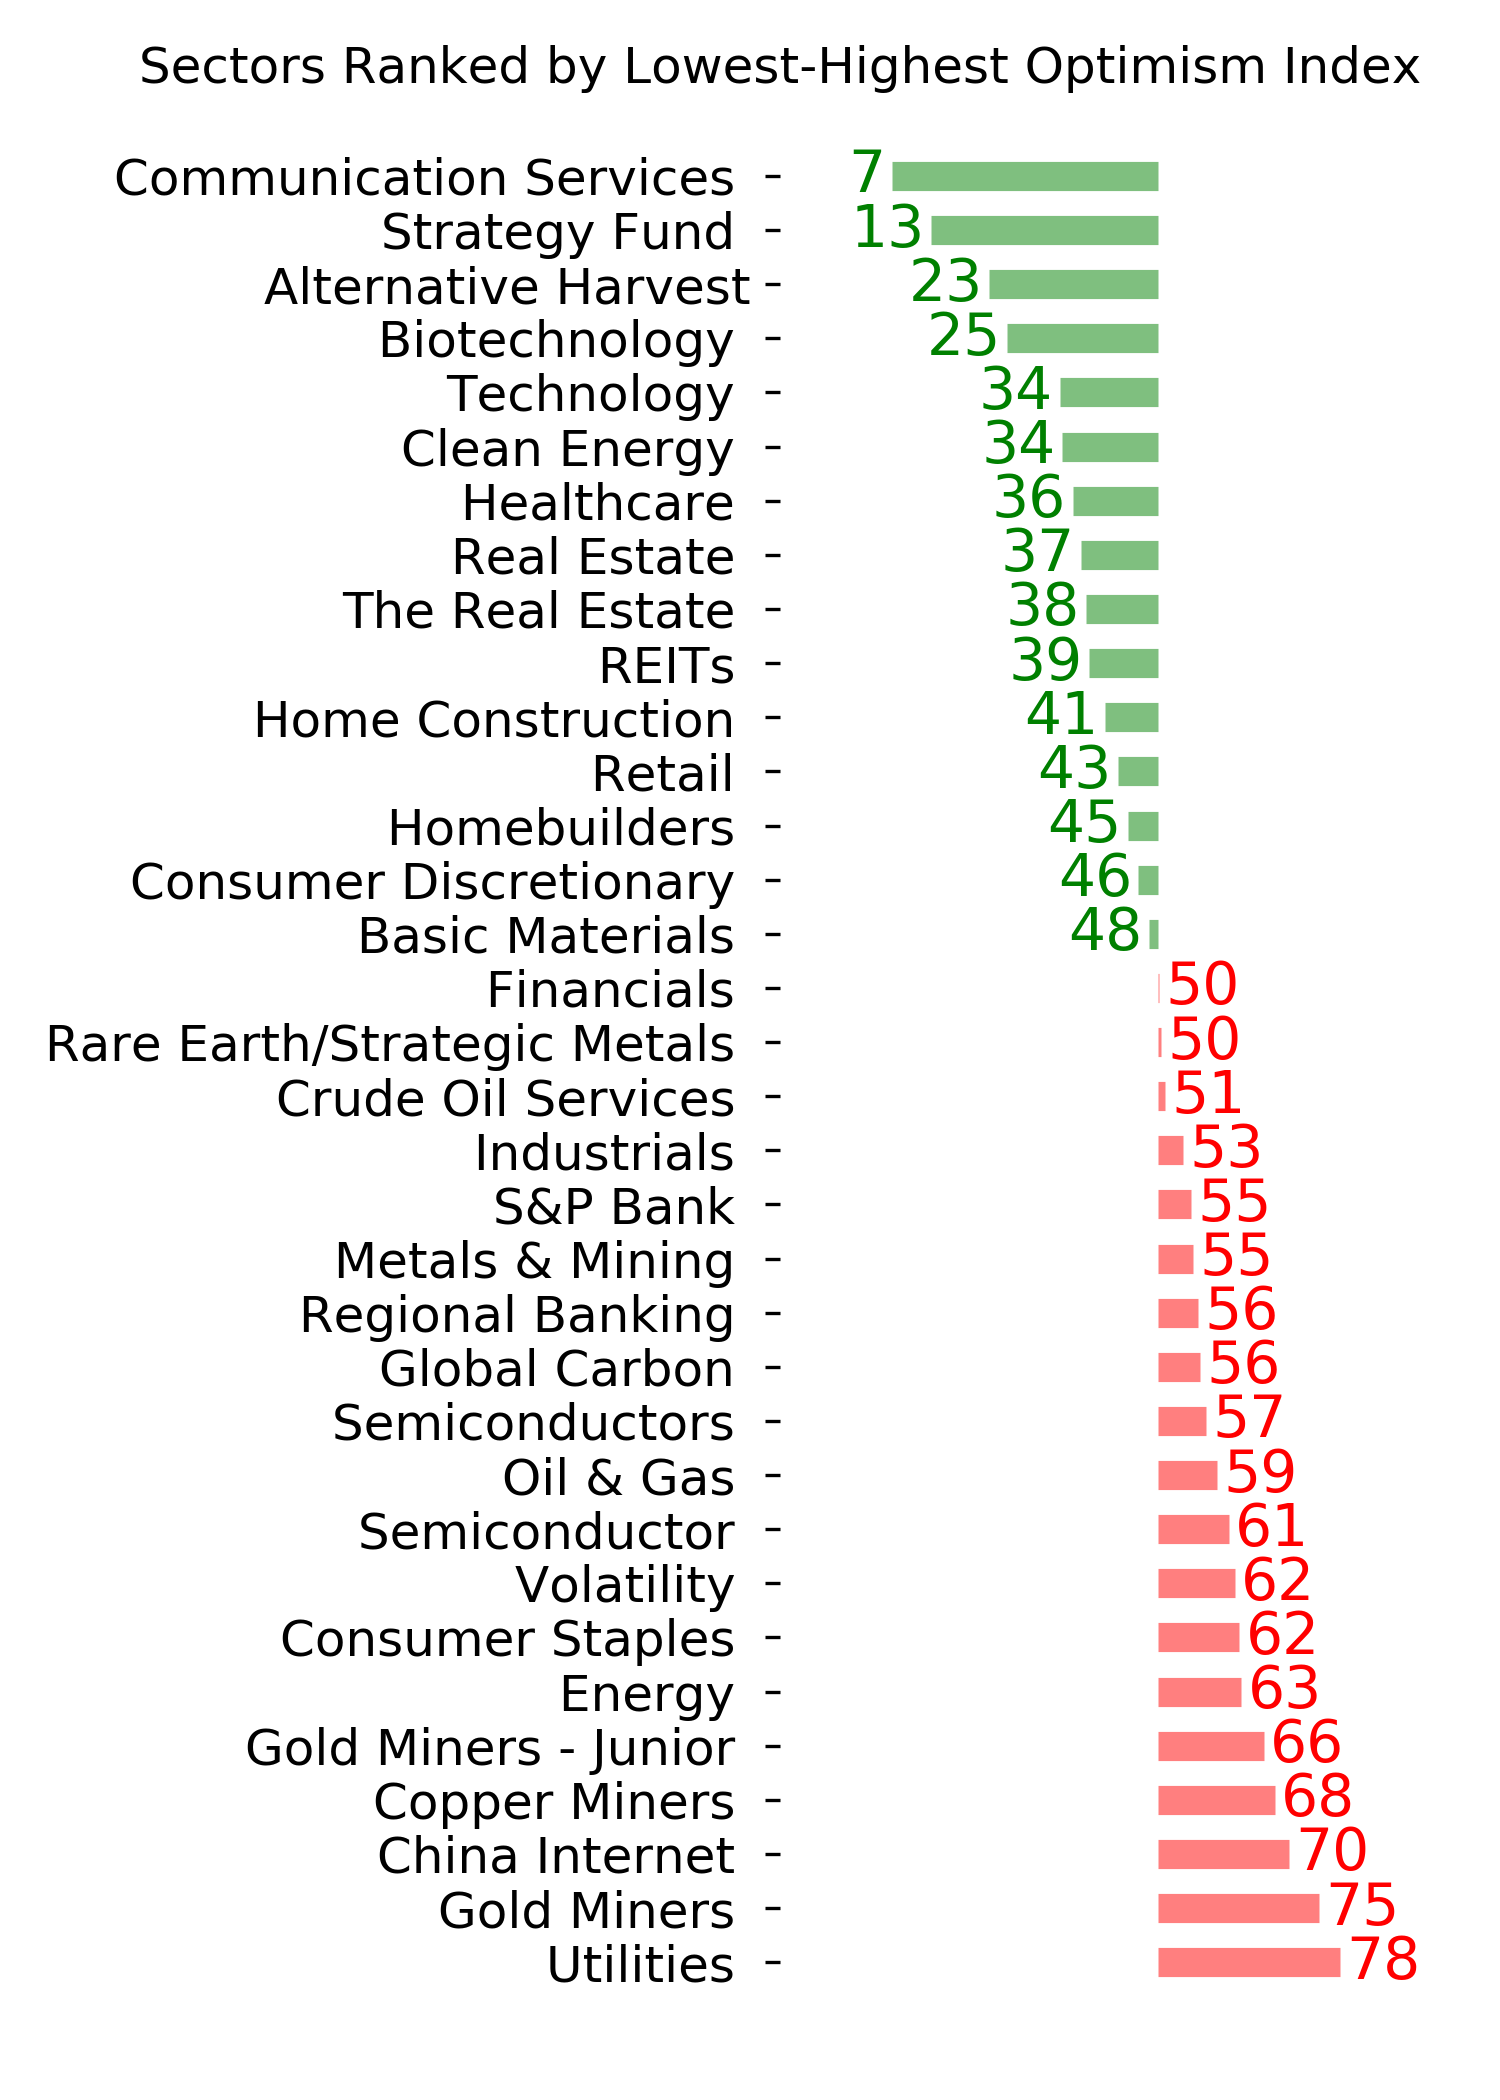
Optimism Index Thumbnails
|
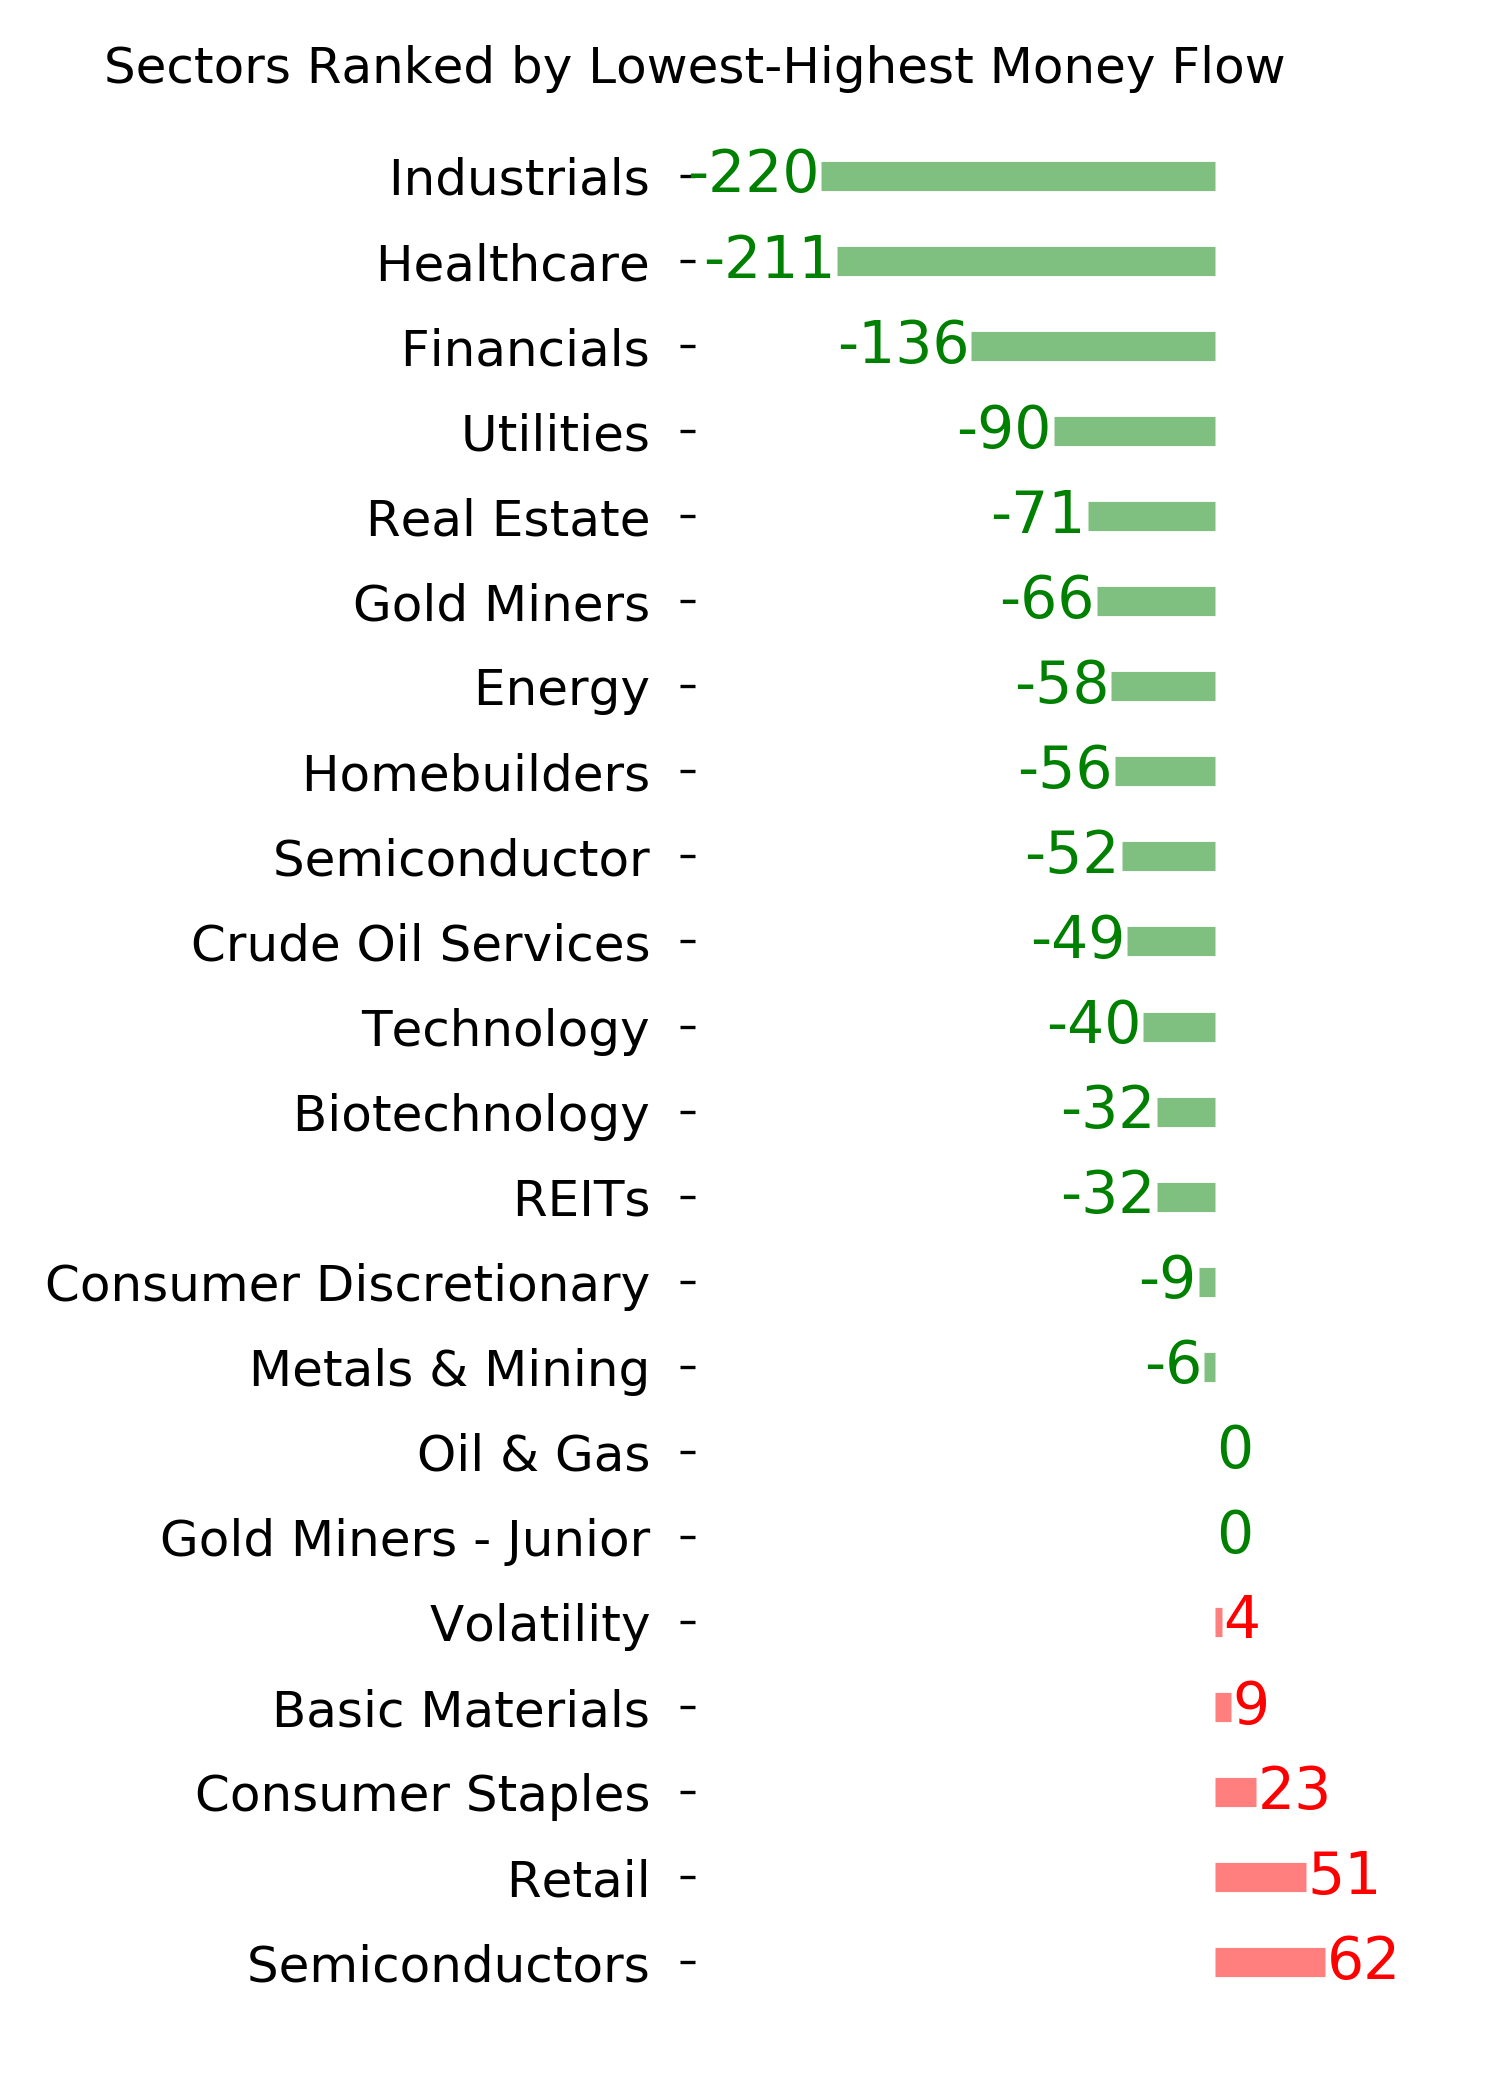
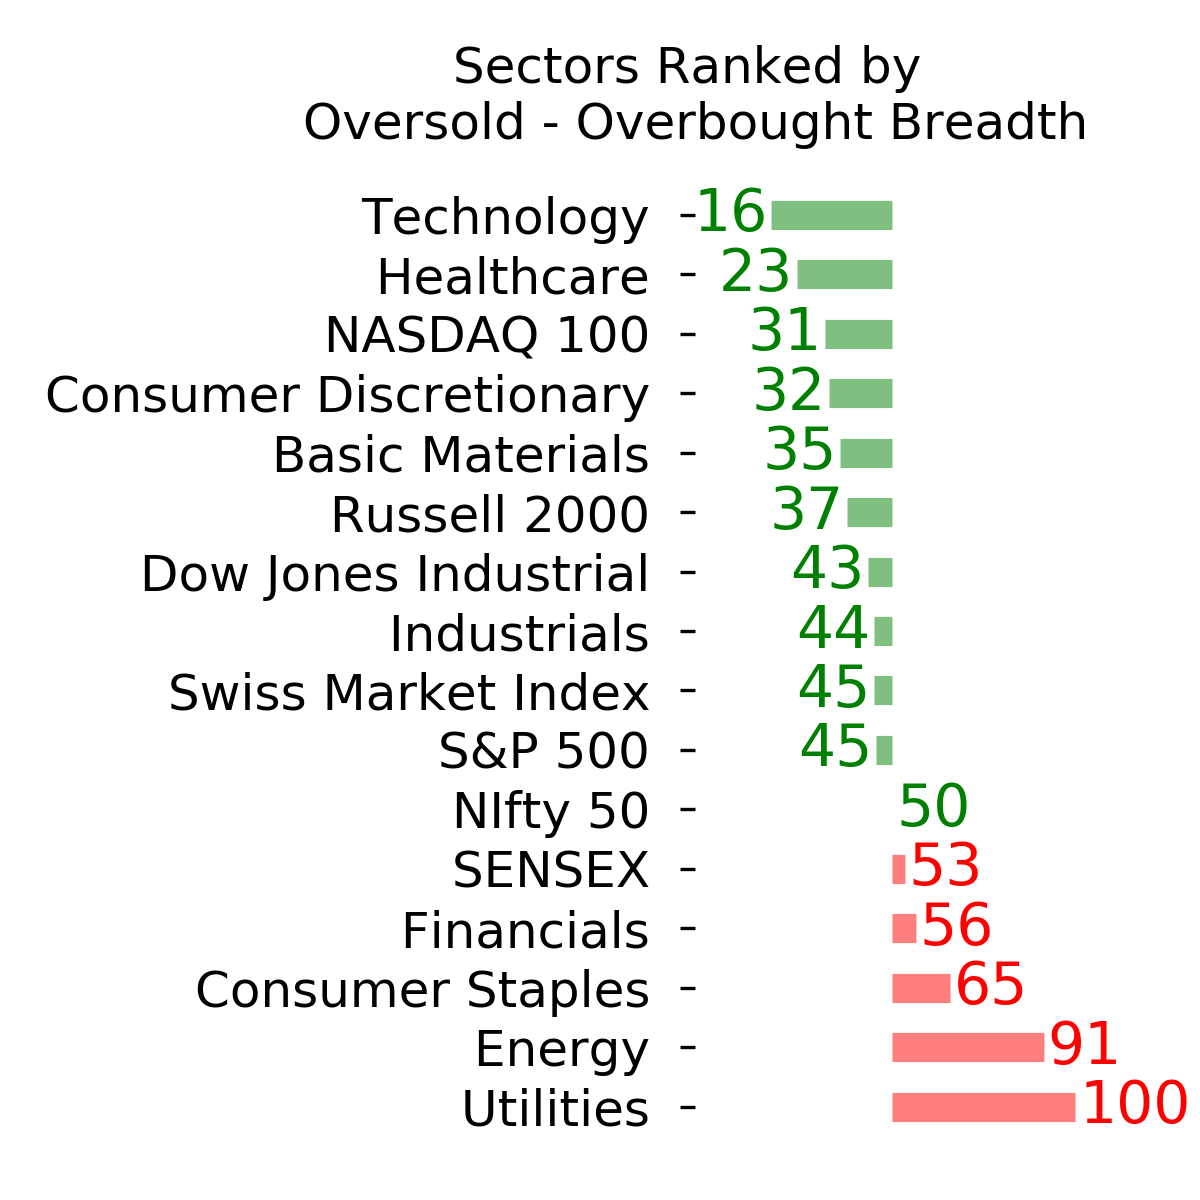
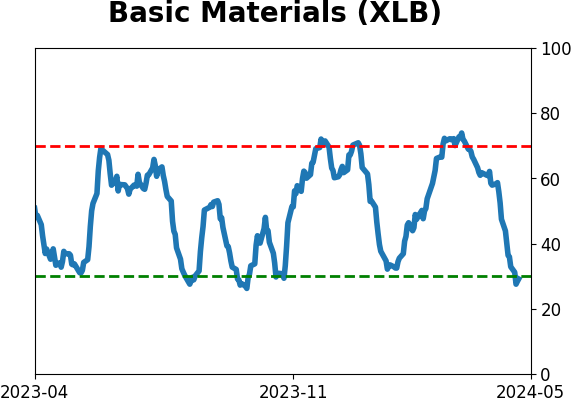
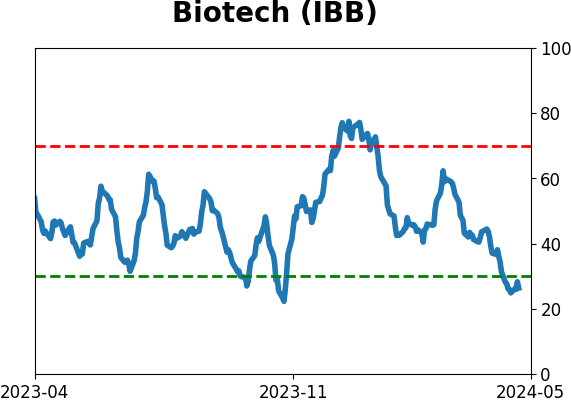
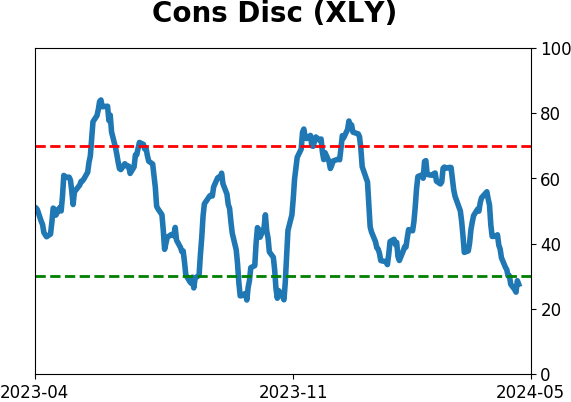
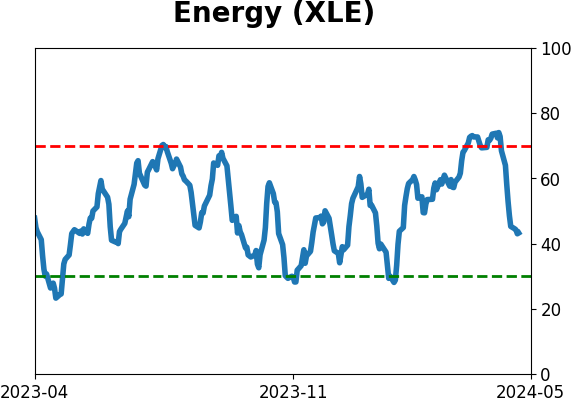
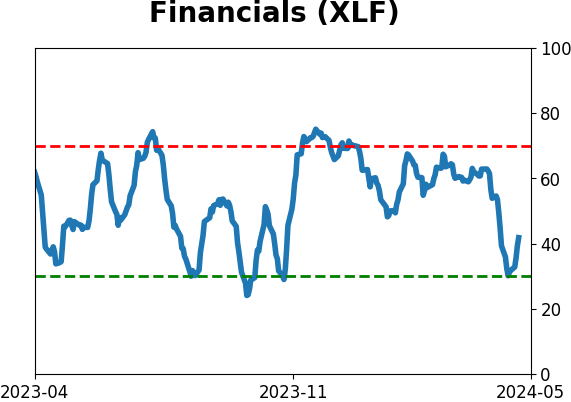
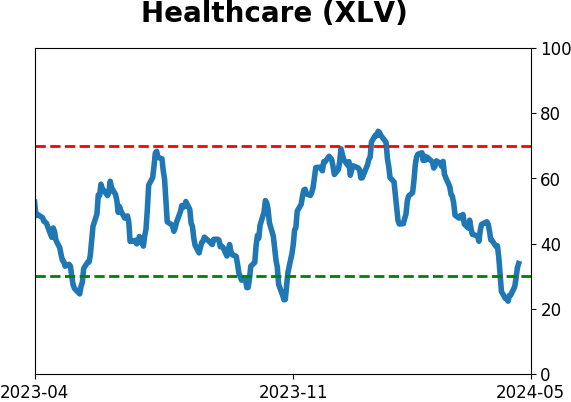
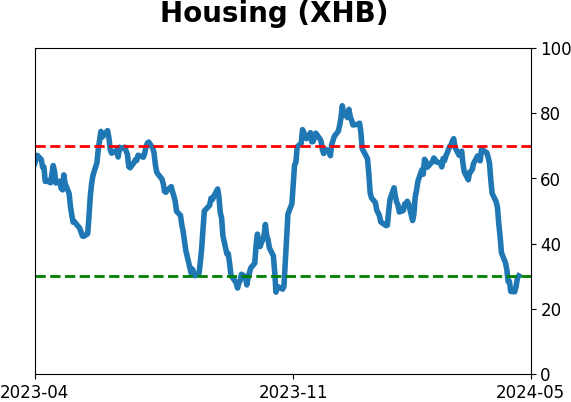
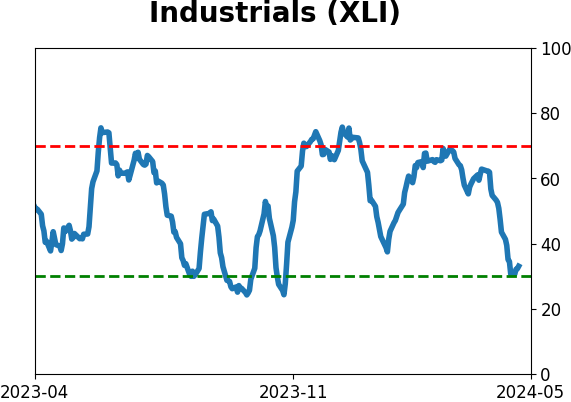
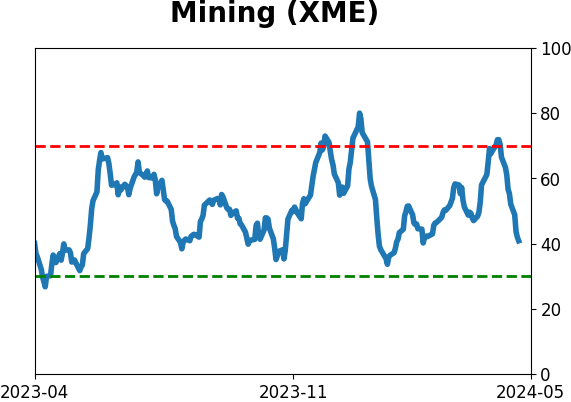
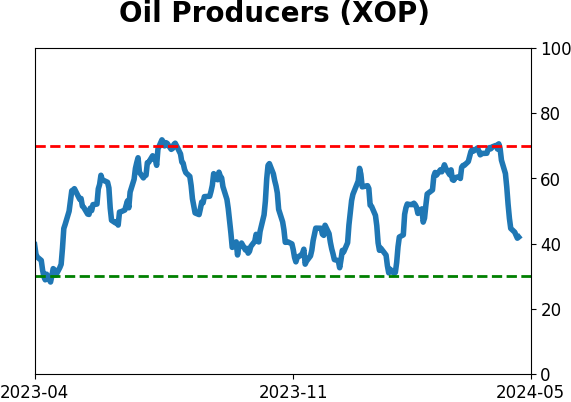
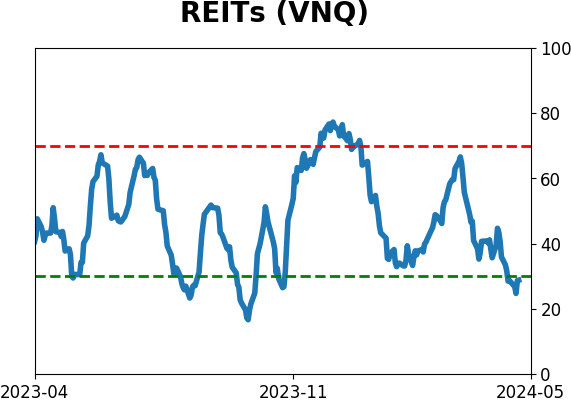
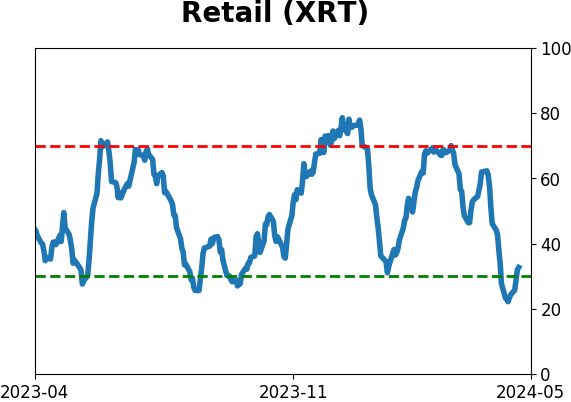
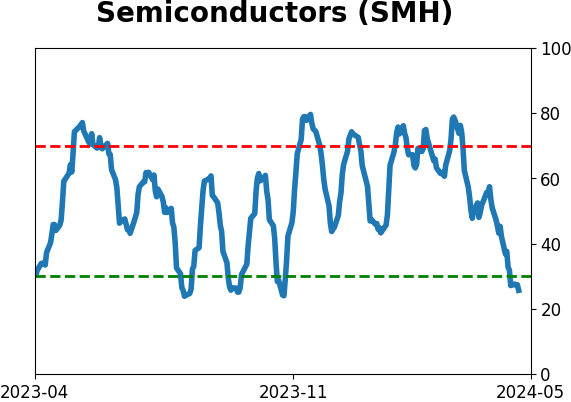
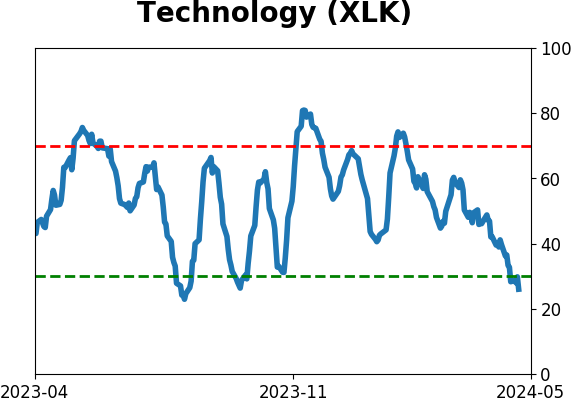
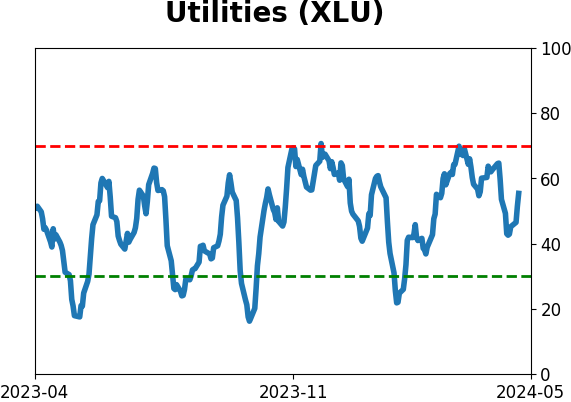
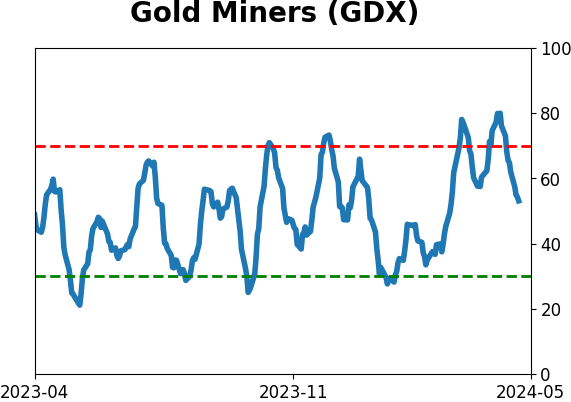
Sector ETF's - 10-Day Moving Average
|
|
|
Country ETF's - 10-Day Moving Average
|
|
|
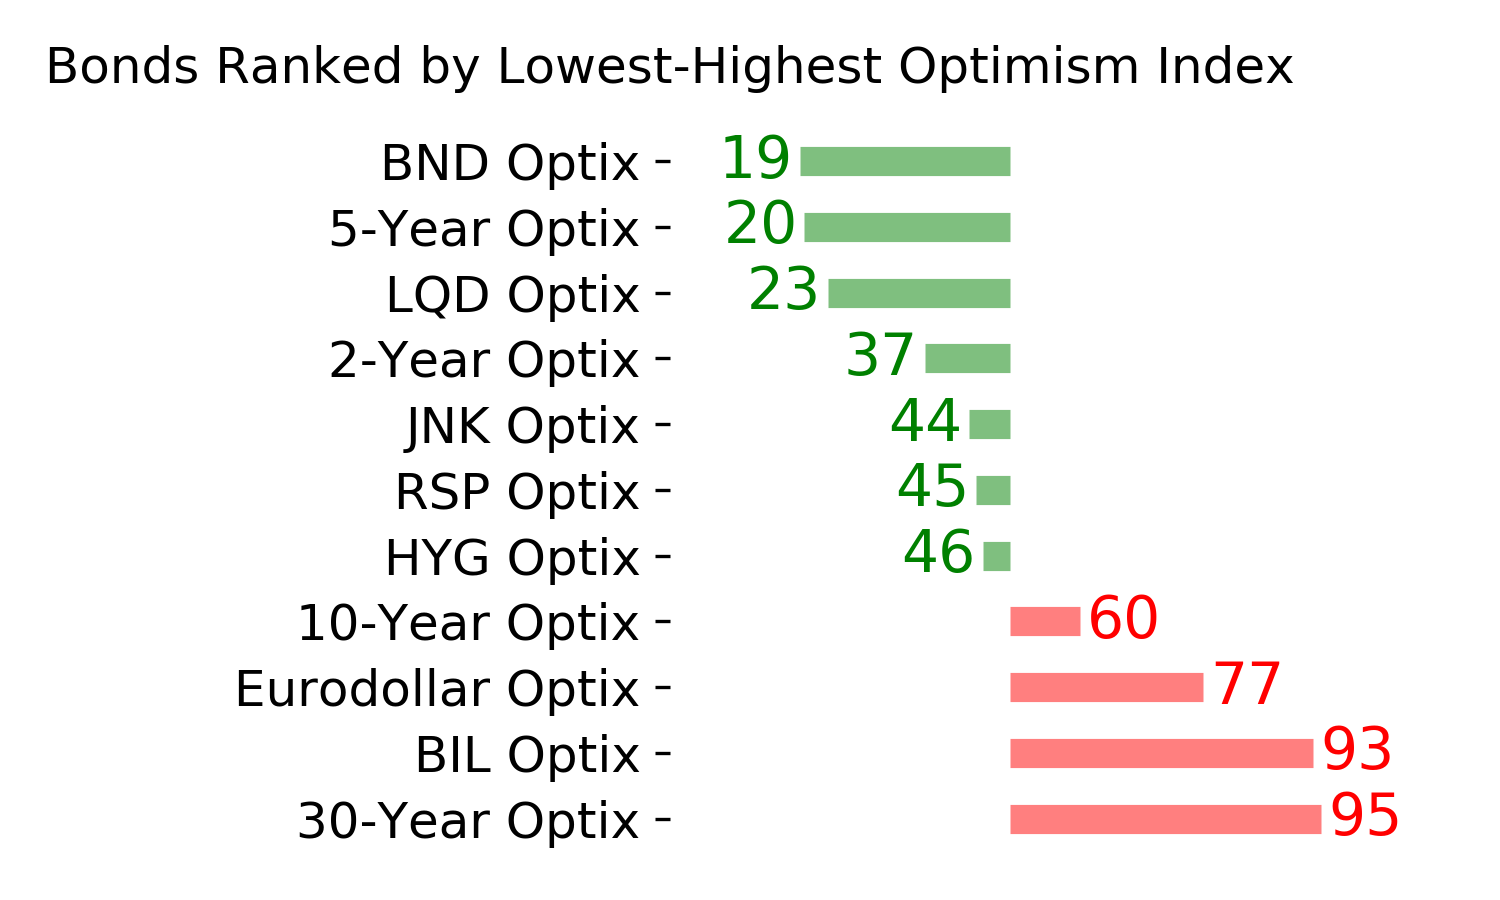
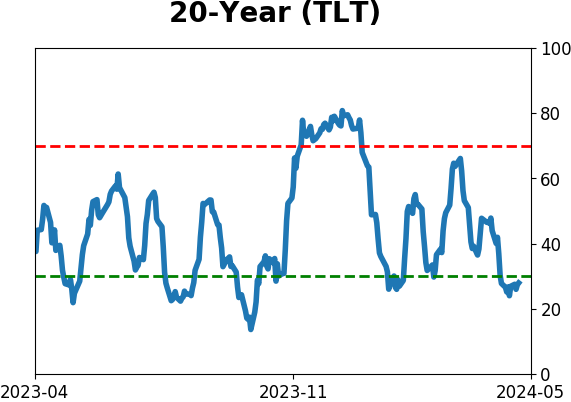
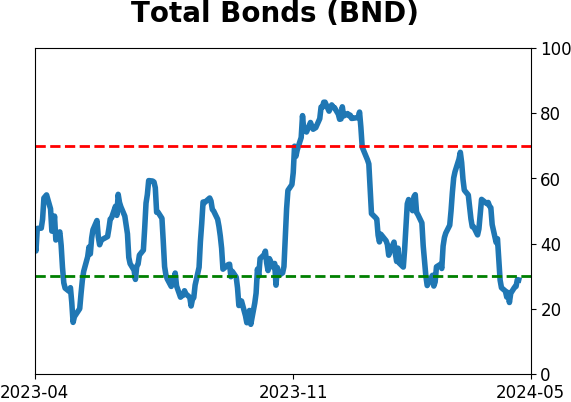
Bond ETF's - 10-Day Moving Average
|
|
|
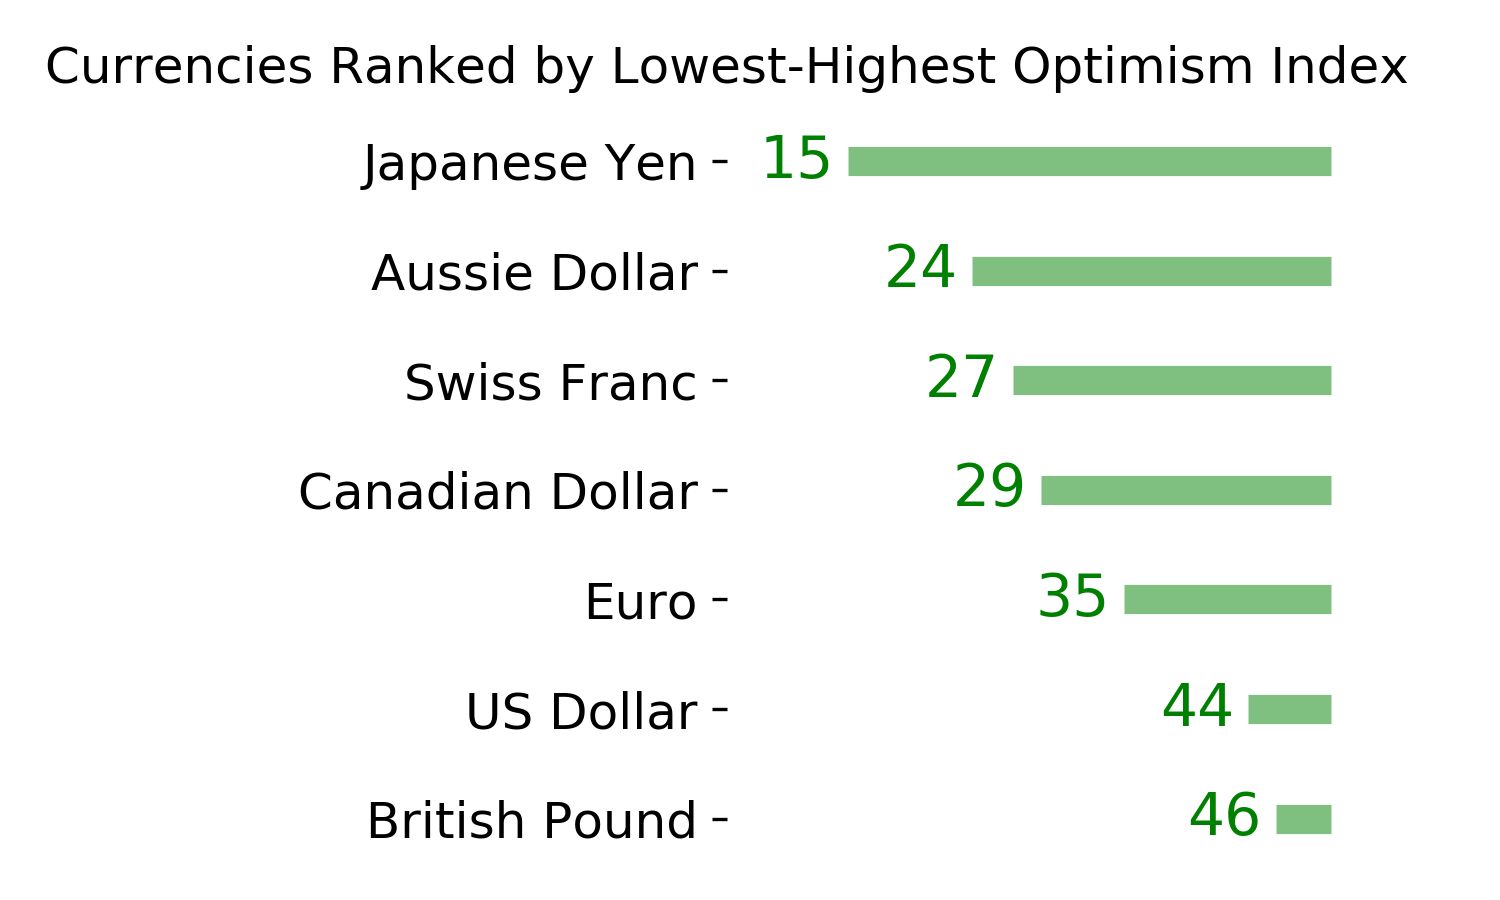
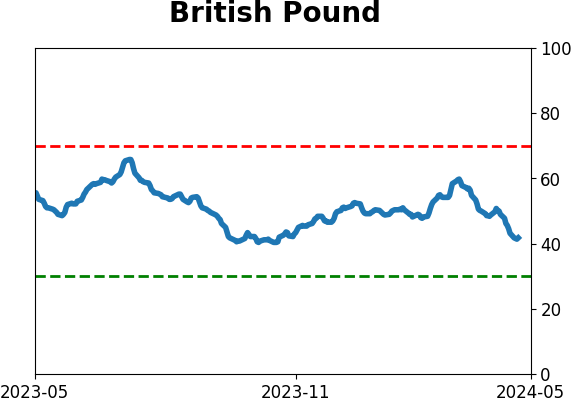
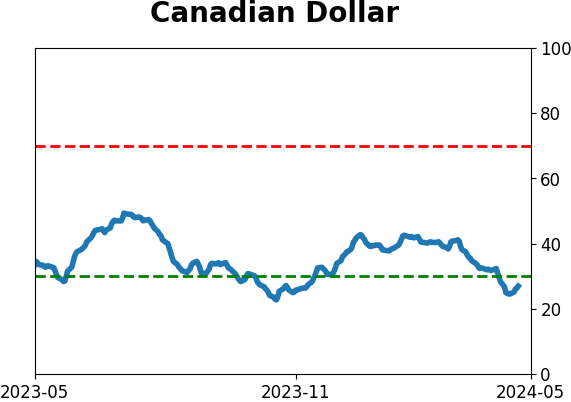
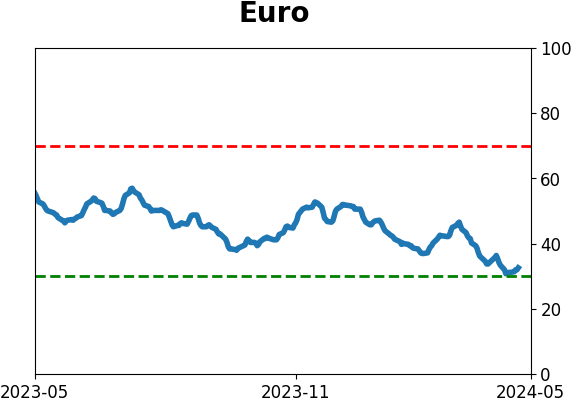
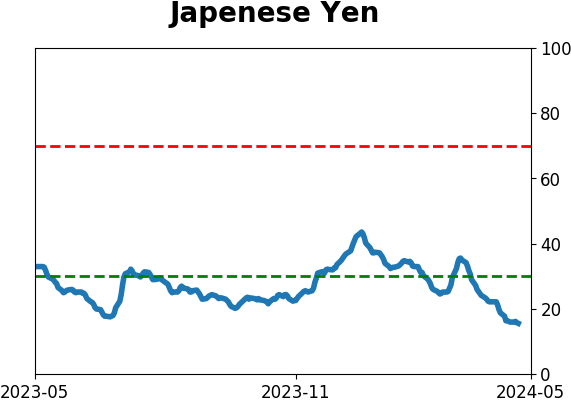
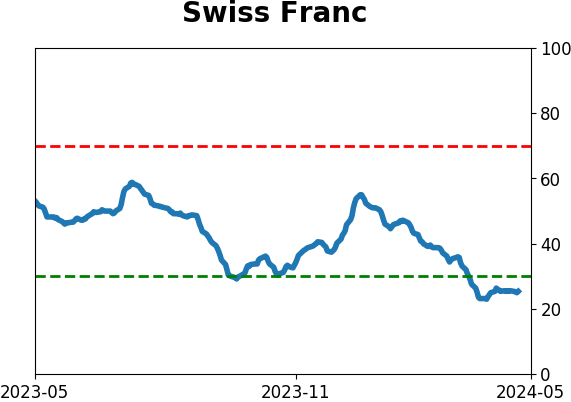
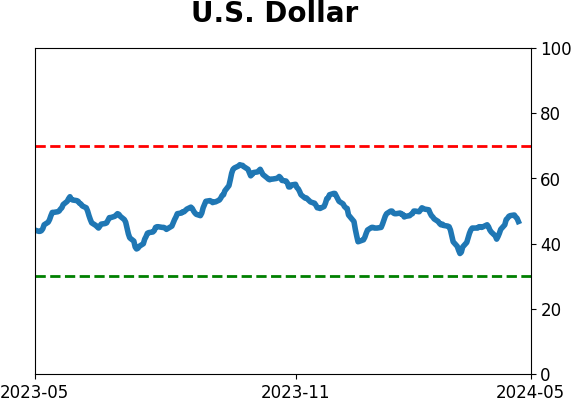
Currency ETF's - 5-Day Moving Average
|
|
|
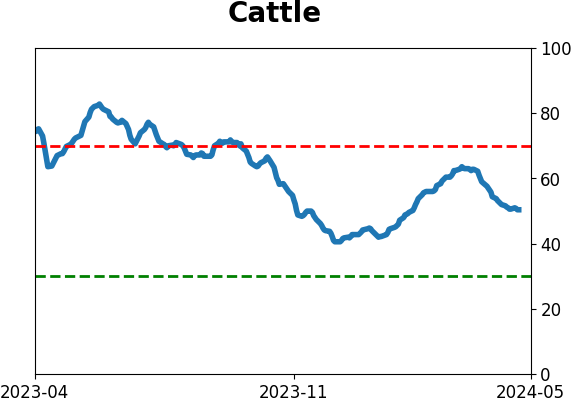
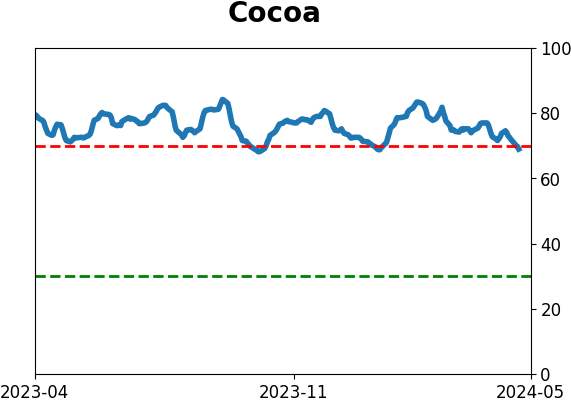
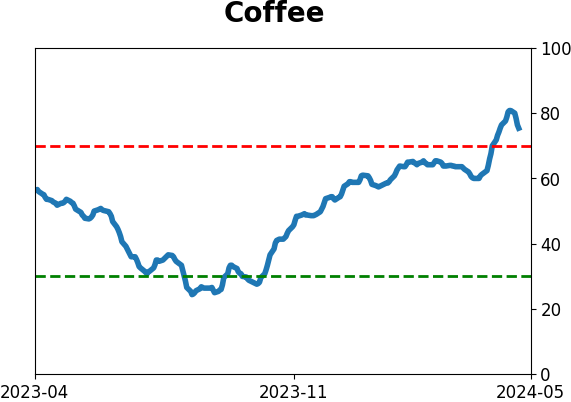
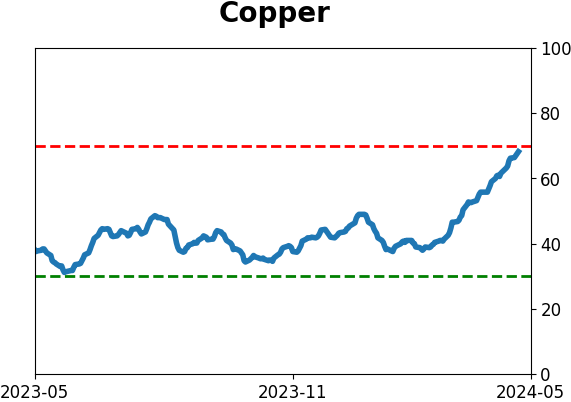
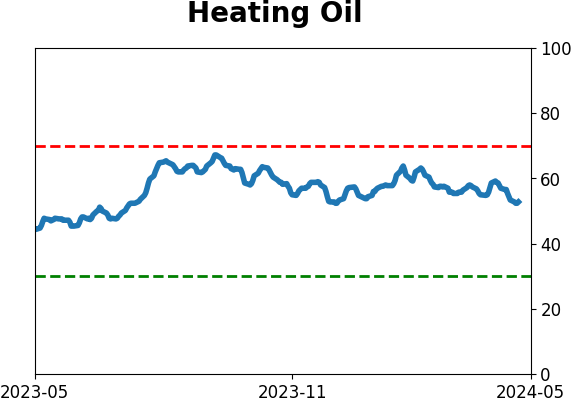
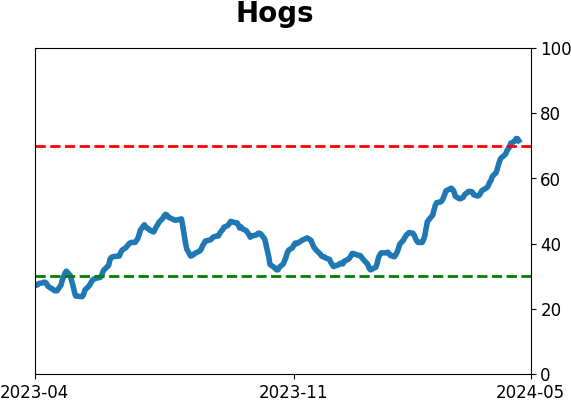
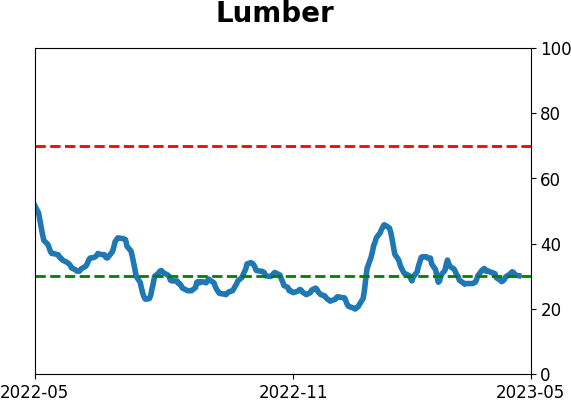
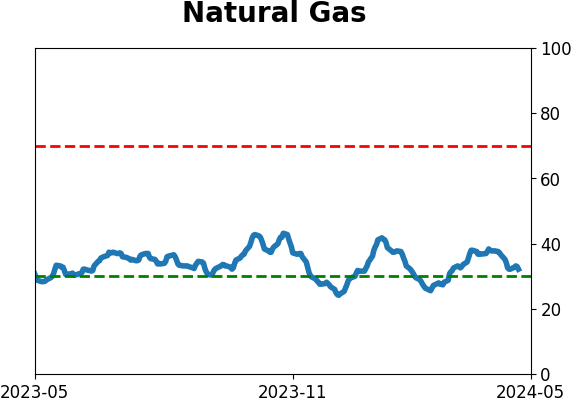
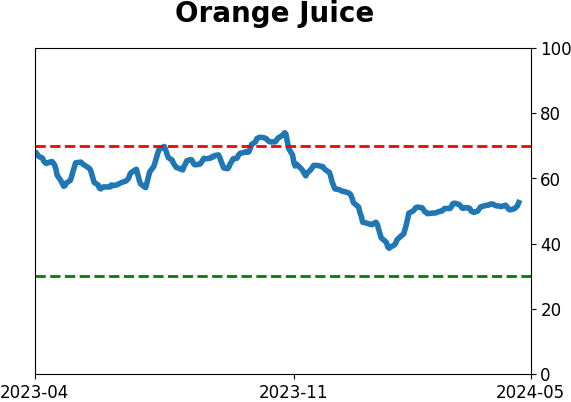
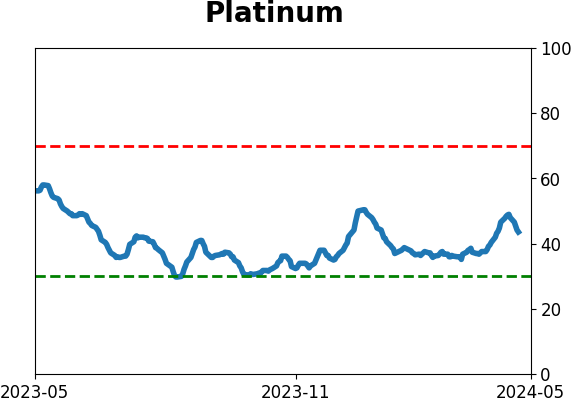
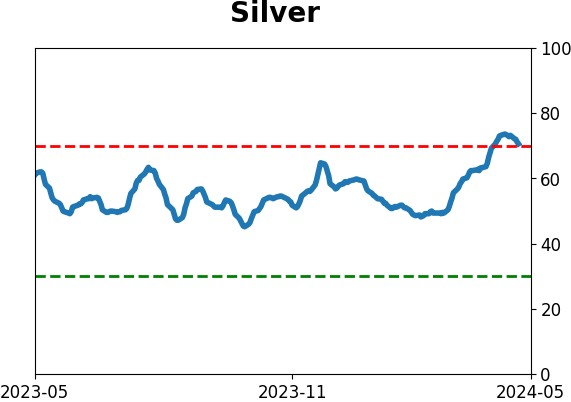
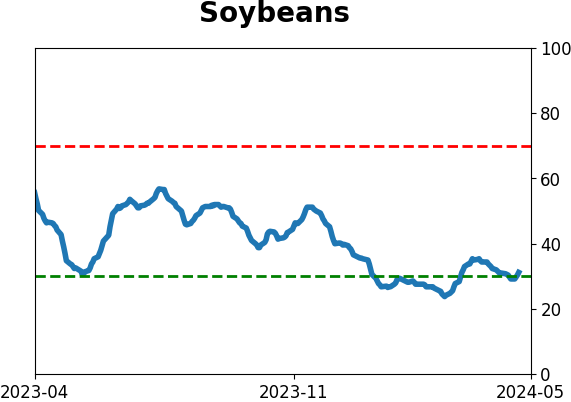
Commodity ETF's - 5-Day Moving Average
|
|