Headlines
|
|
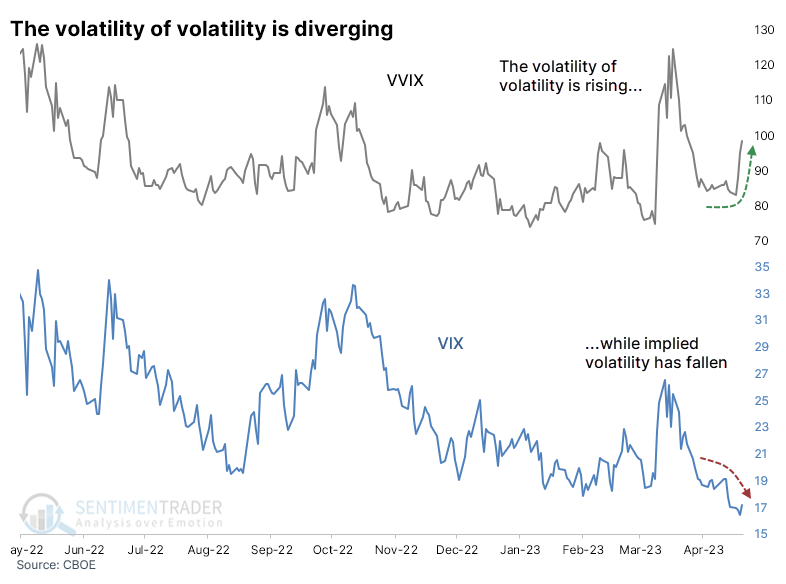
Volatility is low, but the volatility of volatility is jumping:
In recent weeks, traders have been pricing in more movement in the VIX, so the "volatility of volatility" has spiked. But the VIX "fear gauge" itself has dripped lower. Similar divergences preceded some declines in stocks, but more notably, it preceded a strong tendency for the VIX to rise.
|
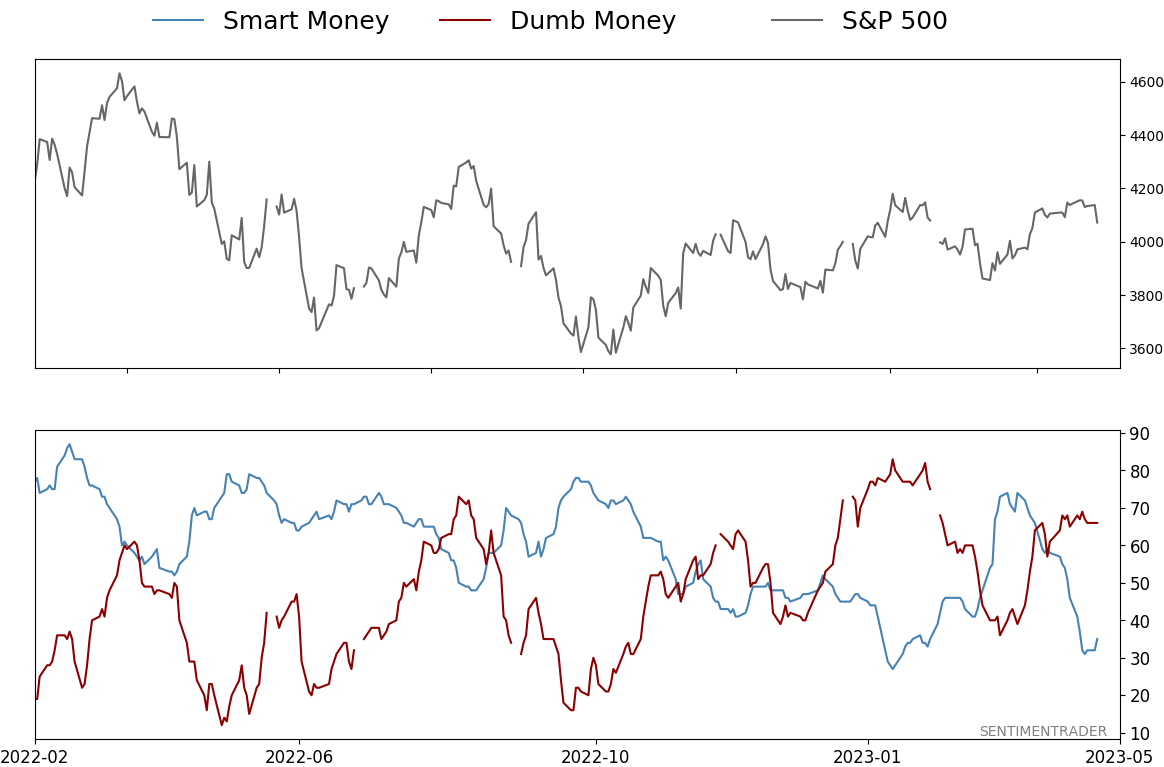
Smart / Dumb Money Confidence
|
Smart Money Confidence: 35%
Dumb Money Confidence: 66%
|
|
Risk Levels
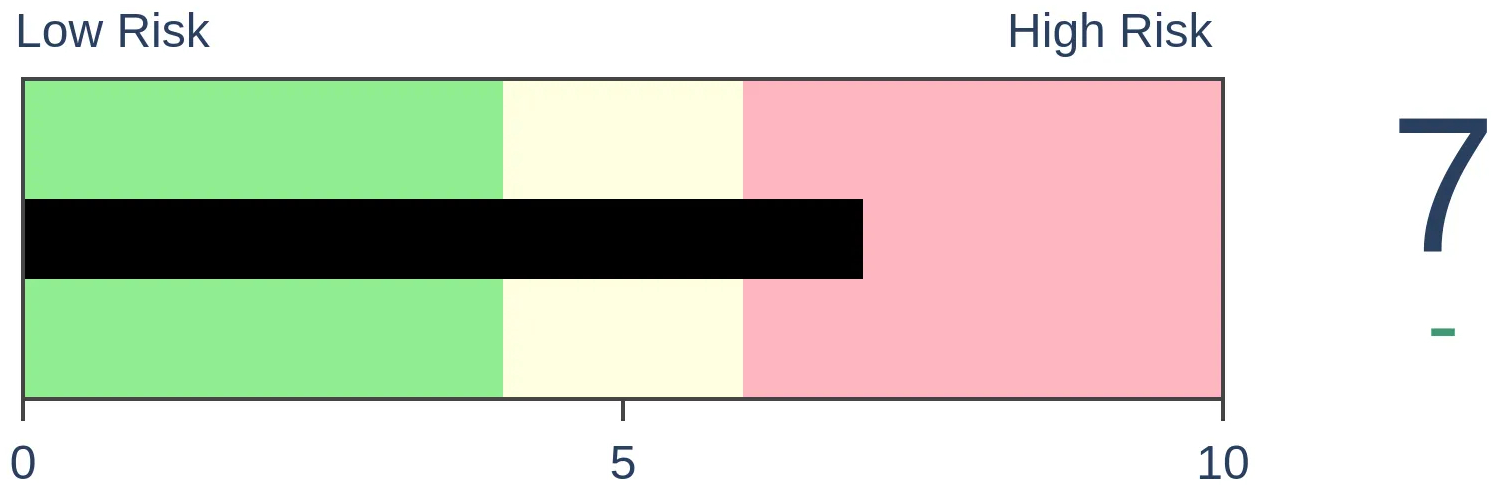
Stocks Short-Term
|
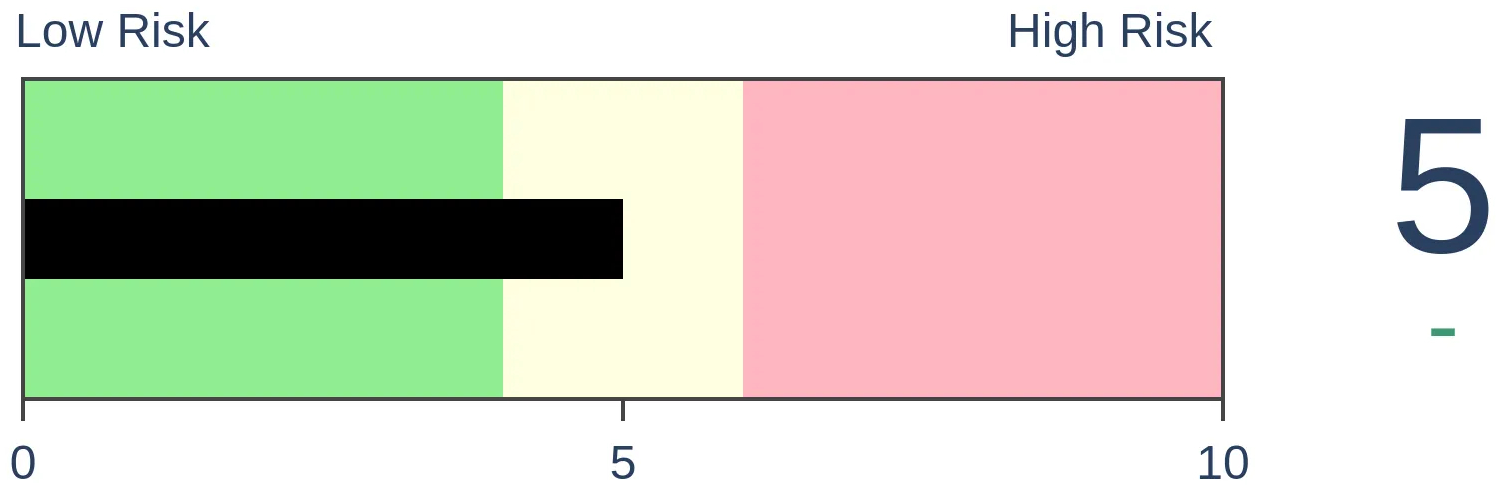
Stocks Medium-Term
|
|
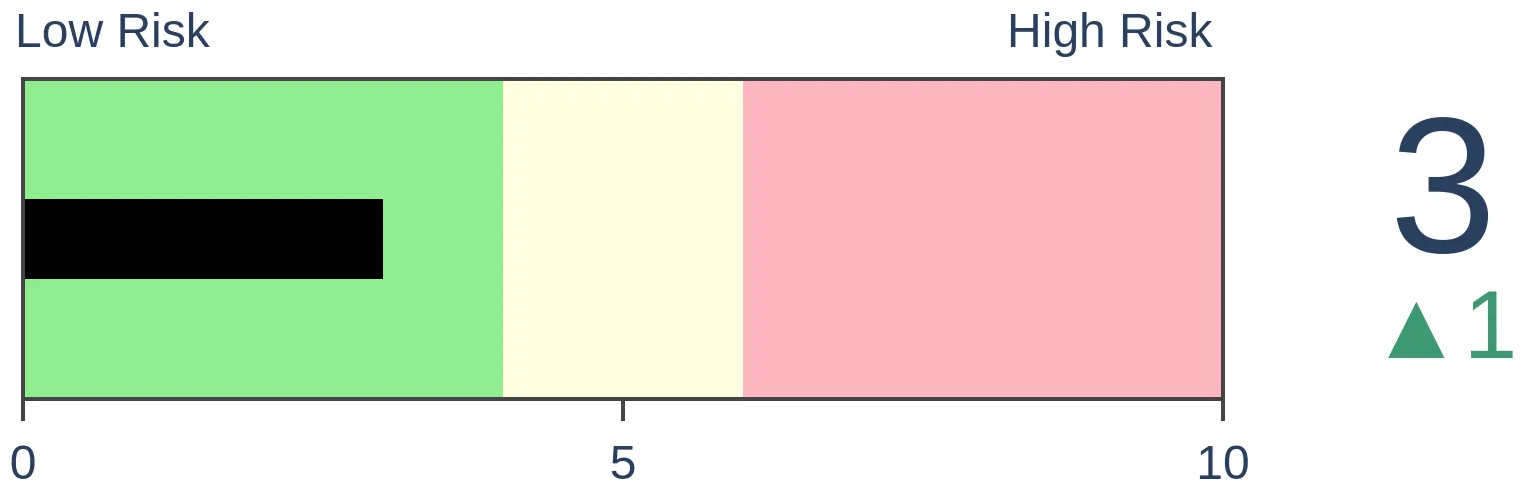
Bonds
|
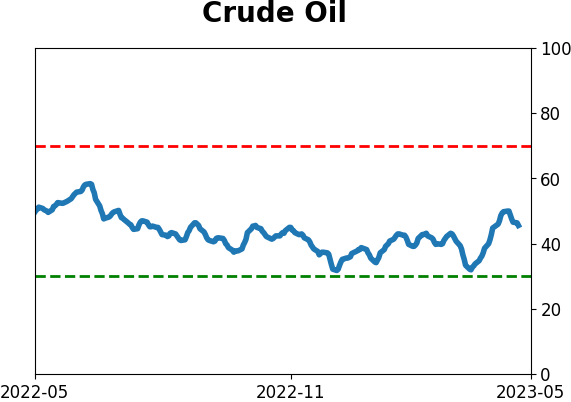
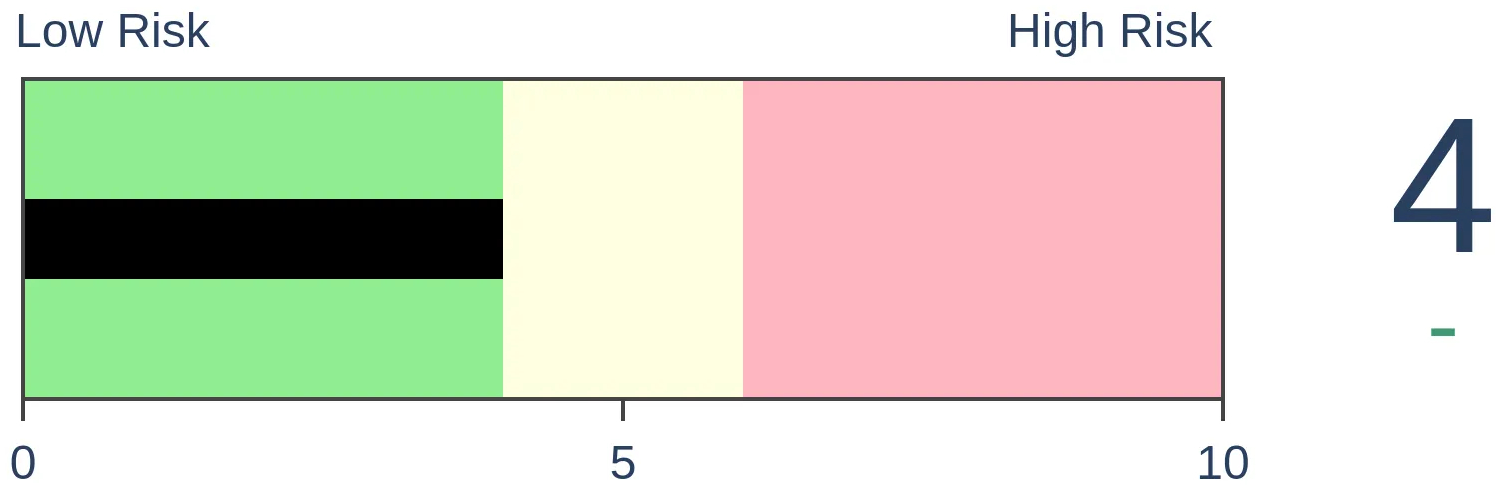
Crude Oil
|
|
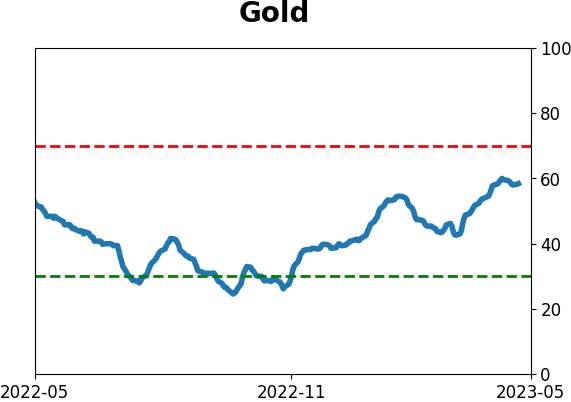
Gold
|
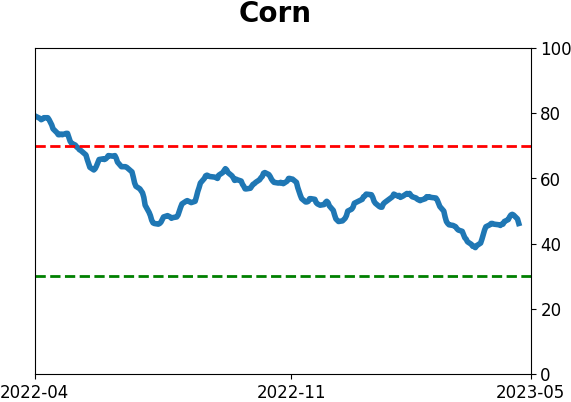
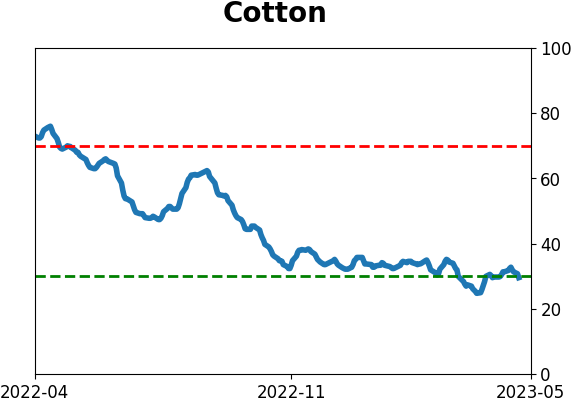
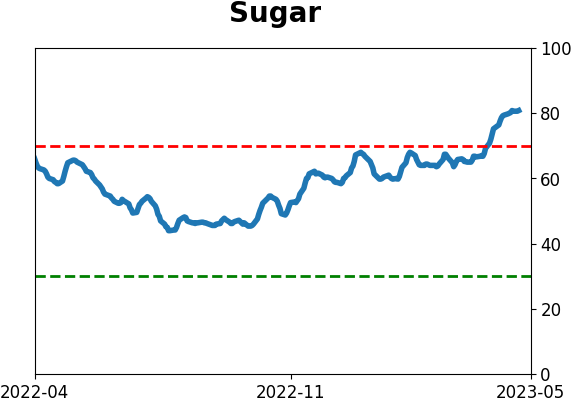
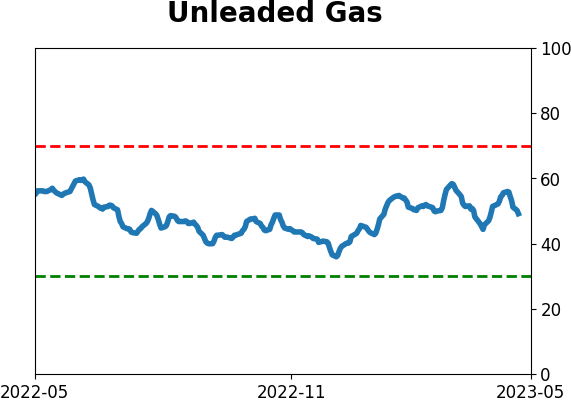
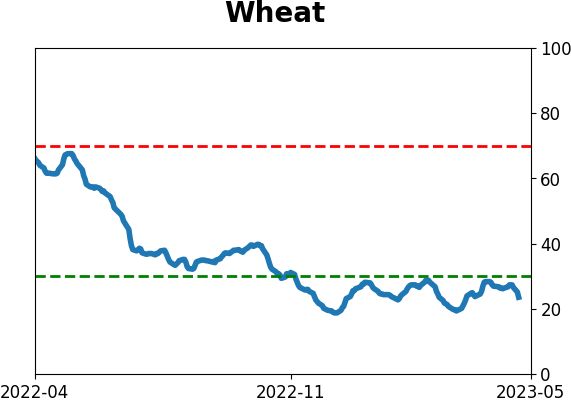
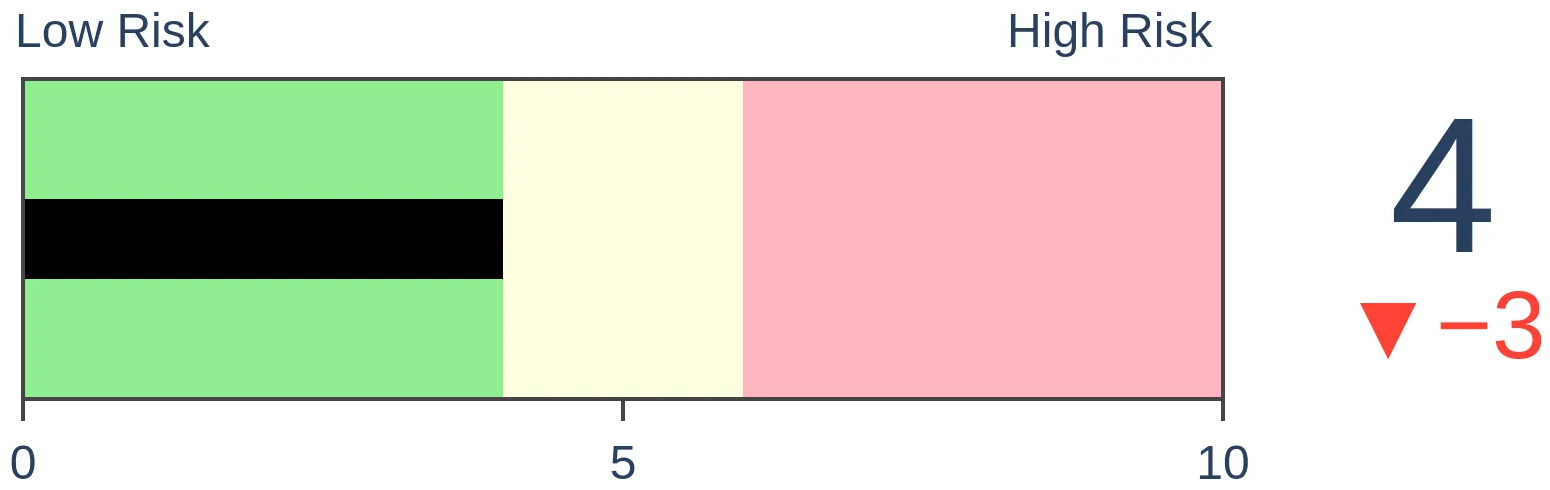
Agriculture

|
|
Research
By Jason Goepfert
BOTTOM LINE
In recent weeks, traders have been pricing in more movement in the VIX, so the "volatility of volatility" has spiked. But the VIX "fear gauge" itself has dripped lower. Similar divergences preceded some declines in stocks, but more notably, it preceded a strong tendency for the VIX to rise.
FORECAST / TIMEFRAME
None
|
Key points:
- Expectations for more swings in volatility recently hit a 3-week high, while volatility itself has compressed
- This has set up a historically wide divergence between the two measures
- After similar behavior, stocks showed a modest negative bias, while the VIX strongly tended to rise
Traders are pricing in more volatility...for volatility
Among the many worries assailing investors in recent weeks is the idea that volatility is too low and investors are complacent. We saw last week why that might be a legitimate short-term concern. It's harder to justify after that.
Okay, the VIX might not be too low, but now the worry is that volatility itself is too volatile. The "fear gauge" has been dropping, but traders are pricing in larger moves in the coming weeks. An index called the VVIX tracks this phenomenon, and it has been jumping to multi-week highs even while the VIX itself crumbles.
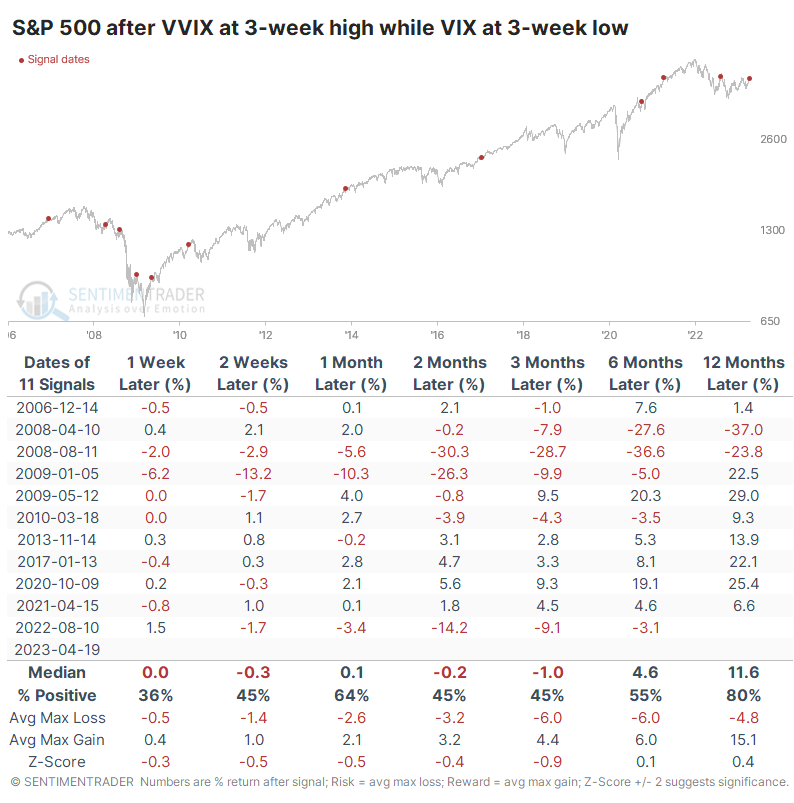
As always, we find it instructive to look at historical behavior to see if we can use evidence to support the concern. And, again, in the short term, it has been a modest worry. The table below shows the S&P 500's forward returns after any date when the VVIX reached a 3-week high while the VIX closed at a 3-week low.
After these signals, the S&P's returns were pretty poor up to three months later. That's almost entirely due to a couple of signals in 2008, though, and the latest one from last August.
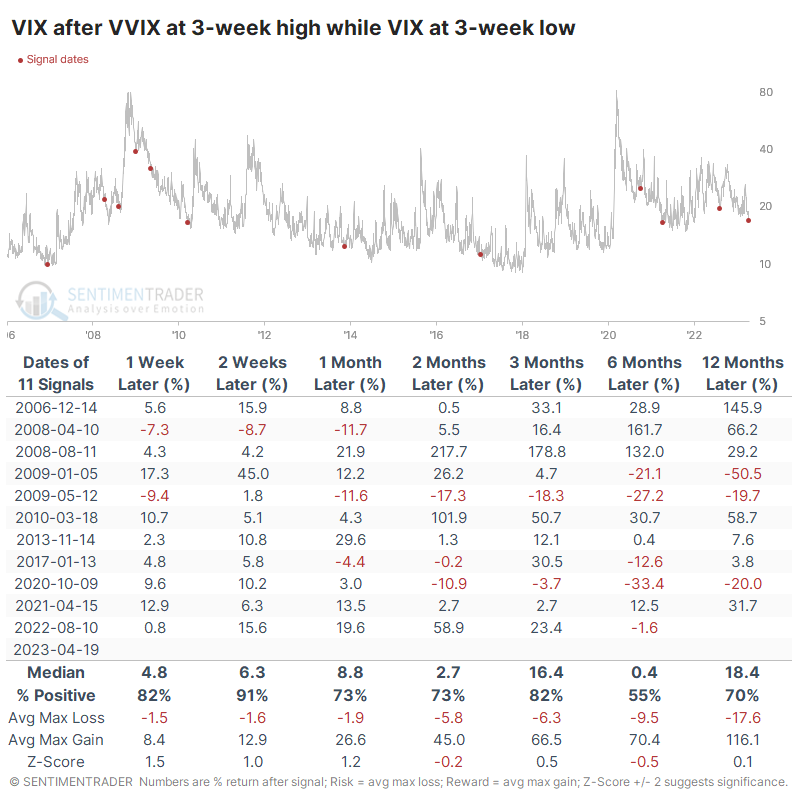
For the VIX itself, these were decent buy signals. Over the next couple of weeks, the VIX rose after 10 out of 11 signals, and the lone loss was reversed in the weeks ahead. Unfortunately, it's next to impossible to trade the VIX. The ETF proxies designed to track it are some of the worst creations ever to be listed, and most traders have no interest in constructing complicated options positions to try to mimic it.
Alternatives weren't much of an alternative
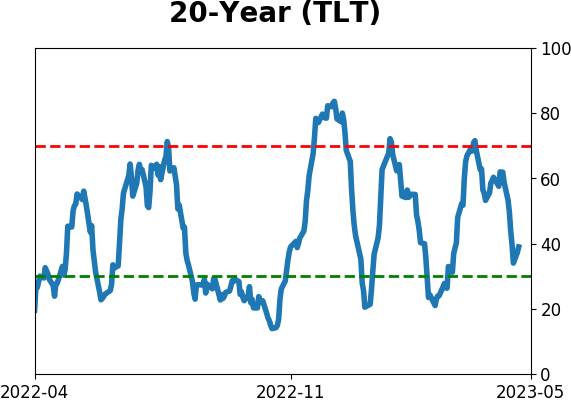
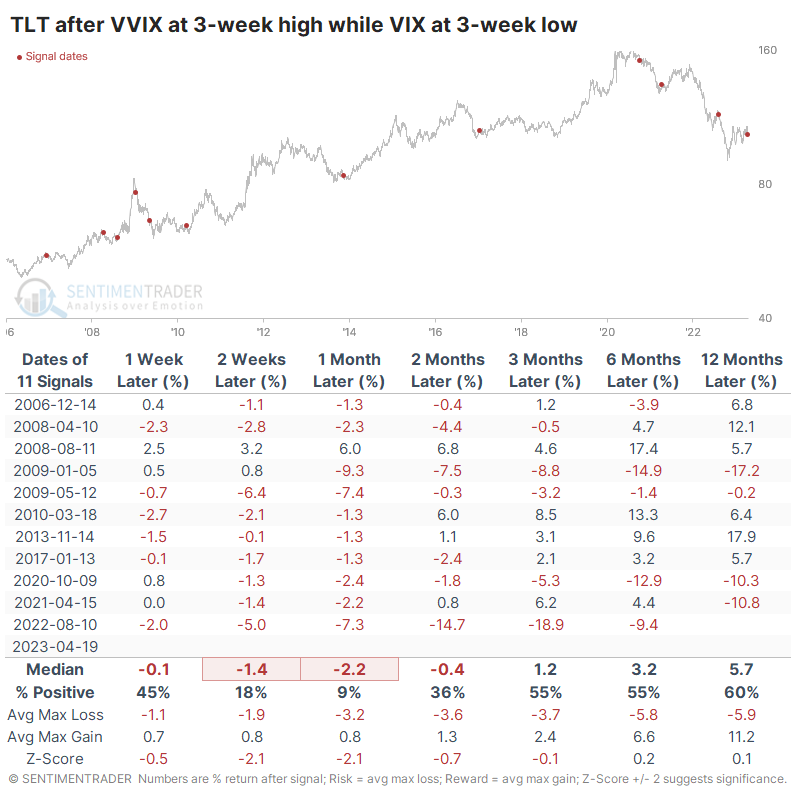
Some gravitate to safe havens, like bonds or gold, as an alternative to the VIX. Well, those haven't been great outlets, either. The table below shows that a fund like TLT, which tracks Treasury notes, has been an even worse holding than the S&P after these signals. Over the next month, only a single signal showed a positive return.
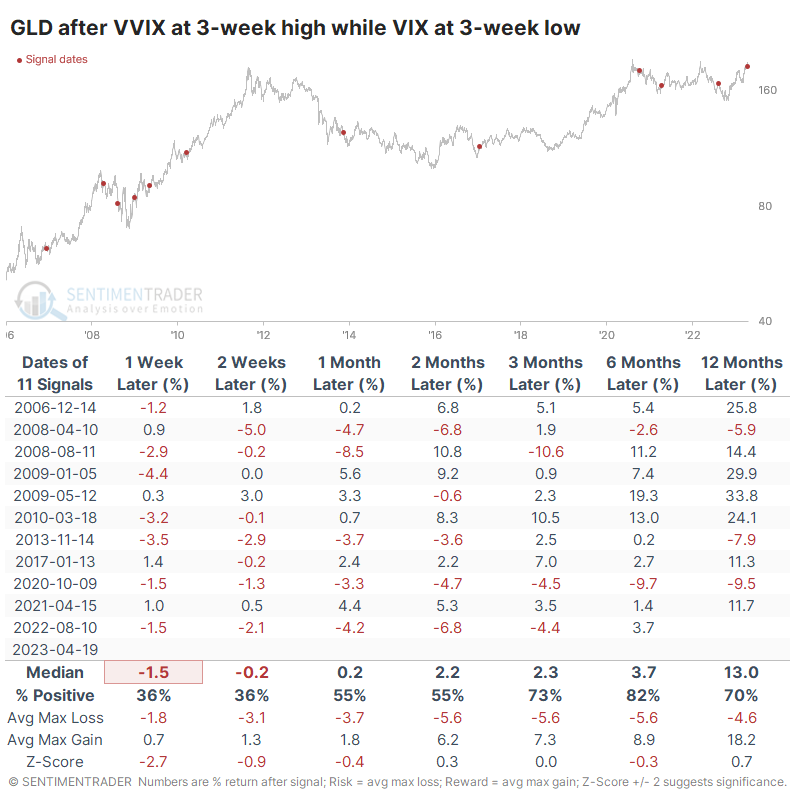
Gold has been a better alternative, but not in the short term. Over the next few months, gold gained after 8 of the 11 signals, but the three losses were fairly significant, including the last one.
What the research tells us...
We don't like to focus on situations where there isn't much of a conclusion, or if there is, there isn't much that one can do about it. This is kind of one of those scenarios. There may be a supportable concern that rising expectations of higher volatility, while volatility itself melts, is a worry. Sophisticated volatility traders can be pretty savvy.
But it hasn't preceded consistent enough declines in stocks to suggest it's a sell signal. Volatility has a strong tendency to rise in the weeks after these conditions. Still, it's hard to take advantage of that for the average investor, and readily available alternatives haven't been a viable option. More than anything, this type of behavior in volatility is just a heads-up that we can reasonably expect stocks to gyrate more in the weeks ahead, but that doesn't necessarily justify reducing exposure.
Indicators at Extremes
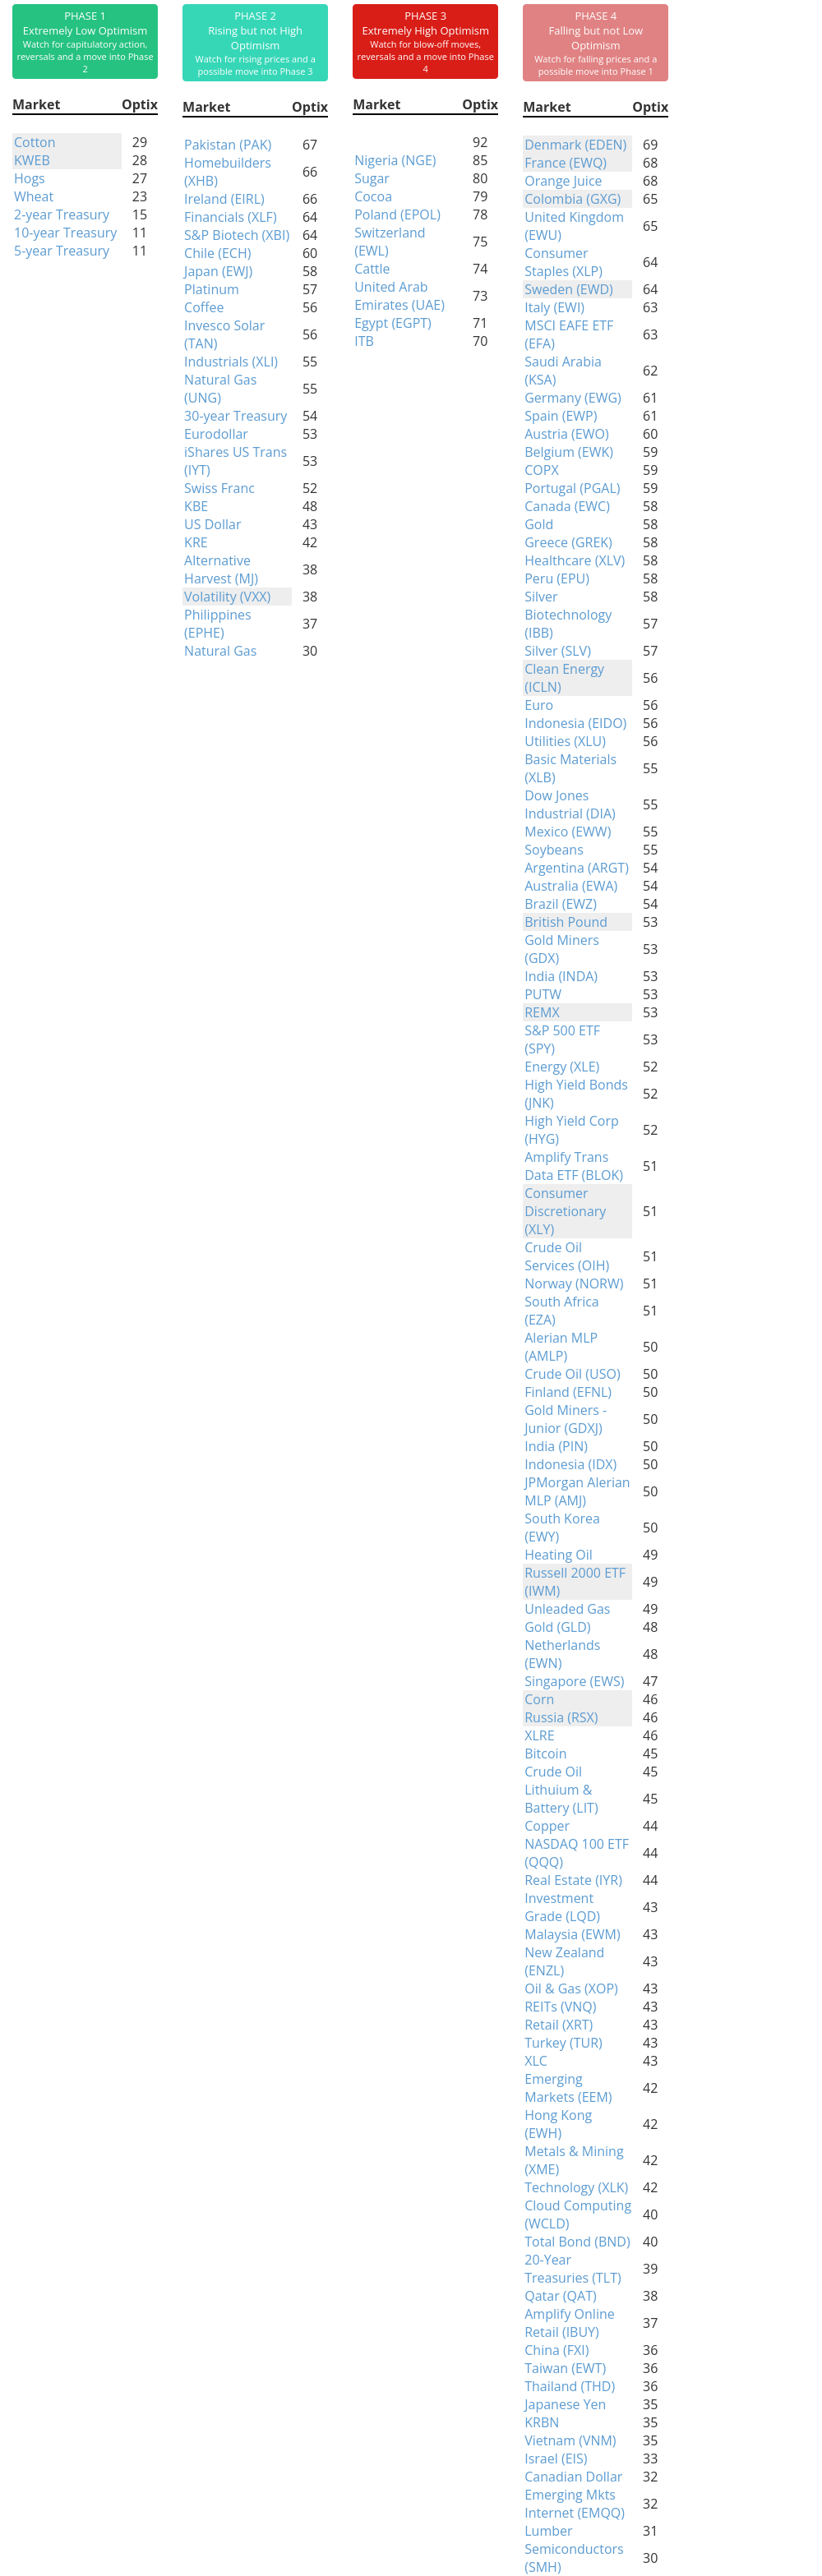
Phase Table
Ranks
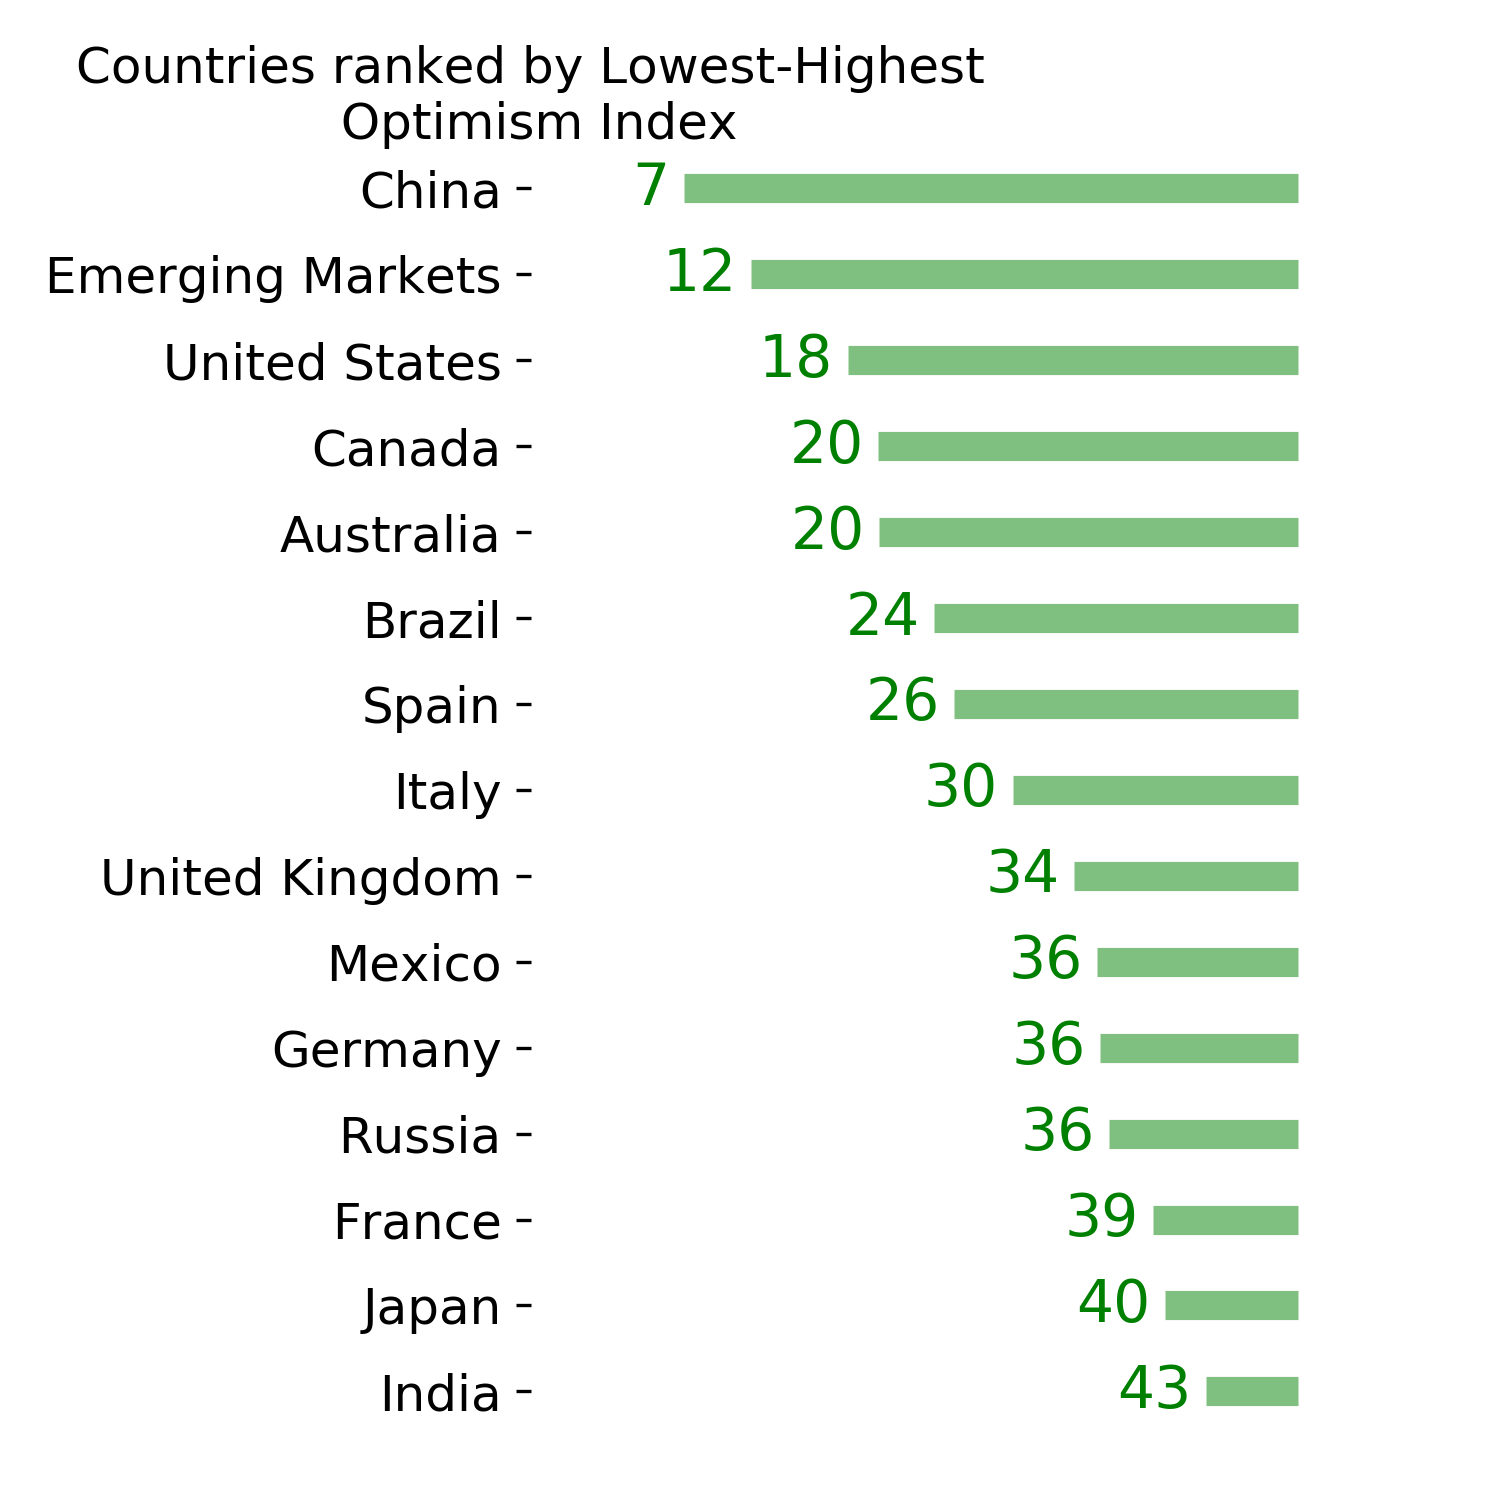
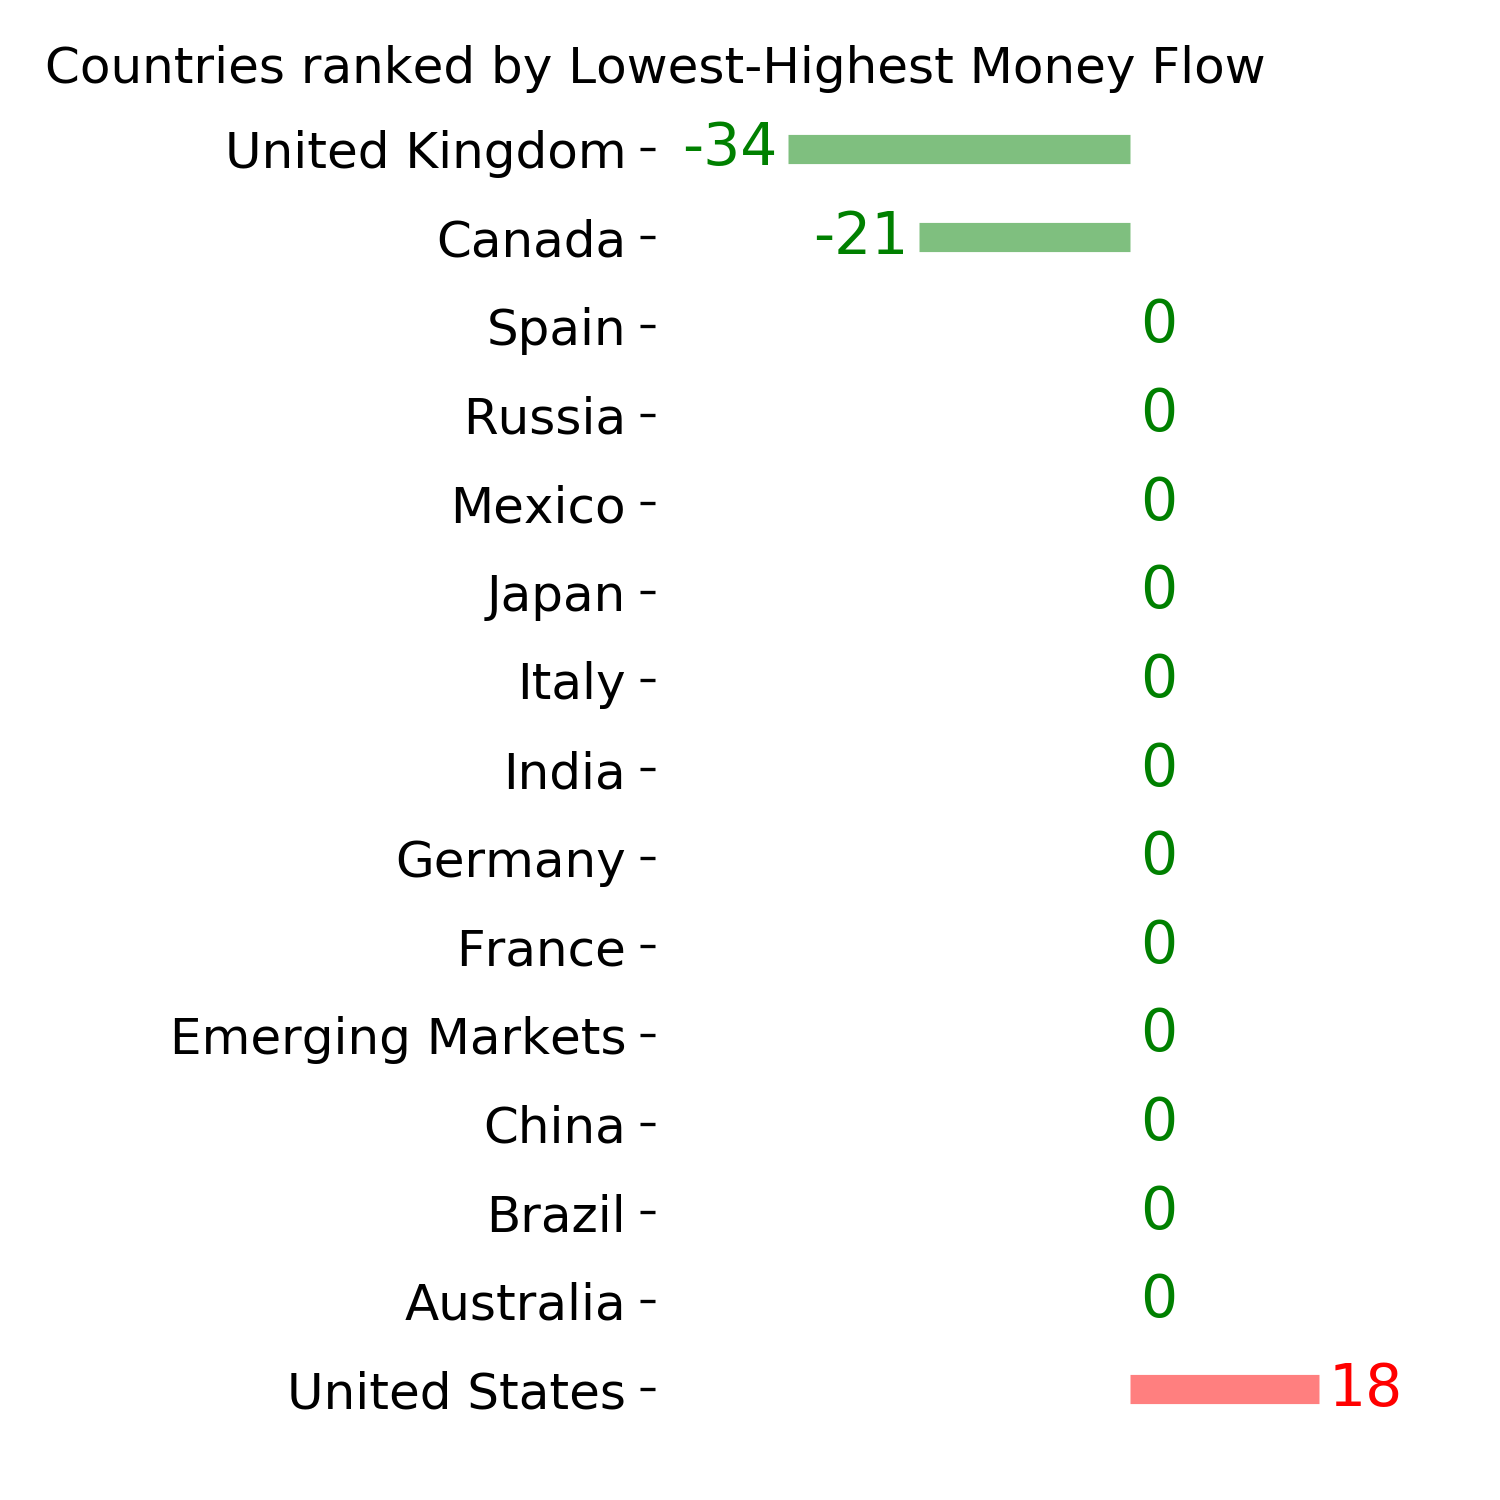
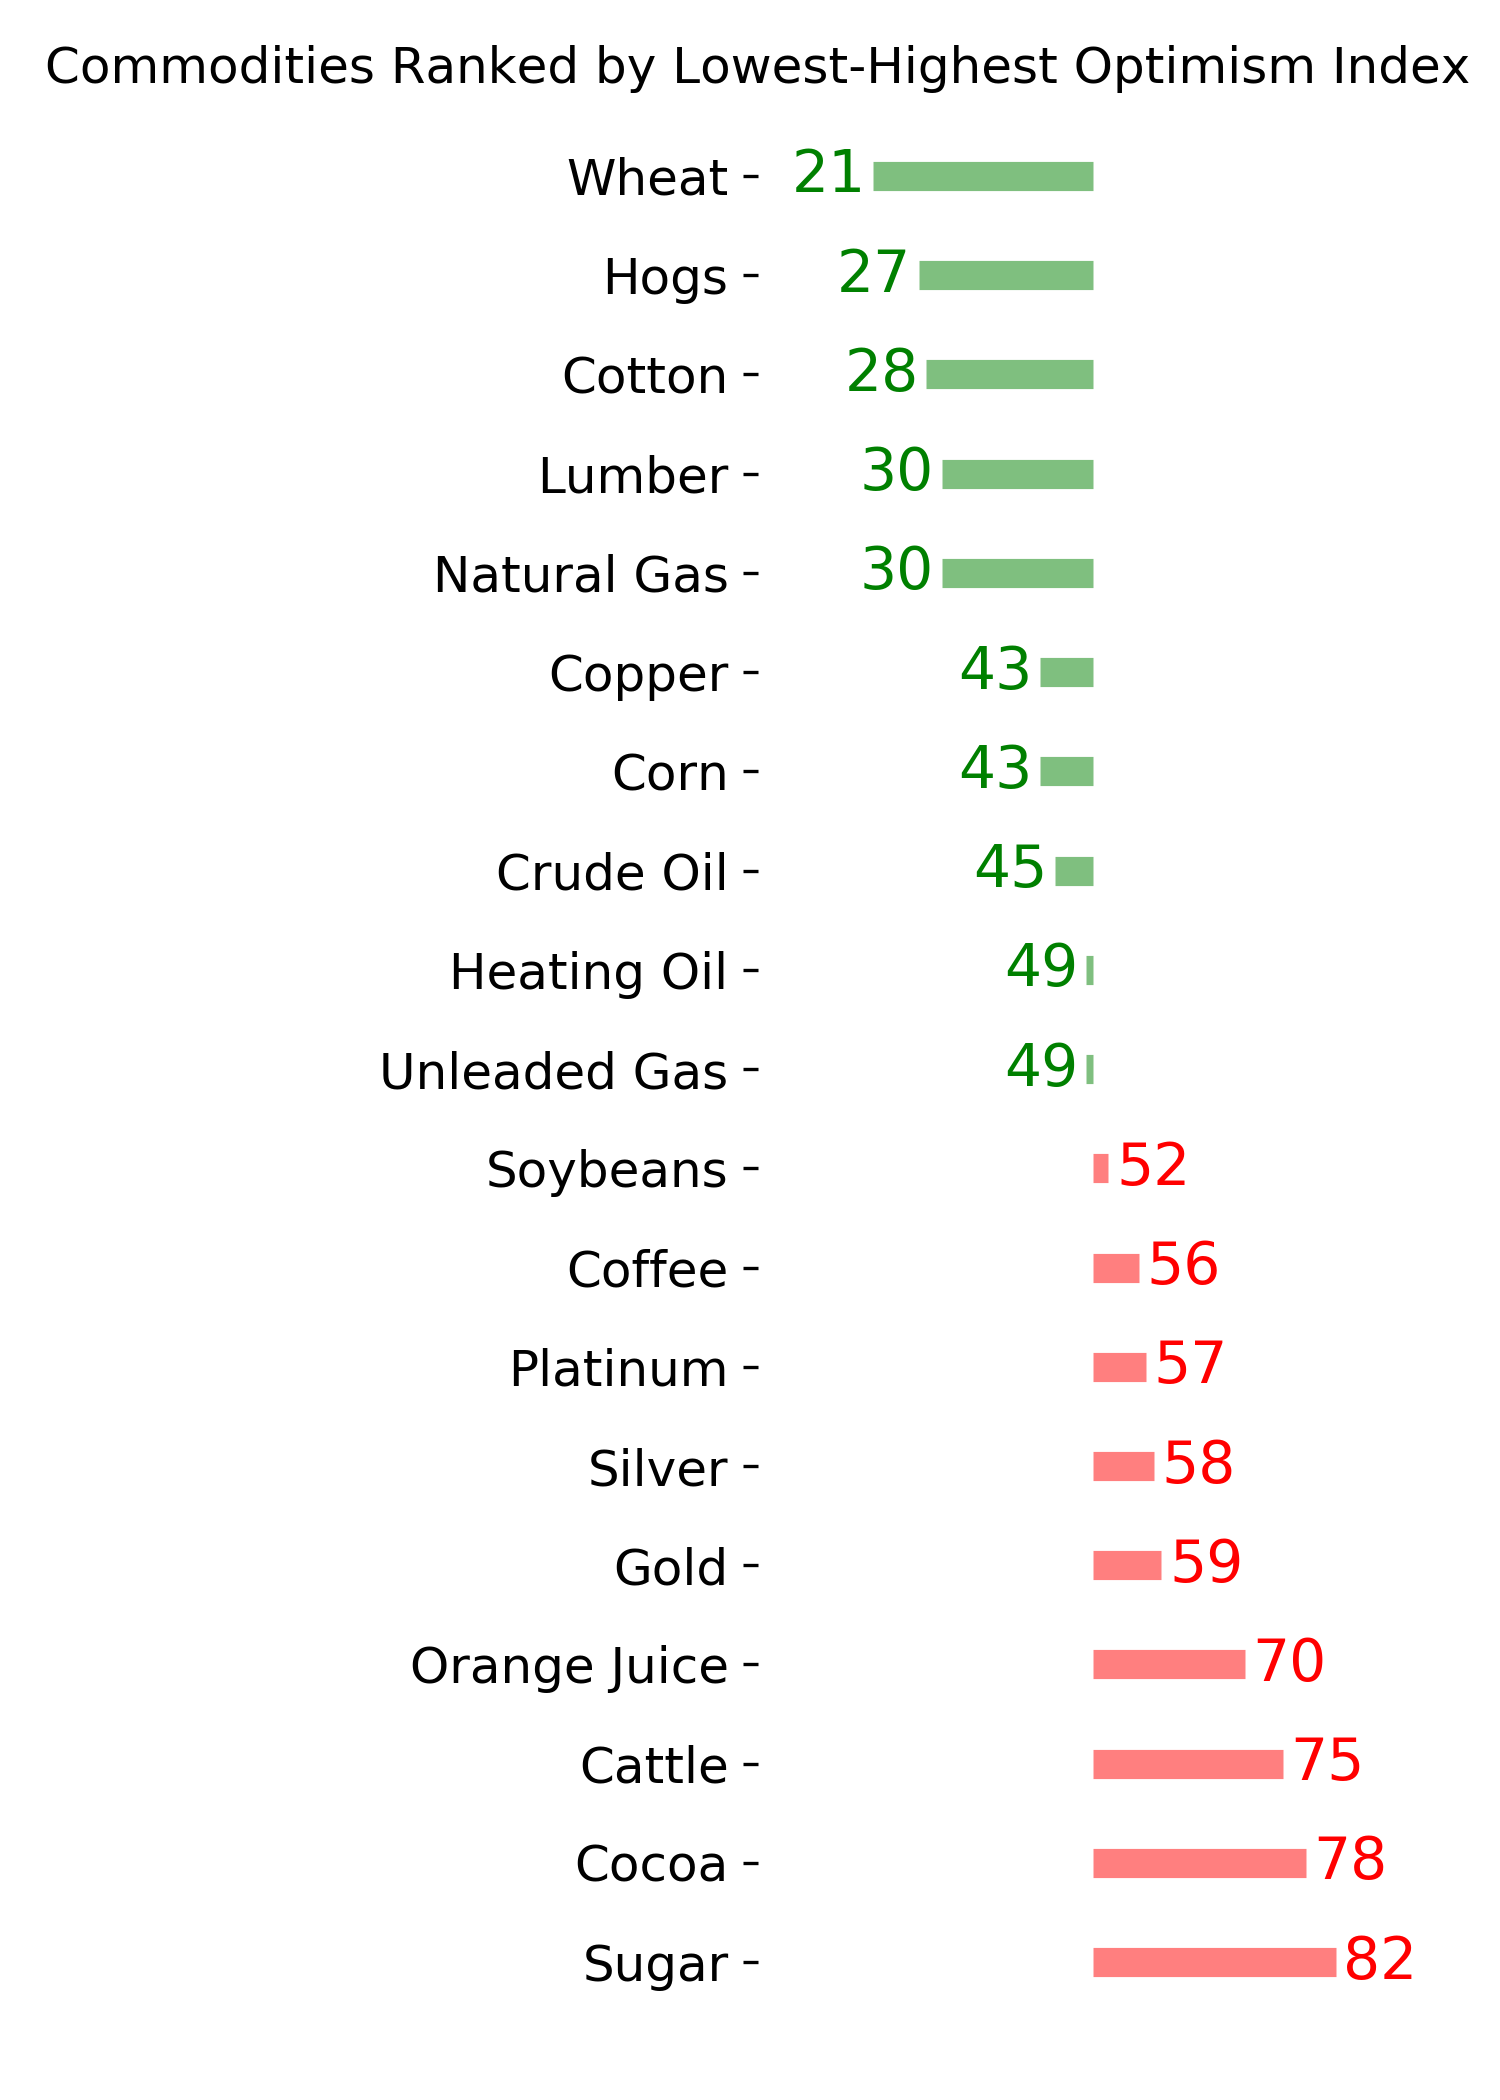
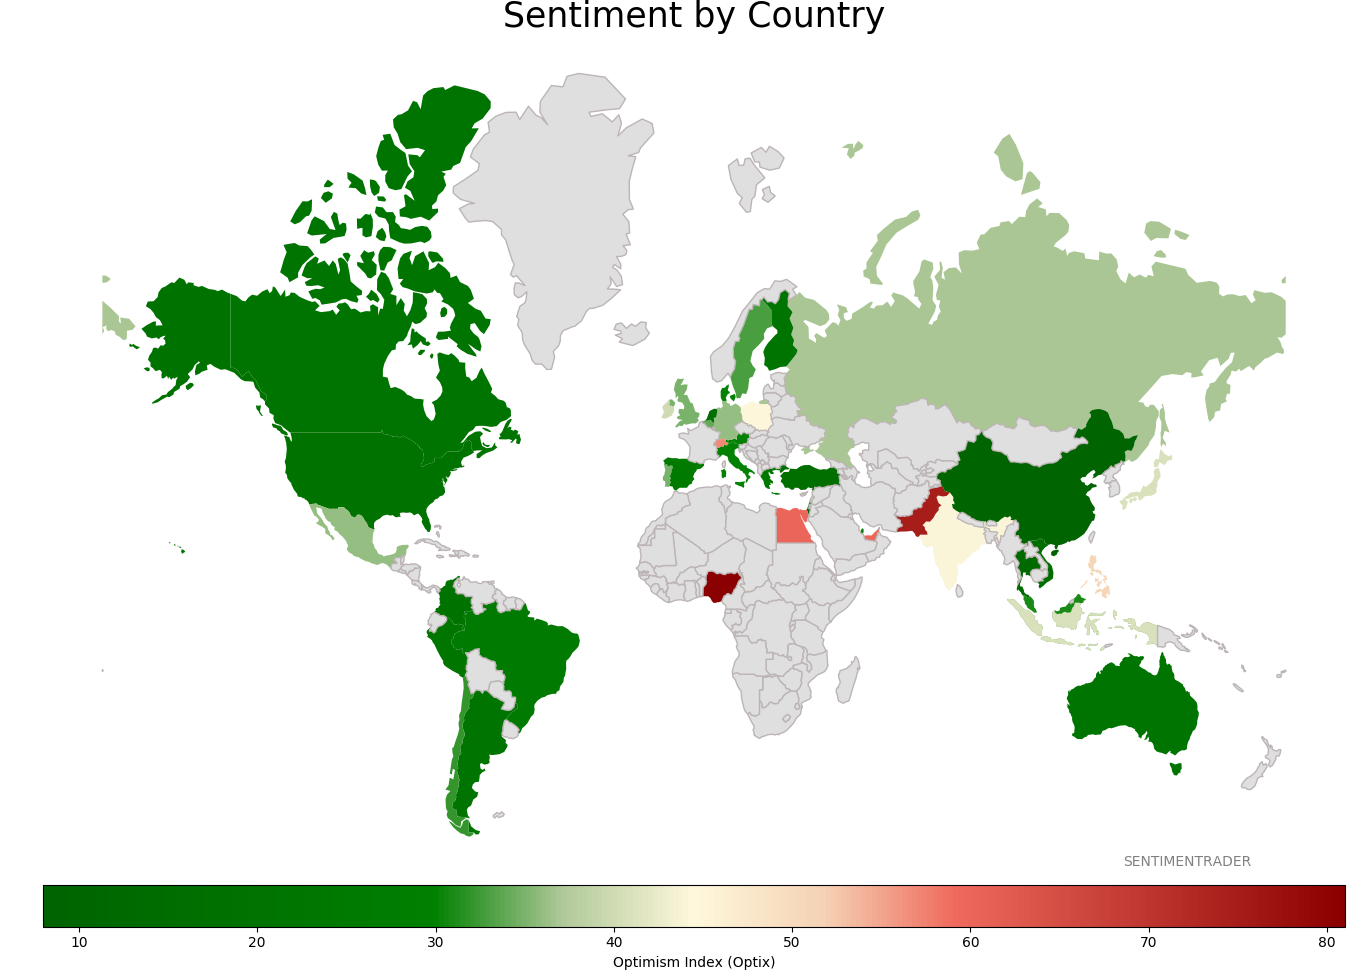
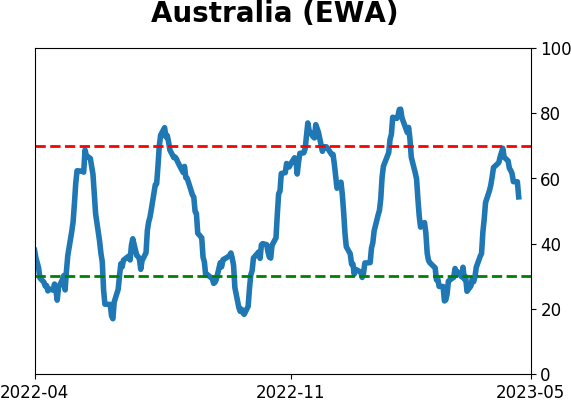
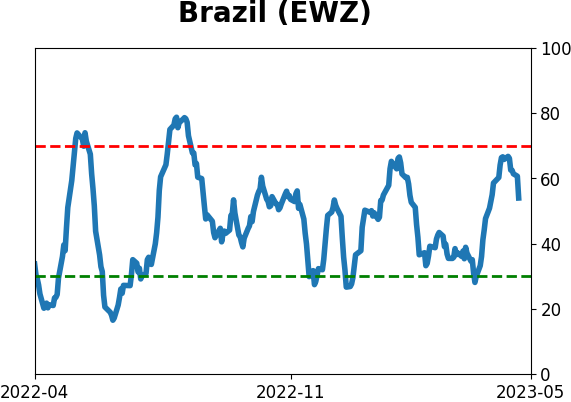
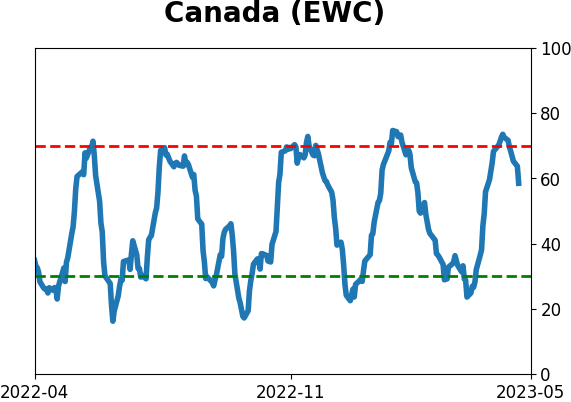
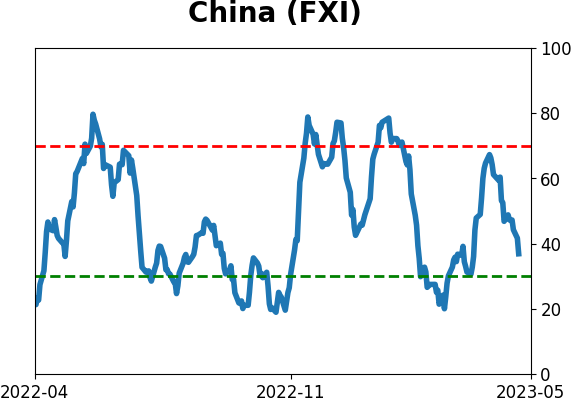
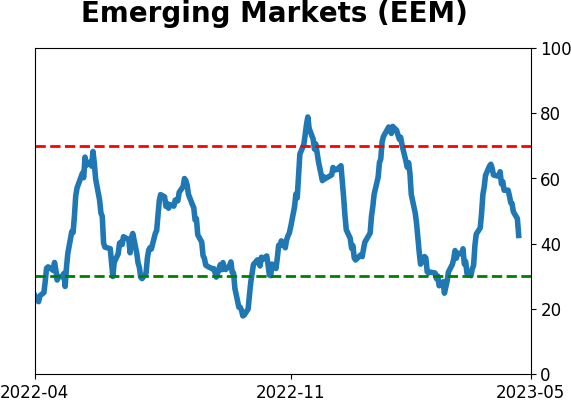
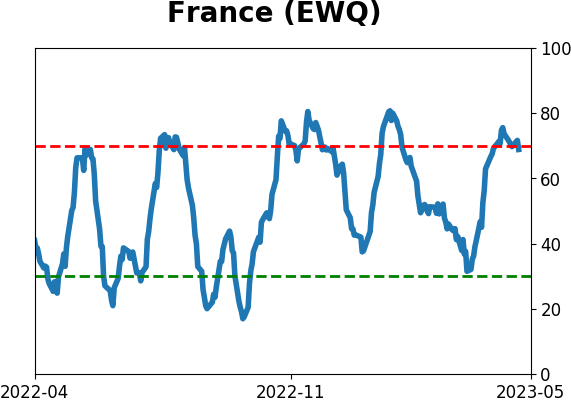
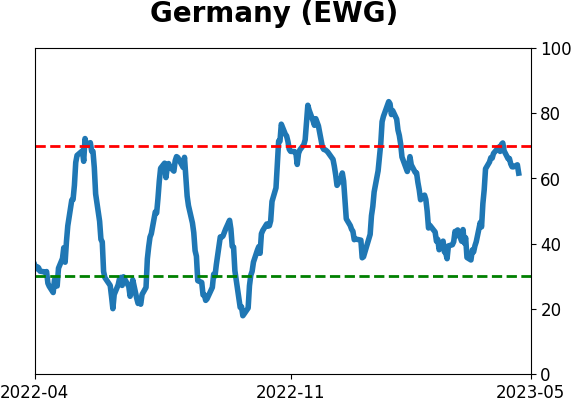
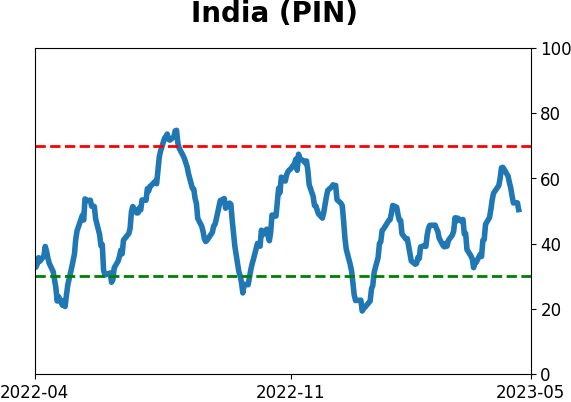
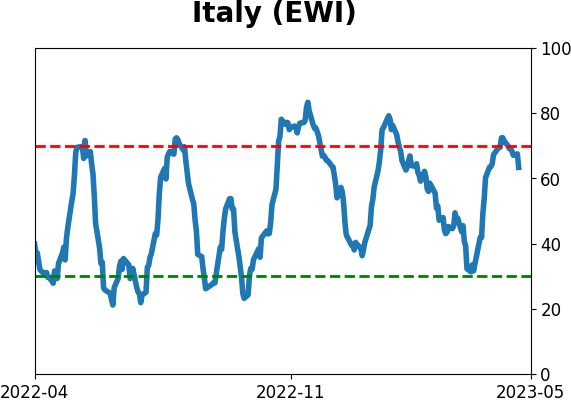
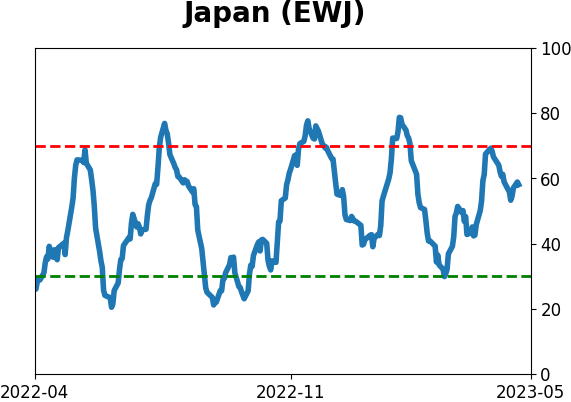
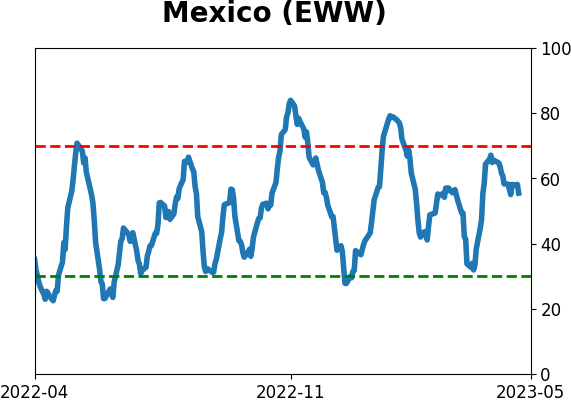
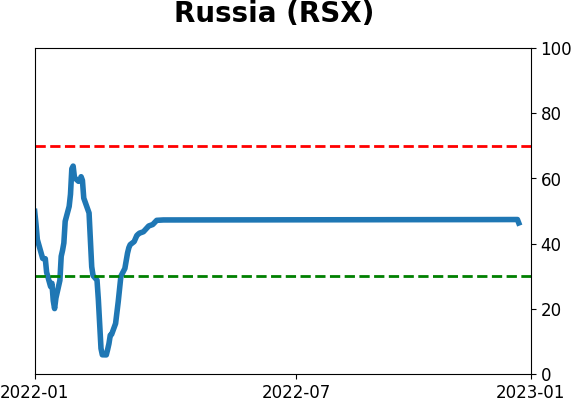
Sentiment Around The World
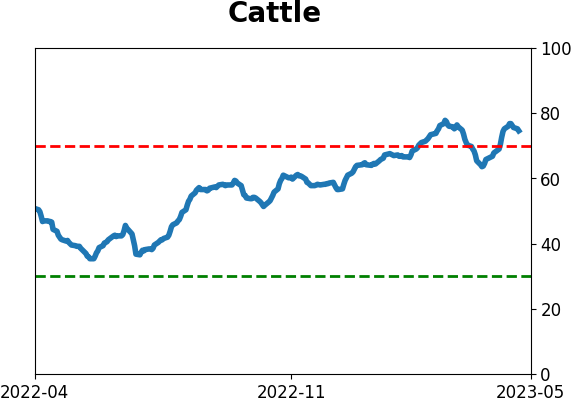
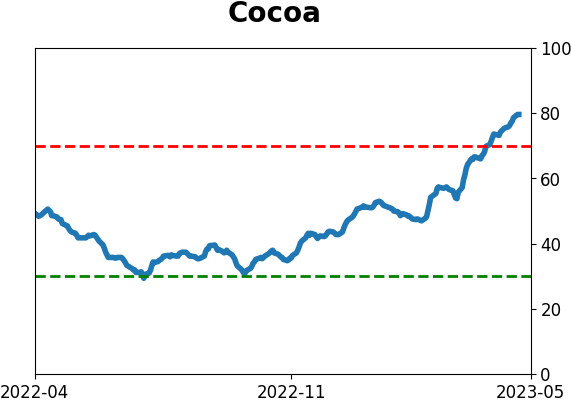
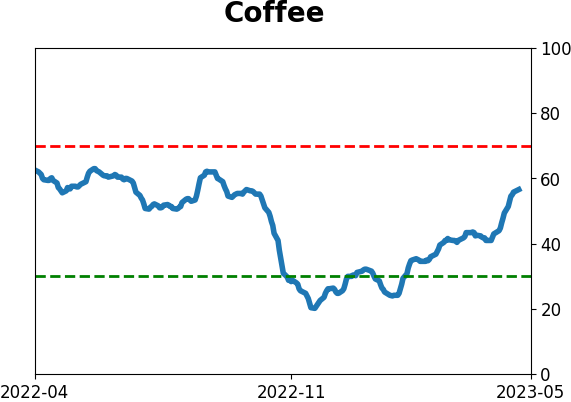
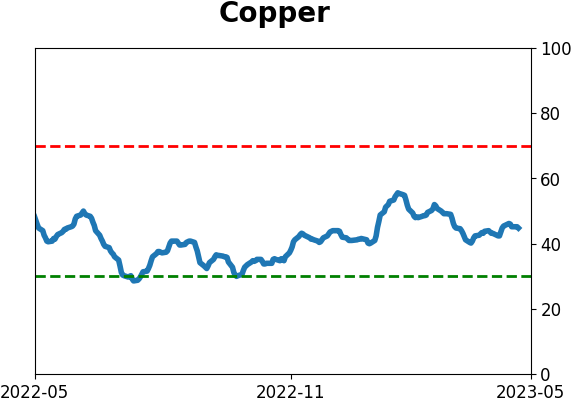
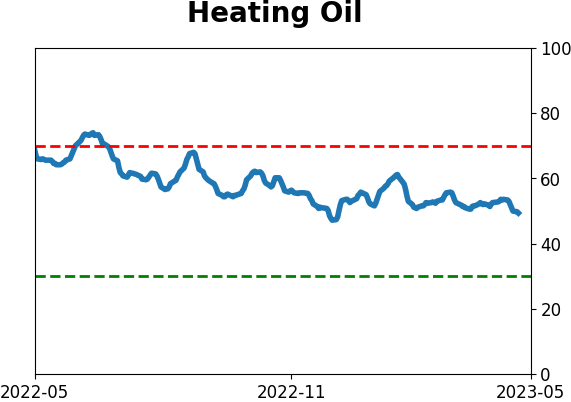
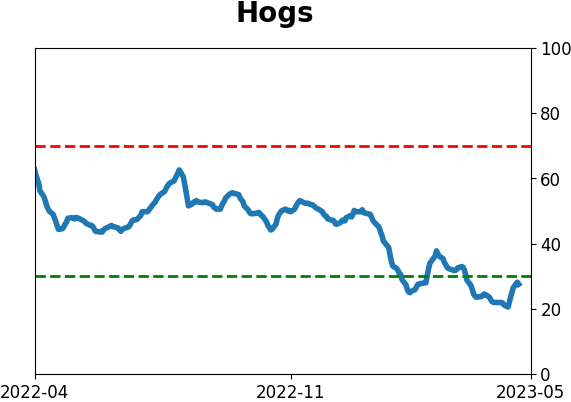
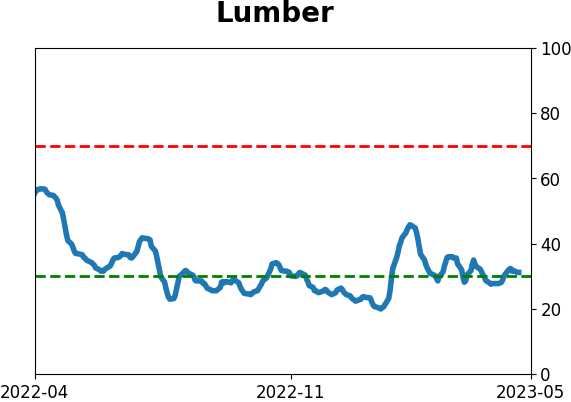
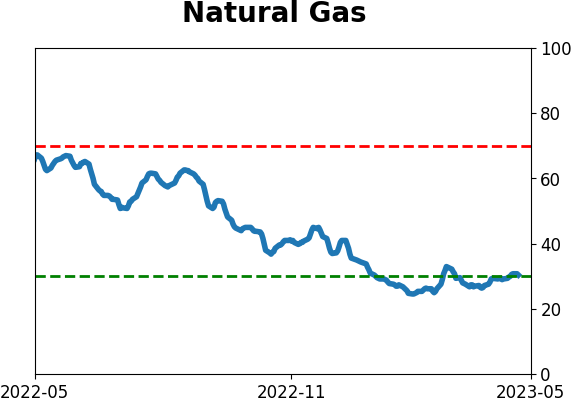
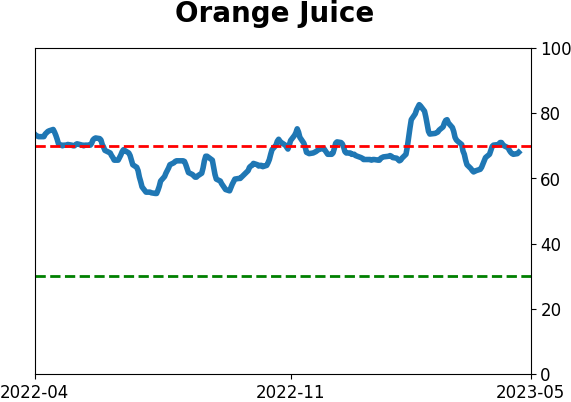
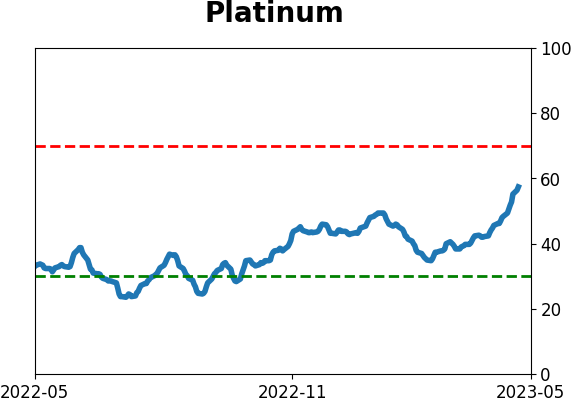
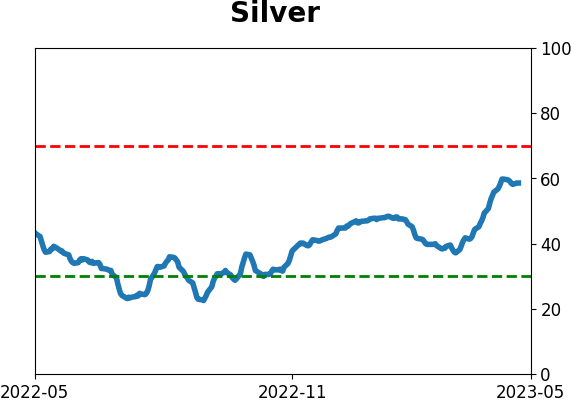
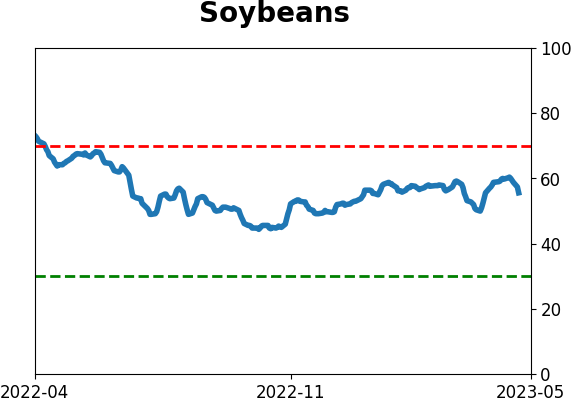
Optimism Index Thumbnails
|
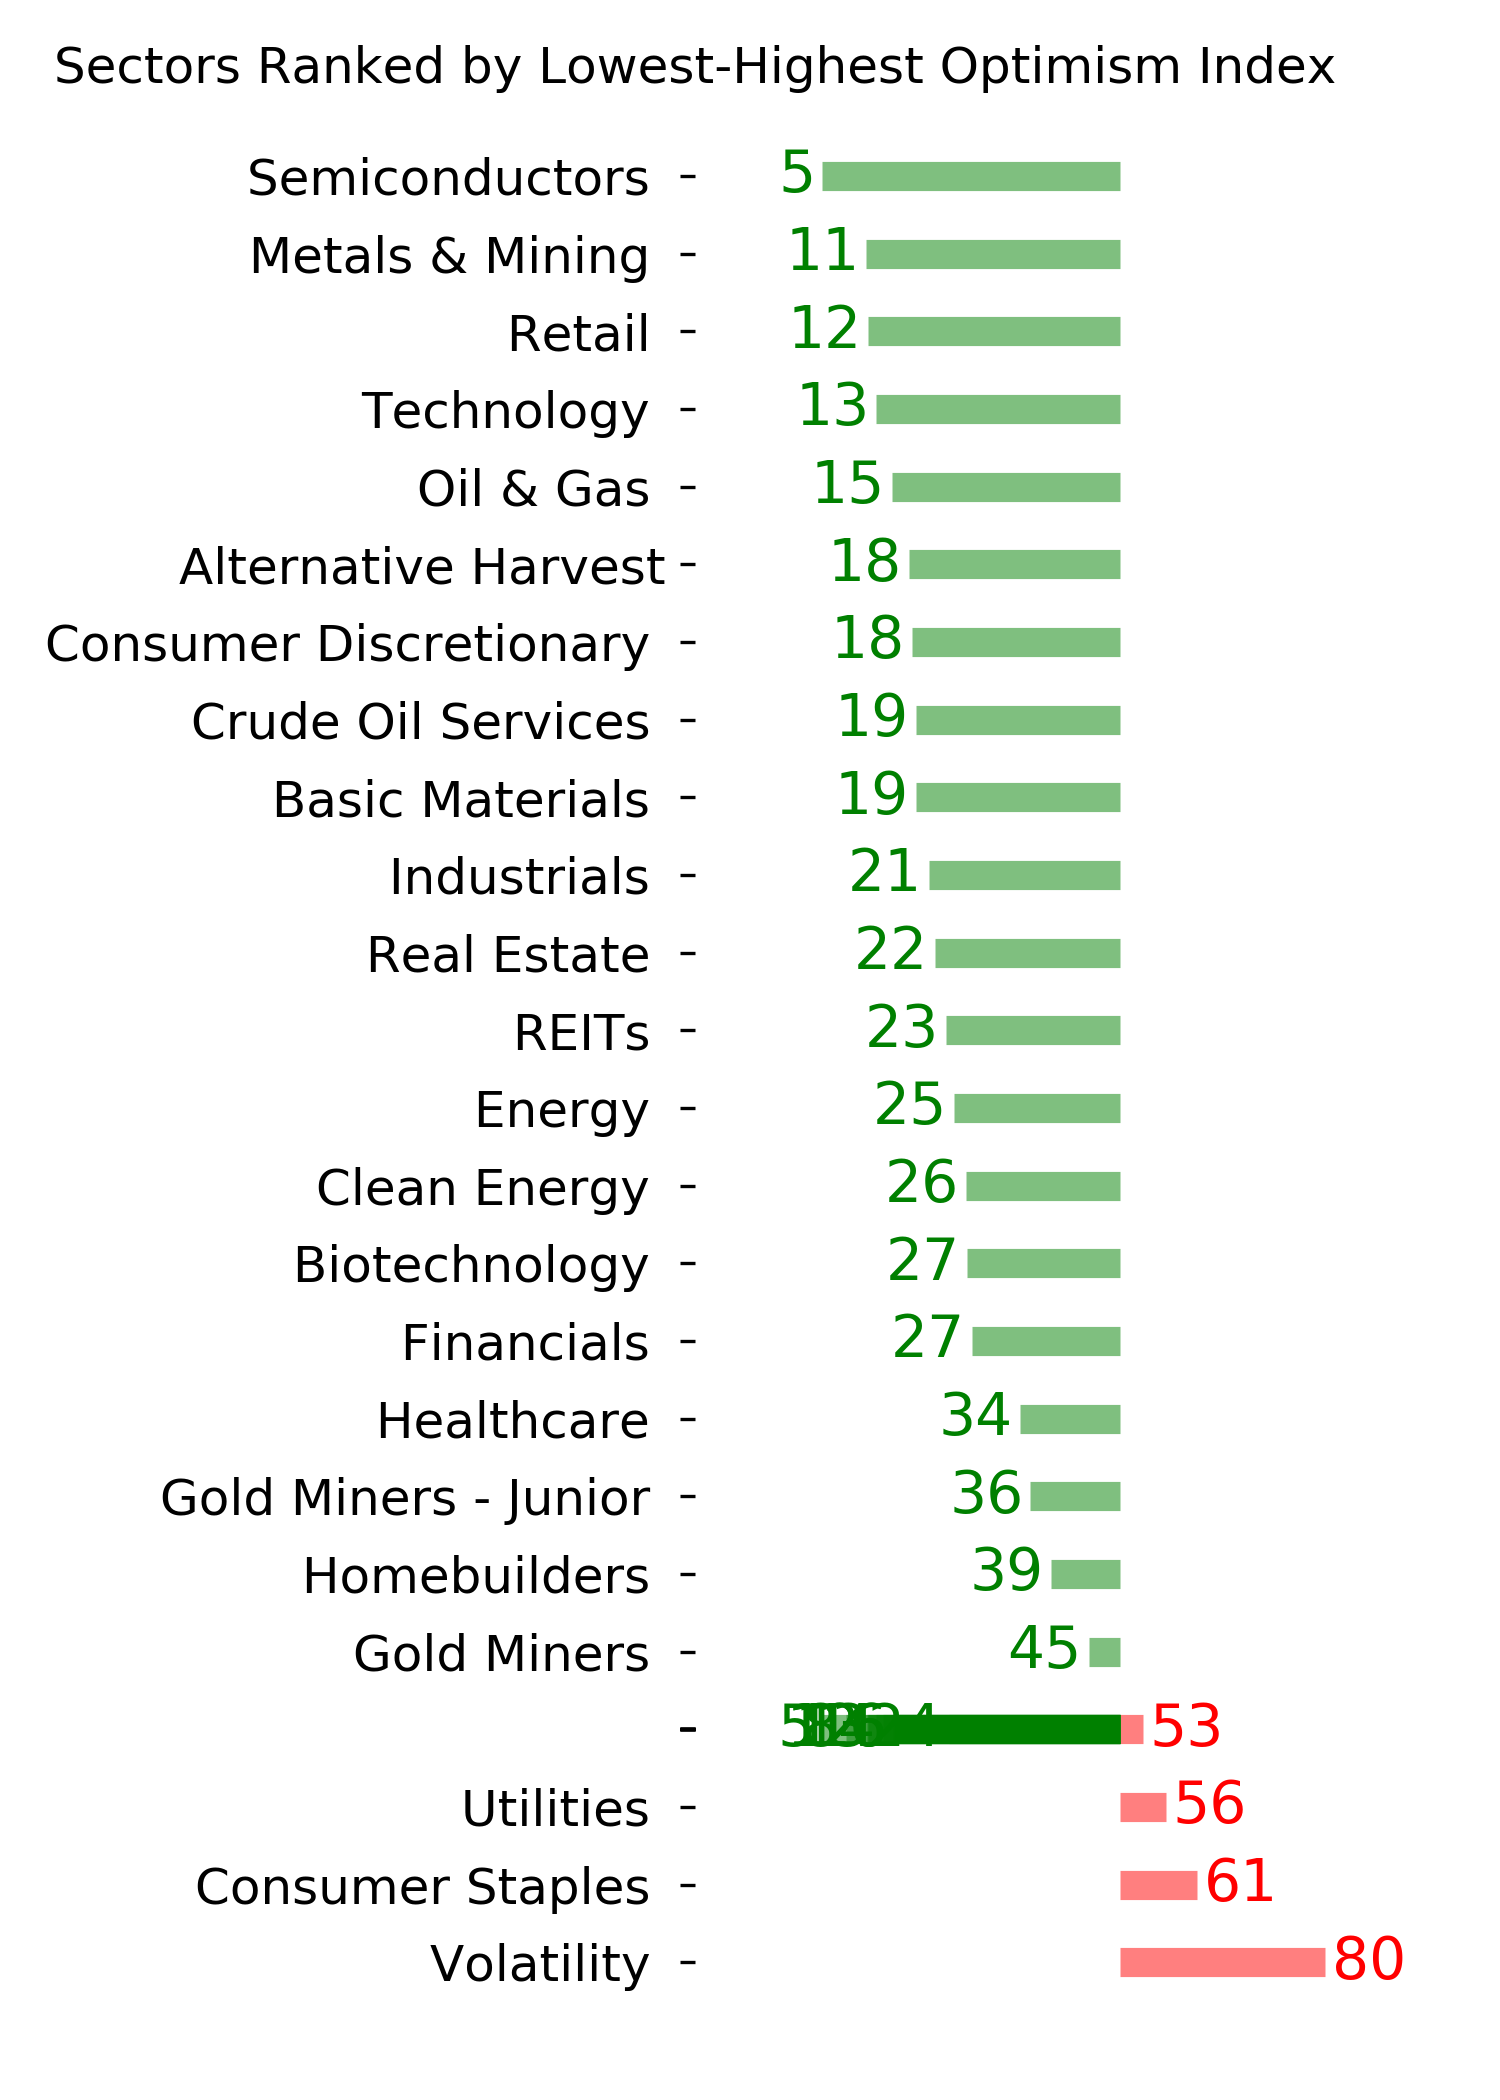
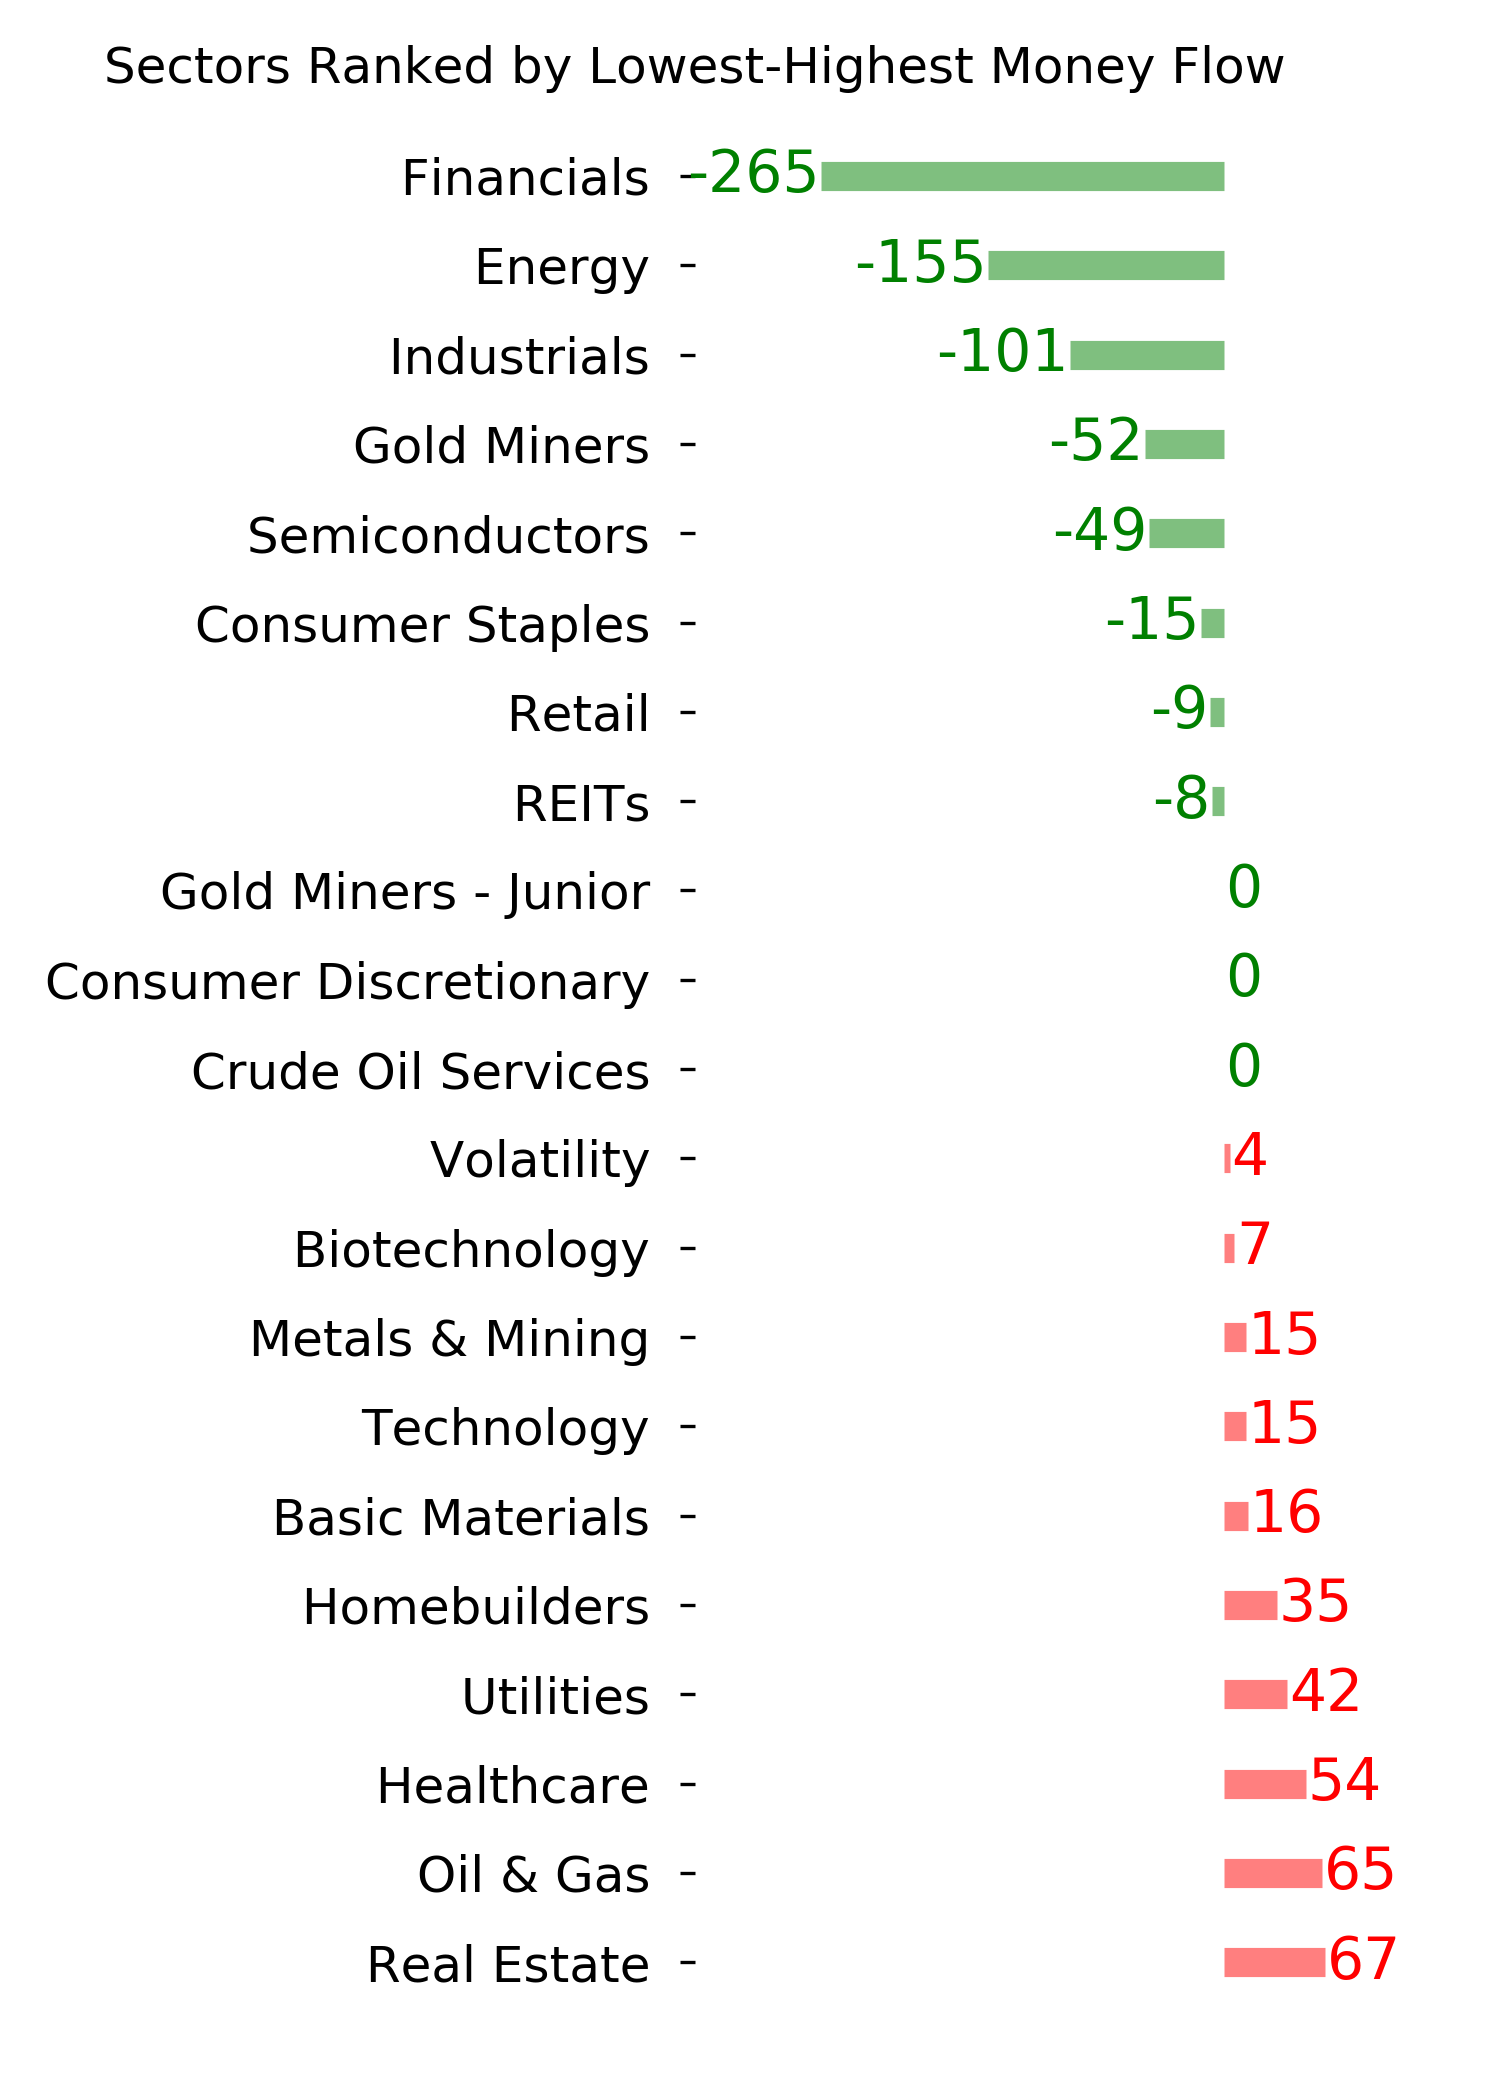
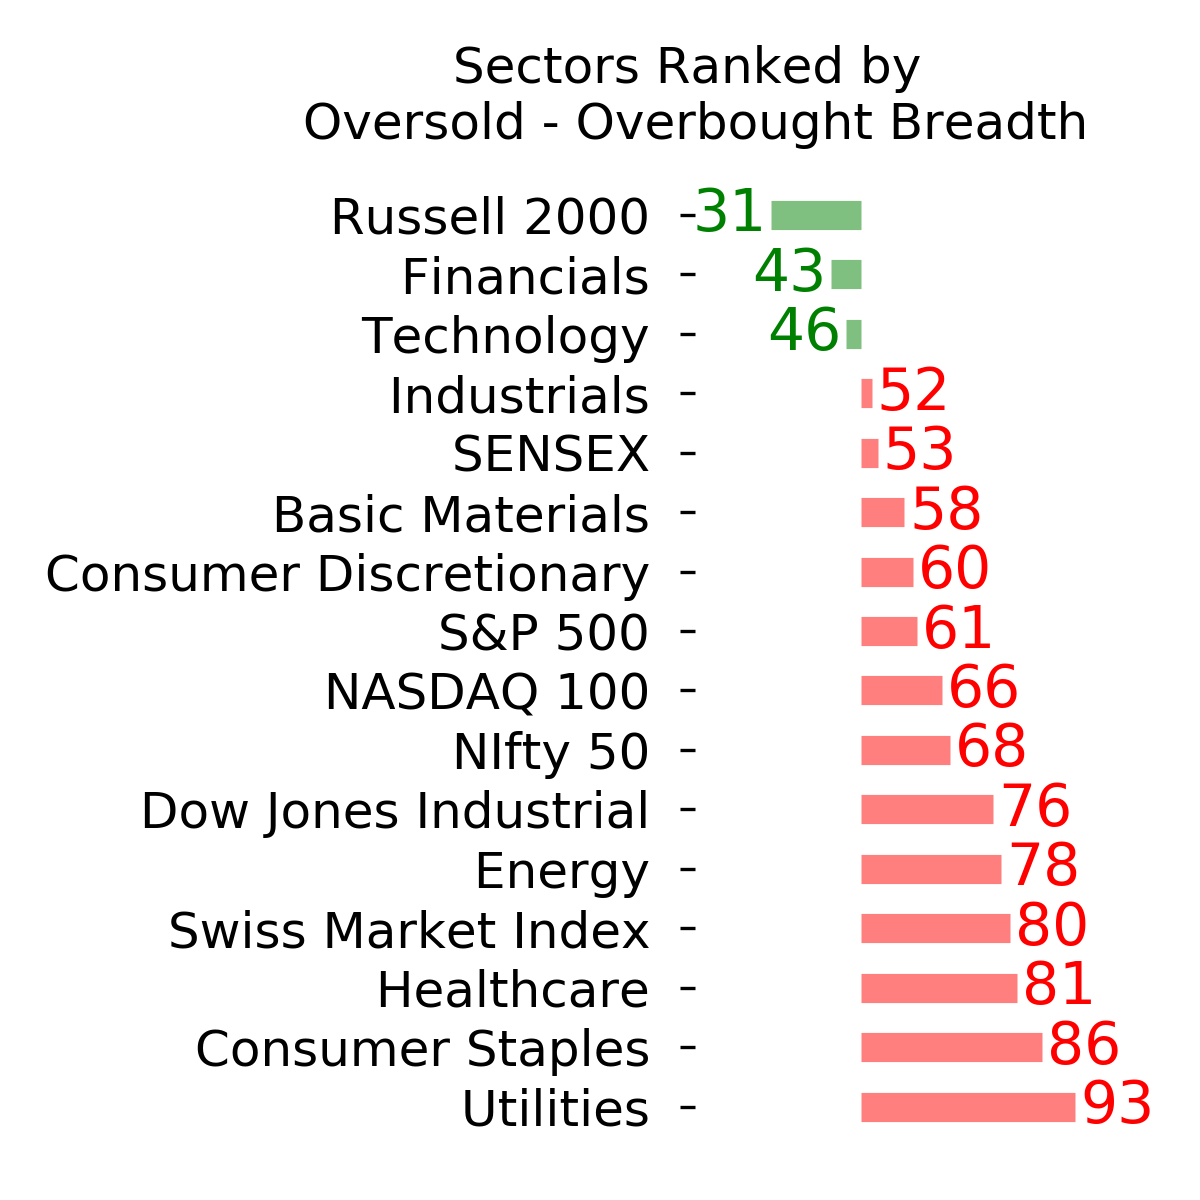
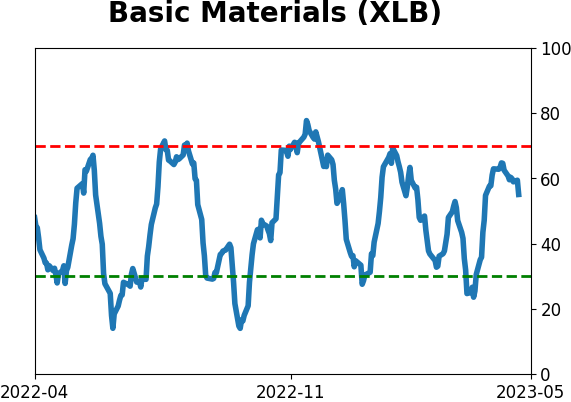
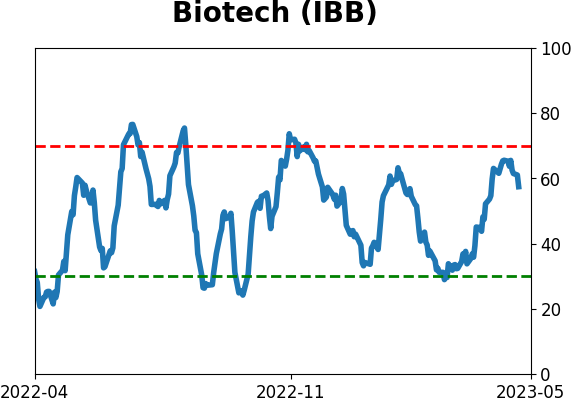
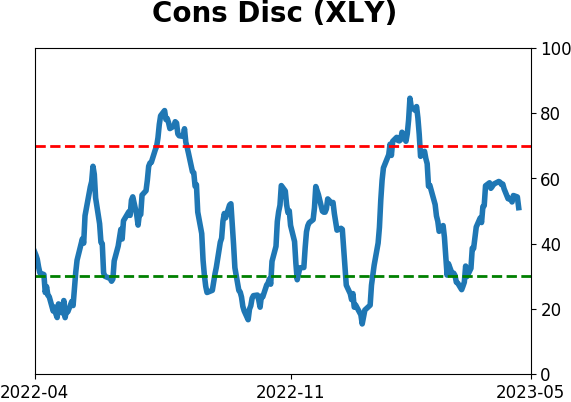
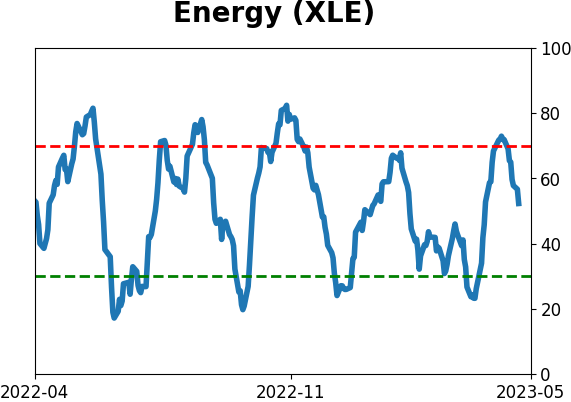
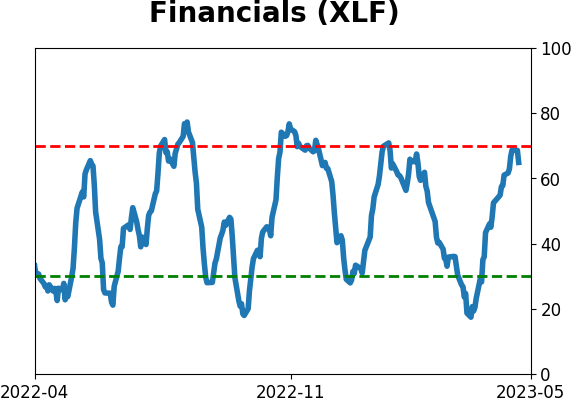
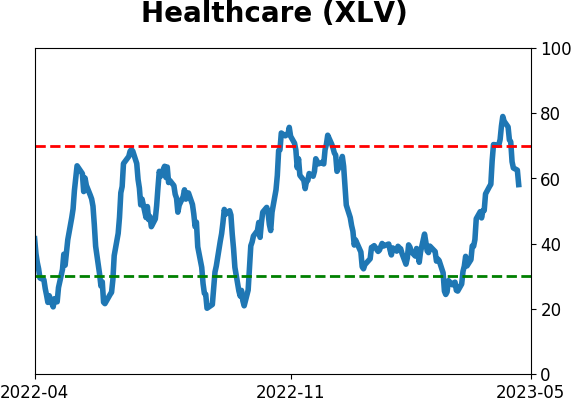
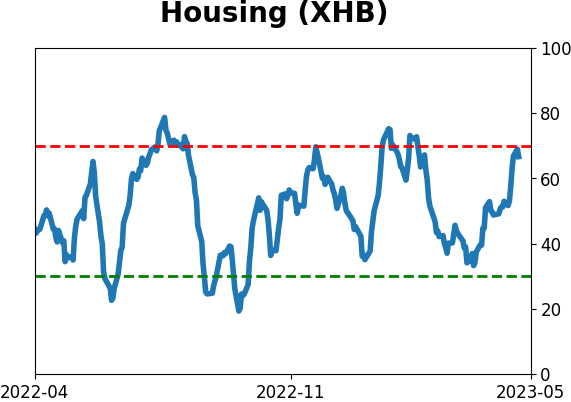
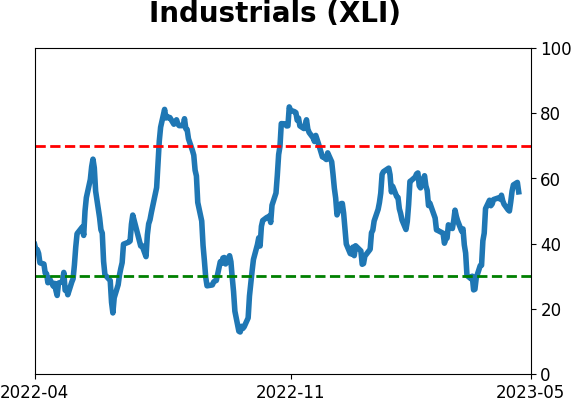
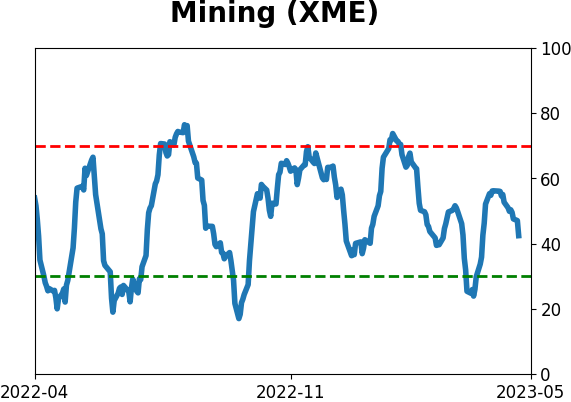
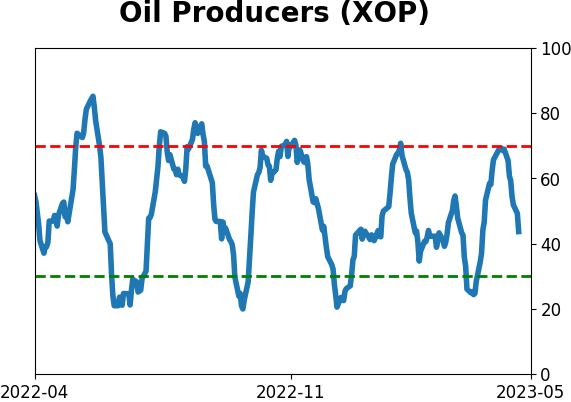
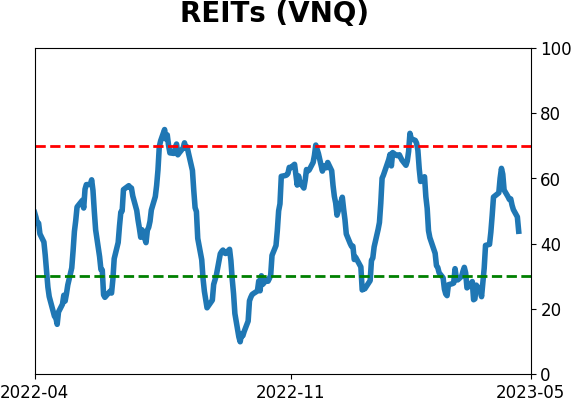
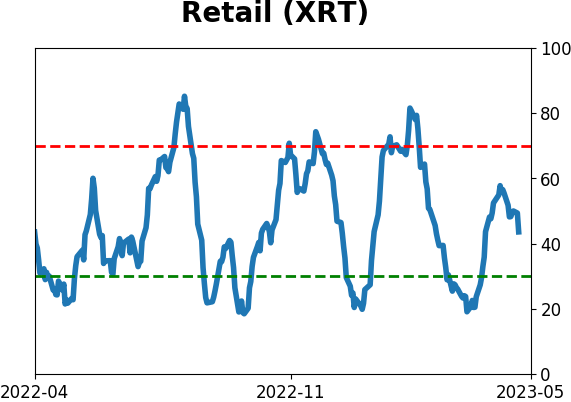
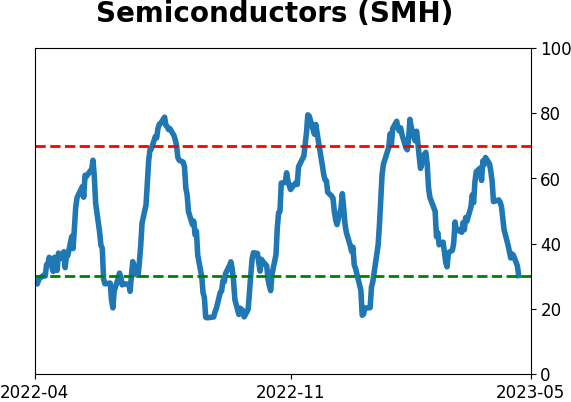
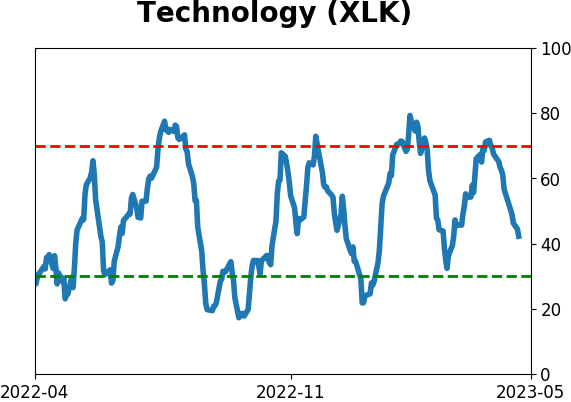
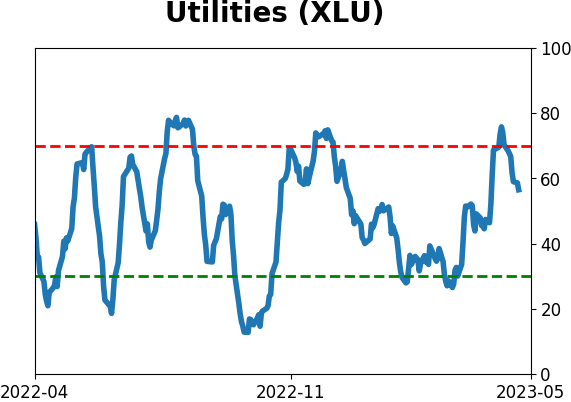
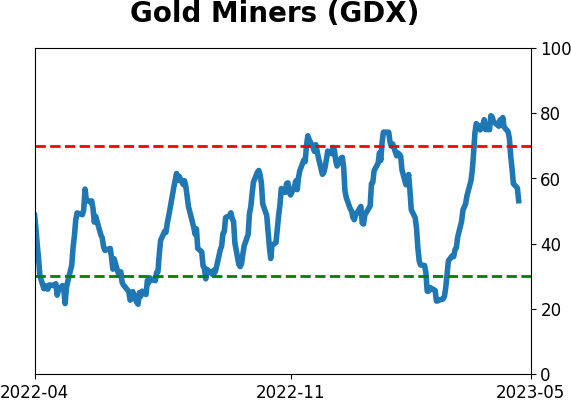
Sector ETF's - 10-Day Moving Average
|
|
|
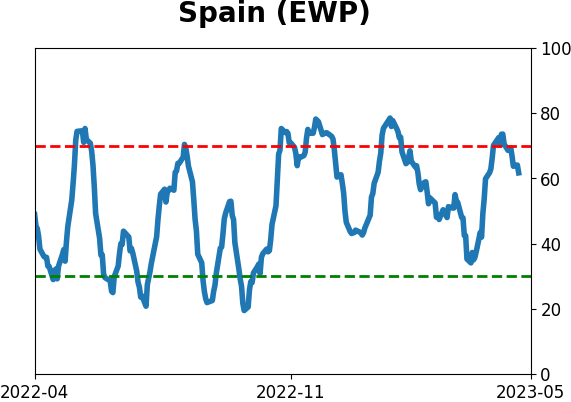
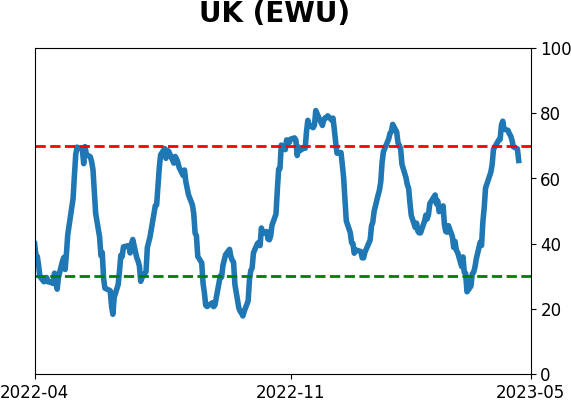
Country ETF's - 10-Day Moving Average
|
|
|
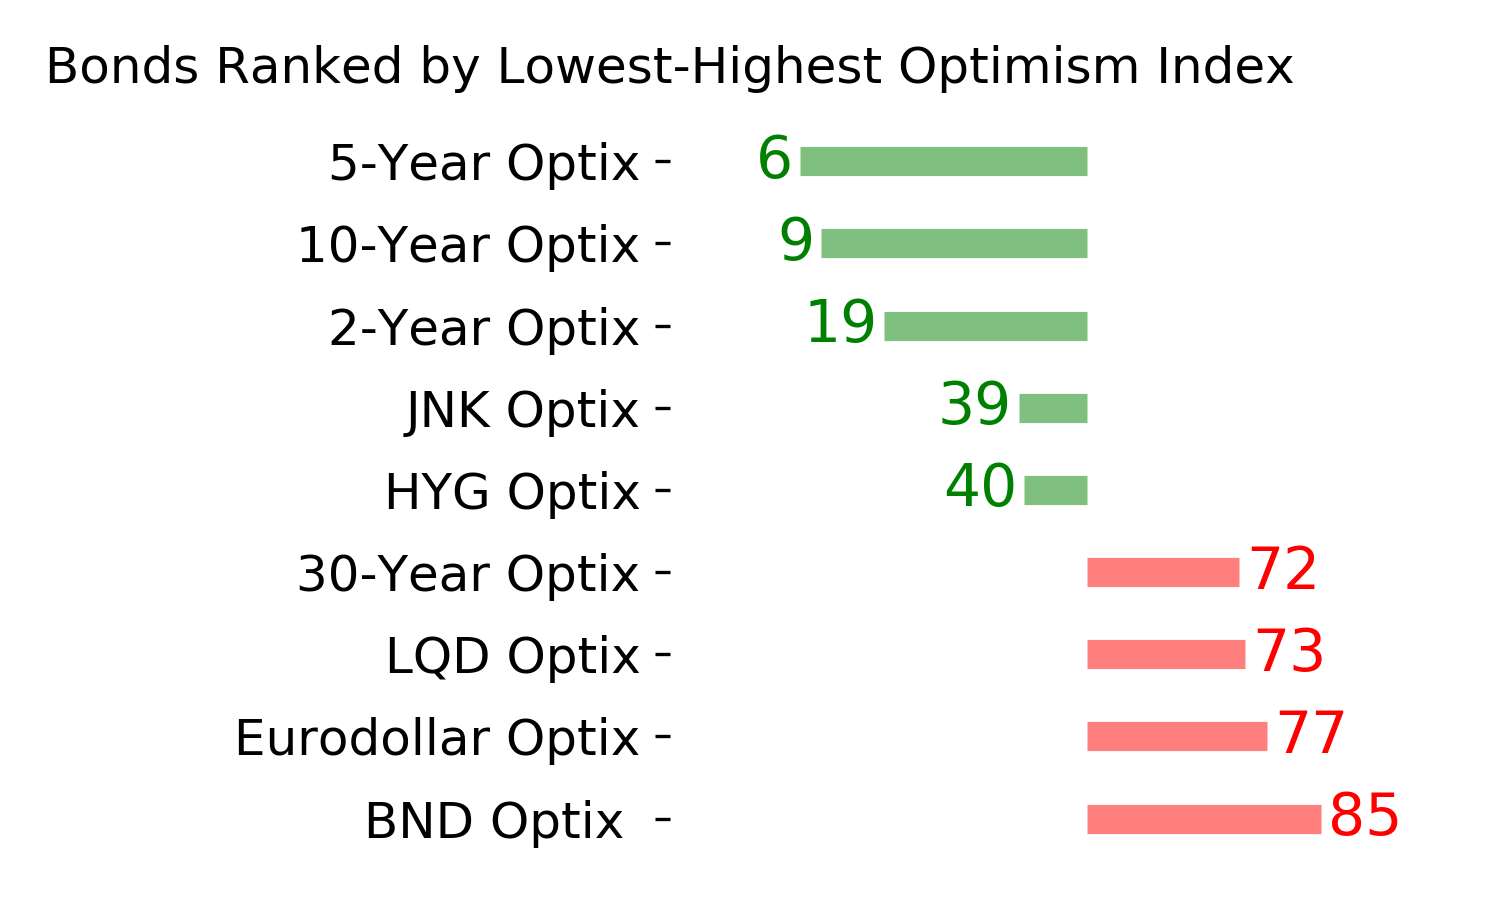
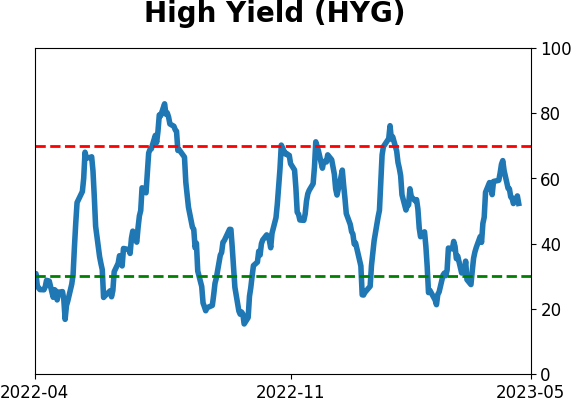
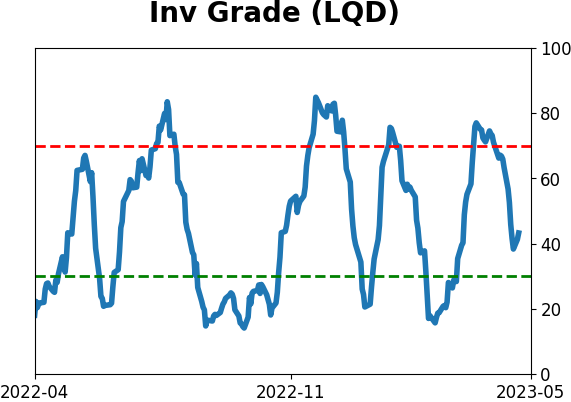
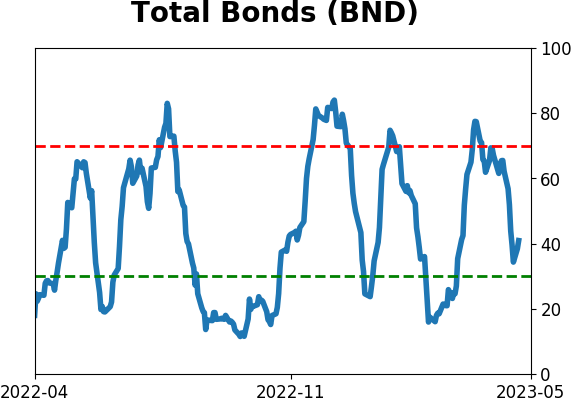
Bond ETF's - 10-Day Moving Average
|
|
|
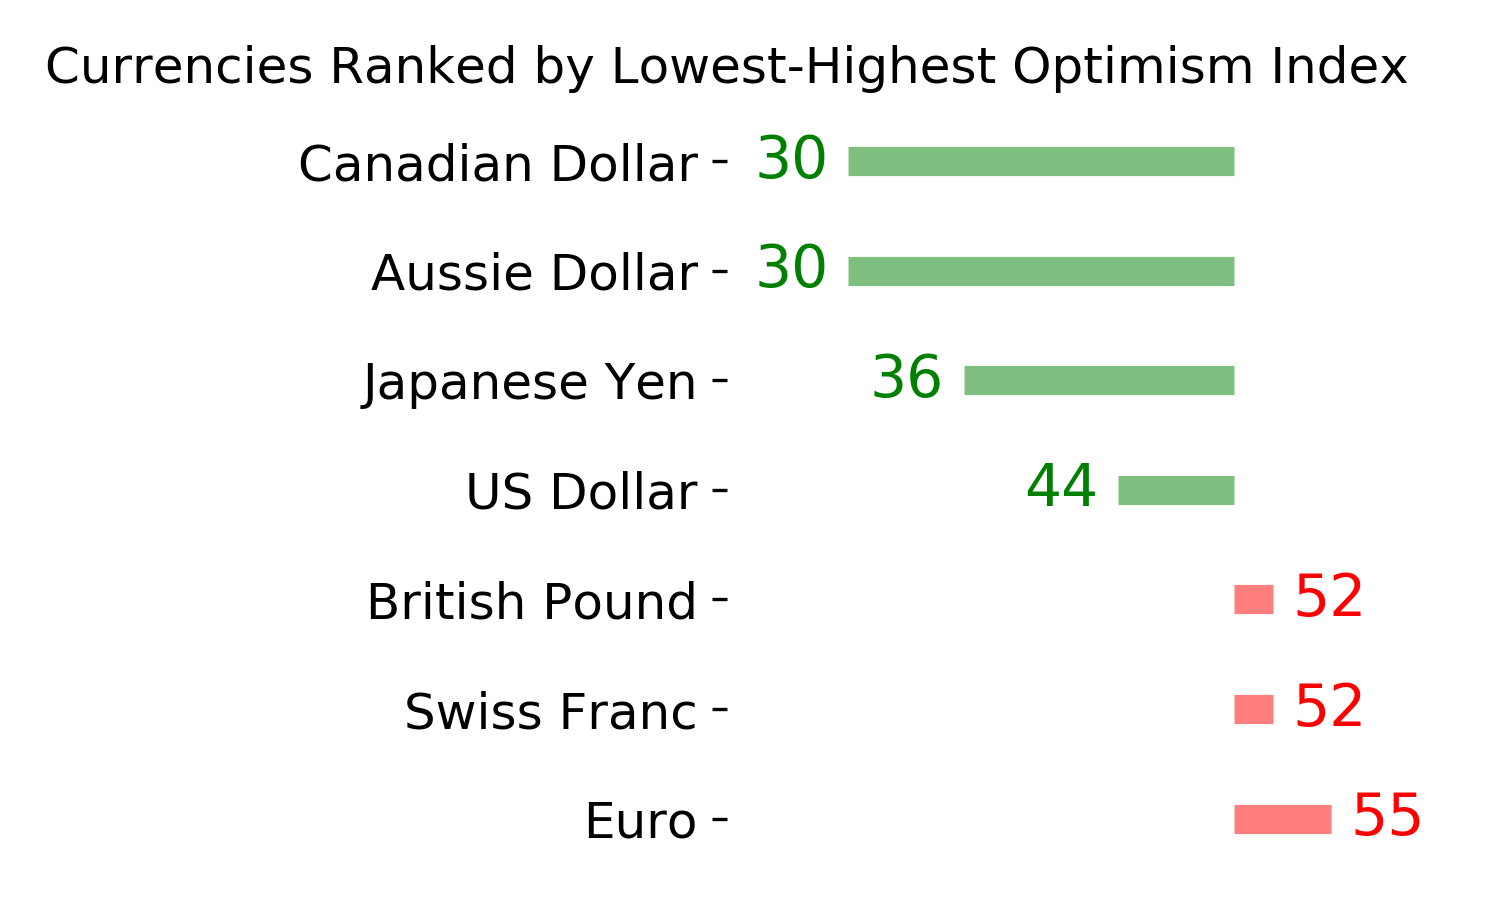
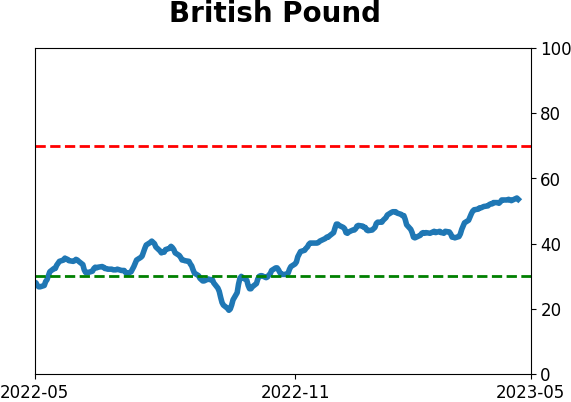
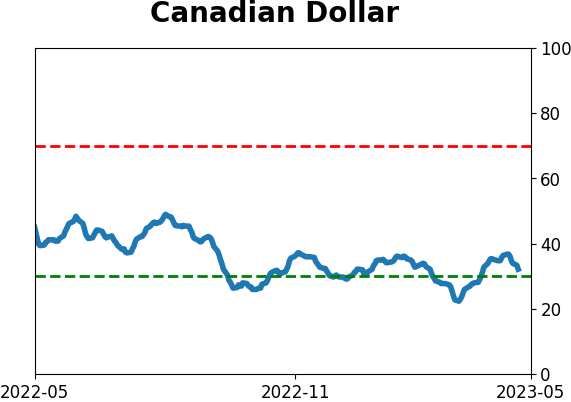
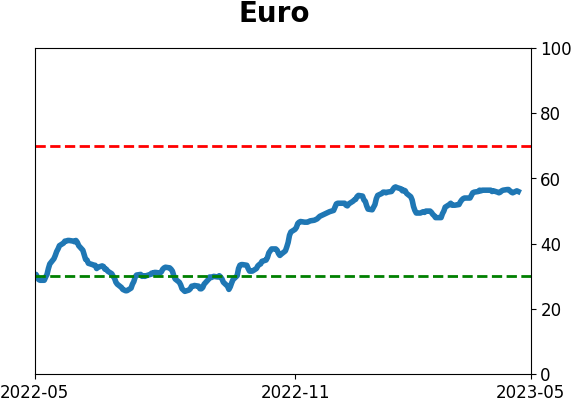
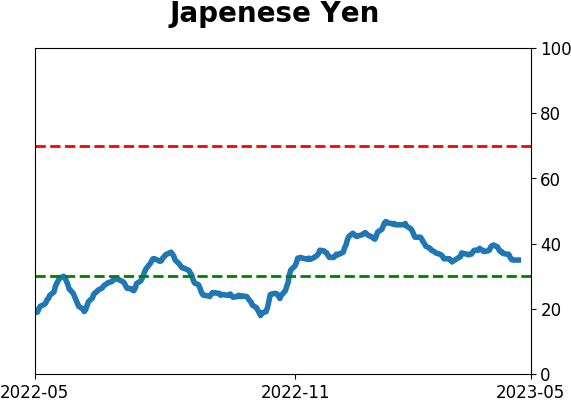
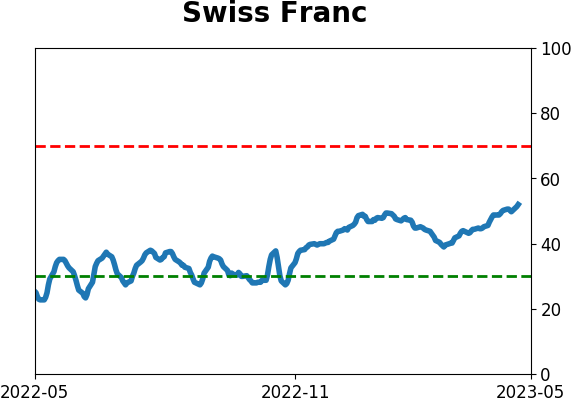
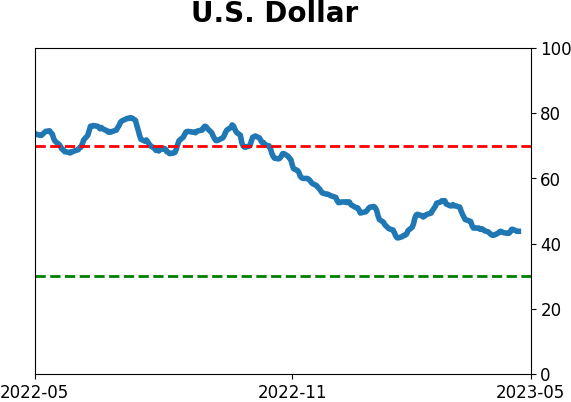
Currency ETF's - 5-Day Moving Average
|
|
|
Commodity ETF's - 5-Day Moving Average
|
|