Headlines
|
|
As the S&P 500 climbs, fewer stocks hold their uptrends:
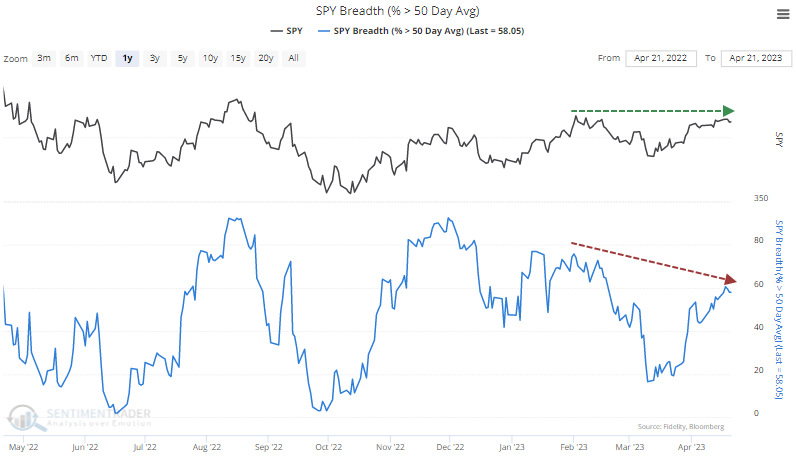
When the S&P 500 formed a 30-day peak in February, there were more stocks trading above their 50- and 200-day moving averages than when the index hit a 30-day high last week. This triggered large negative divergences in breadth. Though commonly cited as a reason to sell, these divergences were not compelling enough to use.
|
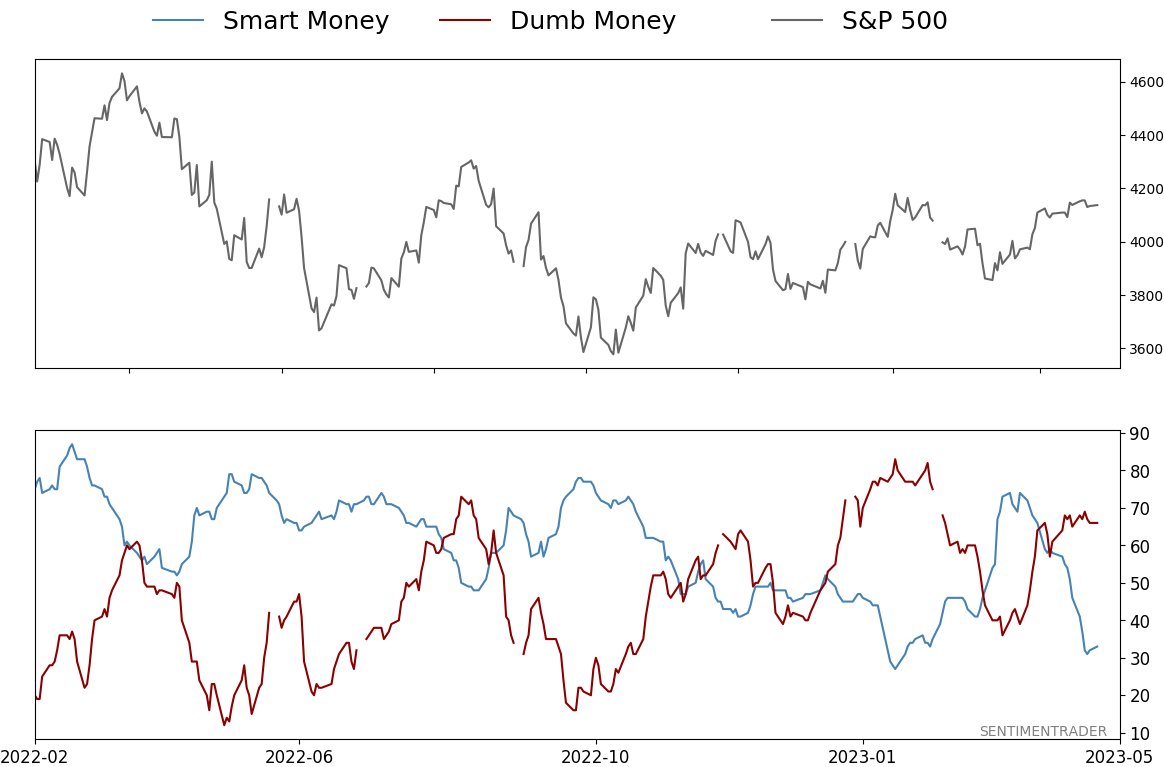
Smart / Dumb Money Confidence
|
Smart Money Confidence: 33%
Dumb Money Confidence: 66%
|
|
Risk Levels
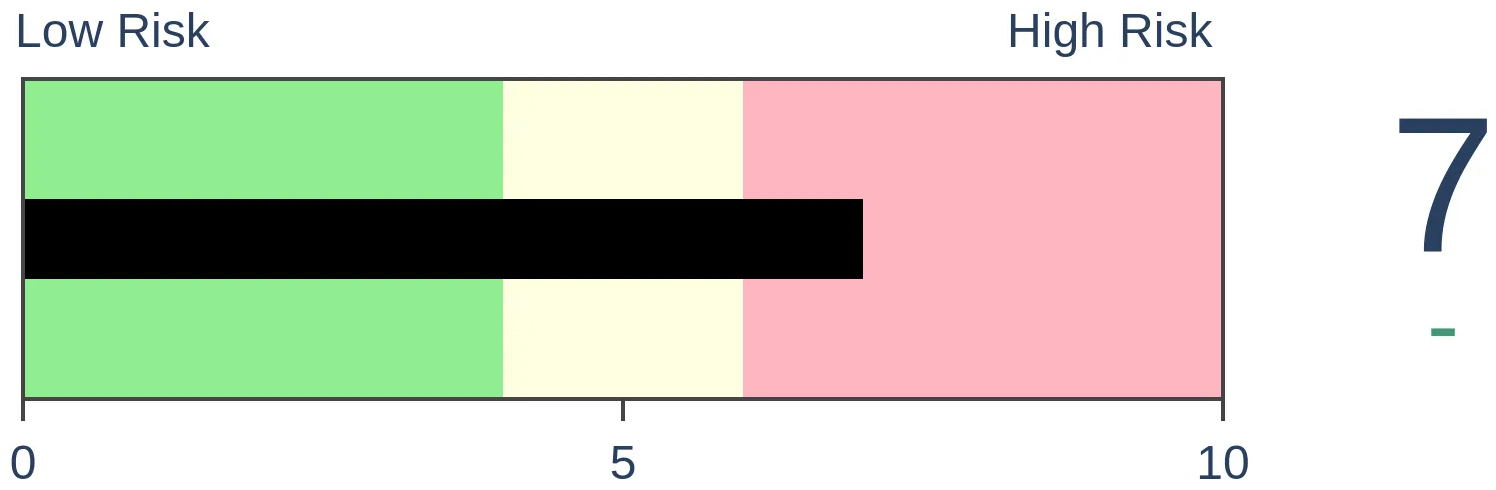
Stocks Short-Term
|
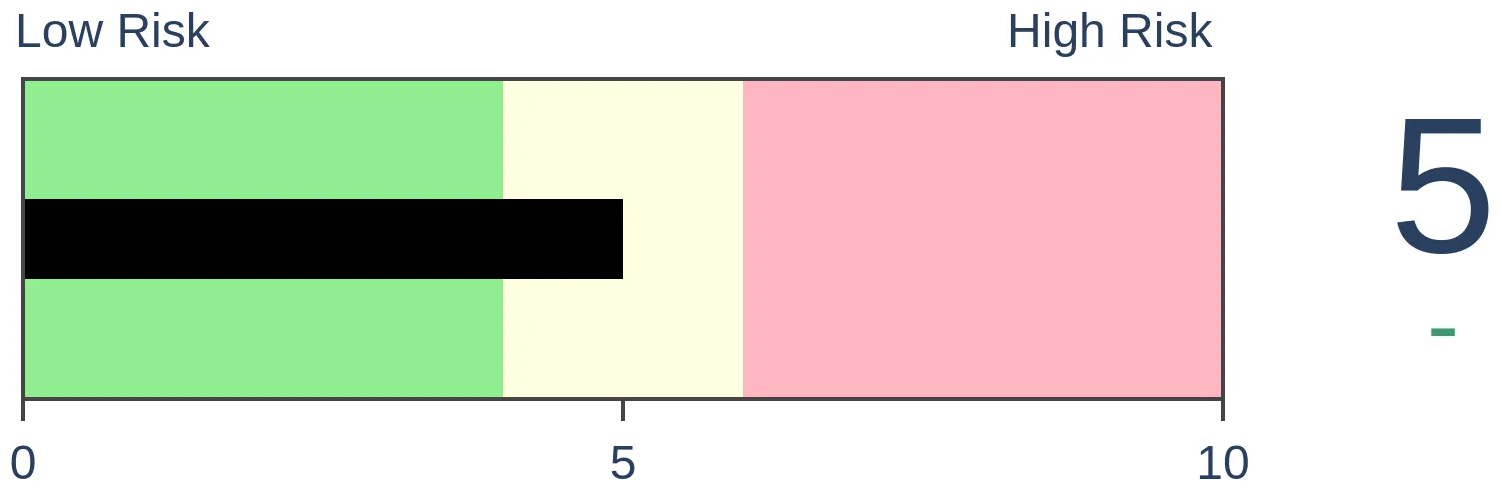
Stocks Medium-Term
|
|
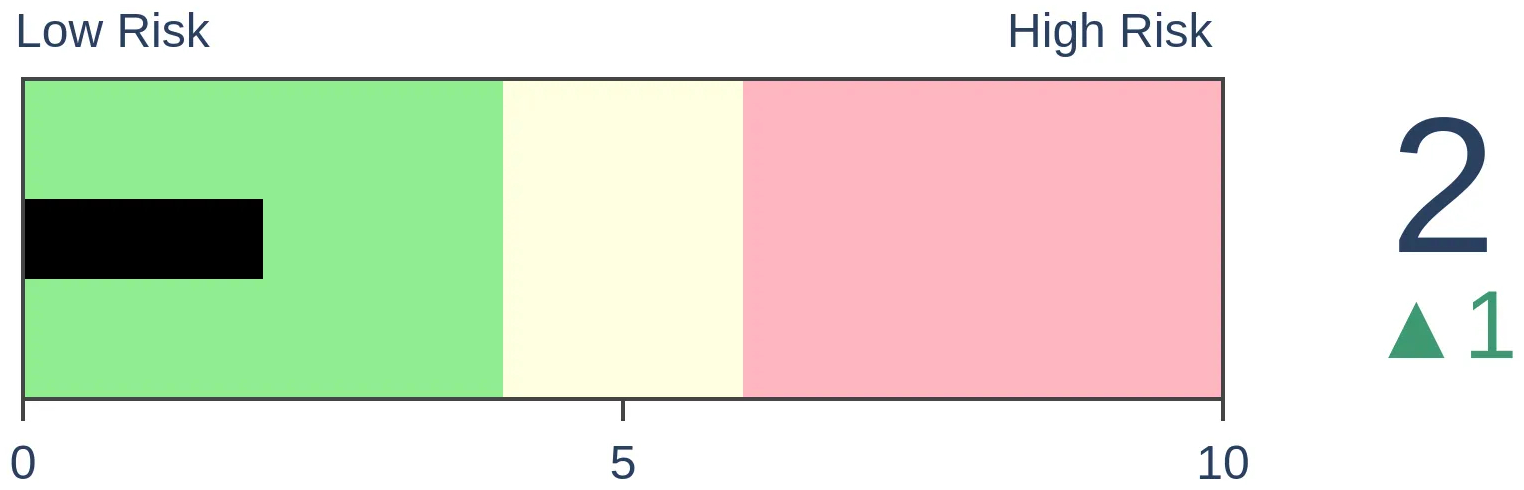
Bonds
|
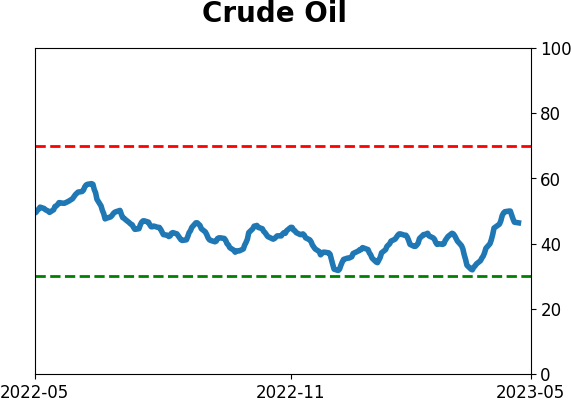
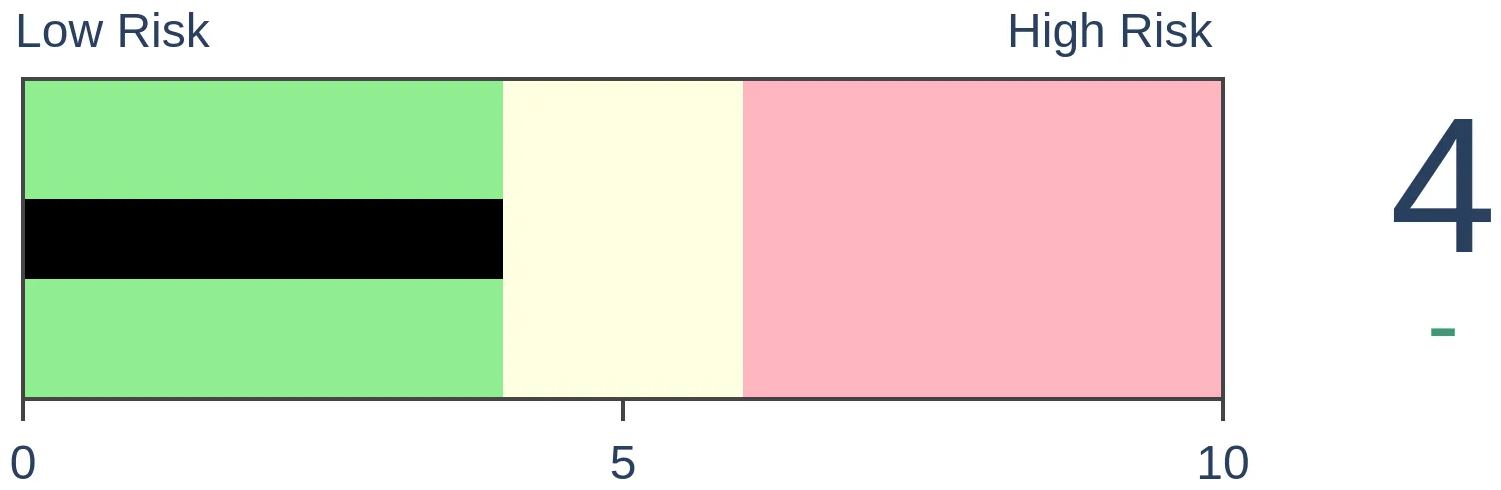
Crude Oil
|
|
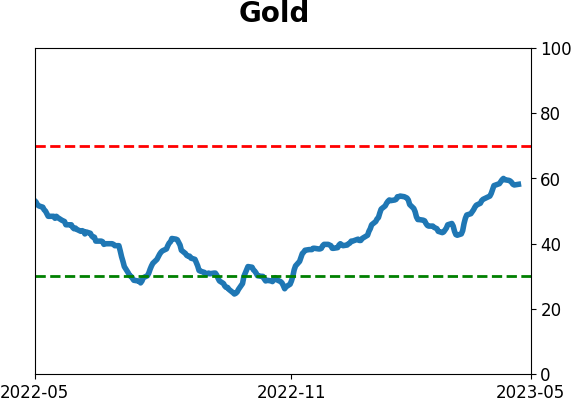
Gold
|
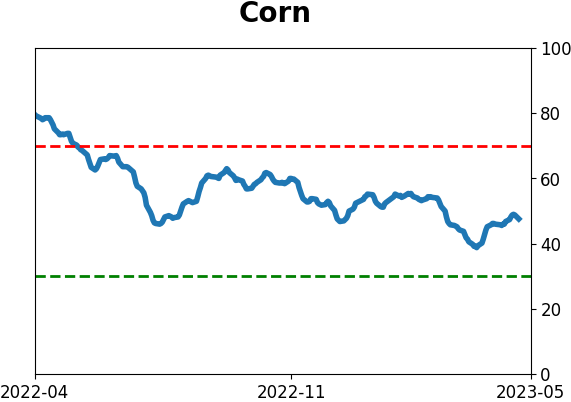
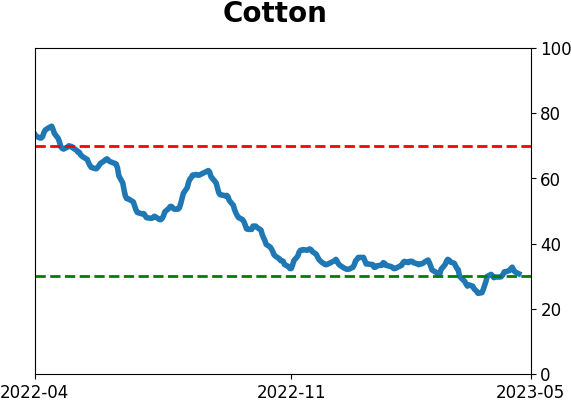
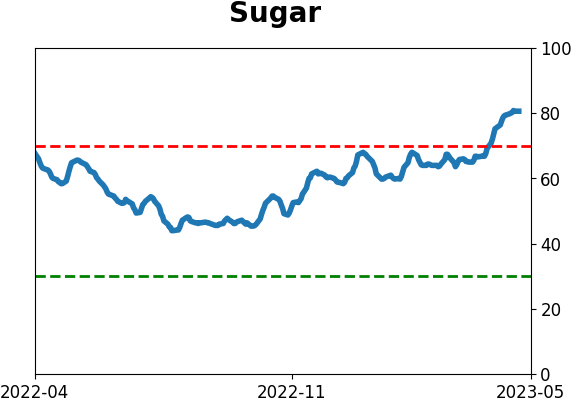
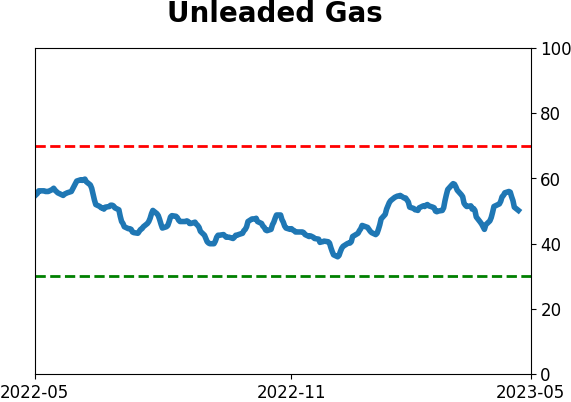
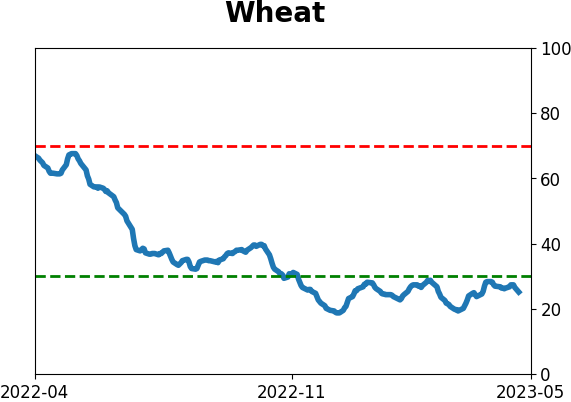
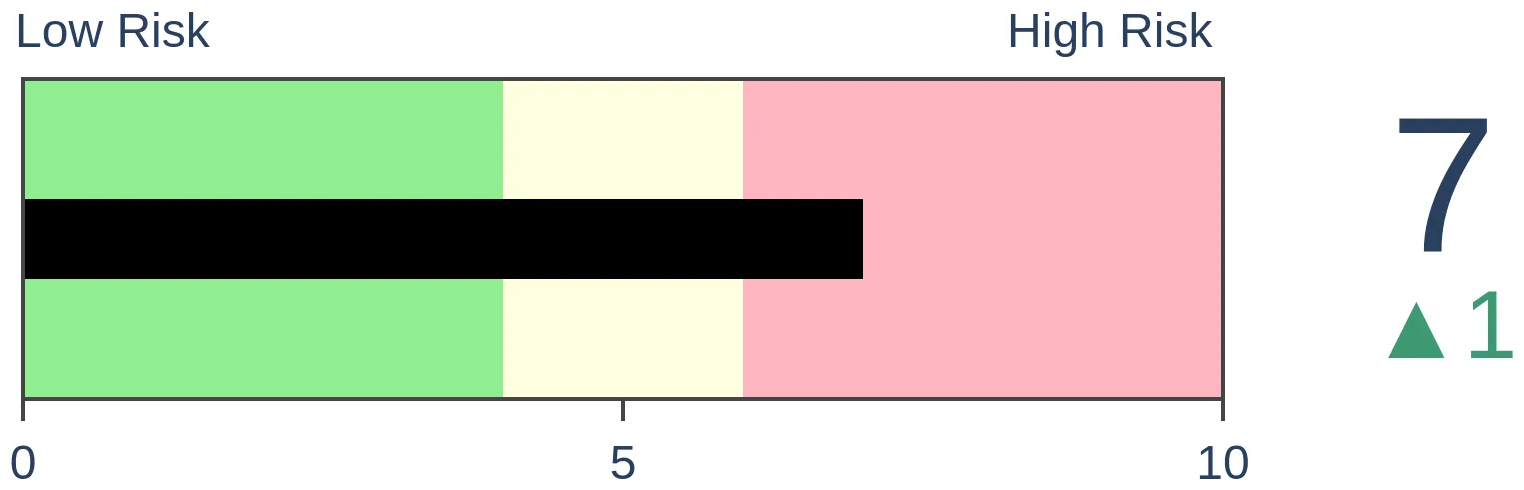
Agriculture

|
|
Research
By Jason Goepfert
BOTTOM LINE
When the S&P 500 formed a 30-day peak in February, there were more stocks trading above their 50- and 200-day moving averages than when the index hit a 30-day high last week. This triggered large negative divergences in breadth. Though commonly cited as a reason to sell, these divergences were not compelling enough to use.
FORECAST / TIMEFRAME
None
|
Key points:
- The S&P 500 made 30-day highs last week, but fewer stocks are above their 50- and 200-day moving averages
- These divergences in breadth are among some of the largest, dating back to 1928
- Forward returns after large negative divergences show these were not consistently successful sell signals
The S&P 500 is rising, but fewer members are in uptrends
After a historically brutal year like 2022, it's natural for investors to become pearl-clutchers. They will use any excuse that seems even remotely reasonable to reduce exposure to equities. And there's no blaming them - wanting to preserve capital after such a scary experience is baked into our DNA.
We've discussed several of the most prevalent worries in recent weeks, and we can add another that popped up this week. Breadth is showing negative divergences based on various (and sometimes wholly arbitrary) metrics. By this, the usual definition is that price in, say, the S&P 500 is making higher highs while fewer of its stocks are holding above their moving averages.
We can see this in the percentage of stocks trading above their 50-day moving averages. When the S&P formed a 30-day peak in February, more than 74% of its stocks traded above their 50-day; on April 18, barely 60% of stocks were.
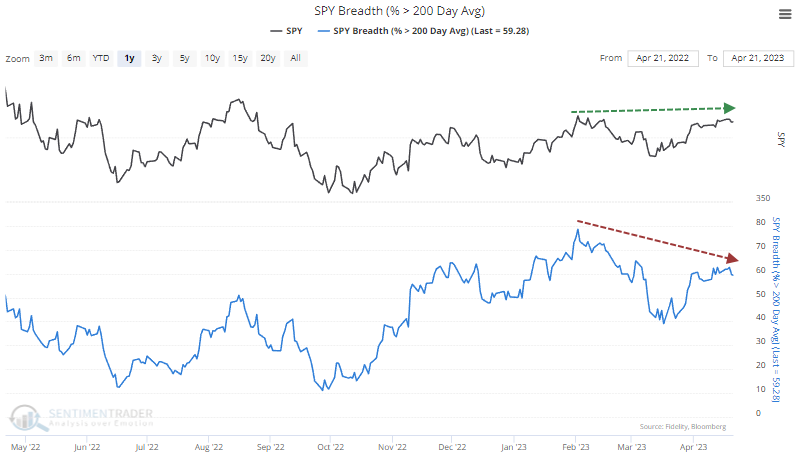
It's also evident in the percentage of stocks above their 200-day averages. In February, more than 78% of stocks traded above their long-term averages. By last week, that had dropped to fewer than 62%.
Let's go back to 1928 and look for every date when the S&P 500 carved out a 30-day peak. This is the highest price reached in at least 30 days on either side of that date. For example, on February 2, the S&P closed at a 30-day high, and it was also the highest price for at least the next 30 days.
Then we'll look at the next date when the S&P hit a 30-day high, but we won't know in advance that it's a peak so we won't suffer from look-ahead bias. For example, on April 18, the S&P set a new 30-day high, but we don't know yet whether it will be the highest price for the next 30 days. That allows us to compare breadth readings between the two dates and look at divergences.
Using breadth divergences as a sell signal
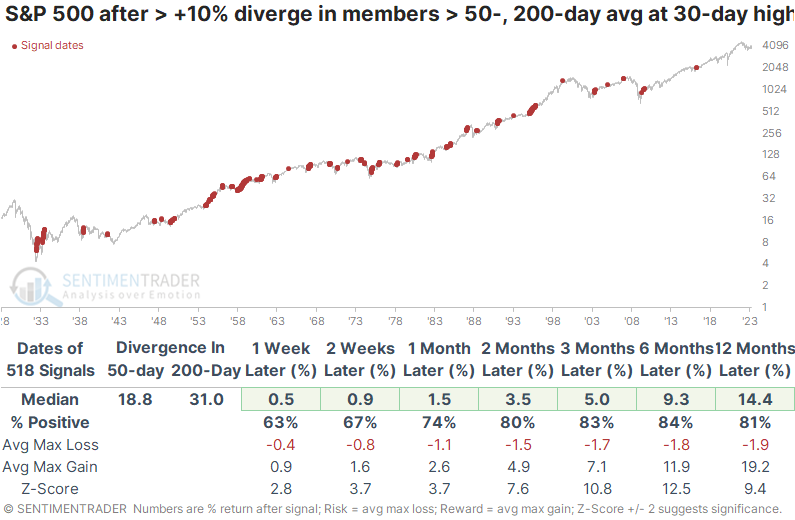
The table below looks at S&P returns following the most negative divergences when the percentage of members above their 50- and 200-day moving averages was at least 10% below the immediately preceding 30-day peak figures. In our current instance, it's comparing the figures on April 18 to those recorded on February 2.
Put simply, it's looking at forward returns after the most negative breadth divergences without cherry-picking or look-ahead bias.
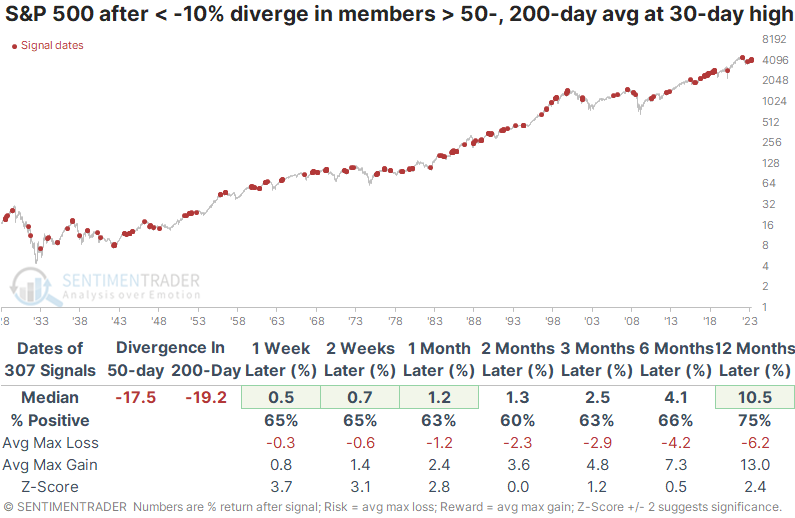
At these divergences, there were about 17% fewer members above their 50-day moving averages and nearly 20% fewer members above their 200-day averages. There was a large sample size, with more than 300 signals since 1928. And the S&P's returns going forward weren't too bad - above average on most time frames.
It's not like these were great buy signals, with only a moderate win rate and an unimpressive ratio of maximum gains to maximum losses. Still, it didn't seem like a great excuse to hit the sell button.
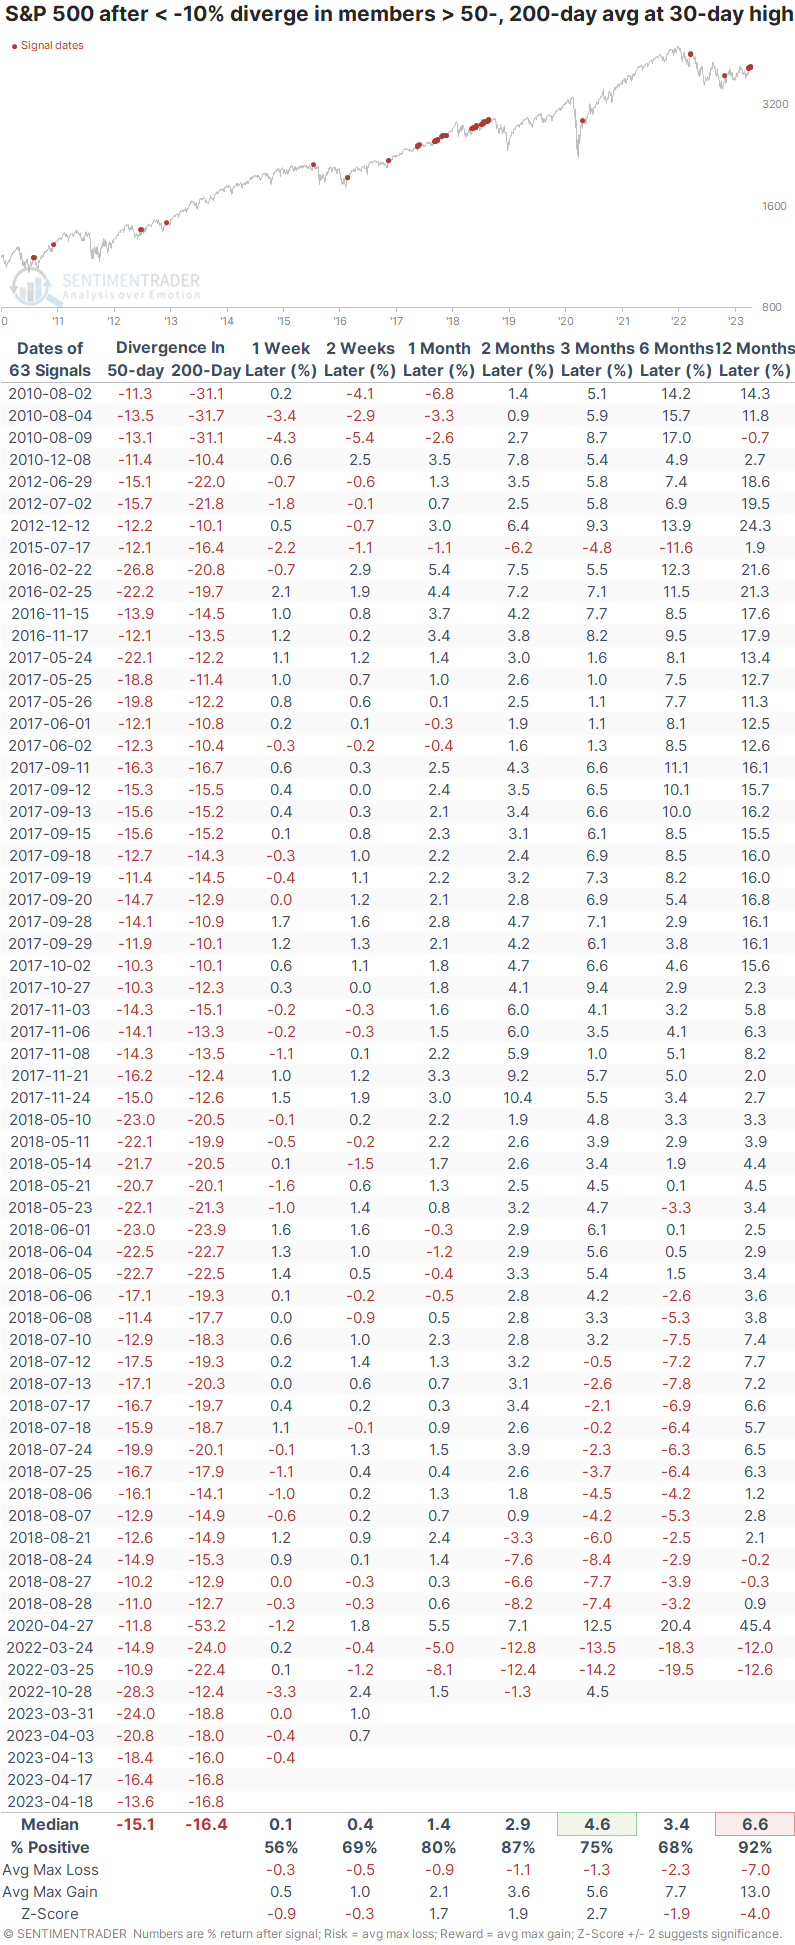
The table below is very large, but looking at recent signals might be useful. It filters the table to show only the signals since the end of the 2008 financial crisis. We can see that these divergences gave investors a good heads-up in 2018 and before some hefty losses last year. But other than that, investors would have missed incredible gains by selling based on these signals. A year later, the S&P was up 92% of the time (most of the study period was dominated by bull markets), but its average return was well below random.
The table below shows the opposite scenario. These are times when the S&P hit a 30-day high, but there were large positive divergences when at least 10% of members traded above their 50- and 200-day averages than at the prior 30-day peak.
The S&P's returns after these positive divergences were highly impressive. It rose a greater percentage of the time, with impressive median returns across all time frames and an extremely compelling risk/reward ratio.
What the research tells us...
Based on the above, investors should be much more welcome of significant positive divergences in breadth than negative ones. That seems like a "duh" statement, but we've seen hundreds of times over the decades that "duh" shouldn't be taken for granted in auction markets.
And even so, it might seem automatic that large negative divergences in breadth like we are seeing now, at least in two common metrics, should be a good sell signal. But they aren't. They proved to be a couple of times over the past decade and before that, but most of the time, they gave false signals.
Analysts will point to the divergences in hindsight if stocks decline from here and say, "Well, of course, you should have sold; I told you so!" And they will conveniently forget those calls to sell if stocks rally or hold steady, which they usually do after these divergences.
Indicators at Extremes
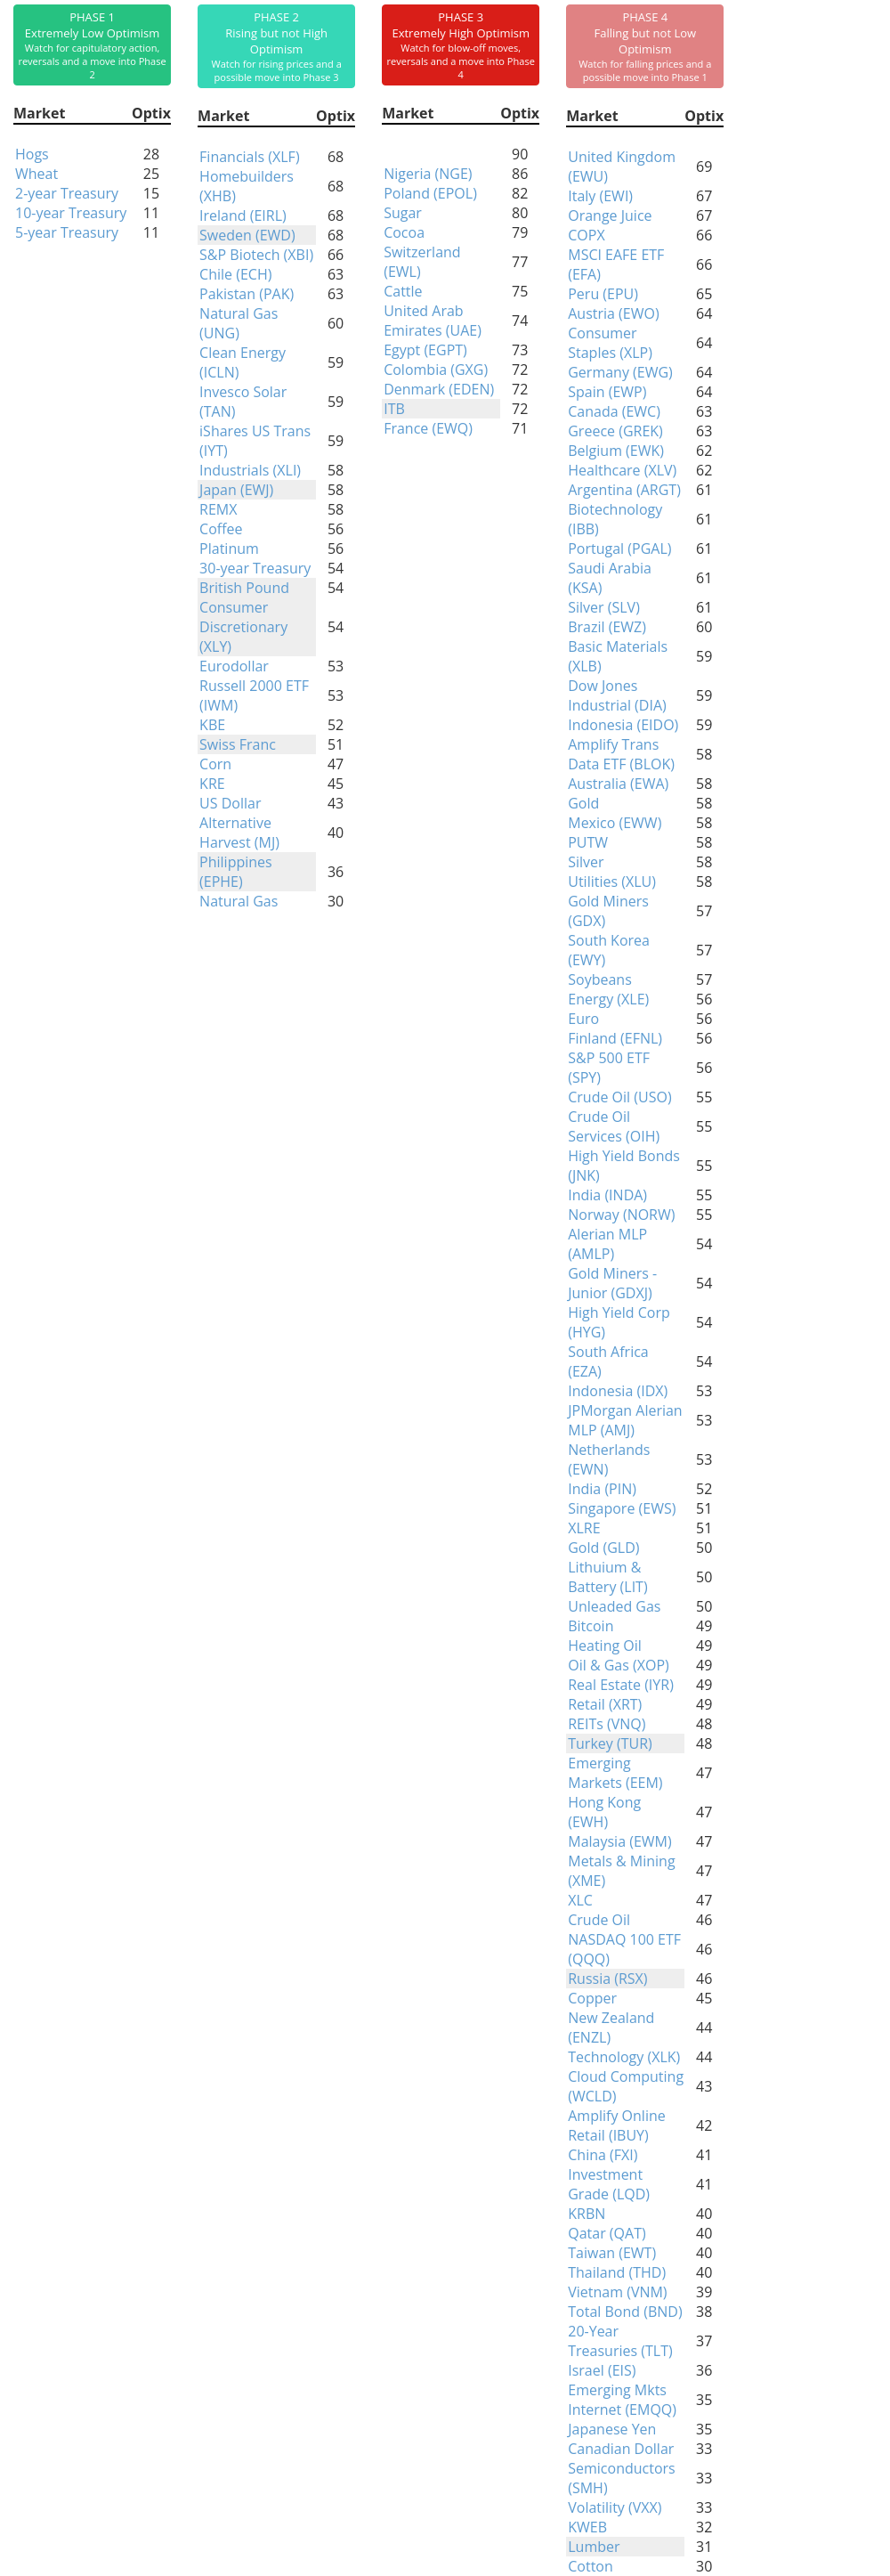
Phase Table
Ranks
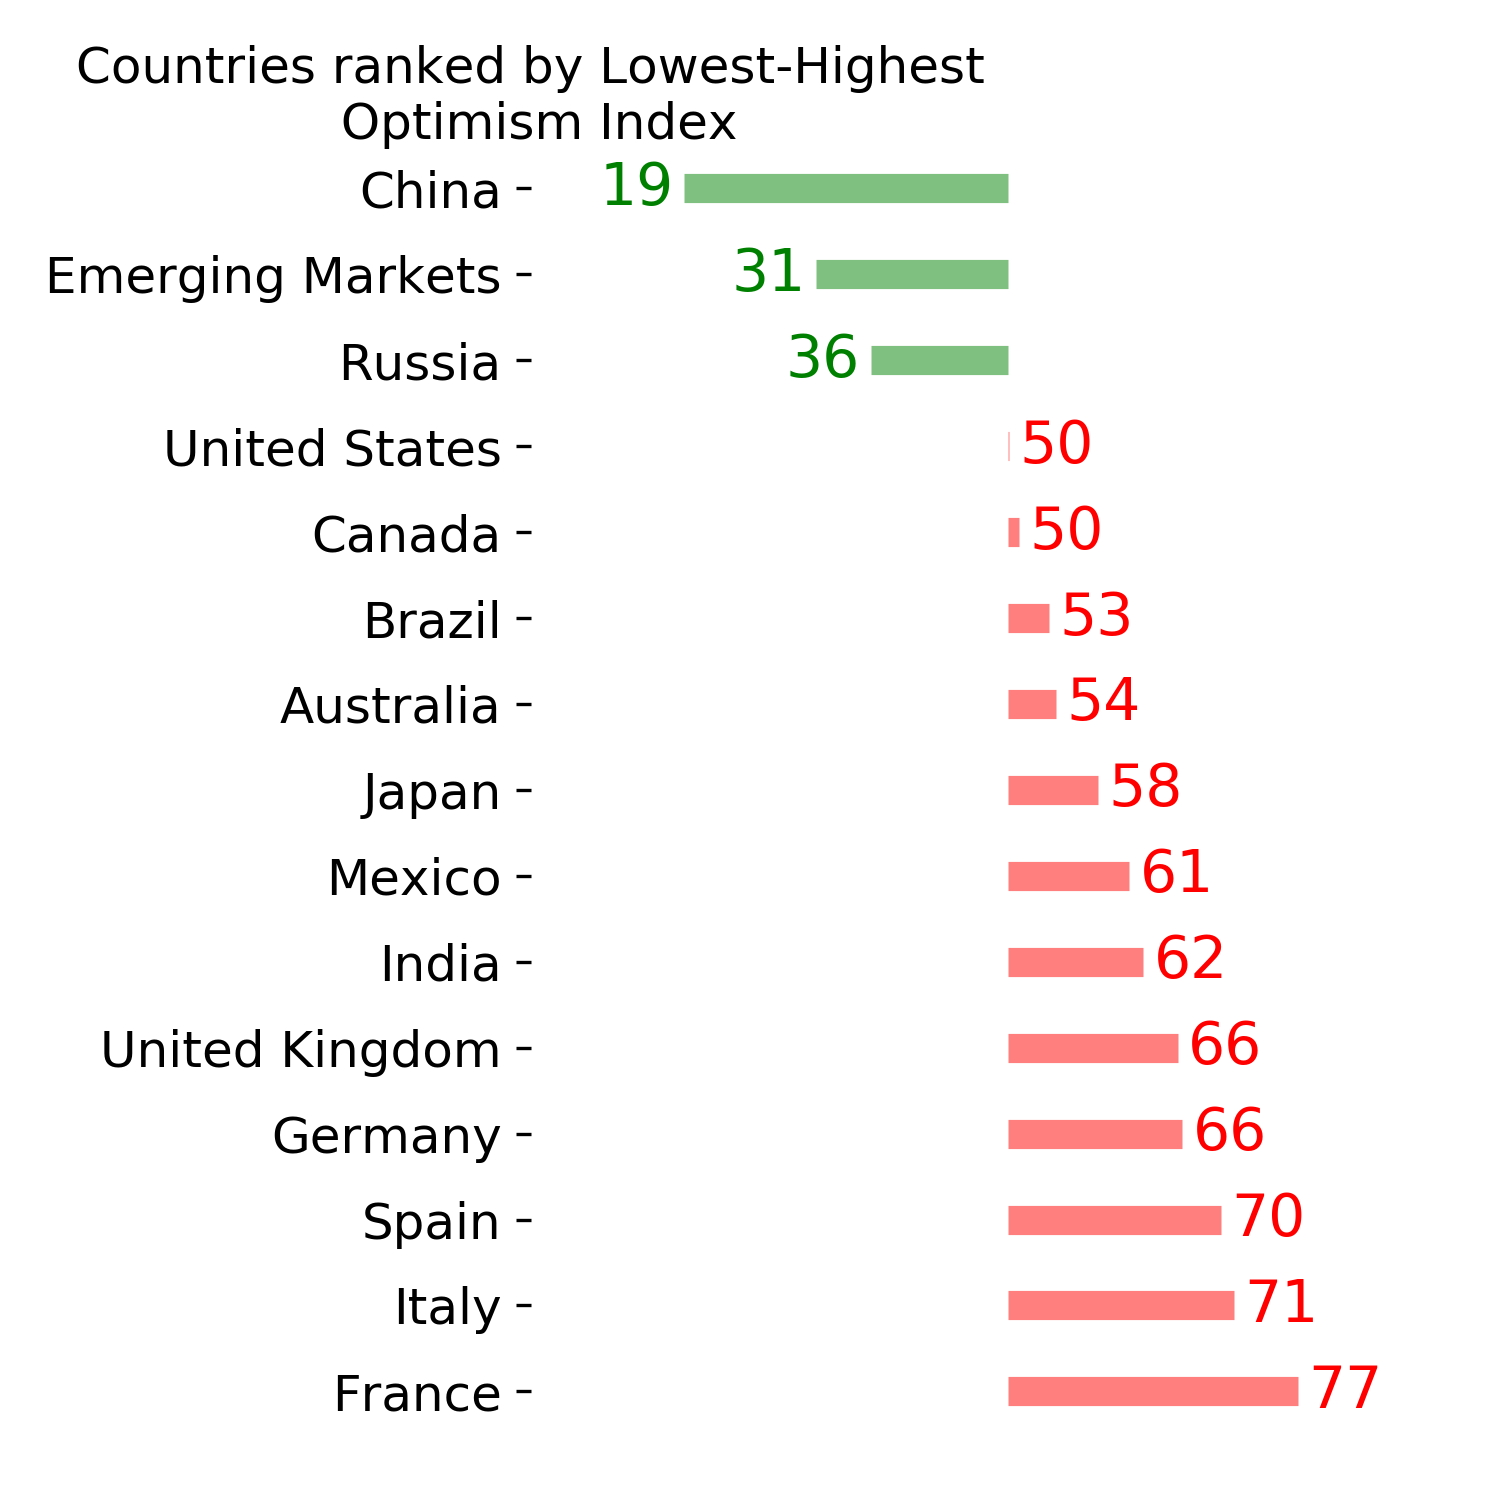
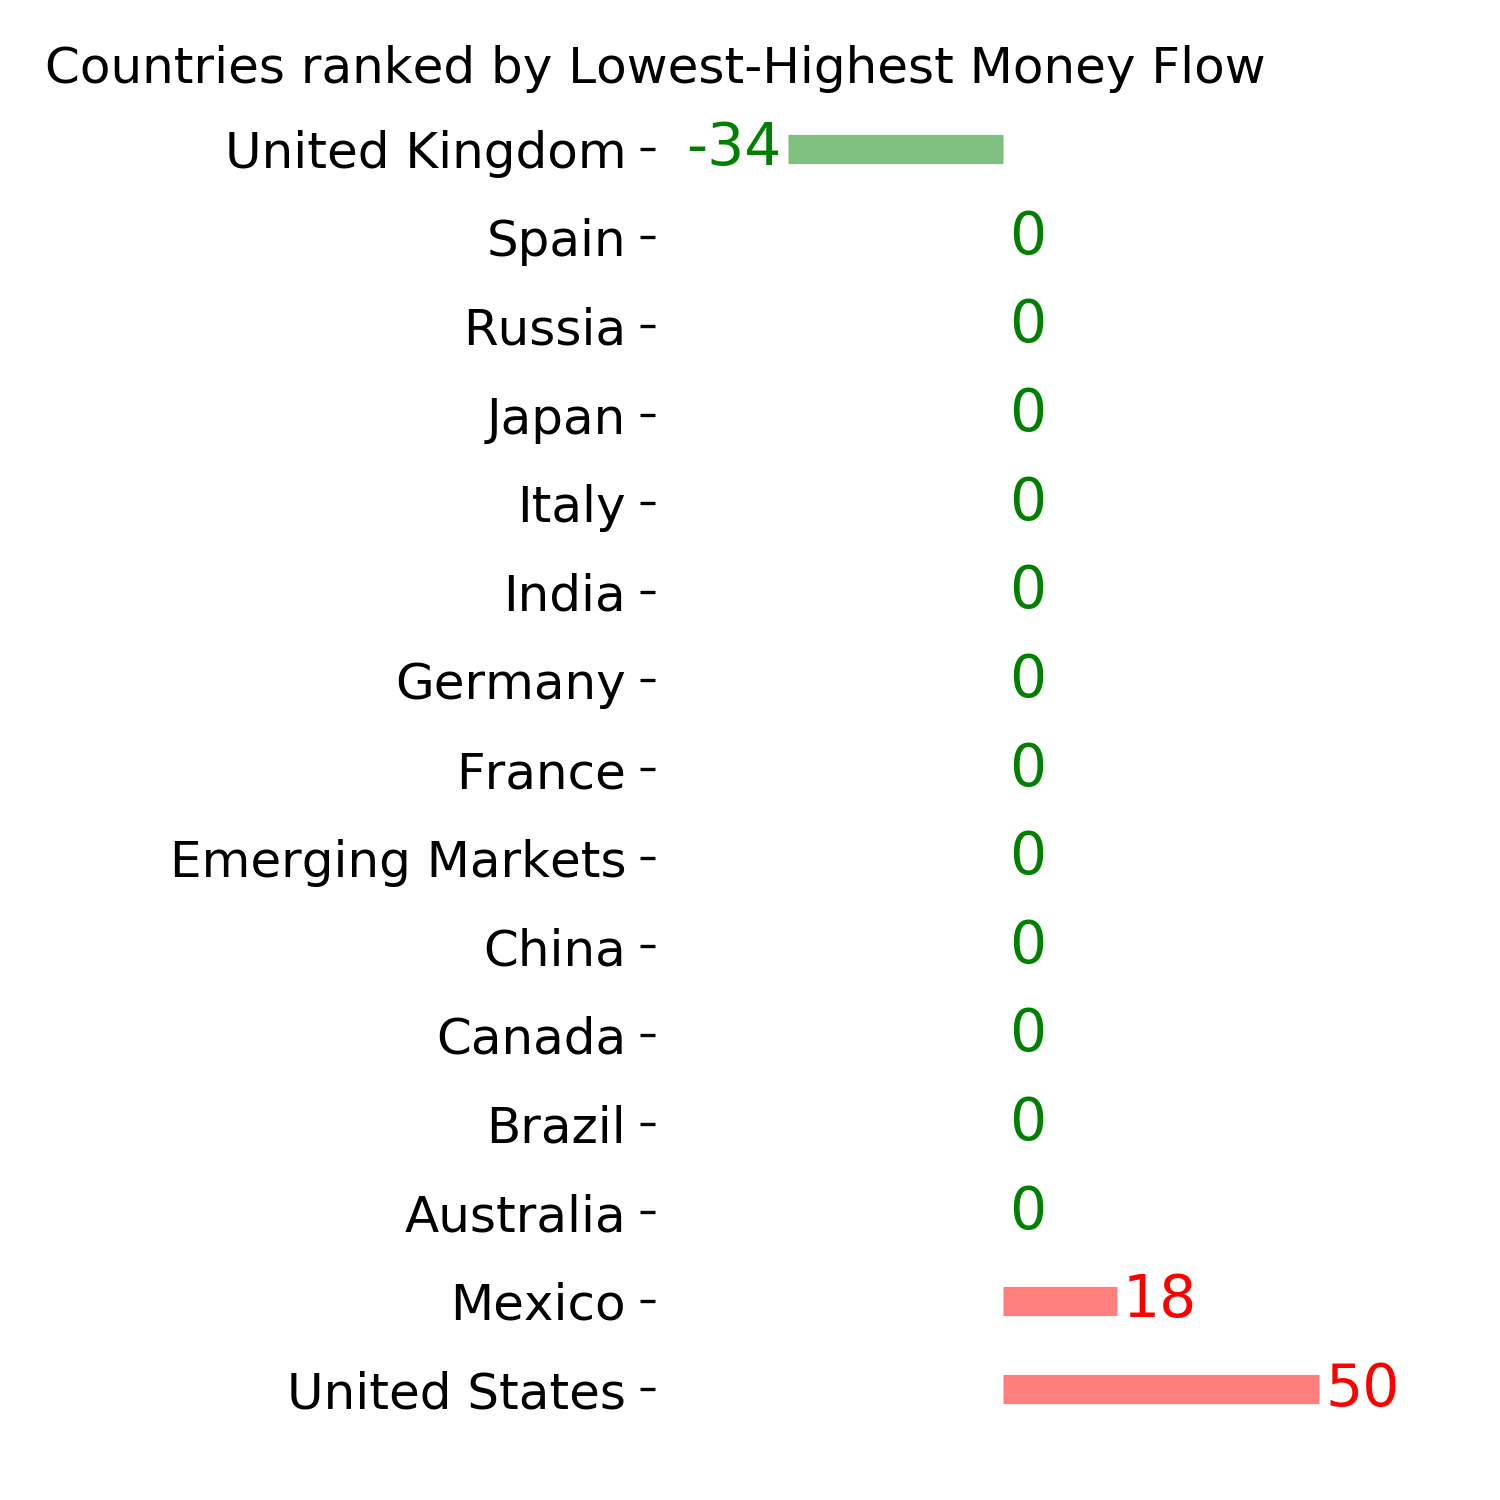
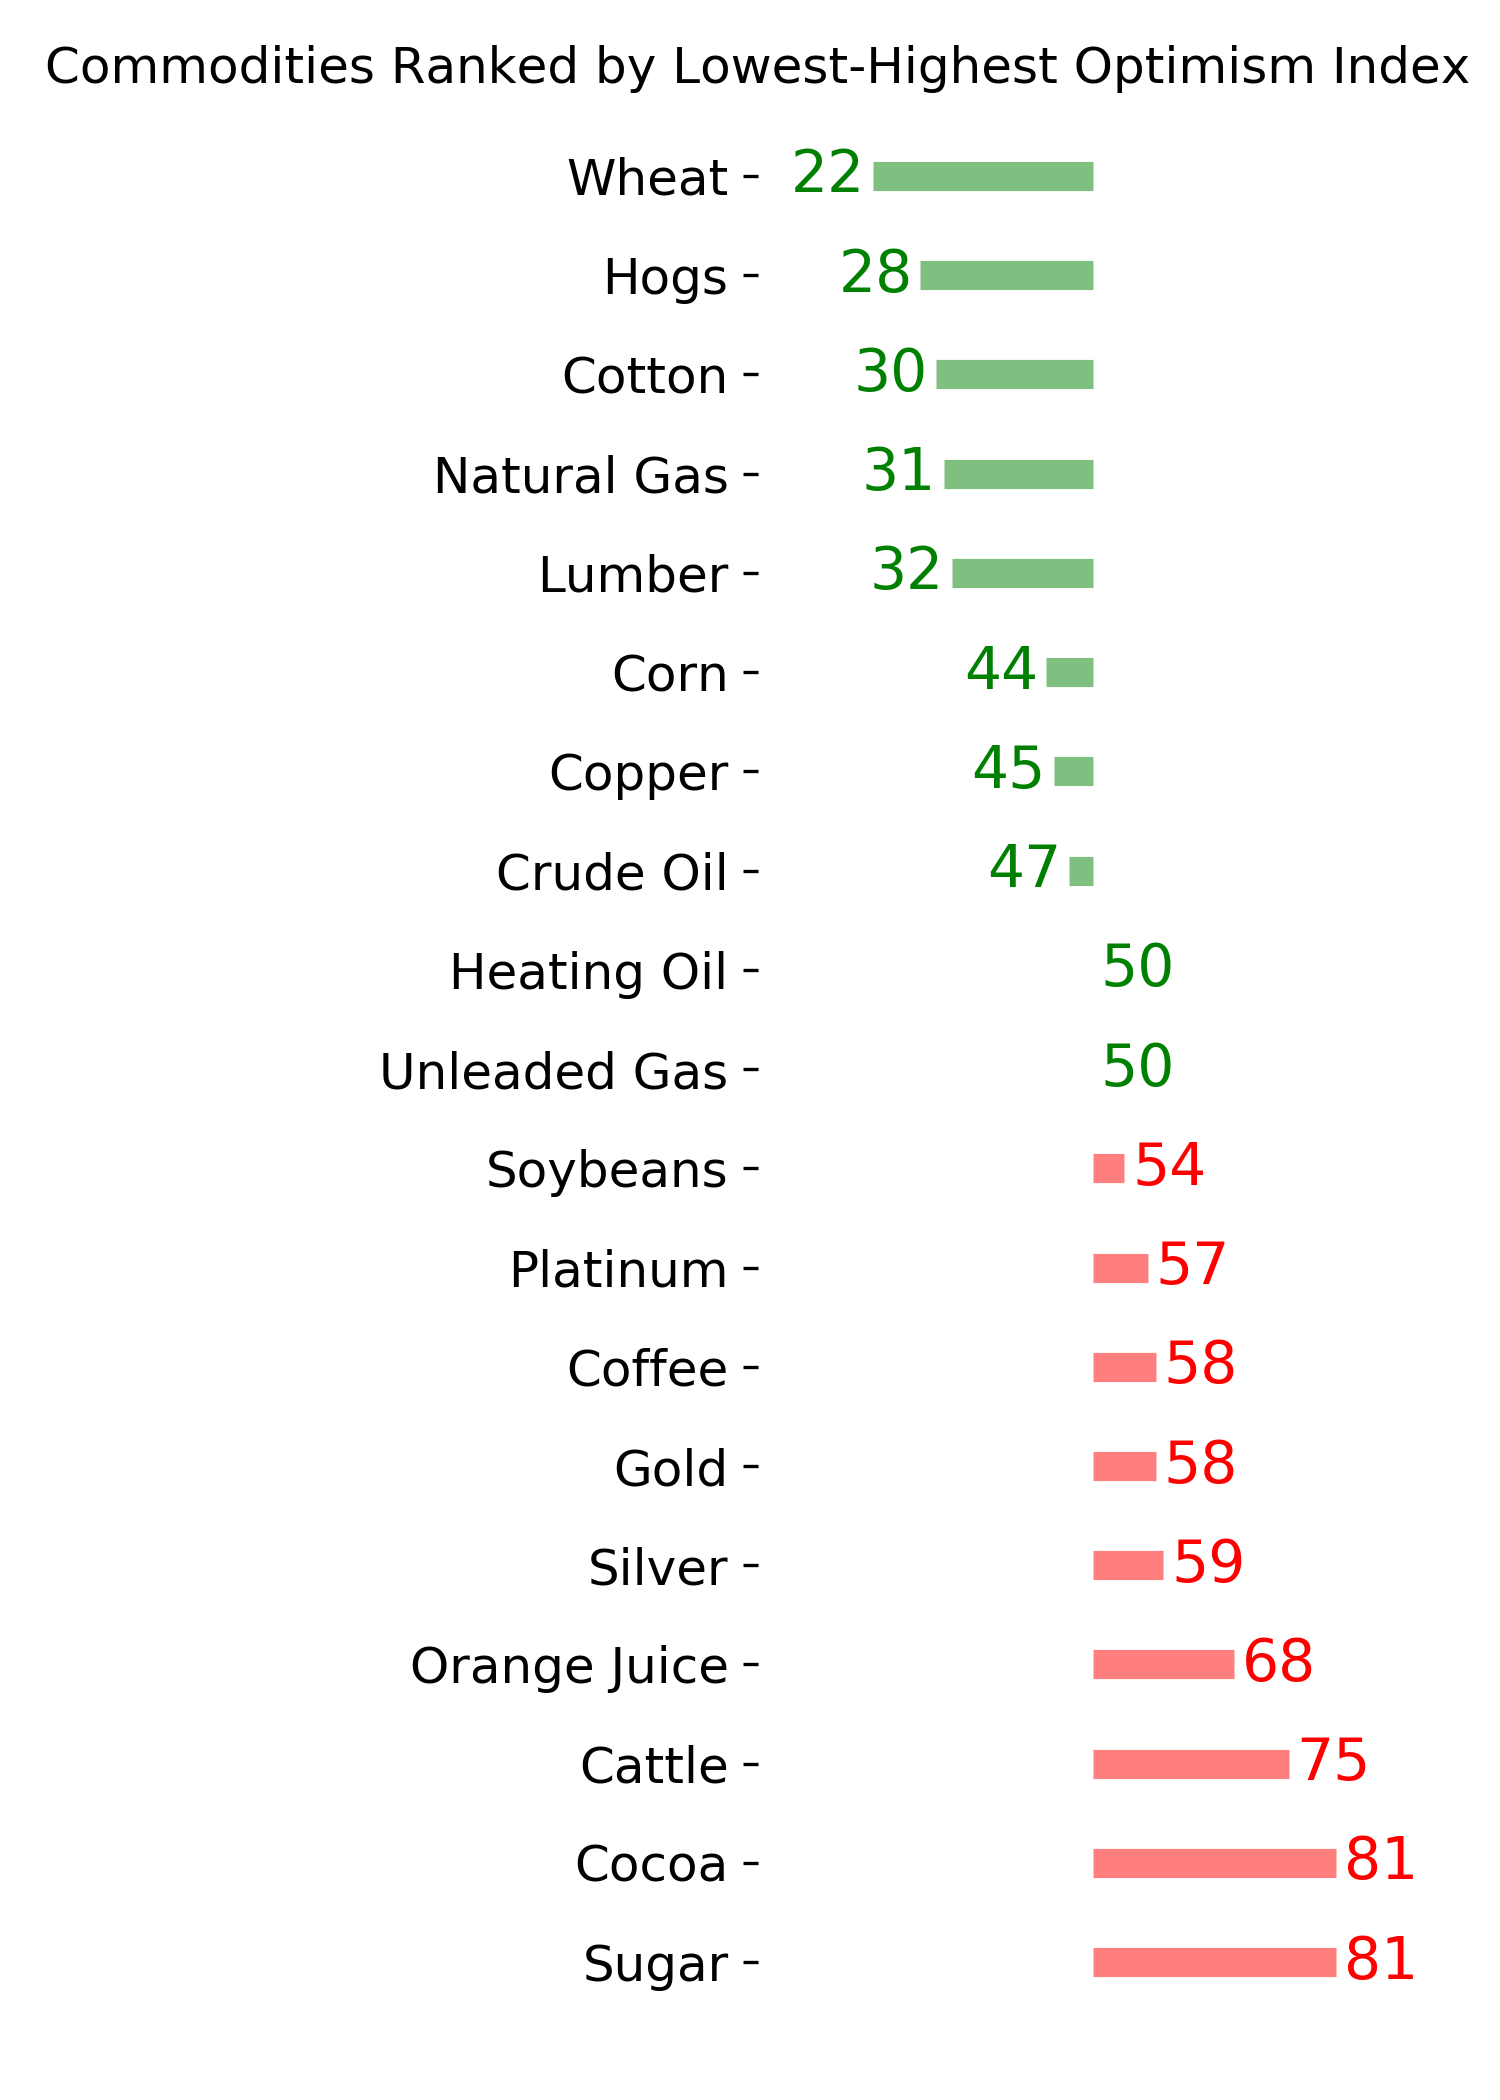
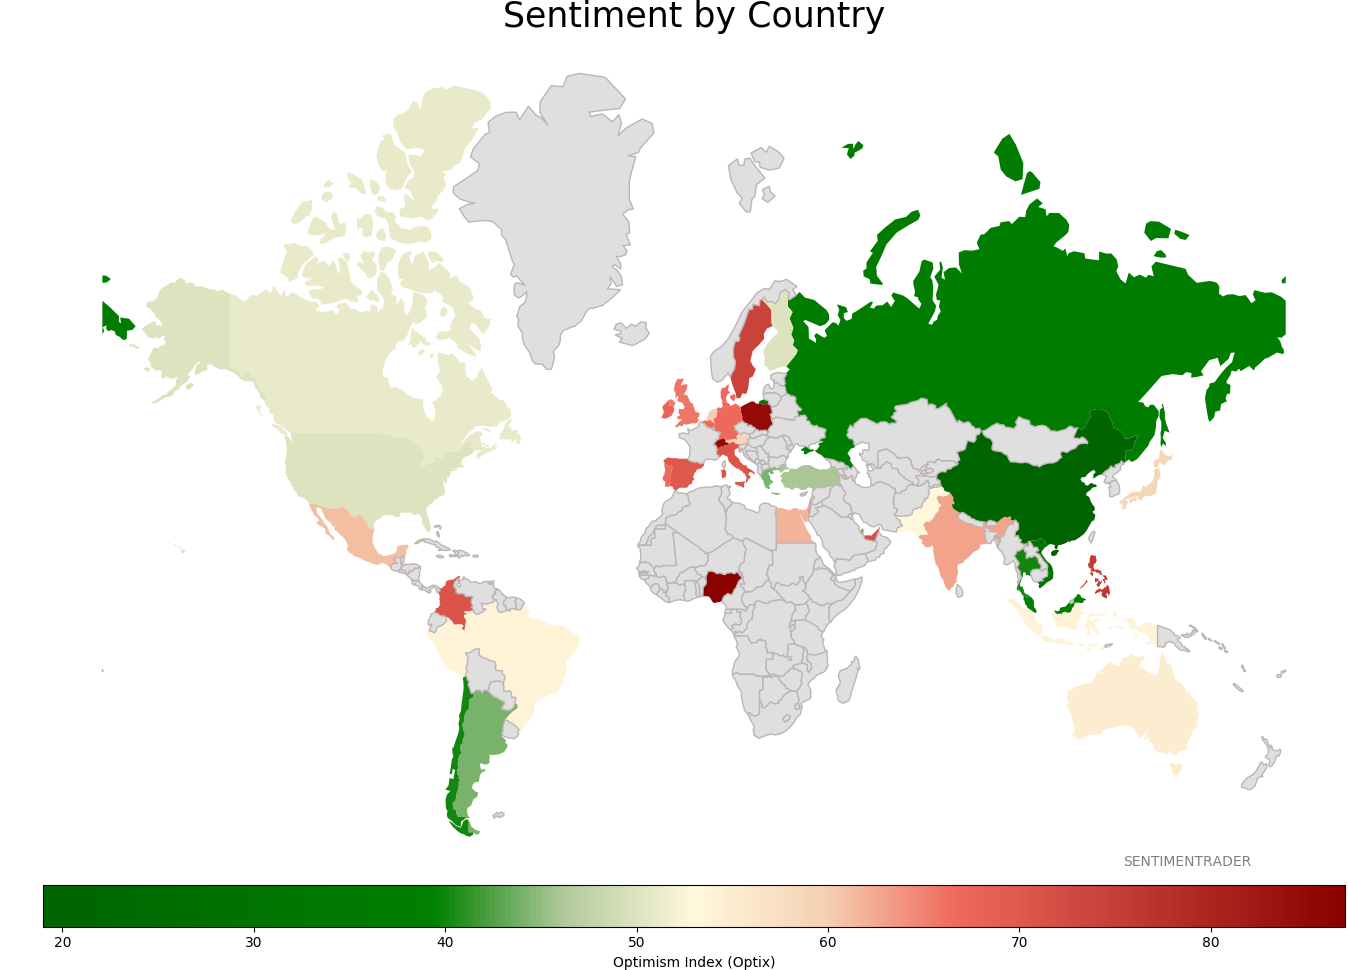
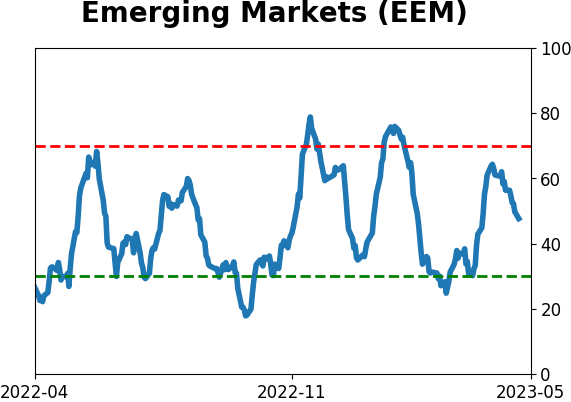
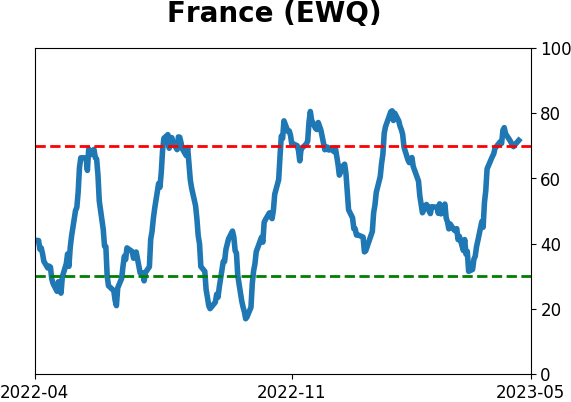
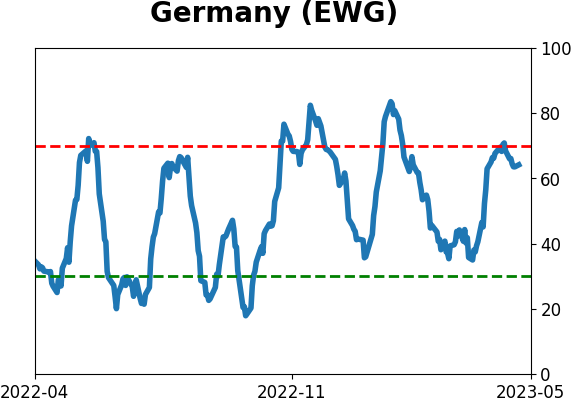
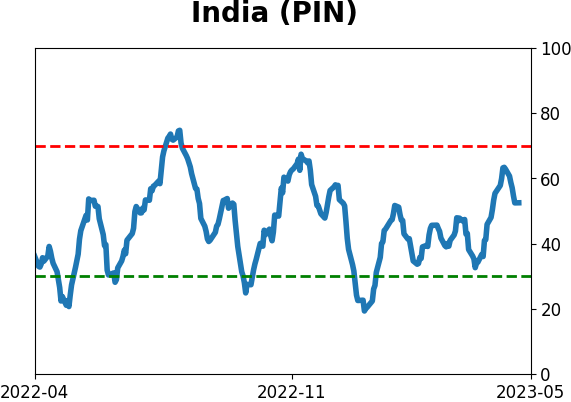
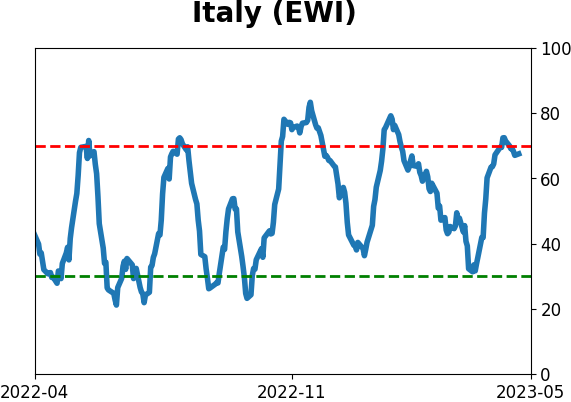
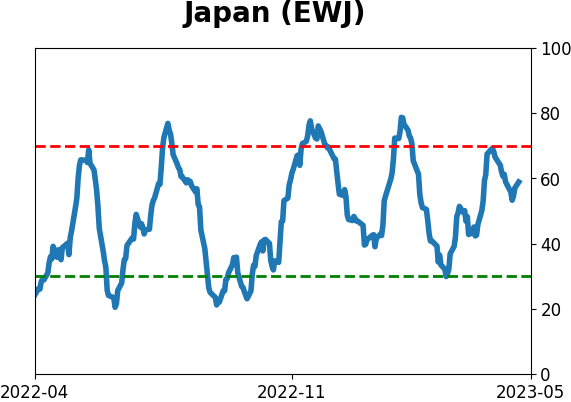
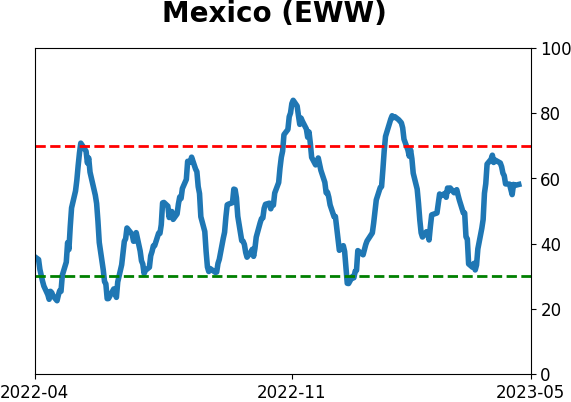
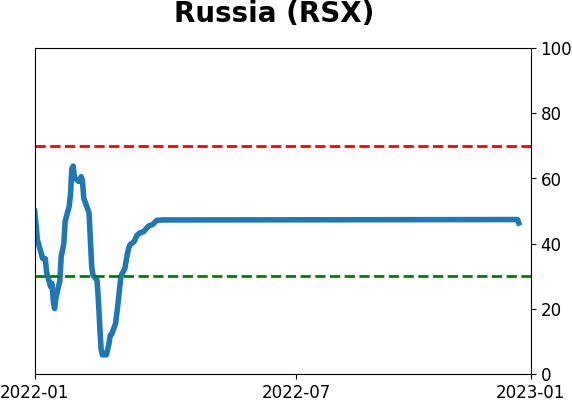
Sentiment Around The World
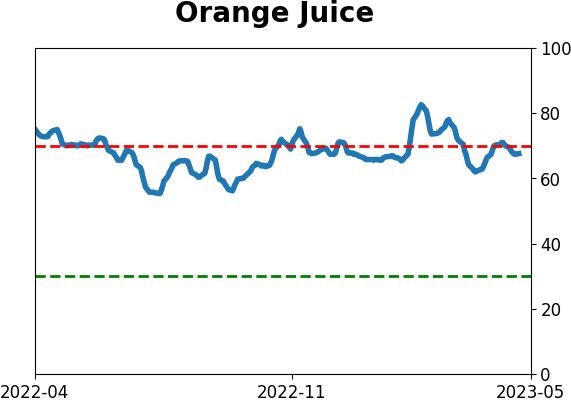
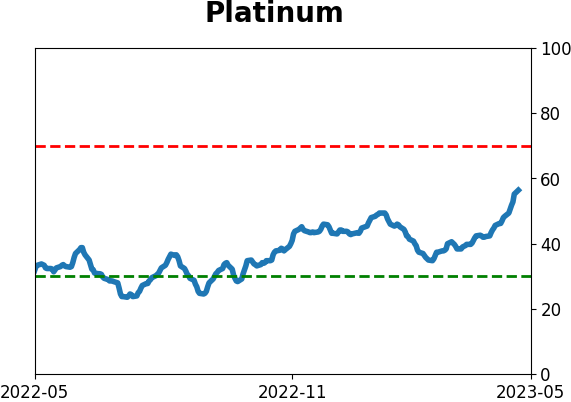
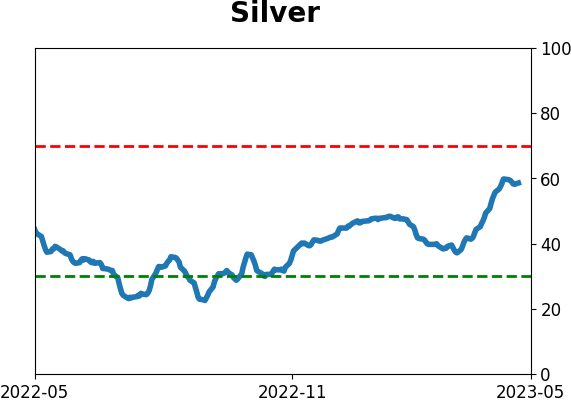
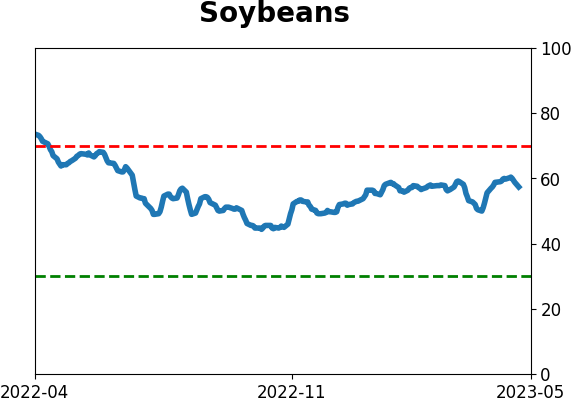
Optimism Index Thumbnails
|
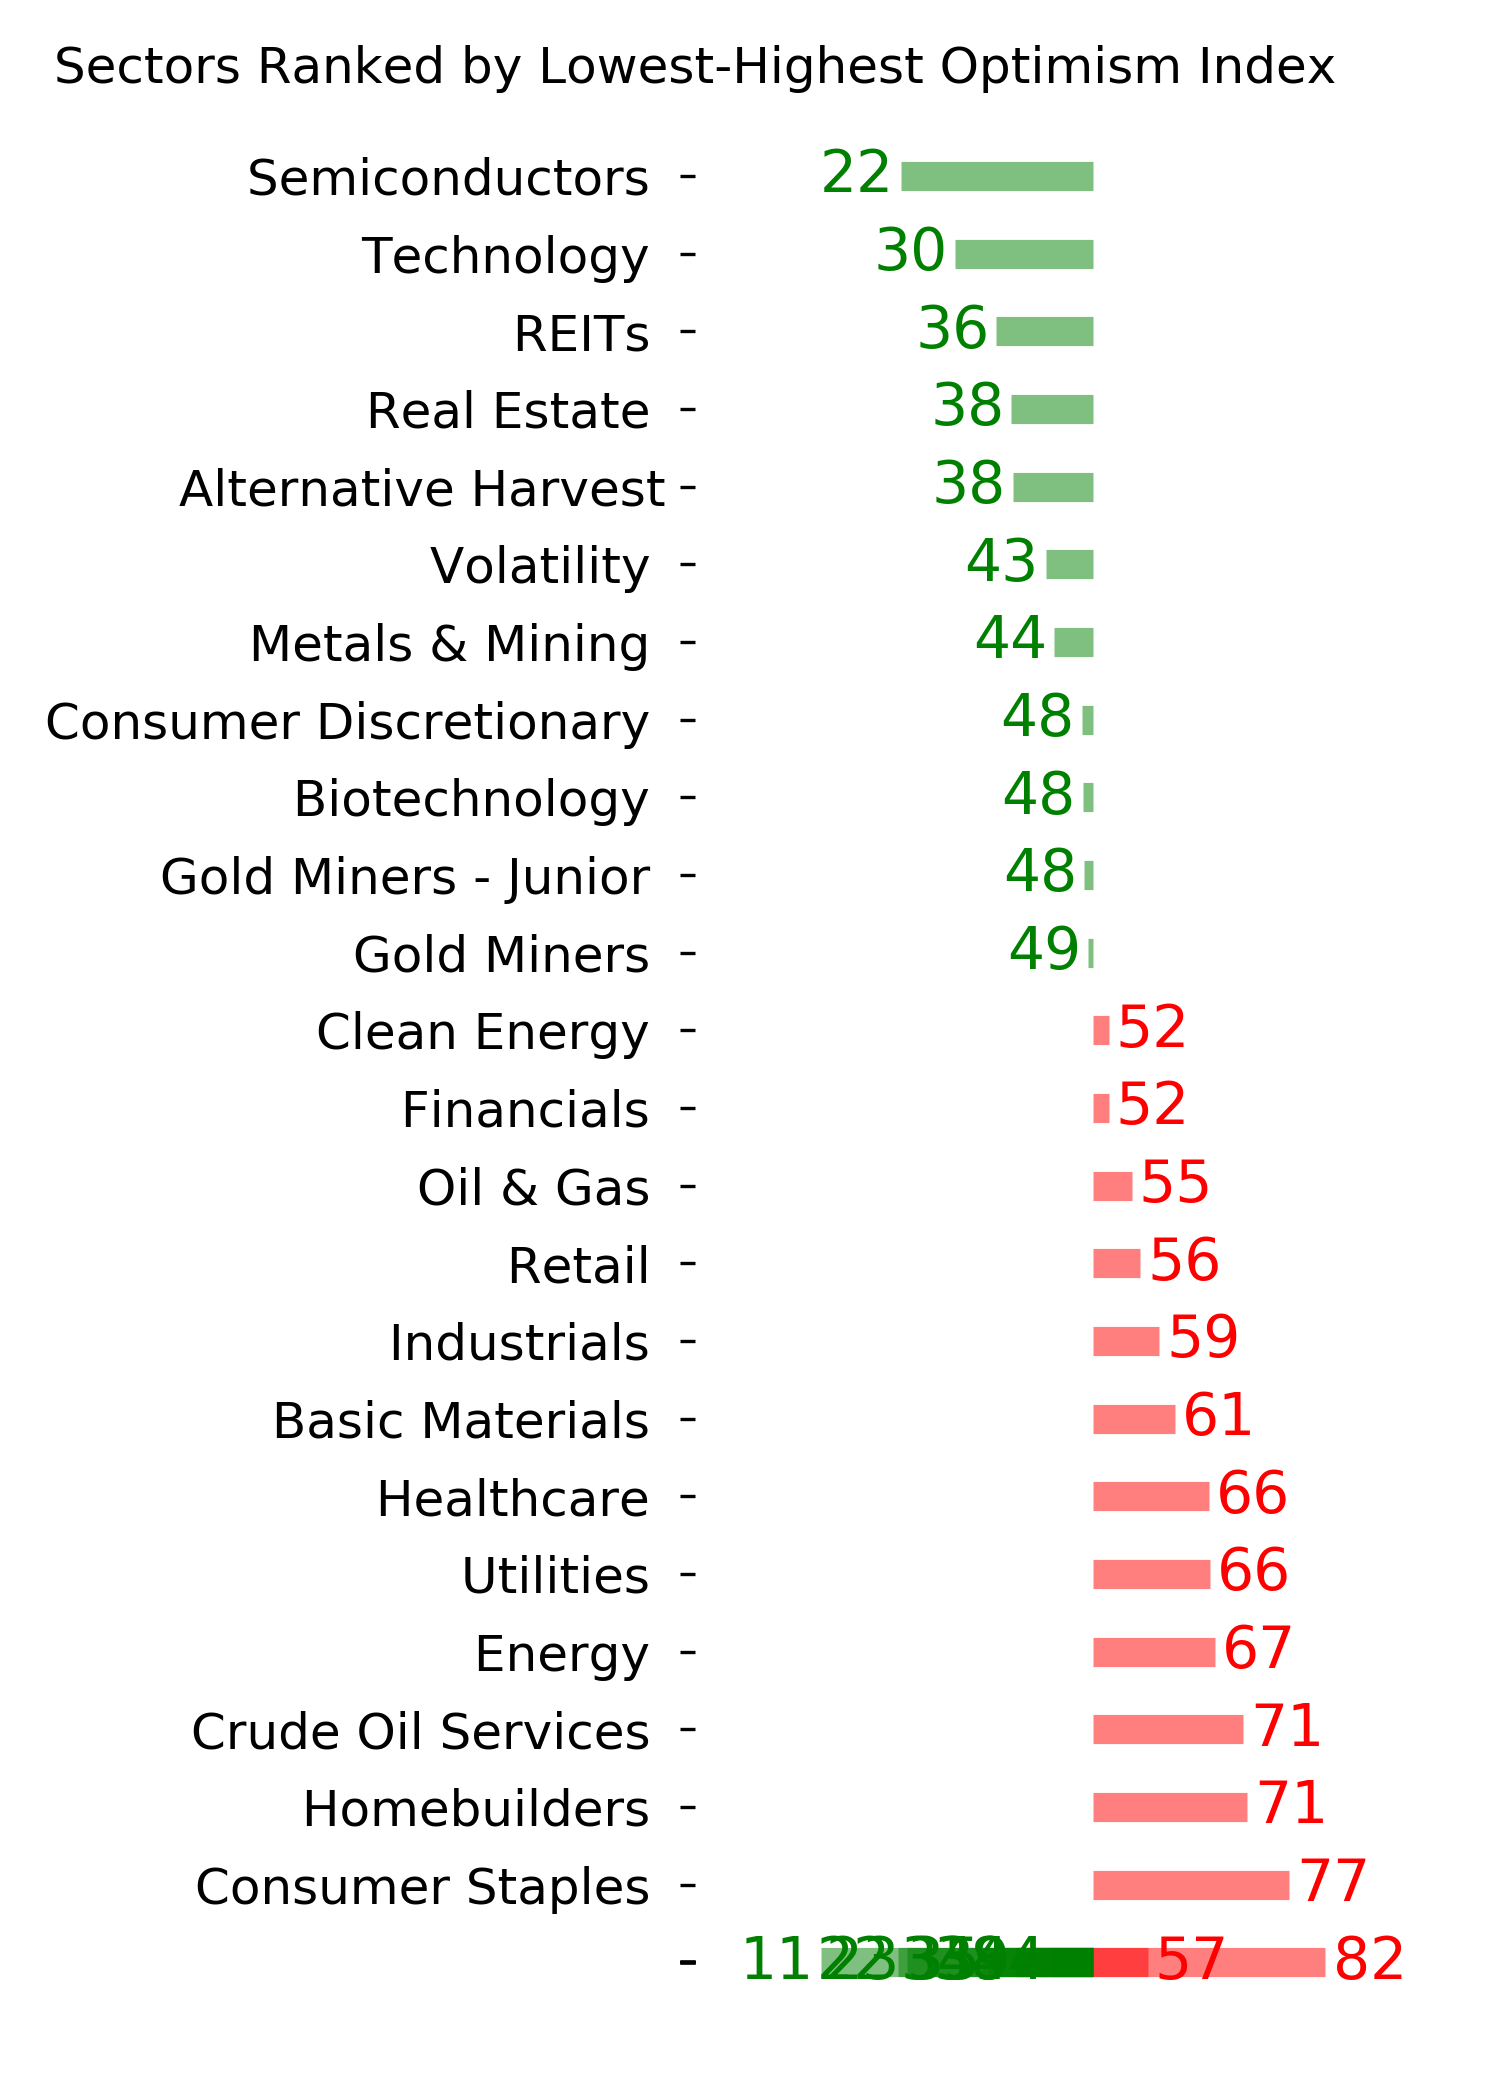
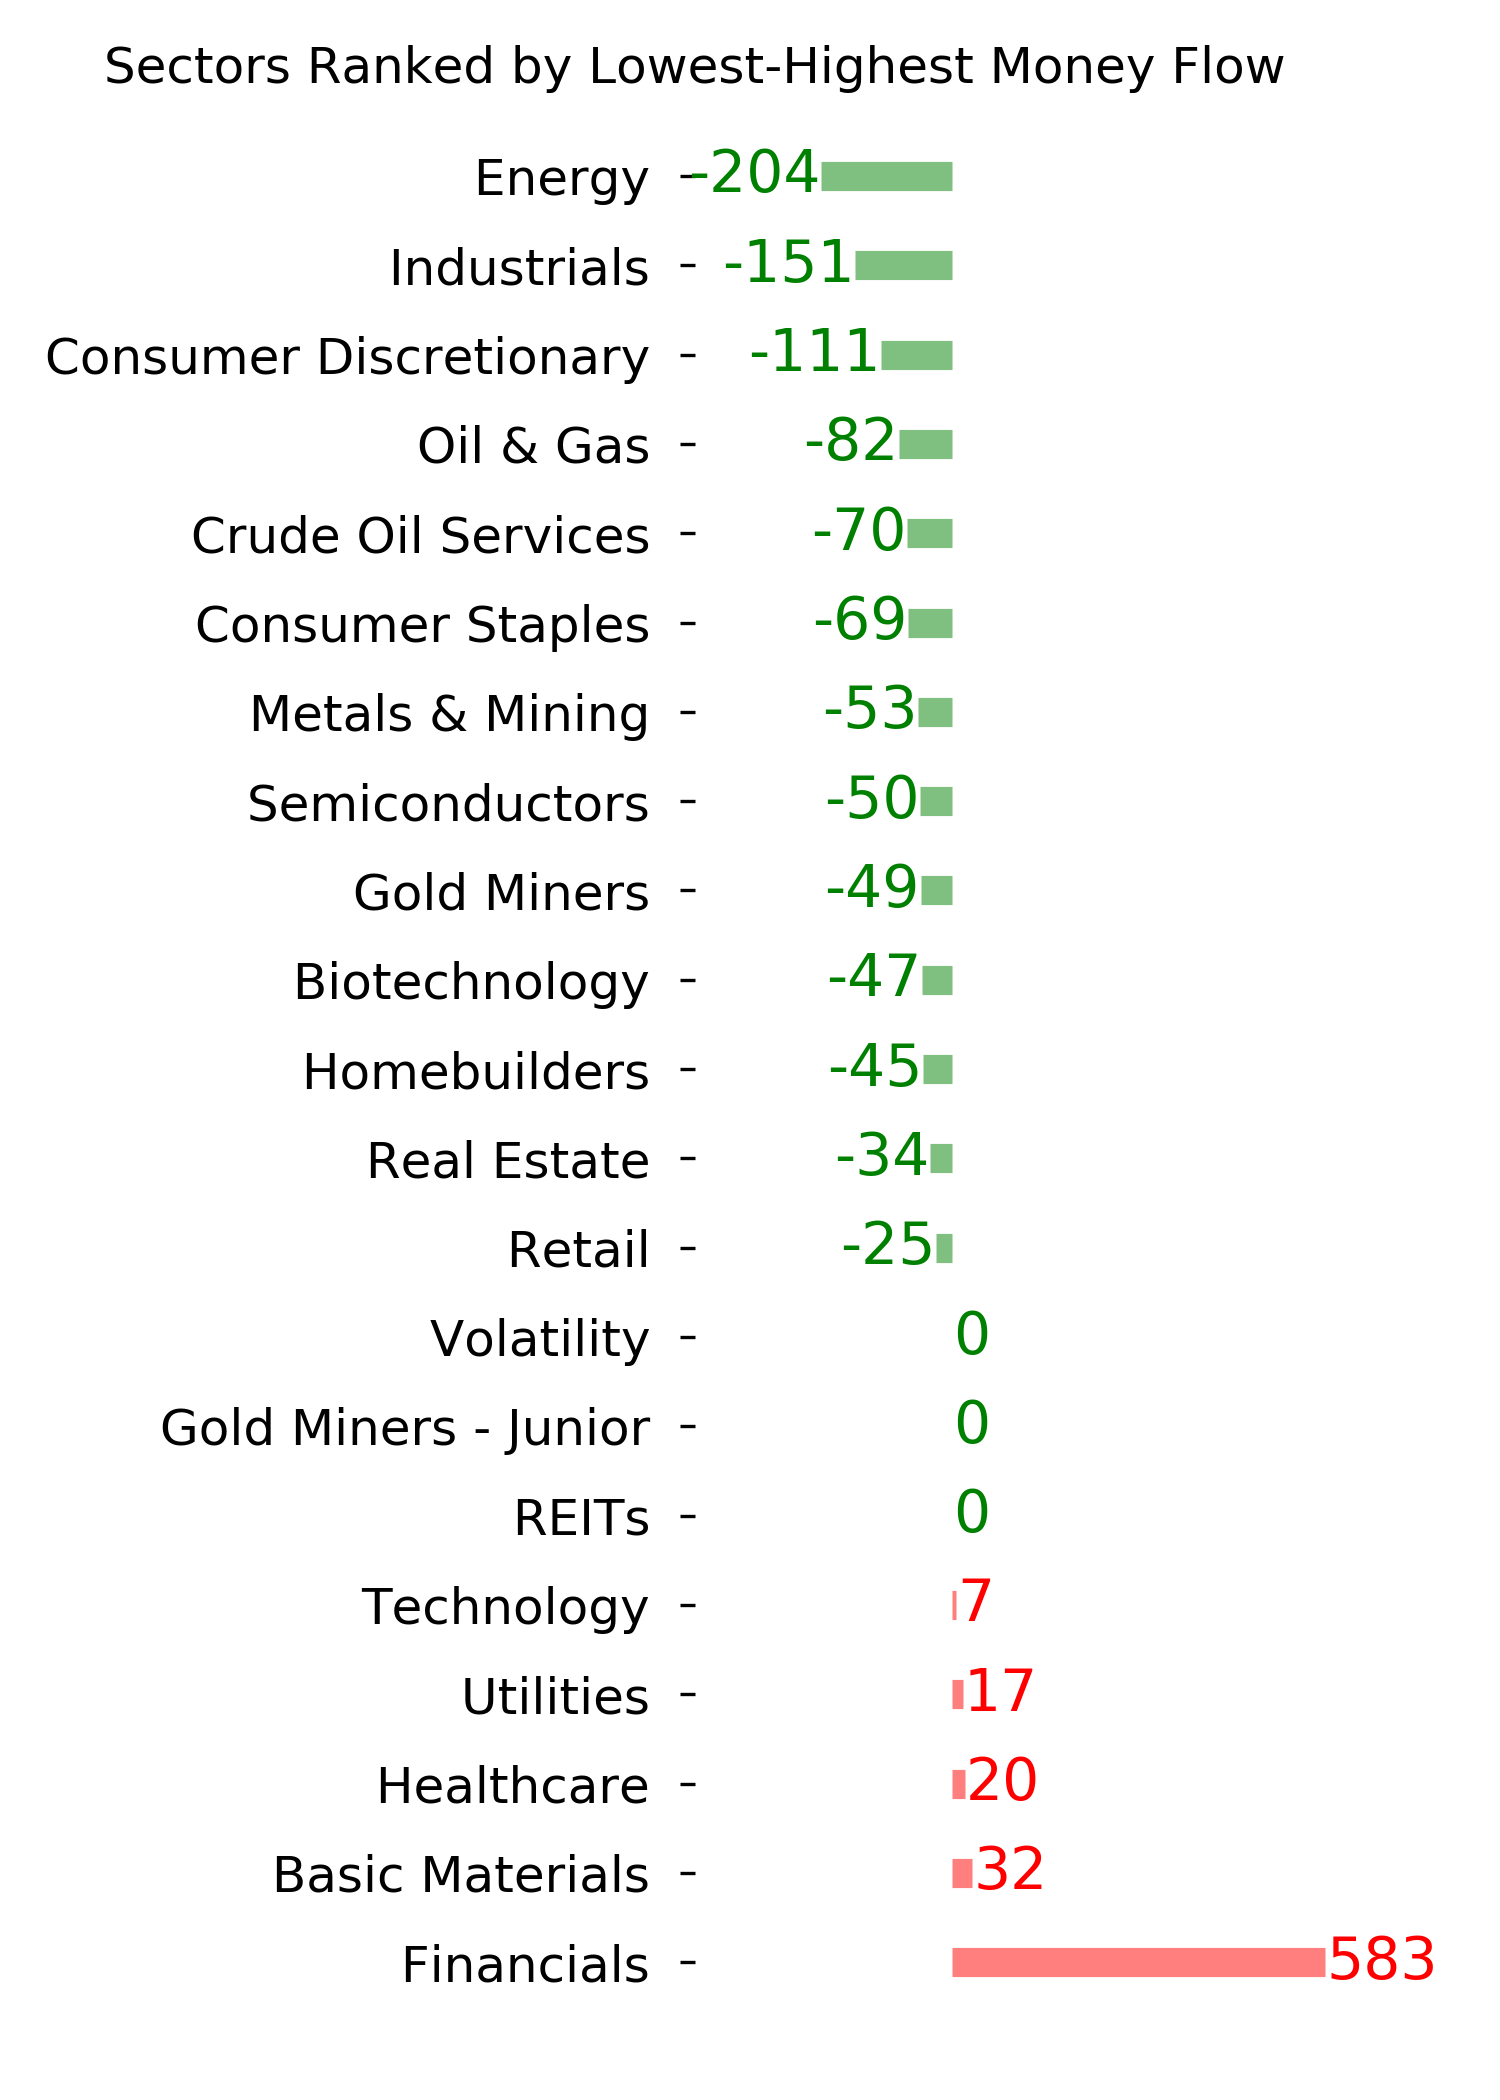
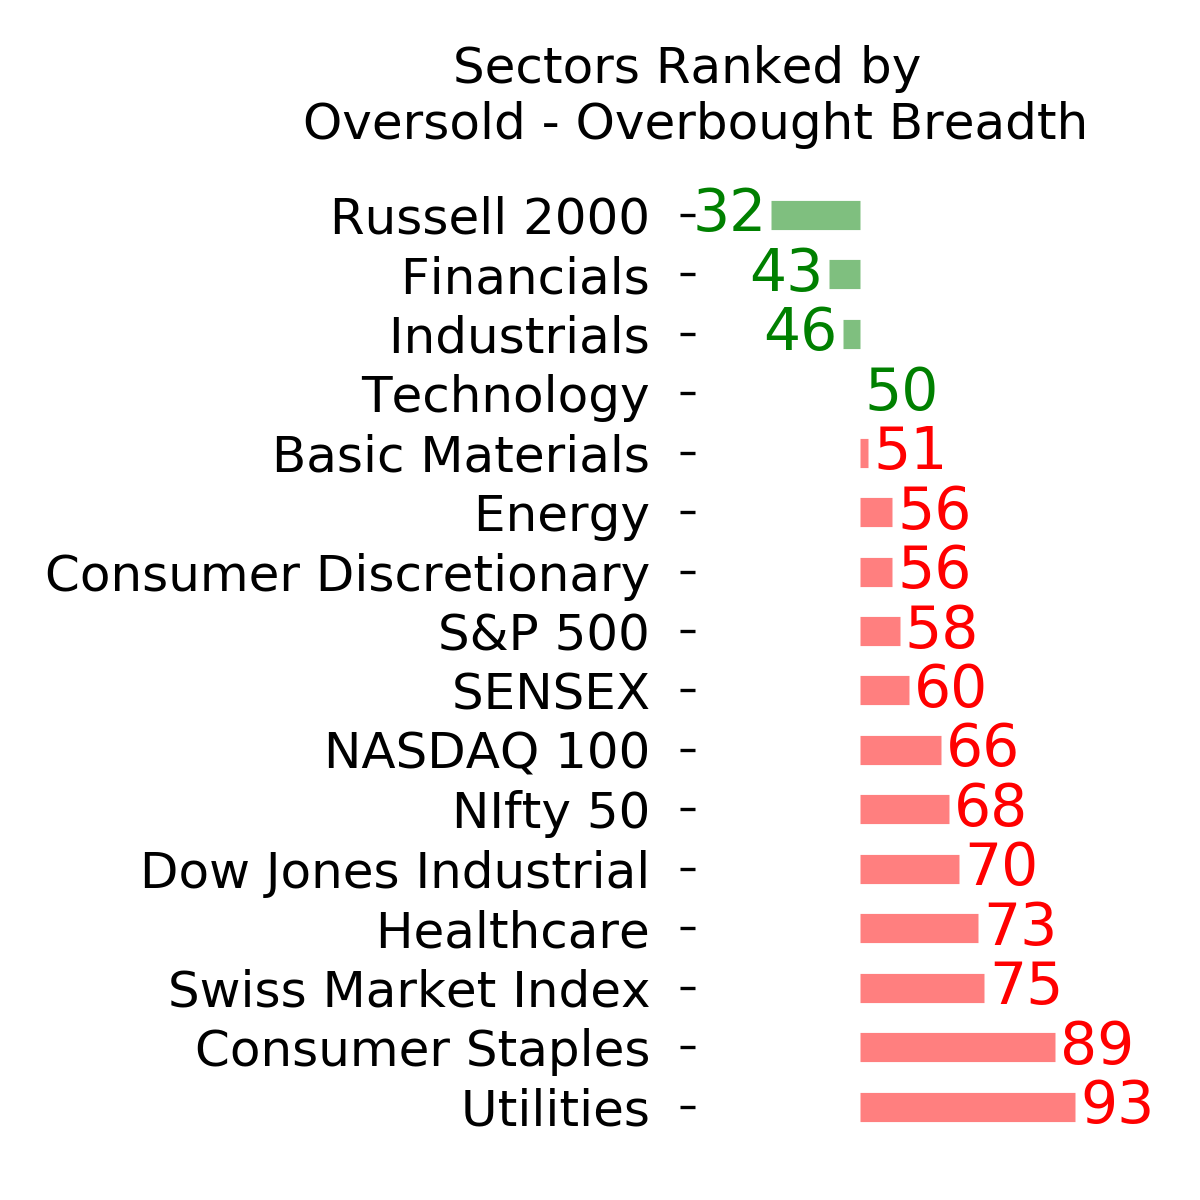
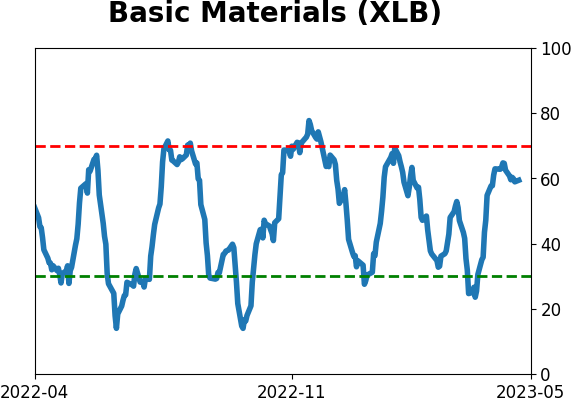
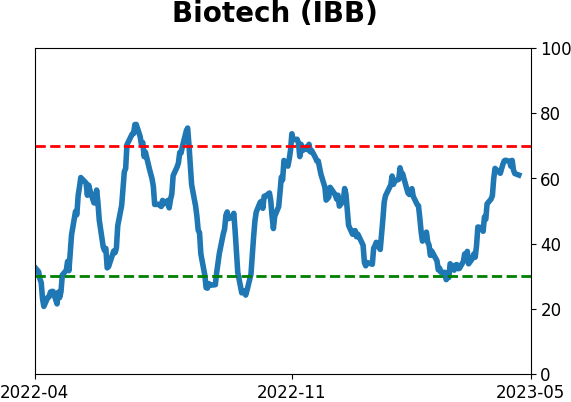
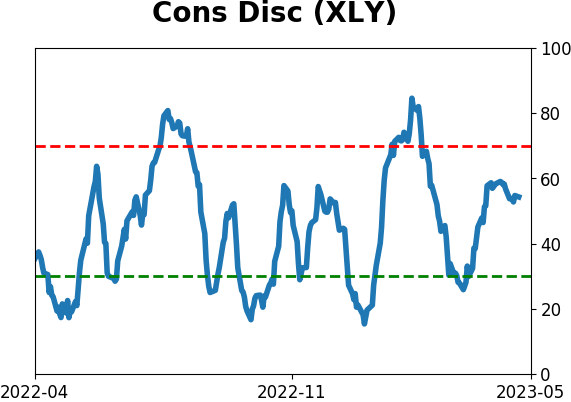
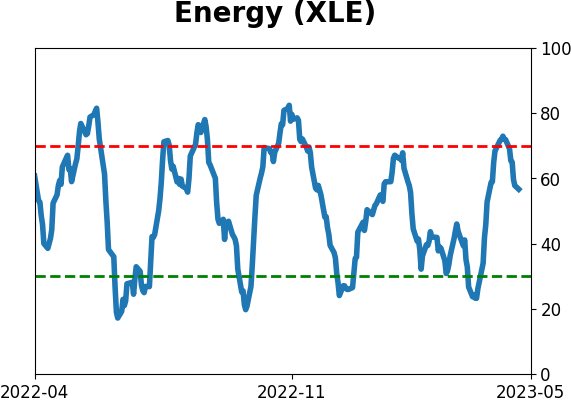
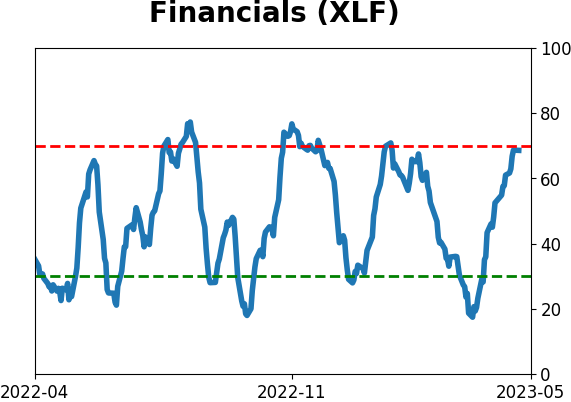
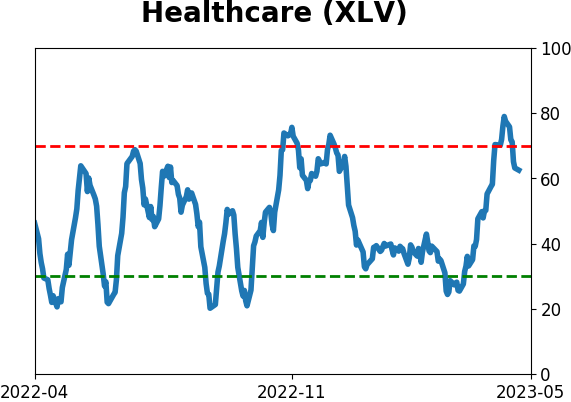
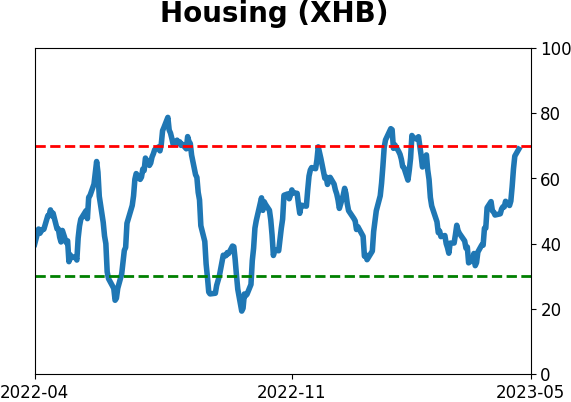
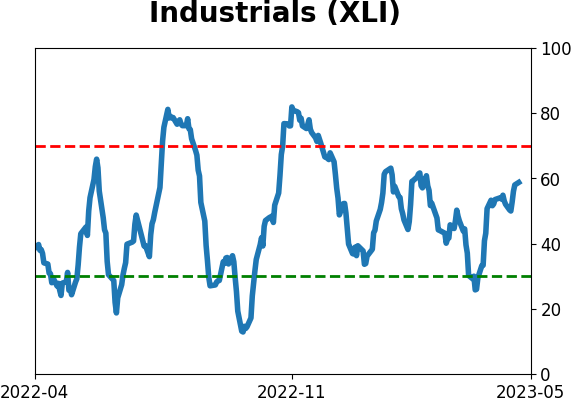
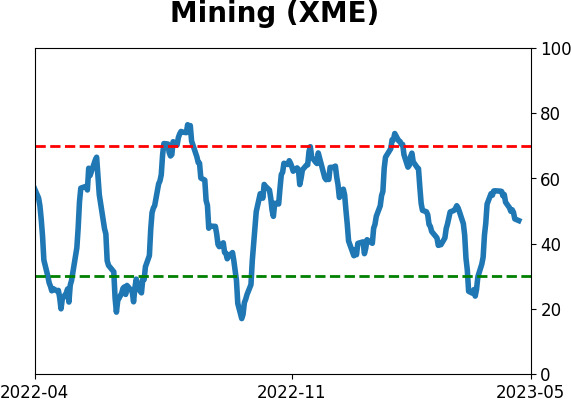
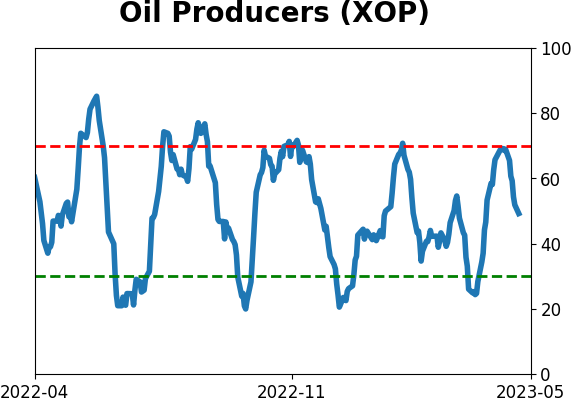
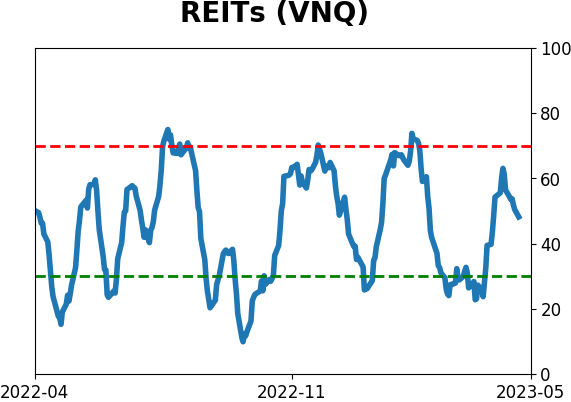
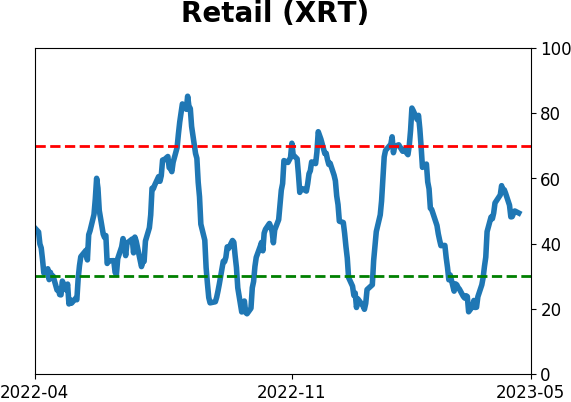
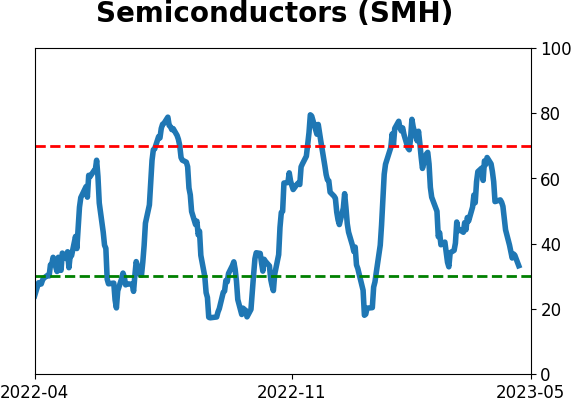
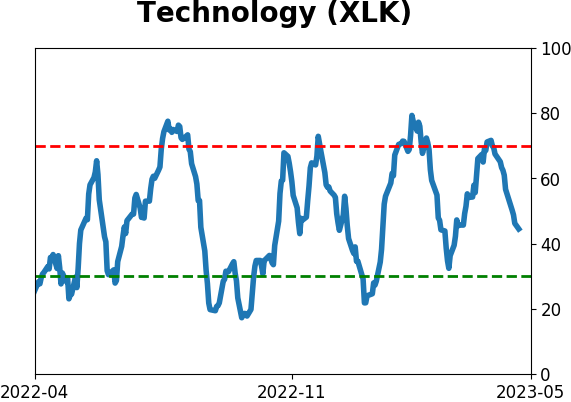
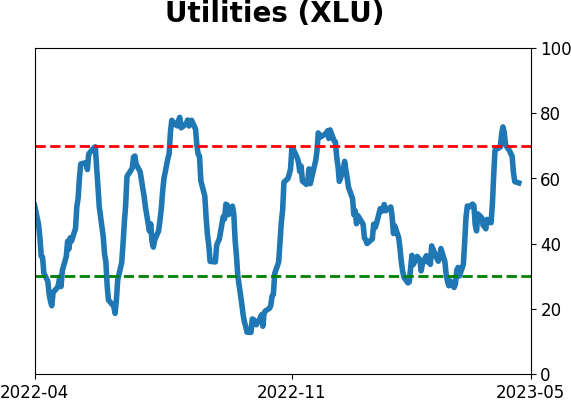
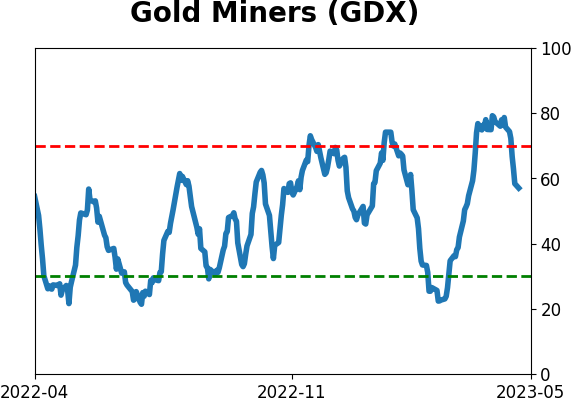
Sector ETF's - 10-Day Moving Average
|
|
|
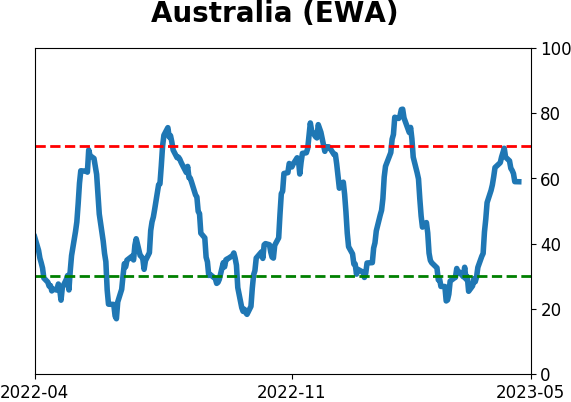
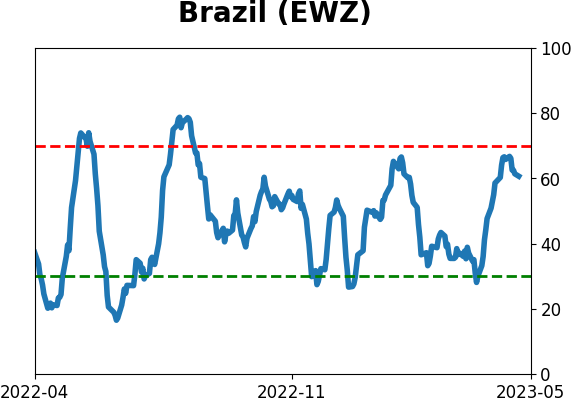
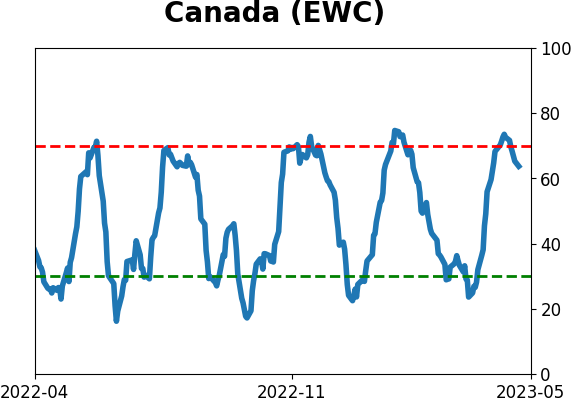
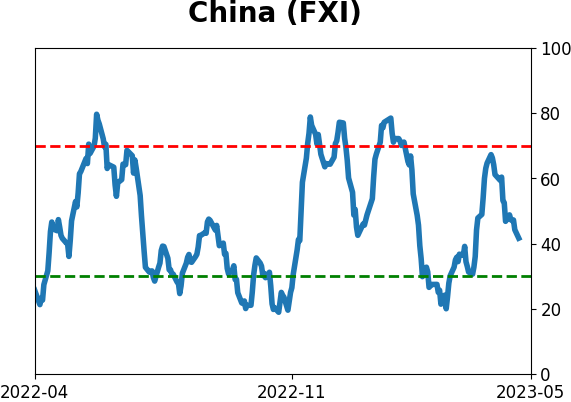
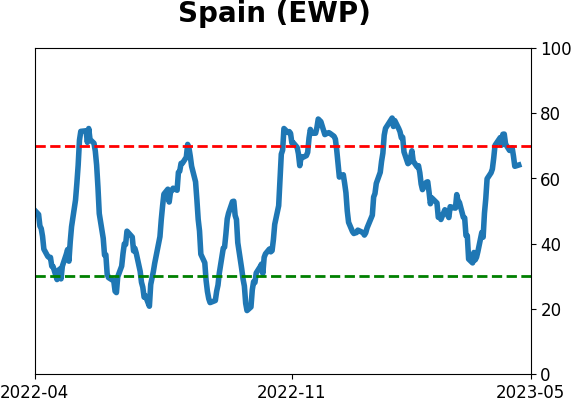
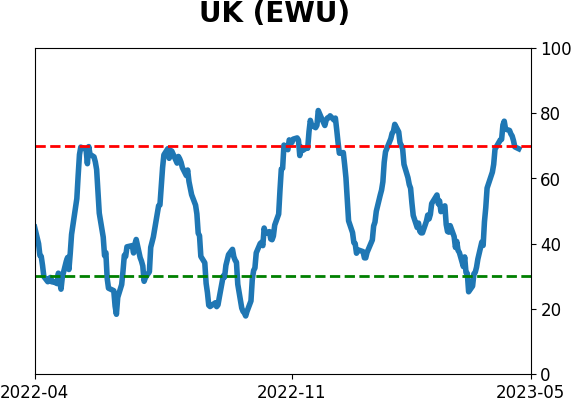
Country ETF's - 10-Day Moving Average
|
|
|
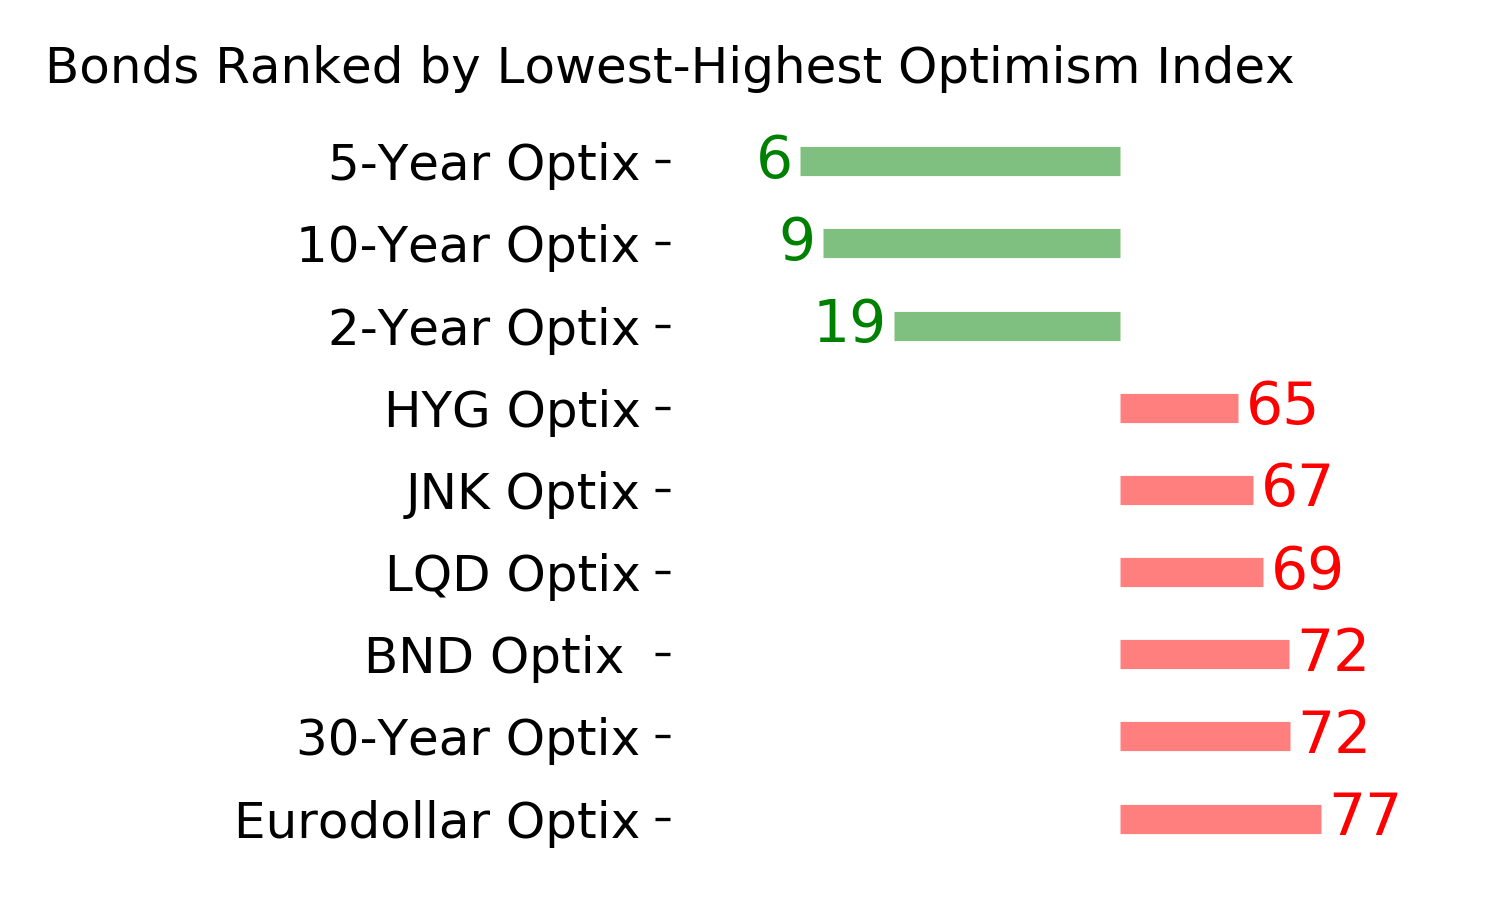
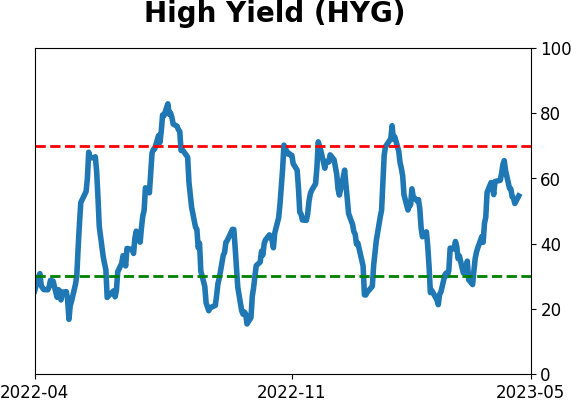
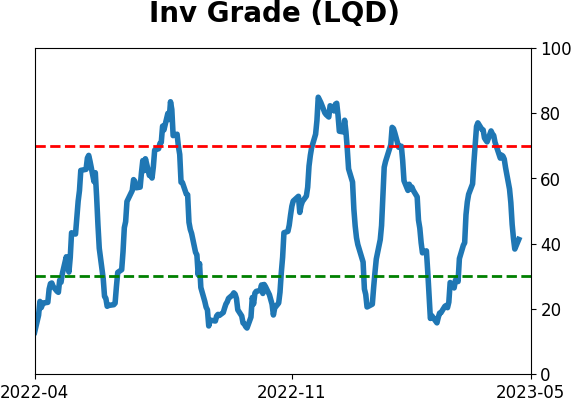
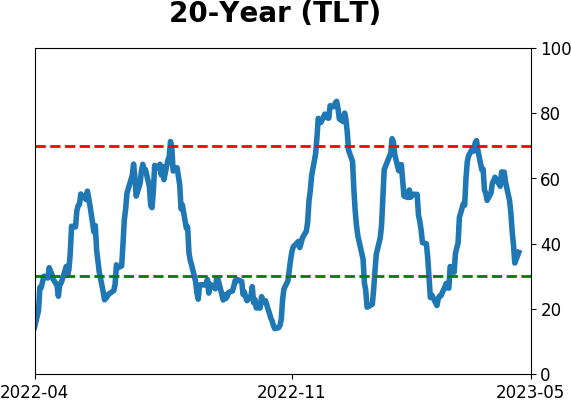
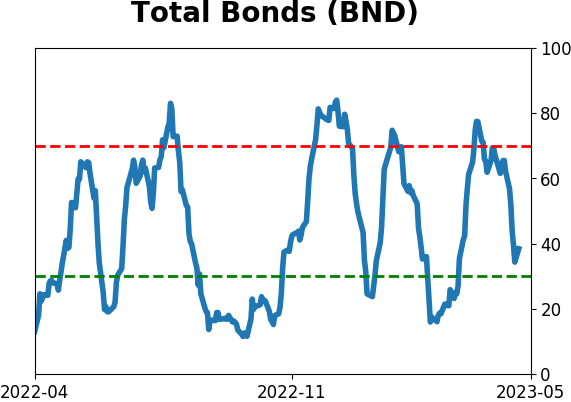
Bond ETF's - 10-Day Moving Average
|
|
|
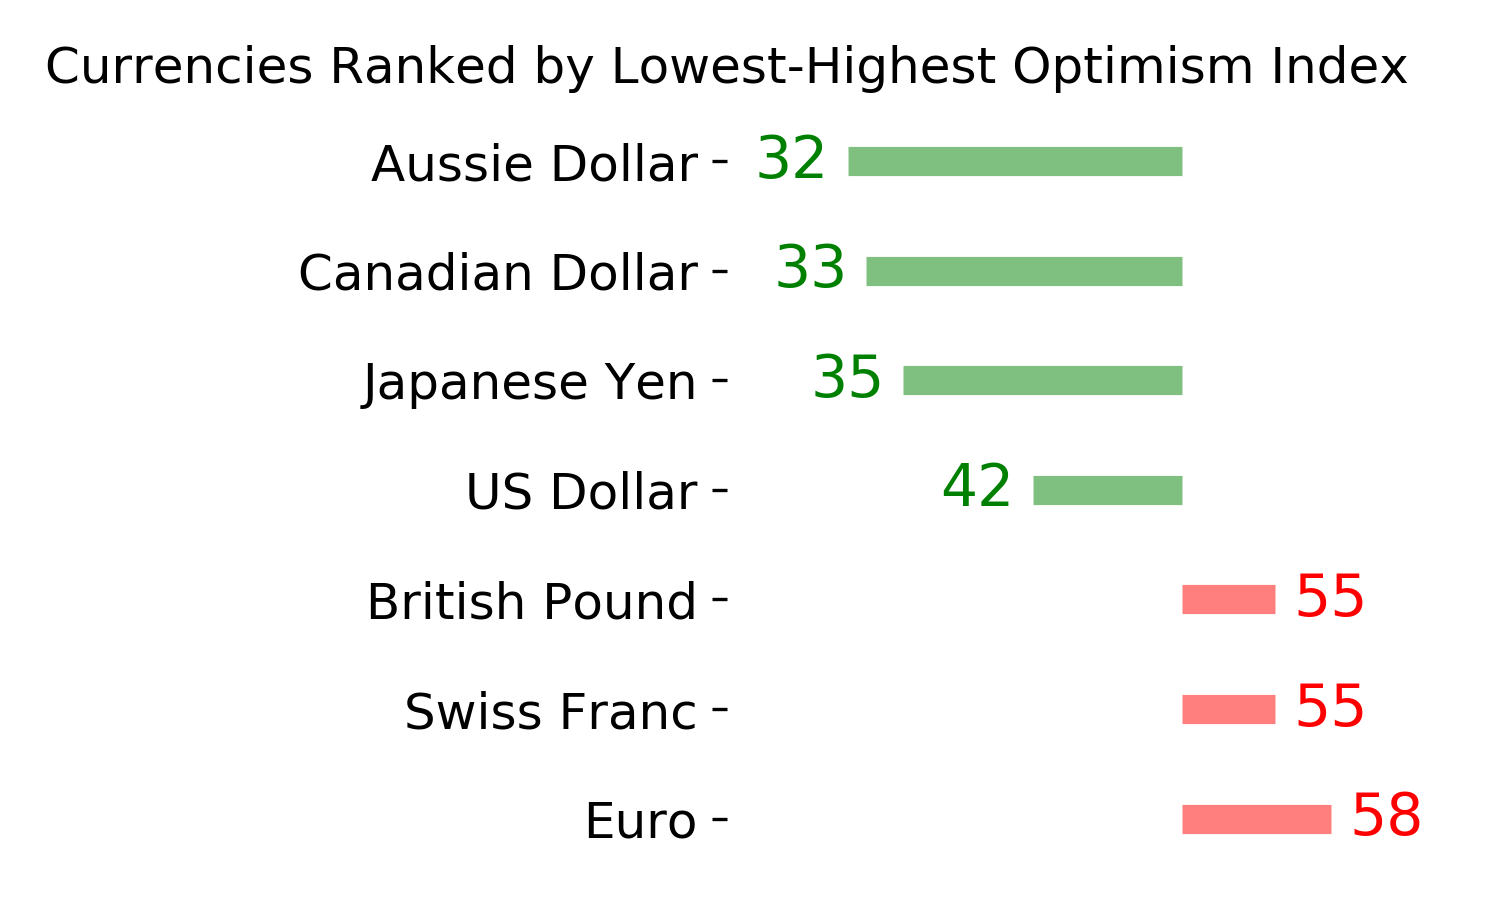
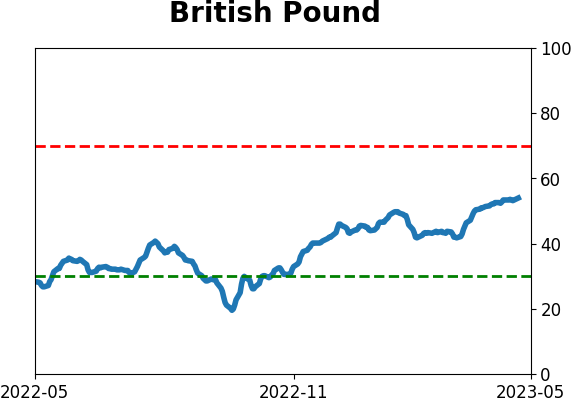
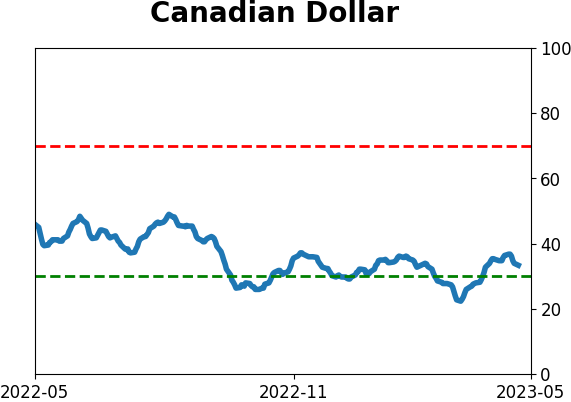
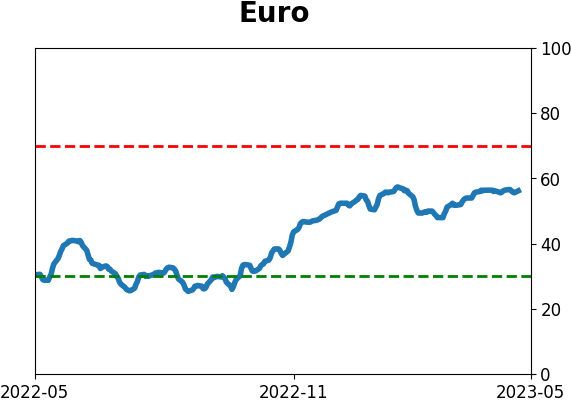
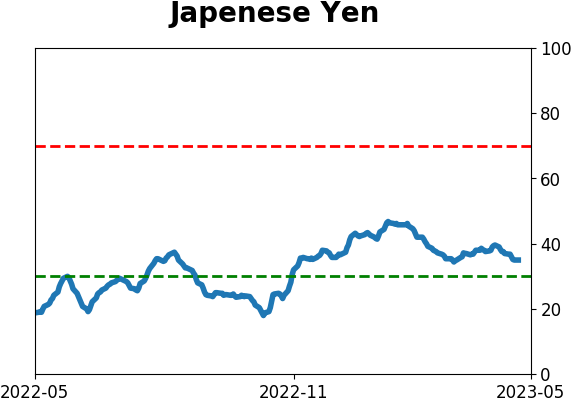
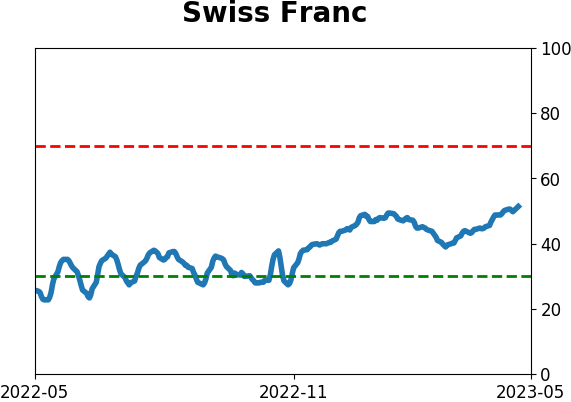
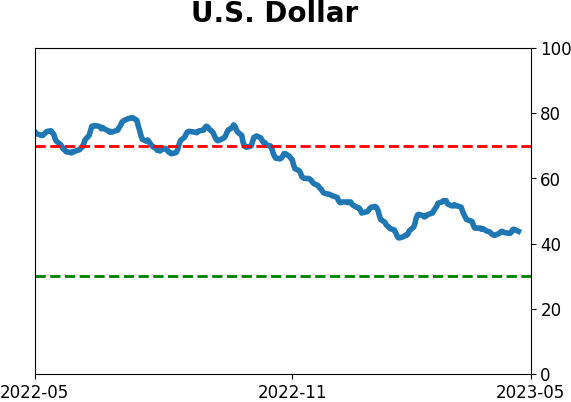
Currency ETF's - 5-Day Moving Average
|
|
|
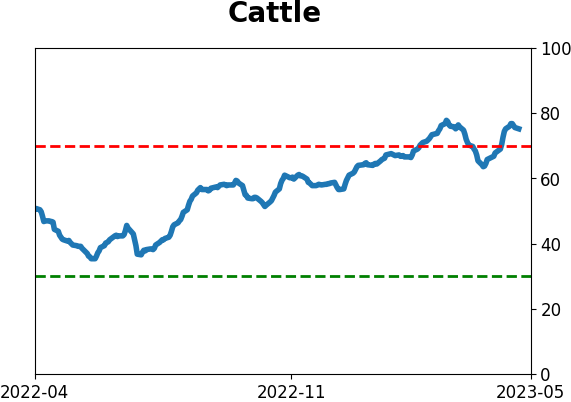
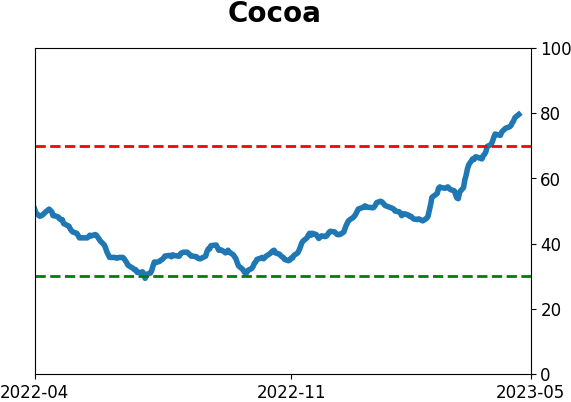
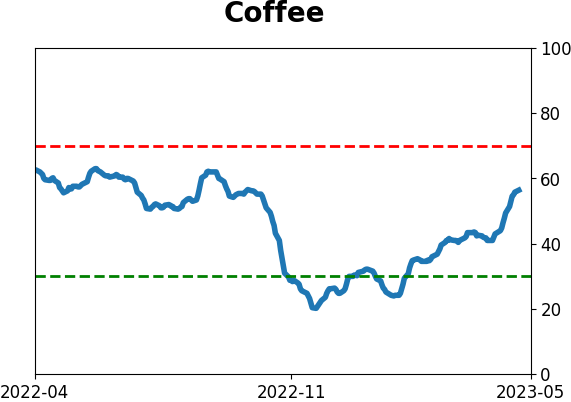
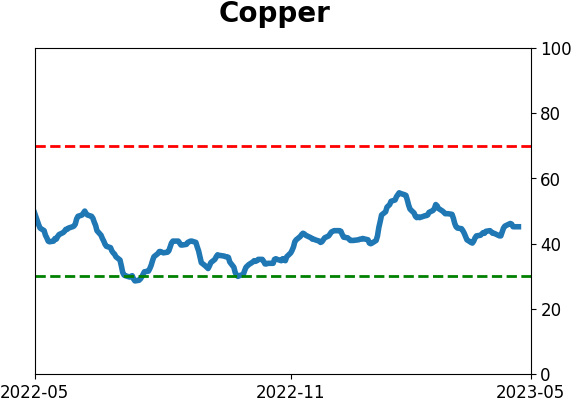
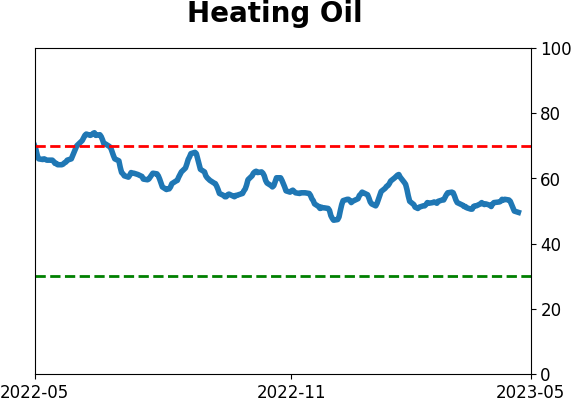
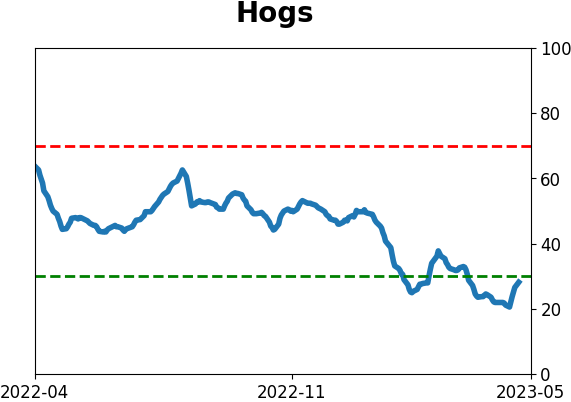
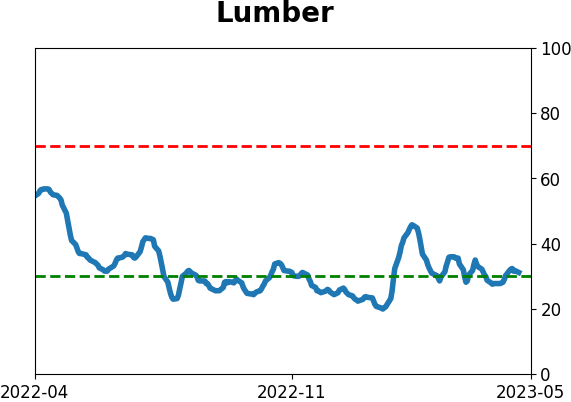
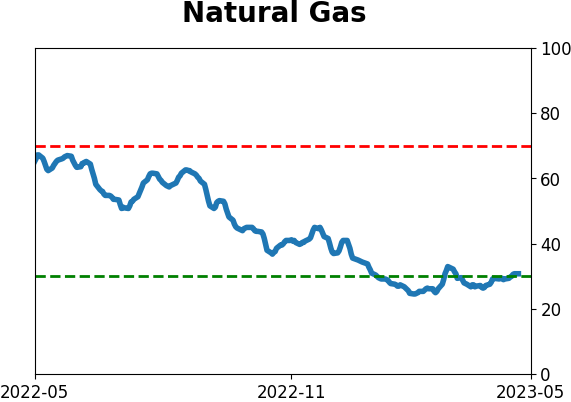
Commodity ETF's - 5-Day Moving Average
|
|