Daily Report : TradingEdge Weekly for Apr 22 - Split conditions return, high and rising inflation, energy insiders

| View/Print a PDF version of this Report |
Headlines
|
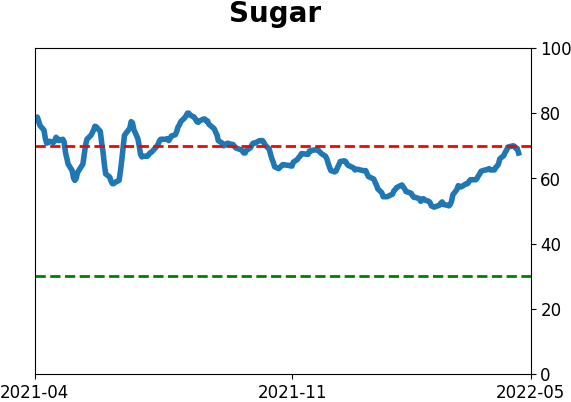
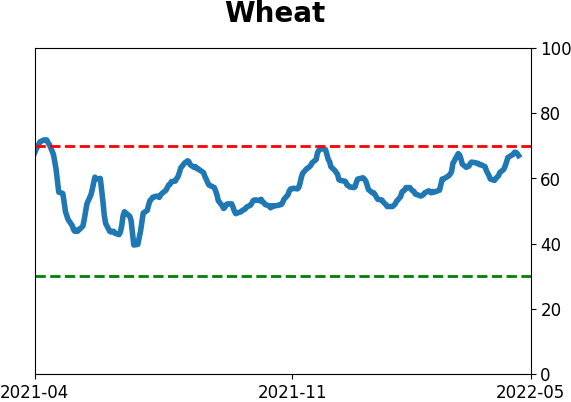
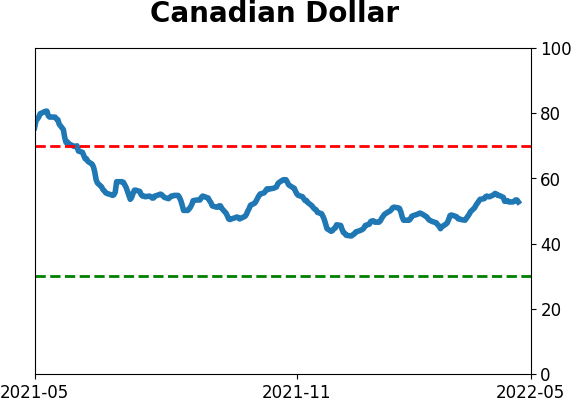
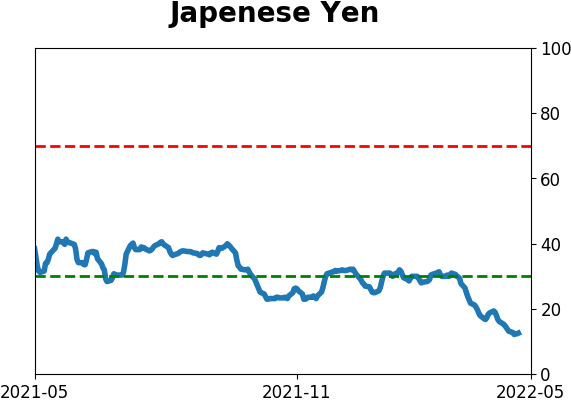
TradingEdge Weekly for Apr 22 - Split conditions return, high and rising inflation, energy insiders: This week, we saw more evidence of a split stock market, with too many issues at 52-week highs or 52-week lows. The Nasdaq 100 has gone from year-over-year gains of more than 50% to a negative return. The yield curve has suddenly surged while investors battle high and rising inflation. Optimism on natural gas is too high, and energy company insiders are selling. The commodities boom is benefiting Latin American countries. The latest Commitments of Traders report was released, covering positions through Tuesday: The 3-Year Min/Max Screen shows that "smart money" commercial hedgers established no new multi-year position extremes this week. They continued to sell S&P 500 contracts and are net short about $21 billion worth of major equity index futures. That's not extreme, but it's a stark change from a month ago. Hedgers are net short more than 6% of the open interest in wheat, which the Backtest Engine shows led to gains in wheat only 24% of the time during the next two months. They hold more than 50% of open interest net long in the Japanese yen. Over the past 15 years, such heavy long exposure led to excellent gains with little risk...except for the entire 2012-14 period, which was just loss after loss. We've already seen hints that this period is similar in that the yen is not reacting to extremes. They're close to going net short the Aussie dollar, which actually may be a good sign - other rallies in that currency tended to occur after hedgers established large net long positions then flipped to net short. Hedgers are selling sugar again, and total positions in agriculture contracts are nearing record short exposure. |
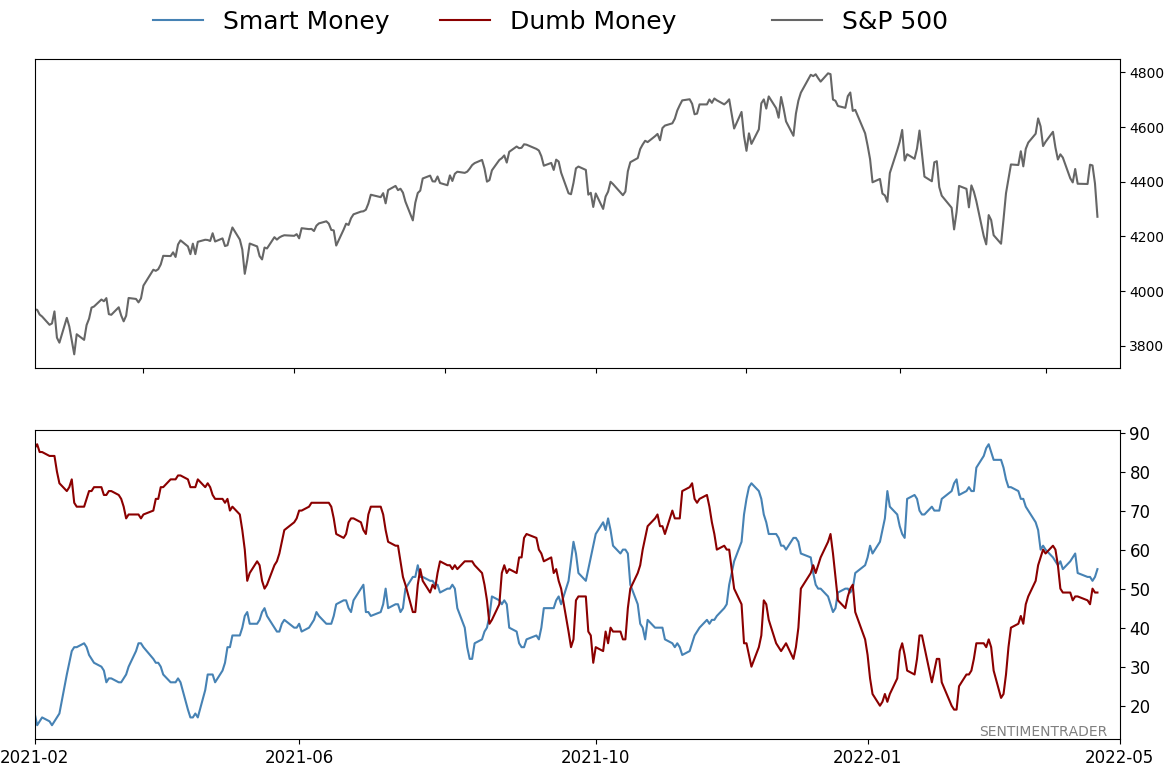
Smart / Dumb Money Confidence
|
|
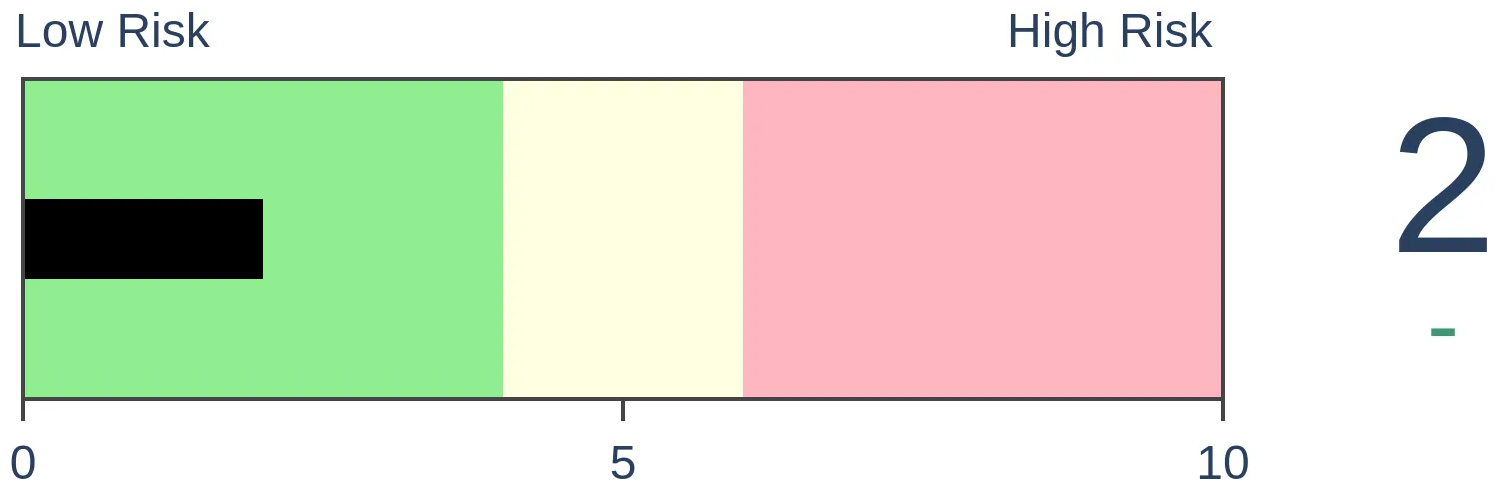
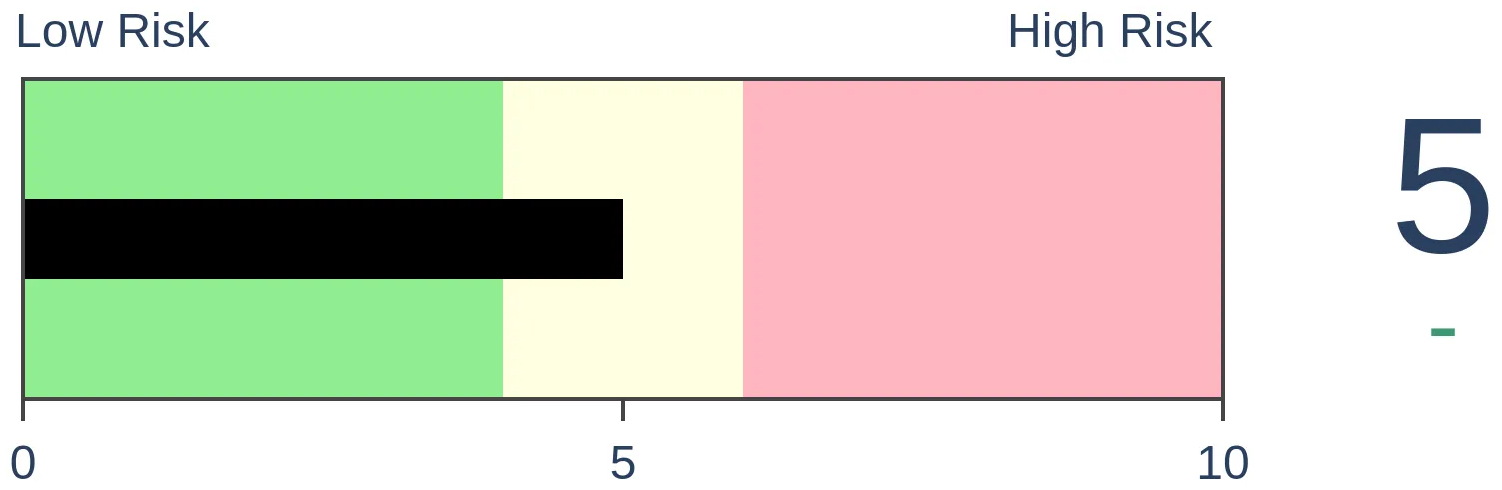
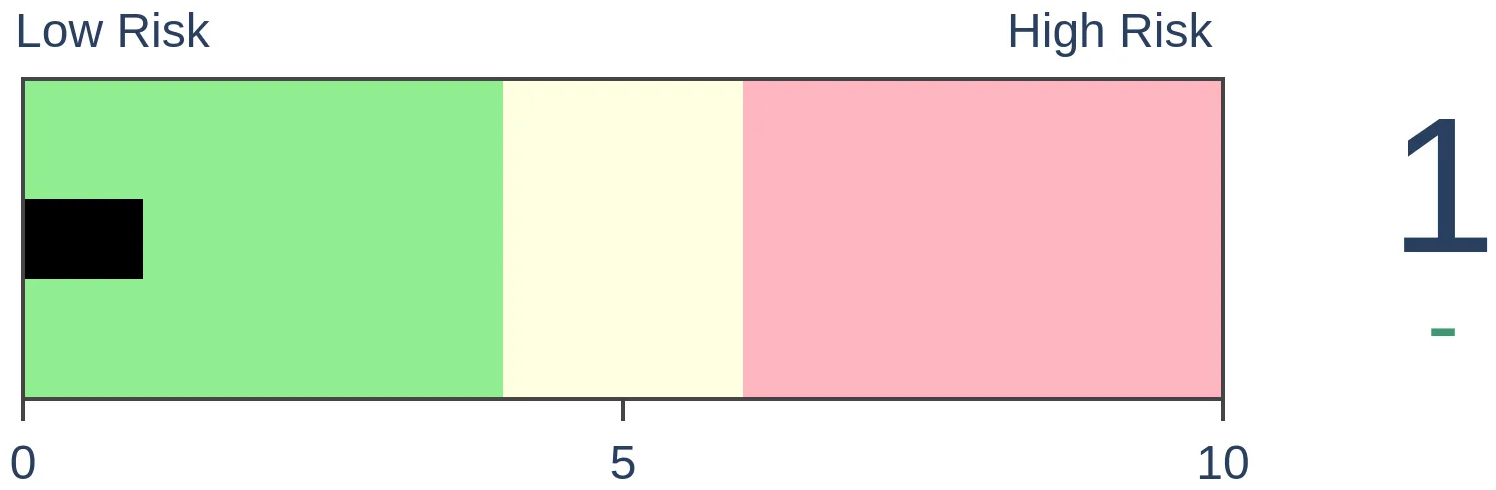
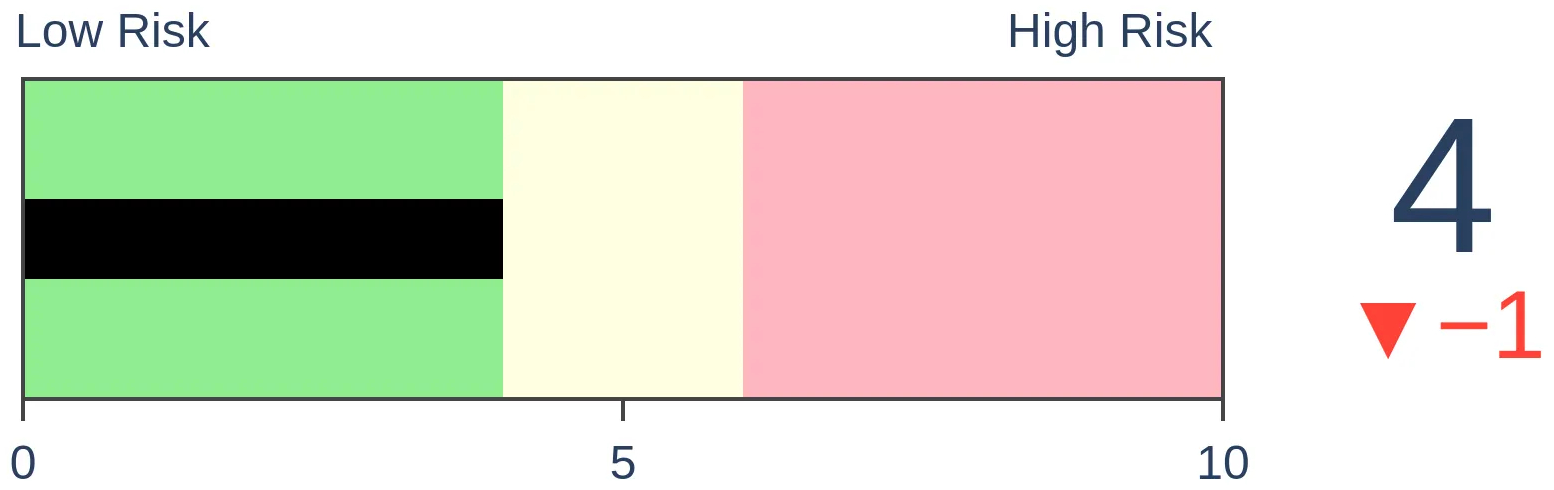
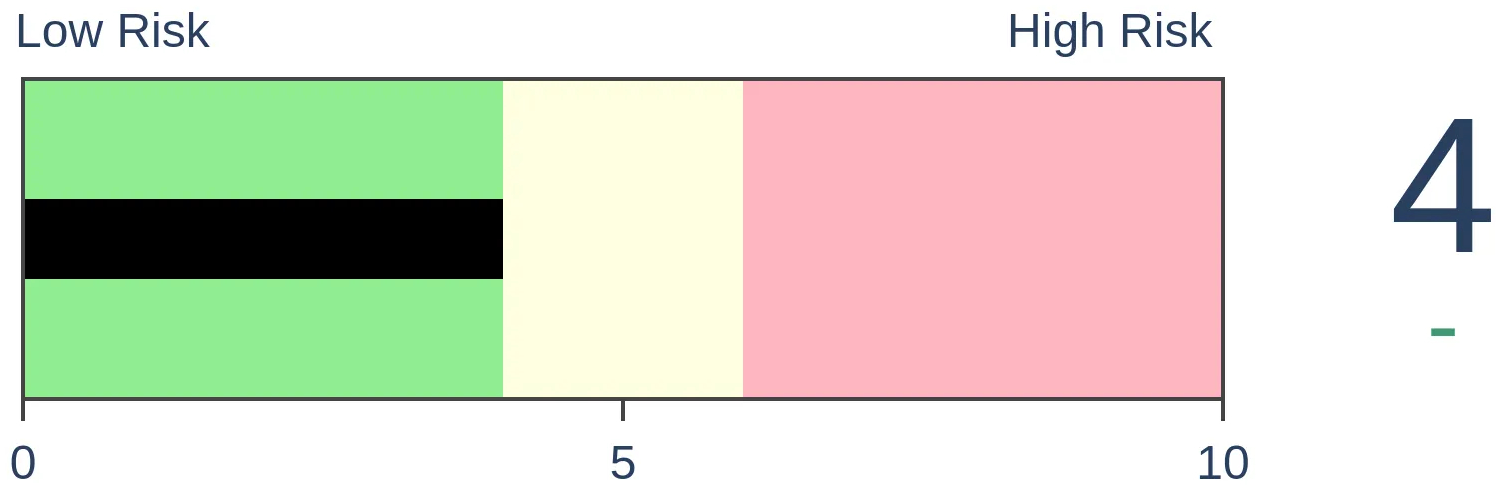
Risk Levels
|
|

|
Research
TradingEdge Weekly for Apr 22 - Split conditions return, high and rising inflation, energy insidersBy Jason GoepfertBOTTOM LINEThis week, we saw more evidence of a split stock market, with too many issues at 52-week highs or 52-week lows. The Nasdaq 100 has gone from year-over-year gains of more than 50% to a negative return. The yield curve has suddenly surged while investors battle high and rising inflation. Optimism on natural gas is too high, and energy company insiders are selling. The commodities boom is benefiting Latin American countries. FORECAST / TIMEFRAME |
Key points:
- Once again, we have to deal with a split market with many new highs and new lows
- Big Tech stocks have reversed 50% year-over-year gains for the 7th time in 40 years
- There has been a persistent prevalence of new lows on the Nasdaq exchange
- The 2/10 yield curve has surged after briefly inverting
- High and rising inflation is about the worst possible combination for stocks
- Natural gas sentiment has reached an extreme high
- Energy company insiders are busy selling their shares
- Natural resource countries have been performing well
The split market returns
One of the requirements for a healthy environment is that 52-week highs on the NYSE have to outnumber 52-week lows. That's not happening with any consistency. Not only that, there is currently a remarkable split in the market, with too many securities at both extremes.
The HiLo Logic Index was above 4% again last Friday, meaning more than 4% of NYSE issues hit a 52-week high, and more than 4% of them fell to a 52-week low. That is not what bulls want to see.
When the HiLo Logic Index was above 4% since 1965, in the top 1% of all days, the S&P 500's annualized return was a horrid -22.1% p.a. (per annum, or percent annualized). When it was at the opposite extreme, the S&P averaged +49.7%.
This has been a familiar problem for months. The 50-day average of the HiLo Logic has now climbed above 2%, and the Backtest Engine shows that when the 50-day average got this high, three months later, the S&P 500 was higher only 8 of 22 times. Returns across every time frame were terrible.
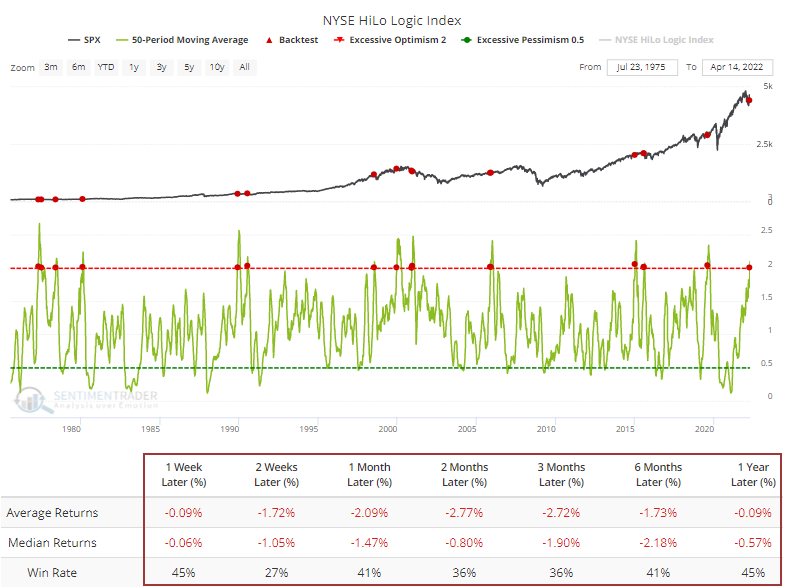
We can't just dismiss this because interest-rate sensitive securities dominate the new lows list. Even within the S&P 500 itself, more than 2.5% of stocks were either at a 52-week high or a 52-week low last Friday. Since 1928, the S&P's returns were terrible when this was the case, with a -15.2% annualized return. Bulls need to see the new high list rise, and fewer issues fall to 52-week lows, for any rally to be sustainable.
The trend is still higher, but cautious
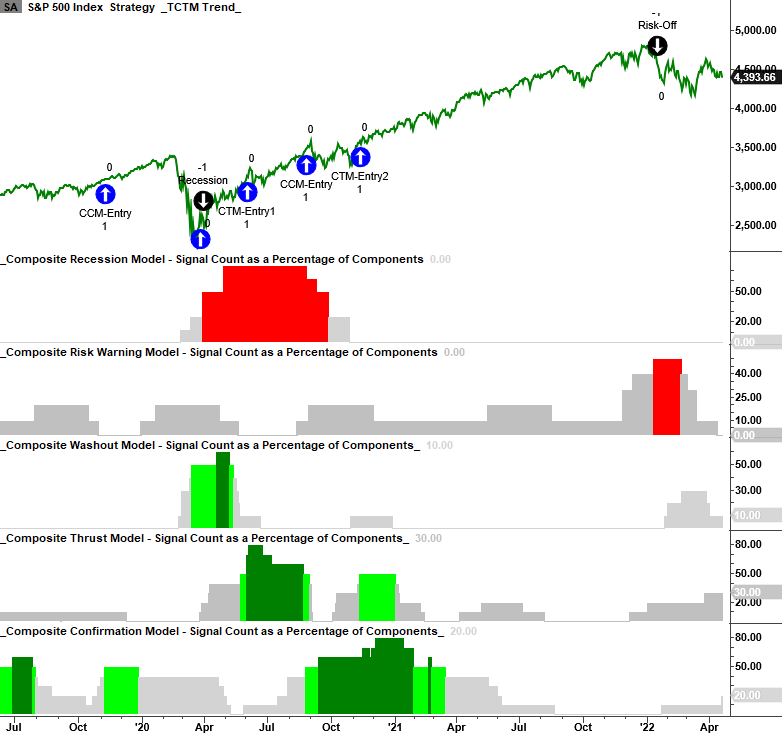
Despite the worries and severe damage in many underlying stocks, the long-term uptrends in most indexes continue to hold.
Dean's updated Tactical Composite Trend Model (TCTM) maintains a cautious bull status as the recession and long-term trend models remain in a favorable position, despite the composite risk warning model signal from December. Now that the market has corrected, he will be monitoring the washout and thrust models for indications that the countertrend move in the market is over.
Big tech gets crushed
The air has been let out of the Big Tech balloon. For the first time in over a year, investors are staring at a year-over-year loss in the Nasdaq 100.
This comes on the heels of what had been a historic rise. This is the 7th time the Nasdaq 100 (NDX) has cycled from a year-over-year rate of change of over +50% to below zero. 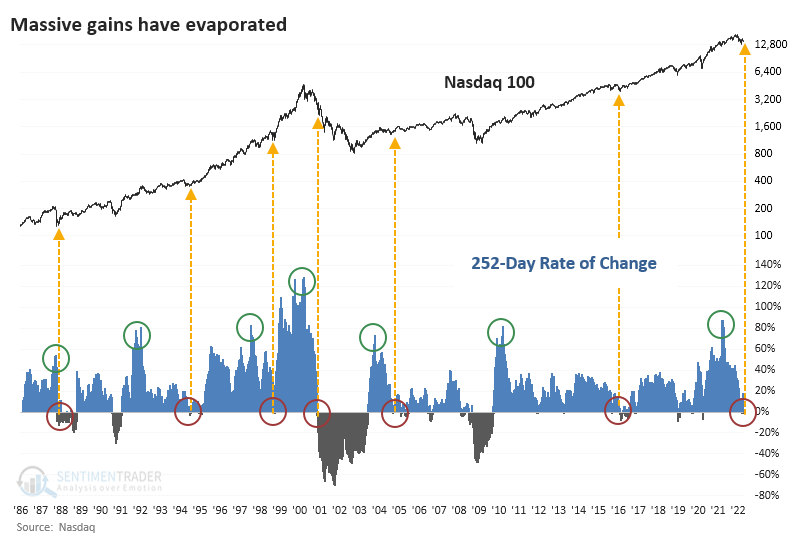
Buyers stepped in immediately five times of the six other times the NDX cycled from super gains to losses. The only failure was the pricking of the internet bubble.
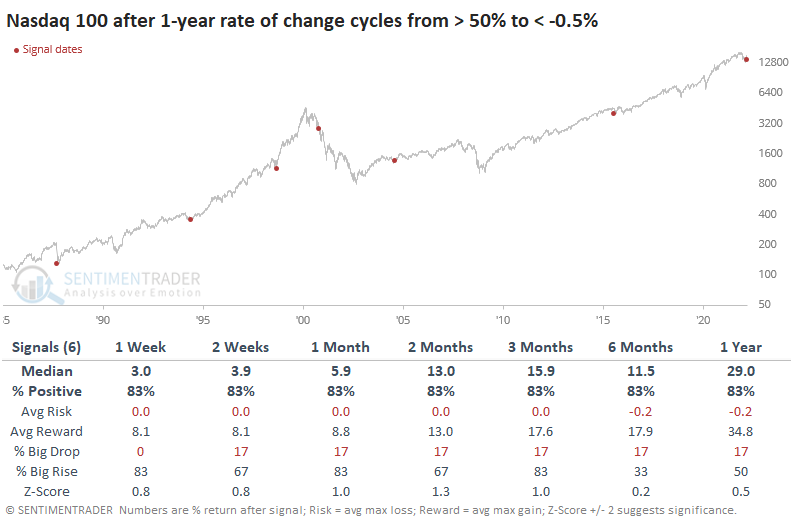
The Risk/Reward Table is one of the most consistent we've ever seen. The sample size is tiny, of course, but the consistency of the results is remarkable. The only signal when the NDX lost more than -0.5% at any point within the next three months was November 2000. As much as we can rely on a sample size of six, it's flashing a big neon sign to pay attention to the days ahead and see if buyers step in.
One of the curious things about this decline is that corporate insiders in these stocks are stepping up. Open market buy transactions among insiders over the last six months just hit a decade high, while insider selling fell to a three-year low. That pushed the Buy/Sell Ratio to one of the highest levels since the financial crisis.
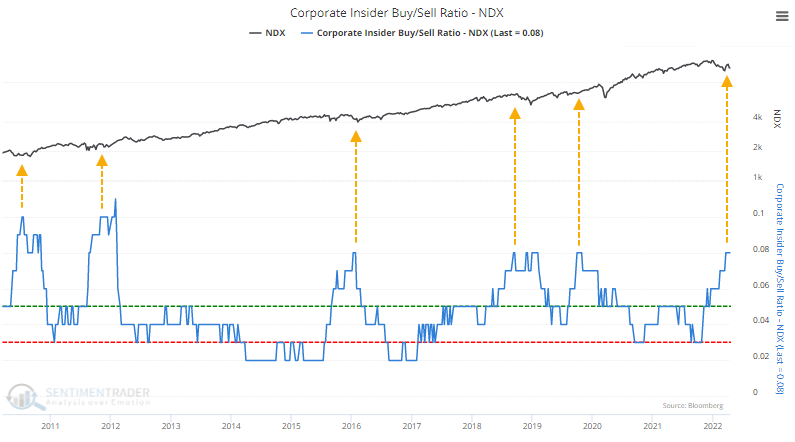
It's even more egregious in the broader technology sector where the current Buy/Sell Ratio has only been eclipsed by late 2011.
A persistent case of new lows on the Nasdaq
Jay looked at the prevalence of new lows on the Nasdaq, per the Nasdaq High/Low Ratio.
The ratio is expressed as the number of issues that closed at a 52-week high divided by 52-week highs plus 52-week lows. For example, if 100 Nasdaq issues closed at a new high and 30 Nasdaq issues closed at a new low, then the Nasdaq High/Low ratio for that day would be:
100 / (100 + 30) = 100 / 130 = 0.77
This data series can be pretty volatile. The chart below displays a 100-day moving average of the daily Nasdaq High/Low Ratio to discern a longer-term trend. This creates a clearer picture of the long-term trend and highlights some meaningful highs and lows.
The chart highlights all days when the Nasdaq High/Low Ratio 100-day average was below 0.20.
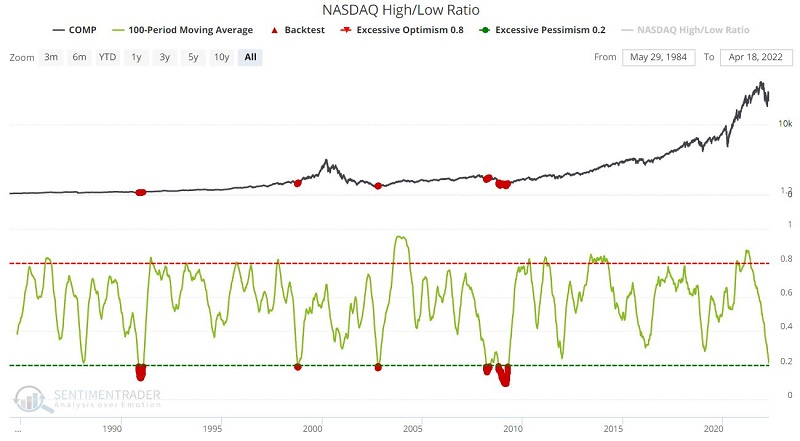
The performance results suggest that low readings present potential buying opportunities. Sometimes, an initial drop below 0.20 proves to be a prelude to a final plunge to the actual price low but there are other alternatives for those who are not inclined to buy into a weak market.
The chart below displays all days when the Nasdaq High/Low Ratio 100-day average crossed above 0.28. In other words, the average first experiences significant weakness and then shows signs of a meaningful rebound (i.e., crossing back above 0.28).
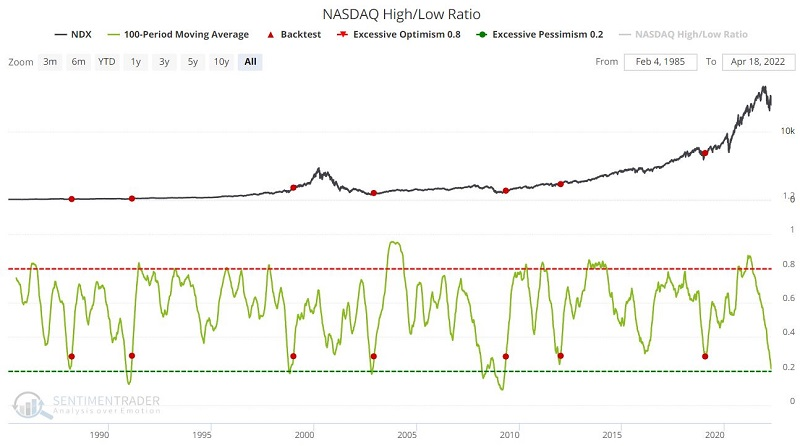
While it might be an exaggeration to refer to this as an "All Clear" signal, it typically occurs when the worst is over.
The yield curve has surge
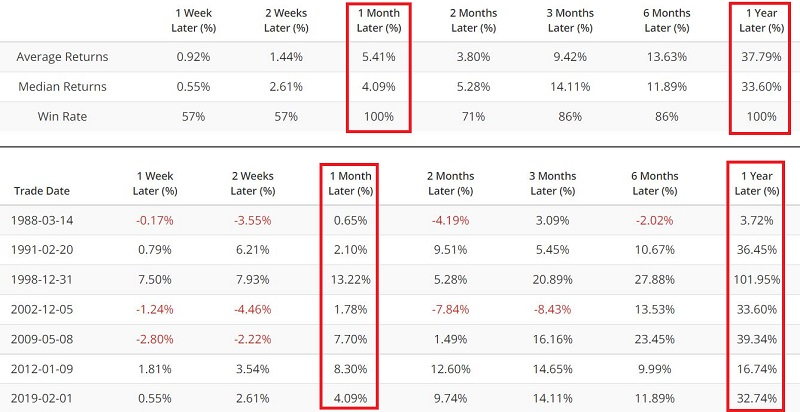
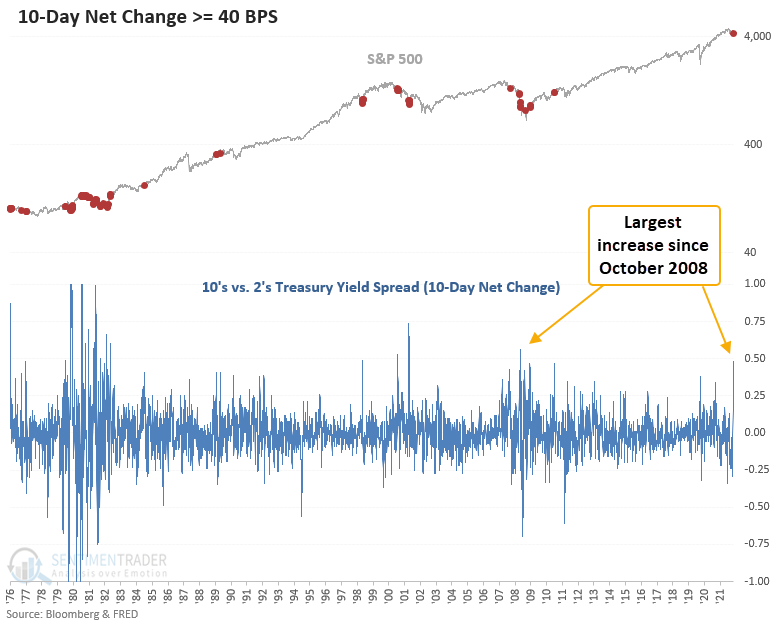
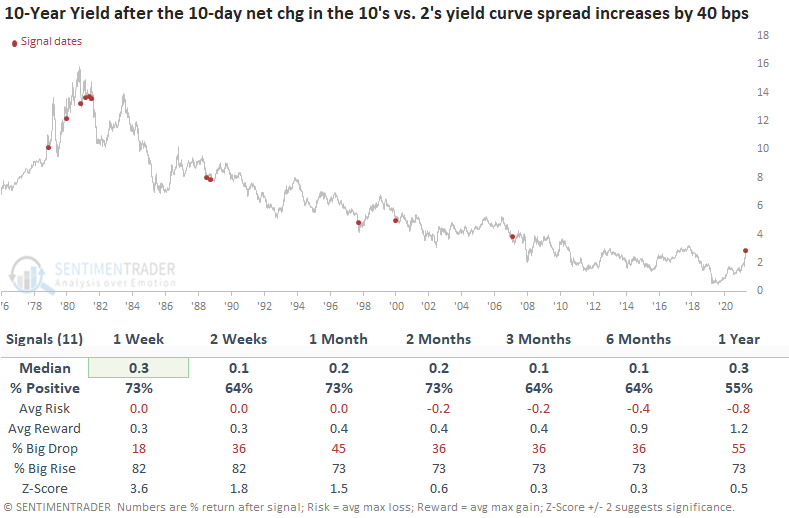
Dan showed that the 10's vs. 2's treasury yield spread has increased by 48 bps over the trailing 10 sessions.
When the 10's vs. 2's treasury yield spread declines, the yield curve is said to be "flattening." Typically, a flattening of the yield curve suggests softer economic conditions.
Conversely, when the 10's vs. 2's treasury yield spread increases, the yield curve is said to be "steepening." A steepening of the yield curve is typically, but not always, associated with more robust economic conditions.
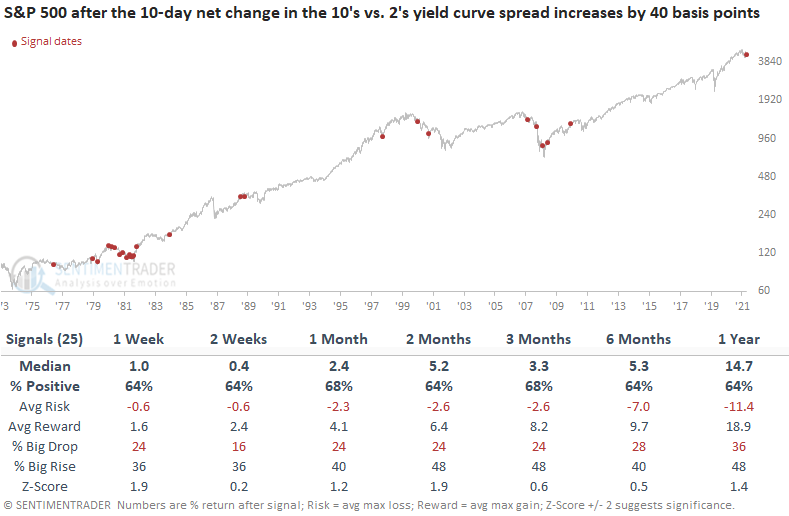
Let's assess the outlook for the stock market when the 10-day net change in the 10's versus 2's treasury yield spread increases by 40 basis points or more. Significant increases in the treasury yield spread in a brief period typically occur in unfavorable trend environments for the S&P 500, with 67% of the instances triggering below the 200-day moving average.
This study generated a signal 25 other times over the past 45 years. After the others, S&P 500 future returns and win rates were slightly better to inline when compared to historical averages. Significant drawdowns in the 6-12 month windows all boiled down to whether the index was in a recession-induced bear market.
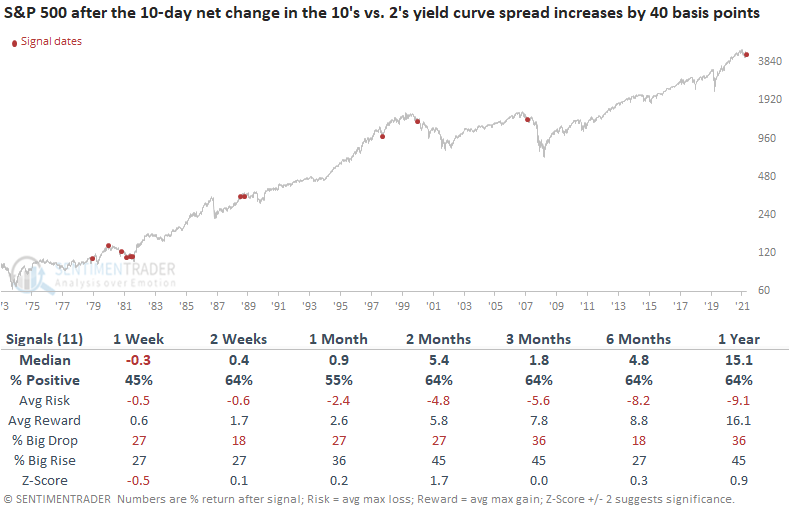
Let's add some context to the study, requiring the 10's vs. 2's yield curve to invert before a signal can trigger. If you recall, the 10/2 curve inverted on 4/1/22.
This study generated a signal 11 other times over the past 43 years. After the others, S&P 500 future returns, win rates, and risk/reward profiles were mixed to slightly better than historical averages across most time frames. However, the results look less favorable on a short to medium-term basis compared to the original study.
The 10-year bond suggests yields could continue to increase, which is alarming, given the amount of pain that bond investors have endured lately.
Inflation is STILL a bogeyman
Jay touched again on inflationary trends, and why it remains a concern for equity investors.
Jay updates inflation measures at the end of the calendar month and NOT when new data is released. As calculated, CPI inflation appears in the chart below (along with the long-term average of 3.22% in blue).
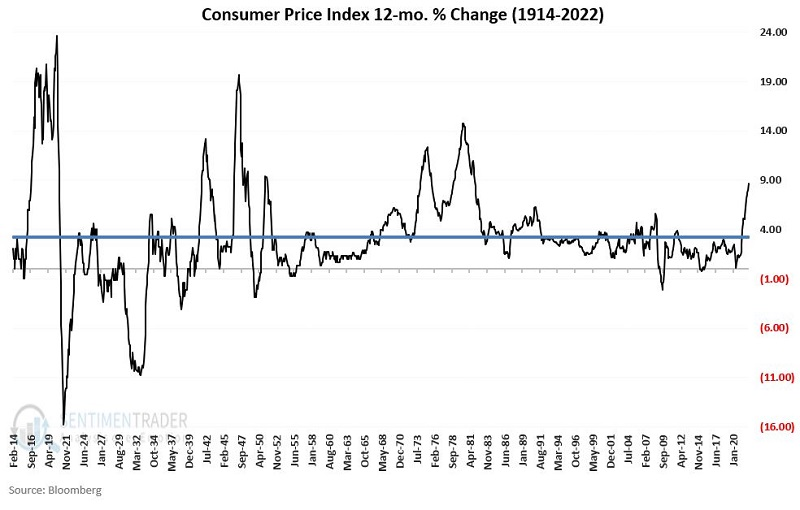
Using this method, 4/30/2022, Jay will record the month-end CPI inflation rate as +8.654%, up from +7.967% at the end of March. High inflation is not a friend of the stock markets. However, that also depends on whether inflation is rising or falling from its high level.
According to the calculations shown above, as of May 1st, the two following factors will be true:
- CPI inflation rate >= 8%
- The current CPI inflation rate > the CPI inflation rate for the previous month
What might this mean for the stock market? The chart below displays the growth of $1 invested in the Dow Jones Industrial Average only during months when the two factors above were true (i.e., CPI inflation ended the previous >= 8% AND HIGHER than the month before that).
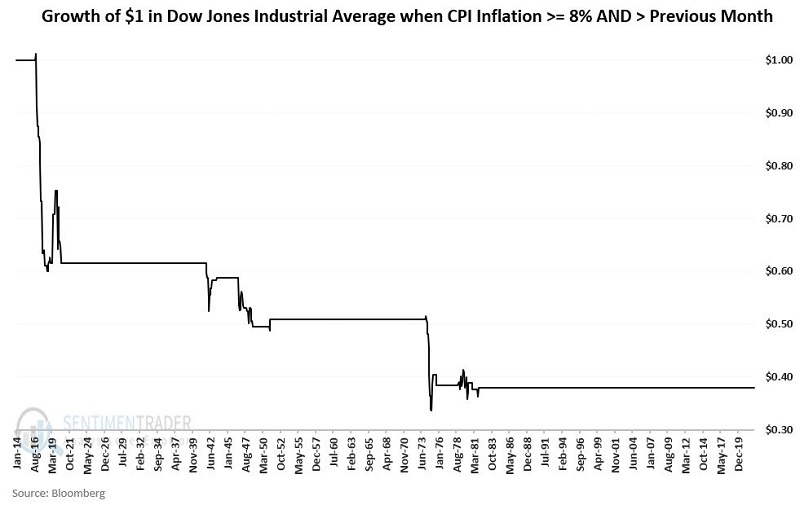
As you can see, when inflation is high (above 8%) and rising (higher than the previous month), stock market performance has been dreadful (net loss = -62%).
While extremes in inflation (and/or deflation) are clearly negative for stocks, it is also true that once the market perceives that inflation has topped out, market performance can improve dramatically - even with the raw inflation number at a relatively high level.
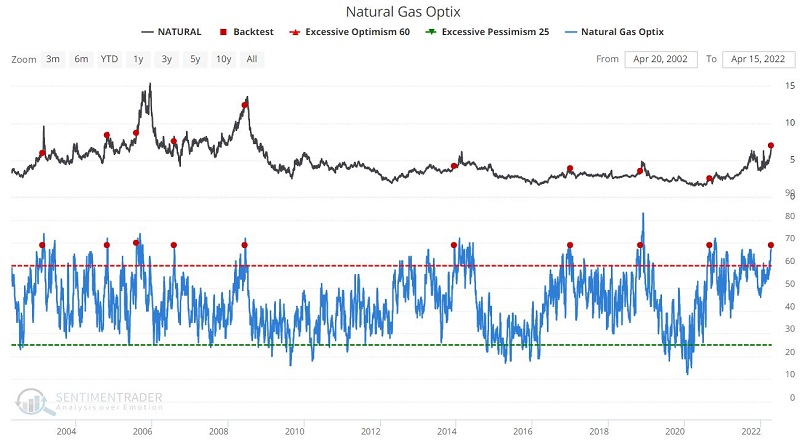
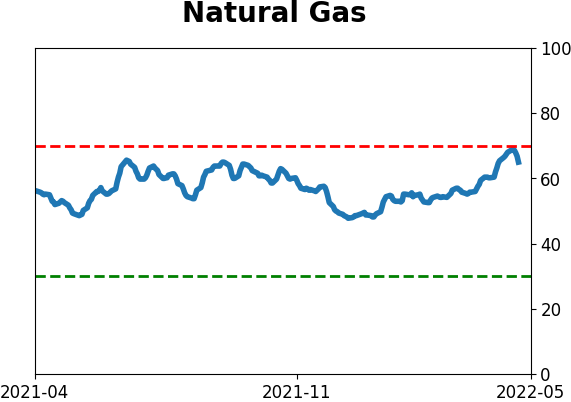
Natural gas may be...out of gas
Jay showed that natural gas sentiment has reached troubling levels.
There is no reason that the reason rally cannot continue, at least according to the calendar. The chart below displays the annual seasonal trend for natural gas futures. This market is still in the middle of a generally bullish seasonal period.
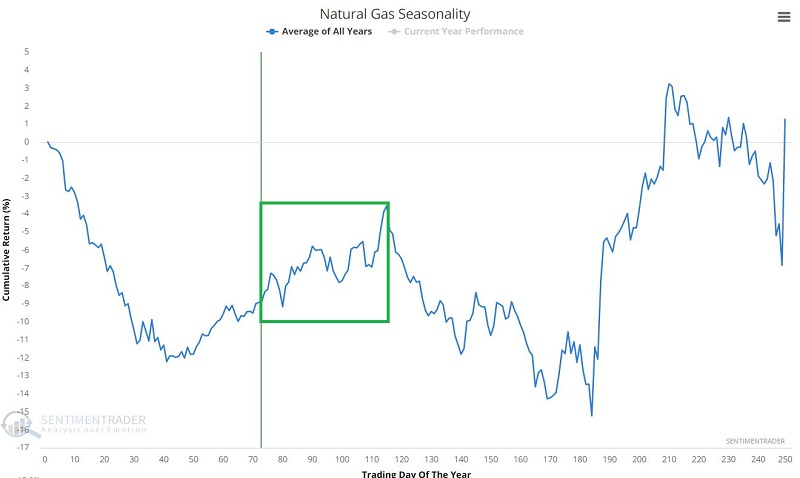
Still, while natural gas can continue to rally higher, it will be important to keep an eye out for clues of a top. The chart below displays those days when Natural Gas Optix crossed above 68.9 for the first time in 26 weeks, which it just did.
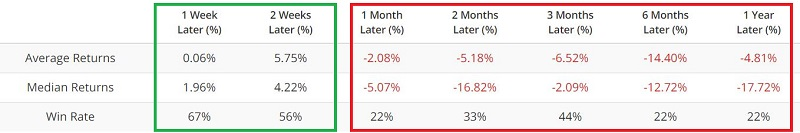
The results are even more dramatic when looking at the ETF ticker UNG.
The results above suggest that natural gas (and UNG) can continue to rally for a time. In fact, a runaway spike in price and/or sentiment would not be at all surprising. But alert traders should pay close attention, for history suggests that that reversal may be swift and severe when this market reverses.
Another potential headwind for energy investors
Also worrying for energy investors is what corporate insiders in energy companies are doing. Jay noted that corporate insiders (executives and board managers) are often privy to knowledge regarding the prospects for their own company. When they act in a concerted manner, it typically conveys important information.
Insiders are required to report when they buy or sell shares of their own company in the open market and we utilize a Bloomberg database that tracks only open-market insider buying and selling.
Here are the key overarching points to know regarding insider buying and selling:
- Heavy insider buying is considered a stronger signal than heavy insider selling because insiders typically only buy if they have confidence that their company (and by extension, the stock) will perform well over the next 12-24 months.
- When insider selling for a given index or stock dries up to a significantly low level, that also tends to portend positive results in the not too distant future. An increase in selling, while not as consistent of a signal as buying, tends to be bearish for the stock and sector.
The chart below shows the total number of corporate insiders of companies covered by the XLE (Energy Select Sector SPDR Fund) ETF that have sold shares on the open market during the past six months. The red dots show all dates when Corporate Insider Sells - XLE was above 85.
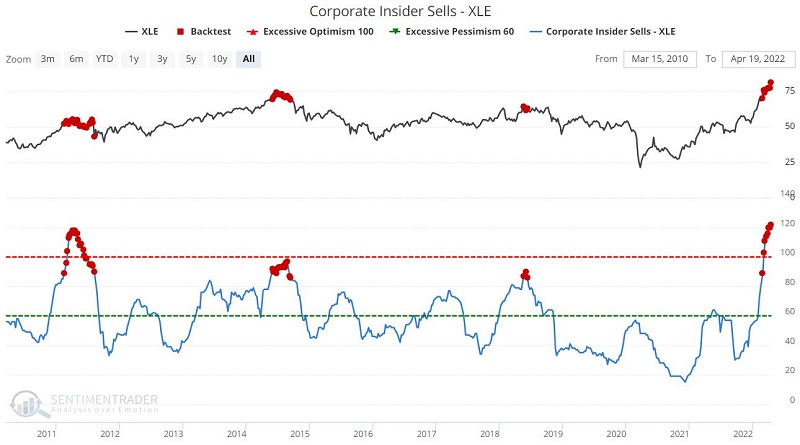
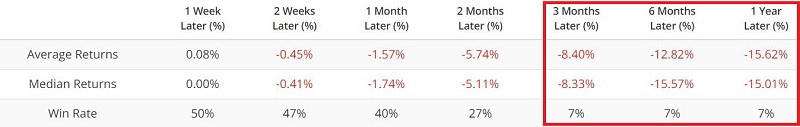
Clearly, this has been a headwind for energy stocks over the medium- to long-term.
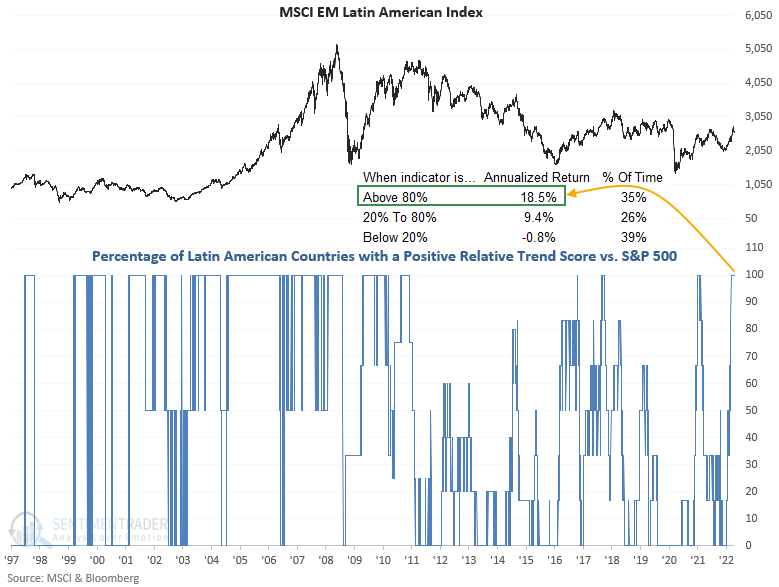
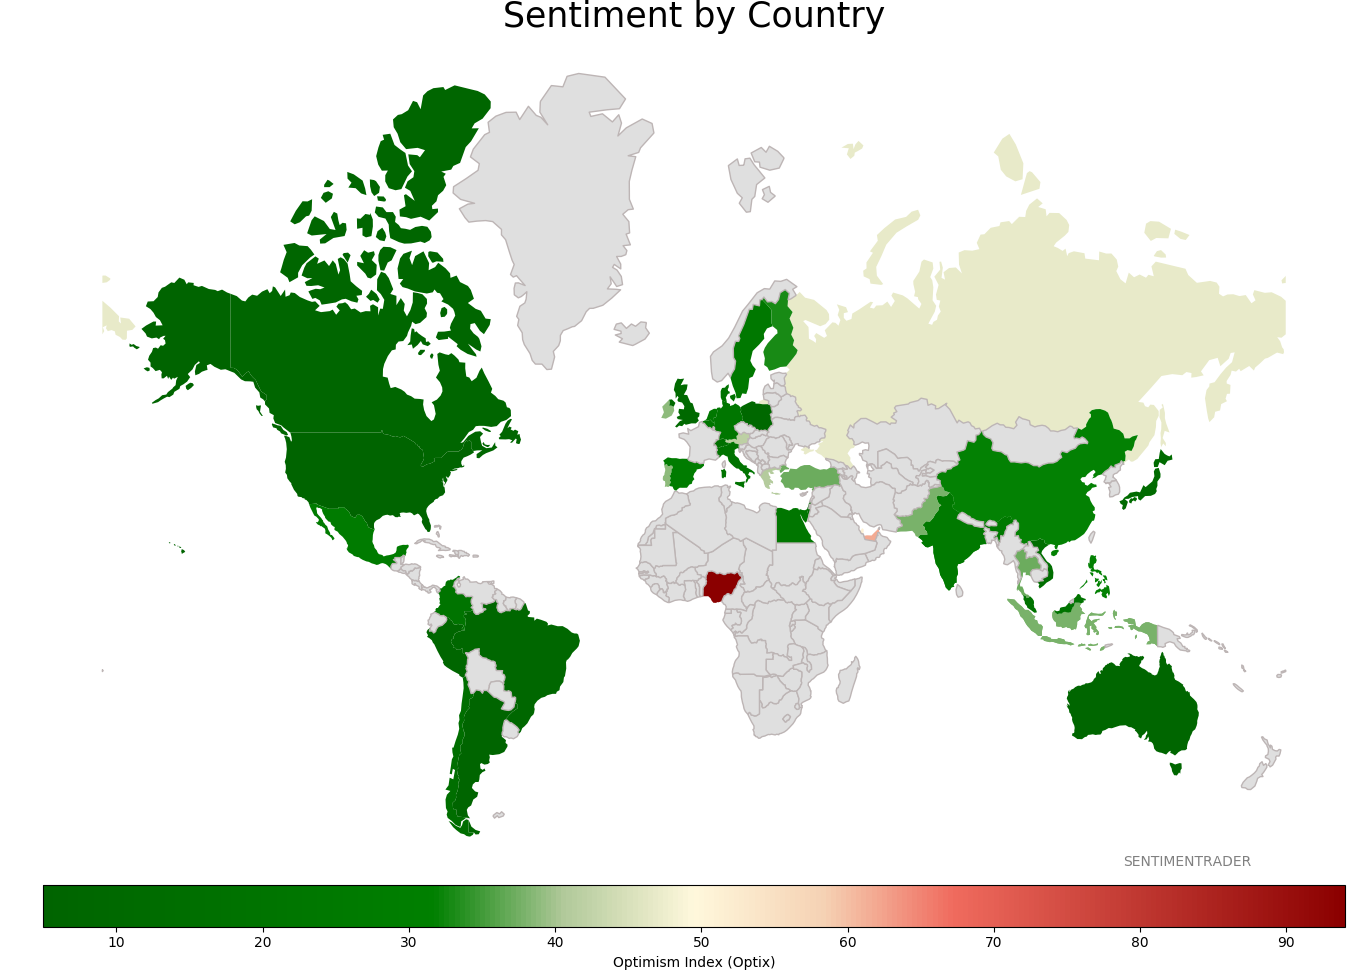
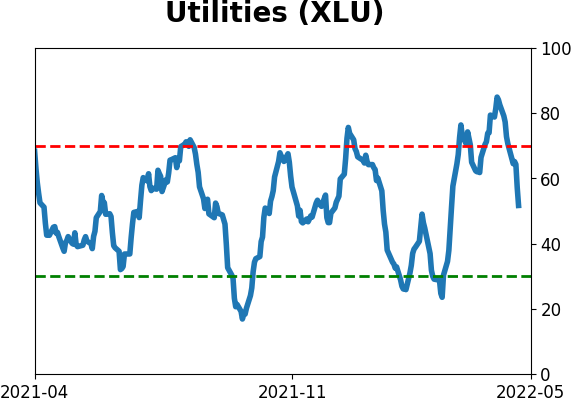
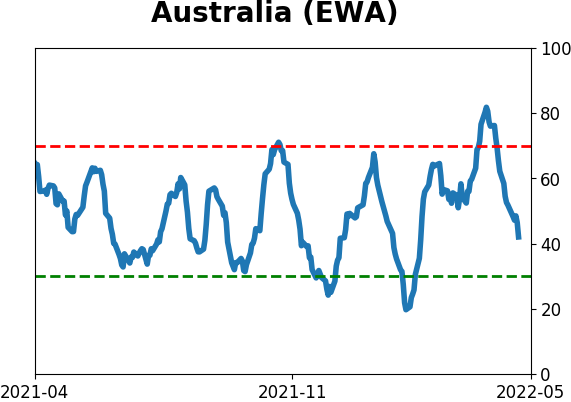
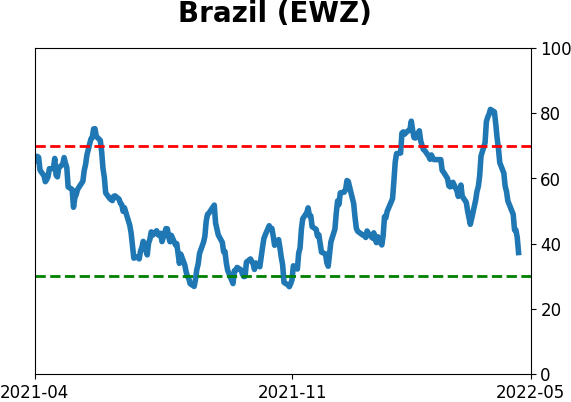
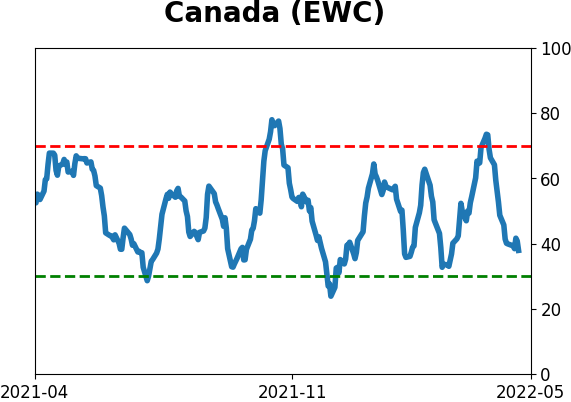
Natural resource-heavy countries have been doing just fine
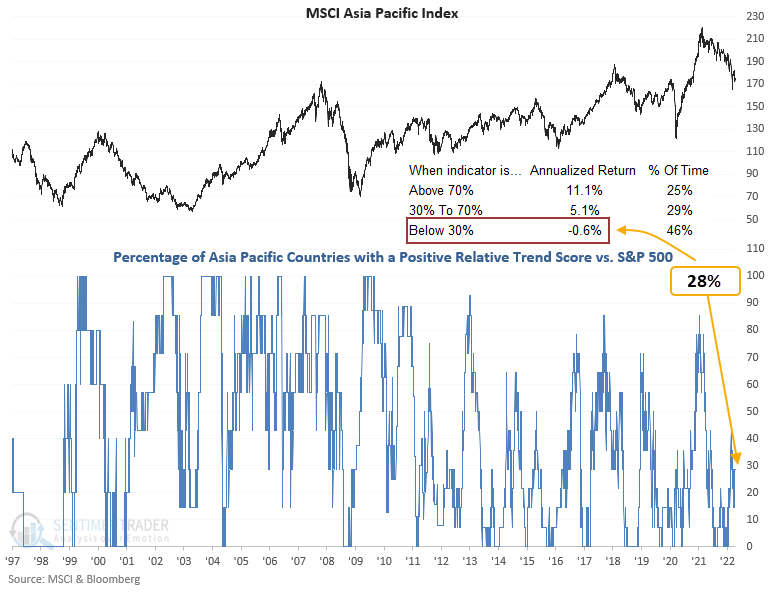
Dean noted that natural resource-based countries show positive absolute and relative trends. At the same time, the manufacturing-based Asia-Pacific region looks unfavorable.
For the first time in more than a year, Latin American countries with a positive relative trend score versus the S&P 500 increased to 100%. When 80% or more of the ETFs show a positive relative trend score, annualized returns look better. The MSCI Emerging Market Latin American Index showed an annualized return of +18.5% when in its current configuration.
When assessing the relative trend scores for Asia-Pacific countries, it shows an unfavorable level of ETFs in the manufacturing-heavy region with a positive relative trend score.
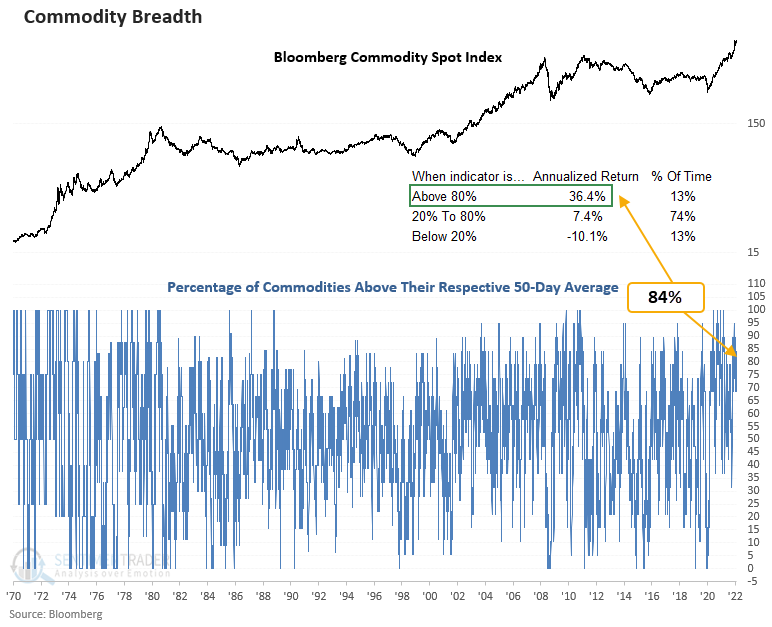
Thanks to a broad-based surge, 84% of commodities are trading above their 50-day average, suggesting strong annualized returns for a commodity index. So, with commodities in a favorable position, we could expect natural resources-based country ETFs to continue to outperform.
About TradingEdge Weekly...
The goal of TradingEdge Weekly is to summarize the research published to SentimenTrader over the past week. Sometimes there is a lot to digest and this summary is meant to highlight the highest conviction or most compelling ideas we discussed. This is NOT the full research that's published, rather it pulls out some of the most relevant parts. It includes links to the published research for convenience; if you don't subscribe to those products it will present the options for access.
Indicators at Extremes
|
|
|
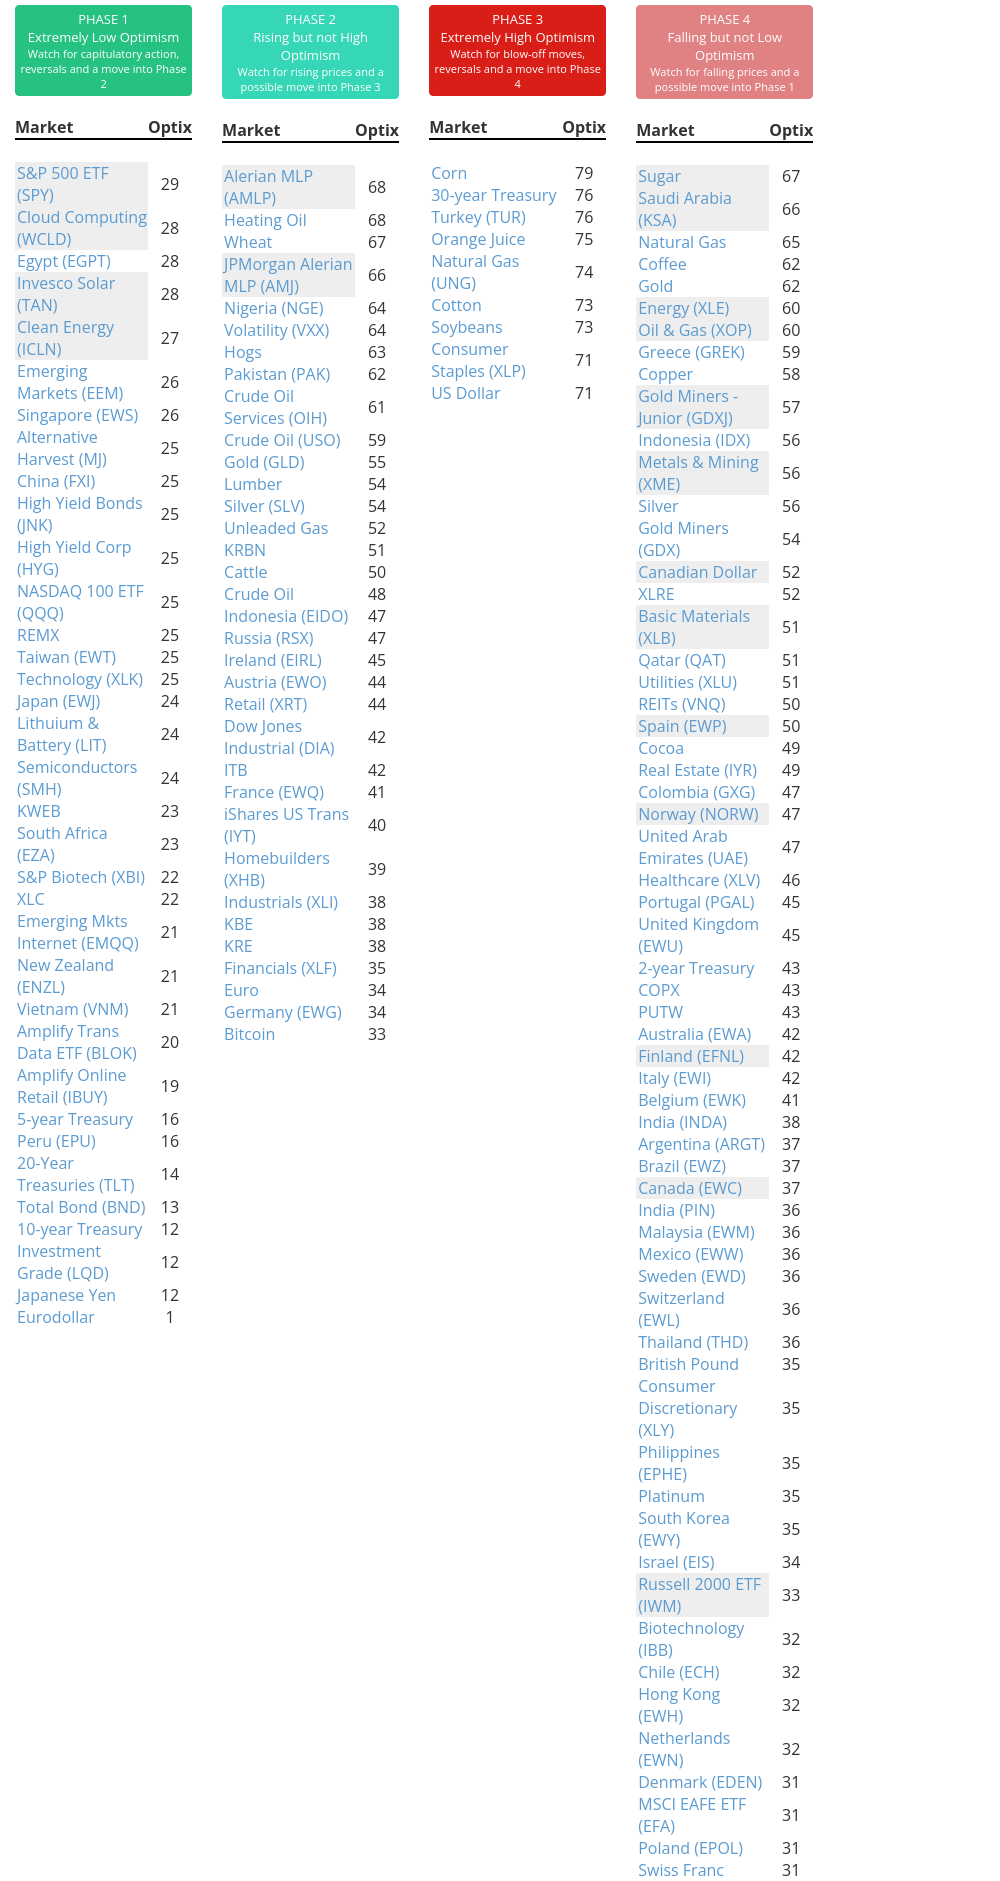
Phase Table
|
|
|
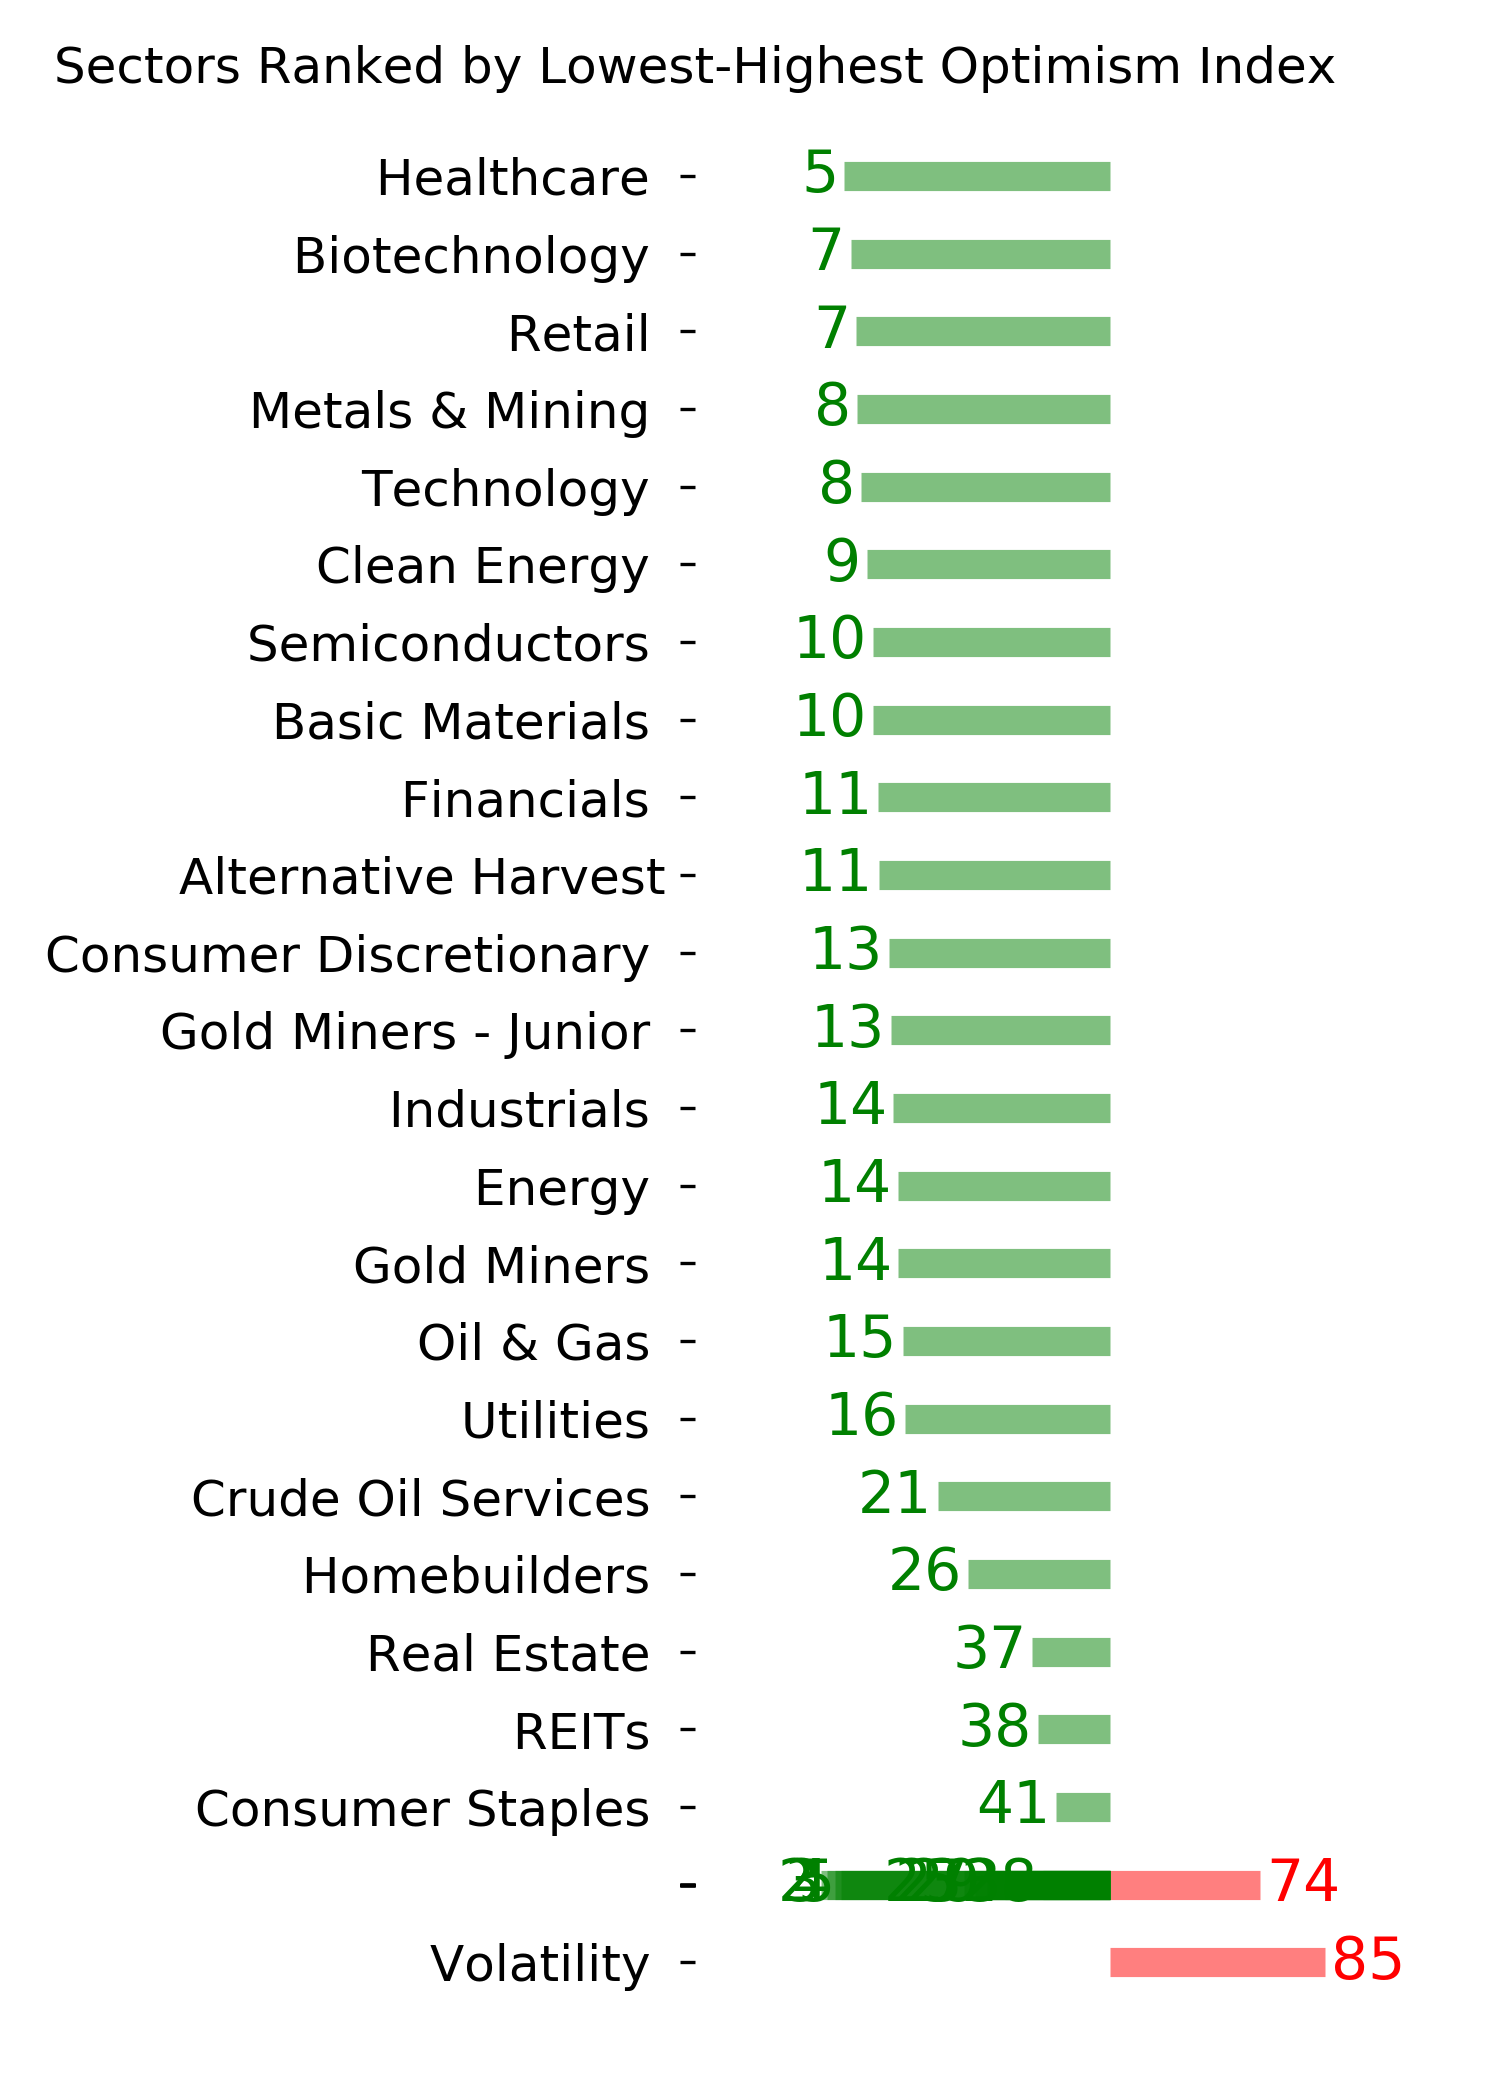
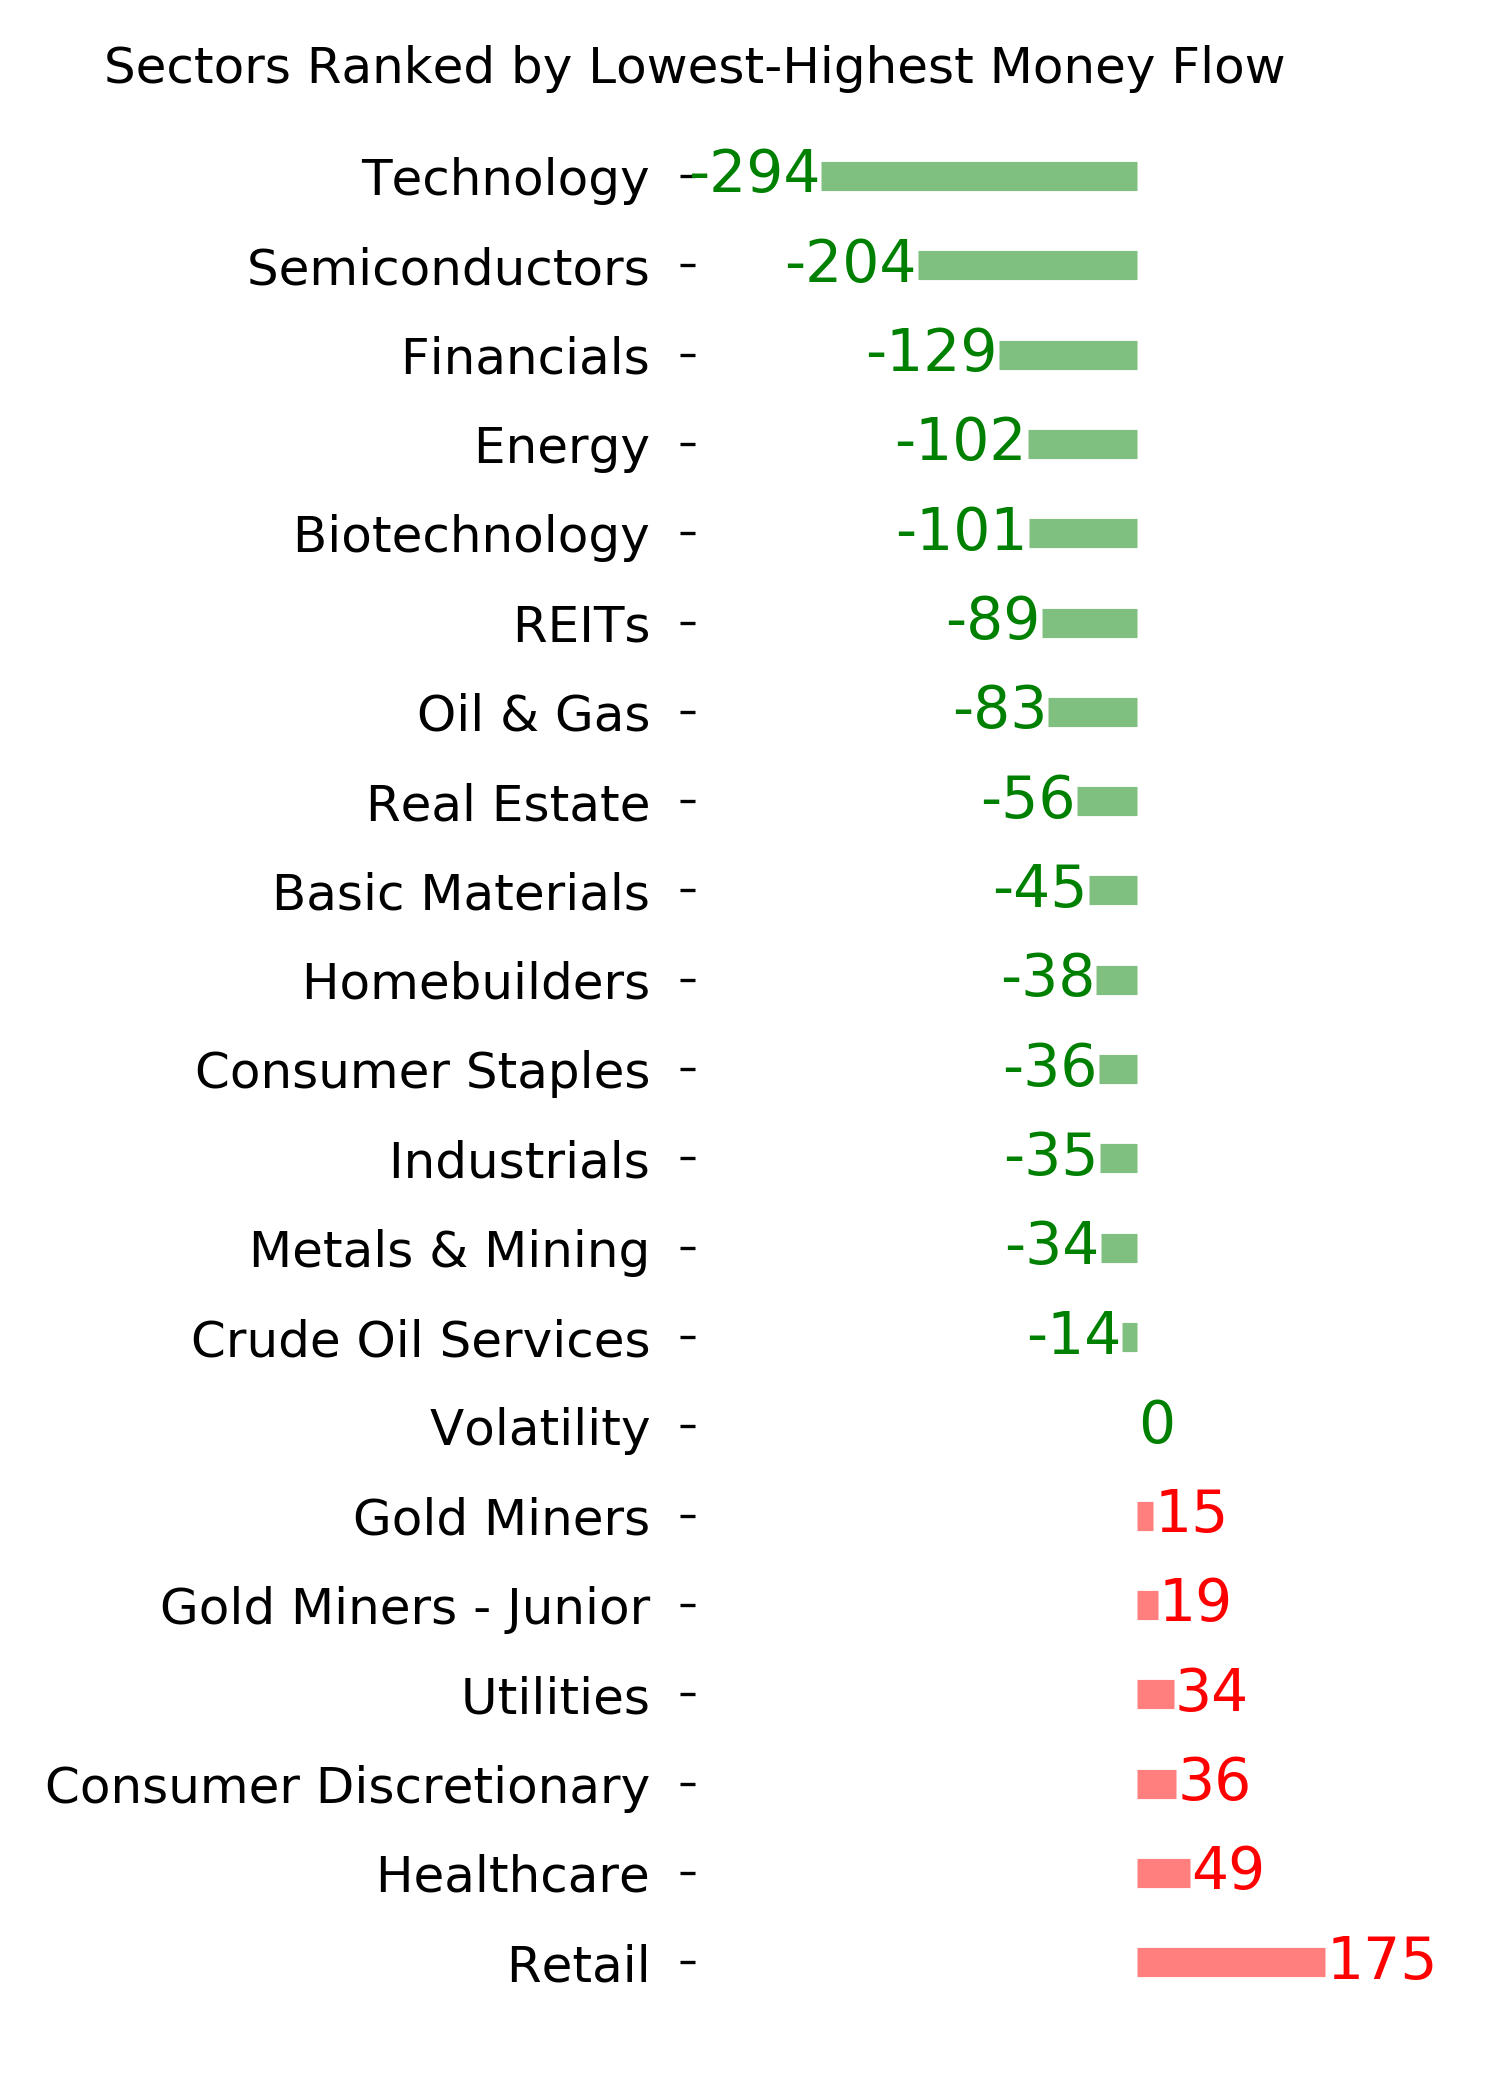
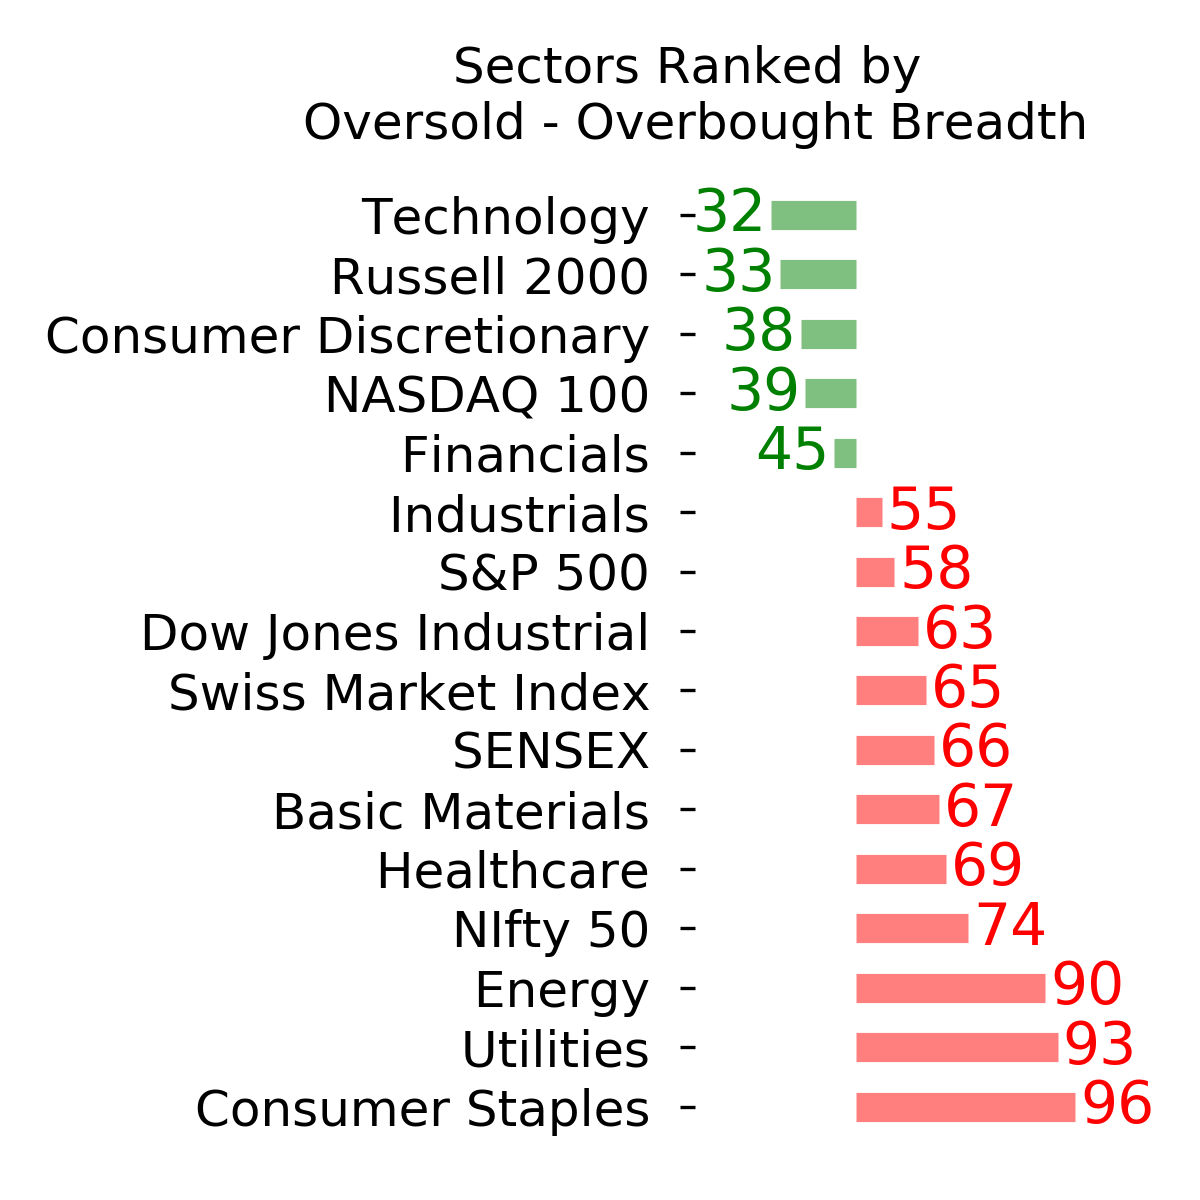
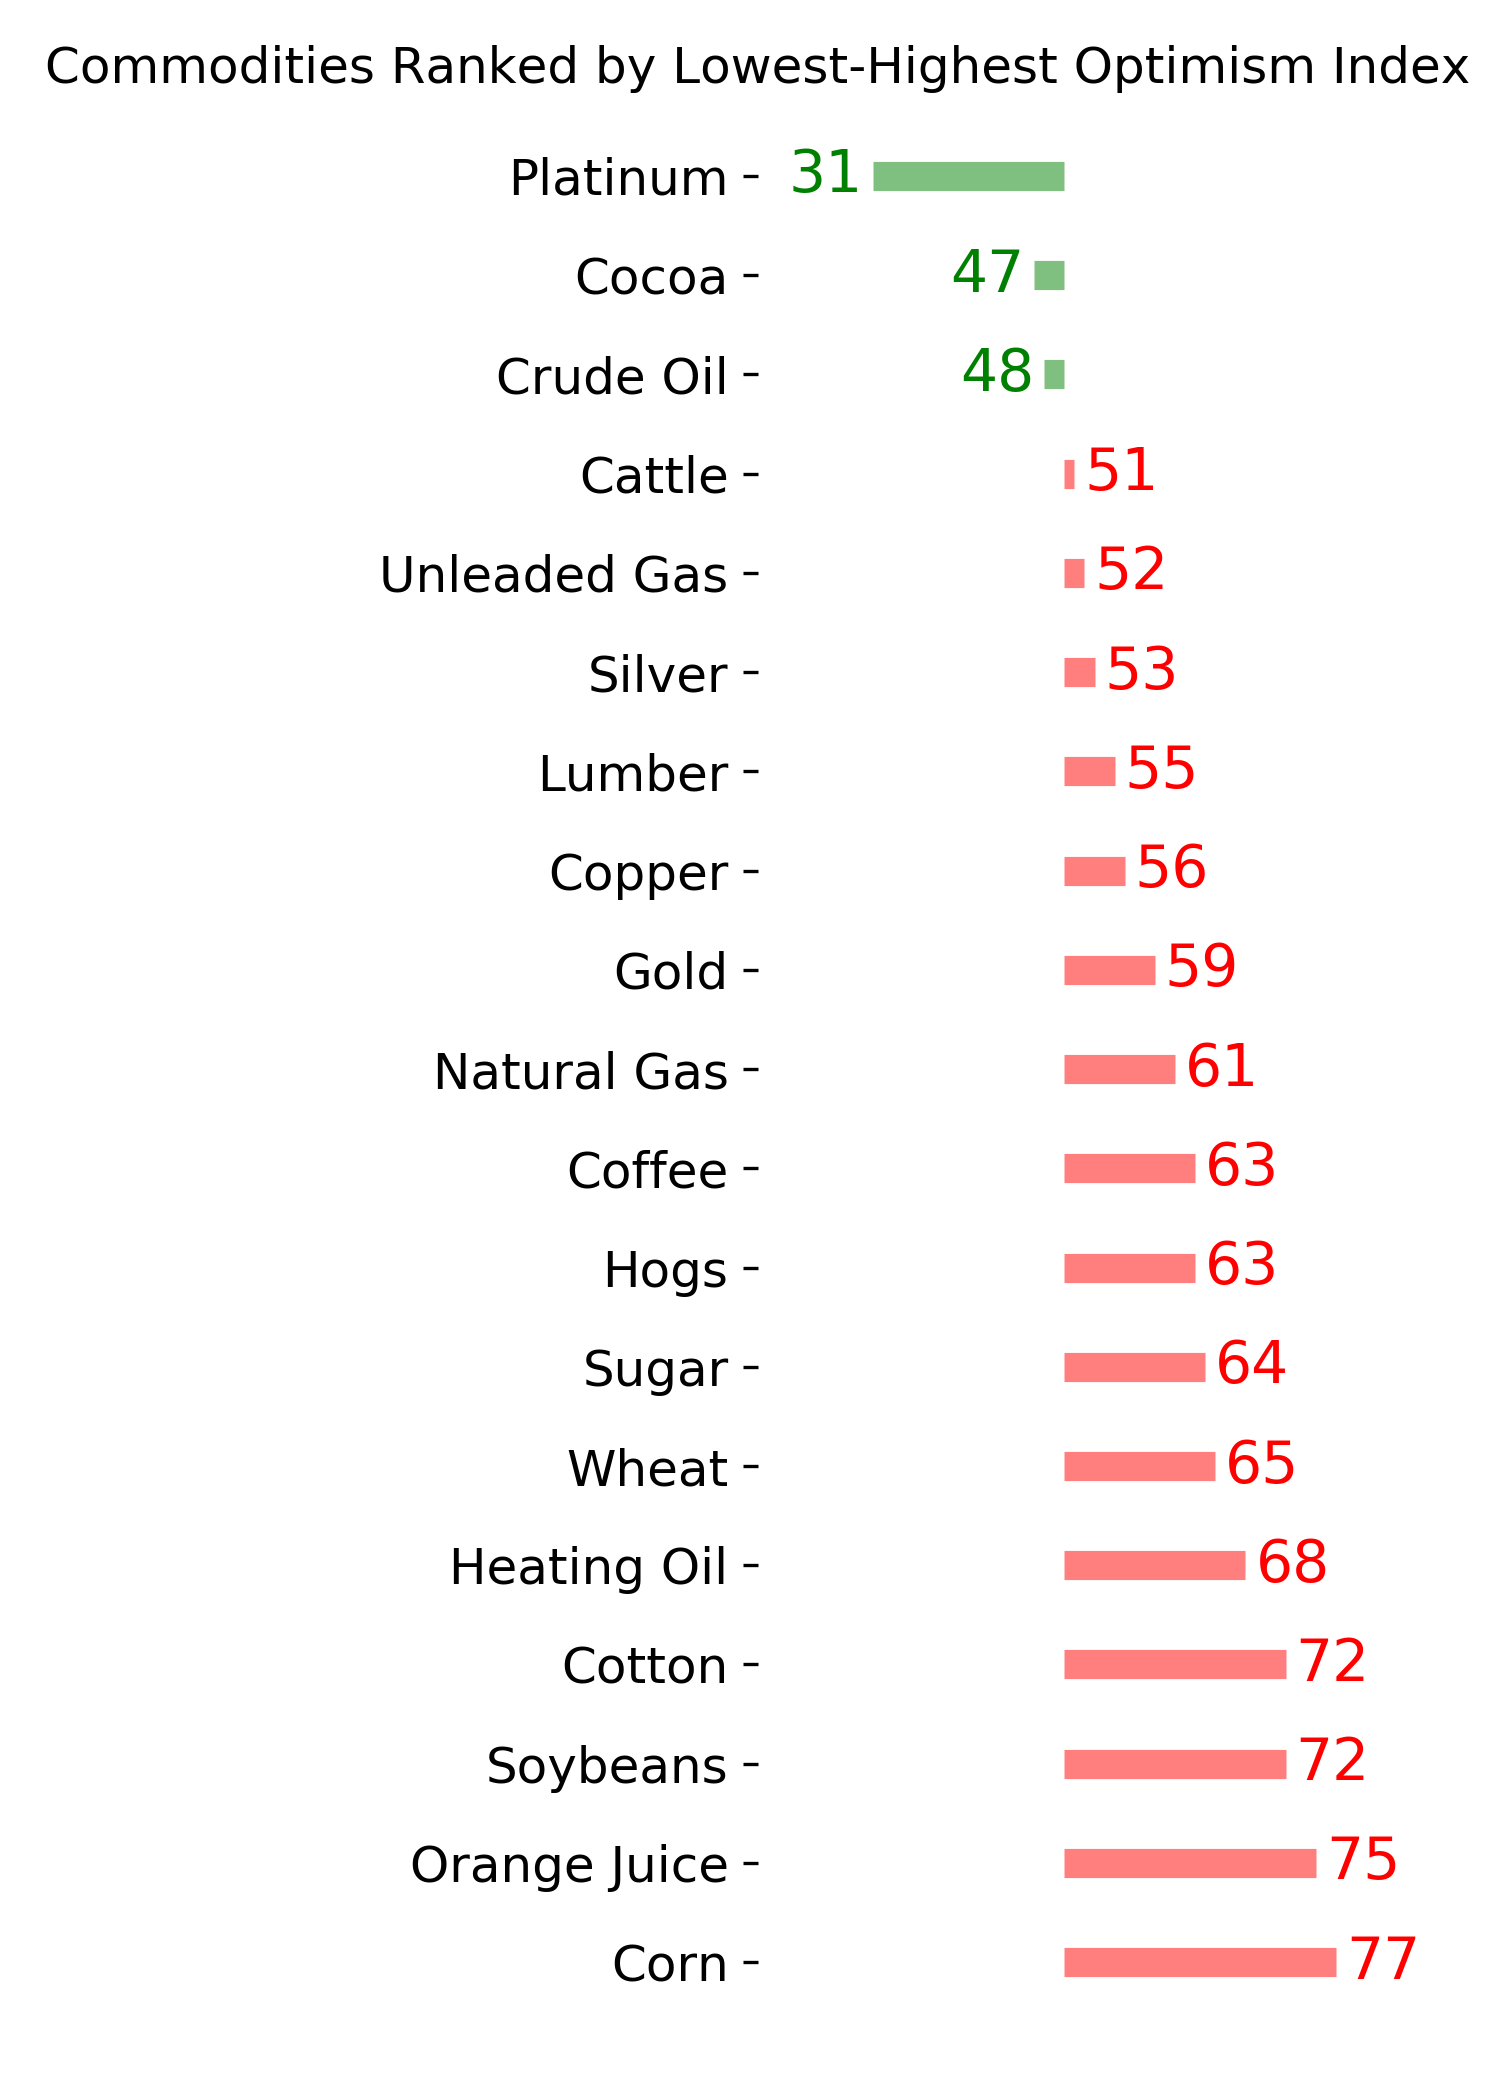
Ranks
|
|
|
|
|
|
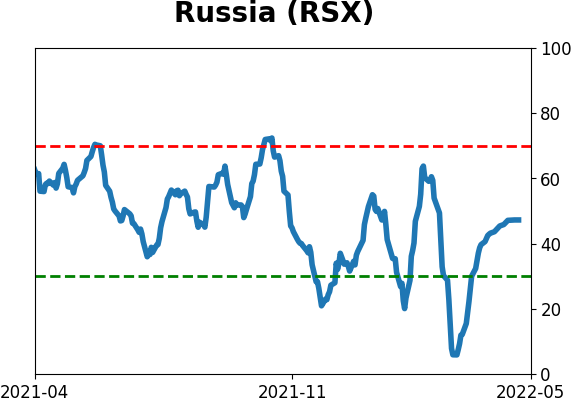
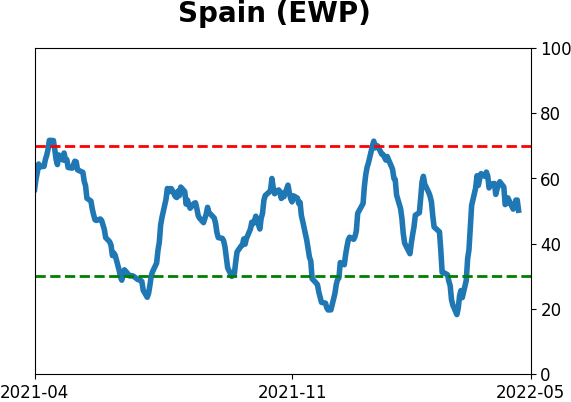
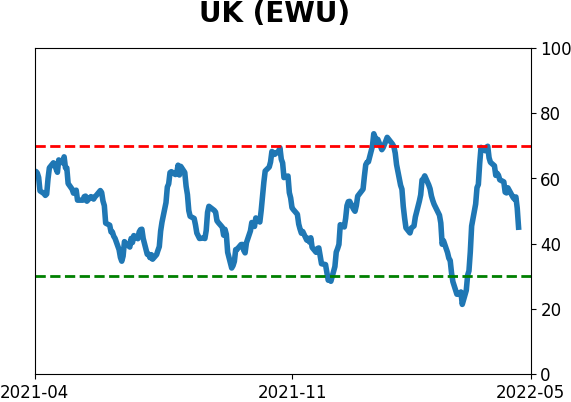
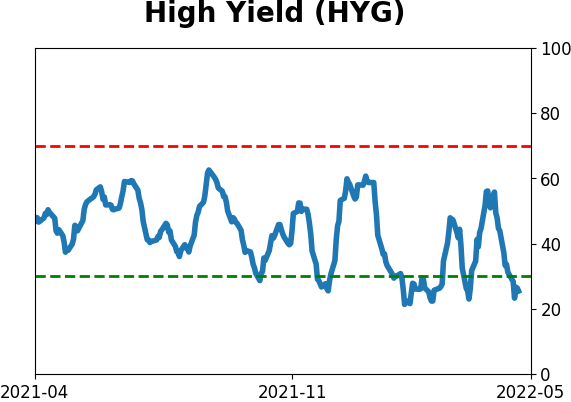
Sentiment Around The World
|
|
|
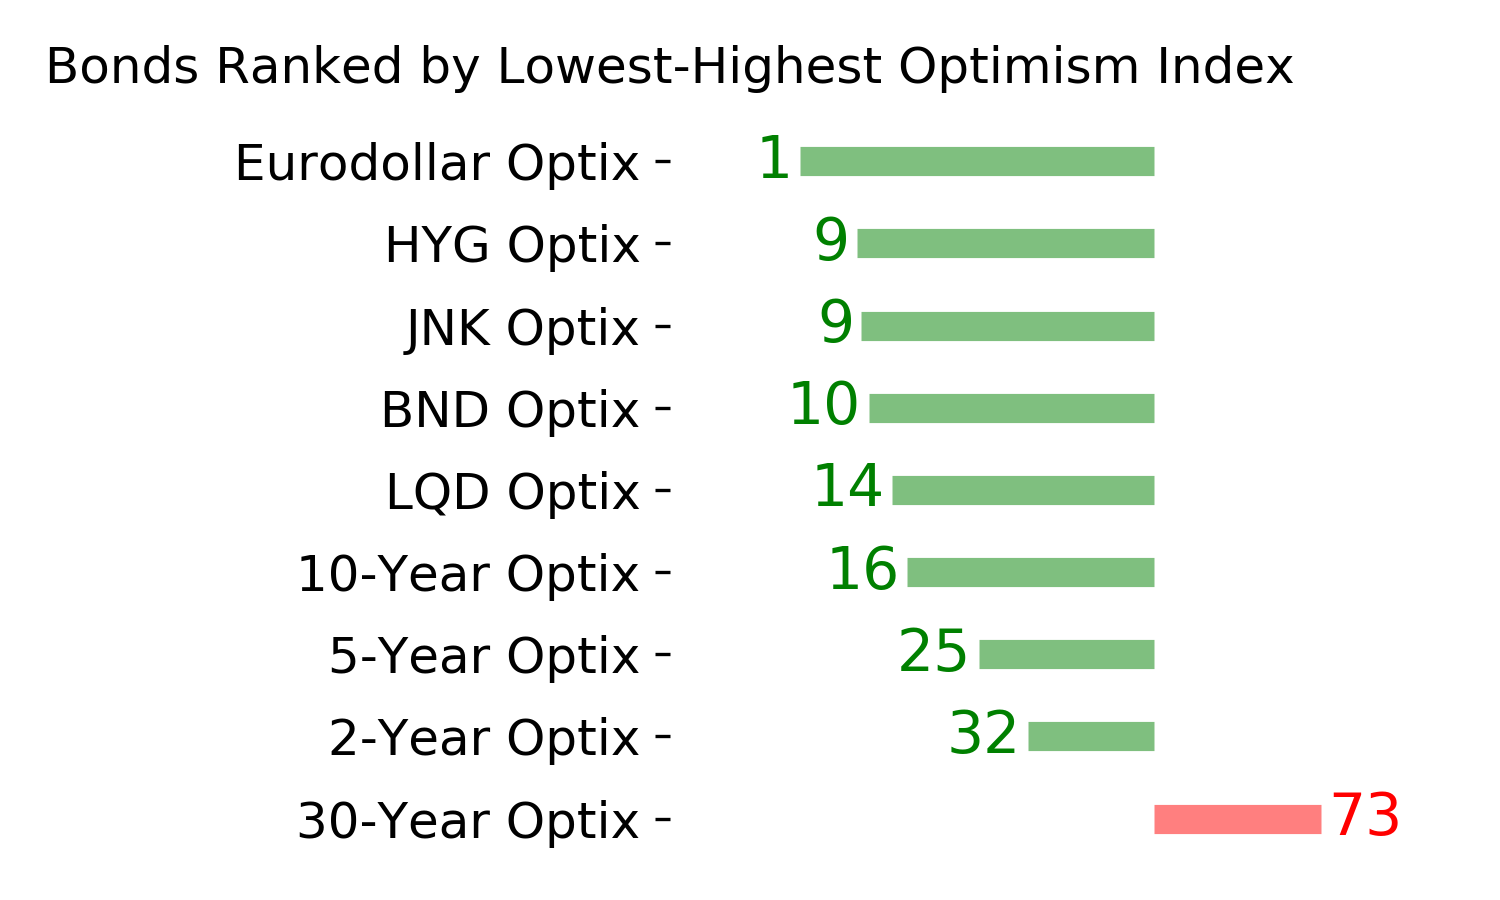
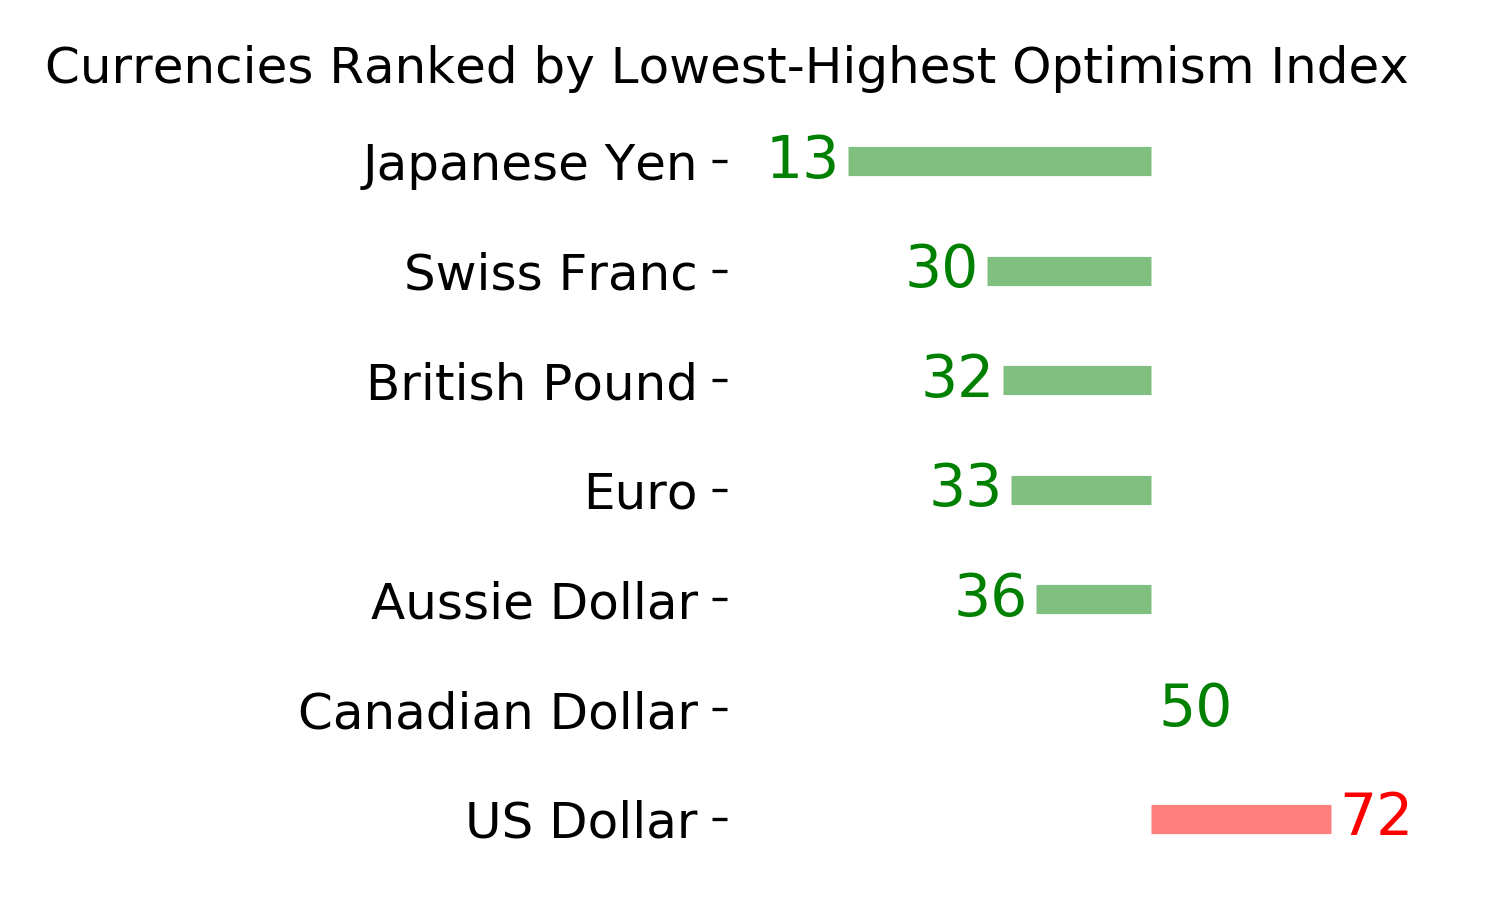
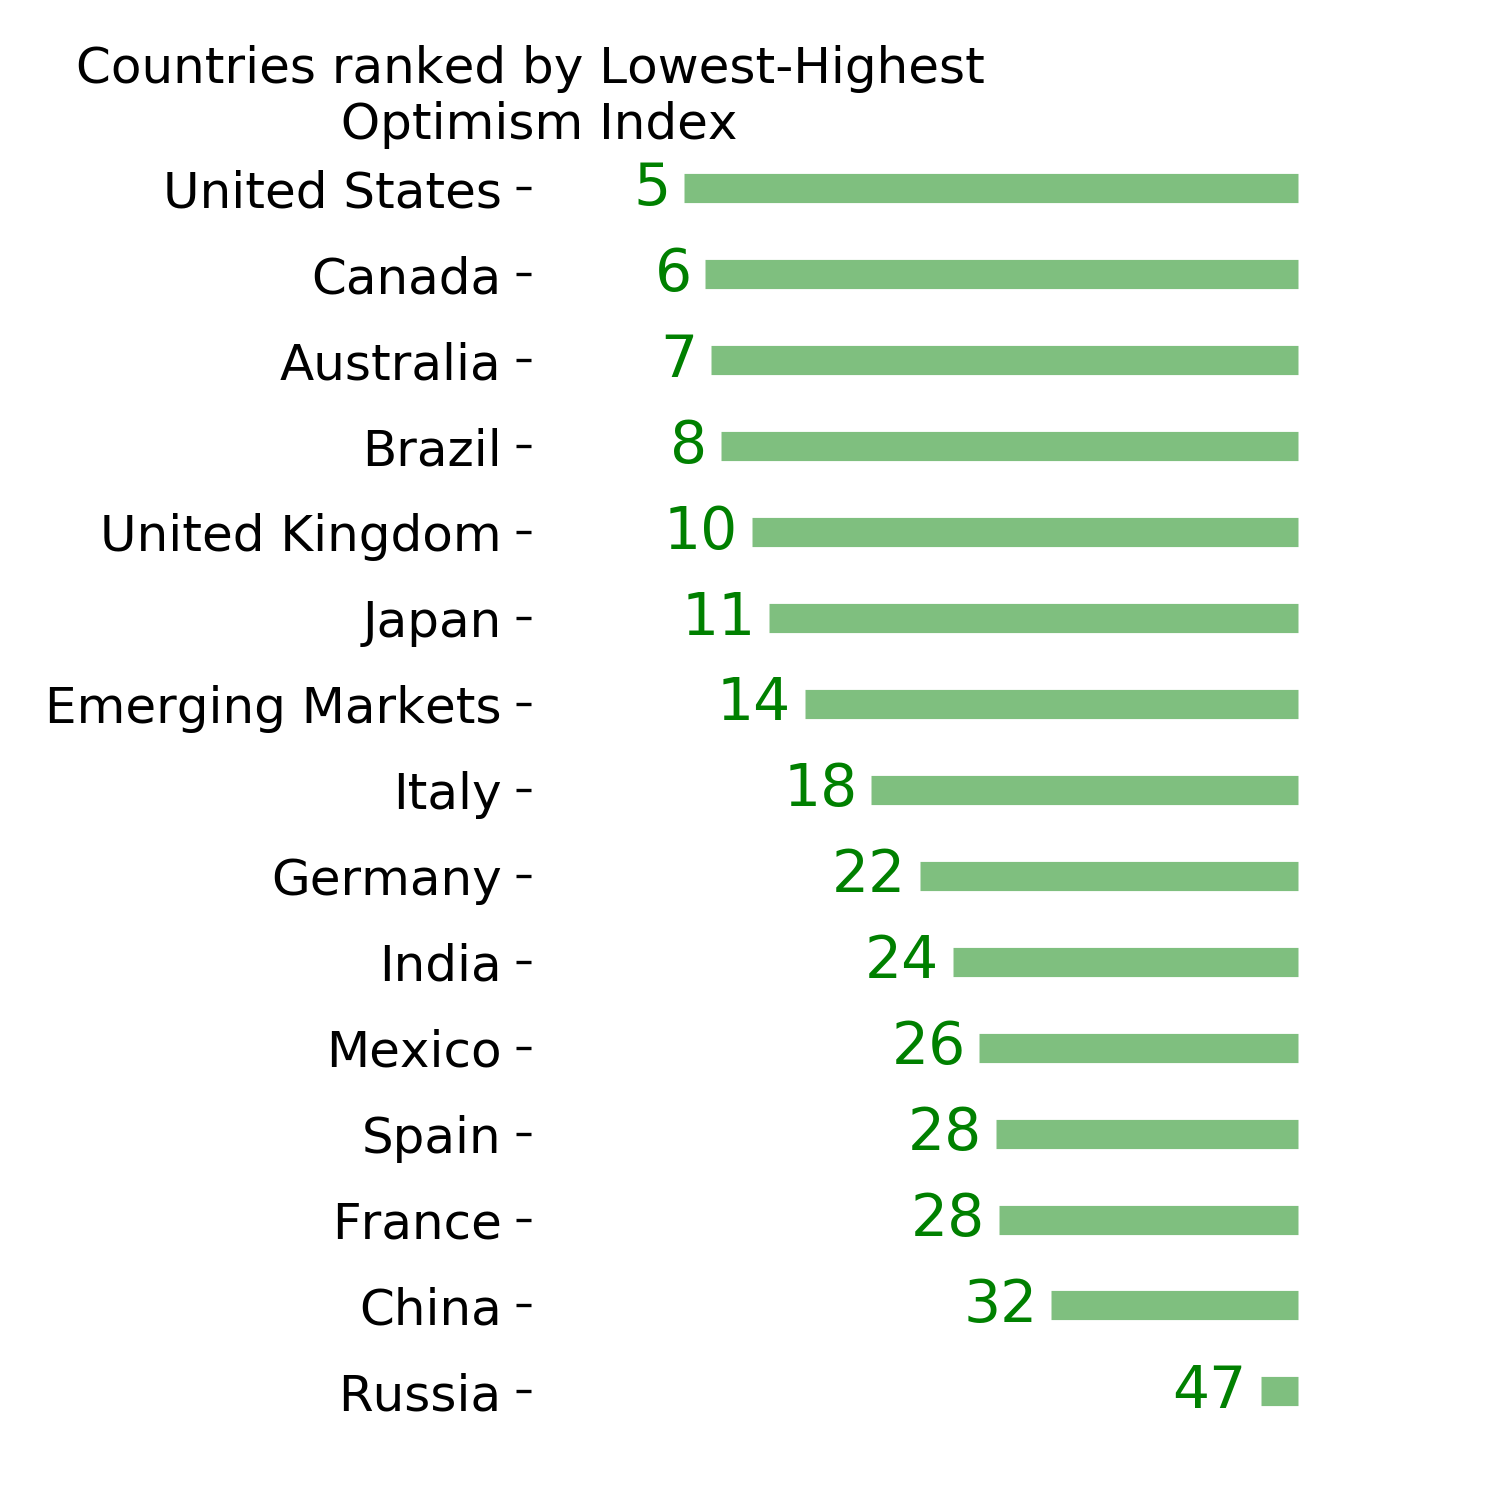
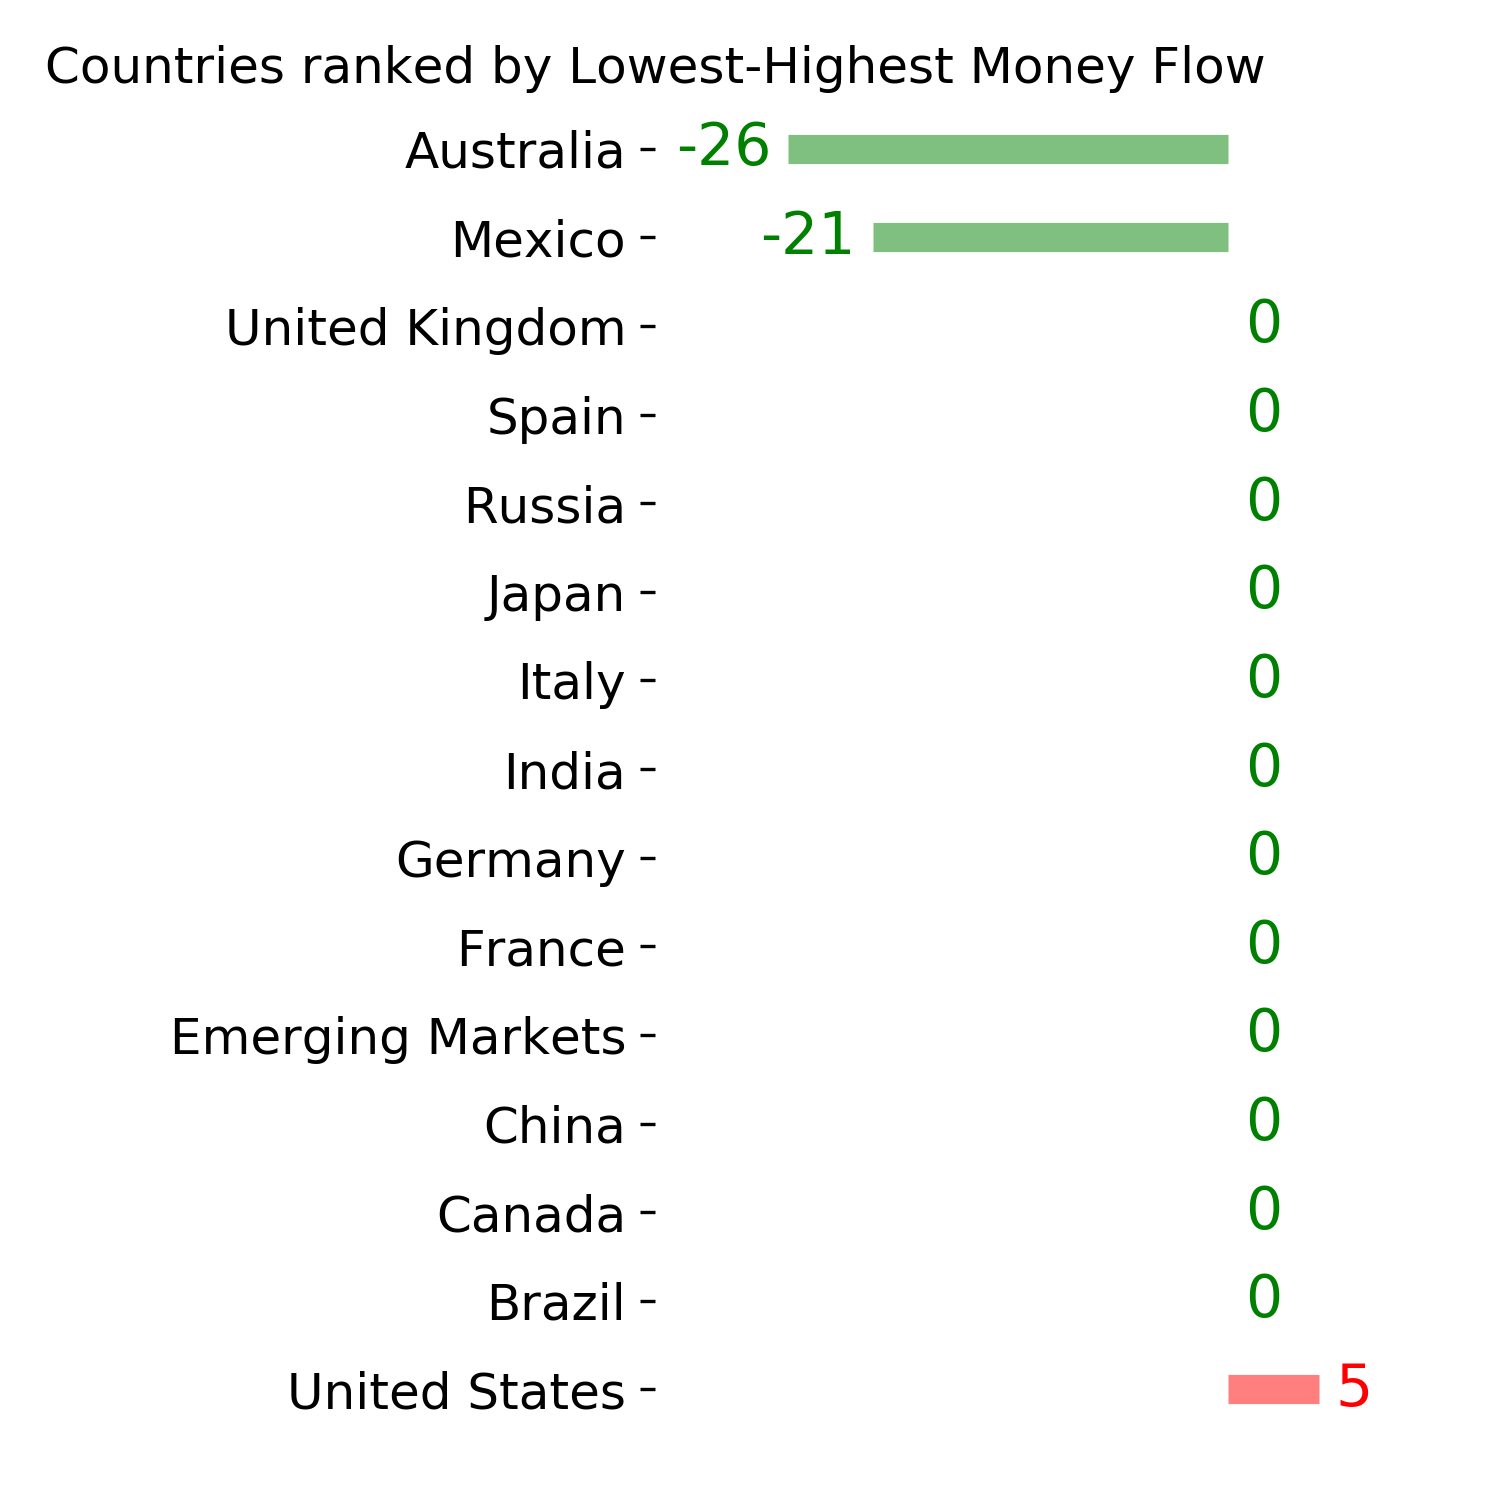
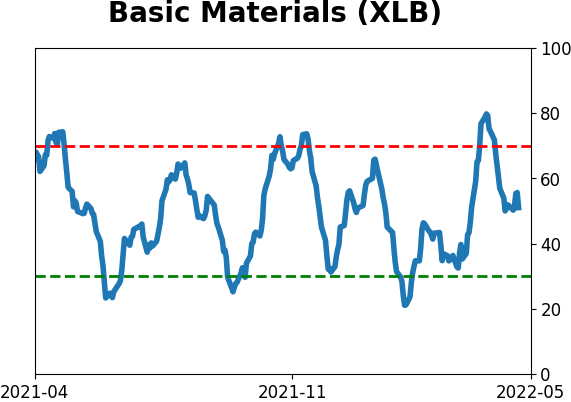
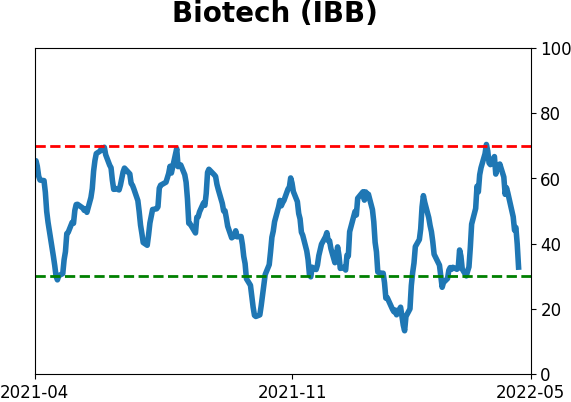
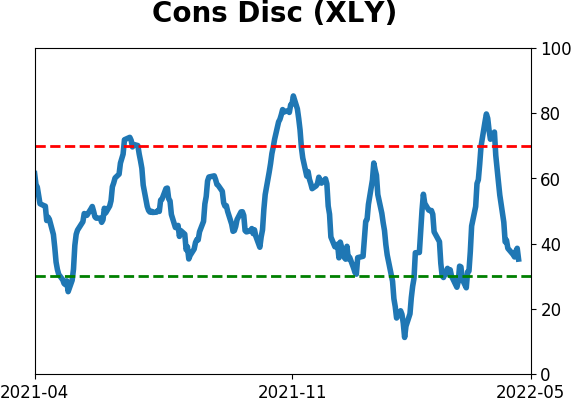
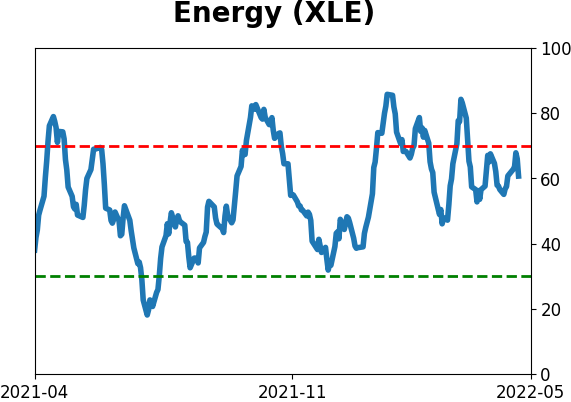
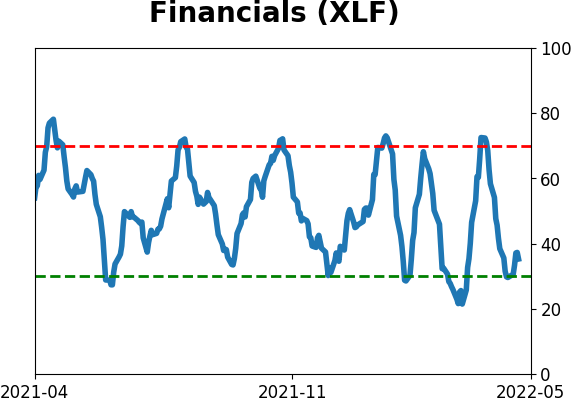
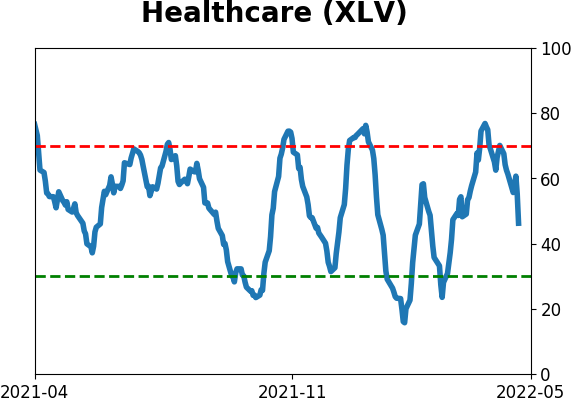
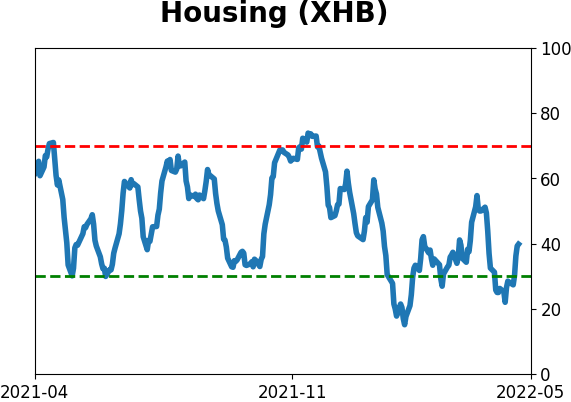
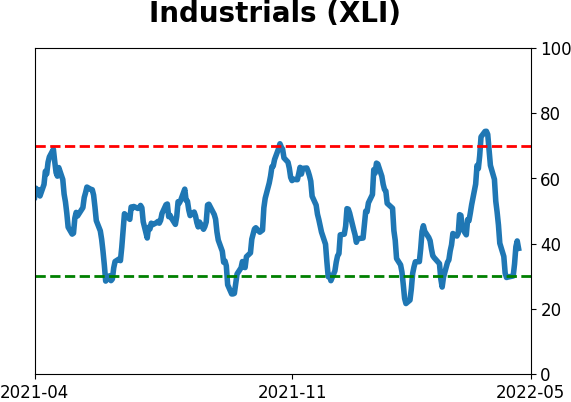
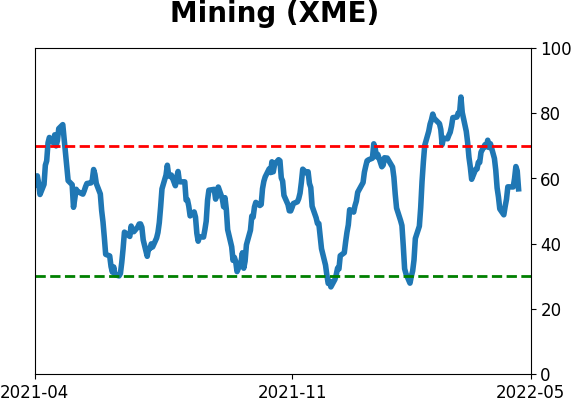
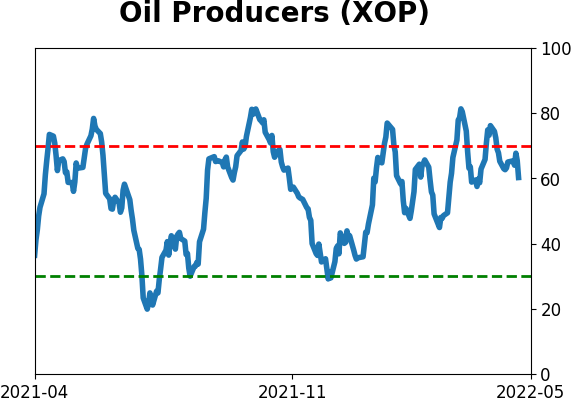
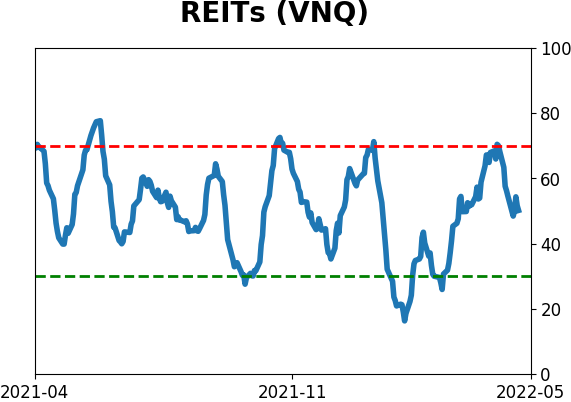
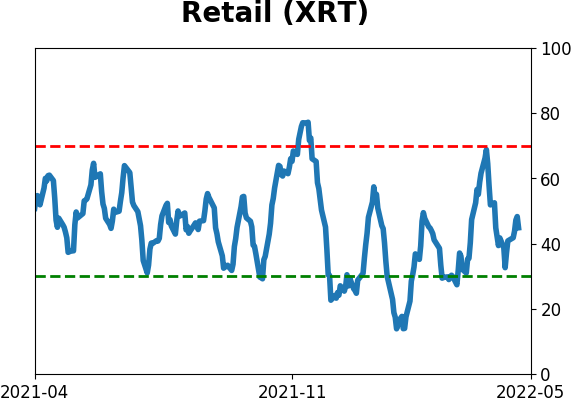
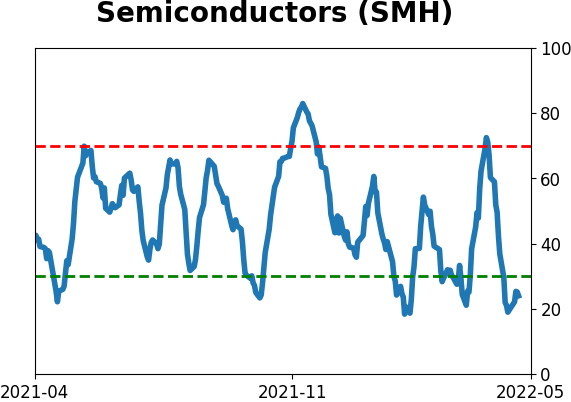
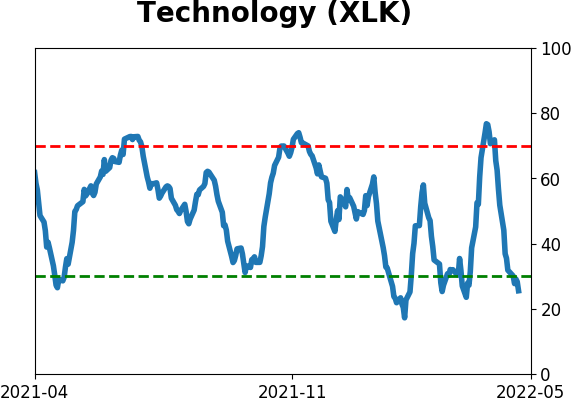
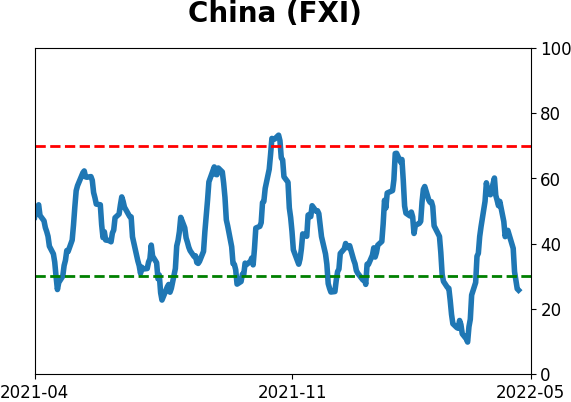
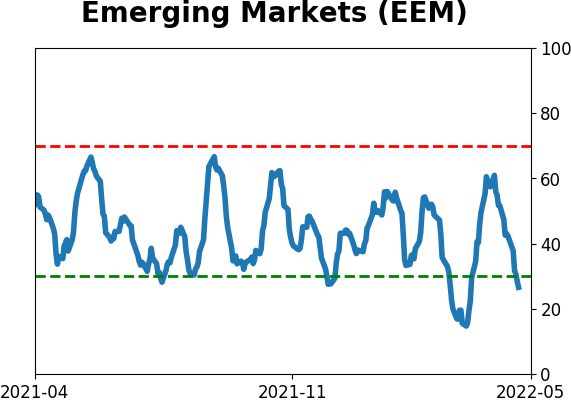
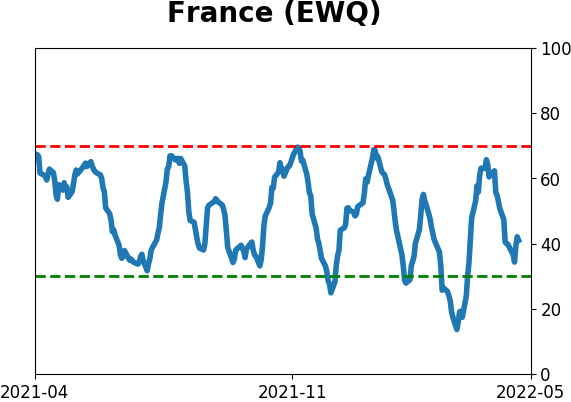
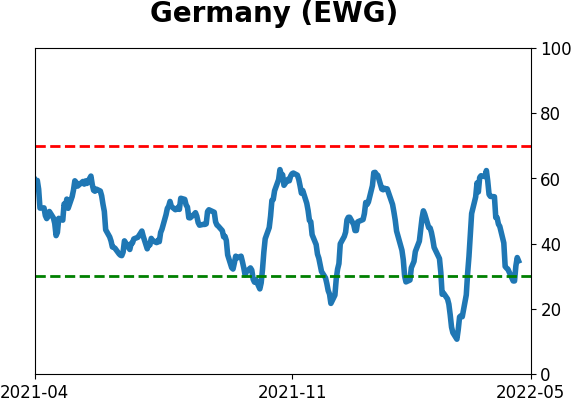
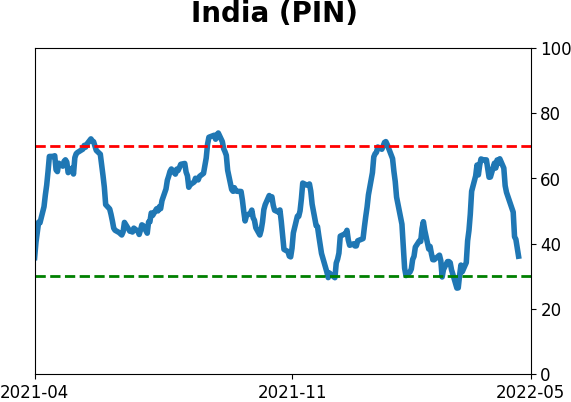
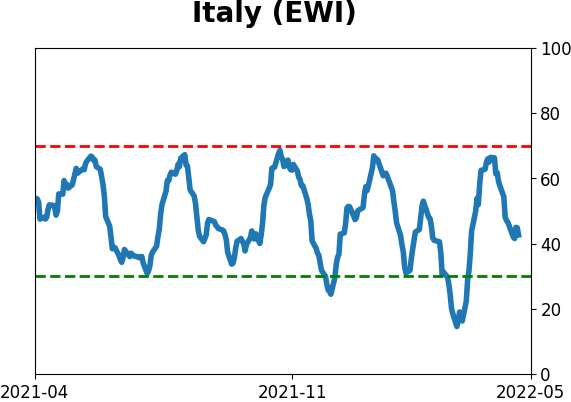
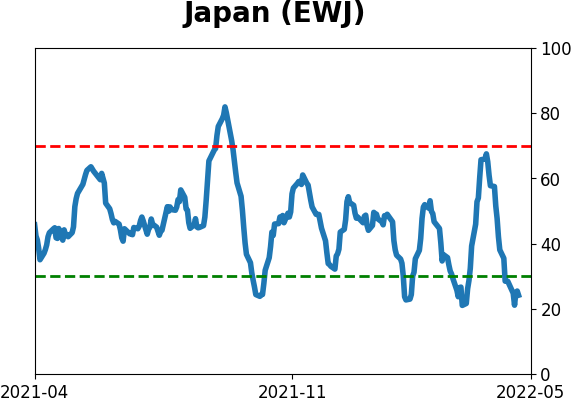
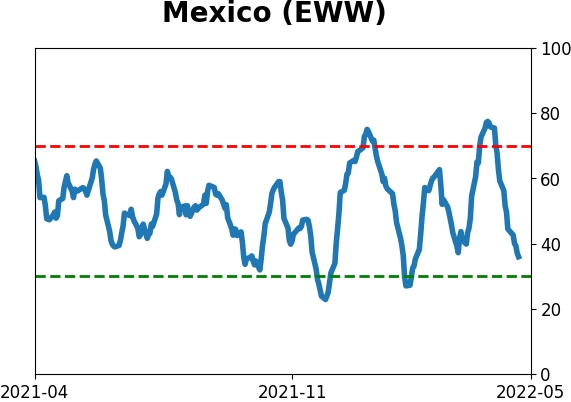
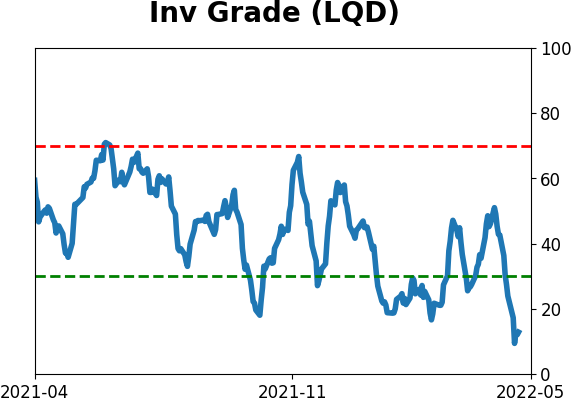
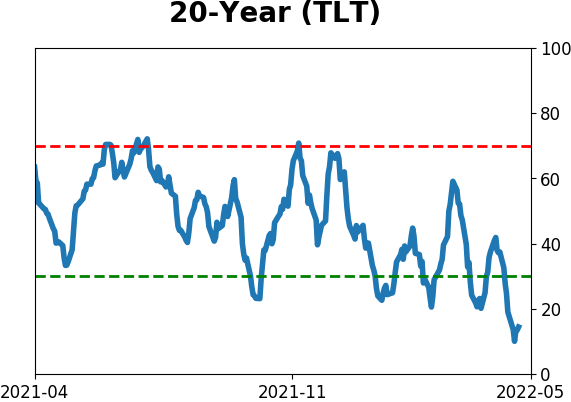
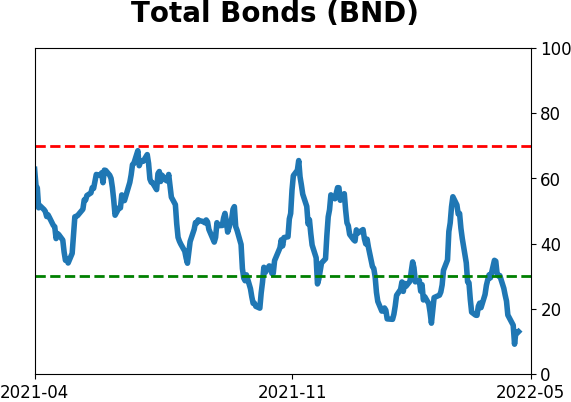
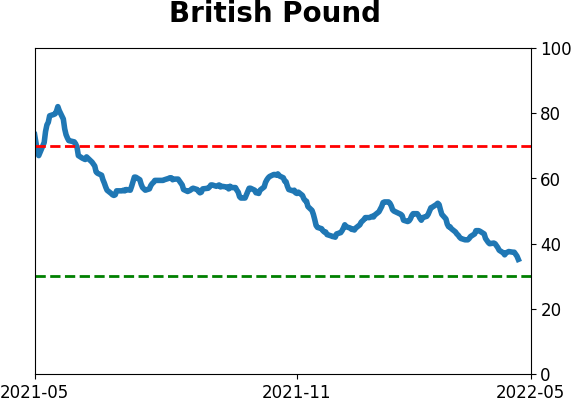
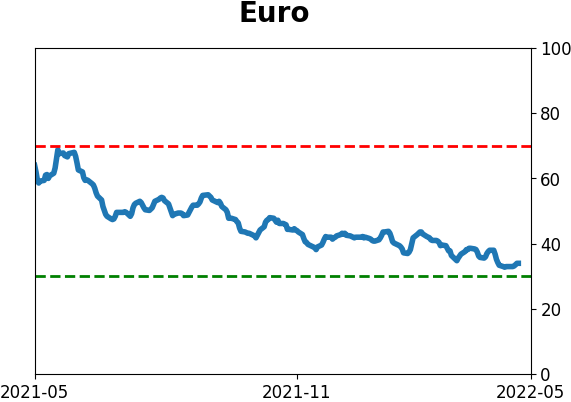
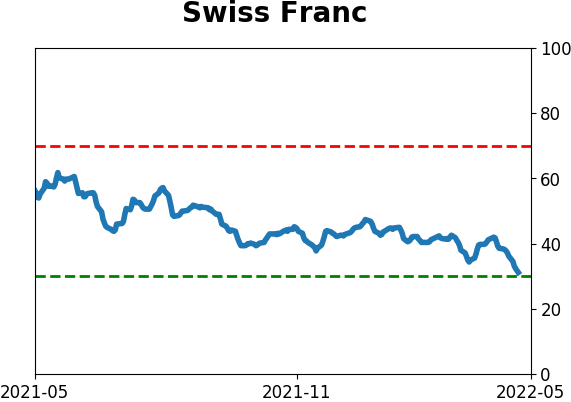
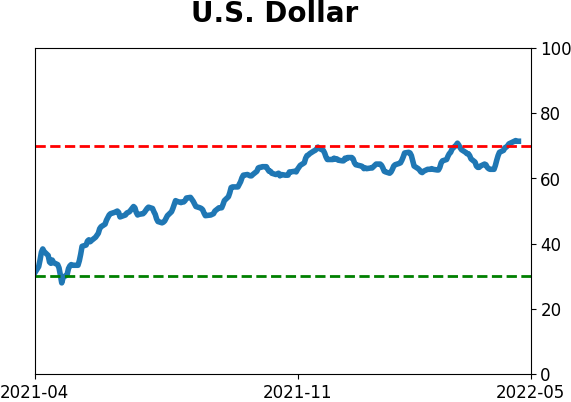
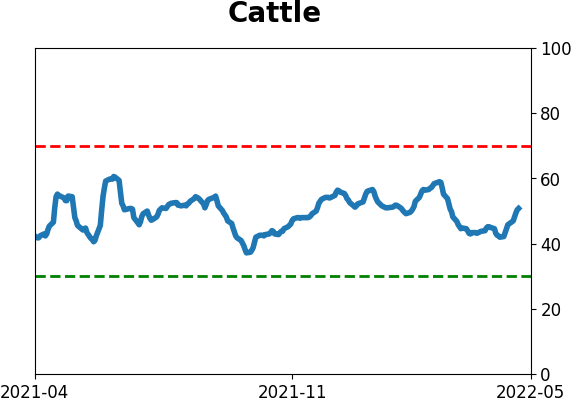
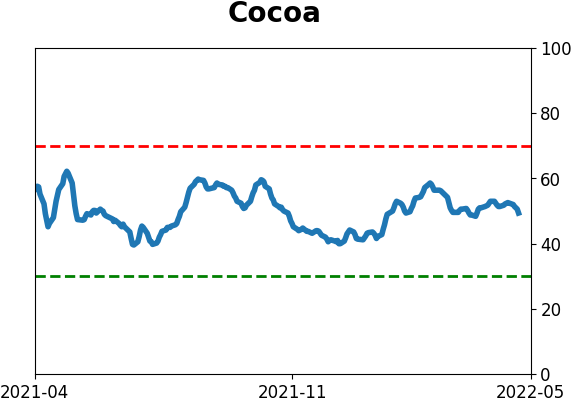
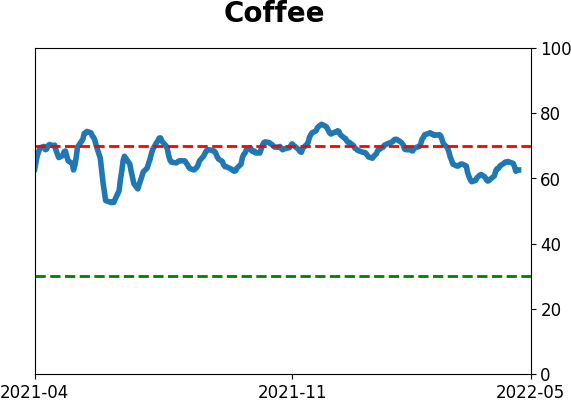
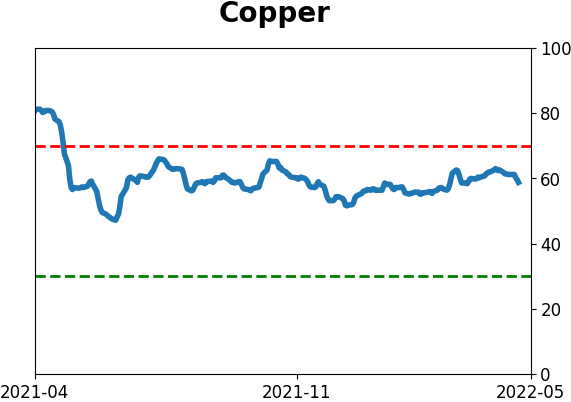
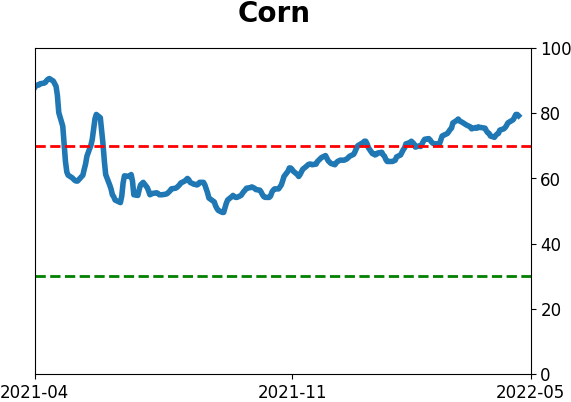
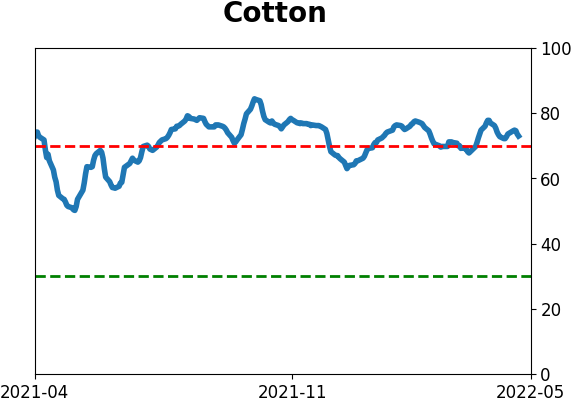
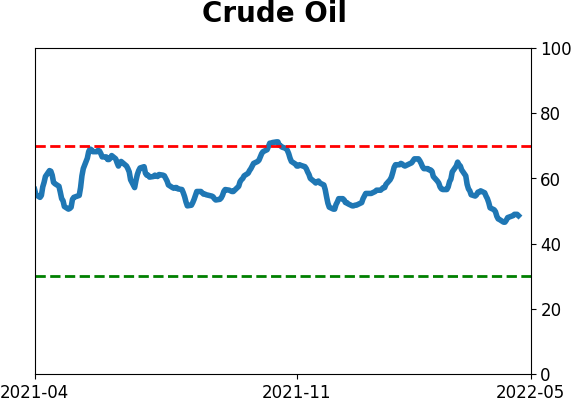
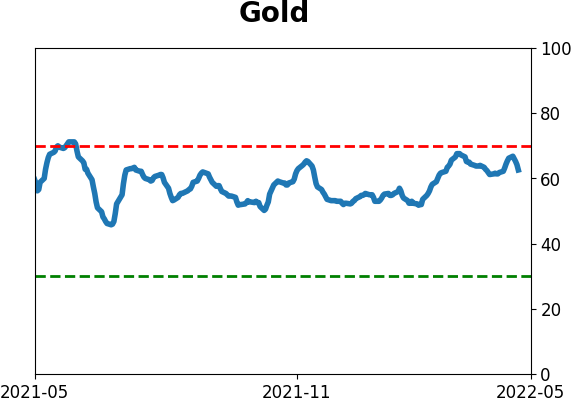
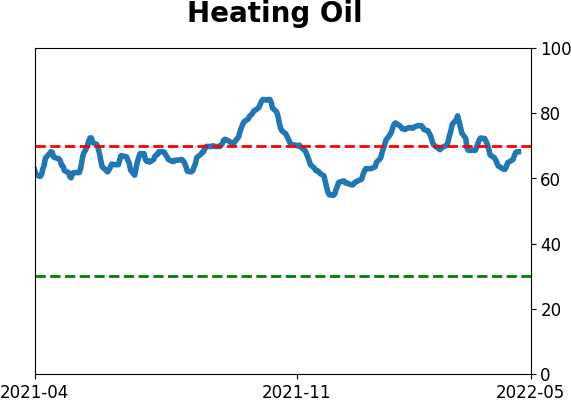
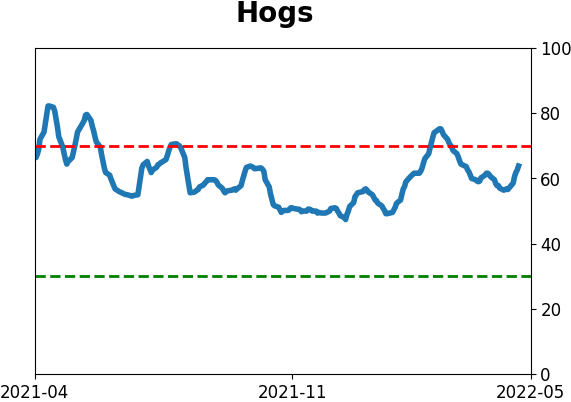
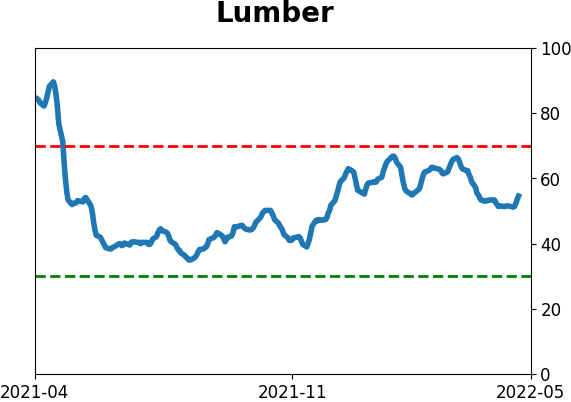
Optimism Index Thumbnails
|
|
|
|
|
|
|
|
|
|
|
|
|
|
|
|
|
|
|
|
|