Headlines
|
|
A bevy of big gains:
Over the past year, the S&P 500 has enjoyed a record number of 1% daily gains versus 1% daily losses. Other periods with nearly as many big gains versus losses saw poor forward returns. Several sectors have joined the S&P with nearly as many gains vs losses.
Bottom Line:
See the Outlook & Allocations page for more details on these summaries STOCKS: Weak sell
The extreme speculation registered in January and February is starting to get wrung out. Internal dynamics have mostly held up, so a return to neutral sentiment conditions would improve the forward risk/reward profile substantially. We're still a ways off from that. BONDS: Weak buy
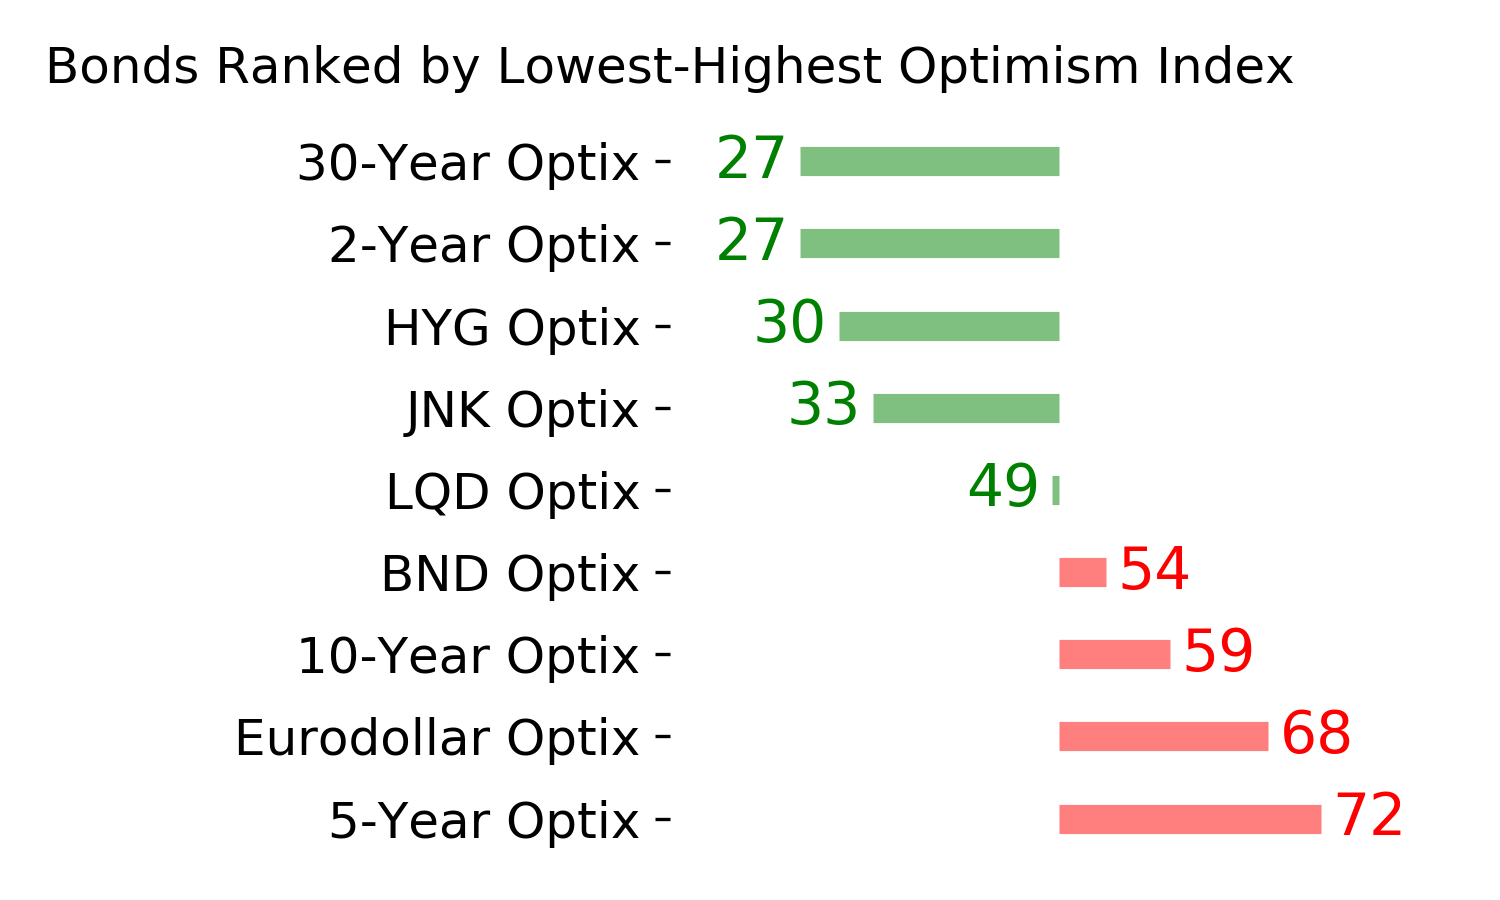
Various parts of the market have been hit in recent weeks, with mild oversold conditions. The Bond Optimism Index is now about as low as it gets during healthy bond market environments. Fixed income isn't responding well, so that needs to be monitored in case it's transitioning to a longer-term negative market environment. GOLD: Weak buy
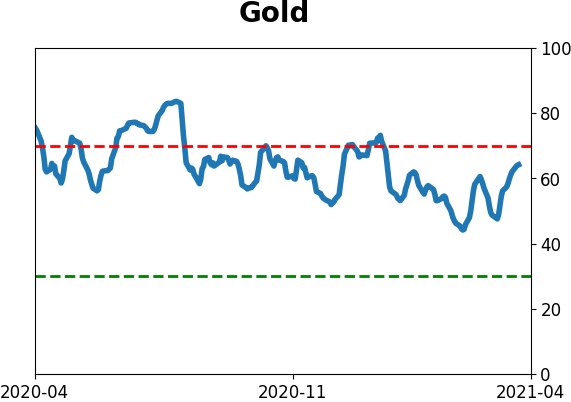
A dollar trying to rebound from a severe short position has weighed on gold and miners. The types of signals they've given in recent weeks, within the context of their recent surge, have usually resulted in higher prices over a medium- to long-term time frame. Like bonds, gold and miners aren't responding very well, and this needs to be monitored.
|
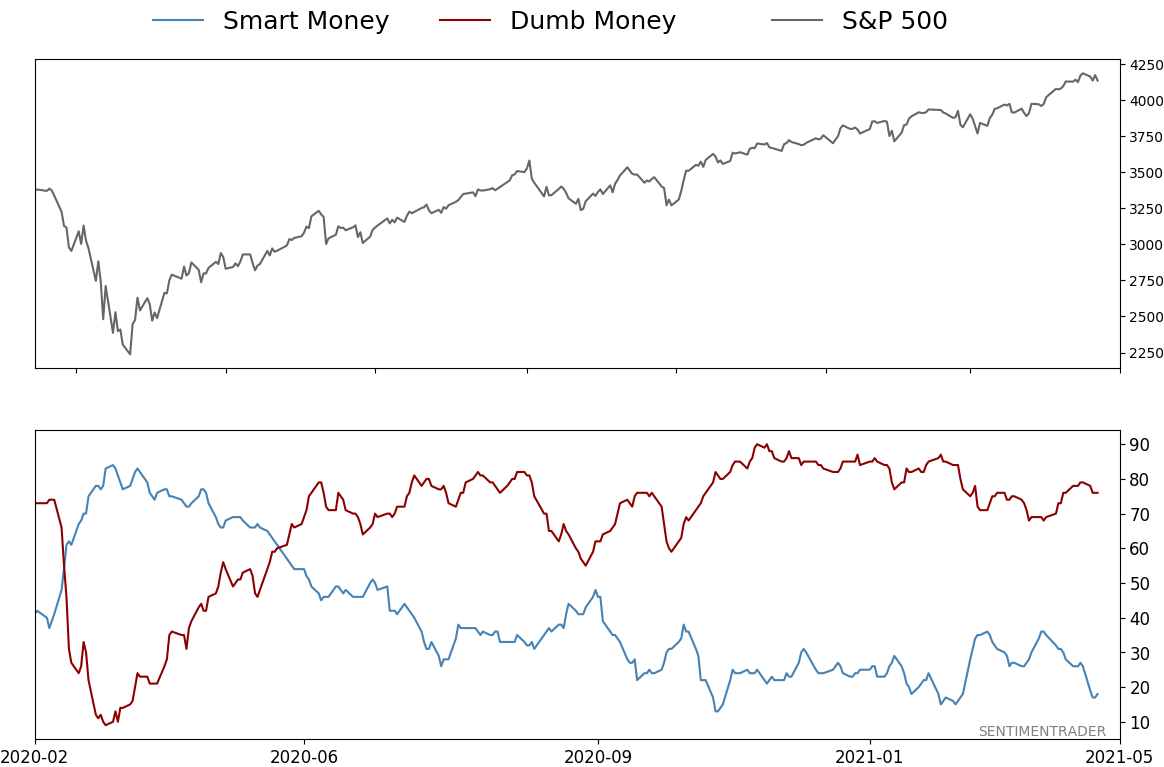
Smart / Dumb Money Confidence
|
Smart Money Confidence: 18%
Dumb Money Confidence: 76%
|
|
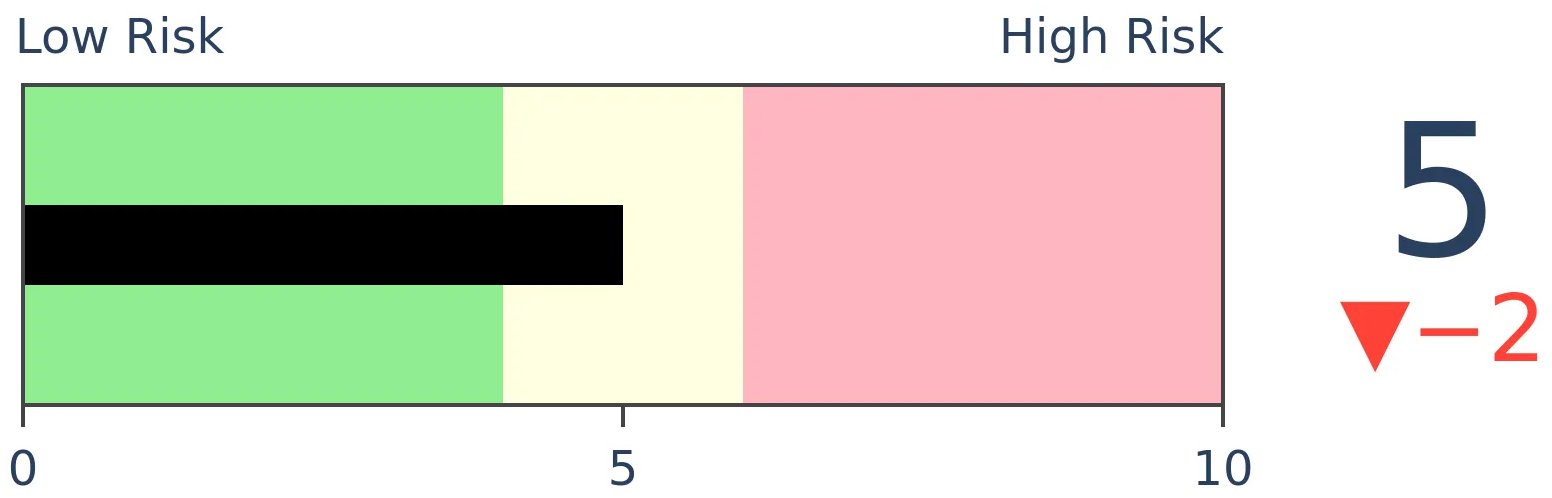
Risk Levels
Stocks Short-Term
|
Stocks Medium-Term

|
|
Bonds
|
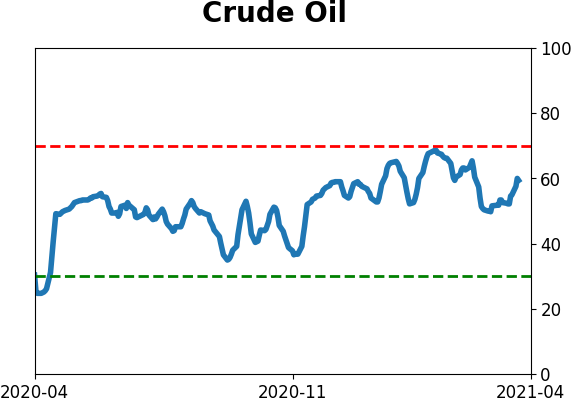
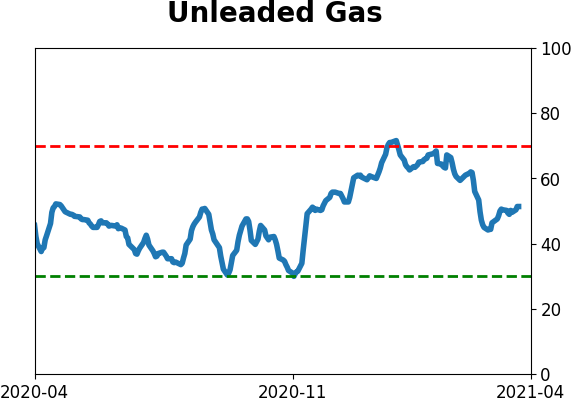
Crude Oil
|
|
Gold

|
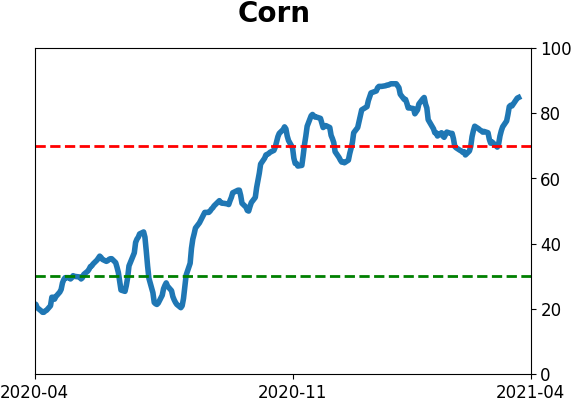
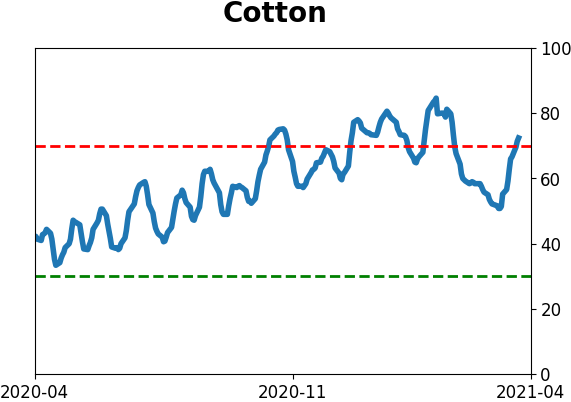
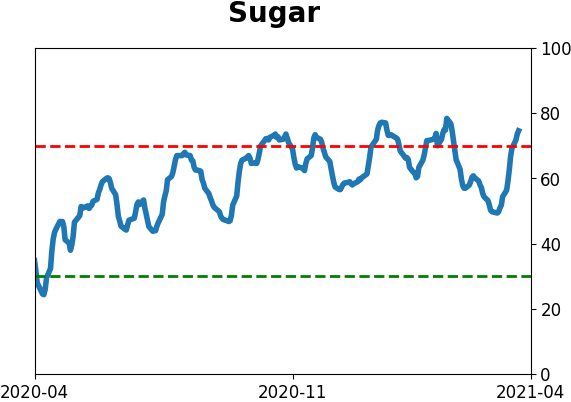
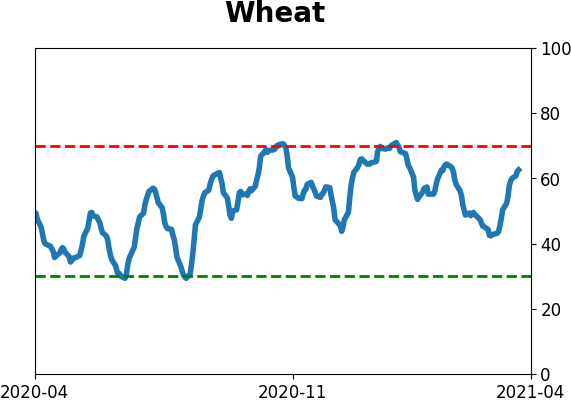
Agriculture
|
|
Research
BOTTOM LINE
Over the past year, the S&P 500 has enjoyed a record number of 1% daily gains versus 1% daily losses. Other periods with nearly as many big gains versus losses saw poor forward returns. Several sectors have joined the S&P with nearly as many gains vs losses.
FORECAST / TIMEFRAME
None
|
Stocks have been running hot, and investors are responding. More and more extremes have been triggering, helping to push valuations high amid low volatility.
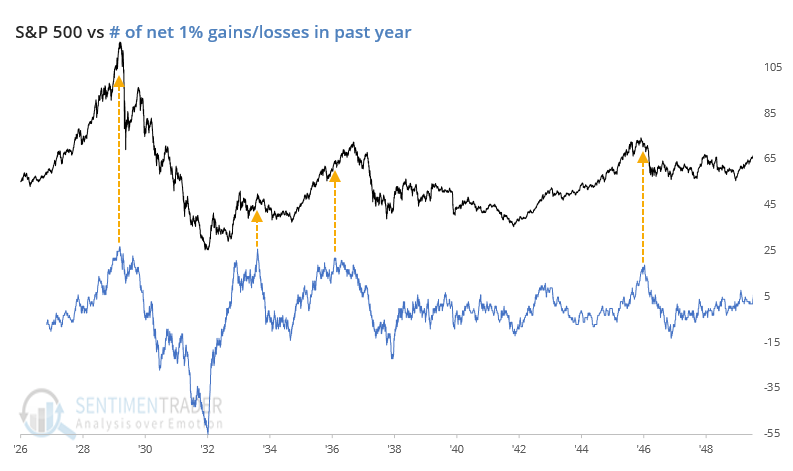
The past few weeks have only added to a historic run from the months before that. At various points during the past year, we've looked at streaks of large gains in the S&P or different sectors, and it's only gotten more remarkable. Even with a breather over the past couple of sessions, the S&P has never before seen a year with more +1% daily gains versus -1% losses.
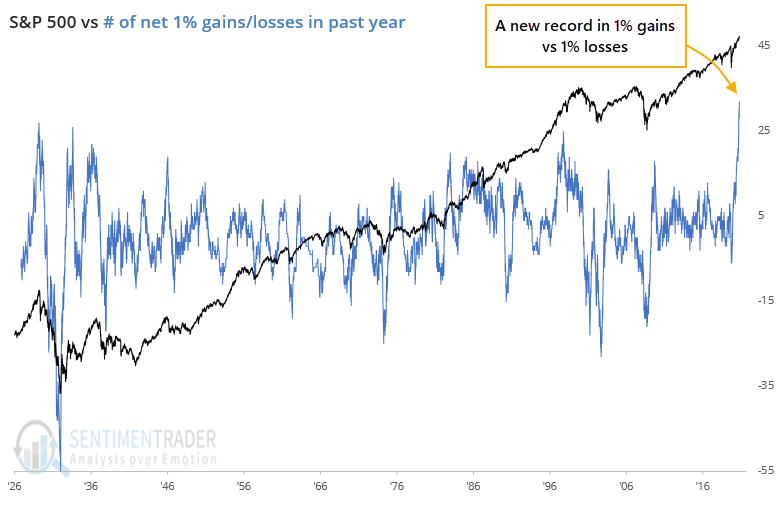
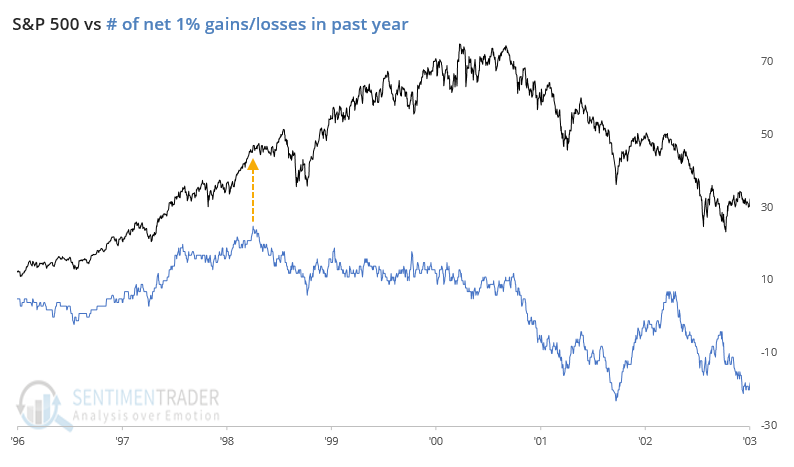
The past year has seen 32 more big gains versus losses, more than the net +27 days heading into September 1929, +26 days into February 1934, and +25 days into April 1998.
When we zoom in on the time periods that saw nearly as many big gains vs. losses as the past year, we can see how stocks struggled to hold the momentum.
The last instance, in 1998, preceded a very rocky period, but stocks didn't ultimately peak for a couple of years.
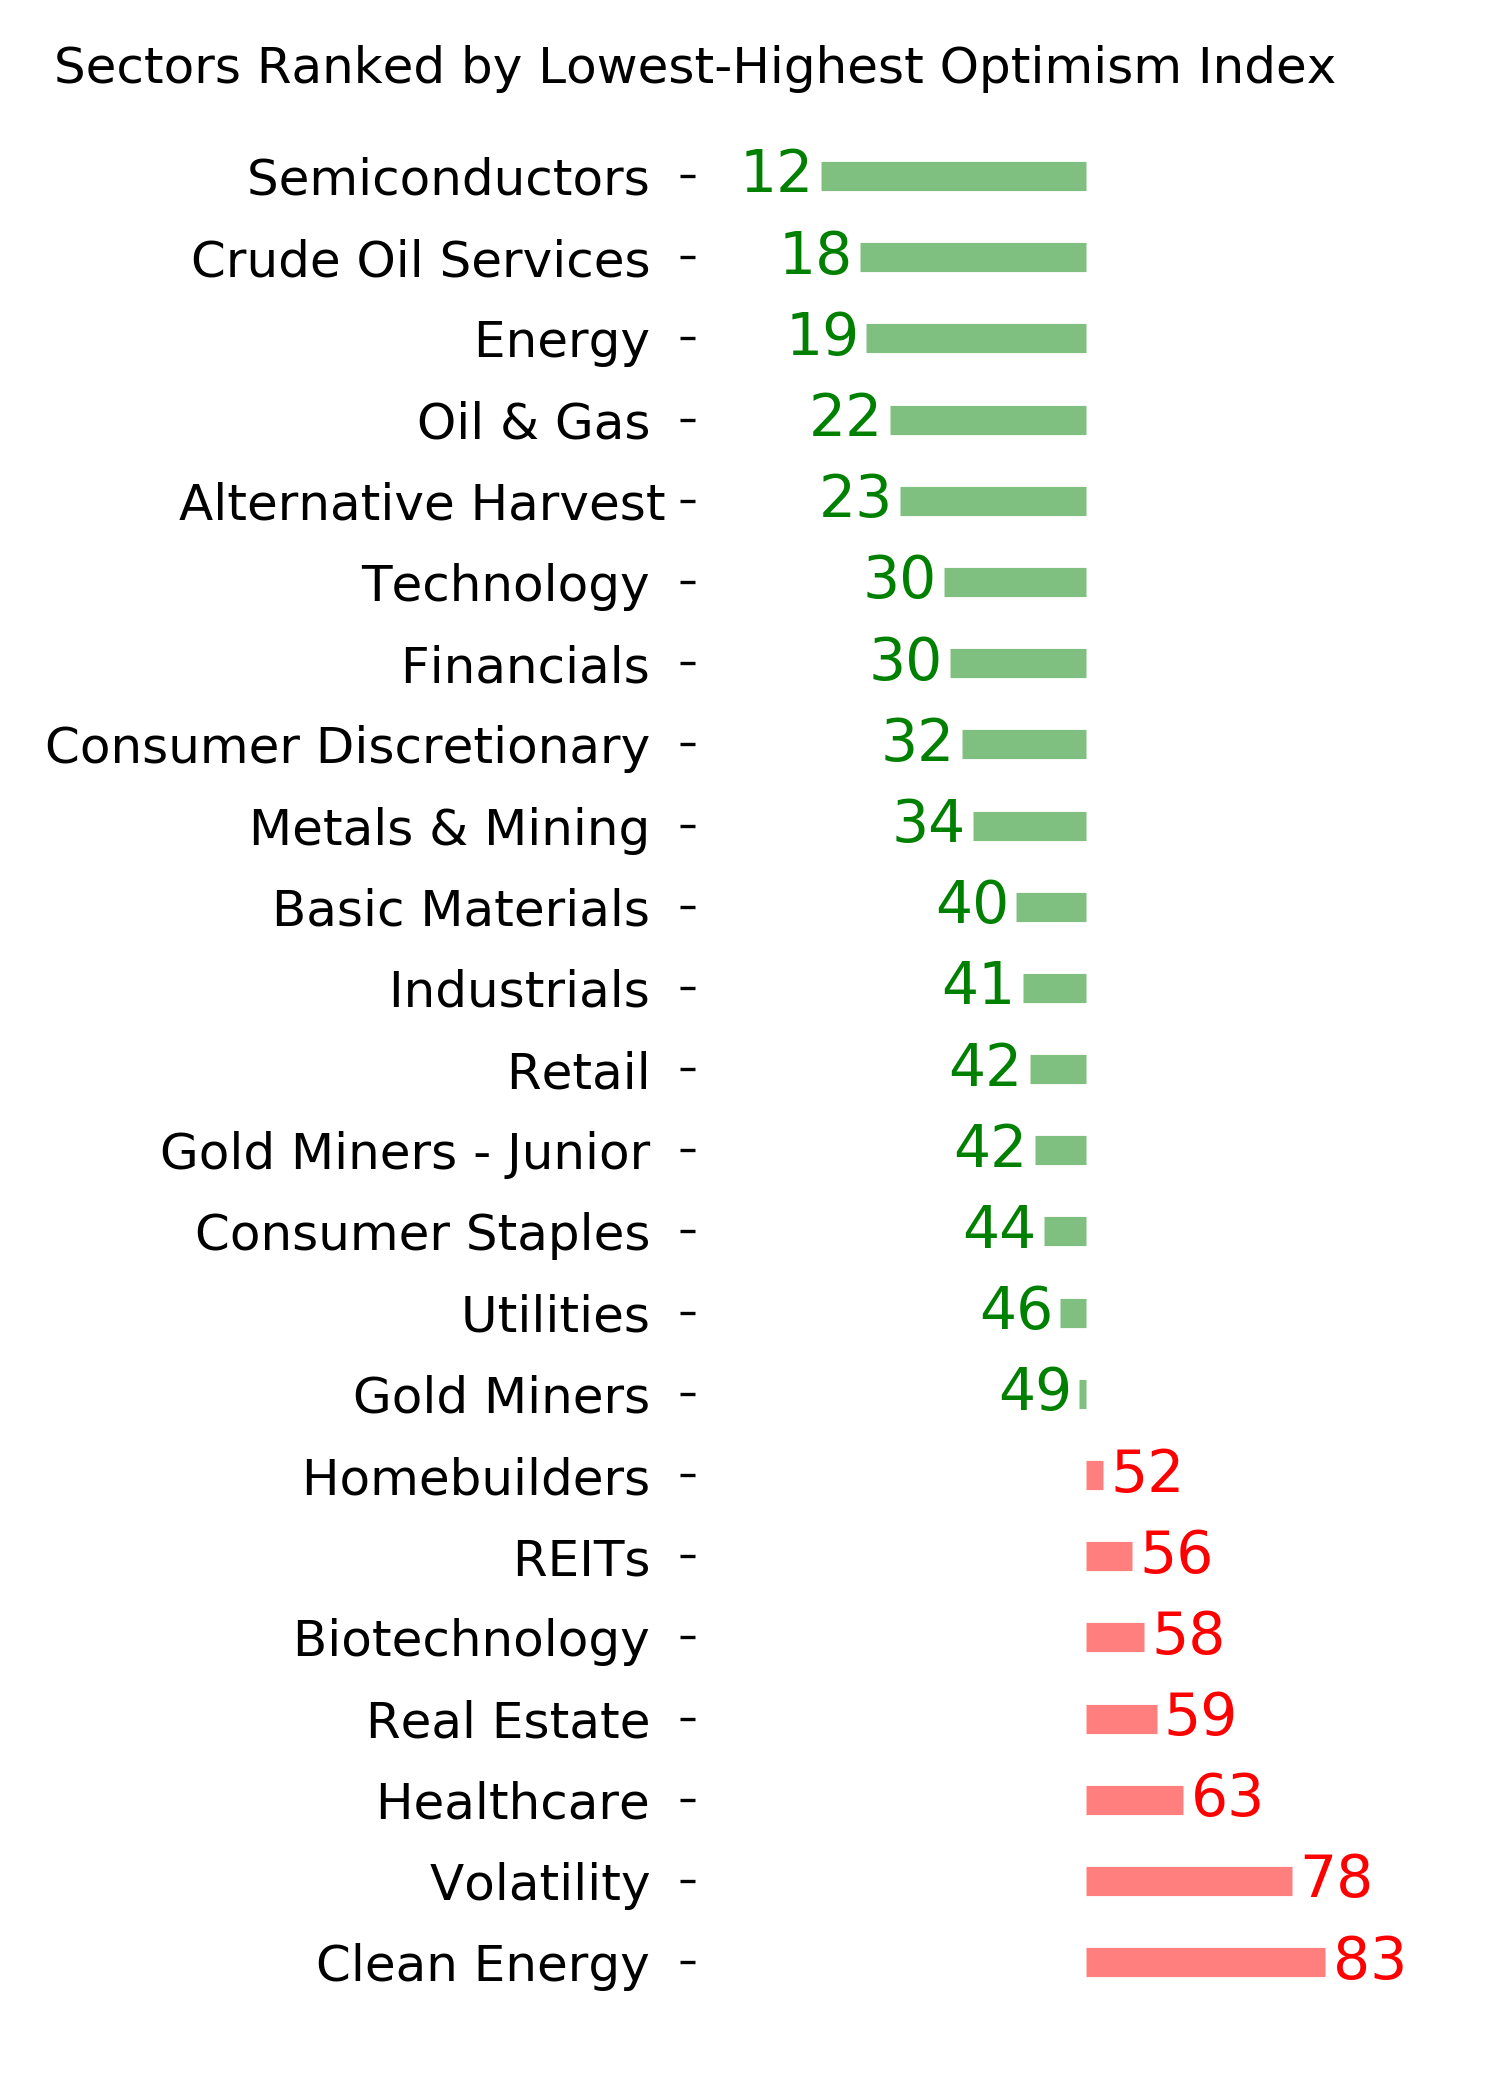
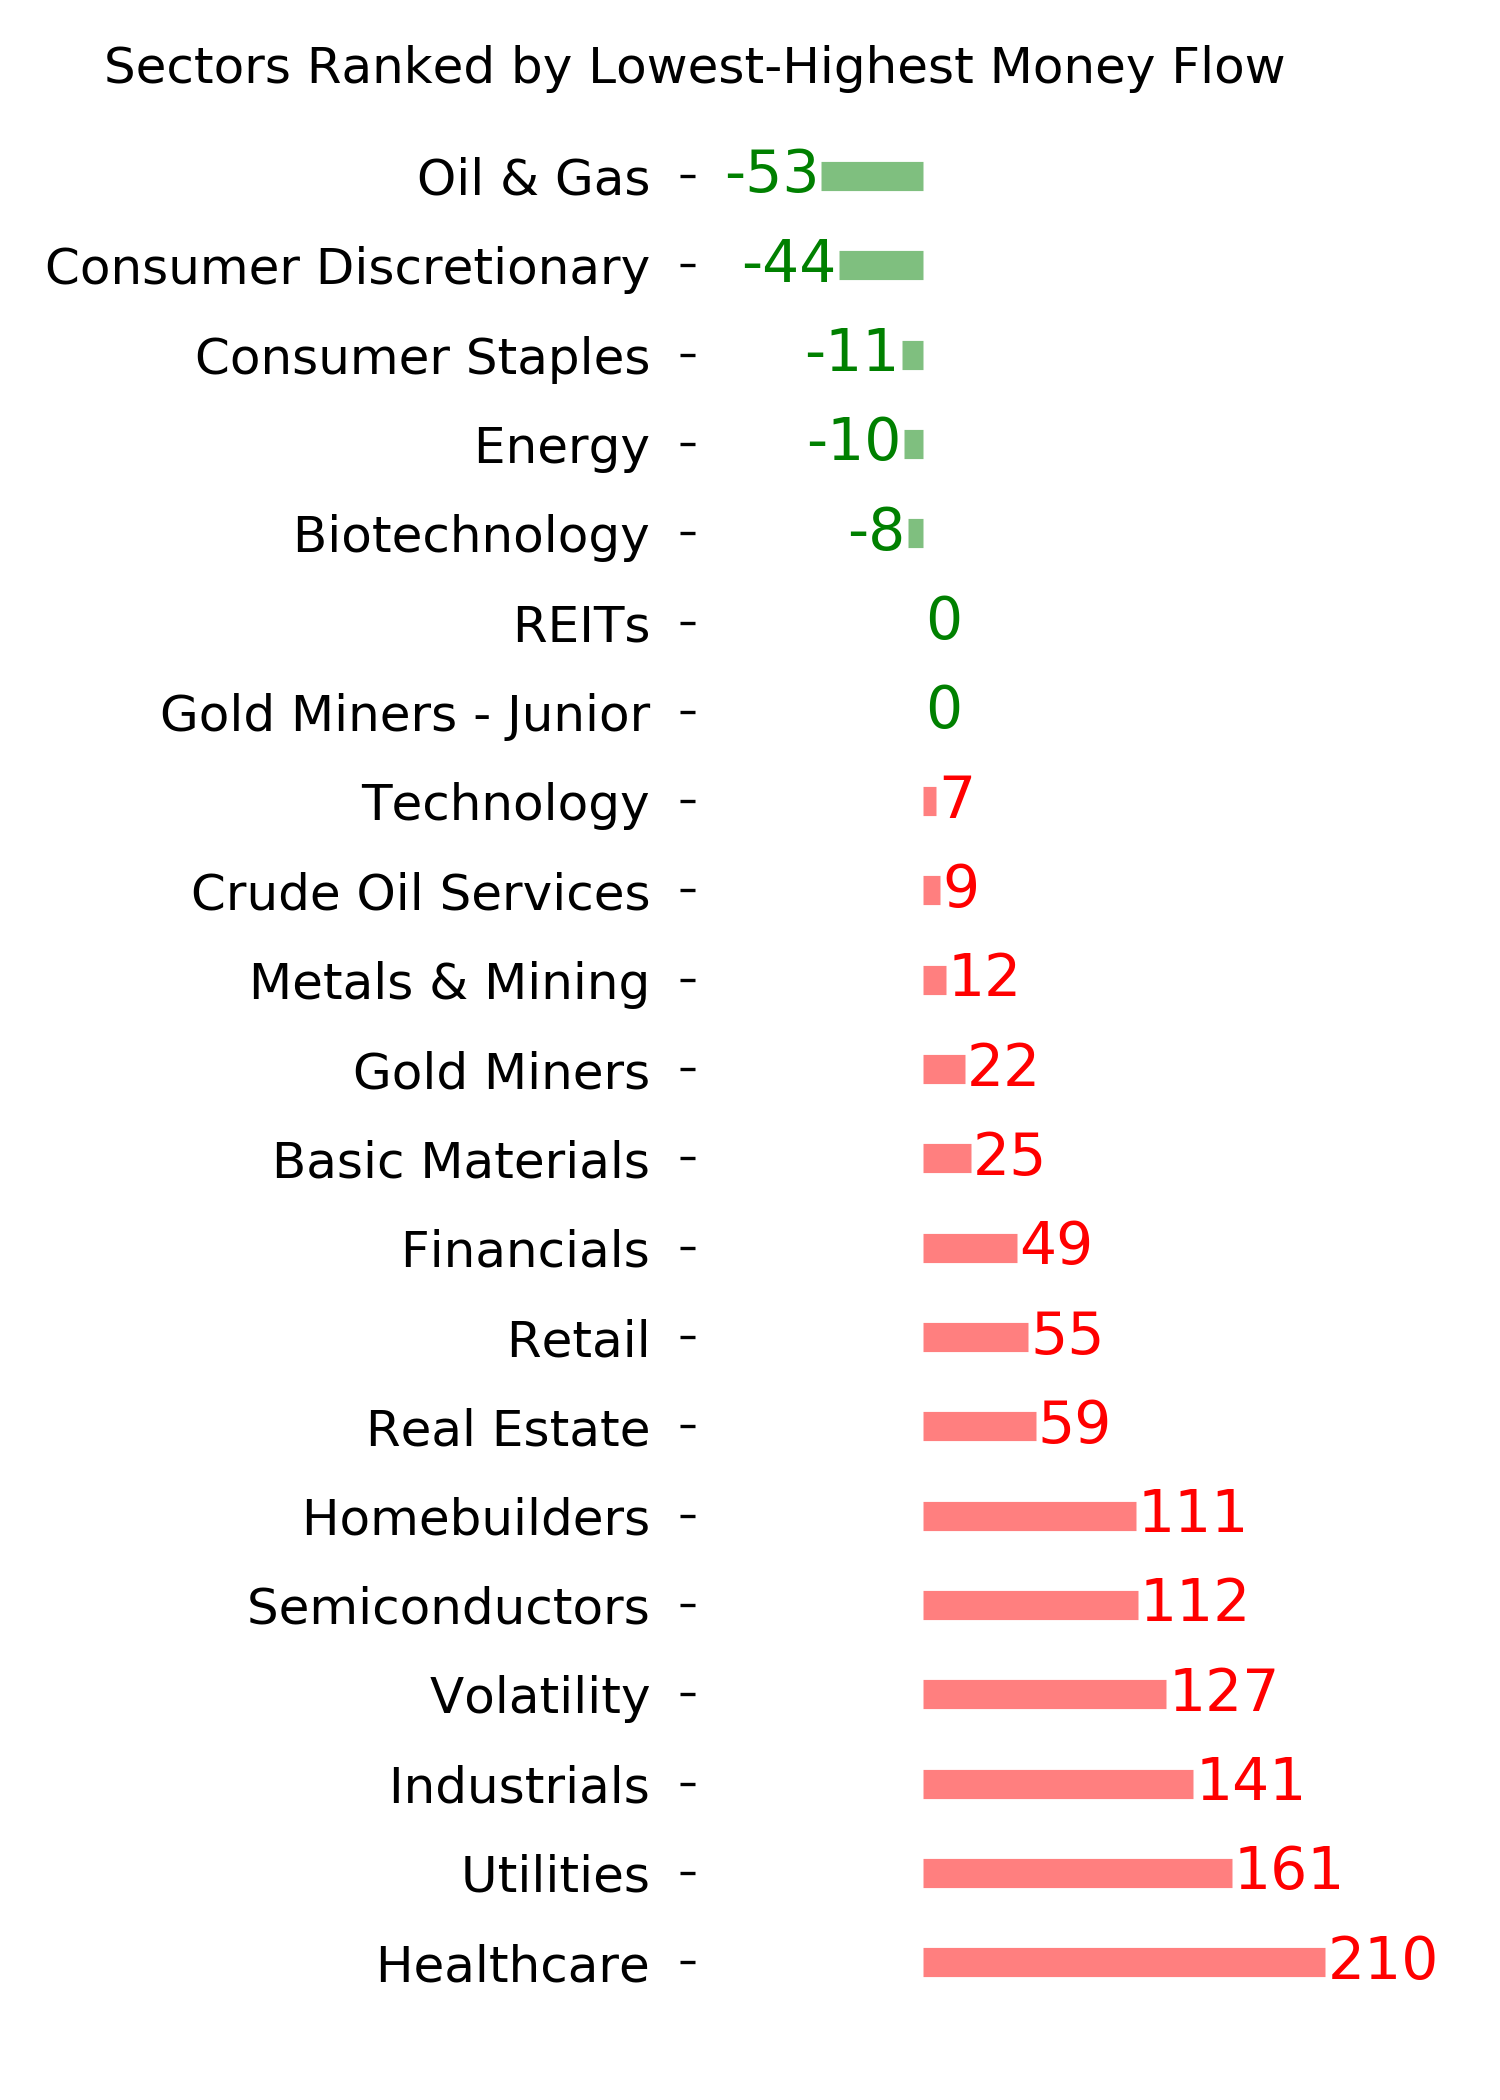
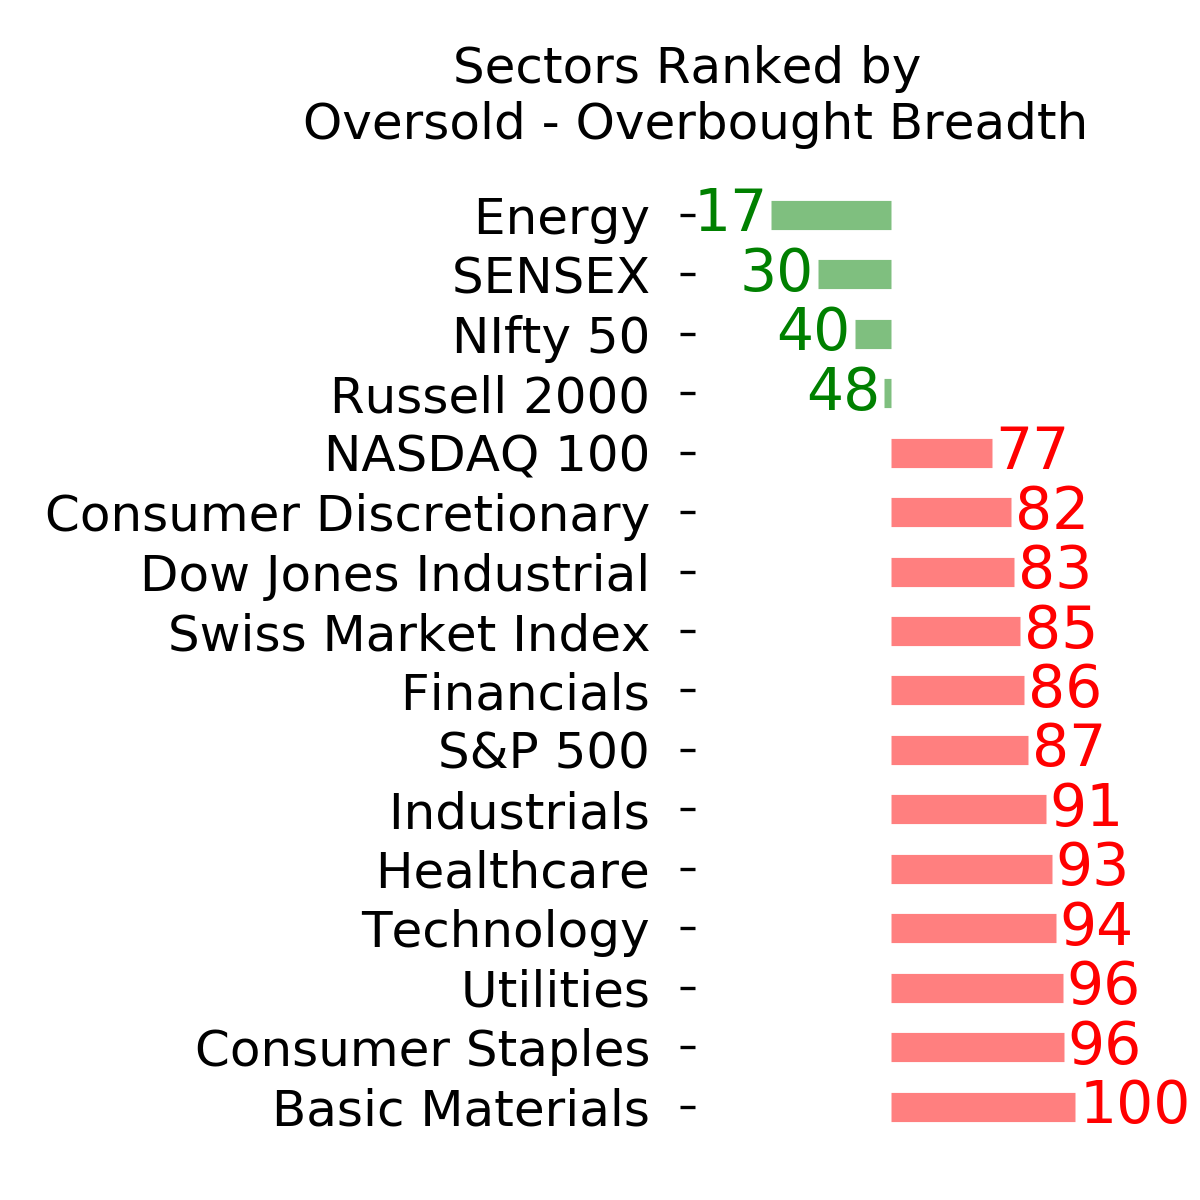
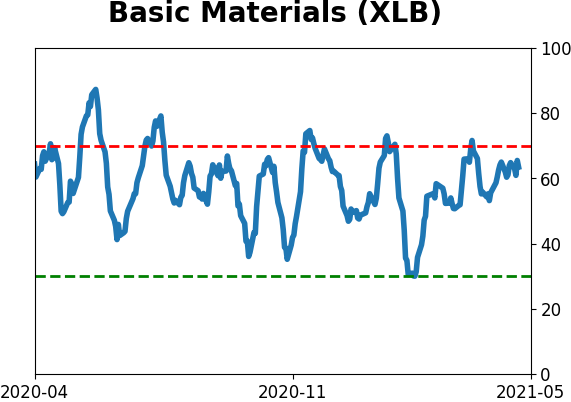
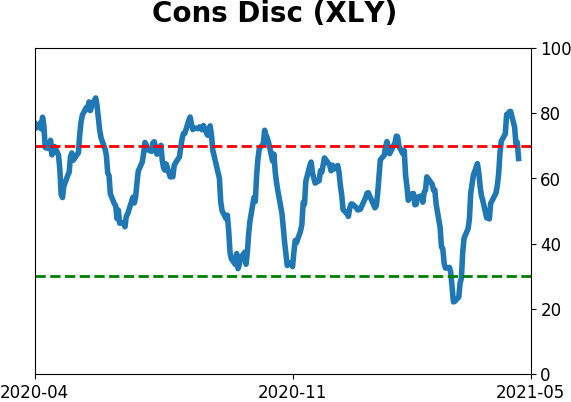
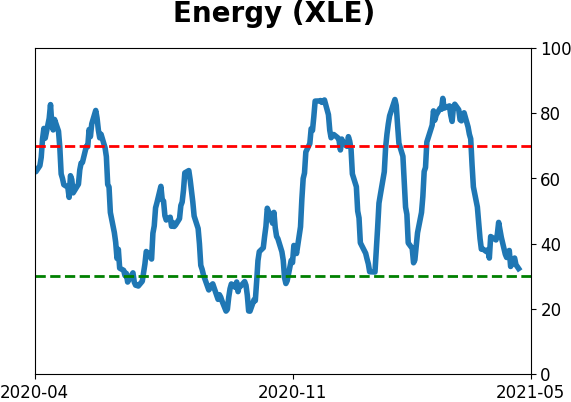
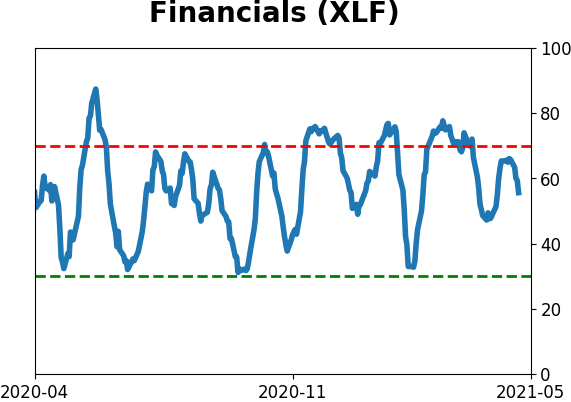
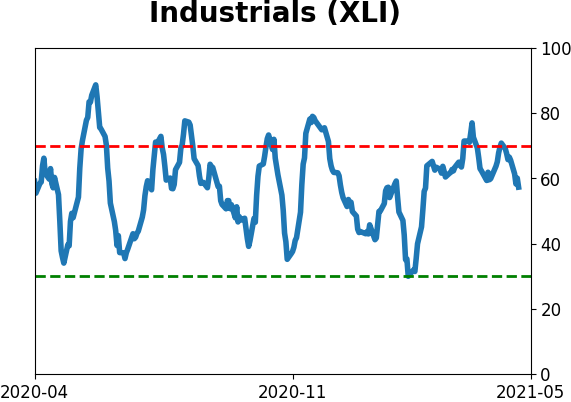
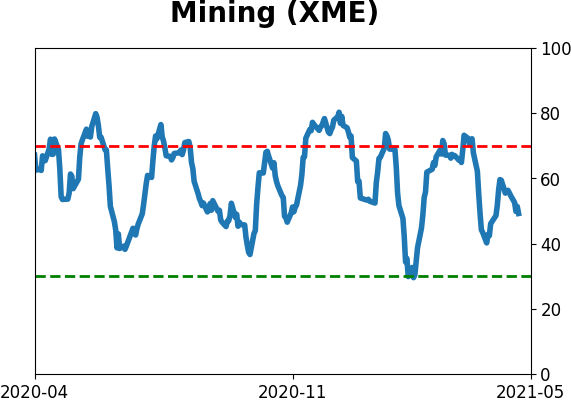
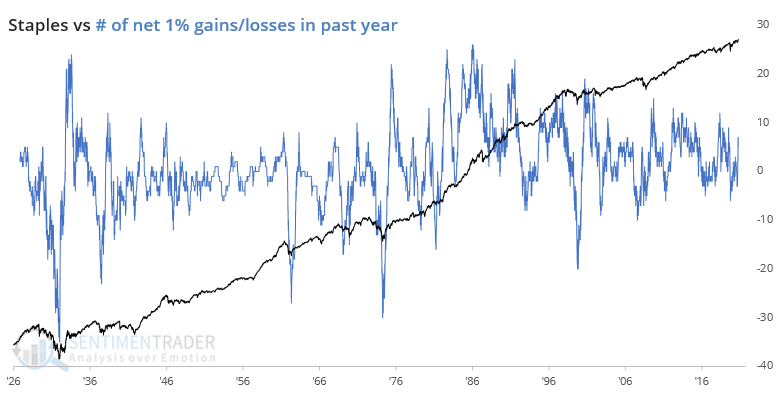
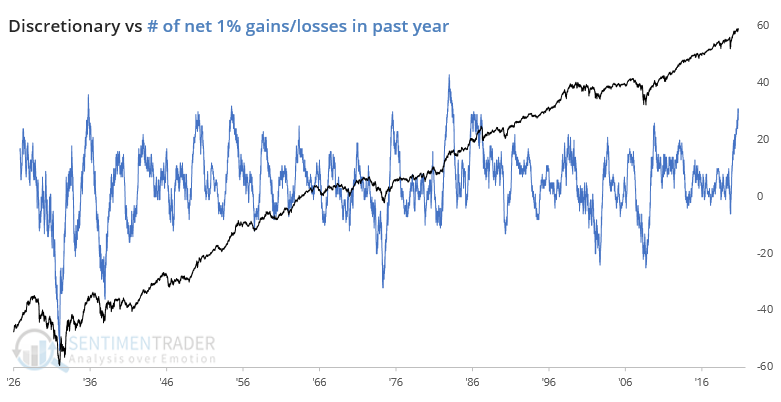
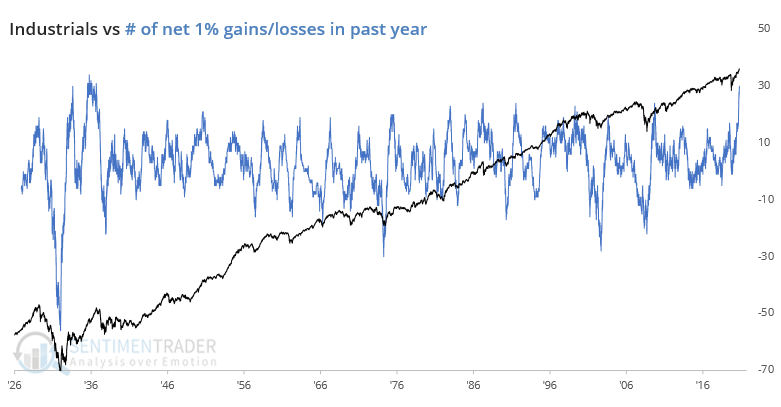
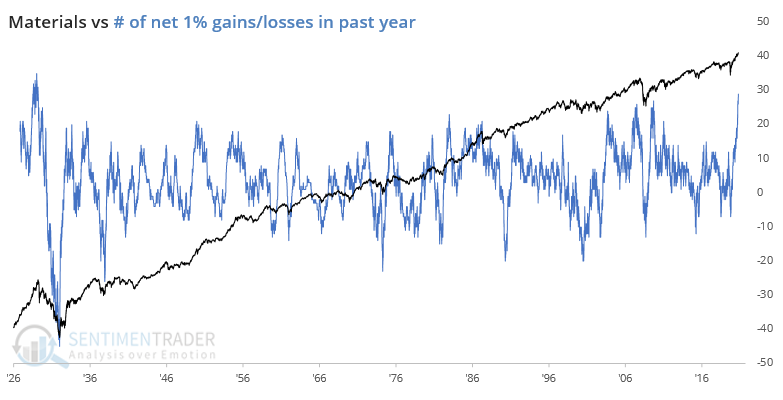
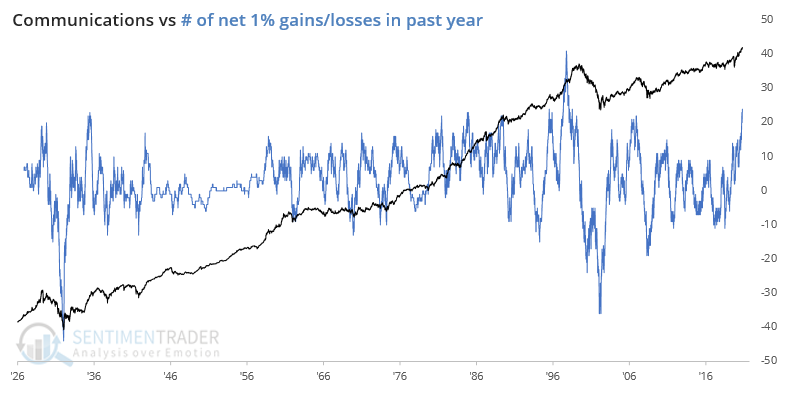
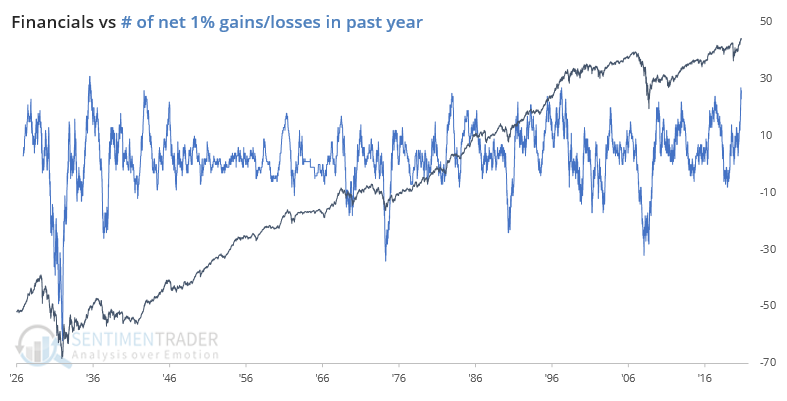
When we look at the major sectors, the ones that currently have a record or near-record net number of big positive days include Discretionary, Industrials, Materials, Communications, and Financials. For what it's worth, all of them preceded at least multi-month exhaustion points.
The past year has been a heady one for investors. One had to work hard to lose money, and those kinds of easy gains stoke complacency. Based on the record number of days with big gains that investors enjoyed offset by the small smattering of big losses, it's no wonder that we see sentiment at or near record levels.
Until very recently, momentum and internal participation have been good, even excellent. That helps to delay a reckoning from sentiment extremes. But essentially, every time that investors have been in an environment like this, with such easy gains, it has preceded at least months of poor or limited returns.
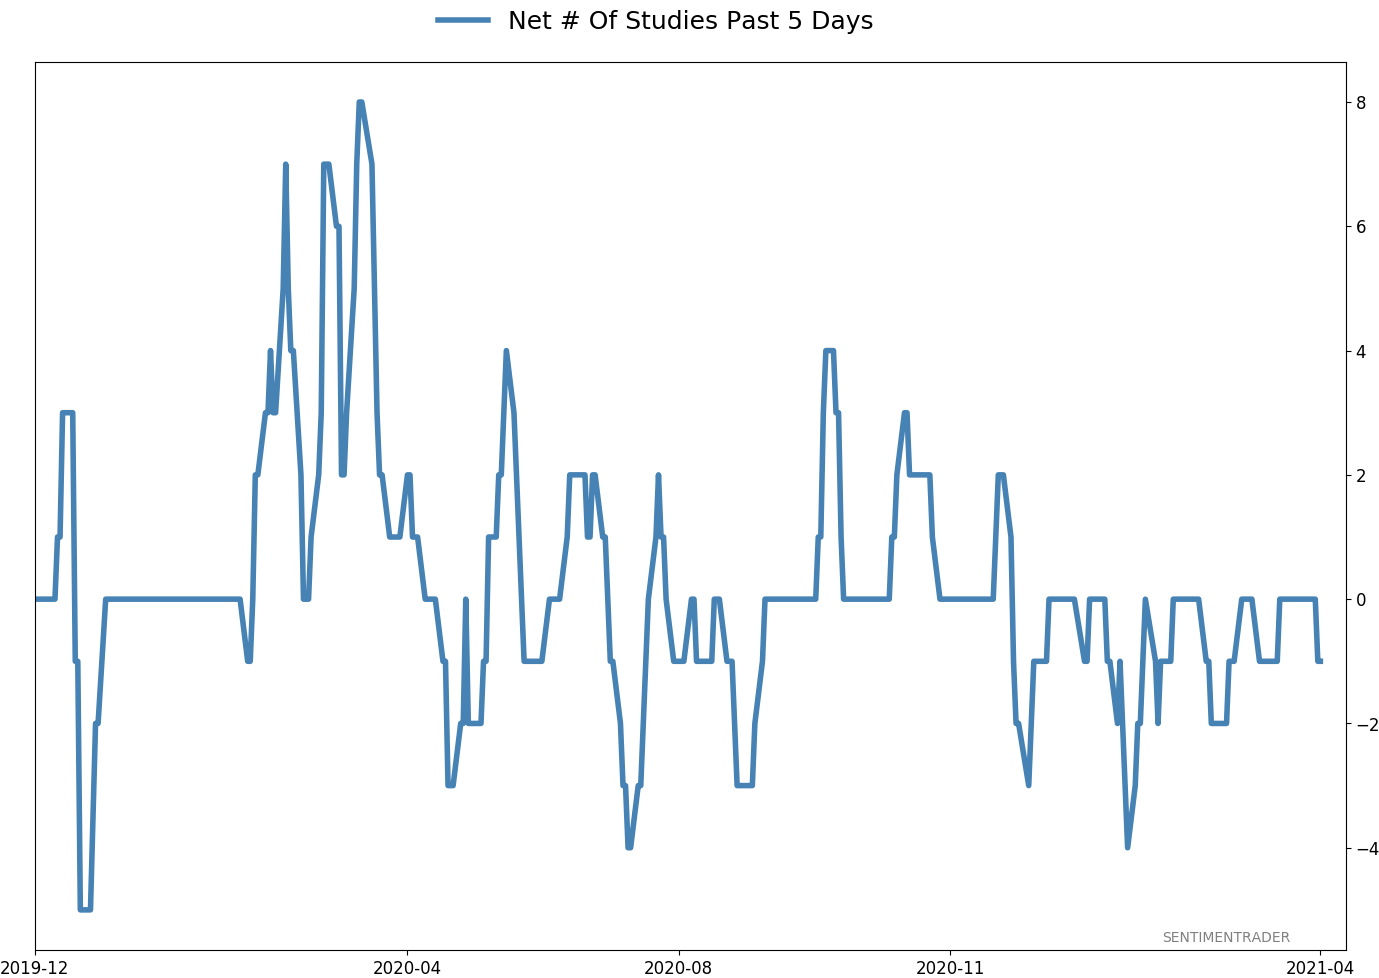
Active Studies
| Time Frame | Bullish | Bearish | | Short-Term | 0 | 0 | | Medium-Term | 0 | 11 | | Long-Term | 11 | 4 |
|
Indicators at Extremes
Portfolio
| Position | Description | Weight % | Added / Reduced | Date | | Stocks | RSP | 0.0 | Reduced 4.9% | 2021-04-22 | | Bonds | 30.0% BND, 8.8% SCHP | 37.9 | Added 15.1% | 2021-02-18 | | Commodities | GCC | 2.5 | Reduced 2.1%
| 2020-09-04 | | Precious Metals | GDX | 9.8 | Added 0.1% | 2021-02-18 | | Special Situations | 4.3% XLE, 2.2% PSCE | 6.5 | Reduced 5.6% | 2021-04-22 | | Cash | | 43.3 | | |
|
Updates (Changes made today are underlined)
I've made no adjustments for months, as the situation remained essentially stuck - energy was doing what it should, sentiment in the broader market was ridiculously stretched but with no major warning signs, and sentiment toward gold and bonds appeared overdone on the pessimistic side. Those conditions have started to reverse a bit, so I further reduced my risk. There are still no major warning signs, but I'm getting increasingly uncomfortable and would prefer to sit safely in cash and wait for better risk/reward opportunities. RETURN YTD: 7.0% 2020: 8.1%, 2019: 12.6%, 2018: 0.6%, 2017: 3.8%, 2016: 17.1%, 2015: 9.2%, 2014: 14.5%, 2013: 2.2%, 2012: 10.8%, 2011: 16.5%, 2010: 15.3%, 2009: 23.9%, 2008: 16.2%, 2007: 7.8%
|
|
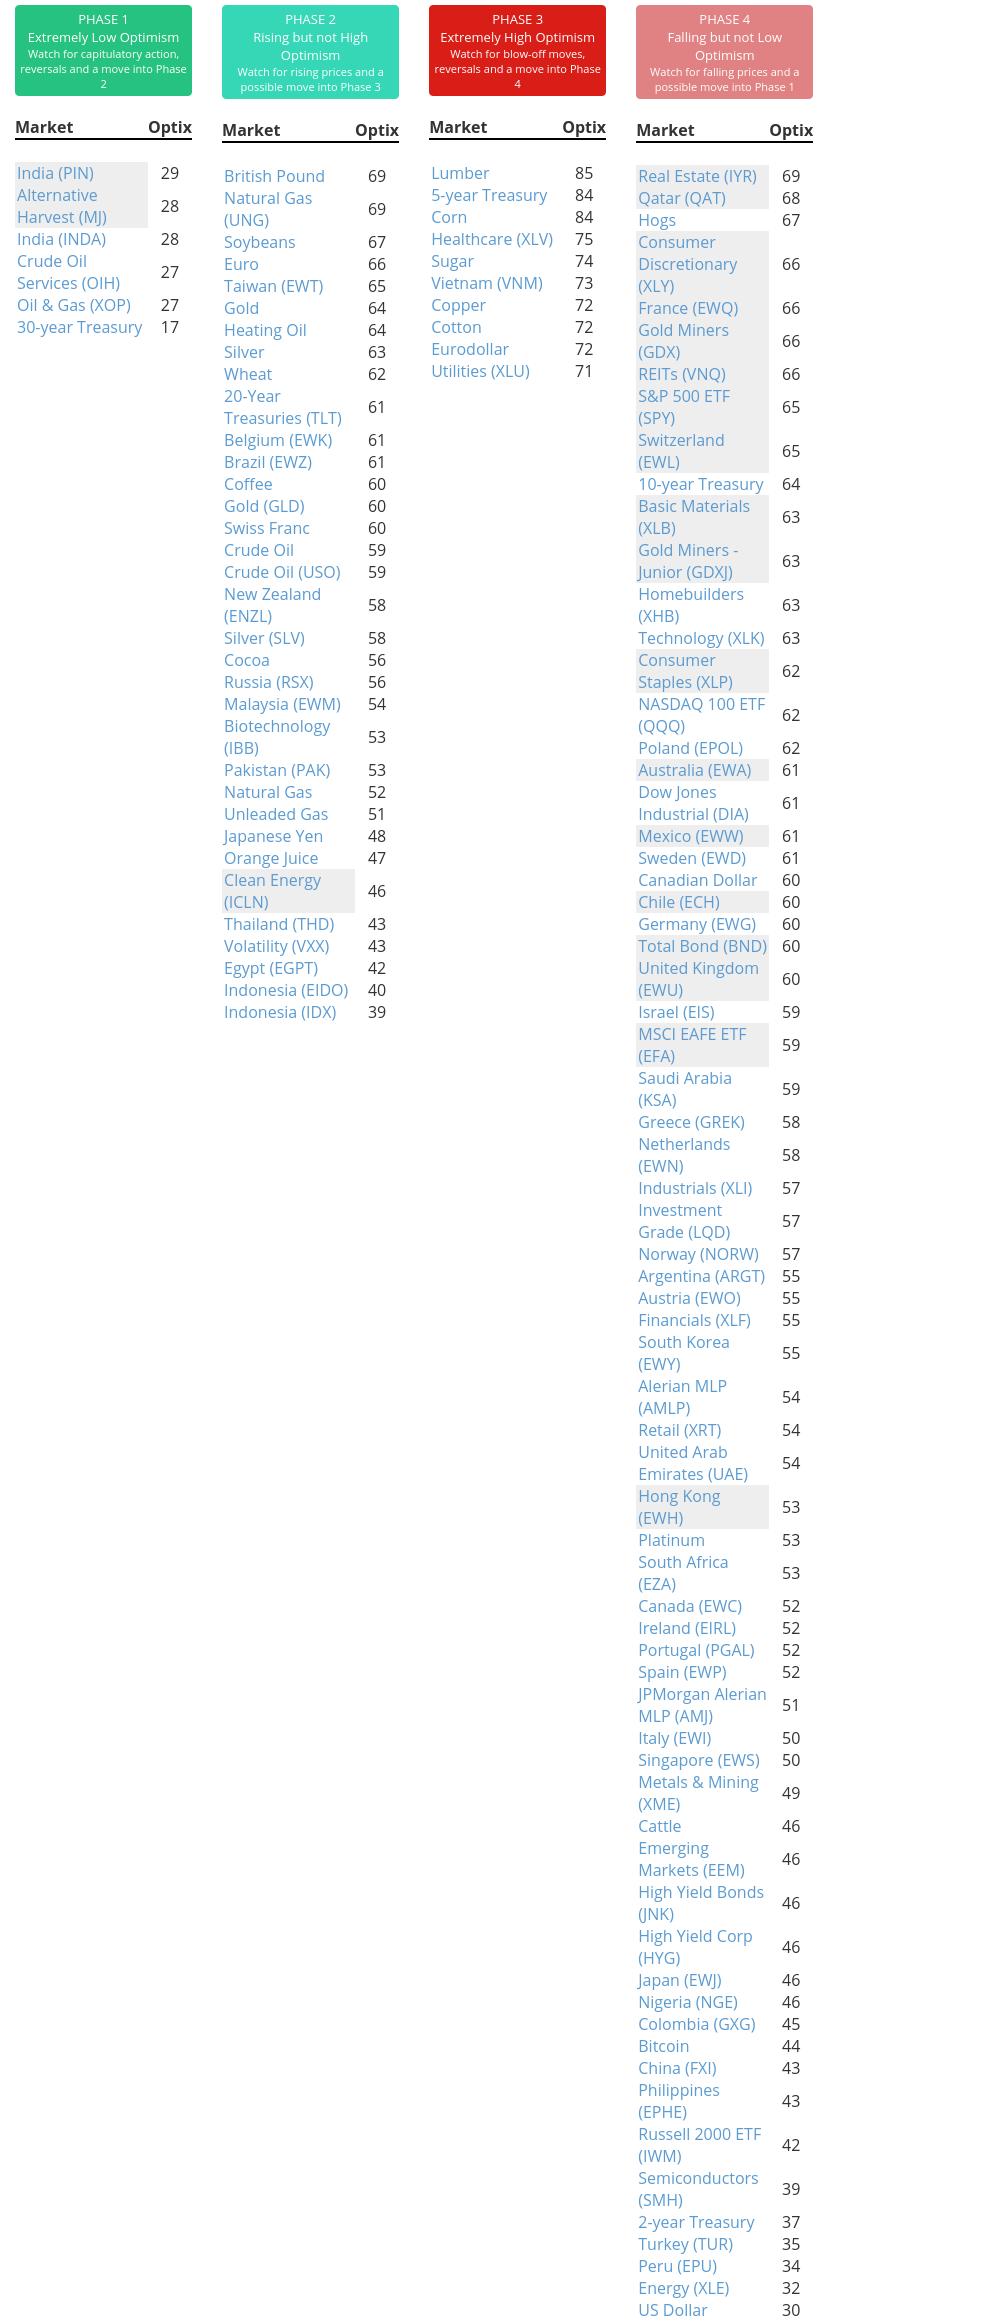
Phase Table
Ranks
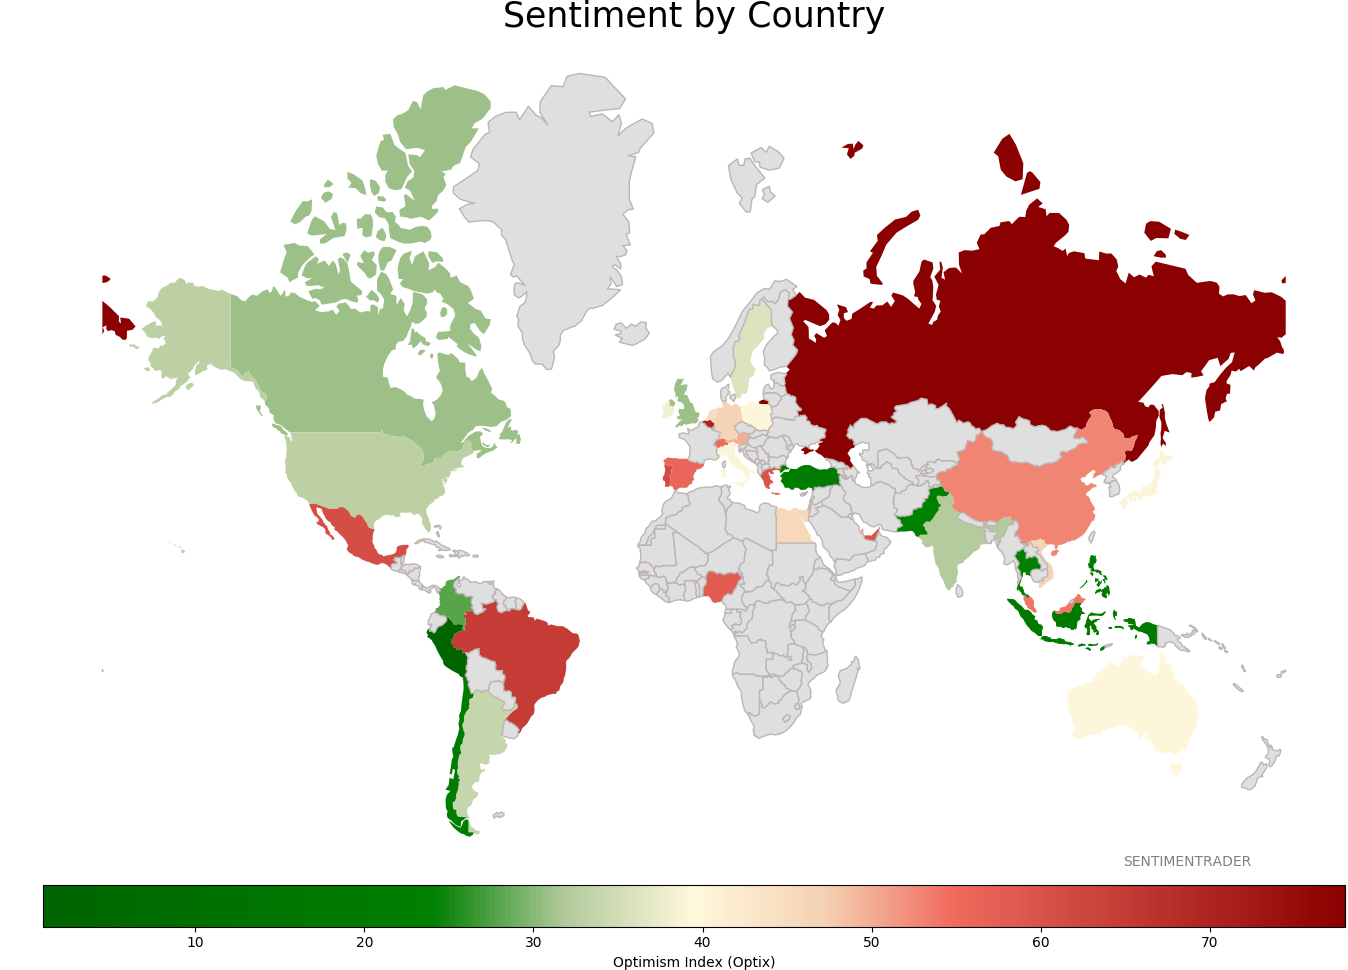
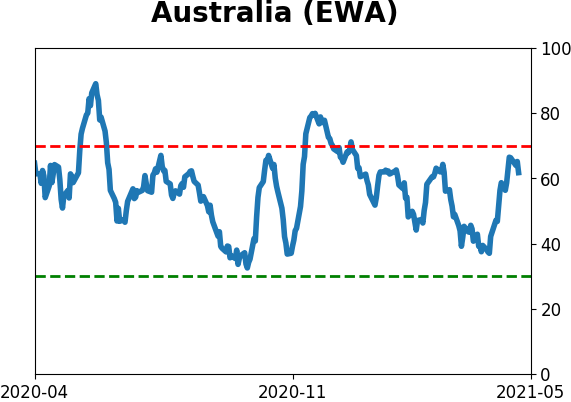
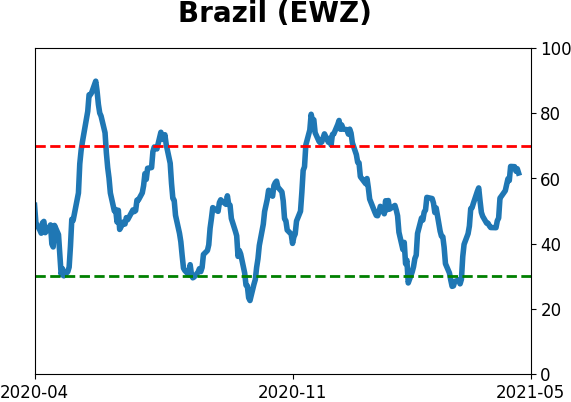
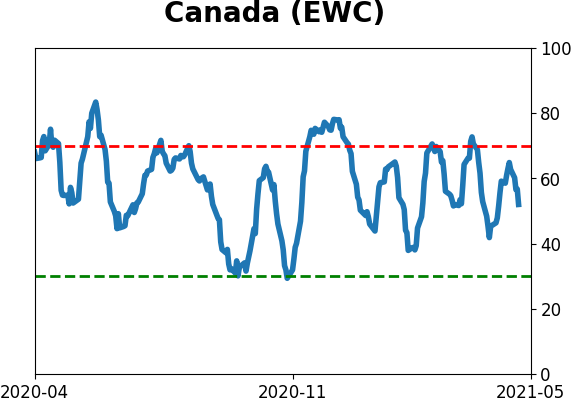
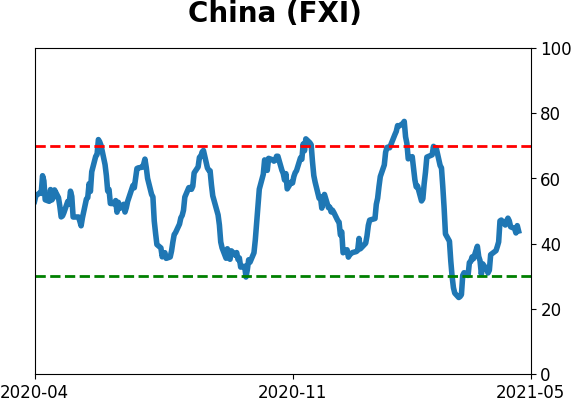
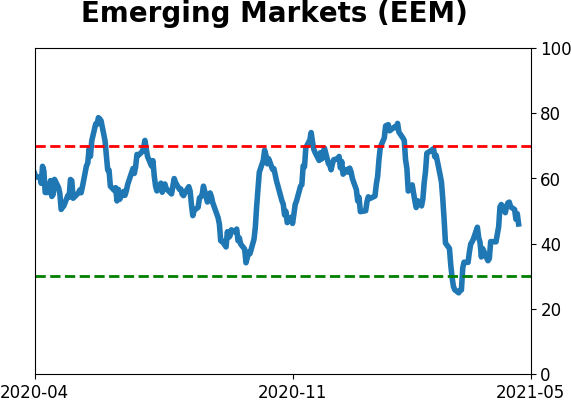
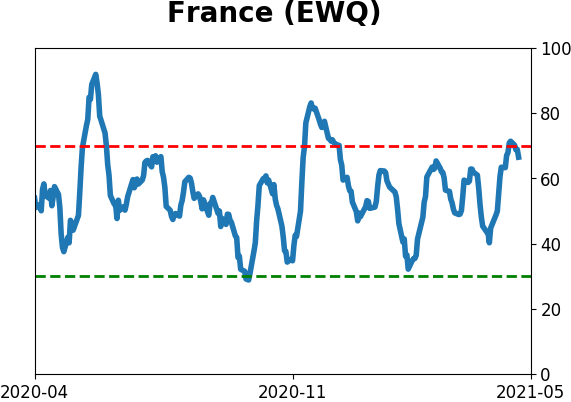
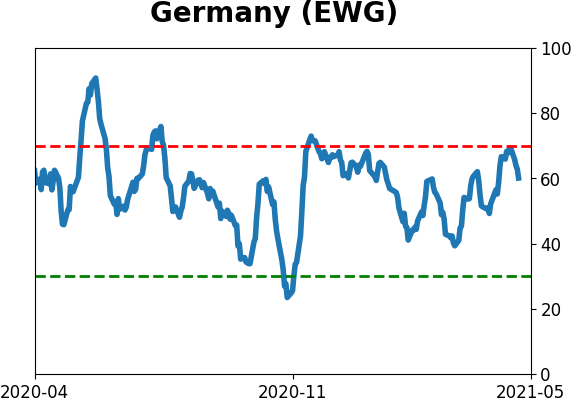
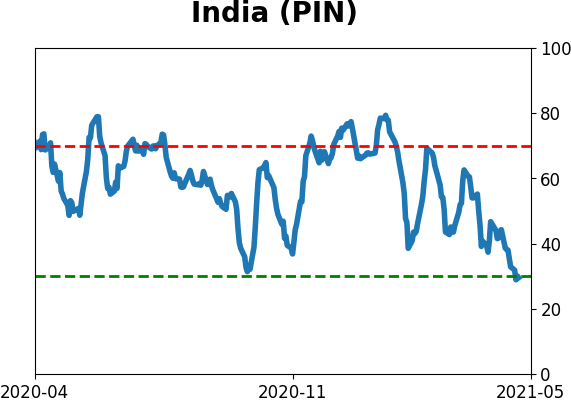
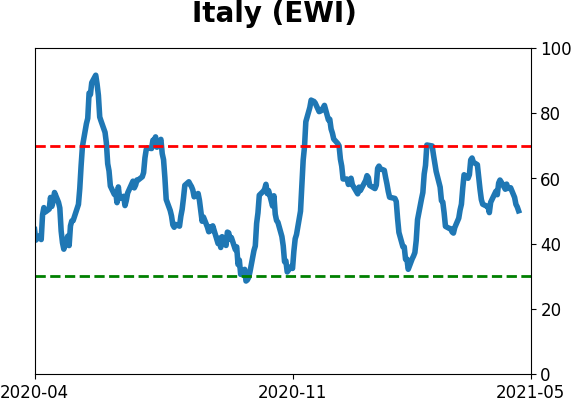
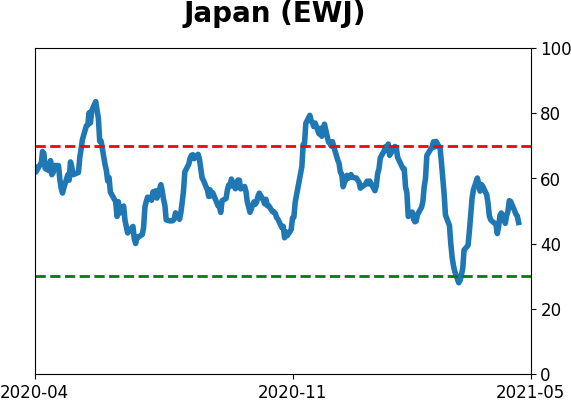
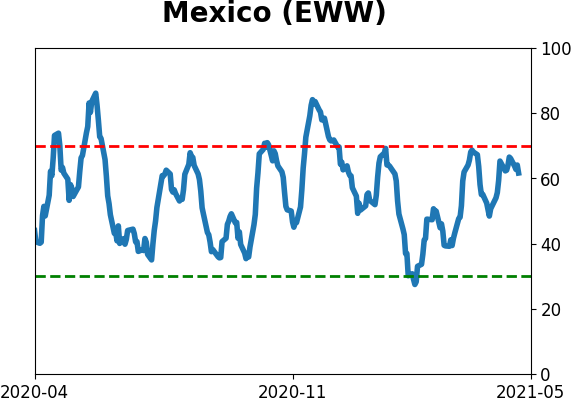
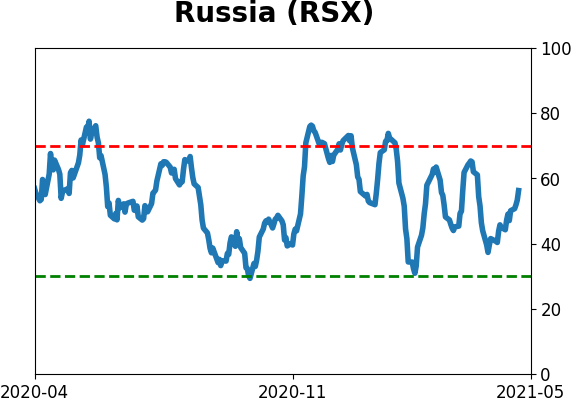
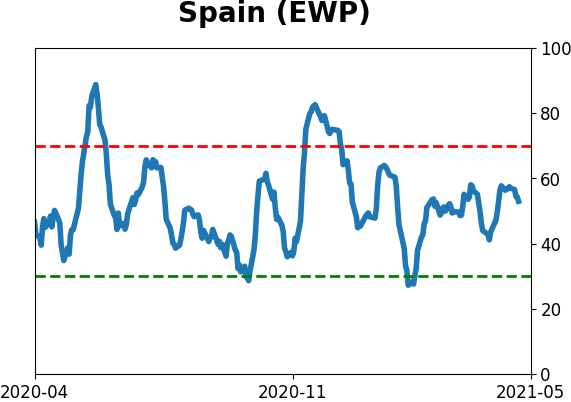
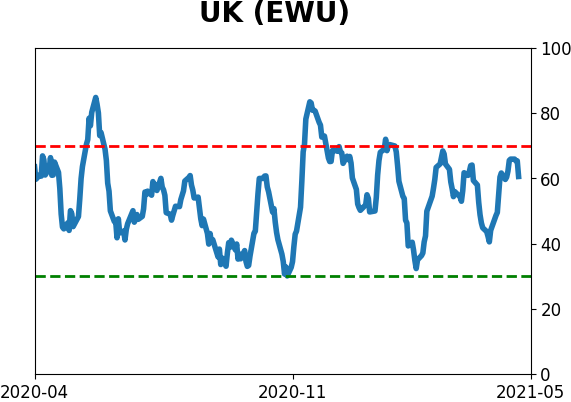
Sentiment Around The World
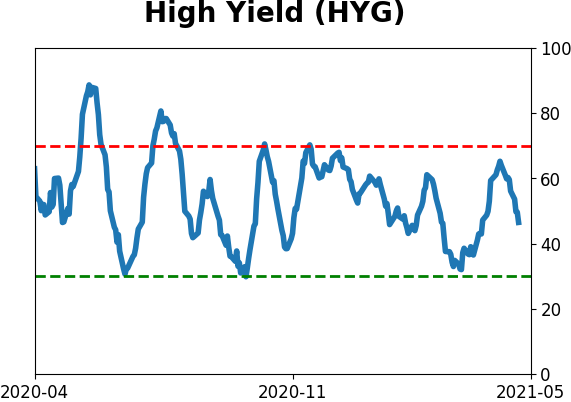
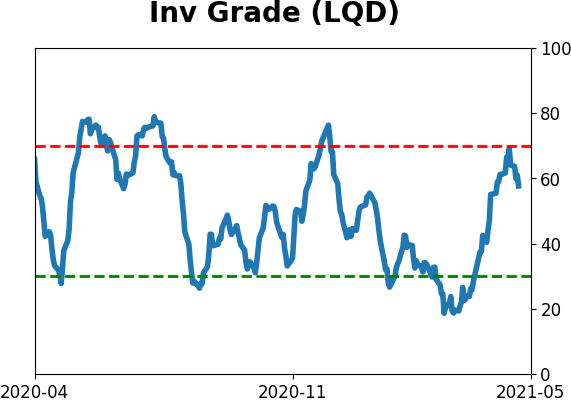
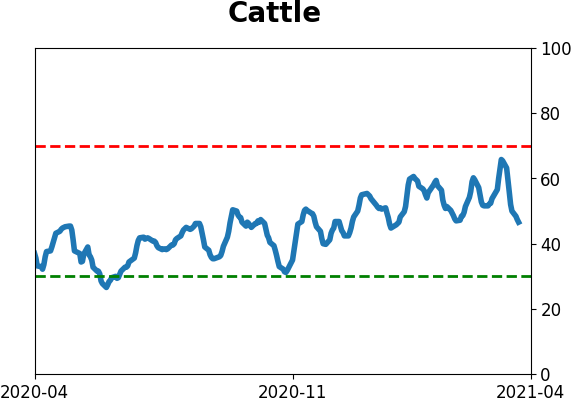
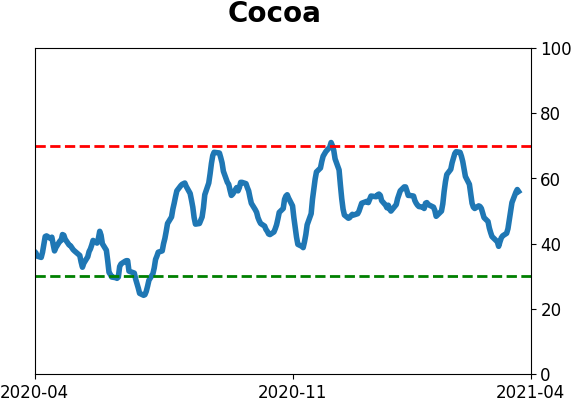
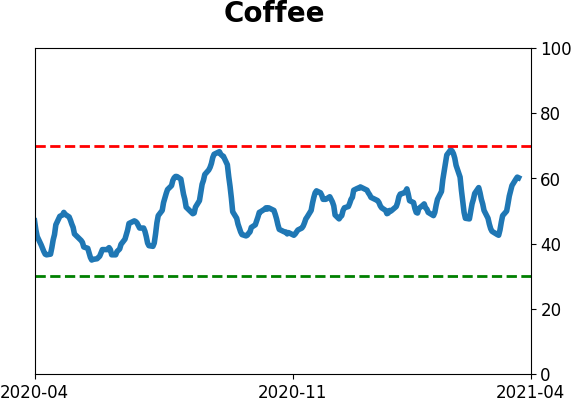
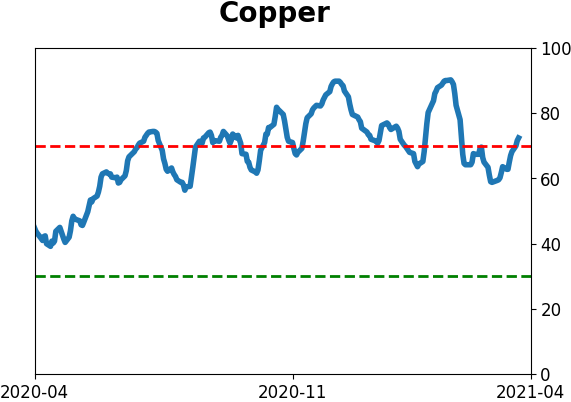
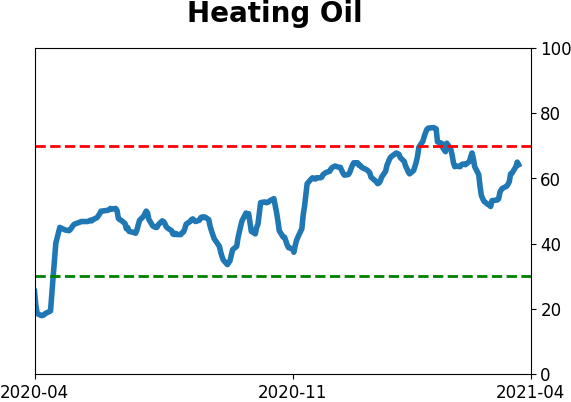
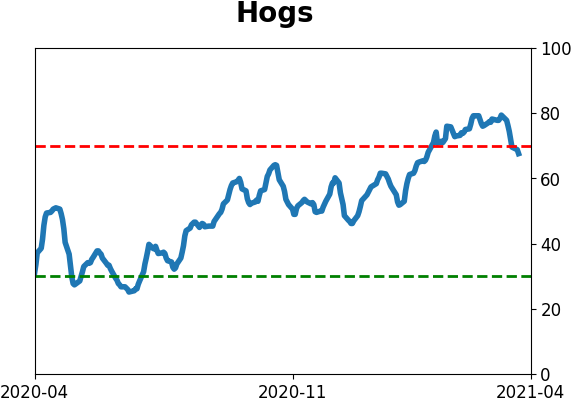
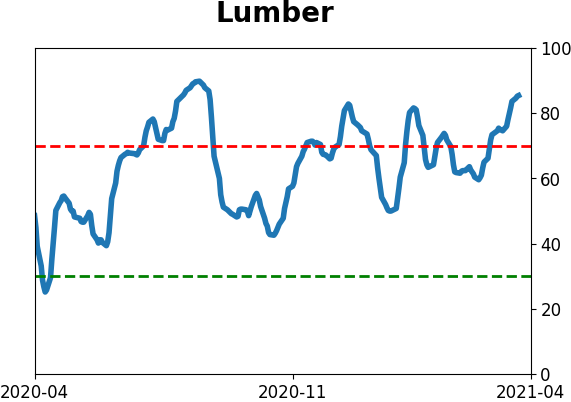
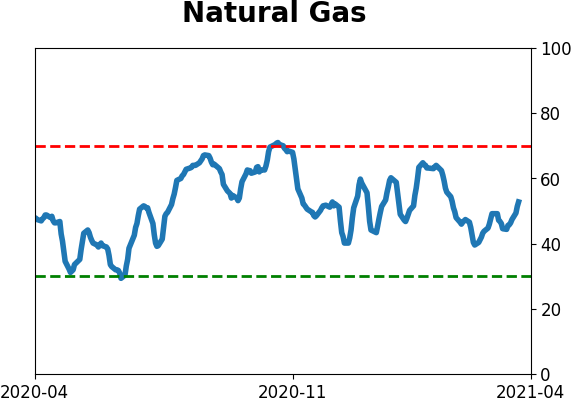
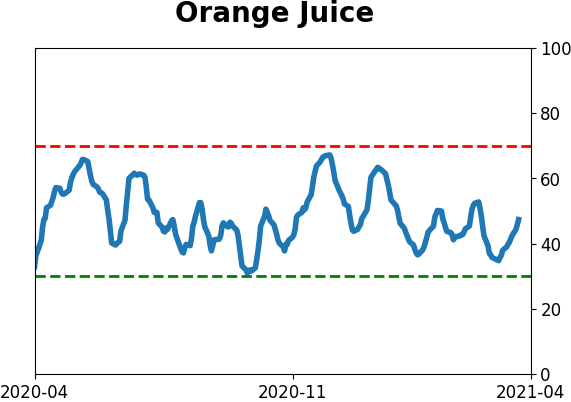
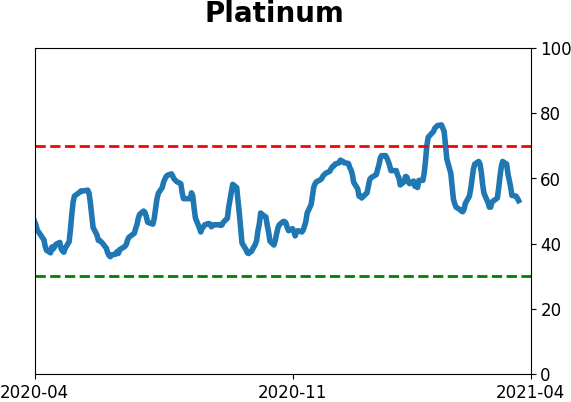
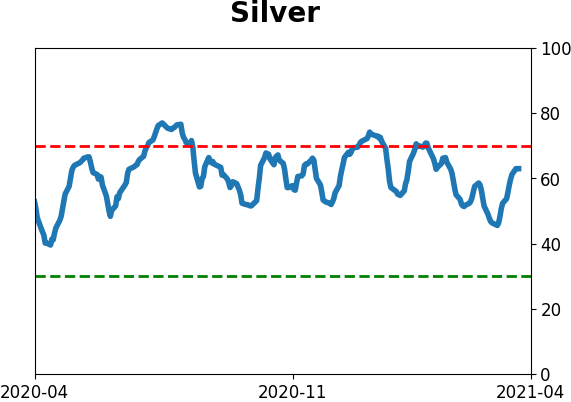
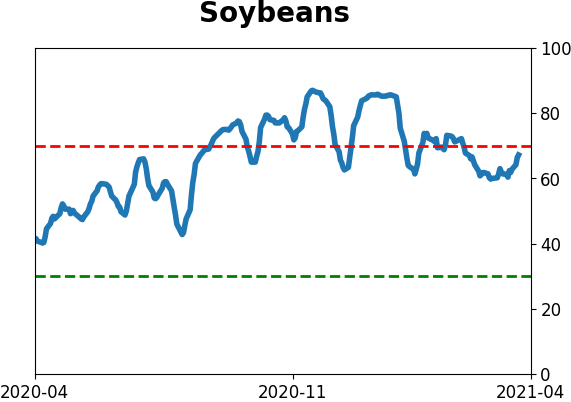
Optimism Index Thumbnails
|
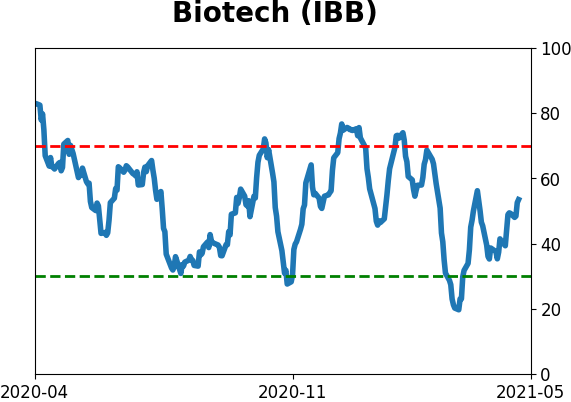
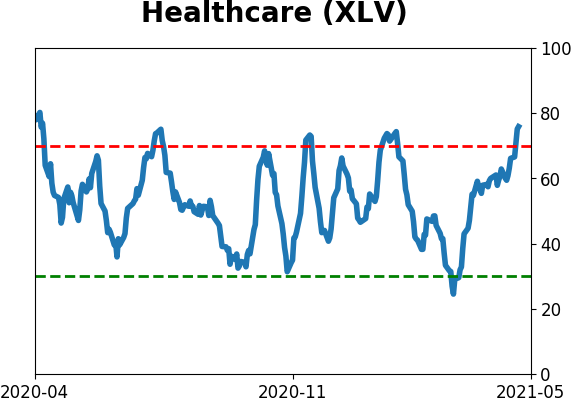
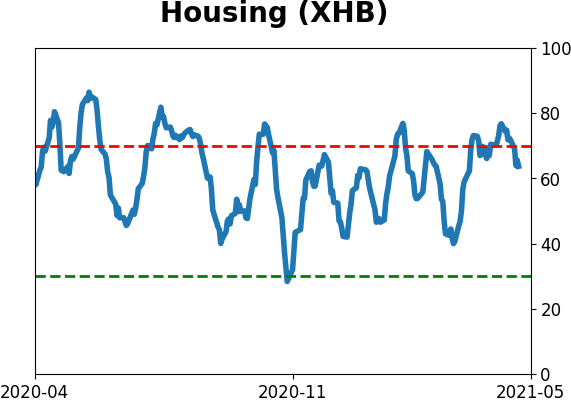
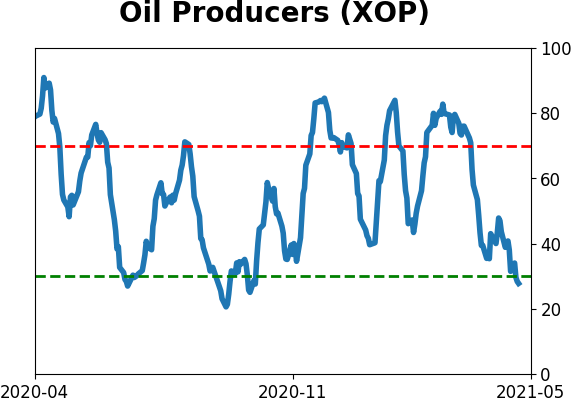
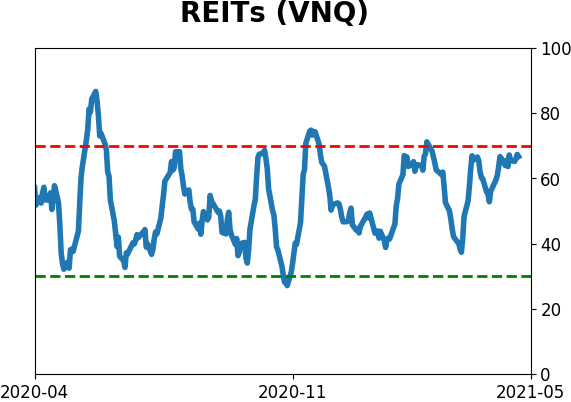
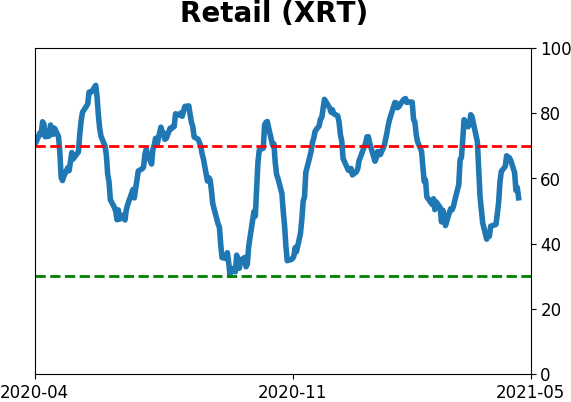
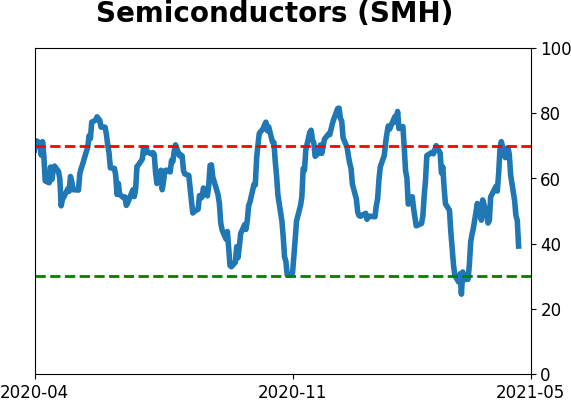
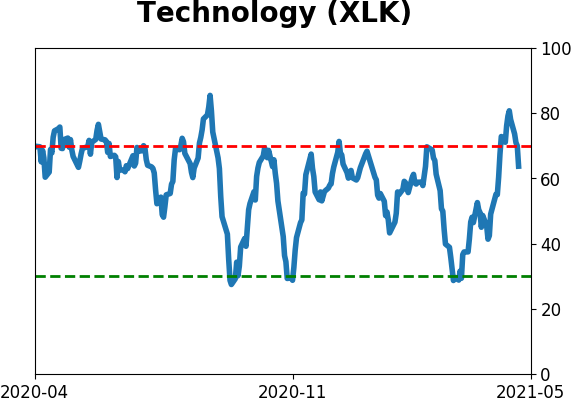
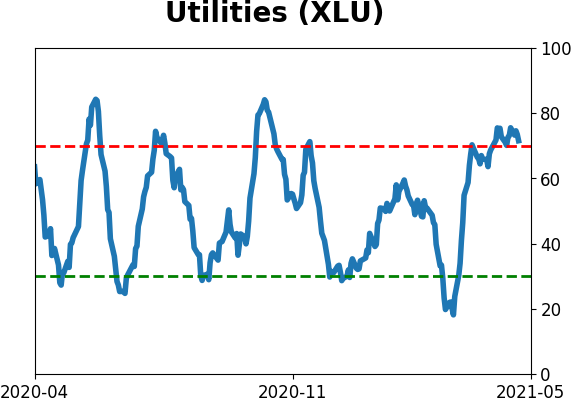
Sector ETF's - 10-Day Moving Average
|
|
|
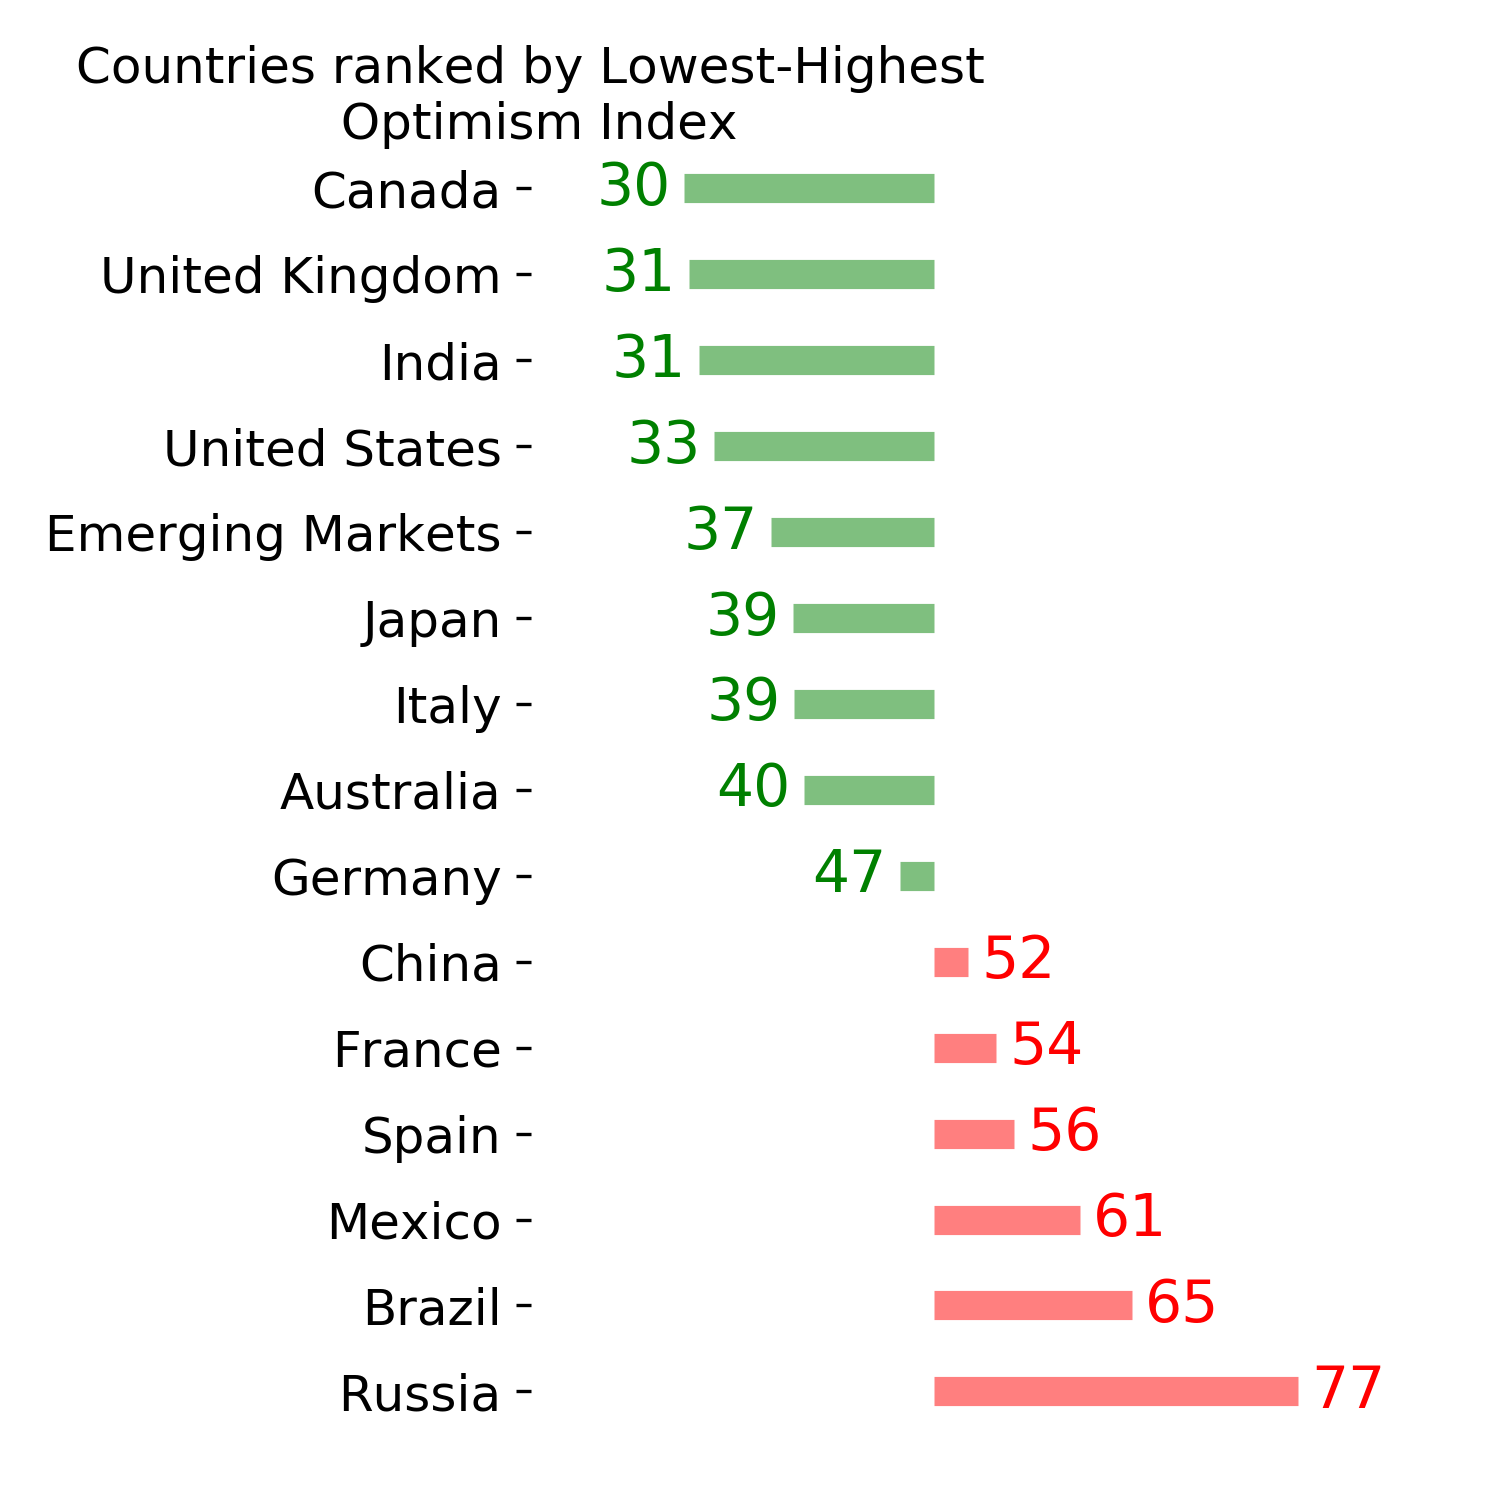
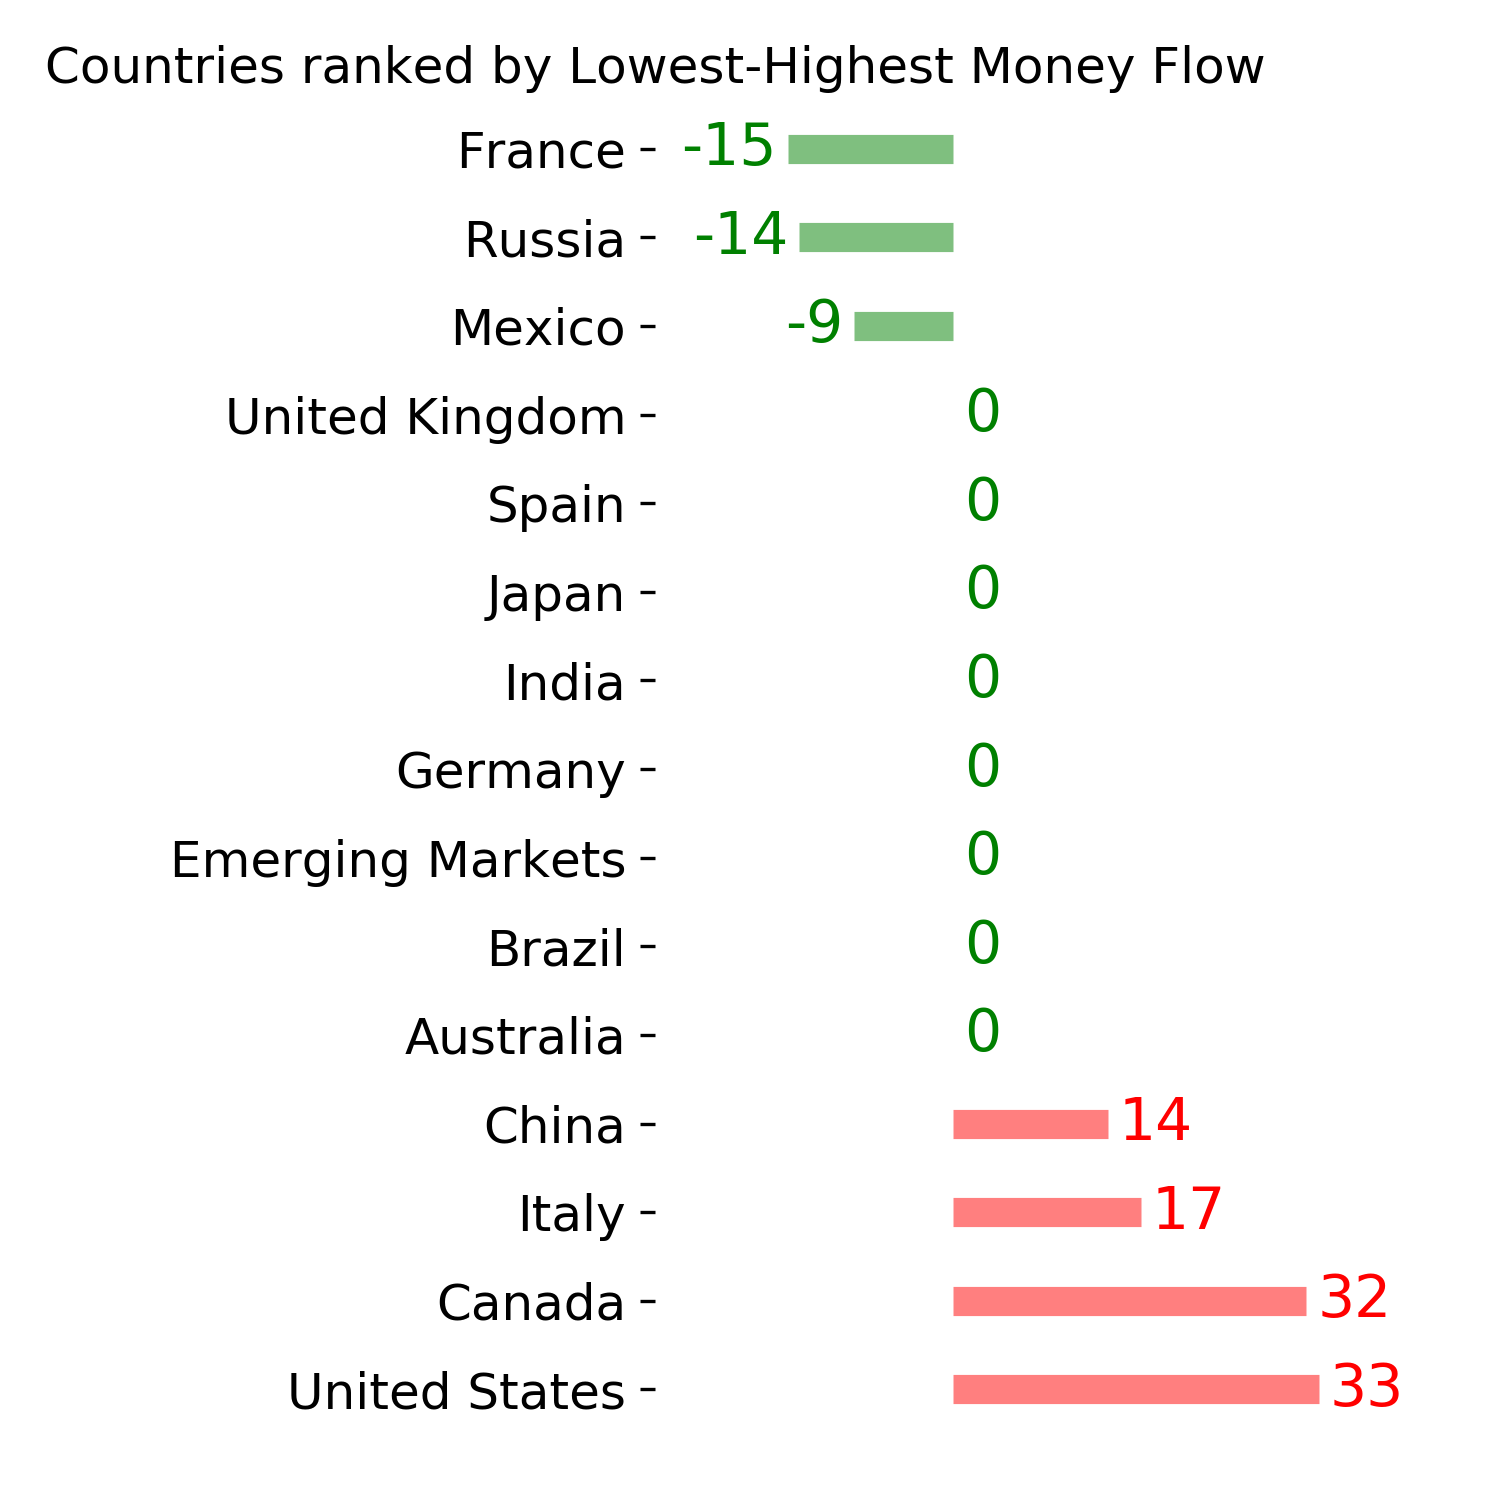
Country ETF's - 10-Day Moving Average
|
|
|
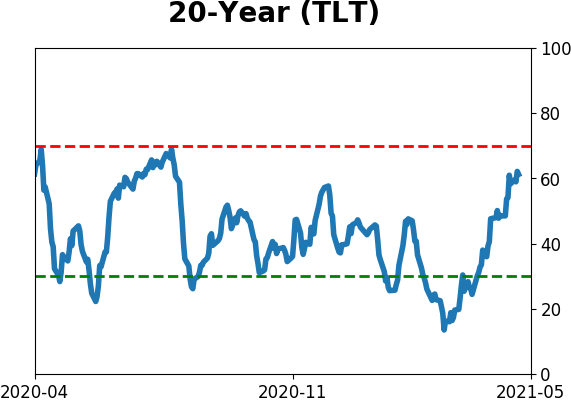
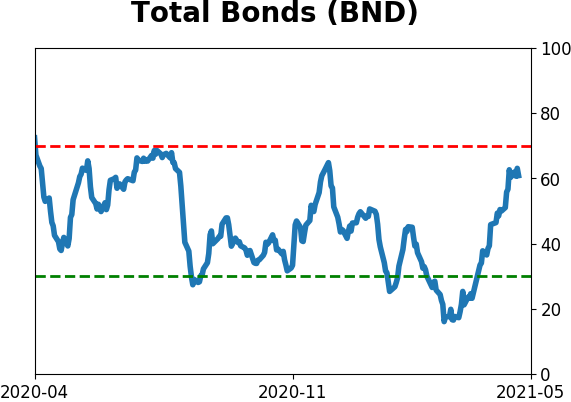
Bond ETF's - 10-Day Moving Average
|
|
|
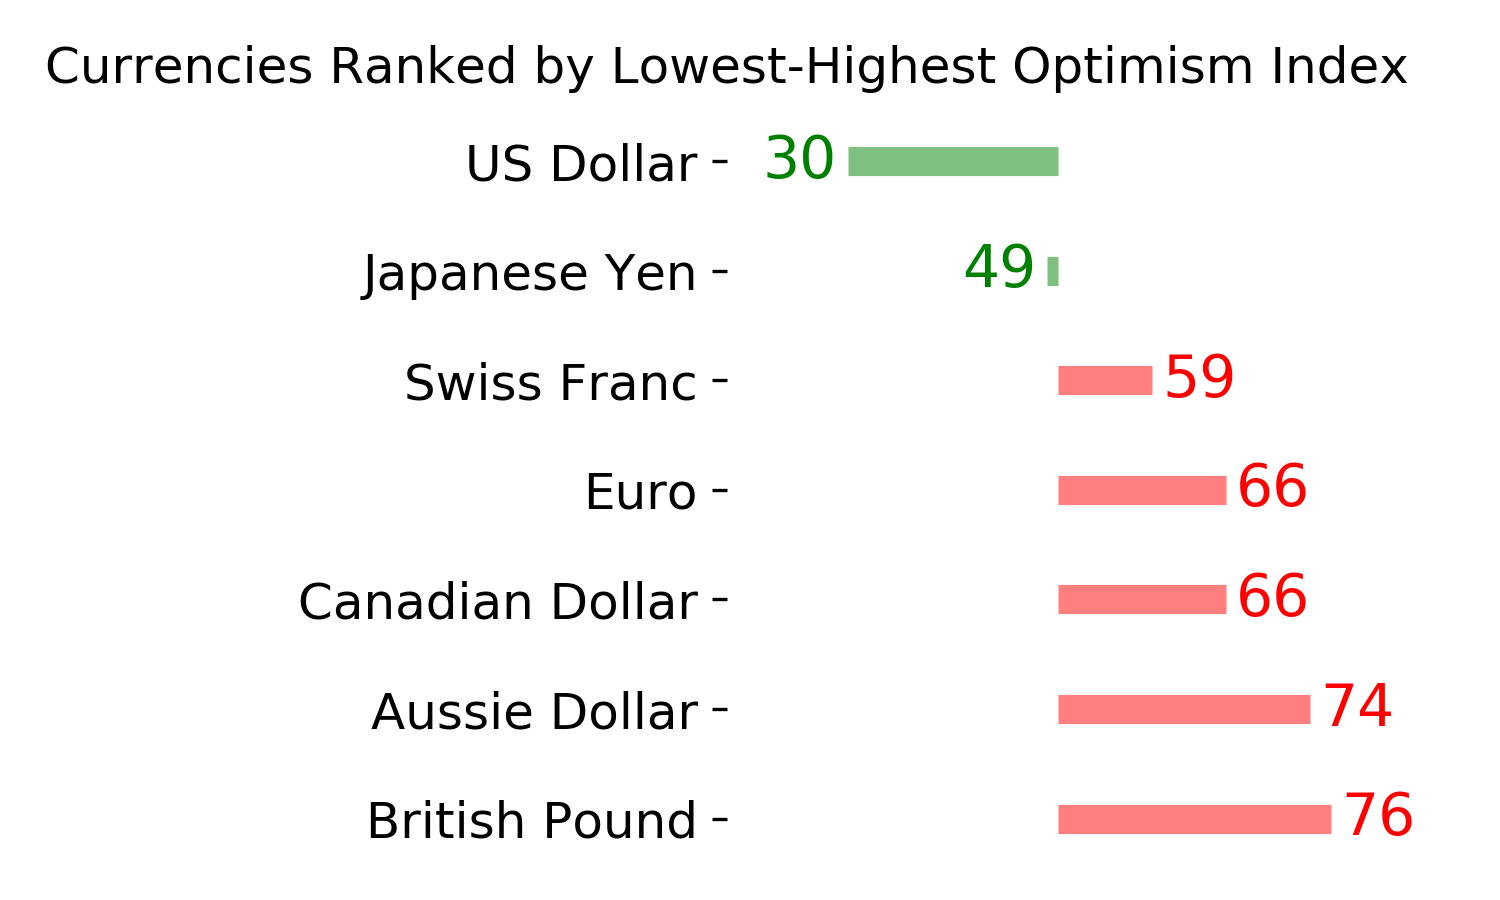
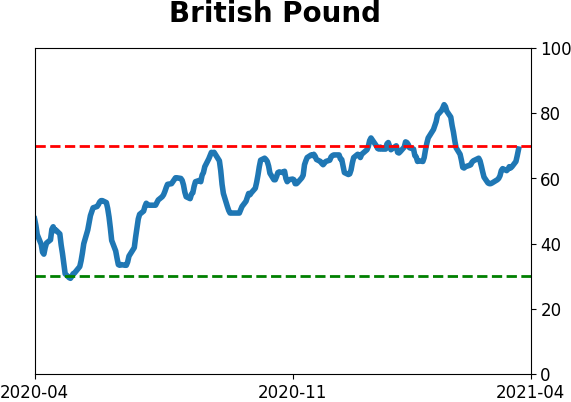
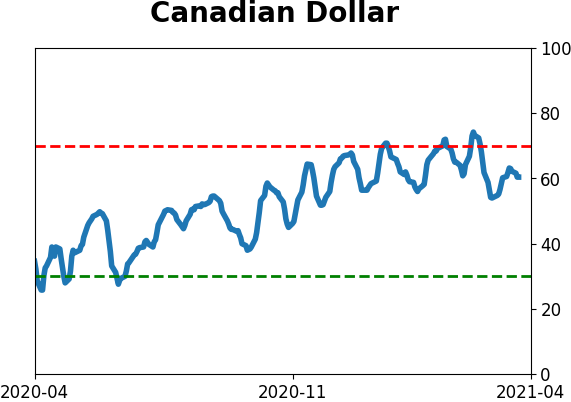
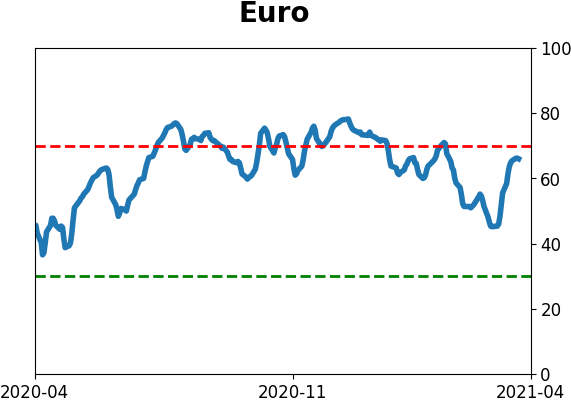
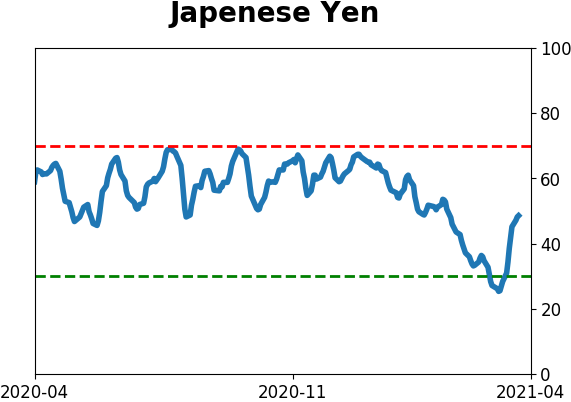
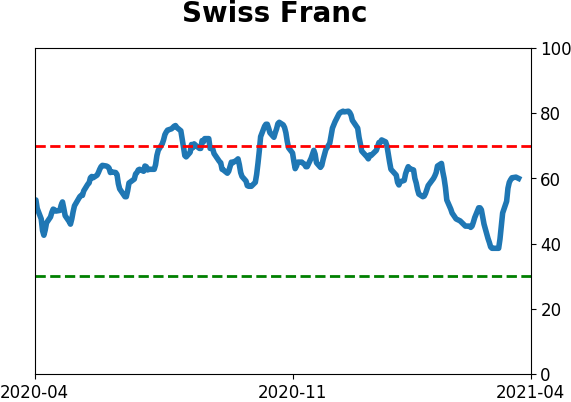
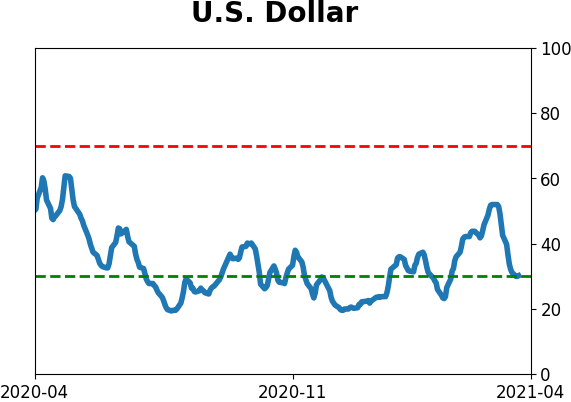
Currency ETF's - 5-Day Moving Average
|
|
|
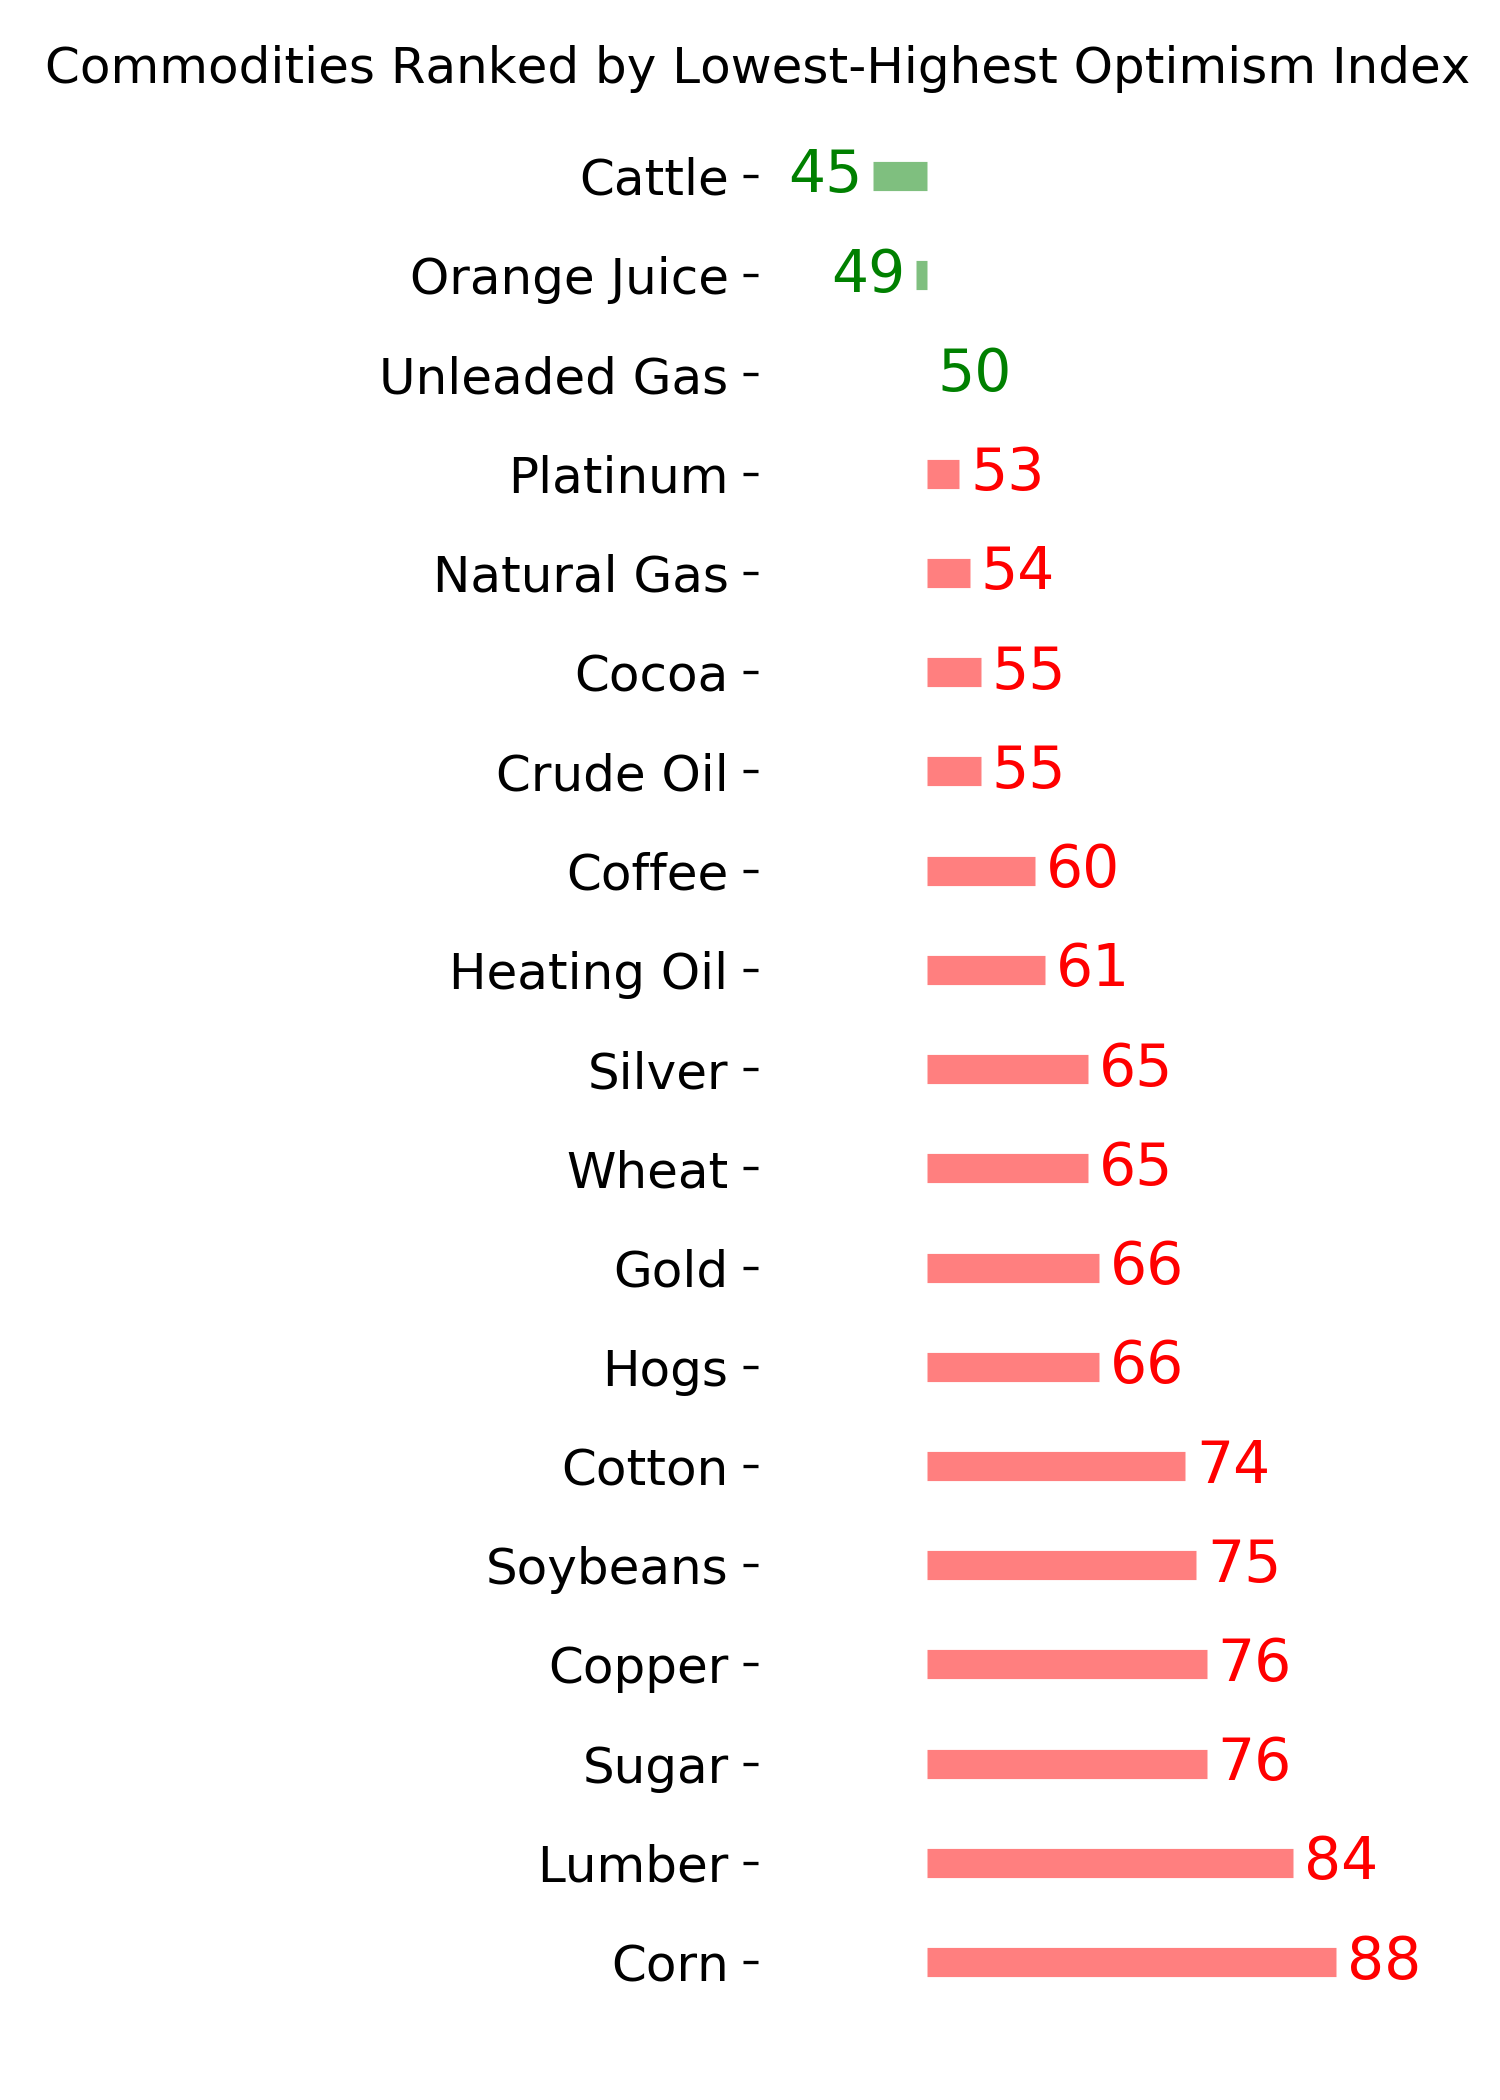
Commodity ETF's - 5-Day Moving Average
|
|