Daily Report : TradingEdge Weekly for Apr 21 - Trend change signals, long-term cycles, few outperforming stocks

| View/Print a PDF version of this Report |
Headlines
|
TradingEdge Weekly for Apr 21 - Trend change signals, long-term cycles, few outperforming stocks: This week, we saw that there were some compelling signs of a positive trend change in the S&P 500. While some investors are concerned that a good earnings season has already been baked in, rallies ahead of earnings season didn't consistently pull gains forward. Few stocks are beating the S&P, and outperformers are getting especially scares among Utilities. |
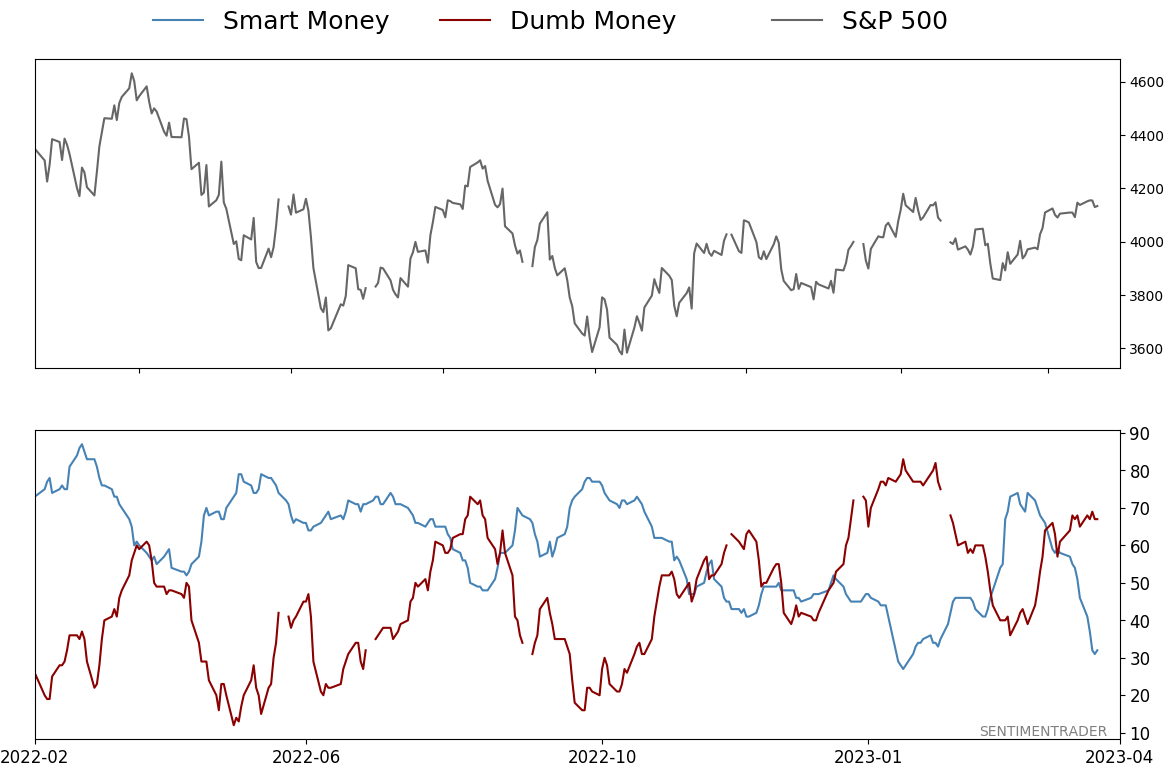
Smart / Dumb Money Confidence
|
|
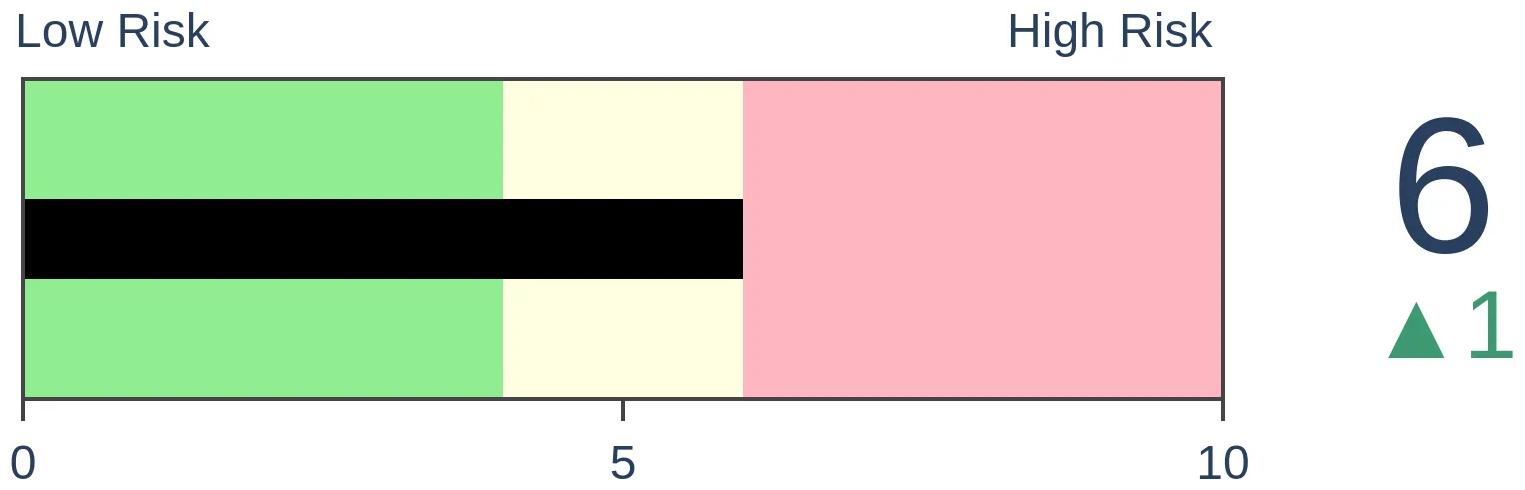
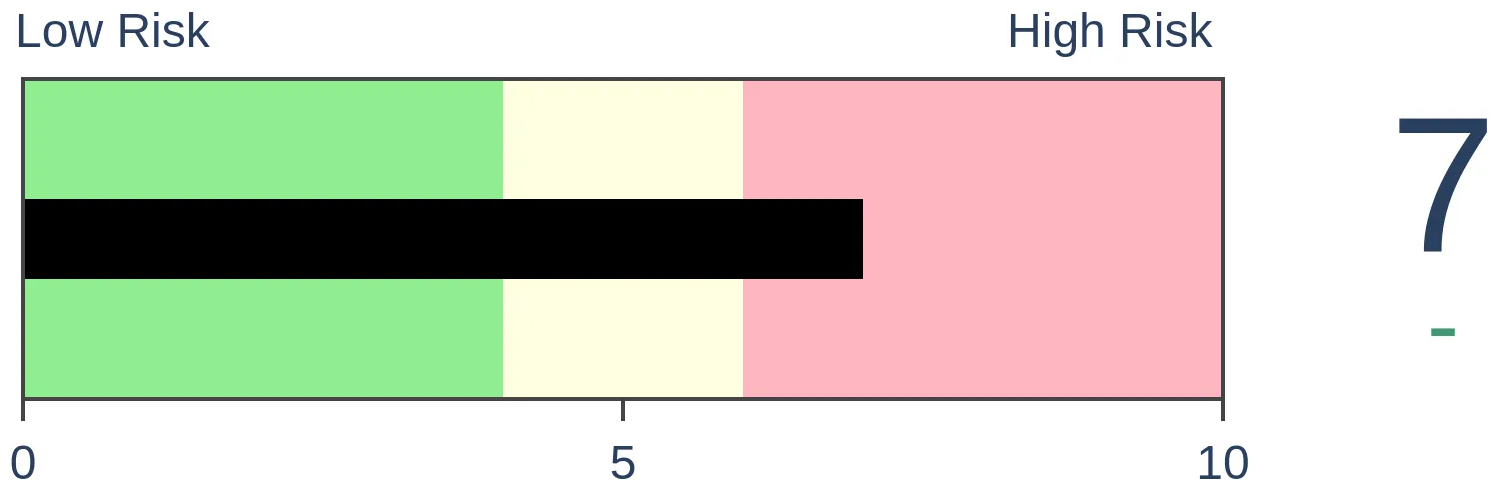
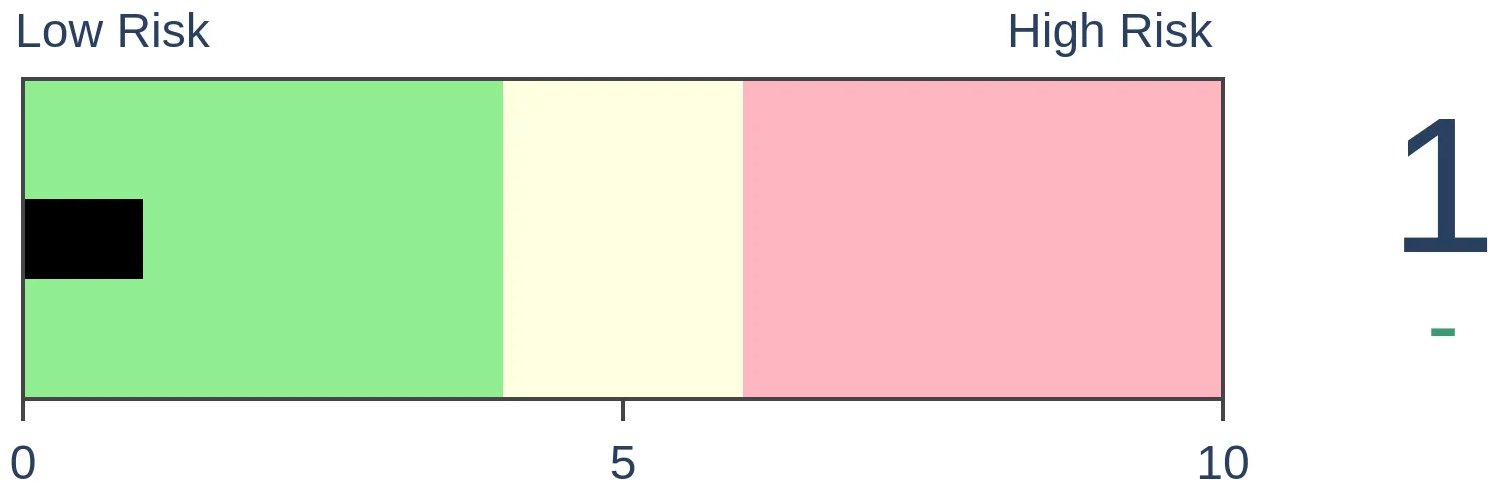
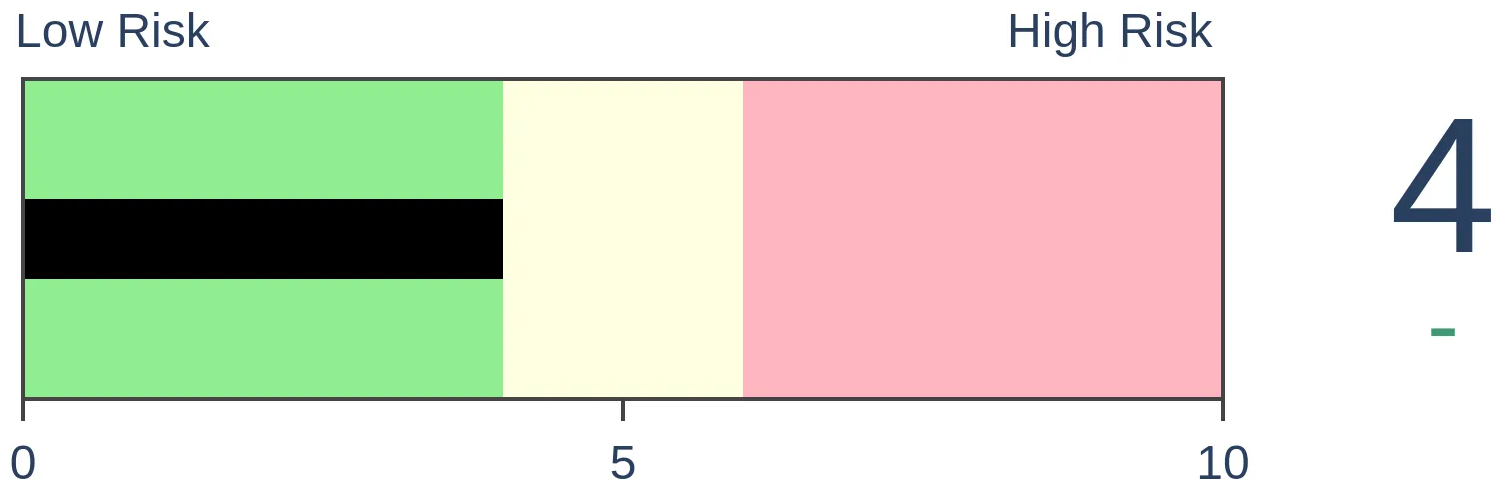
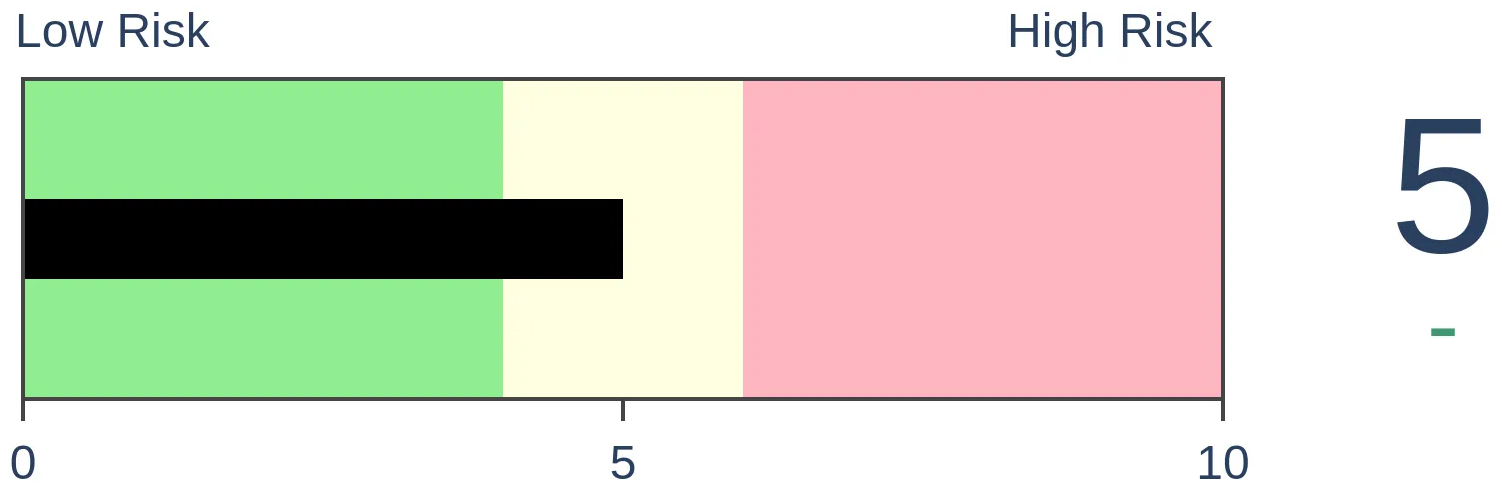
Risk Levels
|
|

|
Research
TradingEdge Weekly for Apr 21 - Trend change signals, long-term cycles, few outperforming stocksBy Jason GoepfertBOTTOM LINEThis week, we saw that there were some compelling signs of a positive trend change in the S&P 500. While some investors are concerned that a good earnings season has already been baked in, rallies ahead of earnings season didn't consistently pull gains forward. Few stocks are beating the S&P, and outperformers are getting especially scares among Utilities. FORECAST / TIMEFRAME |
Key points:
- A composite trend model gave a buy signal for the S&P 500
- The S&P closed above its 10-day average for a month straight, triggering an impressive trend change signal
- Taking a look at the long-term Benner Cycle for stocks
- Also shorter-term Benner Cycles
- Is a good earnings season already baked in?
- Historical volatility in the S&P 500 has plunged over the past month
- The fewest stocks since 1999 are outperforming the index
- After a surge in outperforming stocks, Utility sector stocks are reversing
A composite trend buy signal
A composite that contains ten trend-following indicators cycled from a bearish to a bullish condition. Dean showed that similar trend change signals over the past 90 years preceded excellent returns for the S&P 500.
Over the last 6-9 months, we've shared several breadth-based thrust and recovery signals, which measure the internal condition of an index or exchange over various time frames. Typically, the burst of momentum or improvement in stock trends within the index foreshadows a potential bearish-to-bullish trend change for the index. Last week, a composite trend model for the S&P 500 increased to a bullish score of +8, triggering a trend change buy signal for the world's most-watched index.
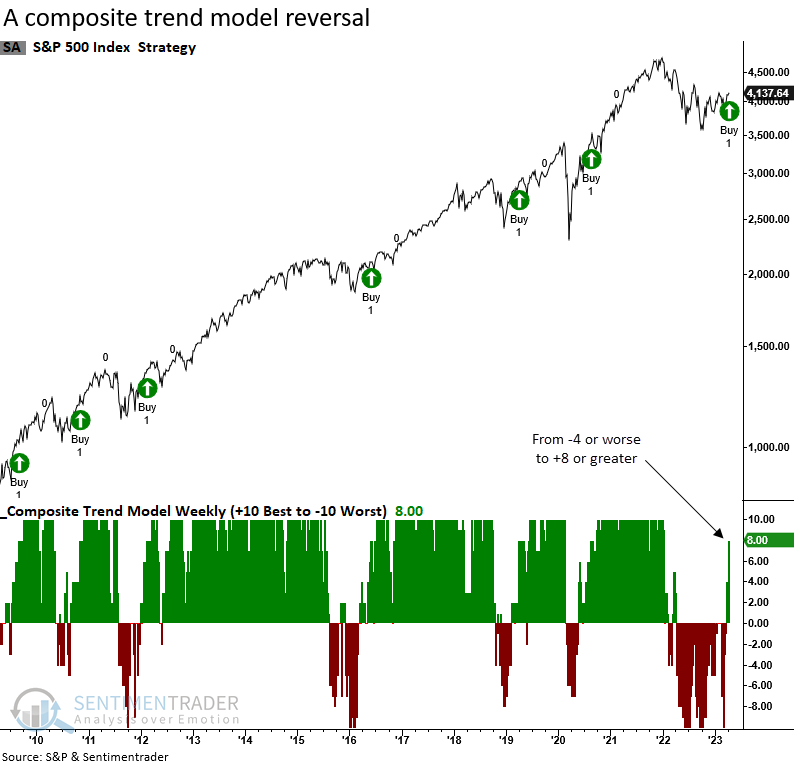
When the composite trend model cycles from -4 or worse to +8 or better, the S&P 500 rose 90% of the time over the next six months. Results a year later were also excellent and recorded 24 consecutive profitable signals between 1967 and 2016.
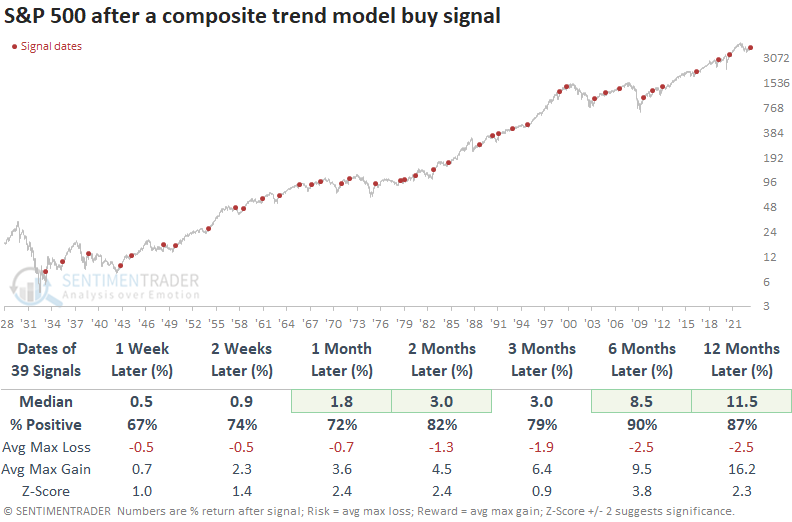
The number of 10%+ drawdowns over the next six and twelve months was minimal, with only three and seven precedents.
A composite model that combines the TCTM Composite Thrust and Confirmation Model components and ten other systems ticked up with the trend change alert but remained well below the threshold level for an overall composite signal.
Another admirable trend streak
Dean also noted that the S&P 500 closed above its 10-day average for 21 consecutive trading days. Similar win streaks over the past 95 years preceded solid returns and win rates, especially when triggering after a 252-day low.
The moving average reversal model has an excellent record of avoiding whipsaw signals in bear markets. So, the untimely alert in 2022 was rare. Still, when a failure occurs, the market is more likely to correct through time, not price.
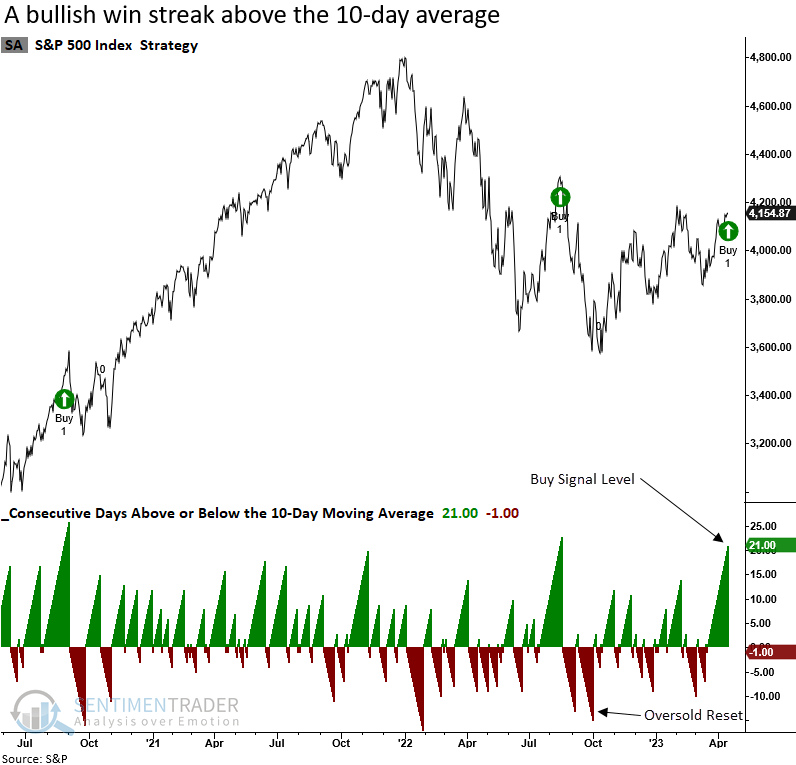
The model identifies a period when the S&P 500 closes below its 10-day average for a minimum of 12 consecutive trading days. i.e., an oversold condition. Once that setup is achieved, the system will trigger a buy signal when the Index sustains itself above the 10-day average for 21 successive trading days.
The moving average reversal model generated a signal 79 other times over the past 95 years. After the others, S&P 500 future returns, win rates, and z-scores were excellent across medium and long-term horizons. Over the next six months, a max loss of greater than 10% occurred in 11 out of 79 cases. And out of those 11 instances, only one exceeded 20%.
Signals triggered after a 252-day low show slightly more favorable results across most trading statistics, especially the 12-month win rate and return. Besides 1930, drawdowns a year later were mild.
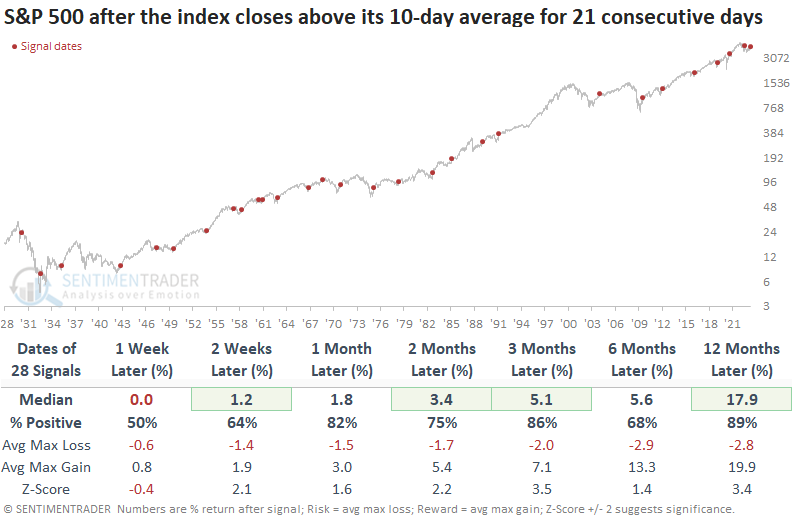
Since 1928, the model failed to turn the S&P 500 trend from bearish to bullish five times during a drawdown phase, including the August 2022 signal. The 1930 alert was the only one that saw the Index move meaningfully below the previous bear market low. With a second signal triggering this week, a 1929-32 scenario seems unlikely.
A long-term cycle analysis
A chart purportedly created by Samual Benner in 1875 was intended to identify boom and bust cycles in the economy. Jay suggested that because stock market performance is so closely tied to the economy, it might benefit us to look at performance across the various favorable and unfavorable periods within the Benner Cycle.
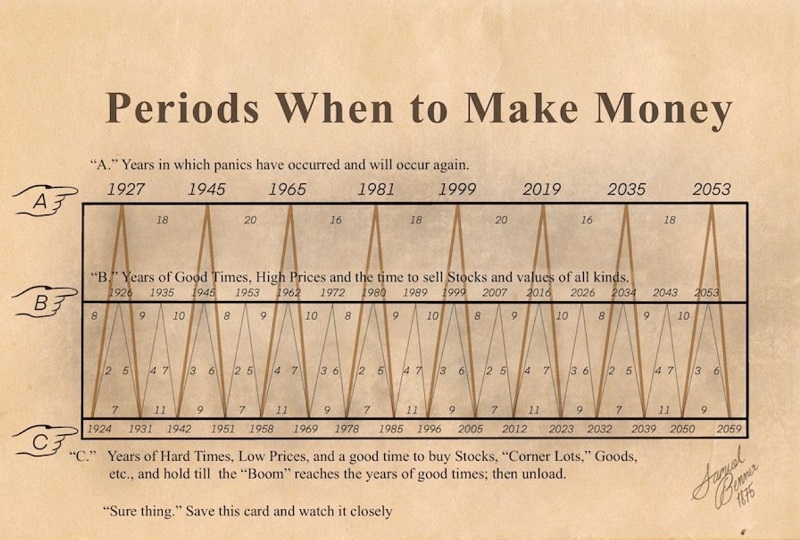
There is a major cycle and a minor cycle. The major cycle (the orange/yellow line) starts by rising from 1924 to 1927 (favorable), then declines from 1927 to 1931 (unfavorable). This line is then non-existent for 11 years until 1942 (neutral).
For this piece, we will look only at the major cycles.
Jay looked first at favorable years within the major Benner cycle - i.e., years when the orange/yellow line is rising. During those periods, $1 in the S&P 500 grew to about $47.
The list below contains all the unfavorable years the major Benner cycle indicates. The current one ends this year.
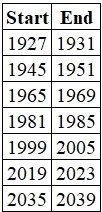
The chart below displays the growth of $1 invested only during the periods listed above
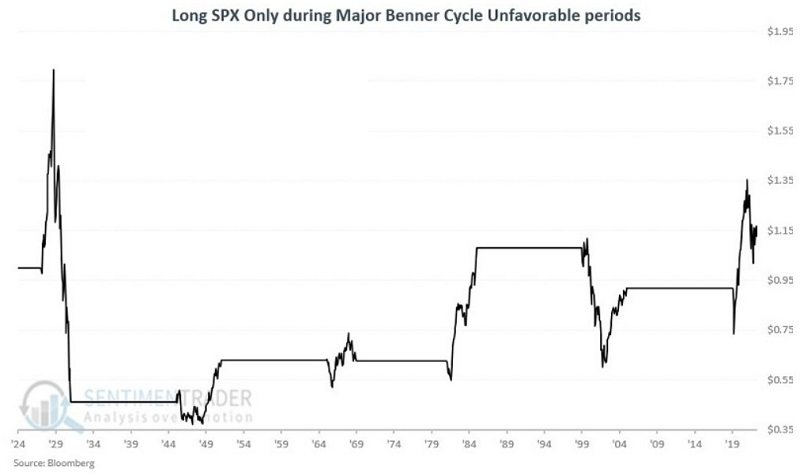
The results above are not uniformly bearish, but most of the periods include a severe bear market and significant volatility. The overall net return is a fraction of those achieved during favorable years.
Minor Benner cycles
Jay continued his analysis of Benner cycles by looking at the minor cycles. In the chart above, this is the light gray line that starts by rising from 1924 to 1926 (bullish), then declines from 1926 to 1931 (bearish).
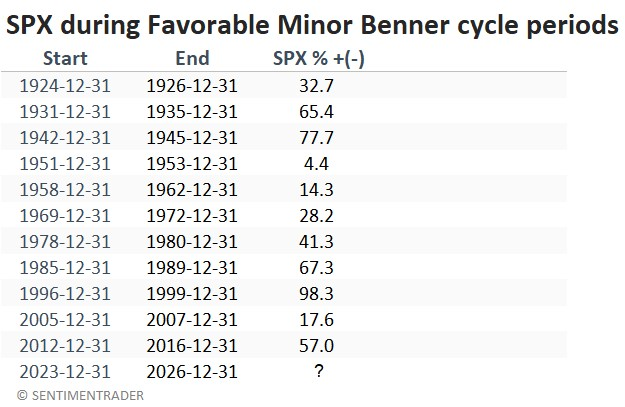
Note that for all tests, we start a new cycle period at the close on December 31st of the stated year and use monthly S&P 500 Index closing prices to track results. So the next minor cycle favorable period begins 2023-12-31 and extends through 2026-12-31.
The chart below displays the growth of $1 invested only during these favorable periods.
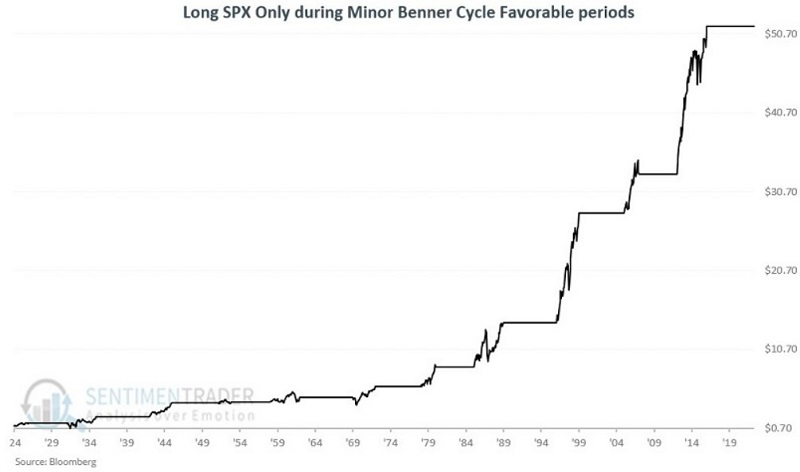
In the past 100 years, overall market performance has been uniformly positive during favorable years in the minor Benner cycle. The table below displays the cycle-by-cycle results.
Jay also touched on those periods when both cycles are favorable (and unfavorable), during which stocks have shown drastic differences in returns. Neither condition is on the immediate horizon.
Are good earnings already priced into stocks?
Is a good earnings season already baked in? Over the past month, investors (traders, really) seemed to think that earnings season will bring good news and have already bought in advance.
If that's the case, then this is one of the most-baked-in earnings seasons since 1950. With more than a 6% rally in the month prior to the start of earnings season, the S&P 500 locked in the 14th-best pre-earnings month.
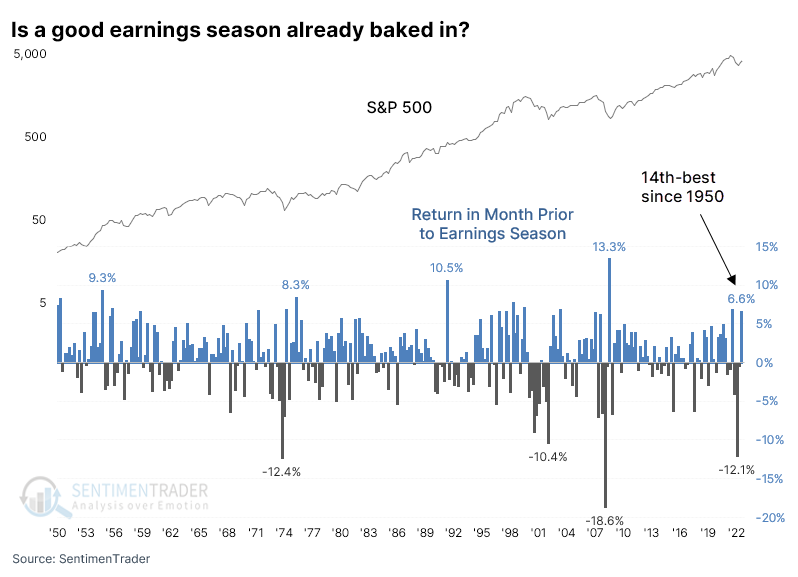
The table below shows the earnings seasons that saw the largest rallies in the S&P in the month prior to the start of the season. On average, the index gained nearly 7% during those four-week stretches, so the current one is right around average.
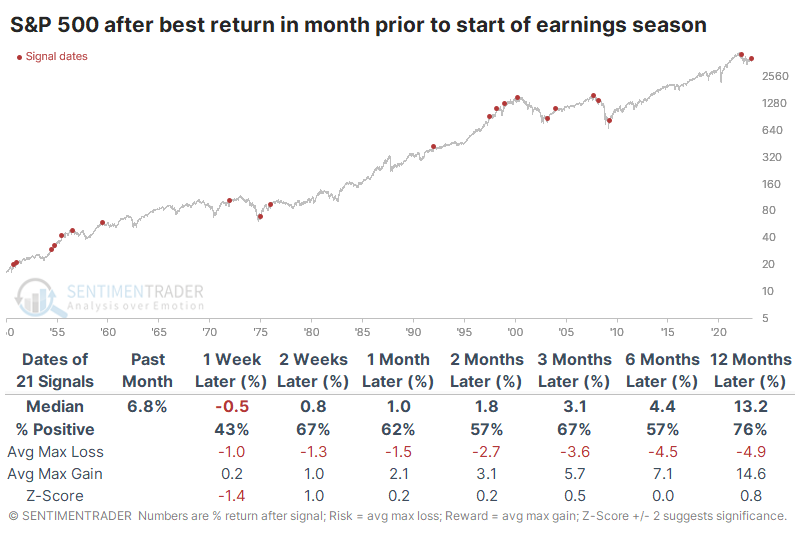
The baked-in argument has a bit of merit in the very short term. Over the first week of earnings, the S&P rallied 43% of the time, with a negative median return. But after that, the case becomes much harder to make. Earnings season runs roughly 30 trading days, between one and two months. And in the month following these signals, the index rallied 62% of the time, with its average max gain exceeding the average max loss.
Across all future time frames, the S&P's return was better than random. Granted, there was nothing special in the returns, but that's kind of the point - the "baked-in good news" didn't radically impact forward returns, though anyone buying last year would disagree.
Among sectors, Technology and Discretionary stocks tended to react the best in the month following these signals.
There is some bad news for bulls, however. If we break down the prior-month rallies before earnings season by quarter, then the current one comes out the worst, by far. When the S&P 500 rallied hard into Q1 earnings season - when companies start to report their results in April - then forward returns were quite poor.
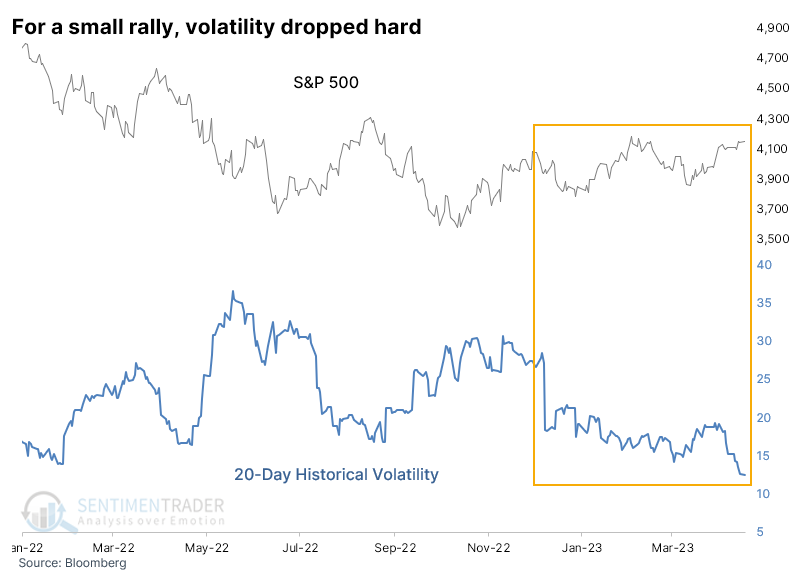
Ahead of earnings season, stocks have become a lot calmer
Stocks have been holding steady, with the S&P 500 in a modest uptrending range since December. What's remarkable is the drastic decline in volatility, which has dropped by more than half.
Over the past 90 sessions, the S&P's historical 20-day volatility, as calculated by Bloomberg, declined from nearly 28% to a little over 12%, a decline of 55%, and it set a new 52-week low. During that same period, the S&P 500 rose only 3.6%.
A drop in volatility, either historical or implied, usually triggers an anxiety alert for contrarian investors: irrational exuberance and all that. And when a plunge in volatility comes during a mostly range-bound market, the anxiety ratchets up even more.
To see if contrarian concerns may be justified, the table below shows whenever the S&P rallied less than 5% over the past 90 days. However, its historical volatility declined by over half, setting a 52-week low.
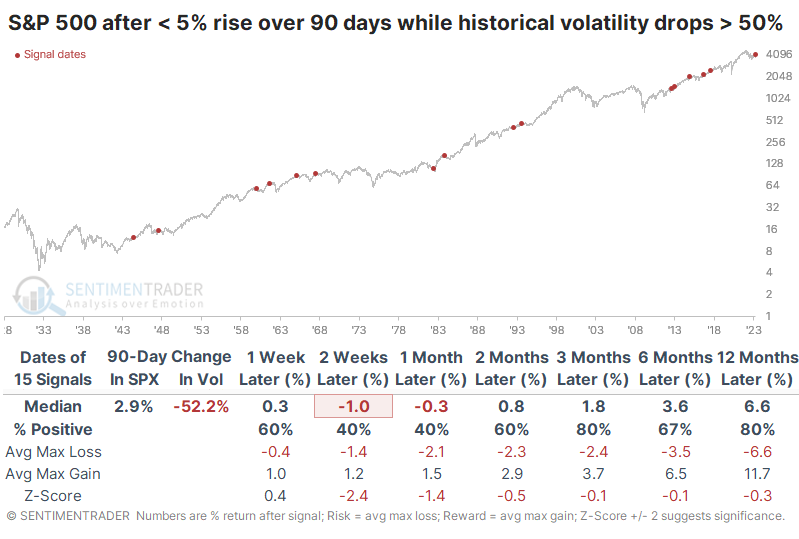
Short-term forward returns weren't so hot, and the S&P underperformed a random return over almost all time frames. Even so, significant losses were minimal or nonexistent, and over the next three and twelve months, there were only 3 losses out of 15 signals.
Among sectors and factors, Technology, Discretionary, and Financial stocks enjoyed some of the largest returns following these signals. That's consistent with a renewed sense of risk-taking during lower-volatility environments.
Few stocks can match the S&P 500's recent pace
As a reflection of a calmer market, historical volatility in the most benchmarked index in the world has plunged over the past month, and the correlation among stocks in the S&P 500 has steadily fallen lately and is at the lowest level in almost a year.
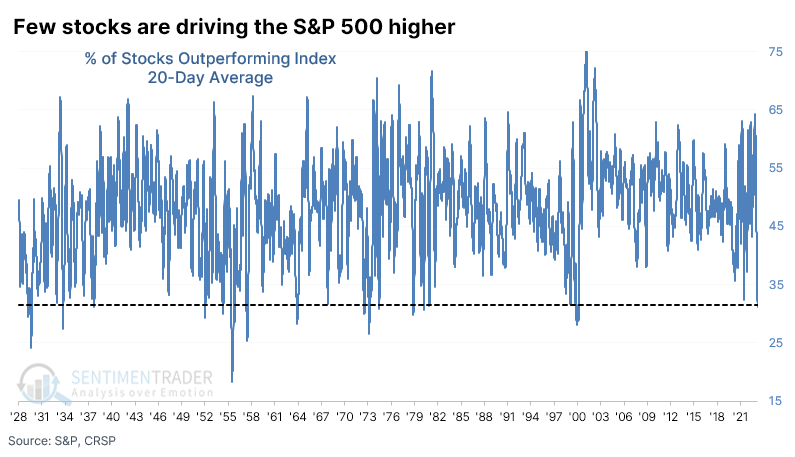
Over the past 20 days, the percentage of S&P 500 stocks outperforming the index on an average session has fallen to less than 32%. That's the lowest since 1999-00.
Any mention of the year 2000 as a precedent automatically raises the hairs on the backs of the necks of any investors active at that time. Zooming out over a long history, the current collapse in outperforming stocks rivals some of the most egregious extremes since 1928.
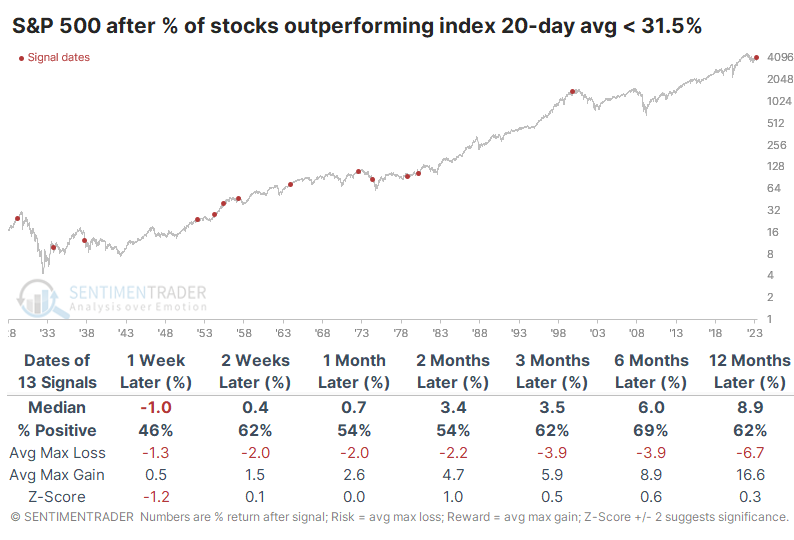
The table below shows every time the 20-day average of outperforming stocks dropped to this low a level for the first time in at least a year. And there were some pretty terrible precedents in there, most notably in 1999.
Even so, there were no double-digit losses over the next year. Stocks were definitely volatile after some of the signals, and several suffered large drawdowns at various points in the next year, but the S&P still showed a median gain of nearly 9%, higher than random.
The S&P 500 is a capitalization-weighted index, so a handful of large stocks can have an outsized impact on its returns. We have a reconstructed equal-weight version of the S&P 500 dating back to October 1957.
Over the next 6-12 months, the equal-weighted version did better than the cap-weighted version after five of the six signals. Several times, the signals occurred around significant turning points in the ratio.
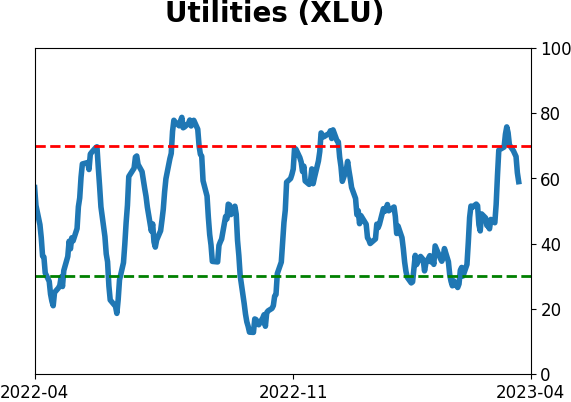
Utility stocks have reversed their outperformance
Outperformance by defensive utility stocks surged and subsequently collapsed. Dean noted that after similar reversals, the S&P 500 showed solid medium and long-term results while the Utility sector struggled on an absolute and relative basis across all time frames.
During periods of market stress, utilities are one of the go-to sectors for investors as they seek a more defensive portfolio allocation to minimize drawdowns. When the fear subsides, market participants flee the relative safety of utilities for sectors with a more offensive tilt.
Last week, 90% of S&P 500 Utility sector members outperformed the S&P 500 Index over a rolling 1-month period. At the same time, fewer than 37% of S&P 500 members outperformed the Index, creating a spread of over 53% between the two series.
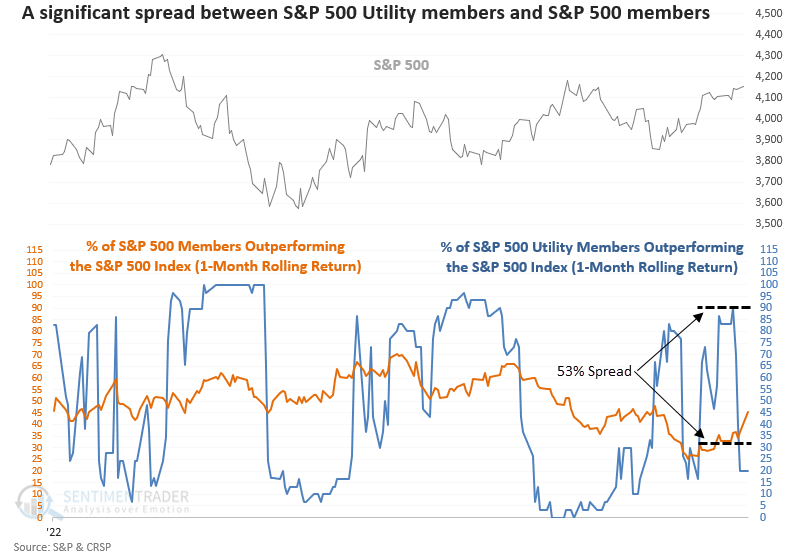
The trading signal identifies when the spread between S&P 500 Utility sector members and S&P 500 members increases above 48% and then declines below 0%, which occurred last Friday.
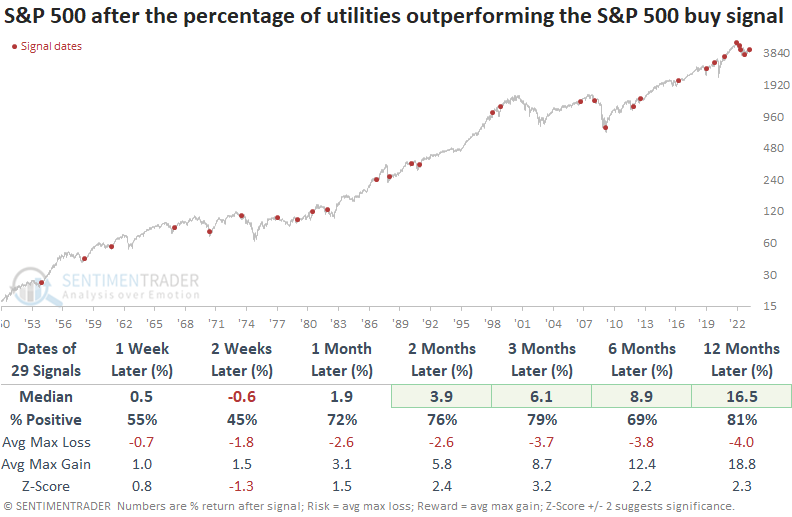
Recent signals struggled, resembling the 1970s when the Federal Reserve was fighting high inflation. But once the bottoming process is complete, the results look excellent on a medium and long-term basis.
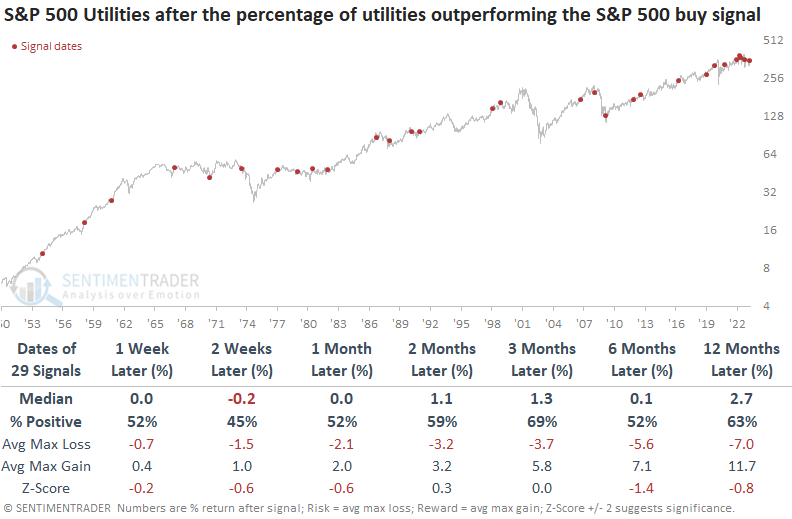
There was nothing to get excited about owning Utility stocks over any time frame. Forward returns for the sector were about equal or rose than random returns across all time frames.
About TradingEdge Weekly...
The goal of TradingEdge Weekly is to summarize some of the research published to SentimenTrader over the past week. Sometimes there is a lot to digest, and this summary highlights the highest conviction or most compelling ideas we discussed. This is NOT the published research; rather, it pulls out some of the most relevant parts. It includes links to the published research for convenience, and if you don't subscribe to those products, it will present the options for access.
Indicators at Extremes
|
|
|
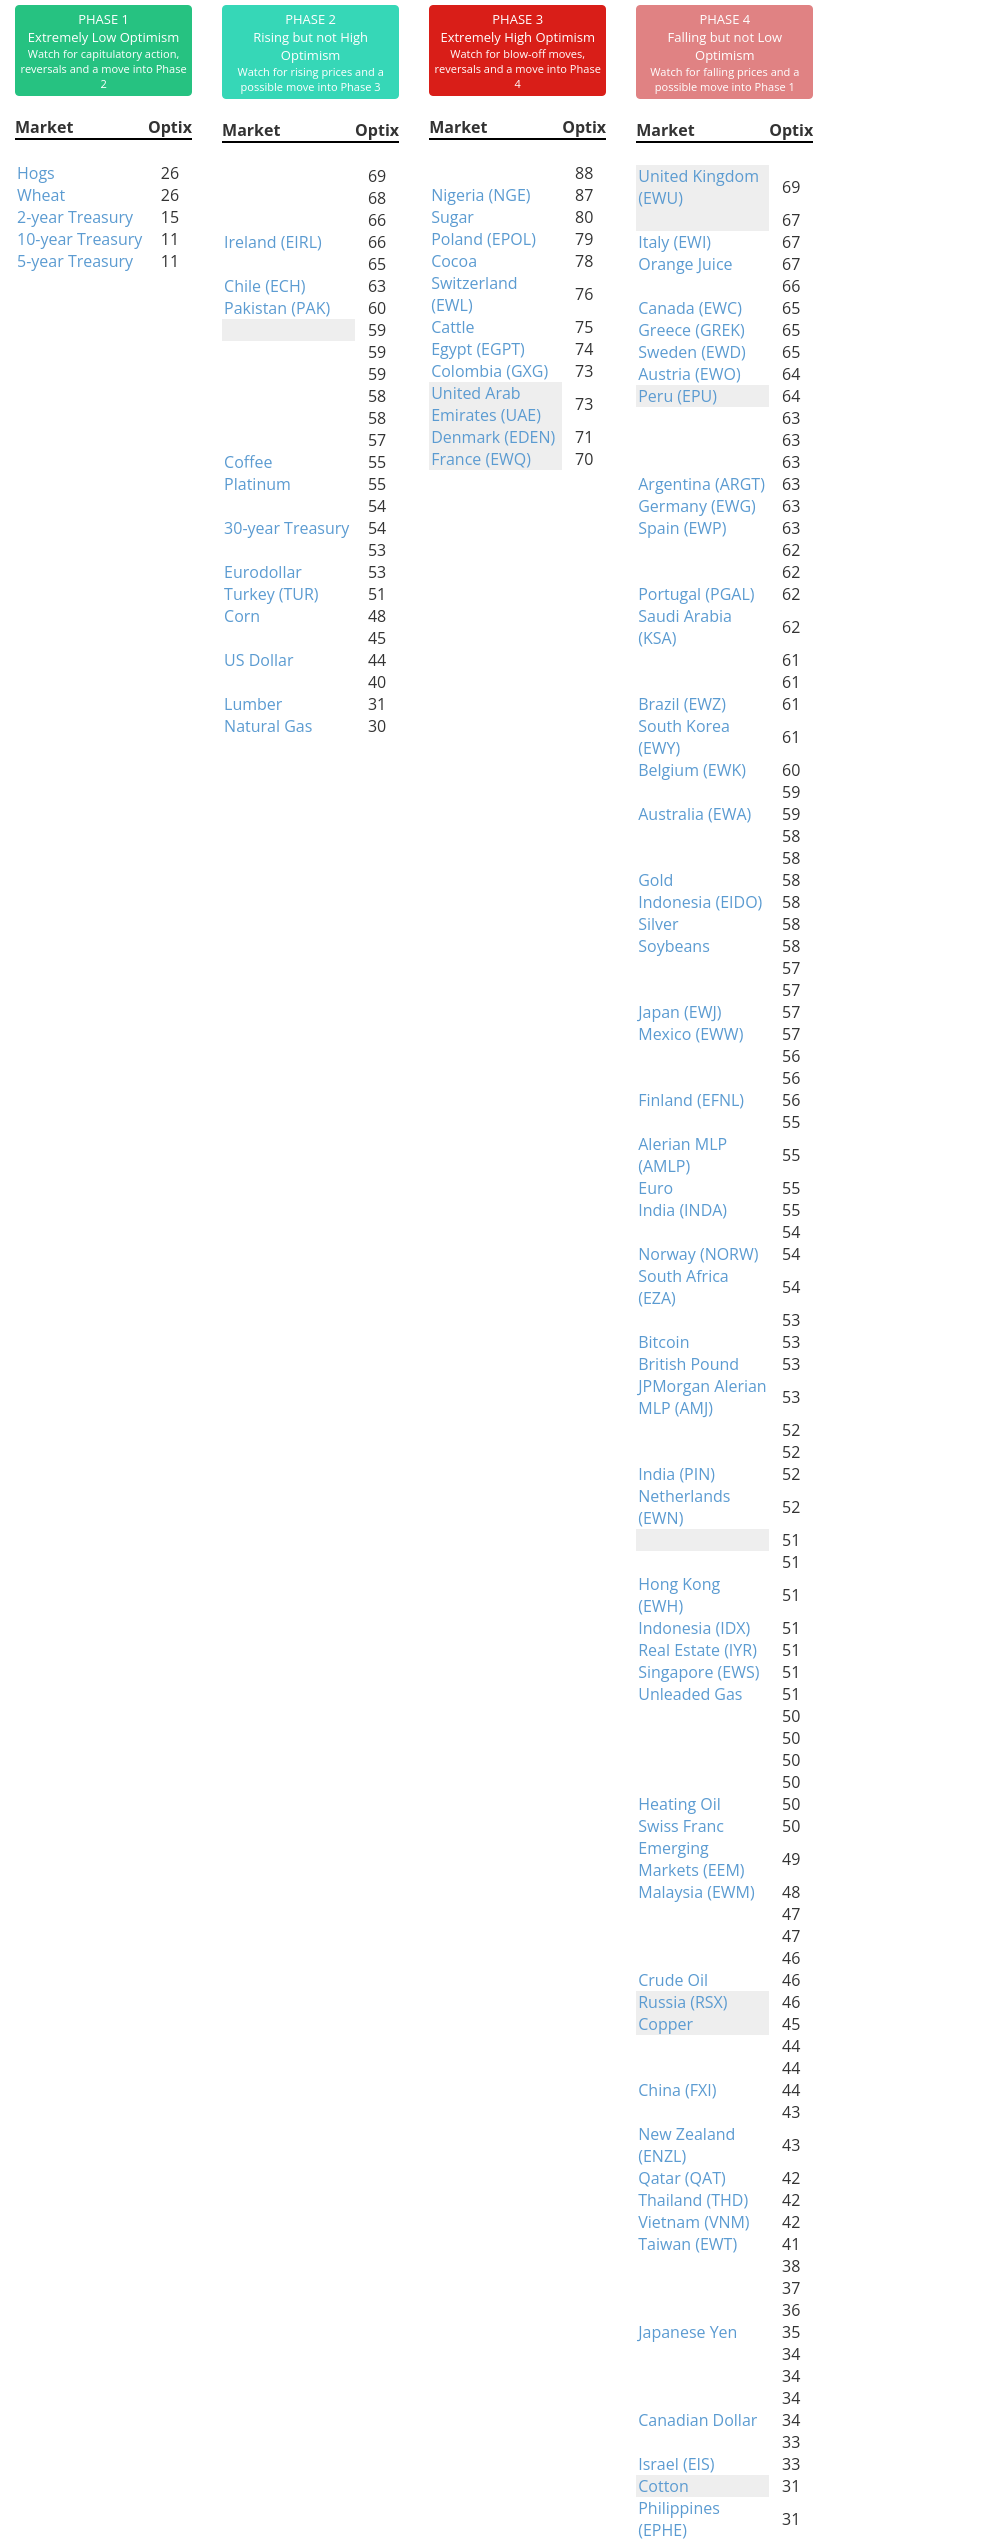
Phase Table
|
|
|
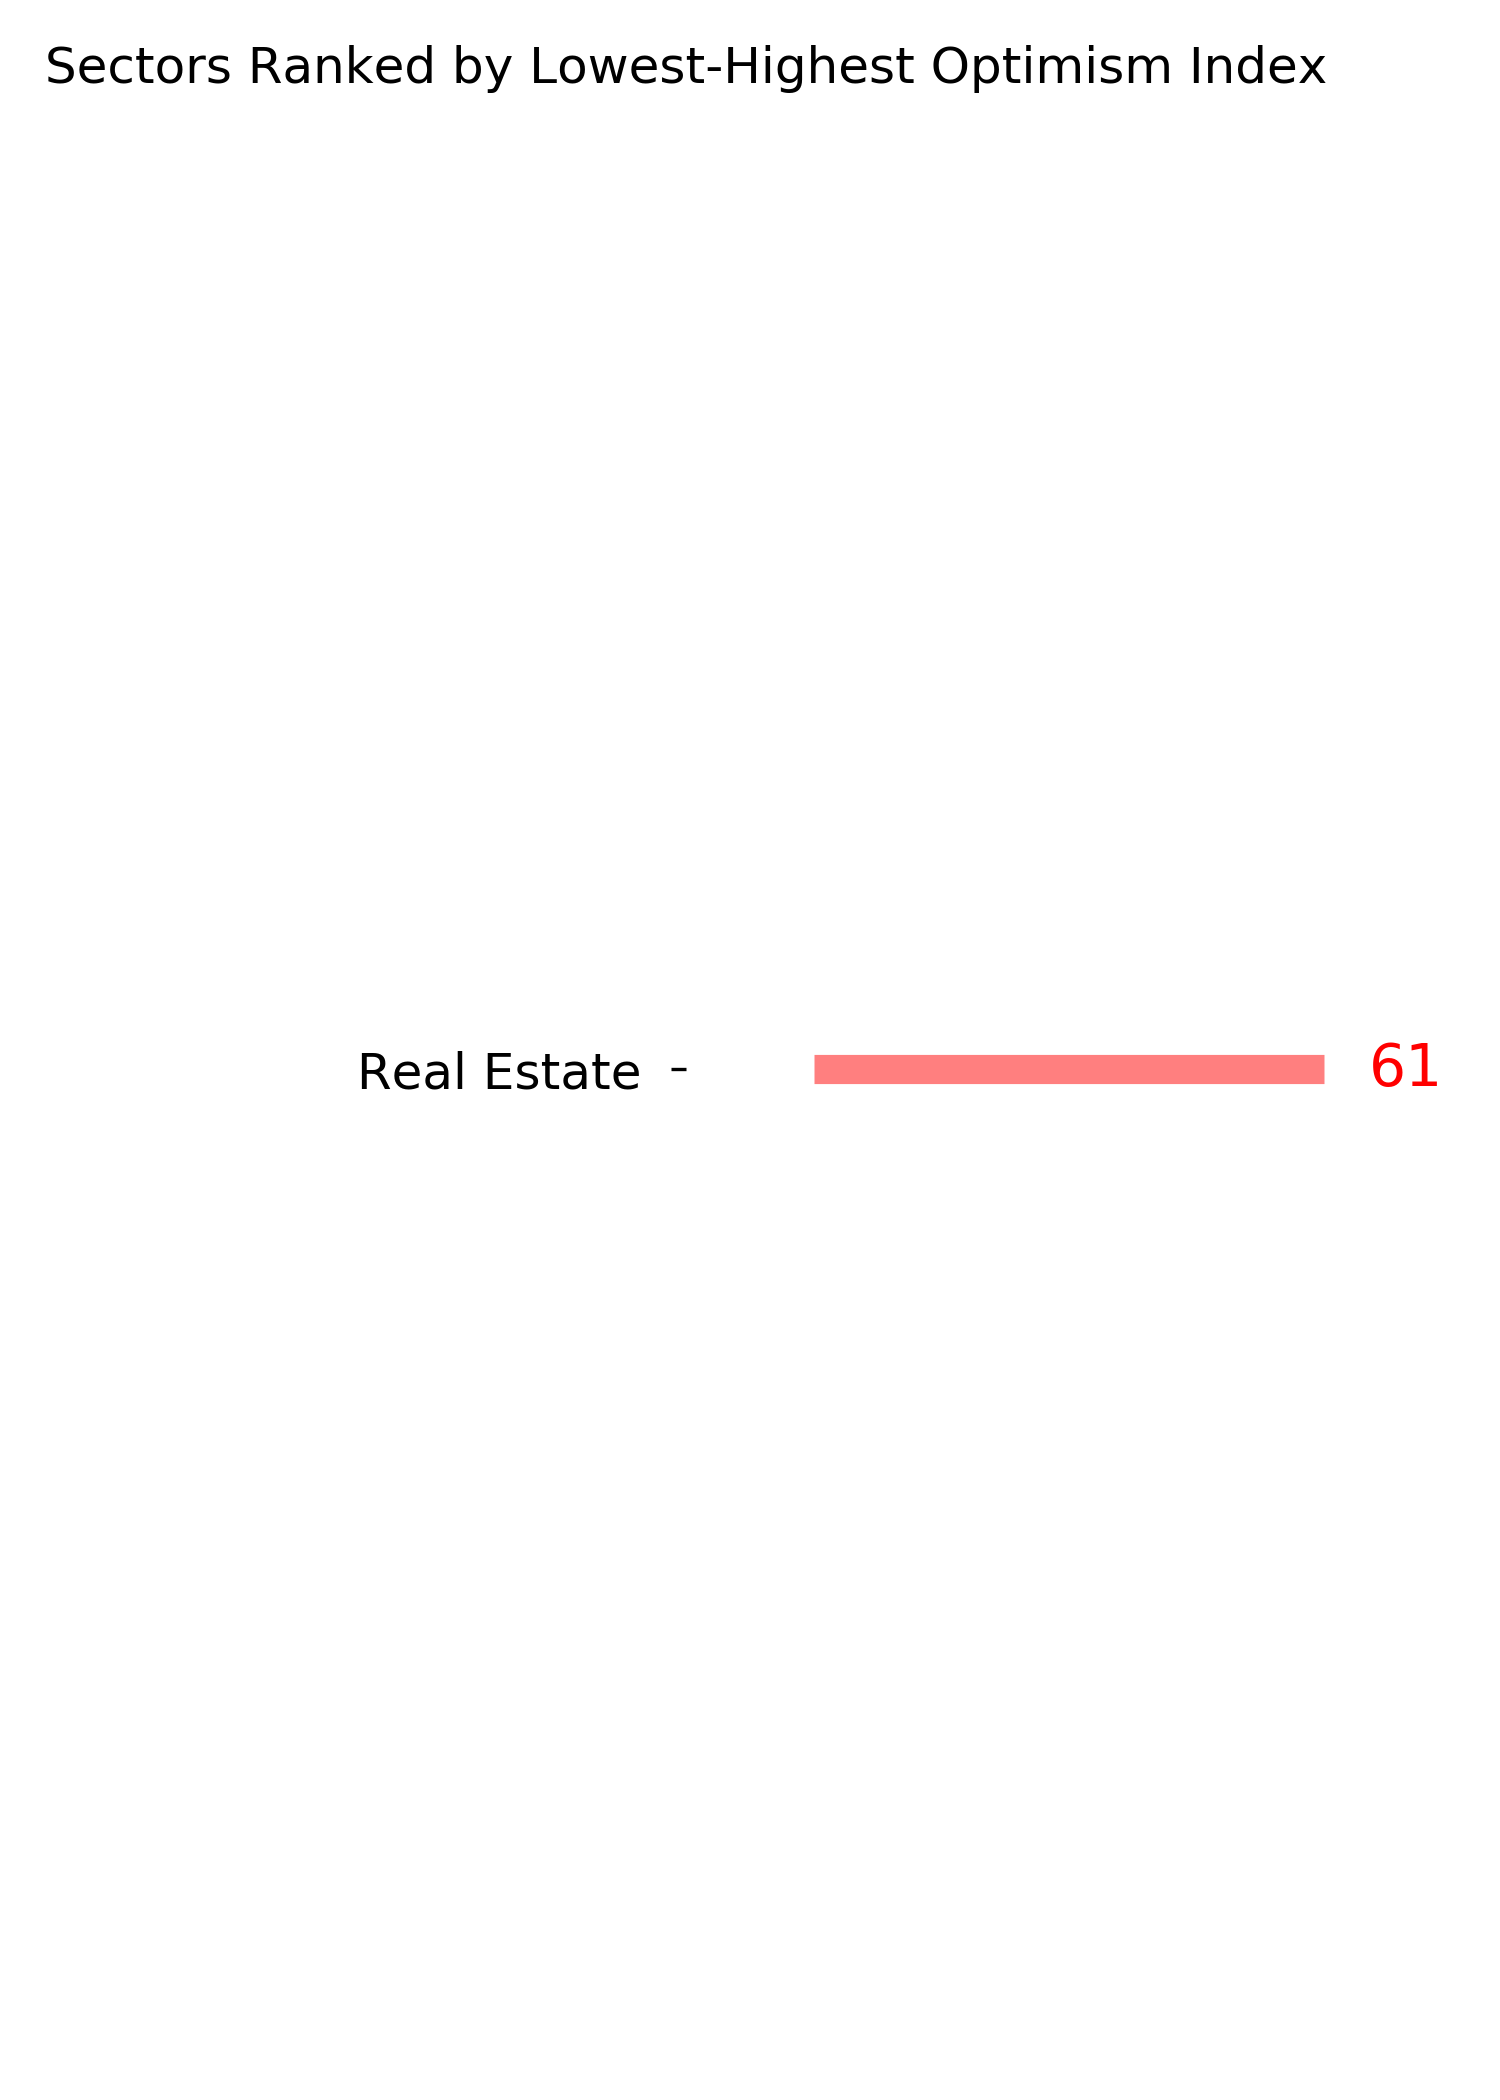
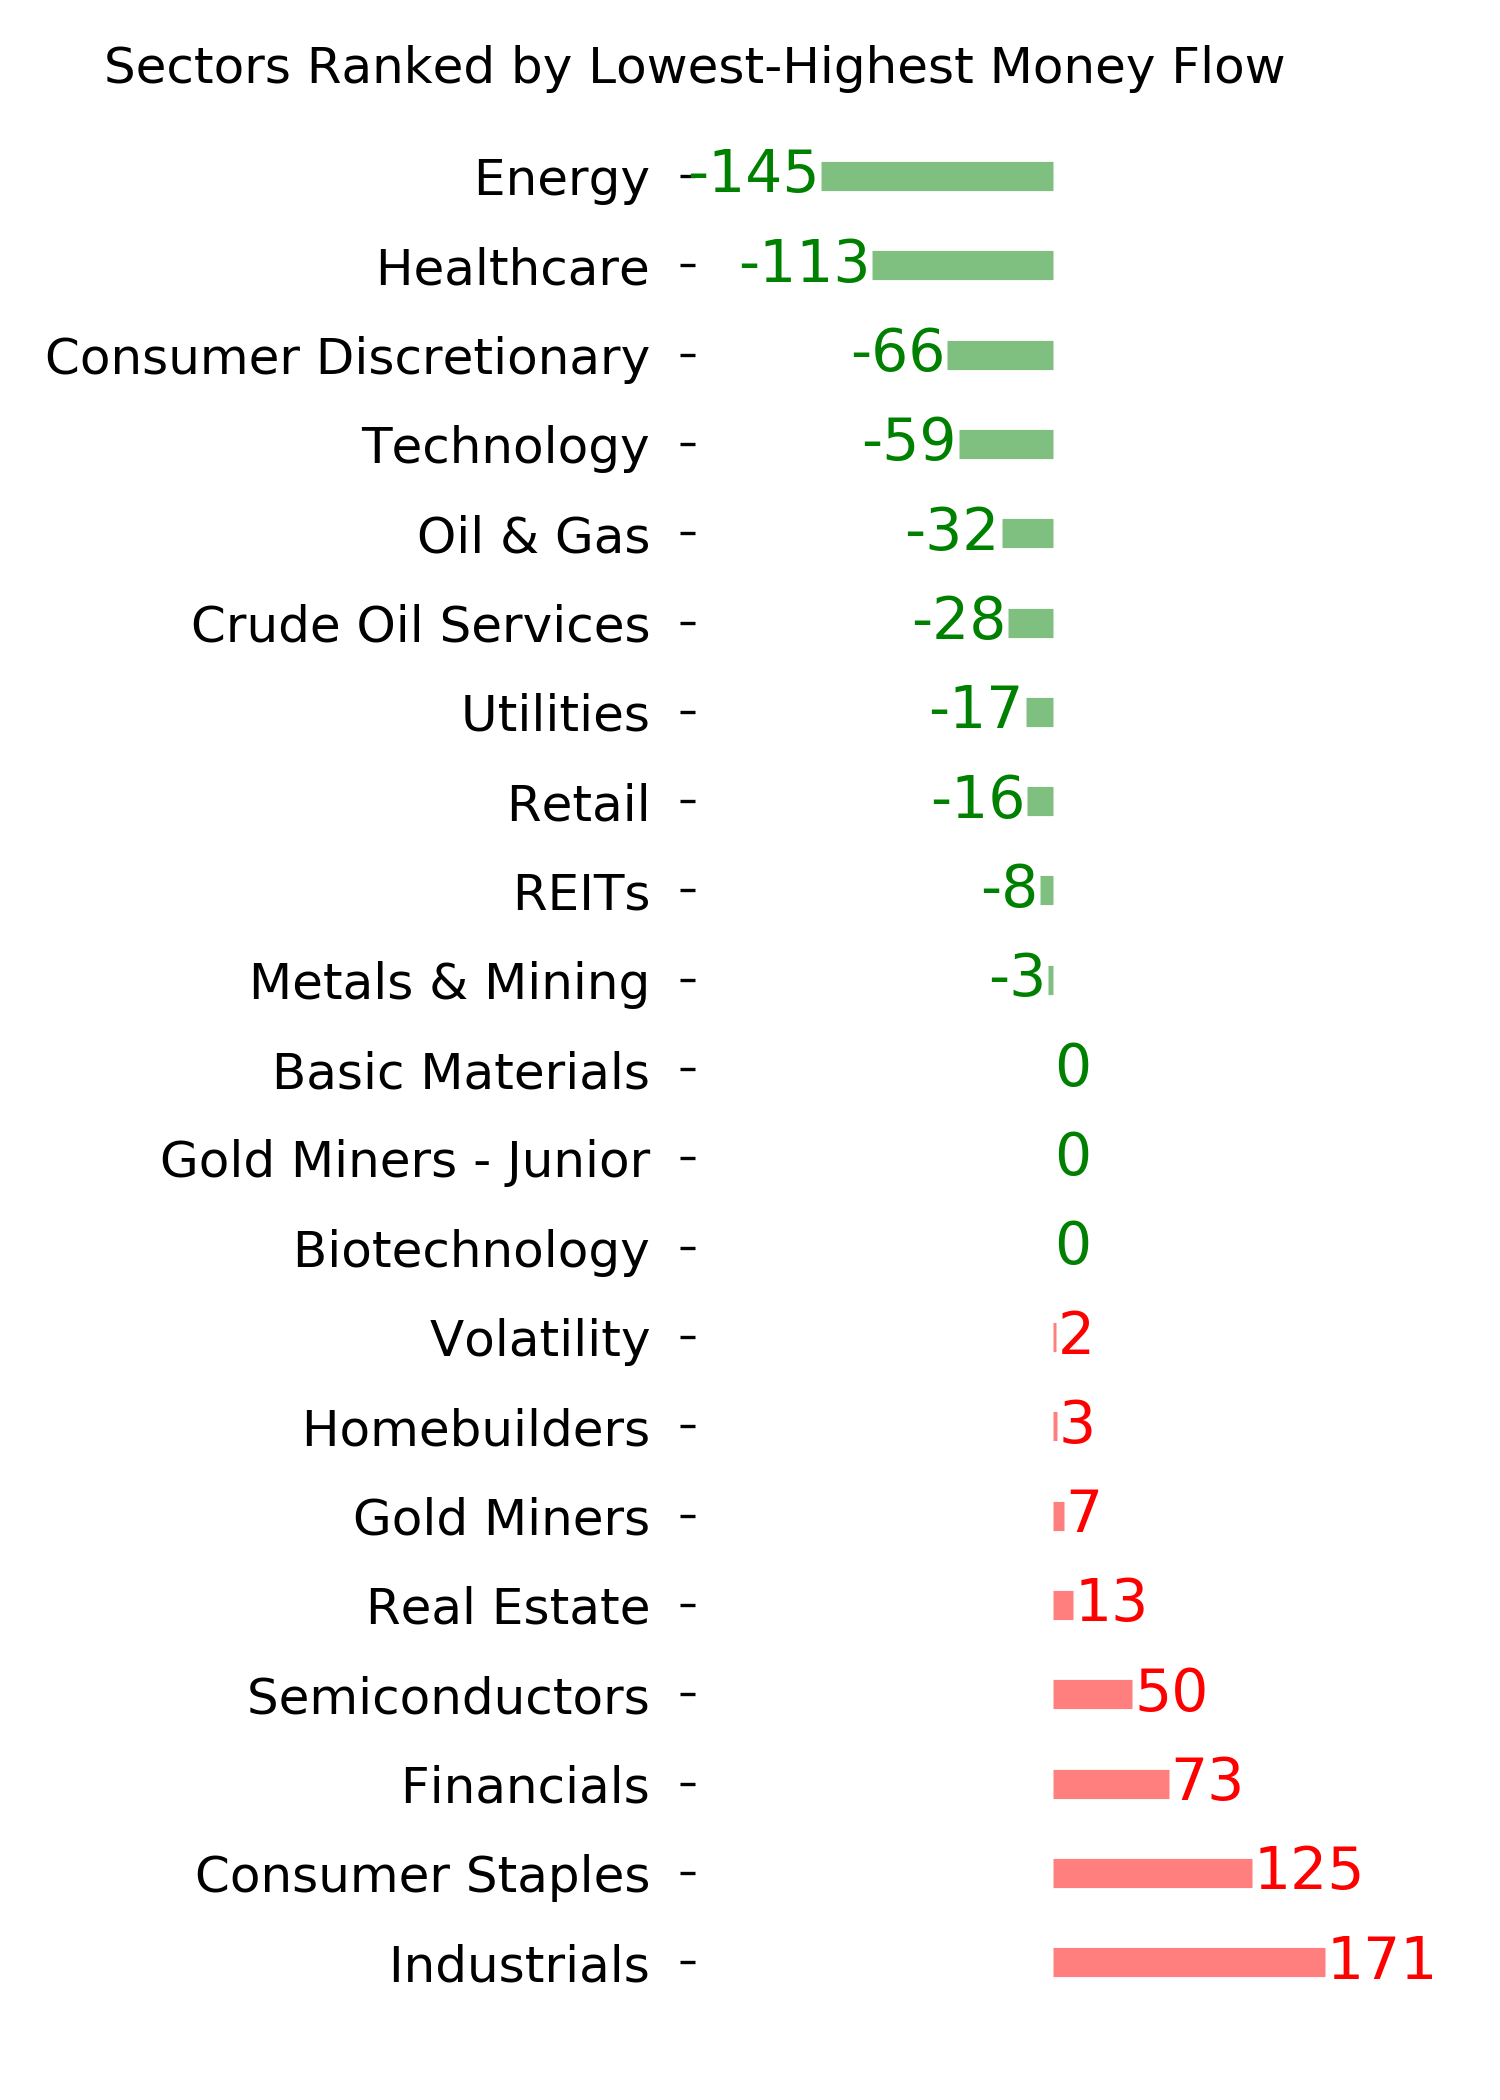
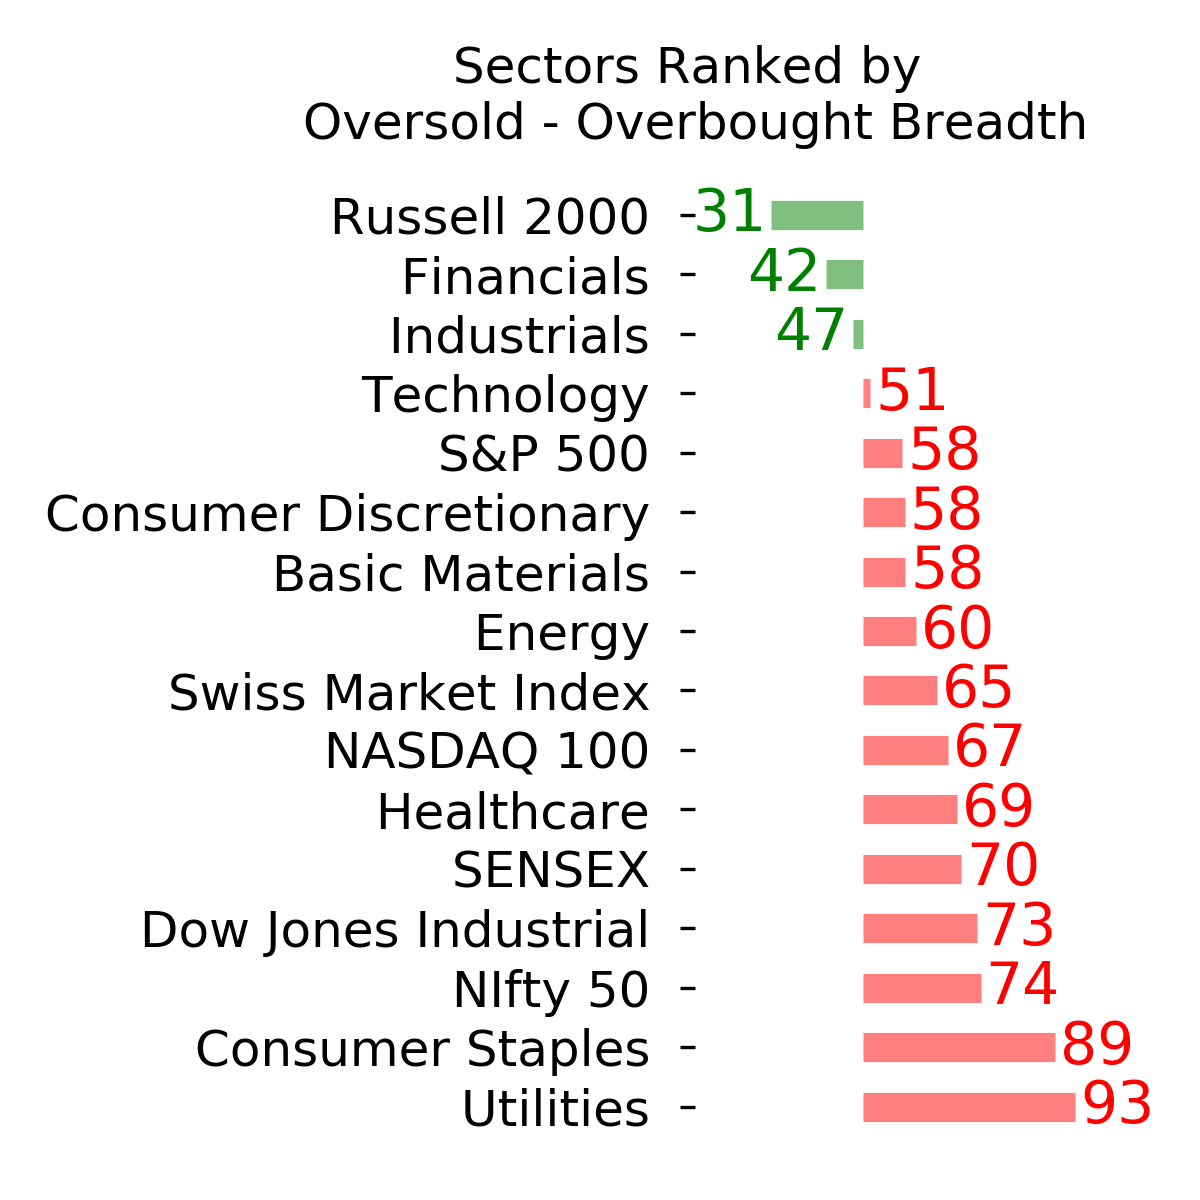
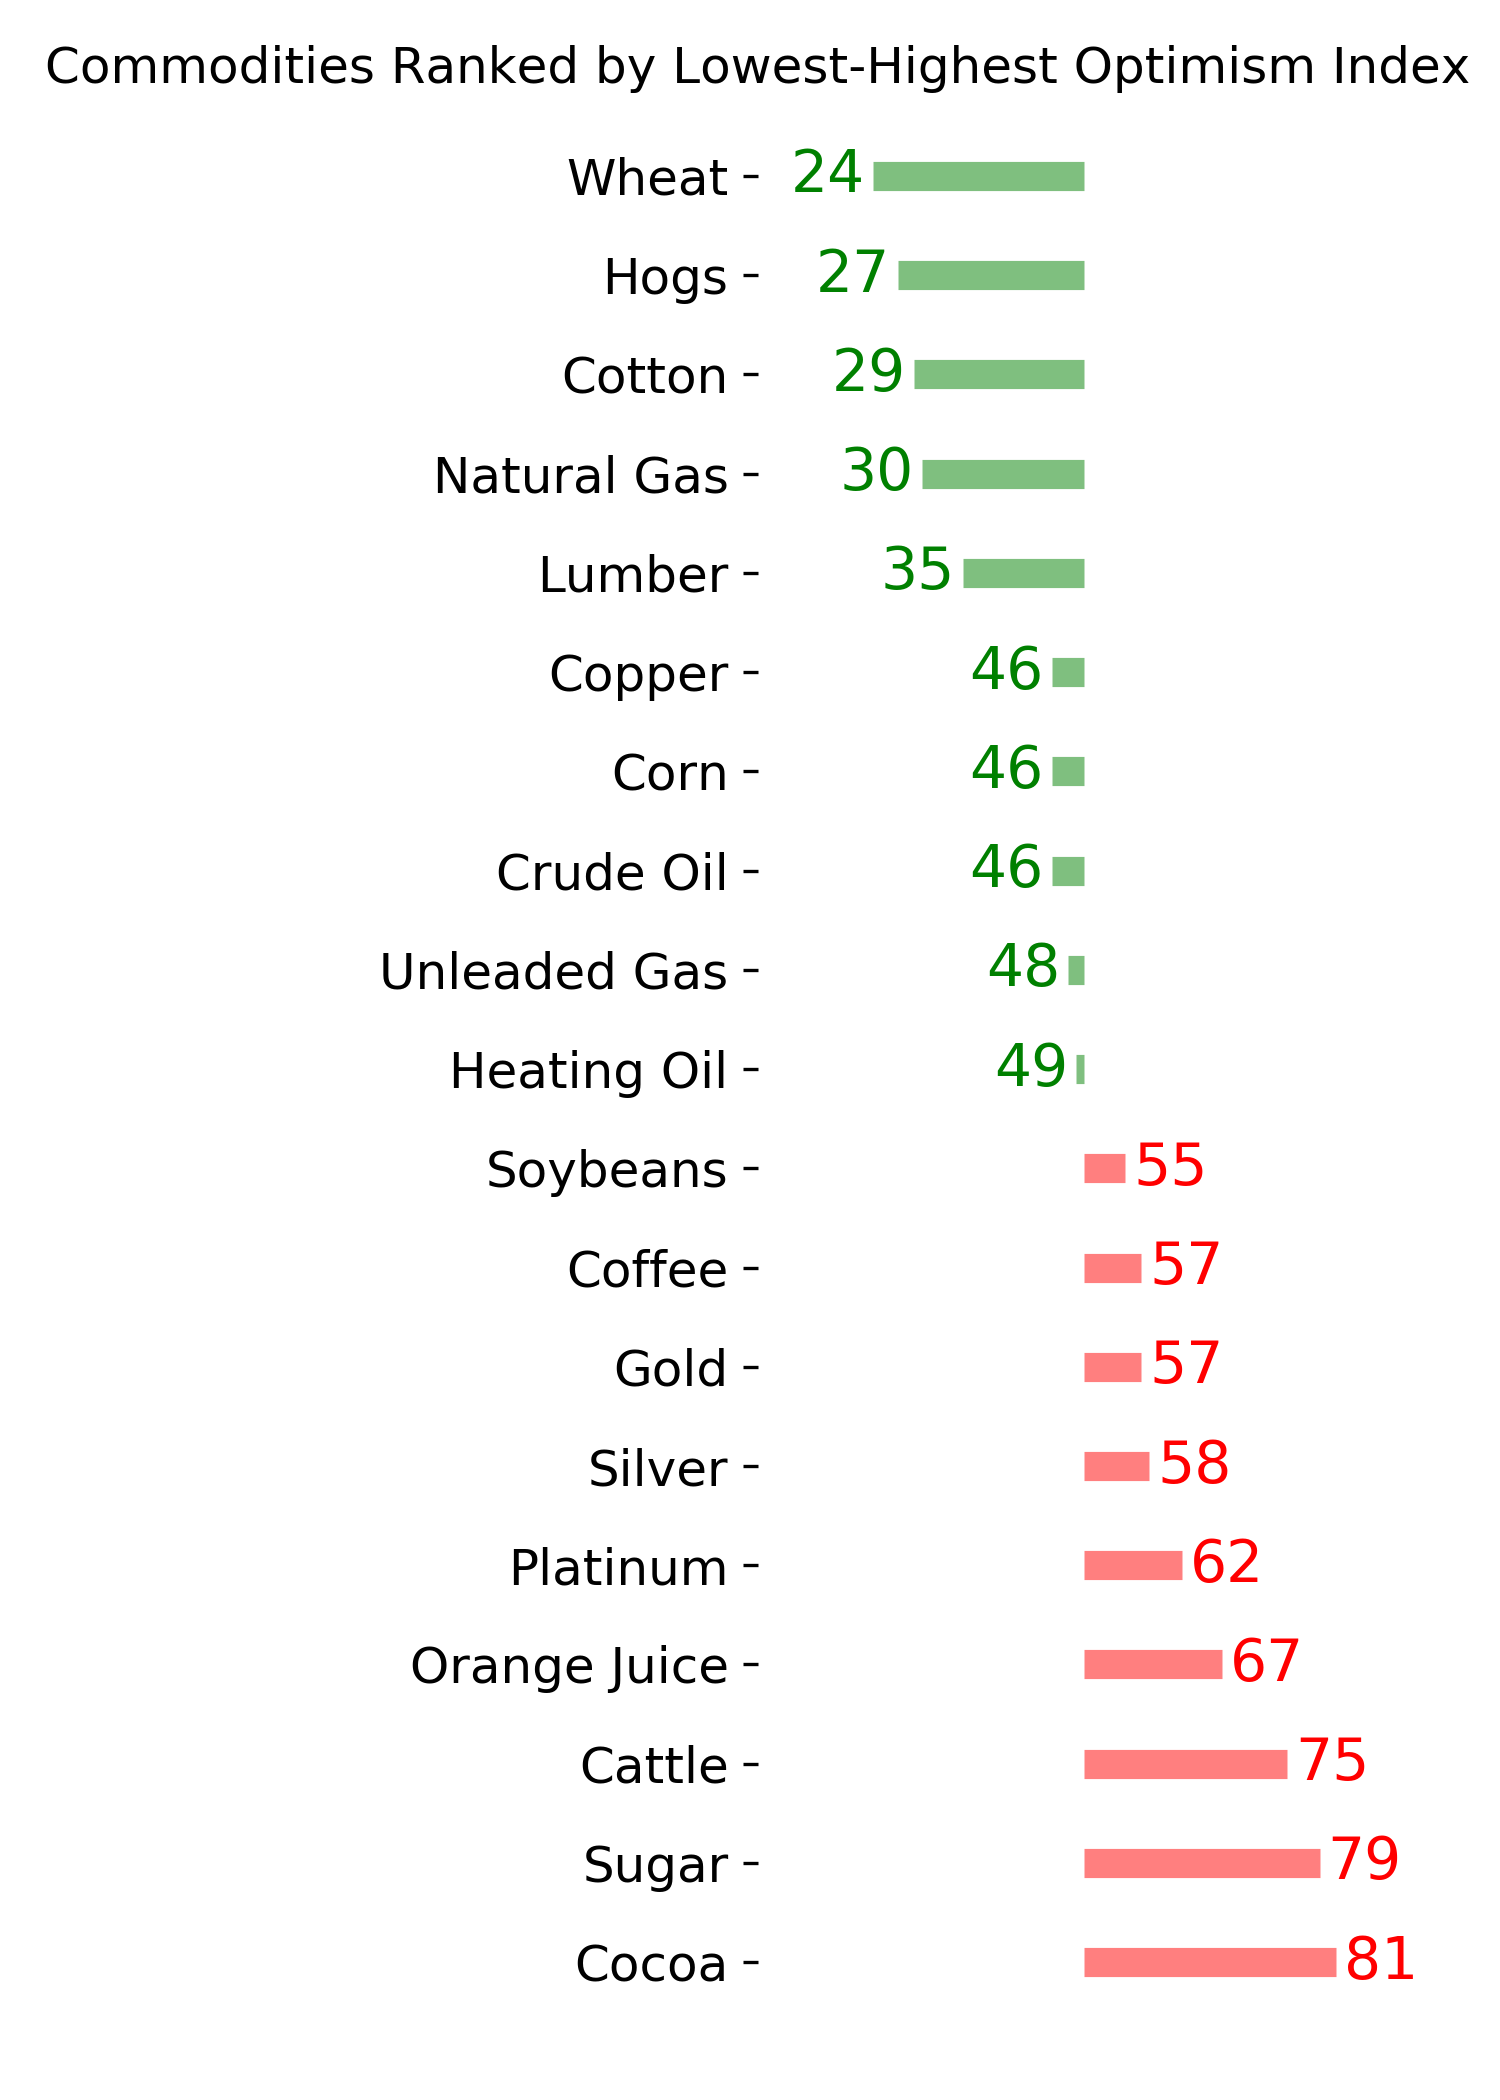
Ranks
|
|
|
|
|
|
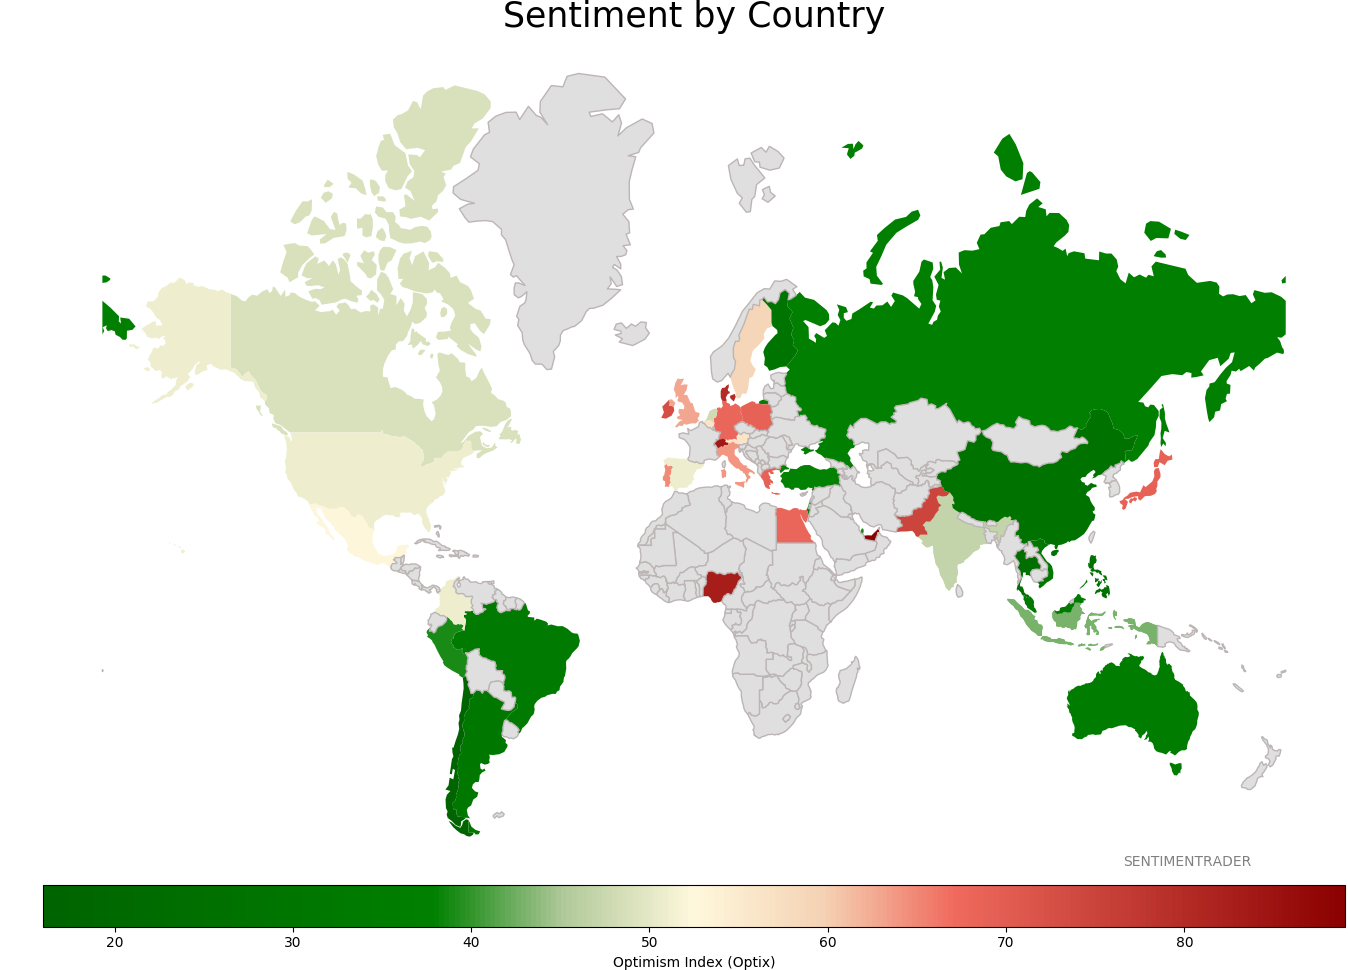
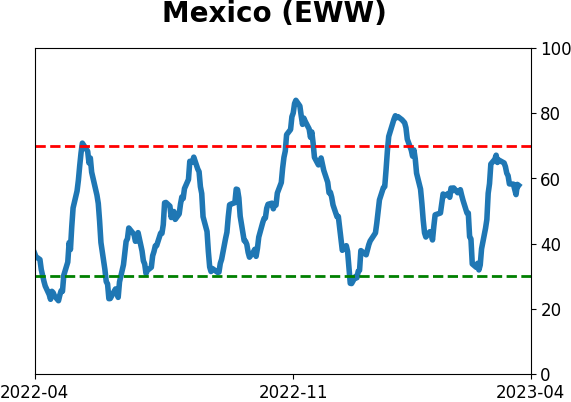
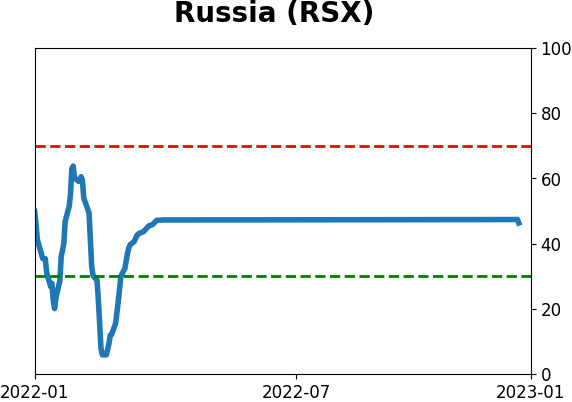
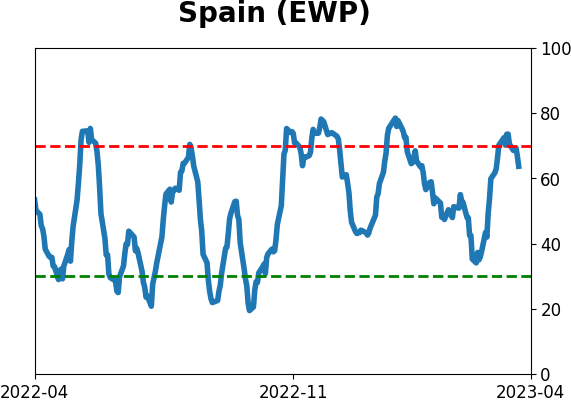
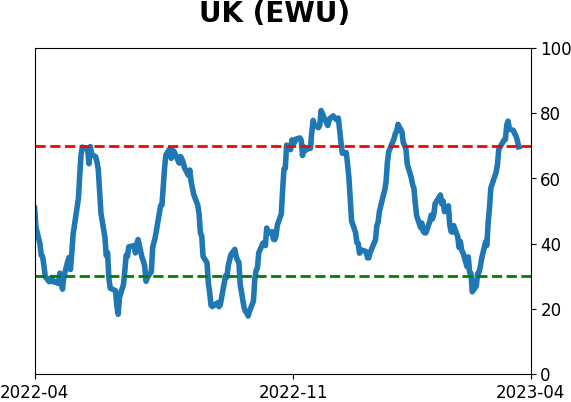
Sentiment Around The World
|
|
|
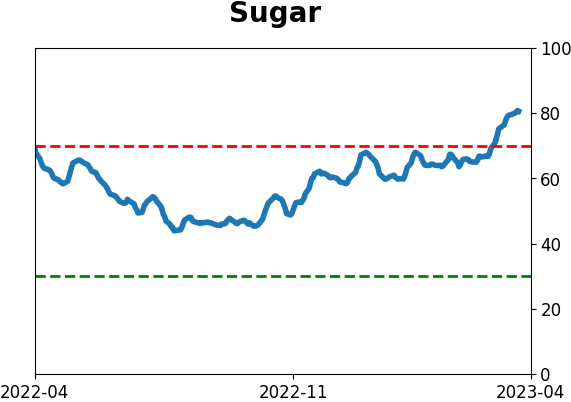
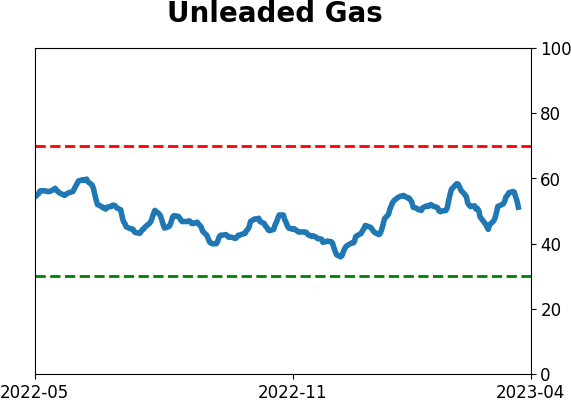
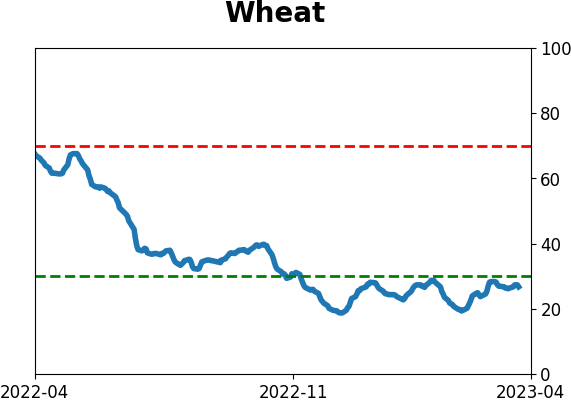
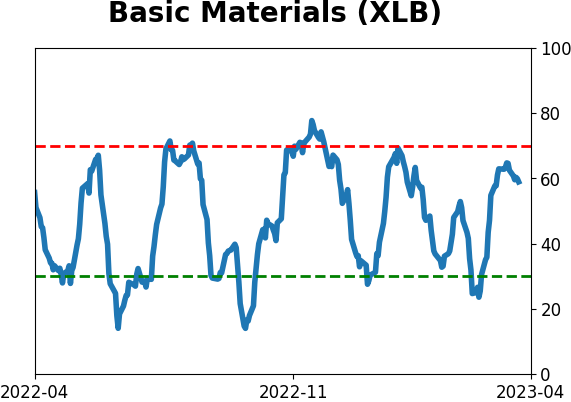
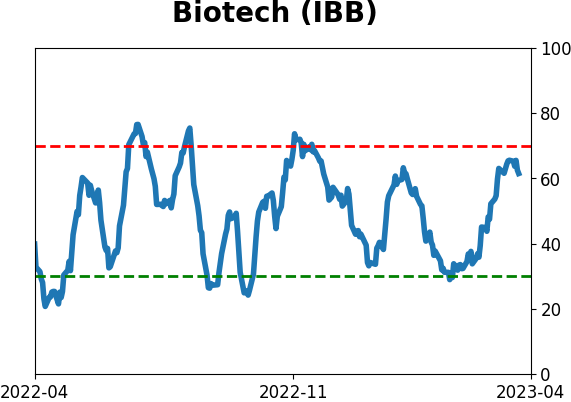
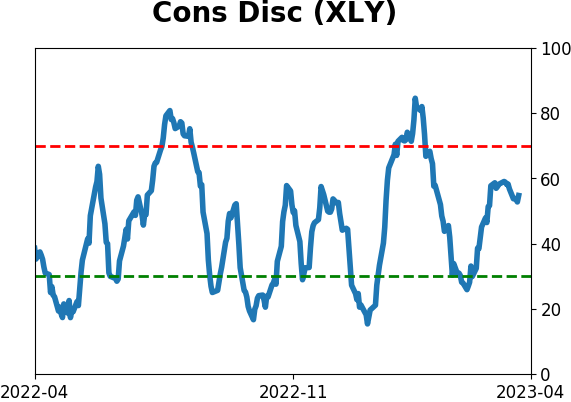
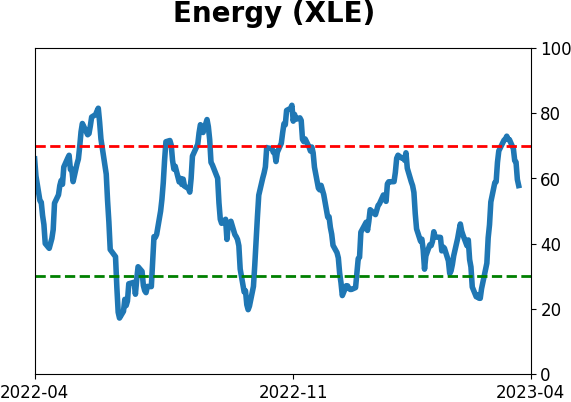
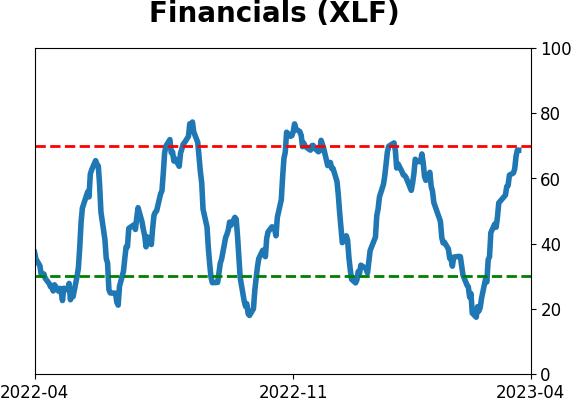
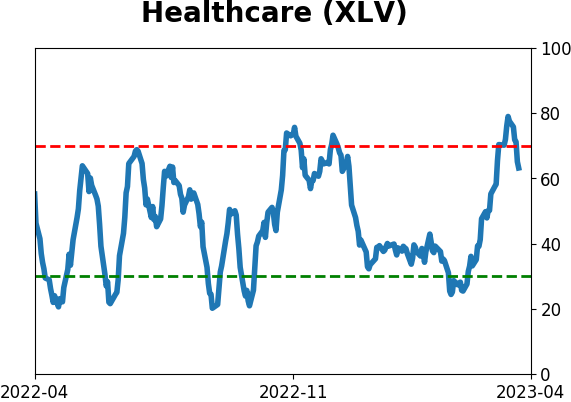
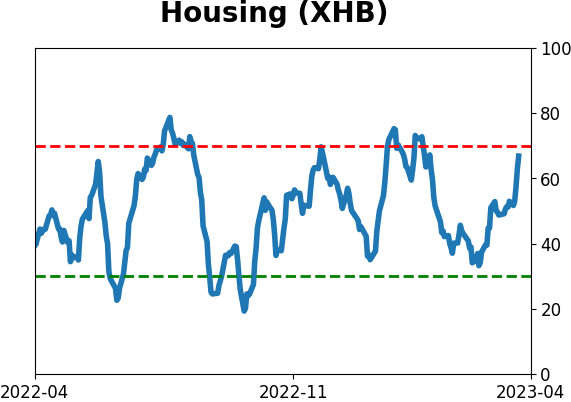
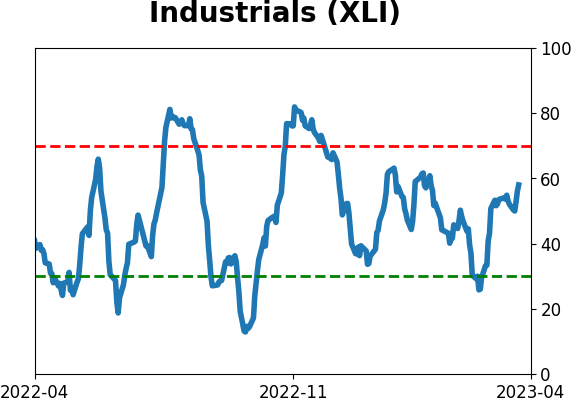
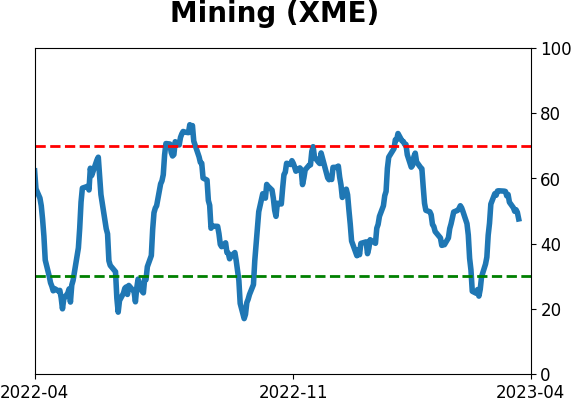
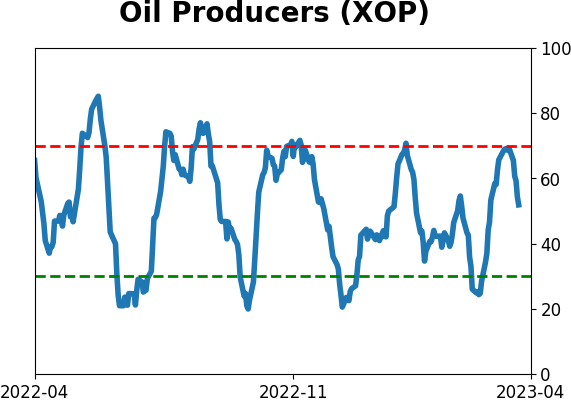
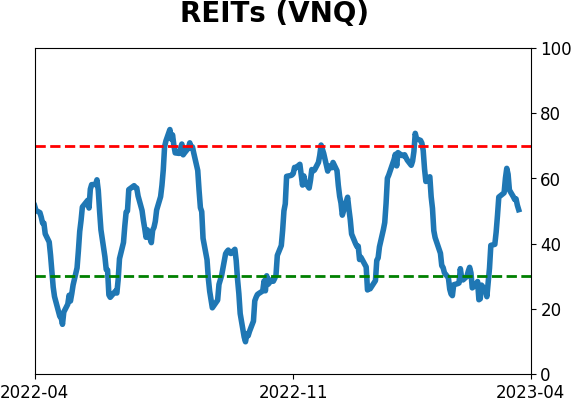
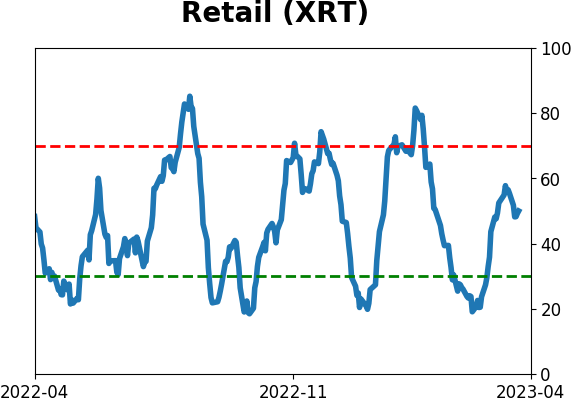
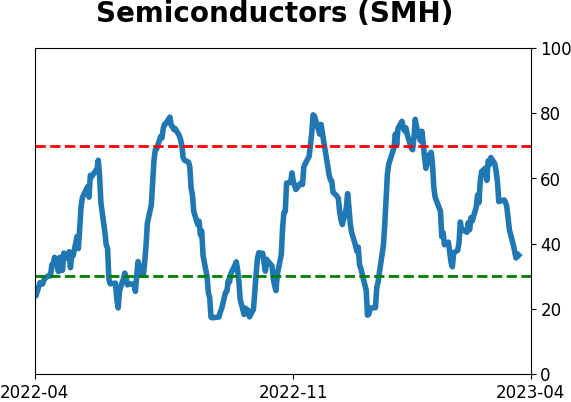
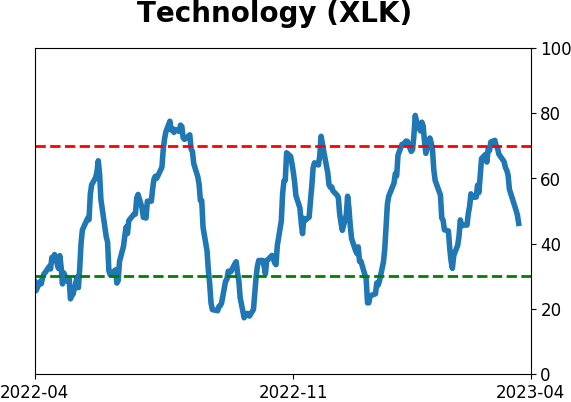
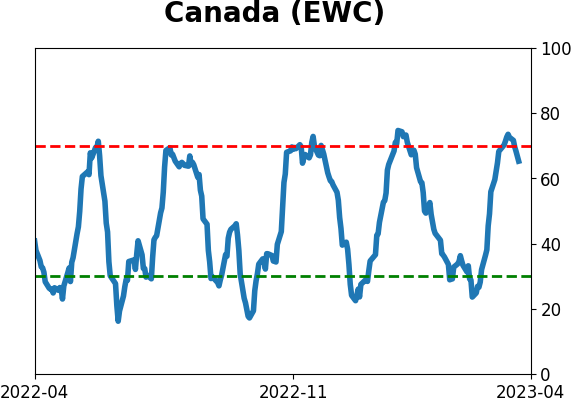
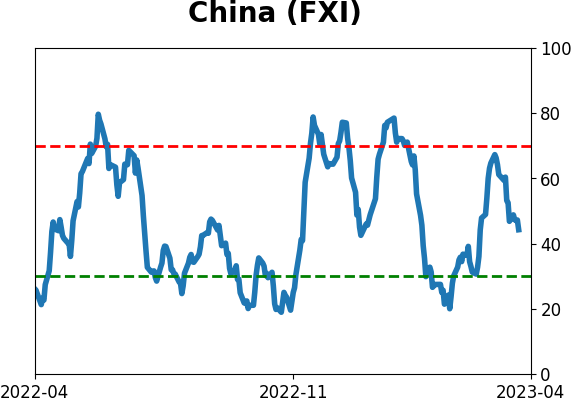
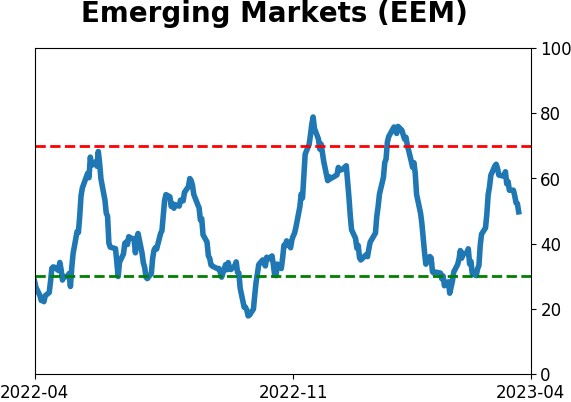
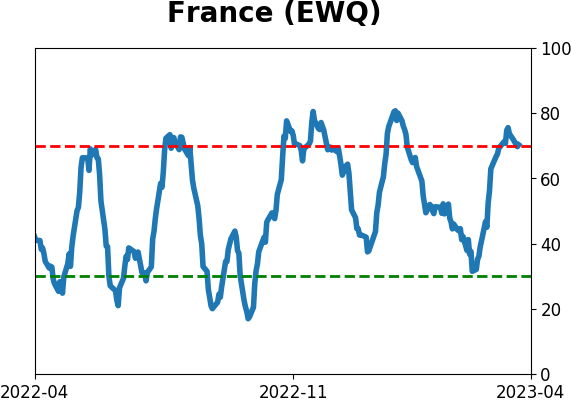
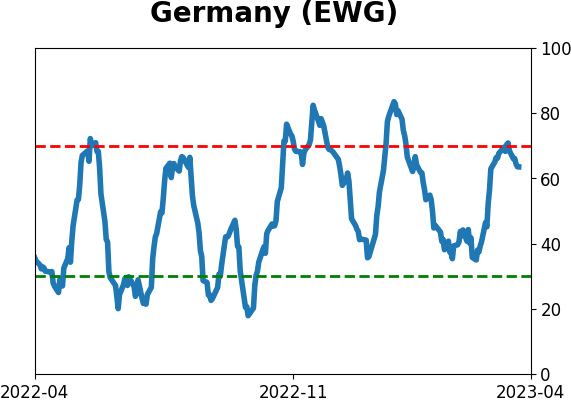
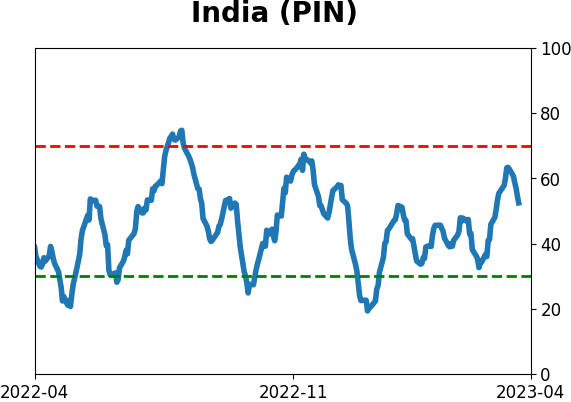
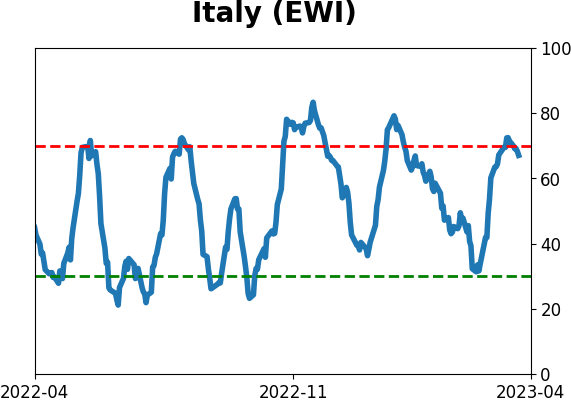
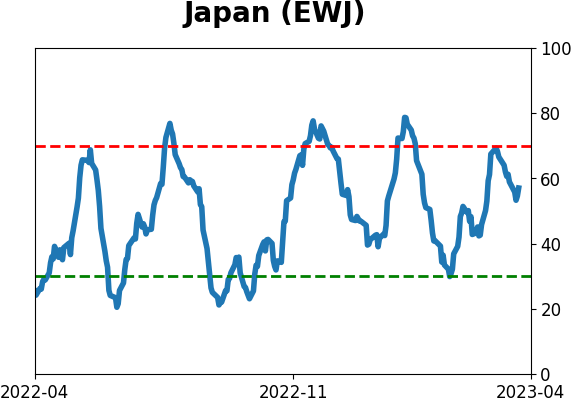
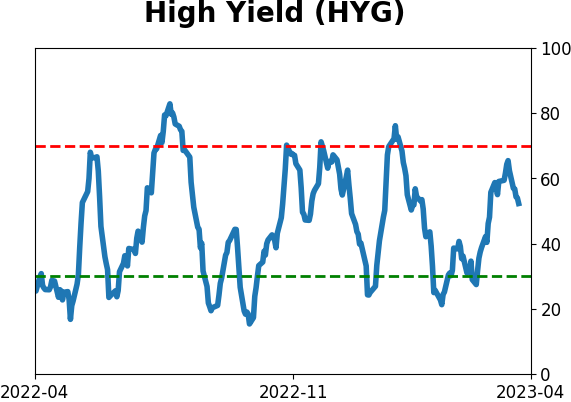
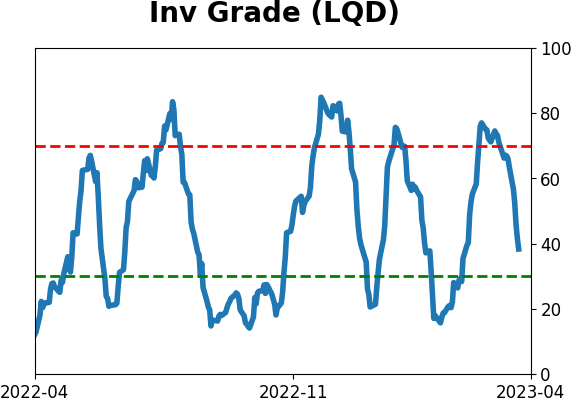
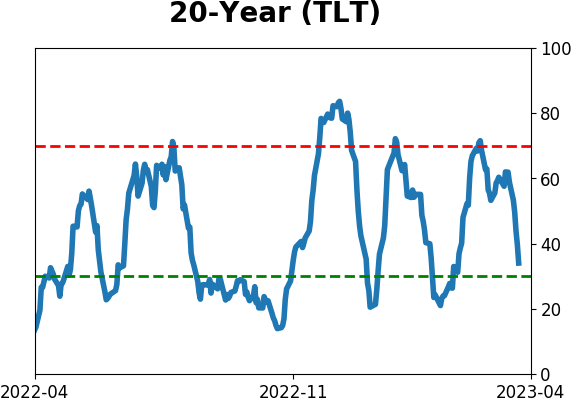
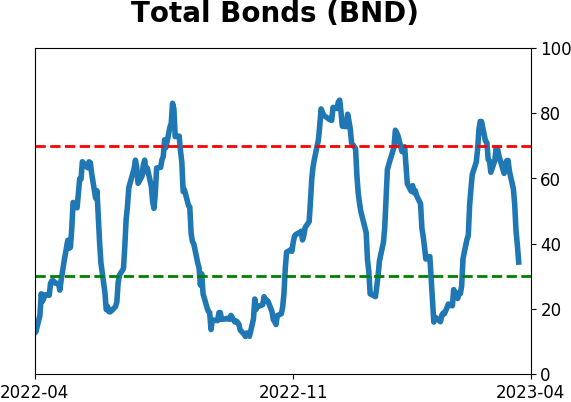
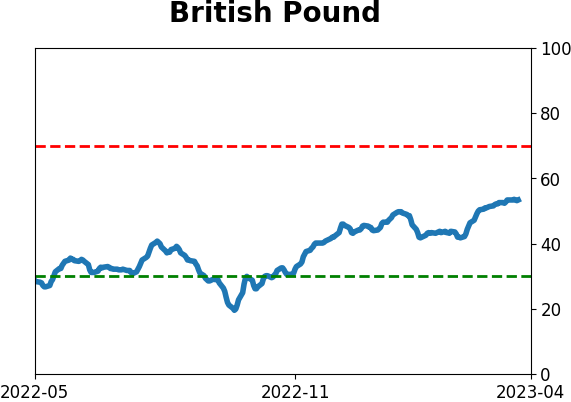
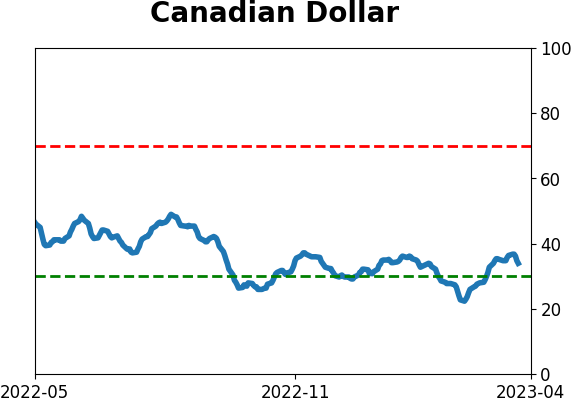
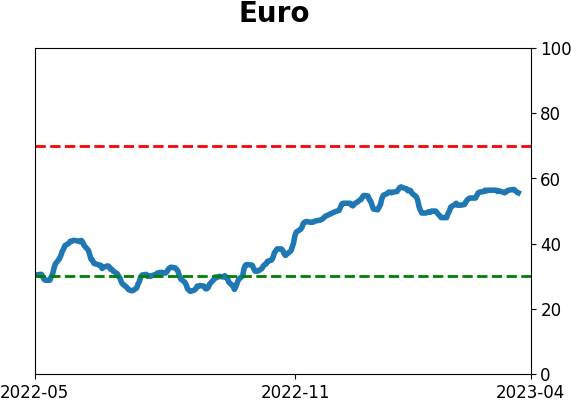
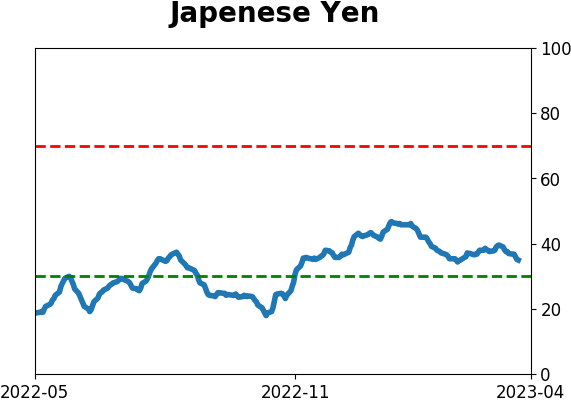
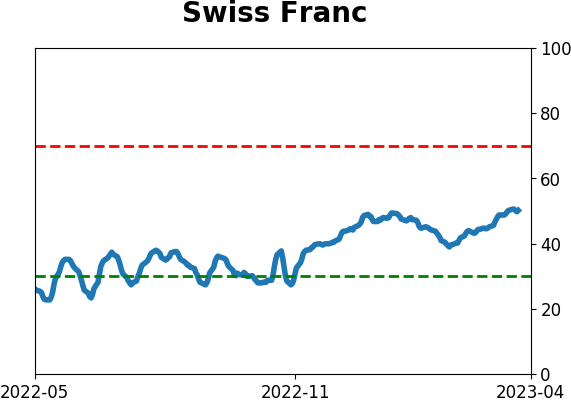
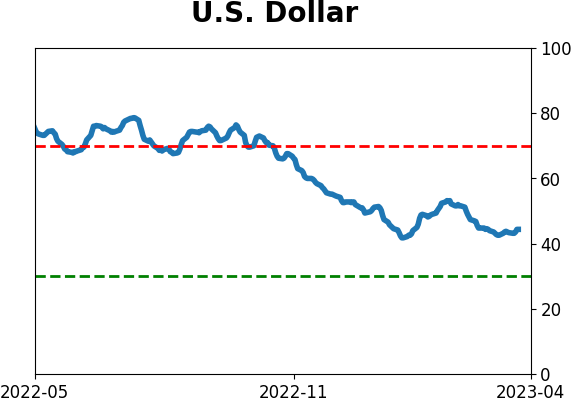
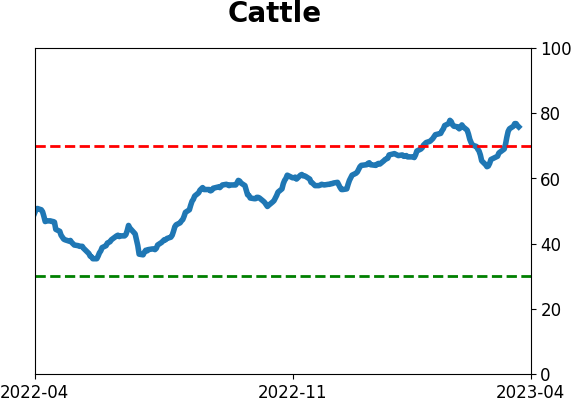
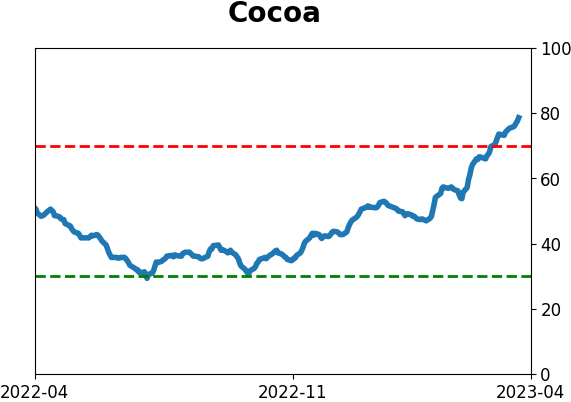
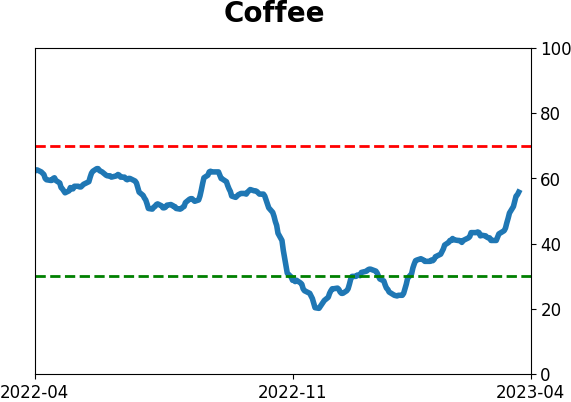
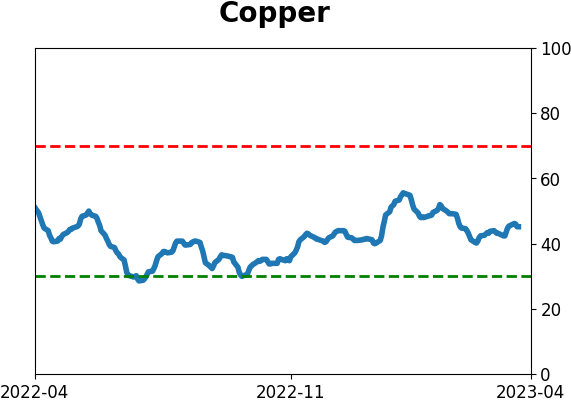
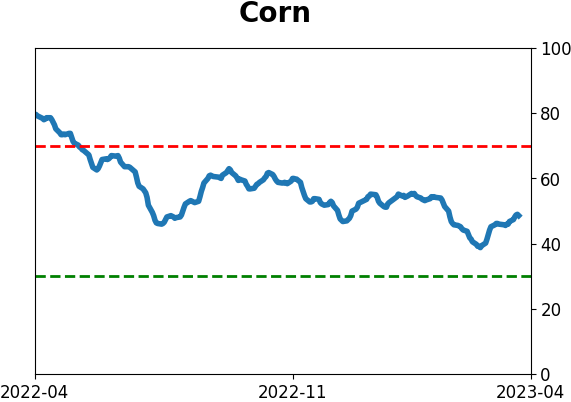
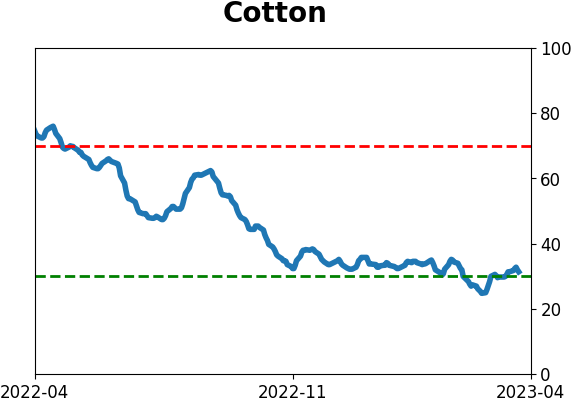
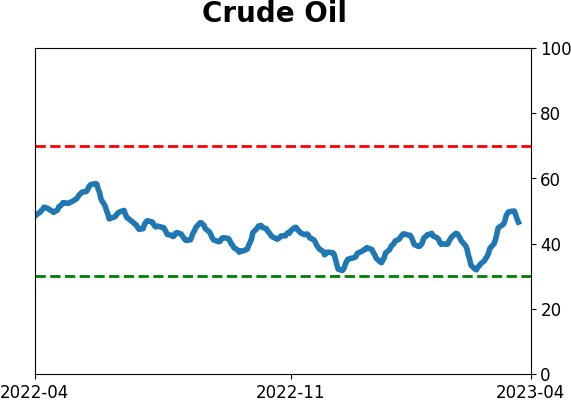
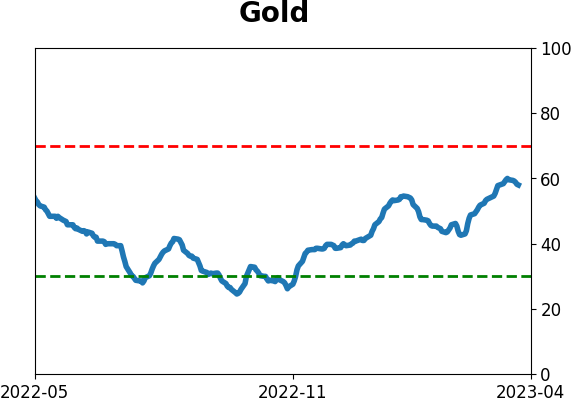
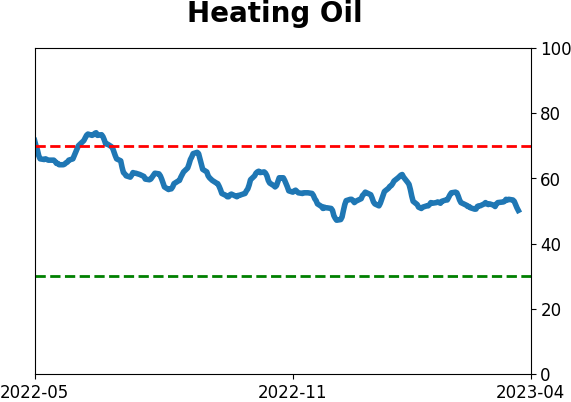
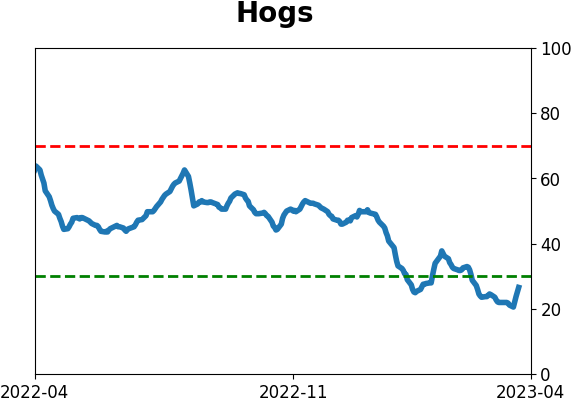
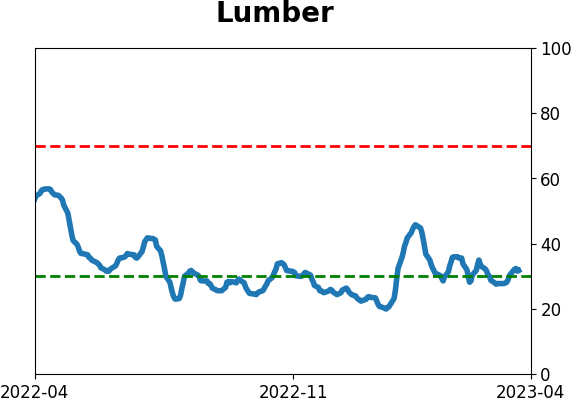
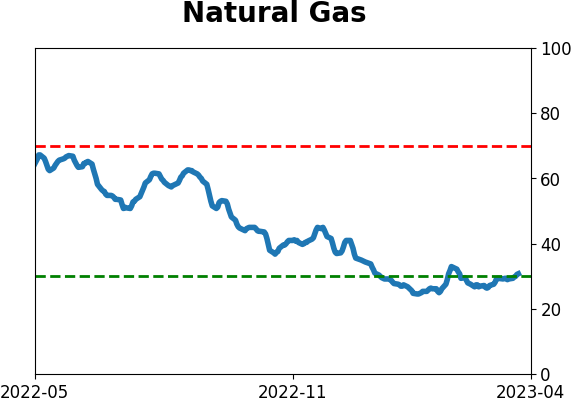
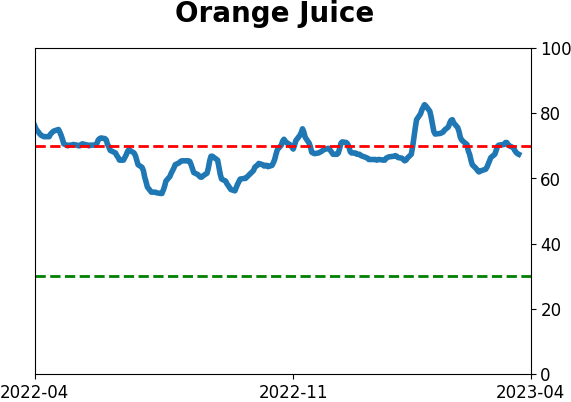
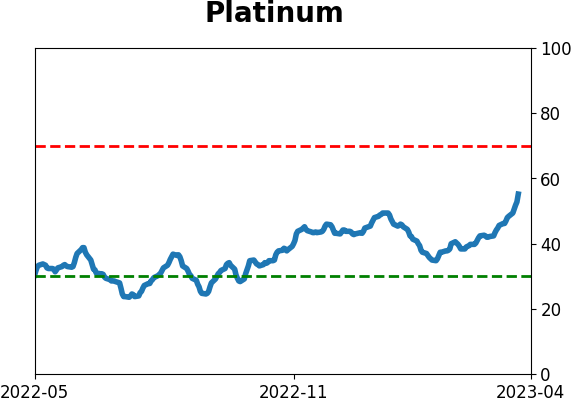
Optimism Index Thumbnails
|
|
|
|
|
|
|
|
|
|
|
|
|
|
|
|
|
|
|
|
|