Headlines
|
|
The first sign of an oversold condition :
The percentage of S&P 500 stocks reaching an oversold status has surged to the highest level since the fall of 2022, triggering an alert for a component in the TCTM Composite Washout Model. Similar oversold conditions suggest the upward trajectory in the S&P 500 will resume.
|
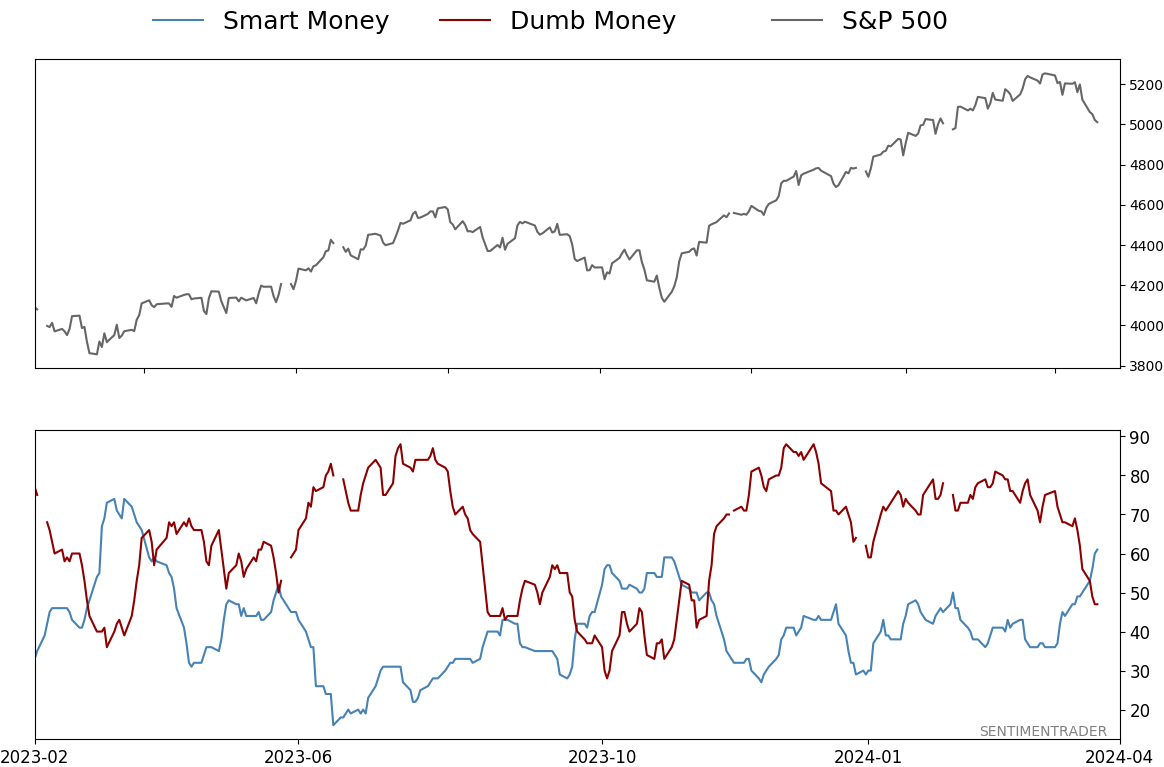
Smart / Dumb Money Confidence
|
Smart Money Confidence: 61%
Dumb Money Confidence: 47%
|
|
Risk Levels
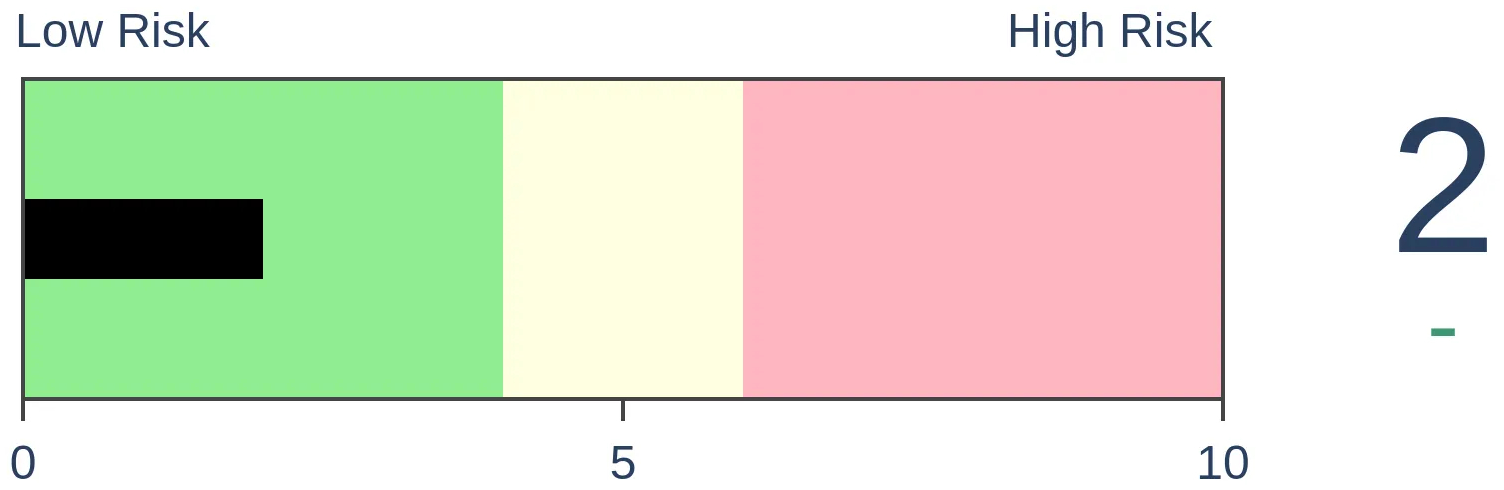
Stocks Short-Term
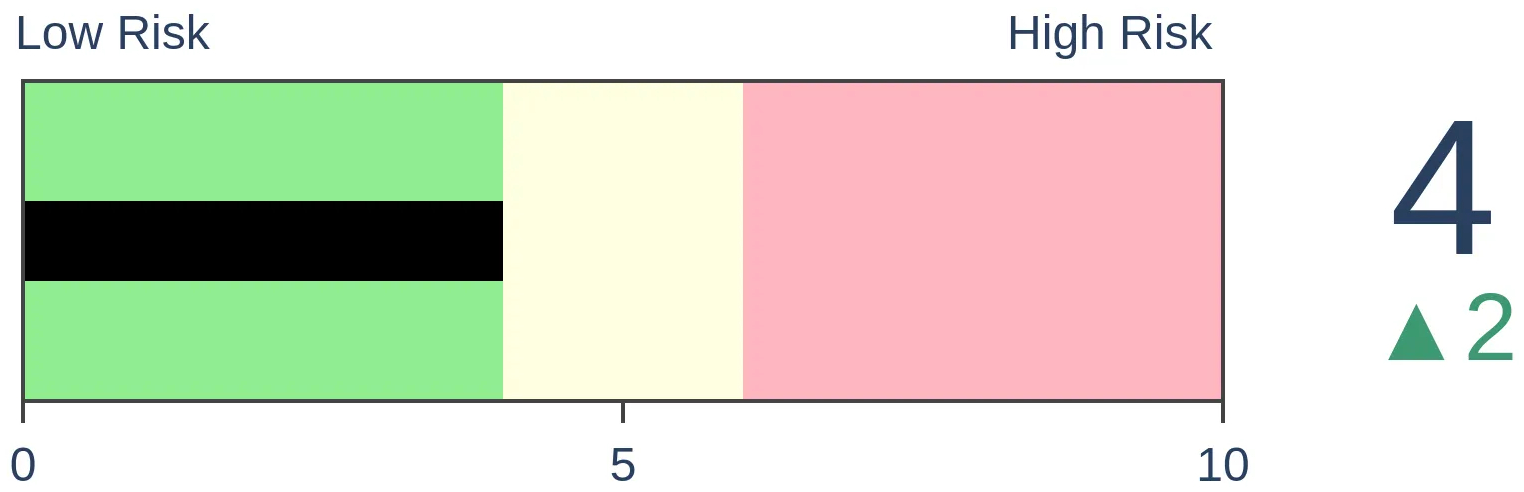
|
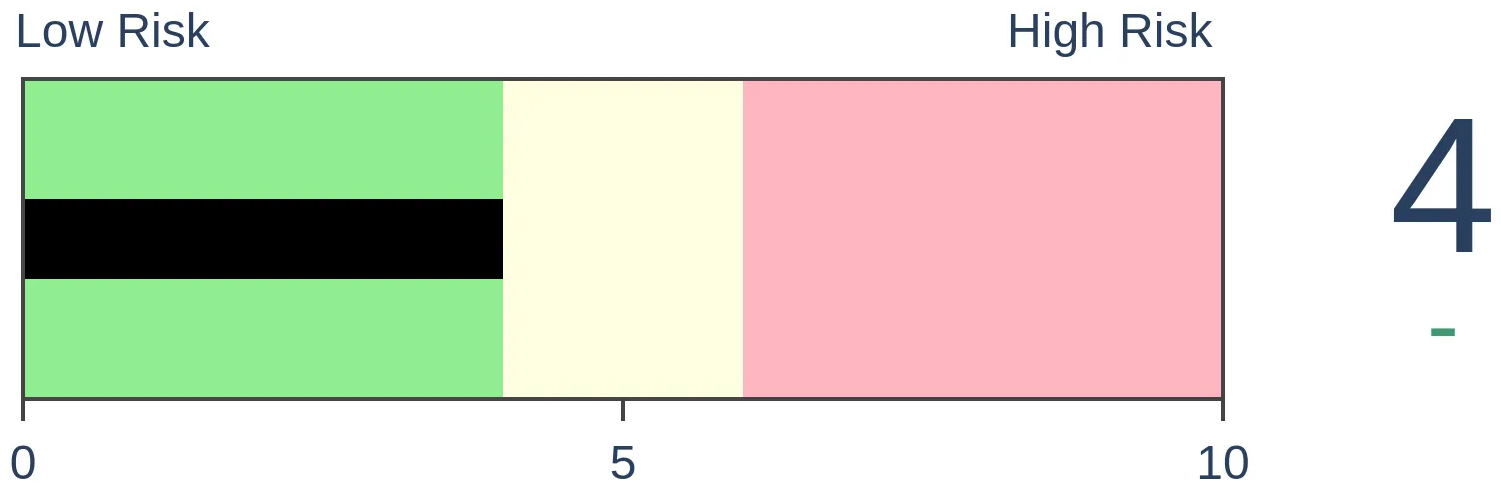
Stocks Medium-Term

|
|
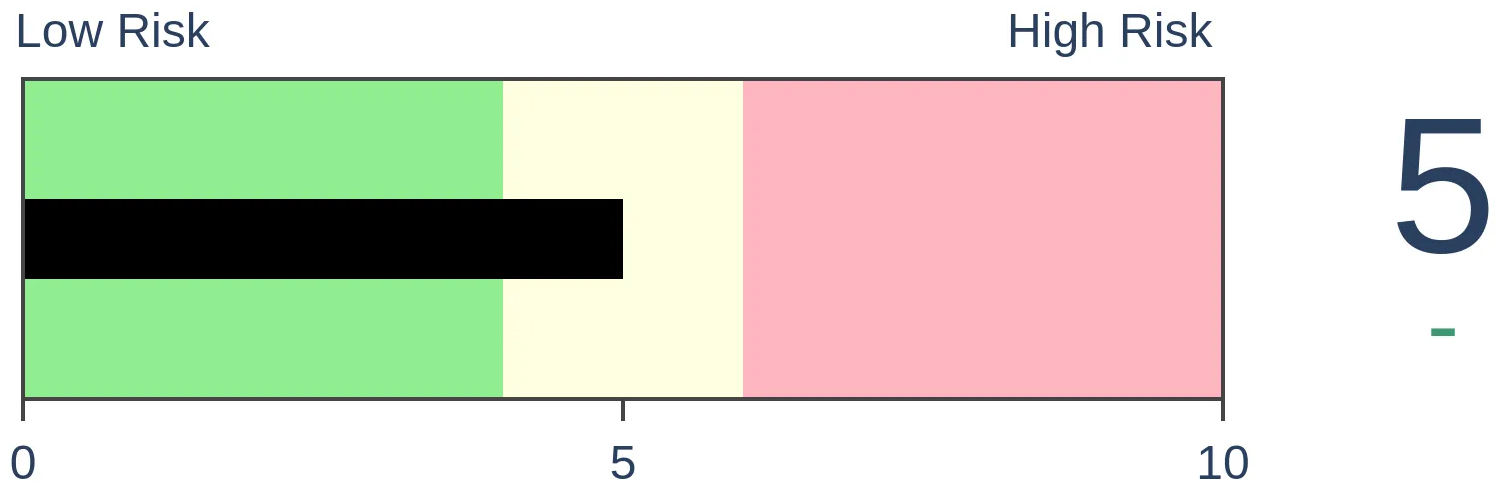
Bonds
|
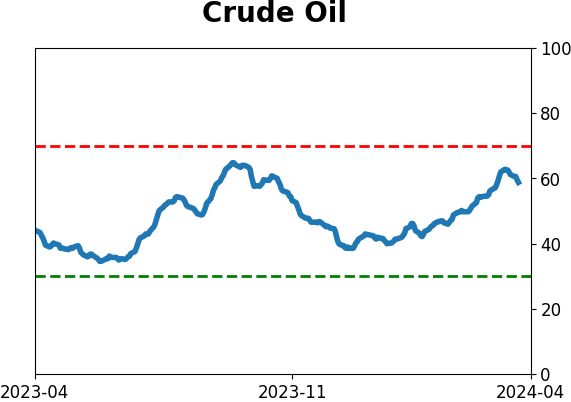
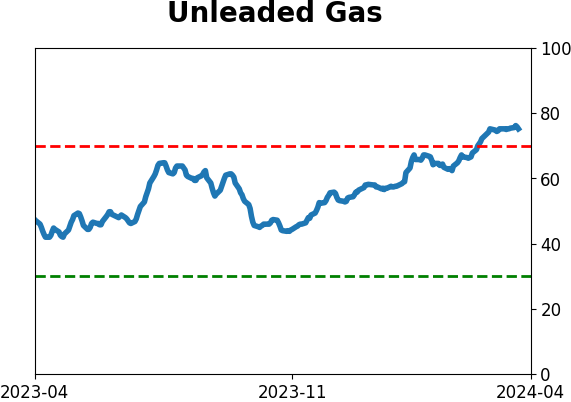
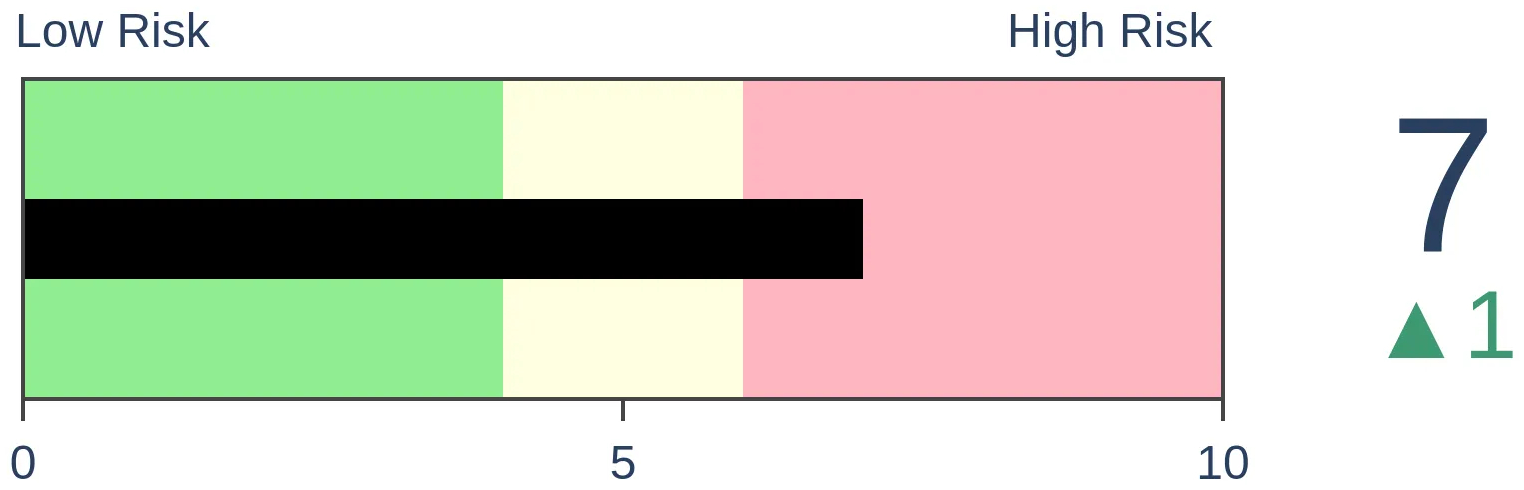
Crude Oil
|
|
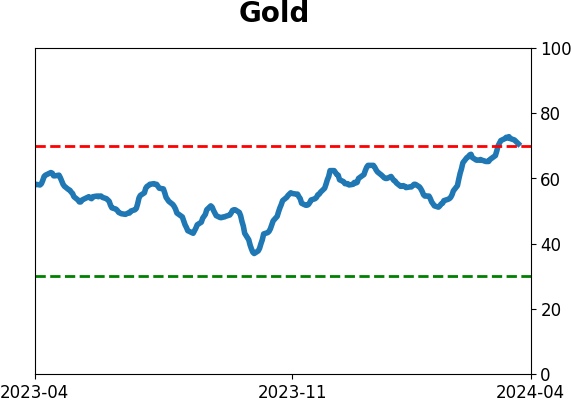
Gold
|
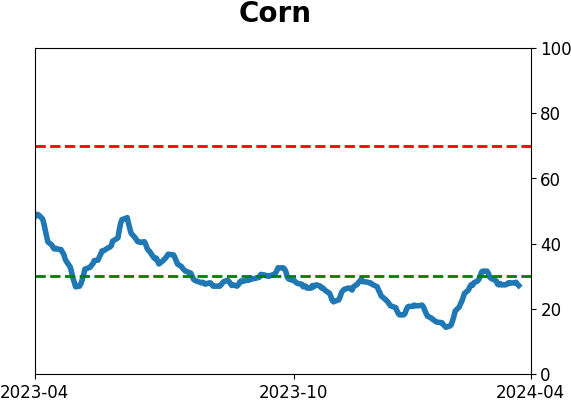
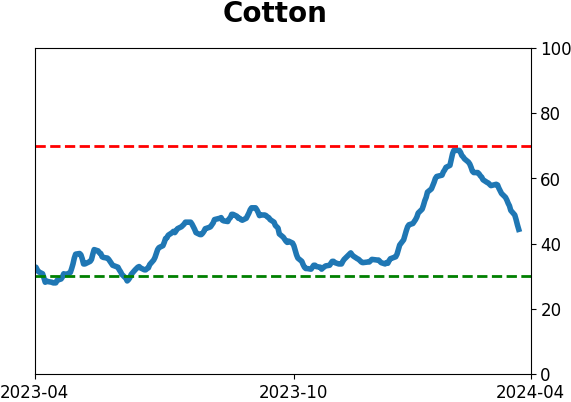
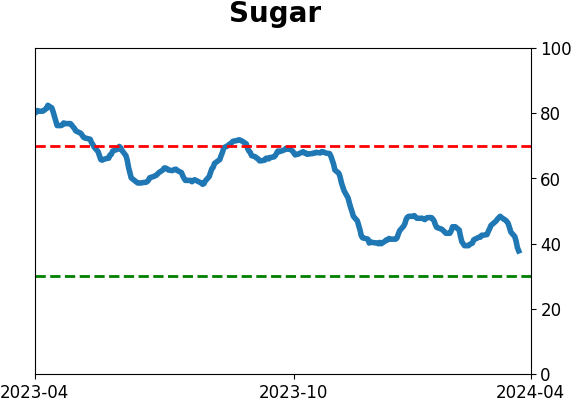
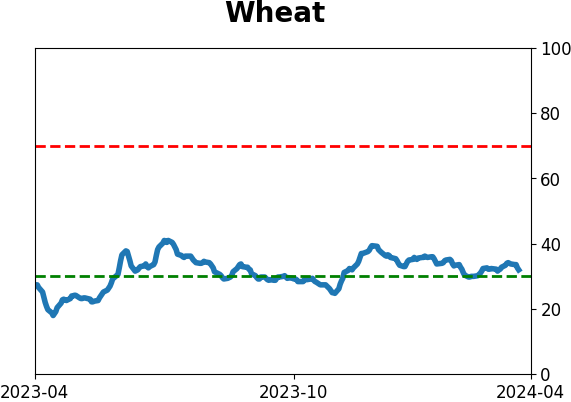
Agriculture
|
|
Research
By Dean Christians
BOTTOM LINE
The percentage of S&P 500 stocks reaching an oversold status has surged to the highest level since the fall of 2022, triggering an alert for a component in the TCTM Composite Washout Model. Similar oversold conditions suggest the upward trajectory in the S&P 500 will resume.
FORECAST / TIMEFRAME
None
|
Key points:
- The percentage of S&P 500 stocks reaching an oversold status increased above a washout threshold
- Similar oversold conditions preceded positive returns and favorable win rates for the S&P 500
- The TCTM Composite Washout Model signal count increased to 10% with the new component alert
Should we buy the dip on the first sign of an oversold condition
Purchasing stocks during a market downturn, especially when indexes are veering towards an oversold condition, can pose significant risks for an investor.
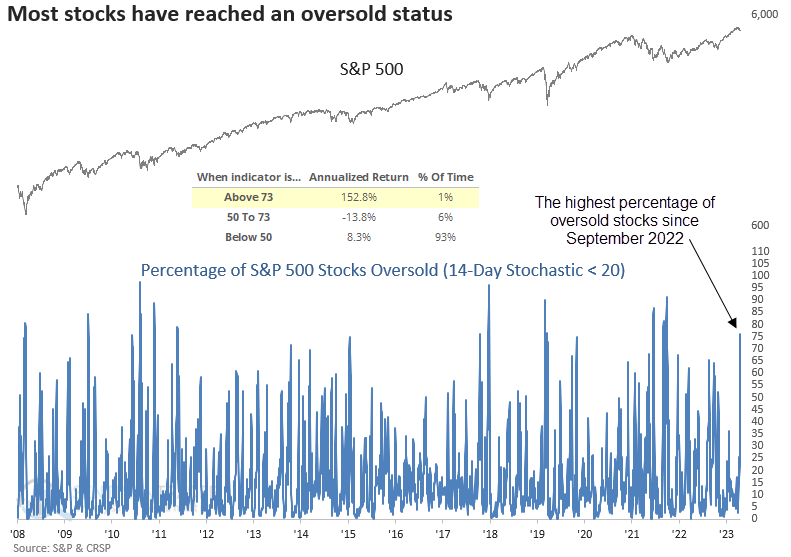
For example, when the percentage of S&P 500 stocks reaching an oversold status hovers between 50% and 73%, the S&P 500 produced a -13.8% annualized return since 1928. However, once the indicator increases to a level that suggests most stocks are oversold, the world's most benchmarked exhibits outstanding annual returns of 152%.
On Tuesday, the percentage of S&P 500 stocks reaching an oversold status increased above 73%, triggering an alert for a TCTM Composite Washout Model component.
Similar oversold conditions preceded positive returns
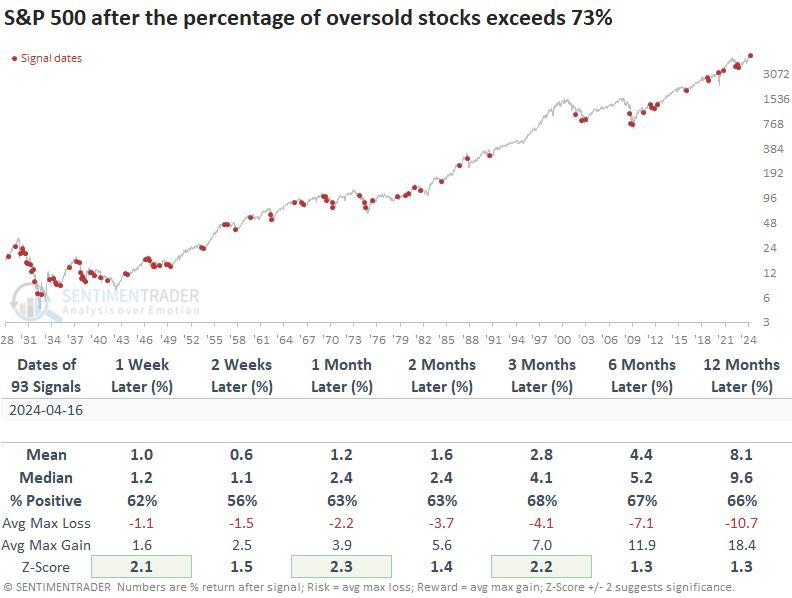
Since 1928, the percentage of S&P 500 stocks reaching an oversold status has generated a signal 93 other times. After similar alerts, the S&P 500 displayed an upward trajectory, with several time frames performing better than random returns over the study period.
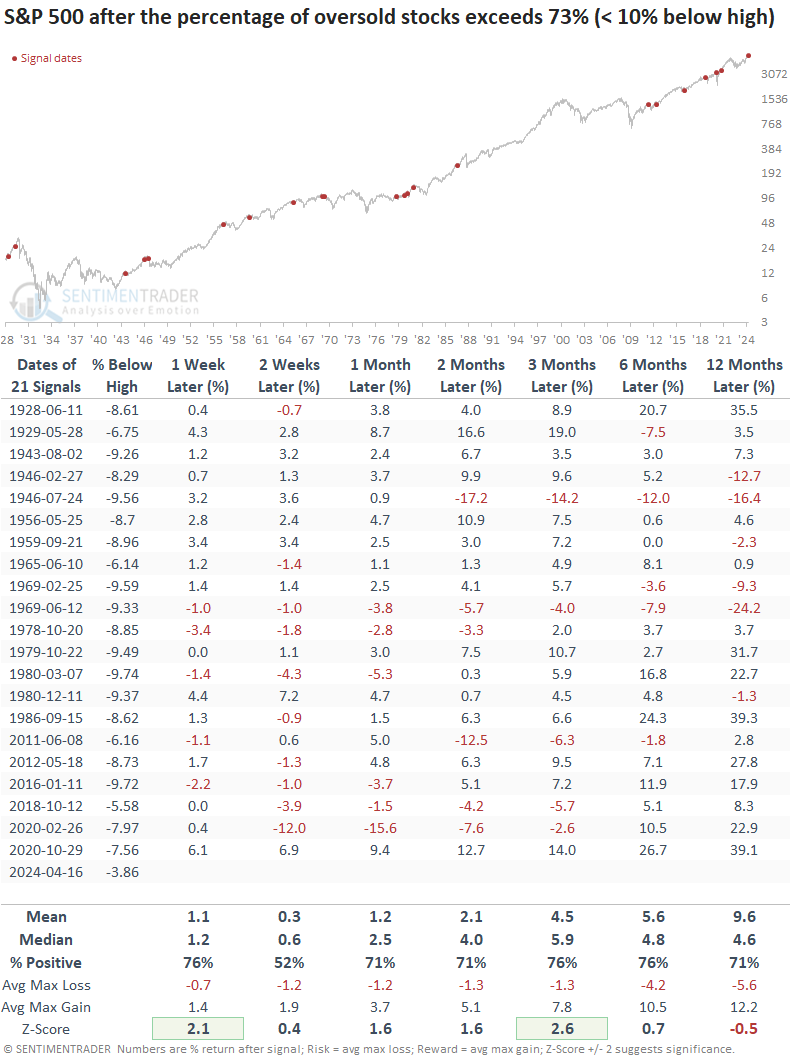
With the S&P 500 trading 3.86% below its recent high, this latest oversold signal represents the shallowest decline from its peak ever recorded.
Whenever oversold conditions emerged while the index remained within 10% of its peak, win rates improved significantly across most time frames, accompanied by marginally more favorable median returns in the subsequent three months.
TCTM Composite Washout Model
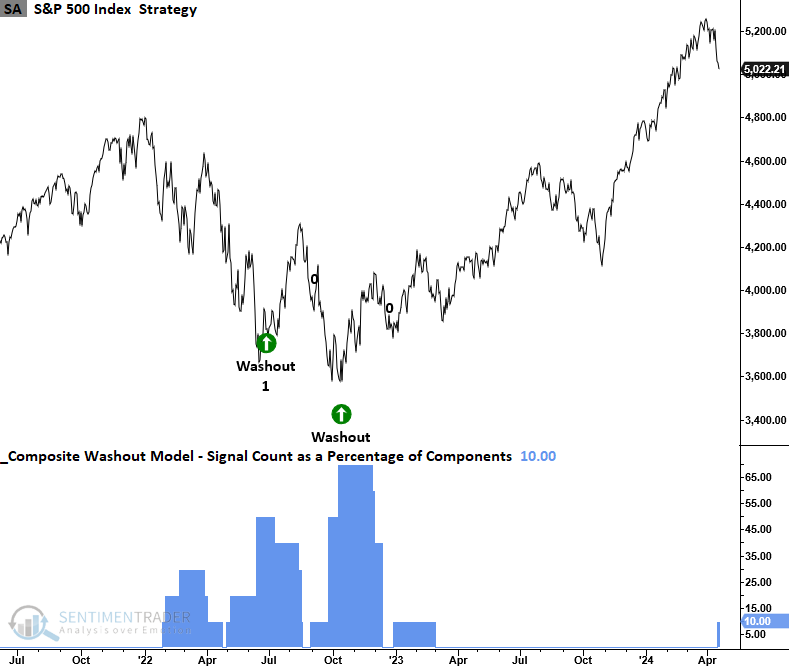
With a signal count of 10%, the Composite Washout Model remains well under the 50% threshold necessary to trigger a broad composite alert.
What the research tells us...
Following an exceptional rally since last fall, equity indexes are now undergoing a corrective phase, as is customary in bull markets. One of the components in the TCTM Composite Washout Model triggered an alert, suggesting stocks have reached an oversold condition. Similar precedents produced favorable returns and win rates for the S&P 500. With the new alert, the CWM signal count increased to 10%, well below the threshold for an alert.
Indicators at Extremes
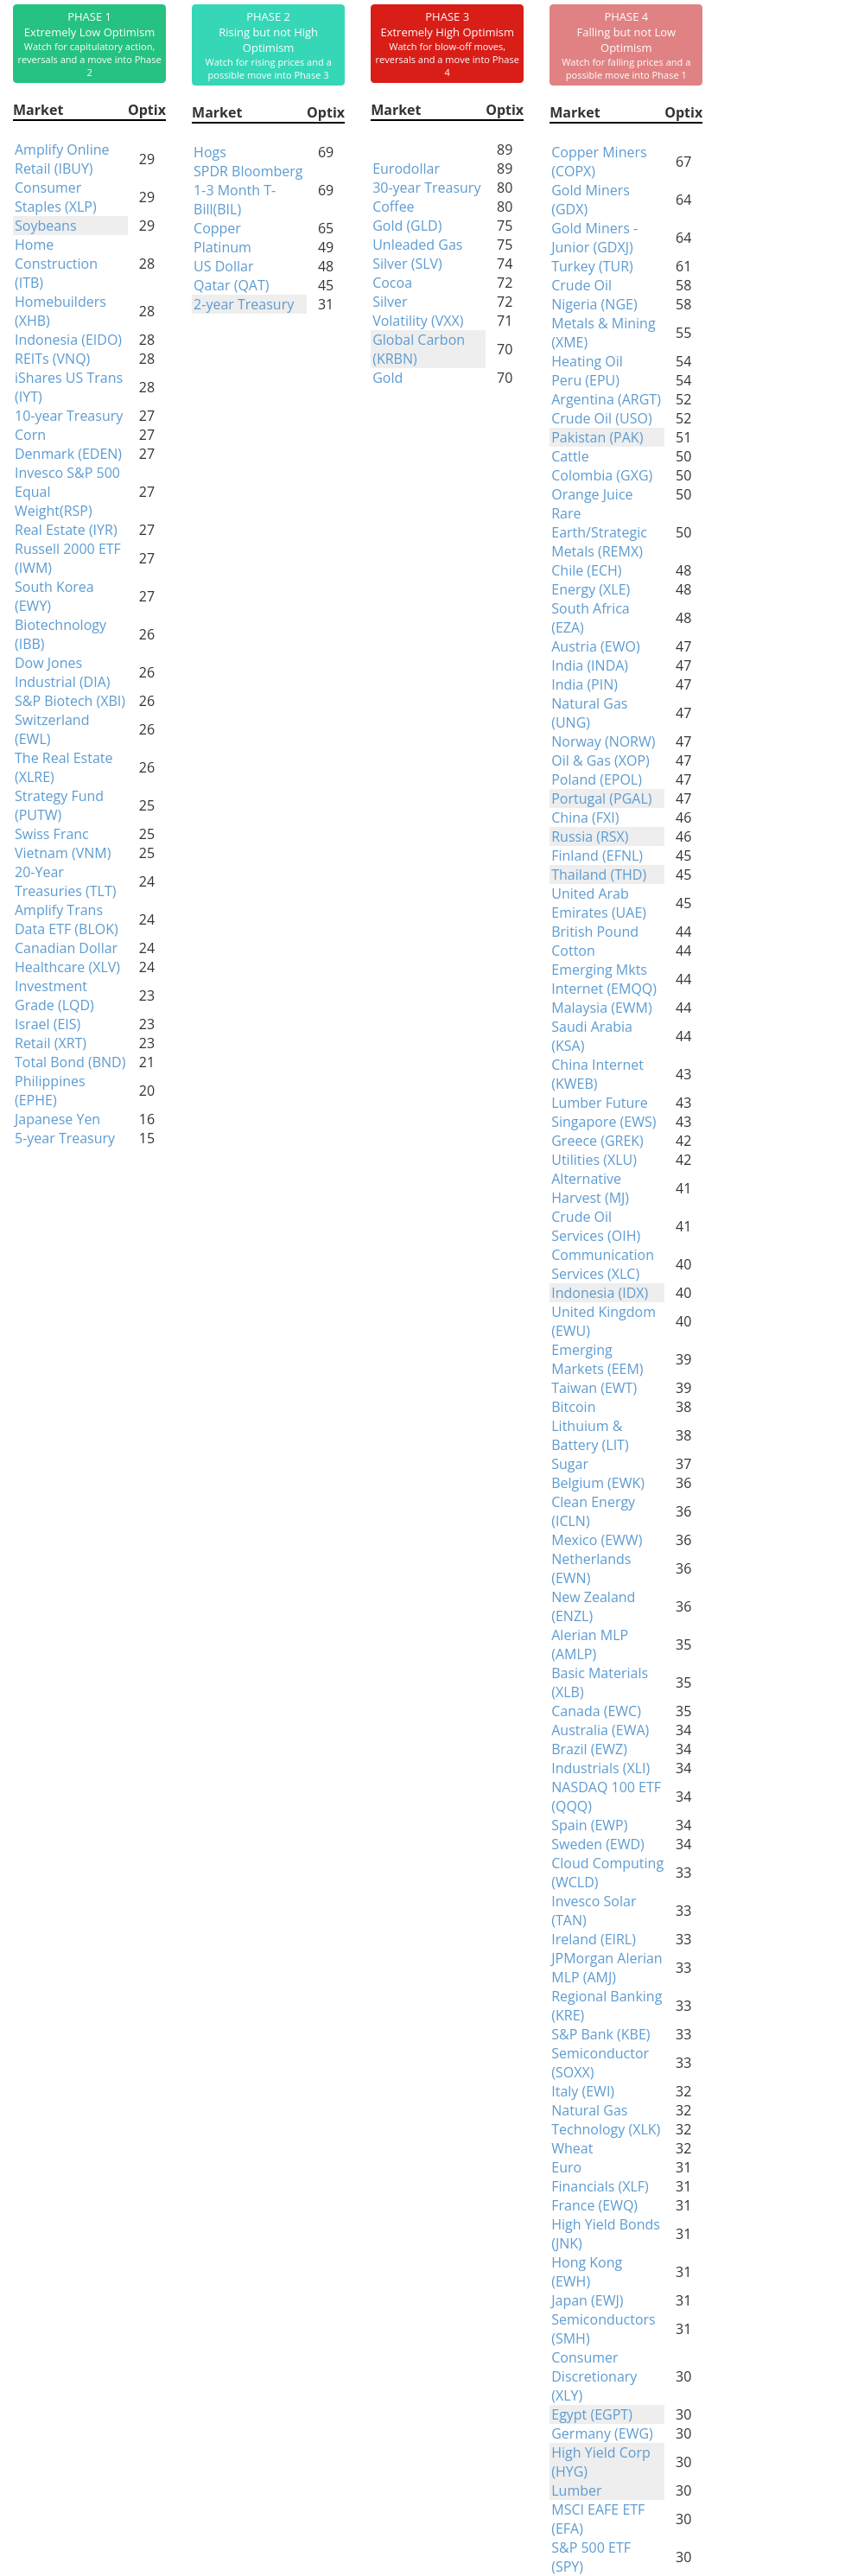
Phase Table
Ranks
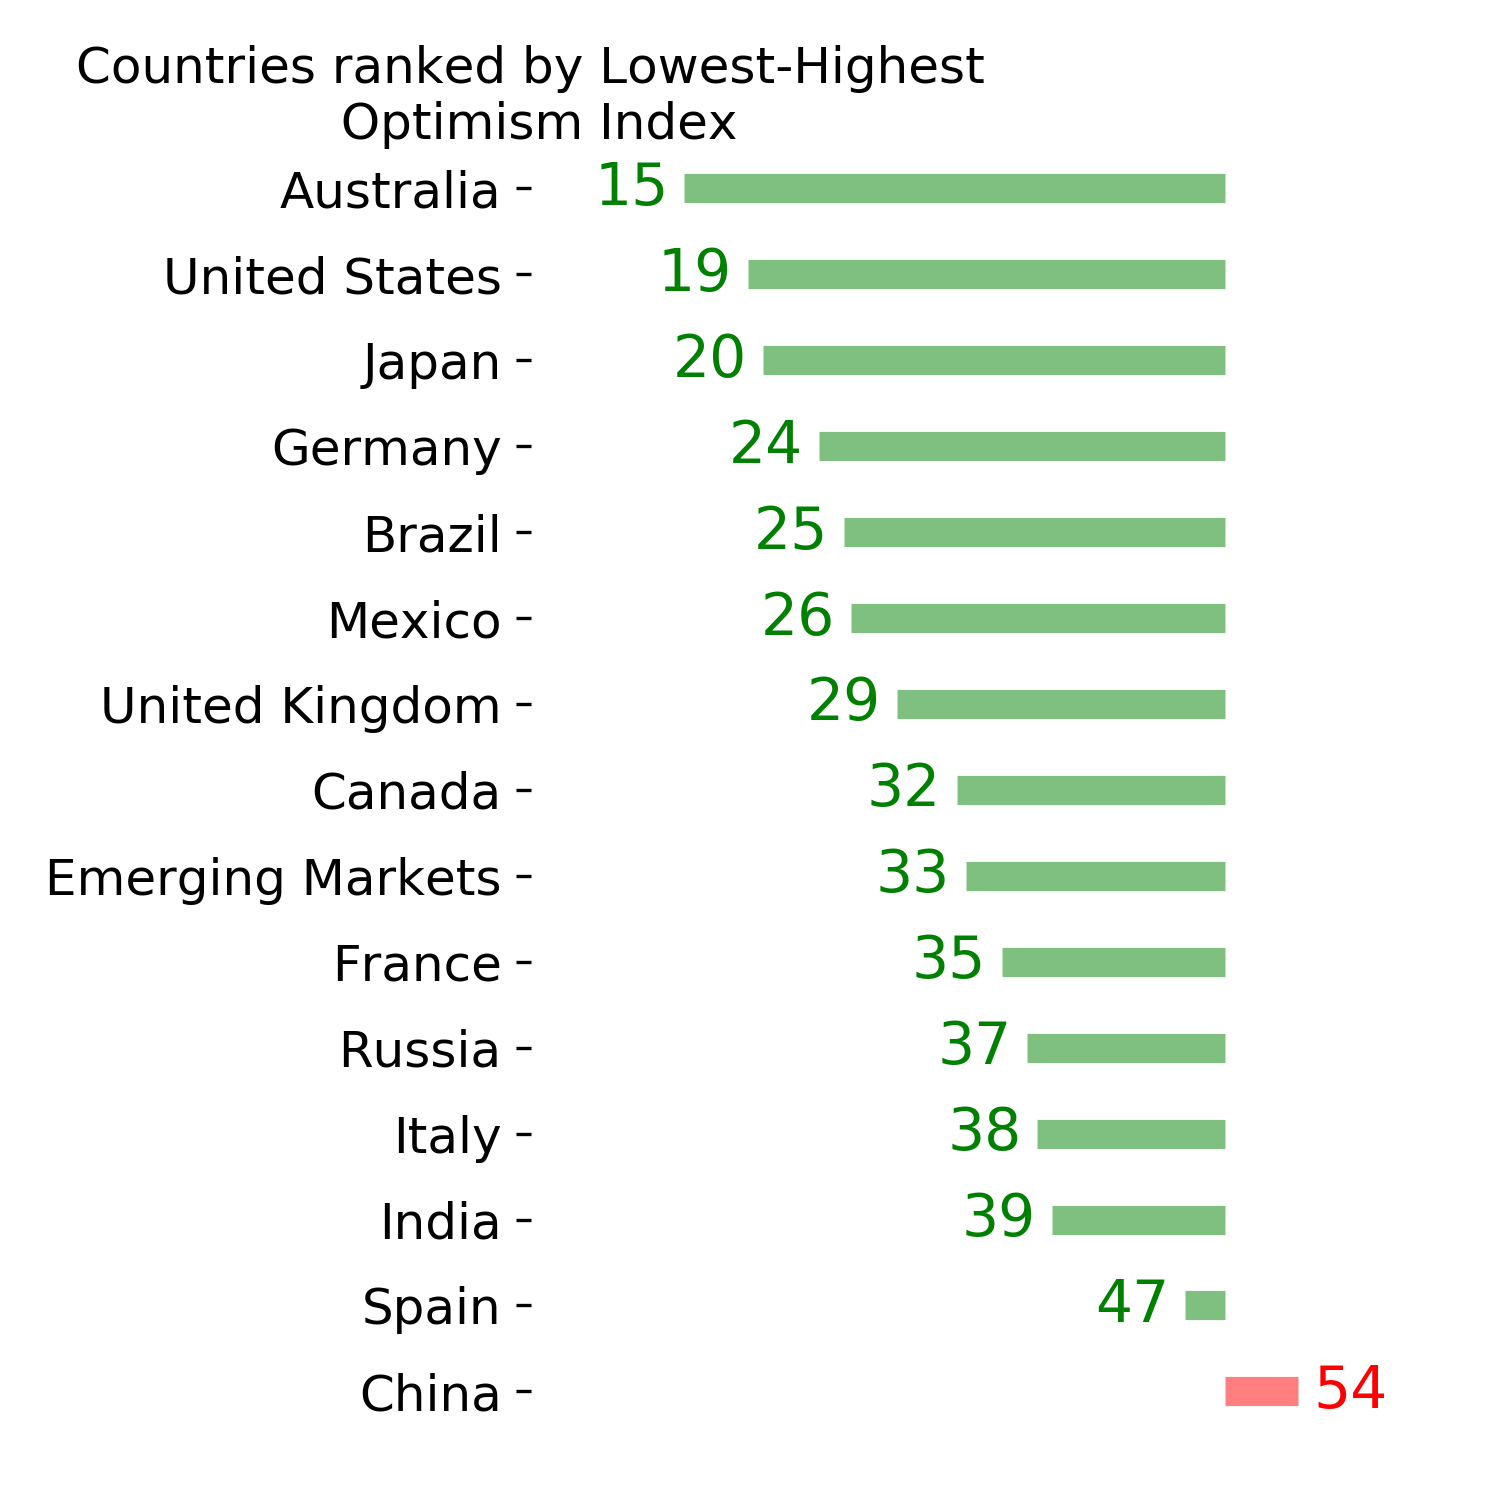
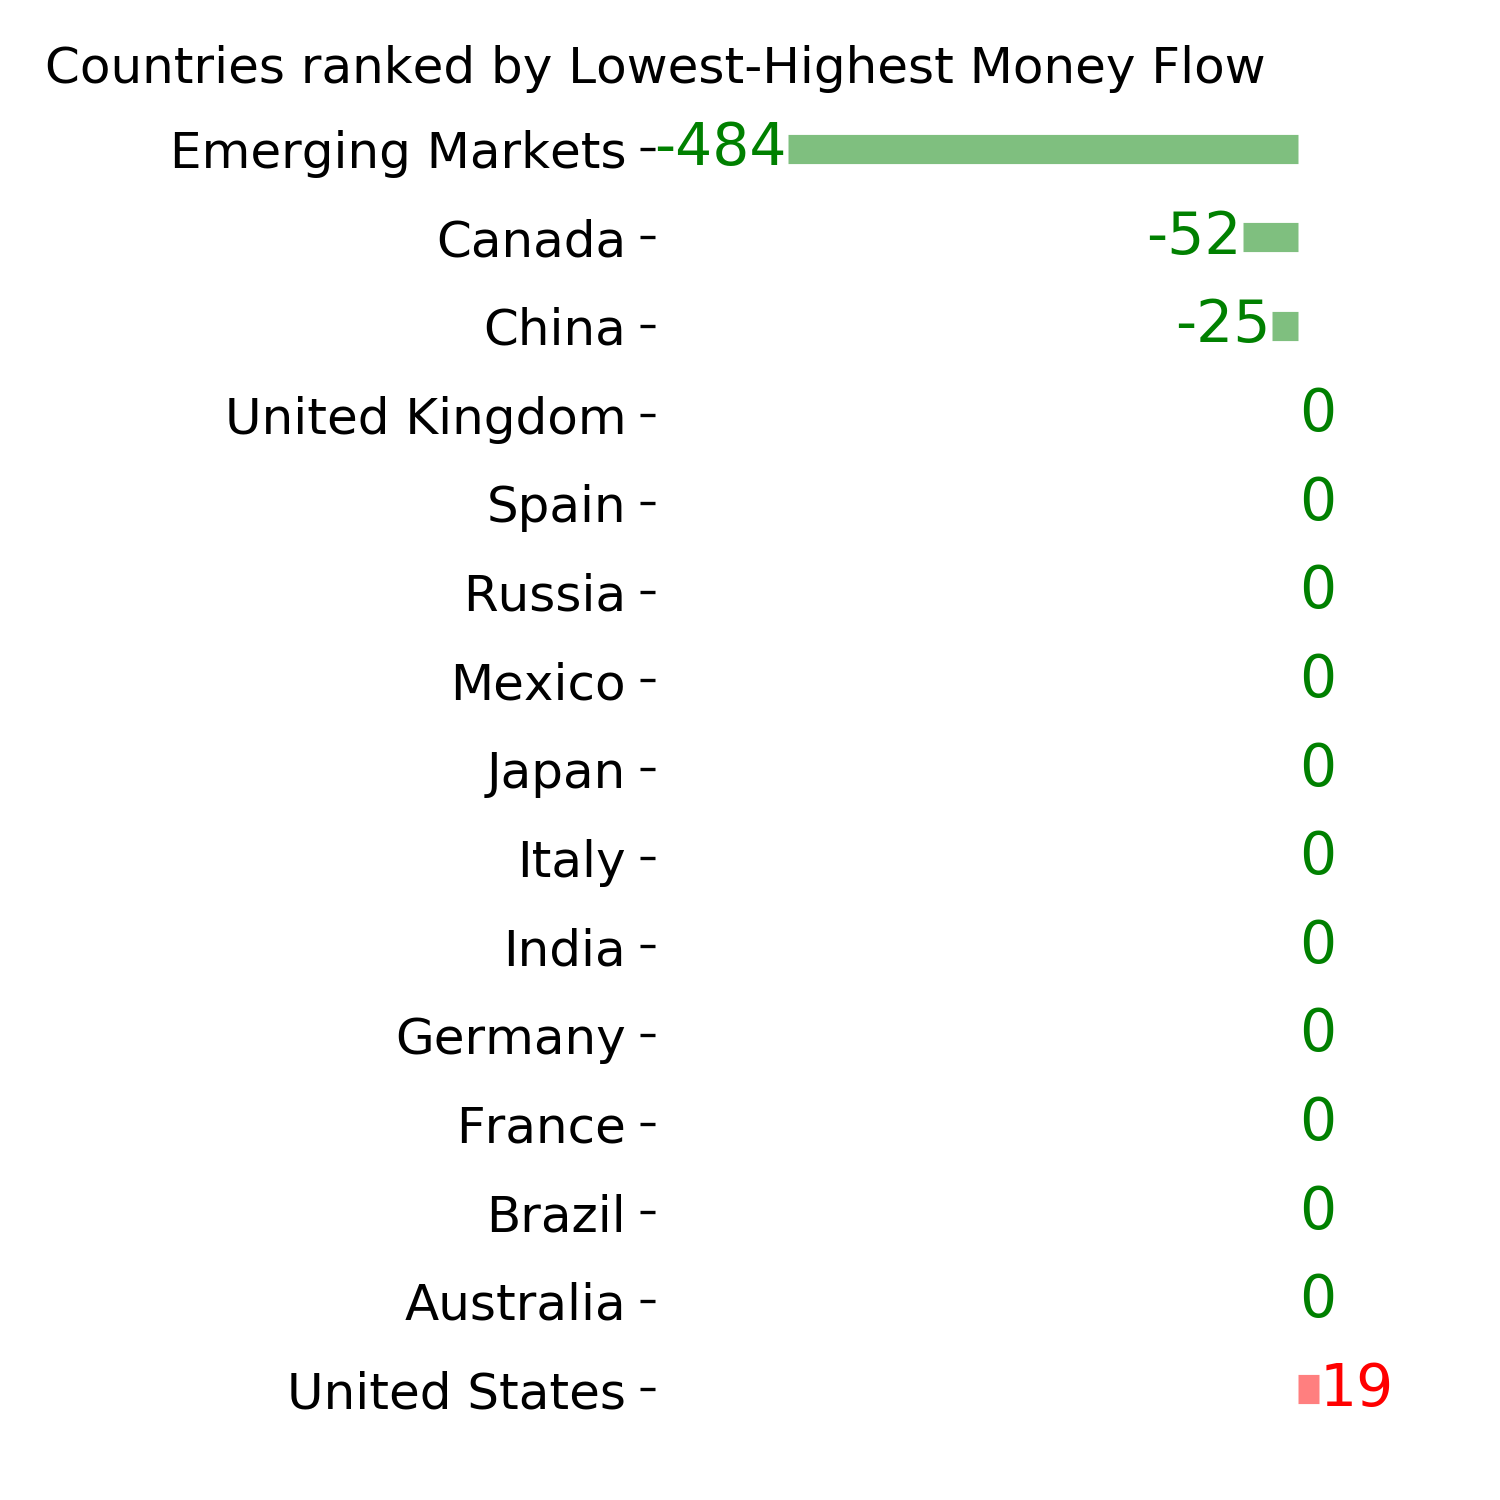
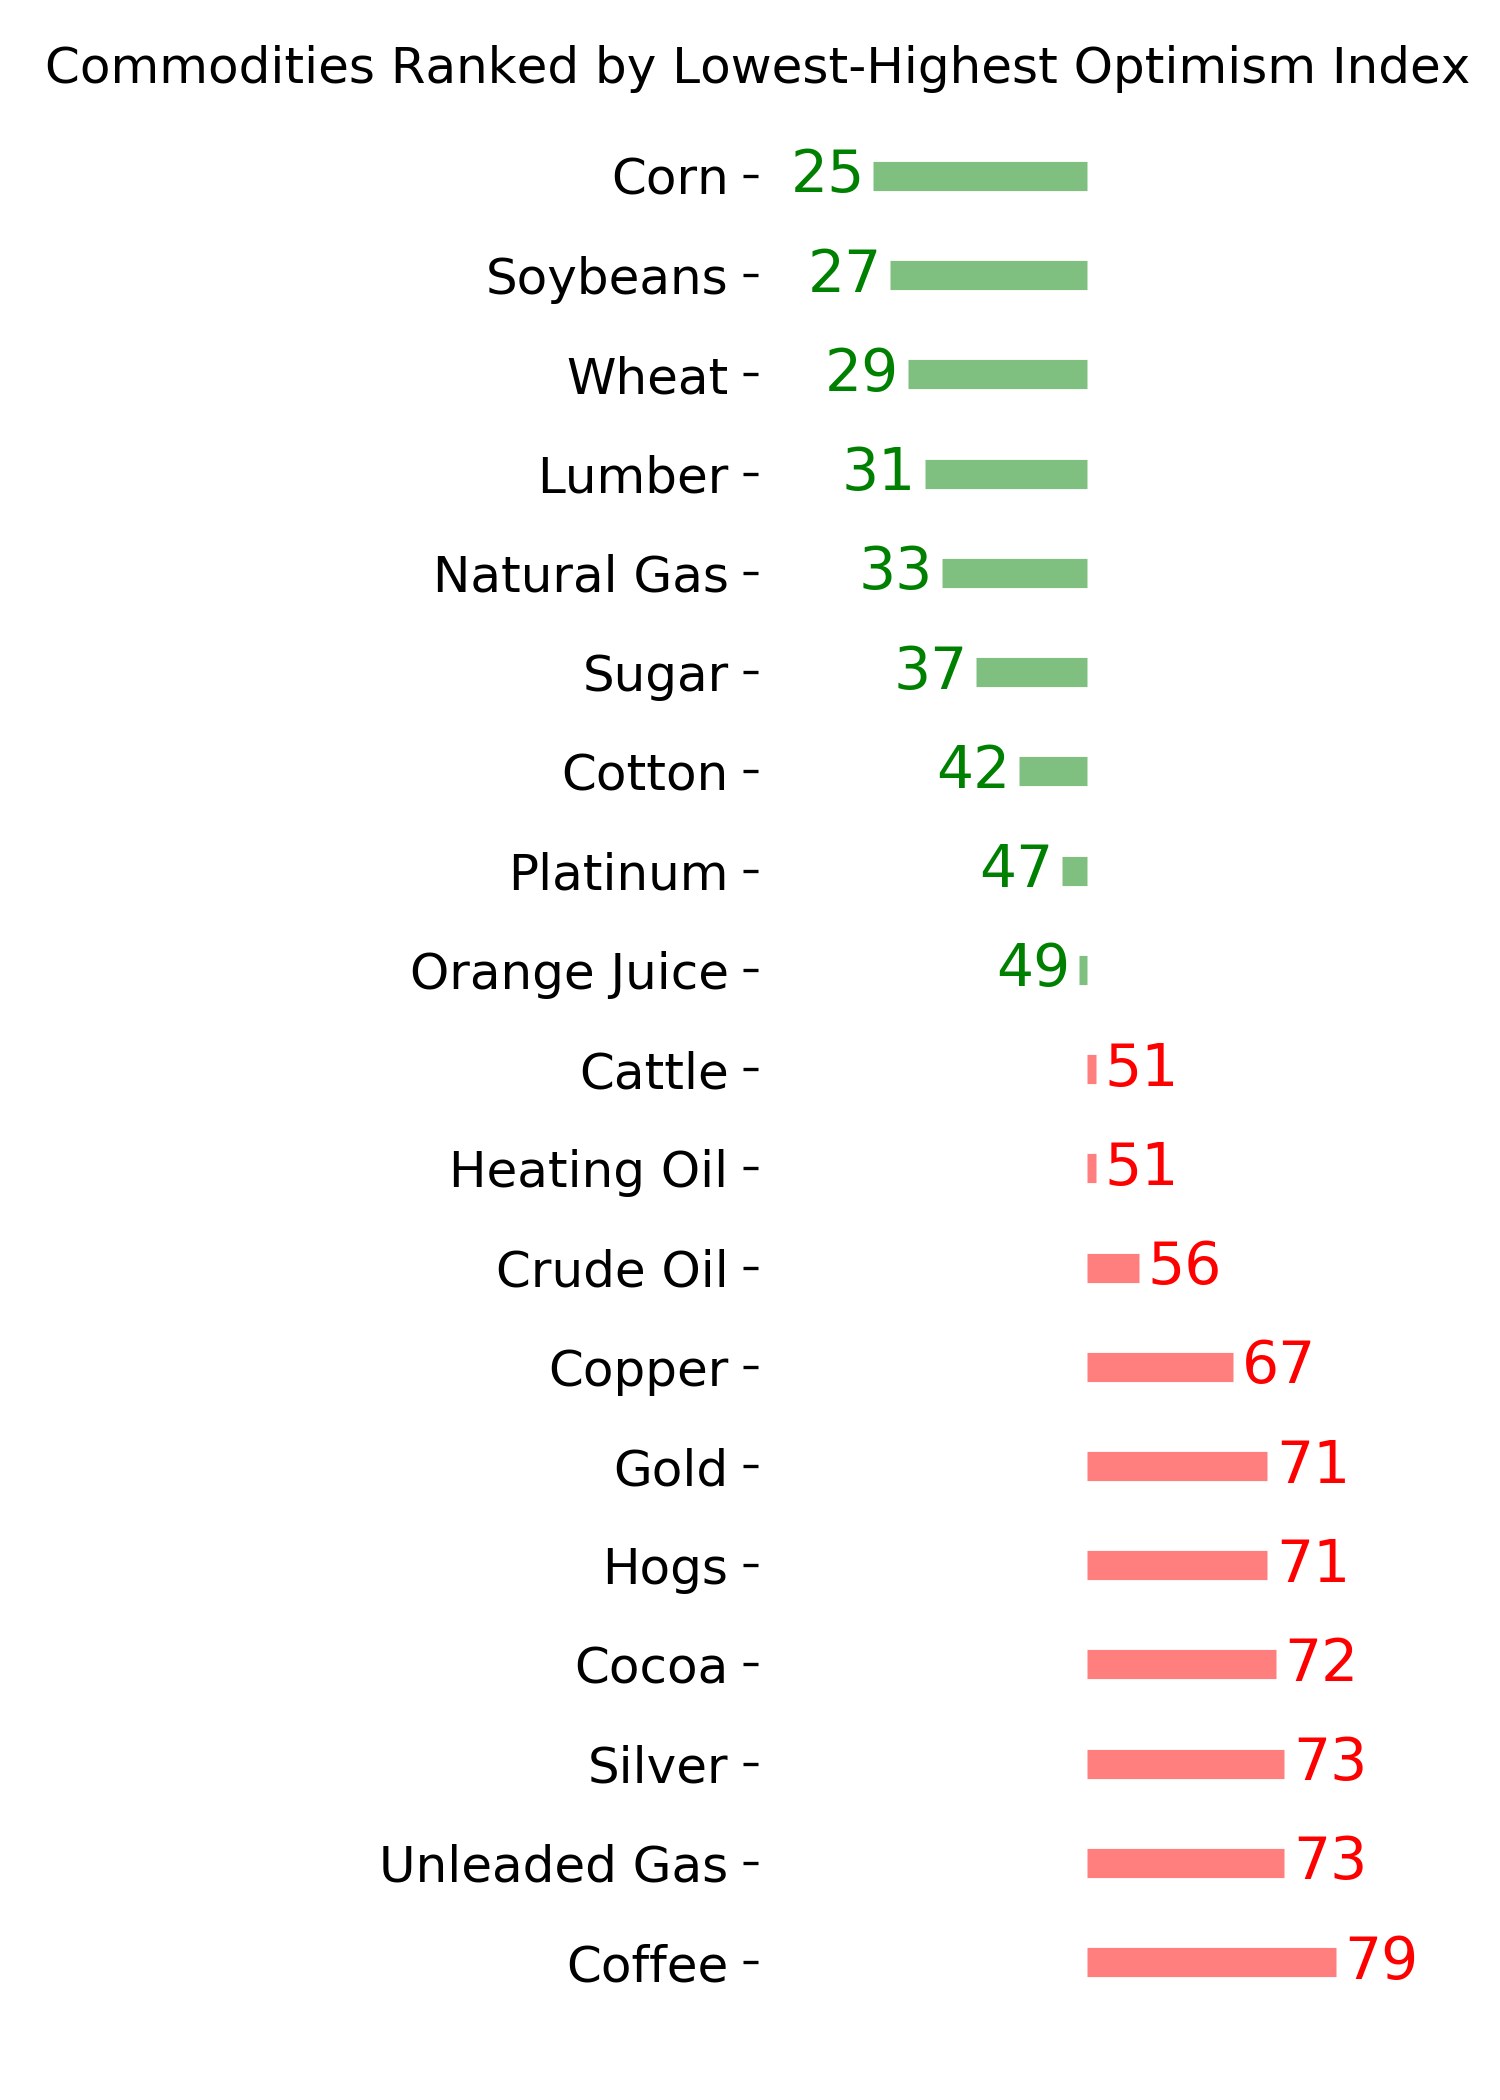
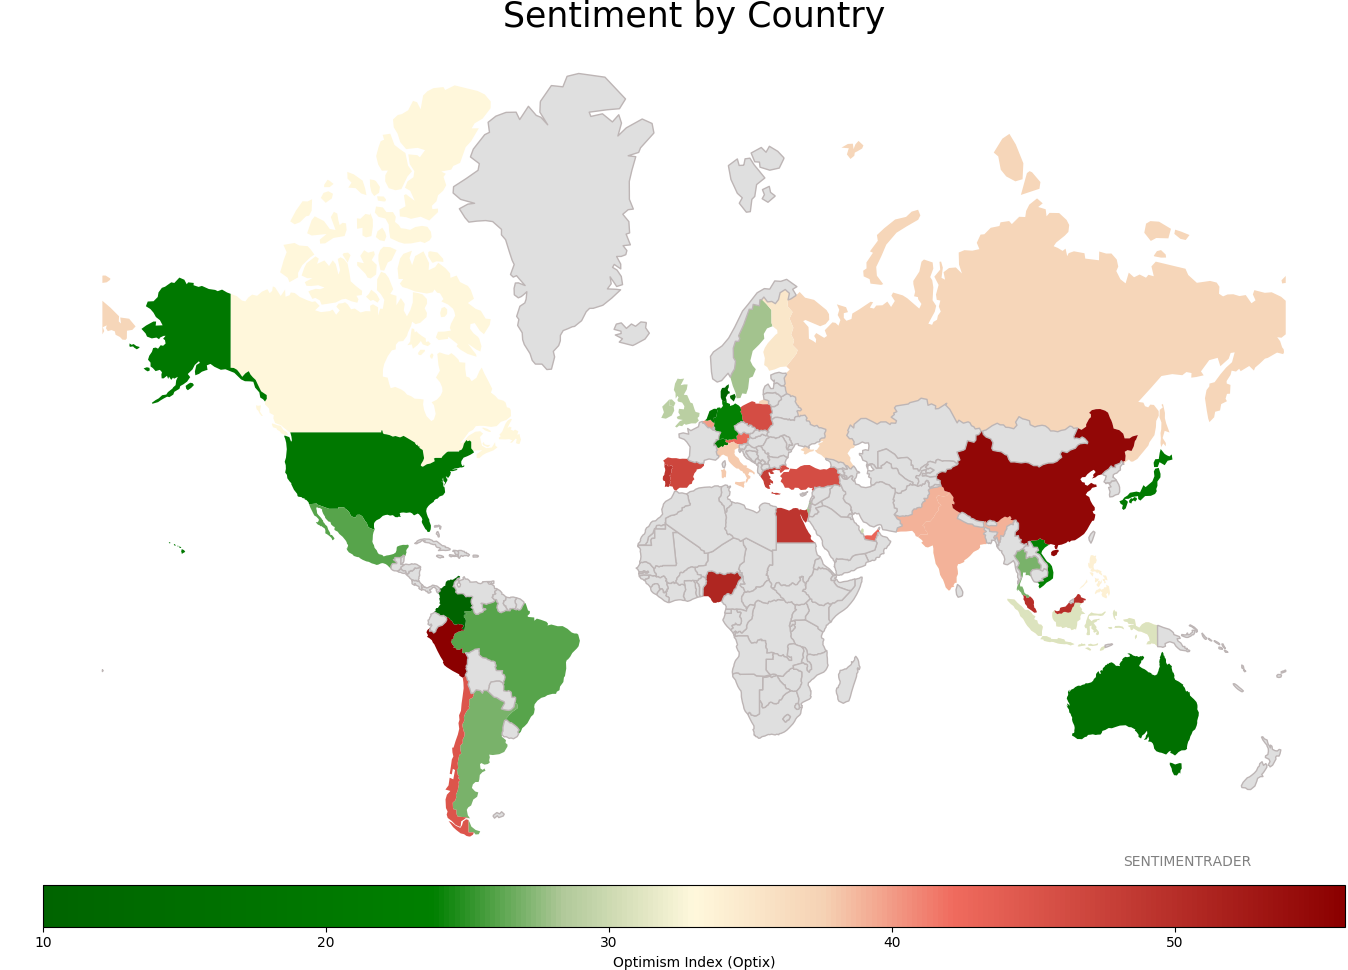
Sentiment Around The World
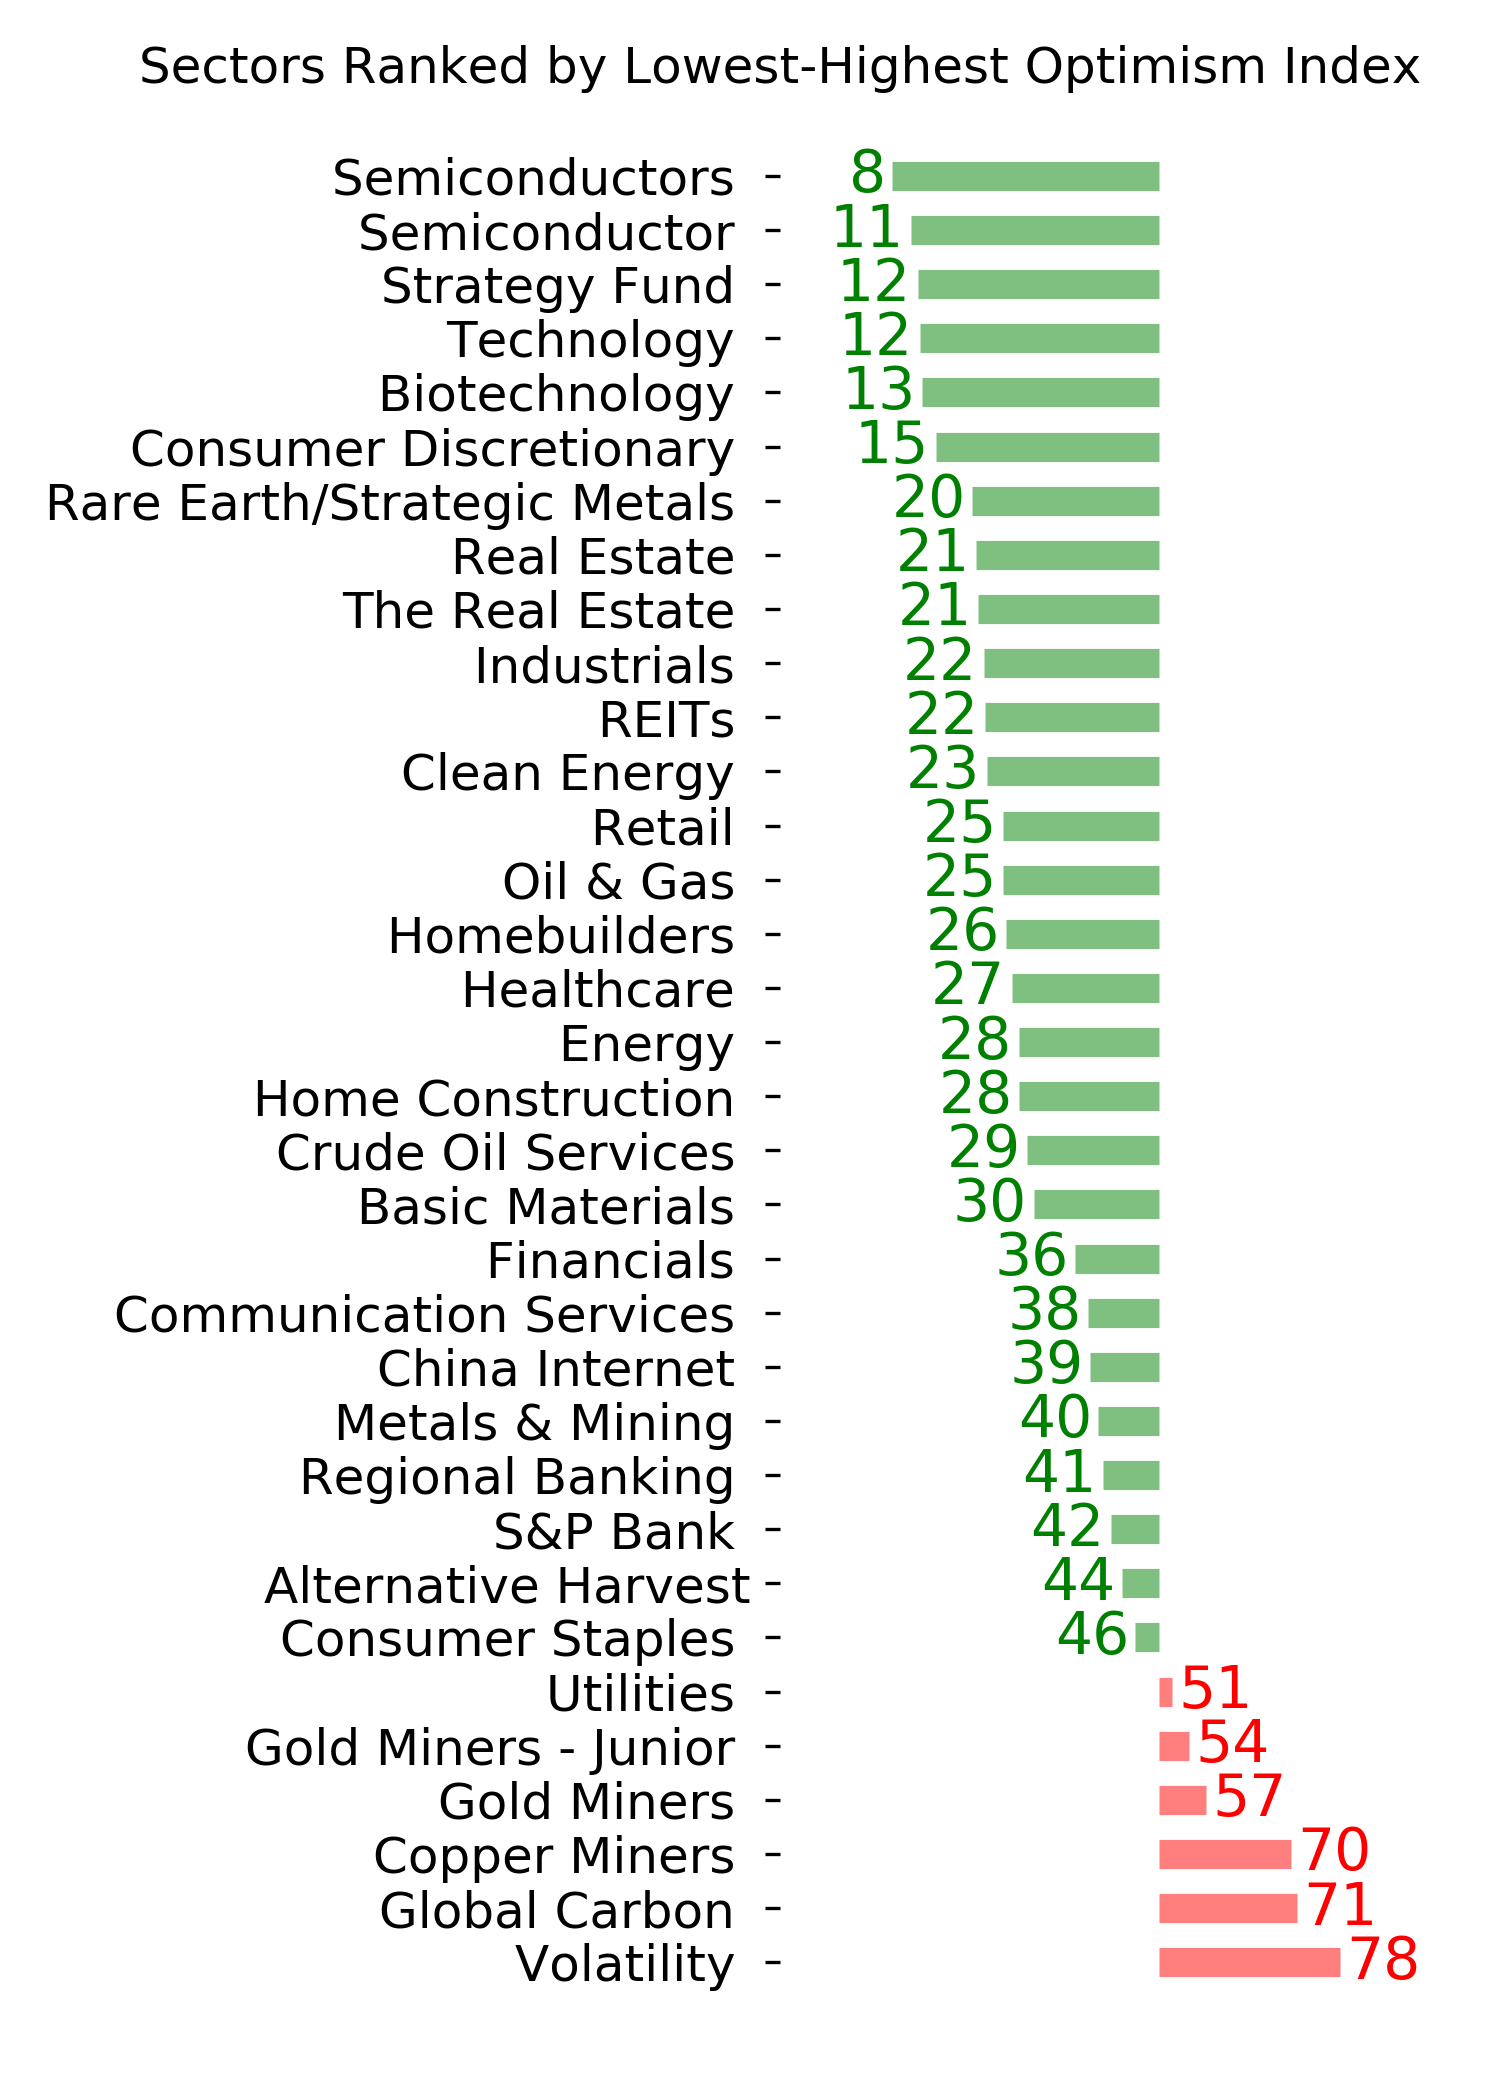
Optimism Index Thumbnails
|
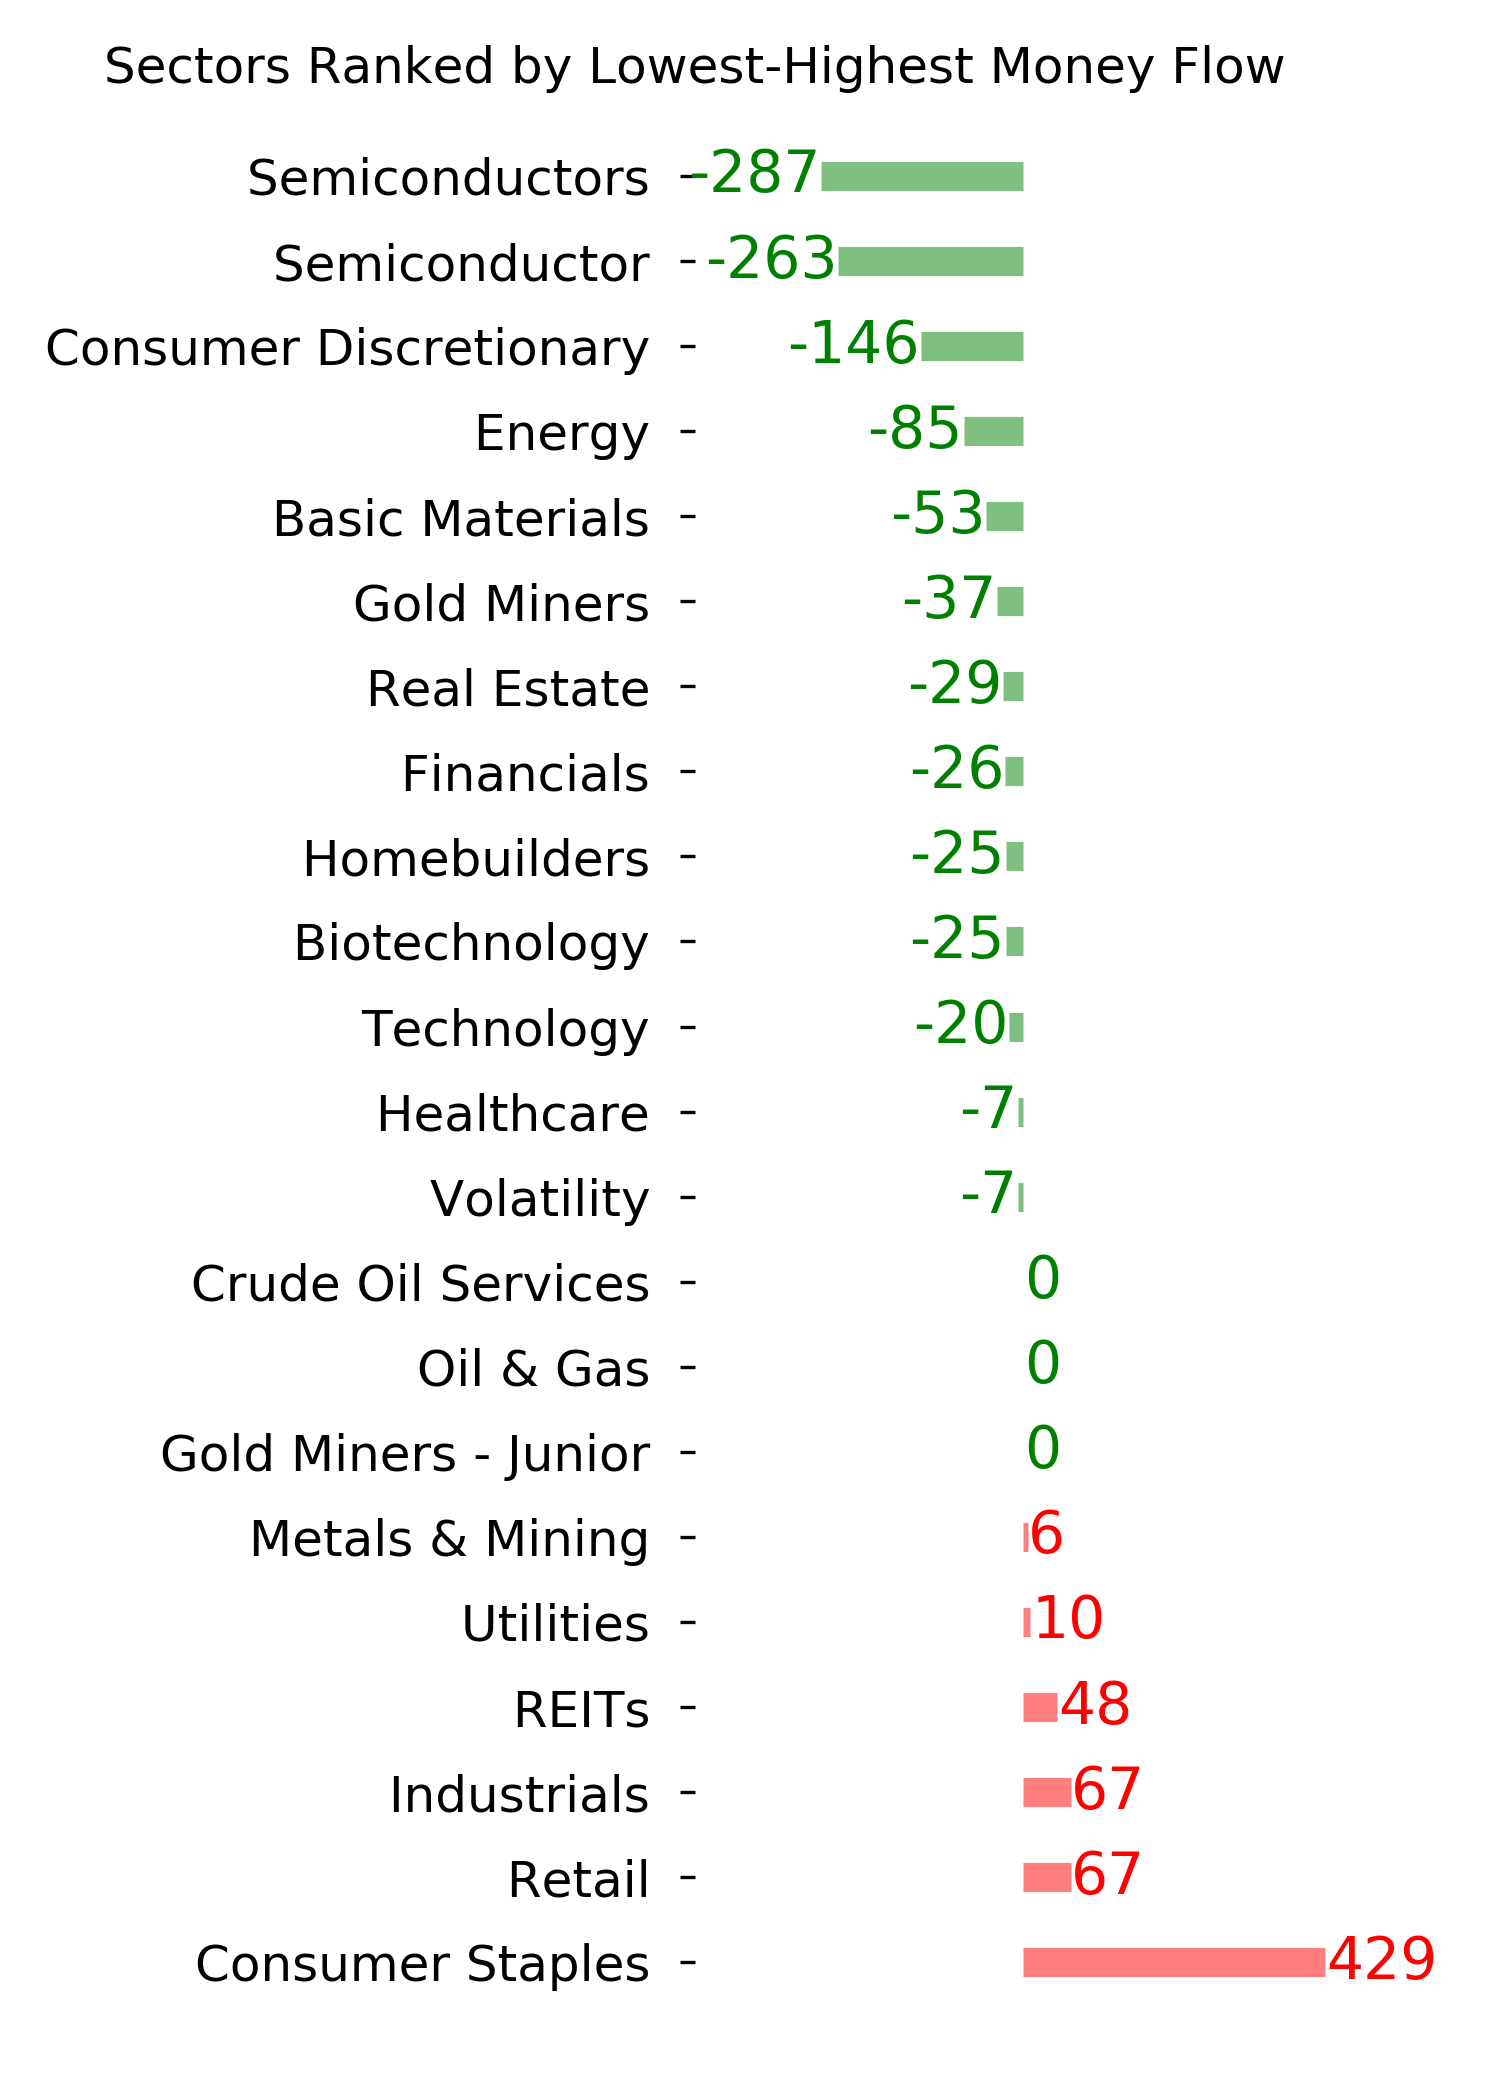
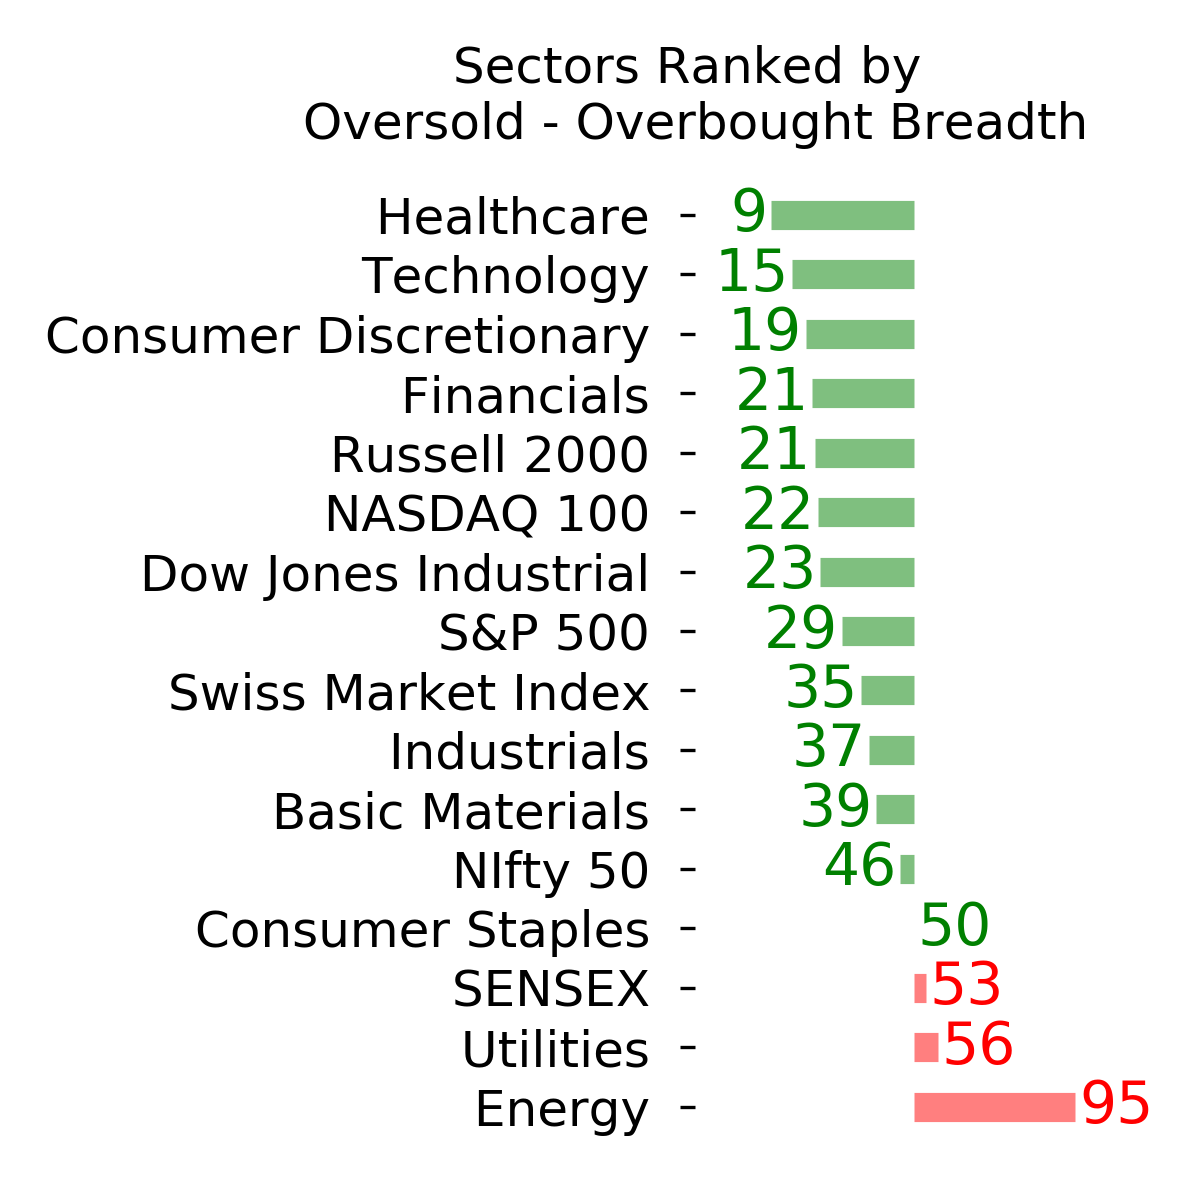
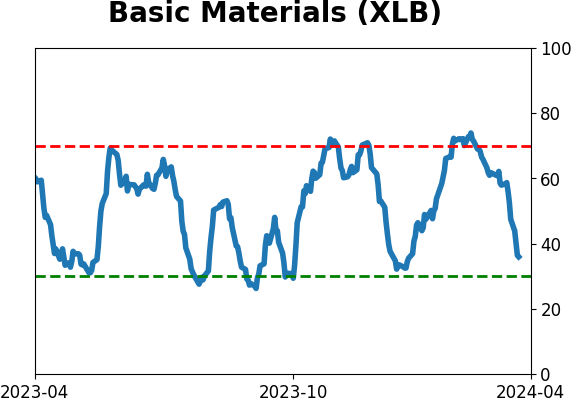
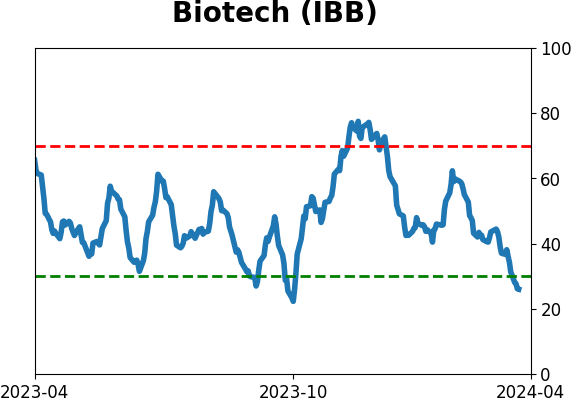
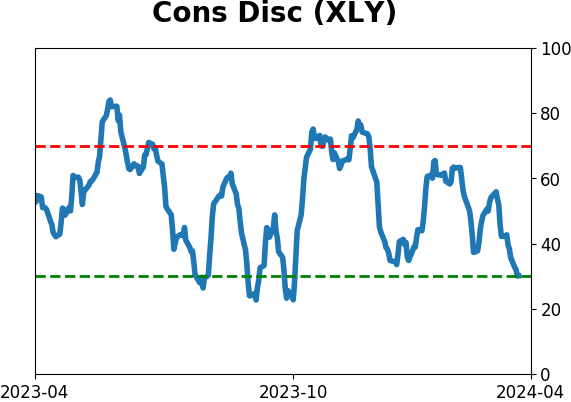
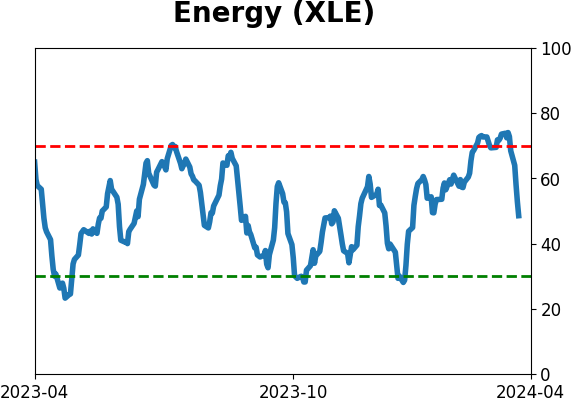
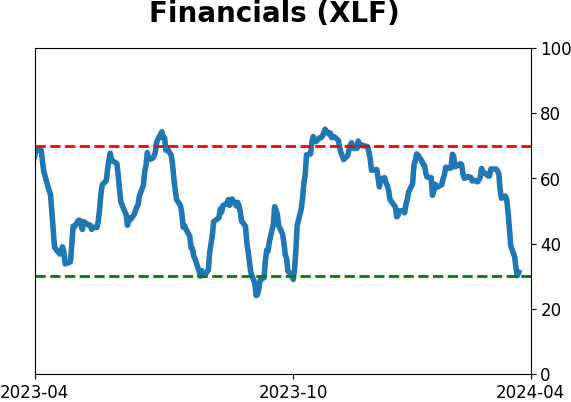
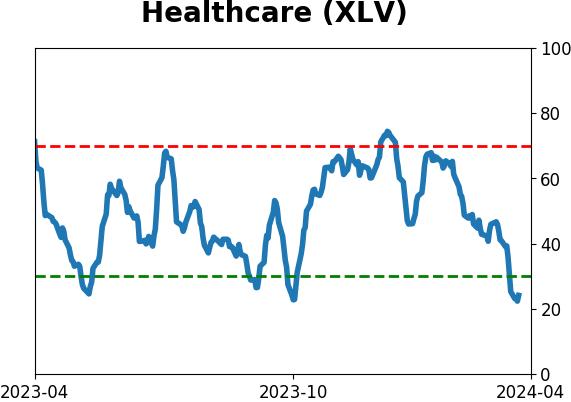
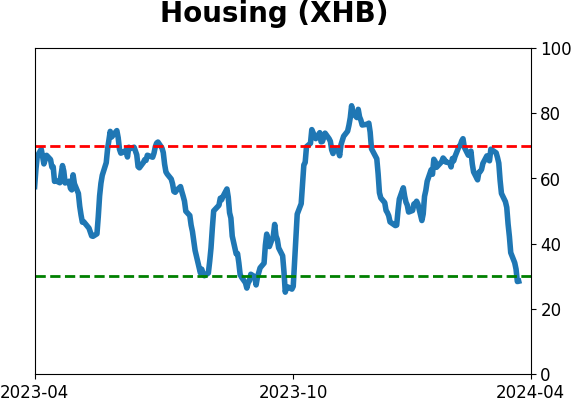
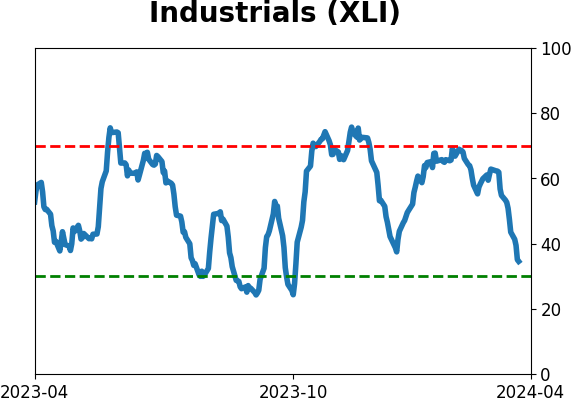
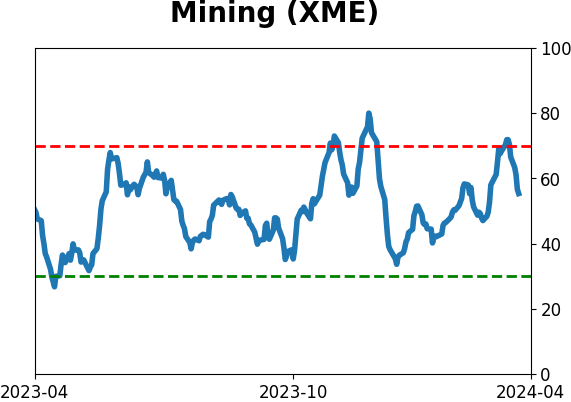
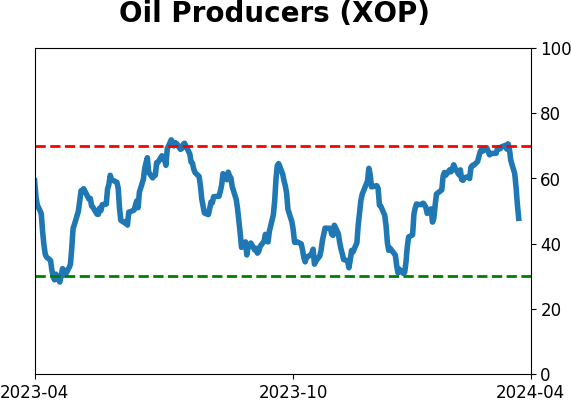
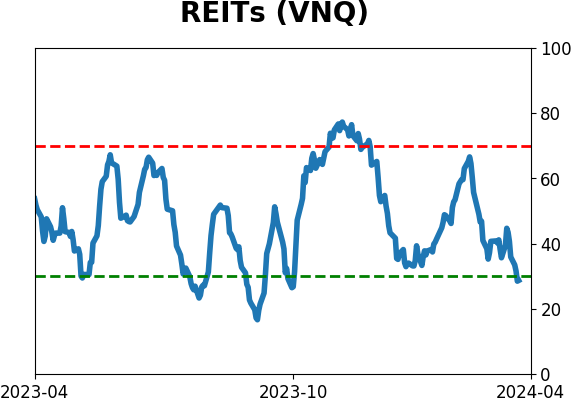
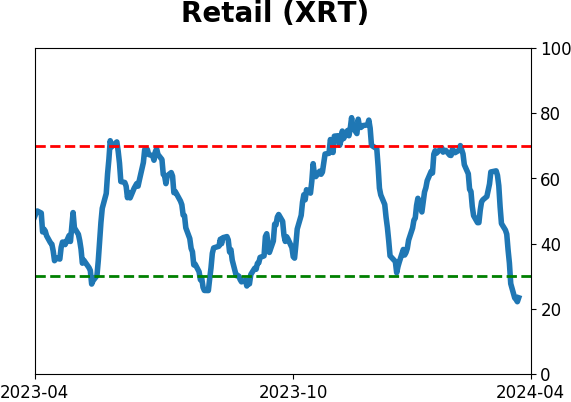
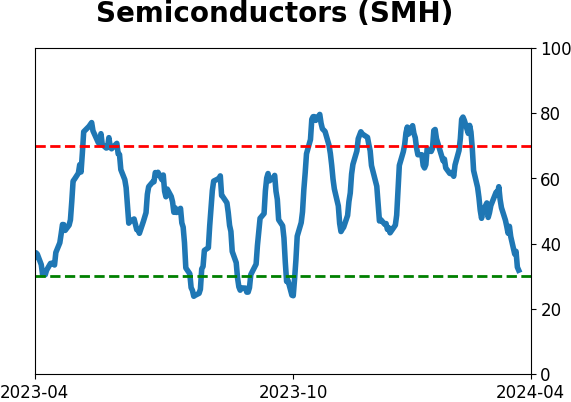
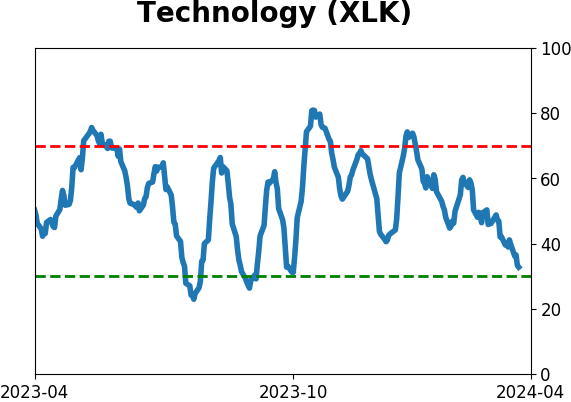
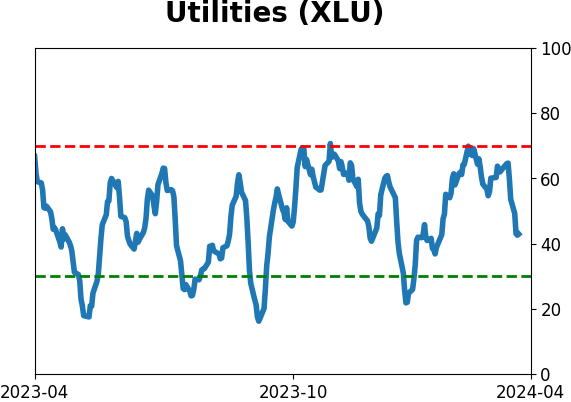
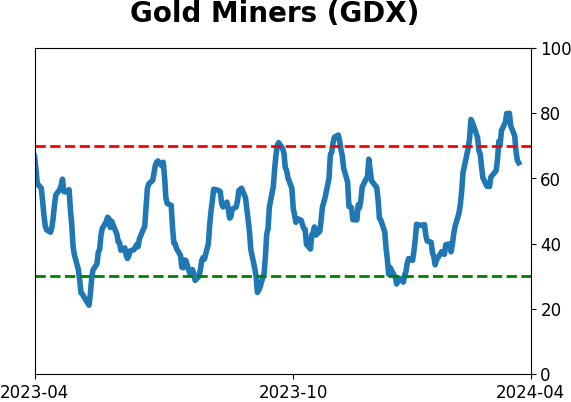
Sector ETF's - 10-Day Moving Average
|
|
|
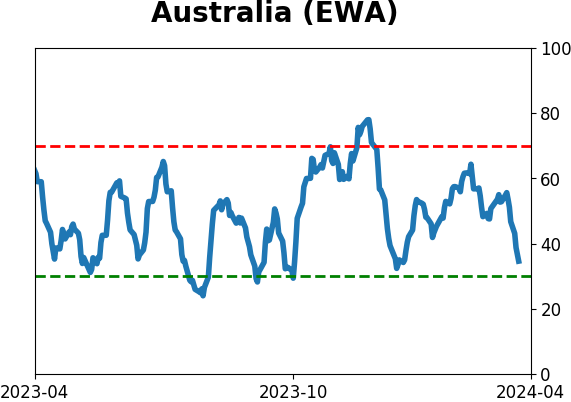
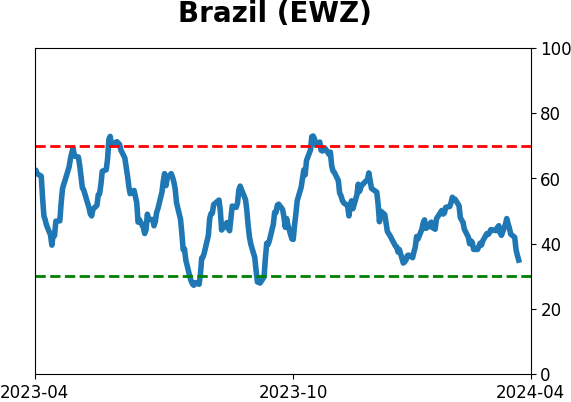
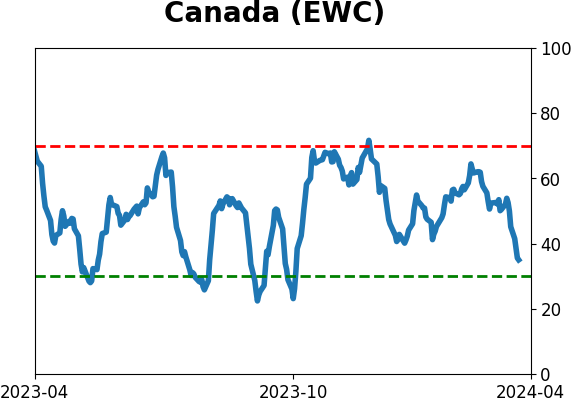
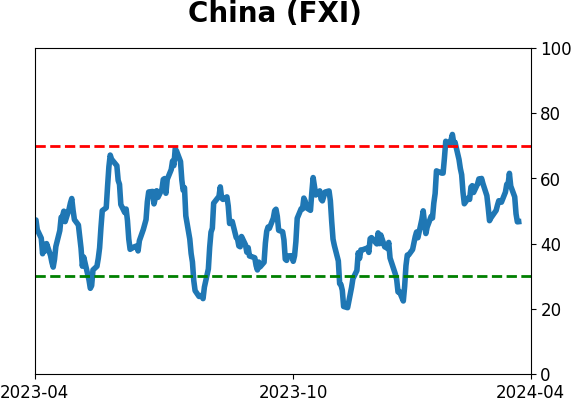
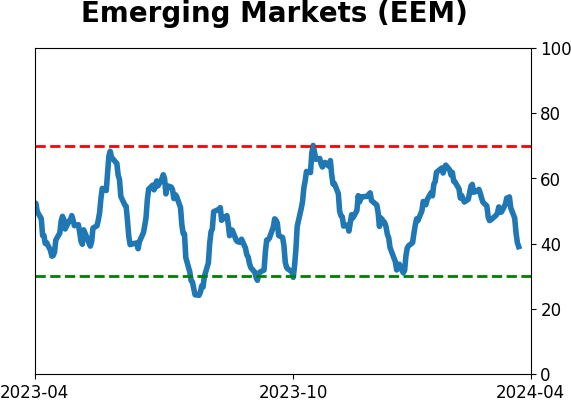
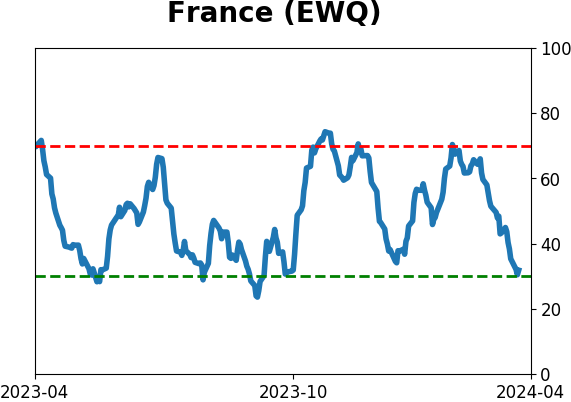
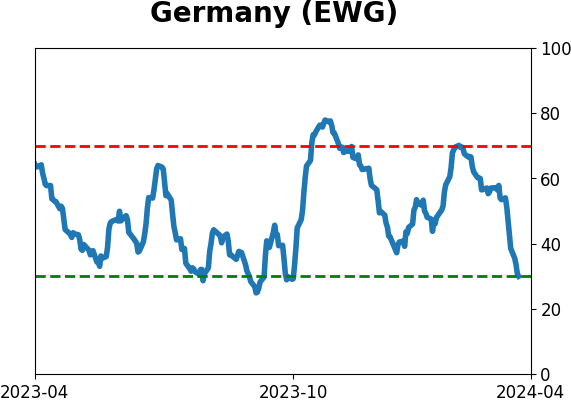
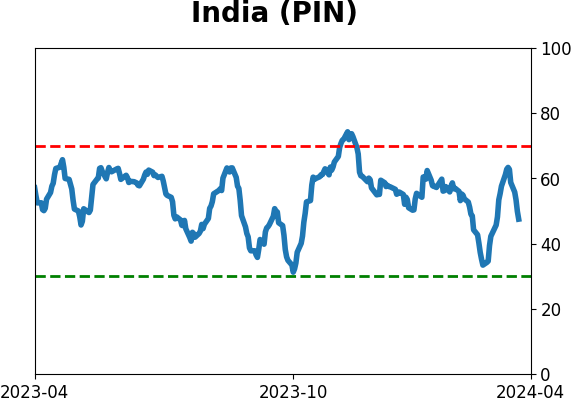
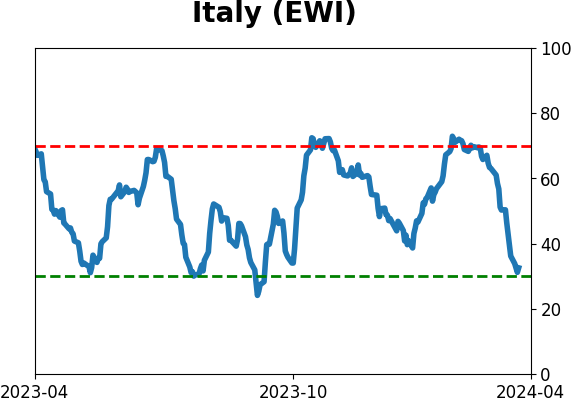
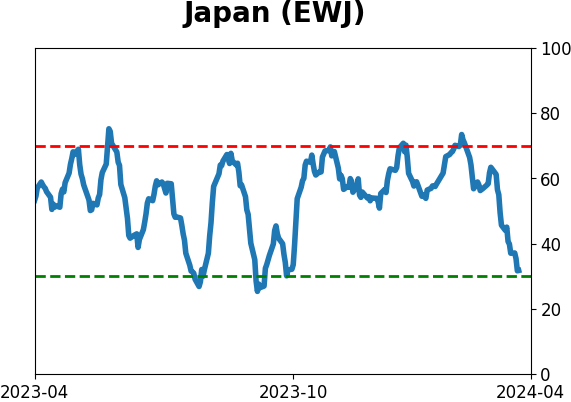
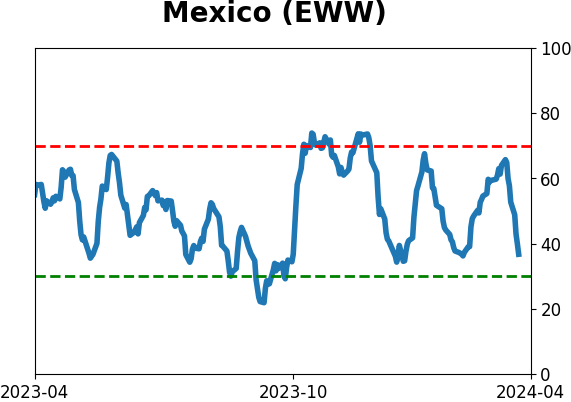
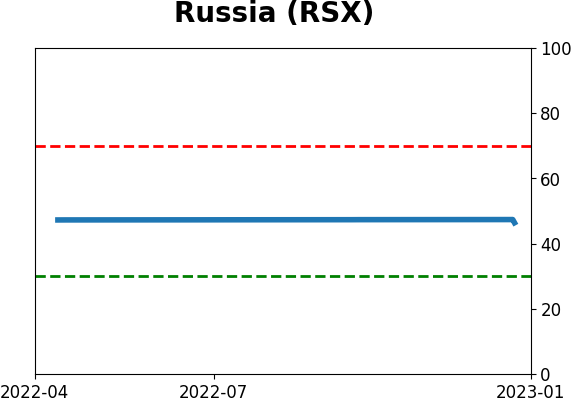
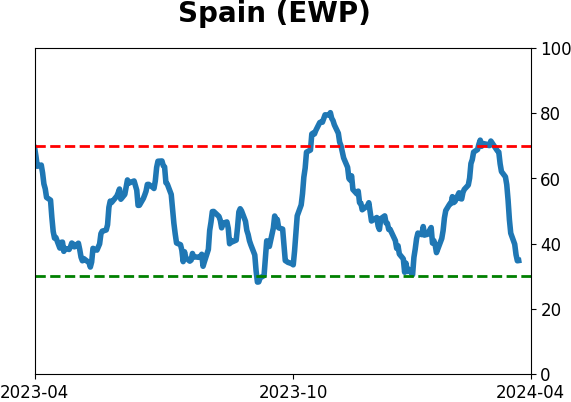
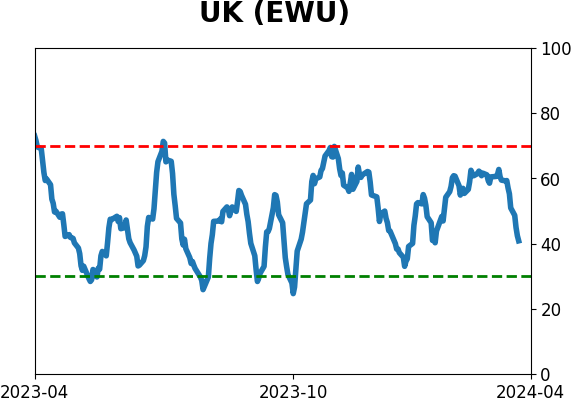
Country ETF's - 10-Day Moving Average
|
|
|
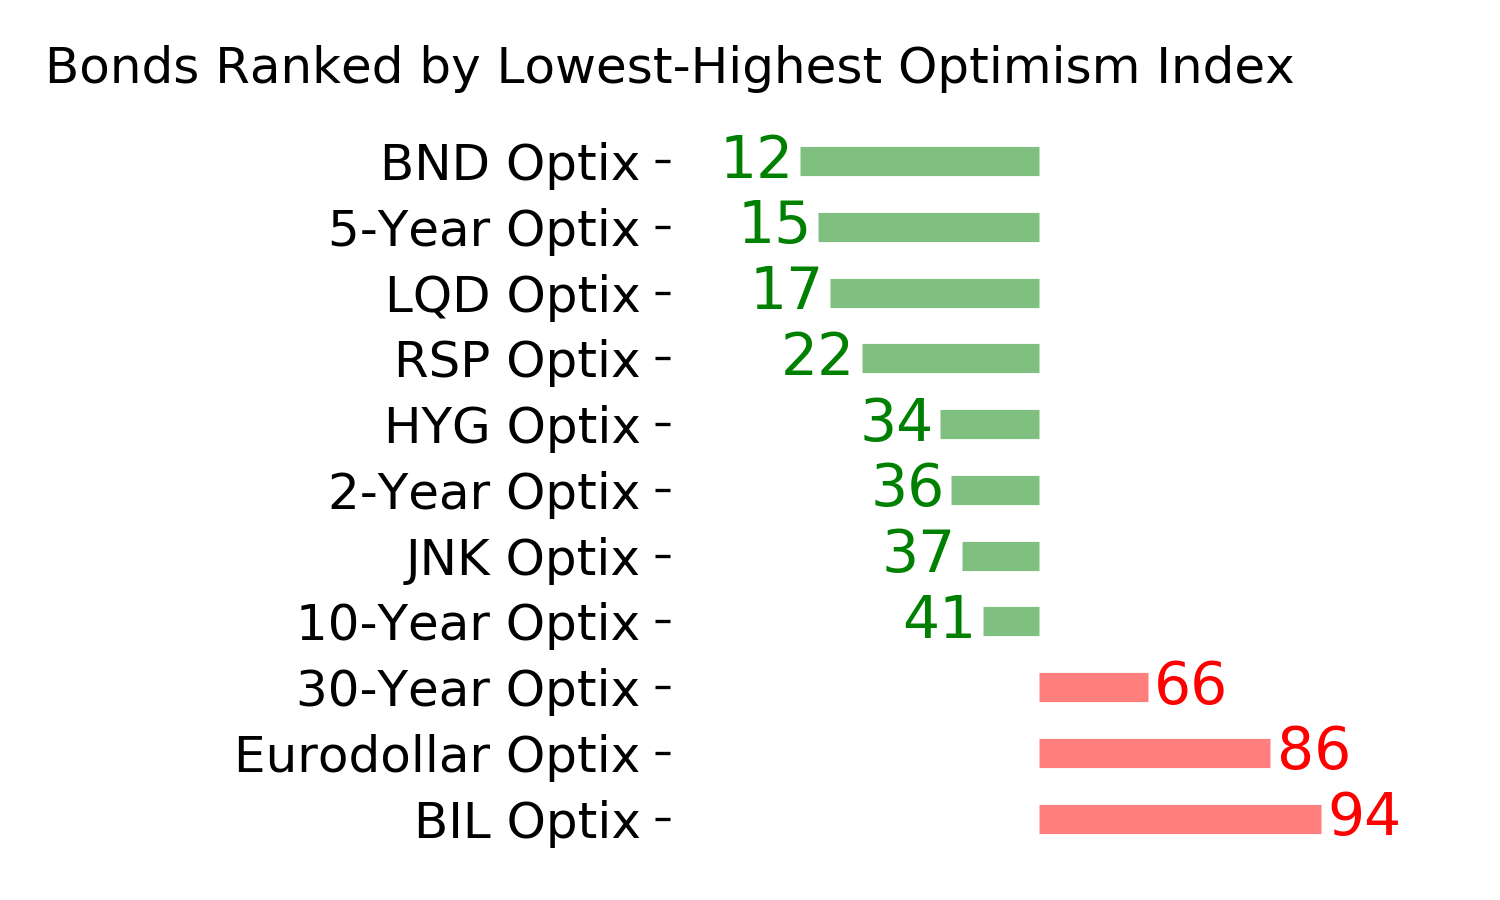
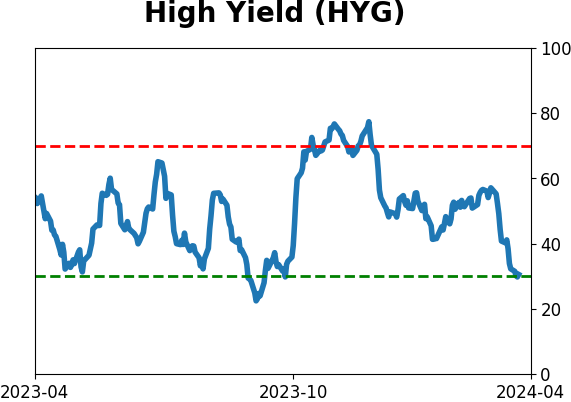
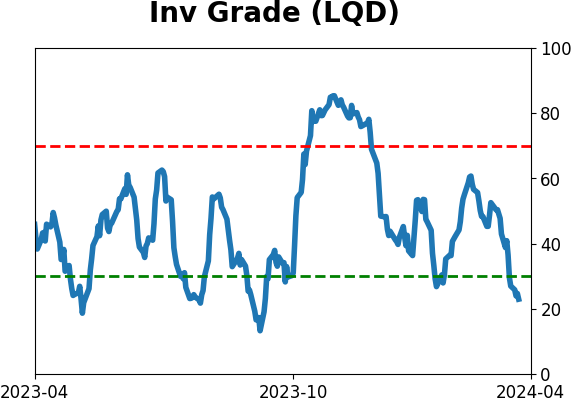
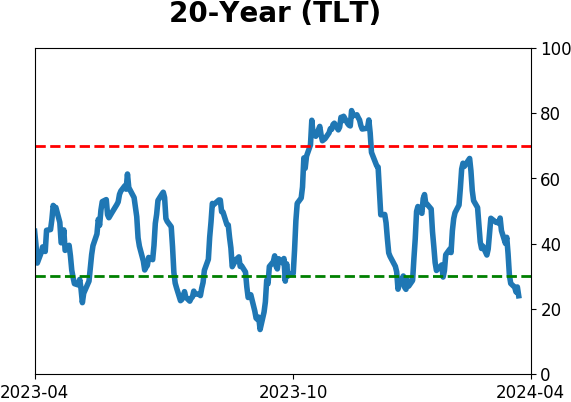
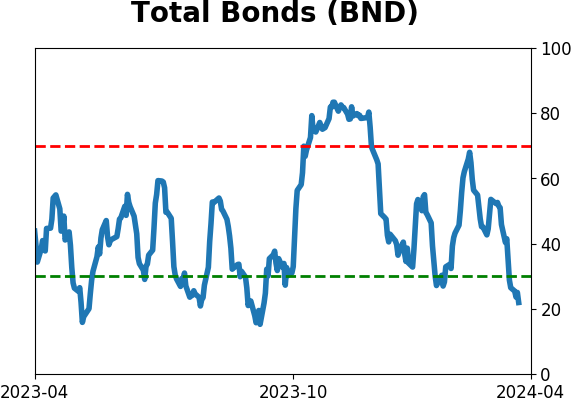
Bond ETF's - 10-Day Moving Average
|
|
|
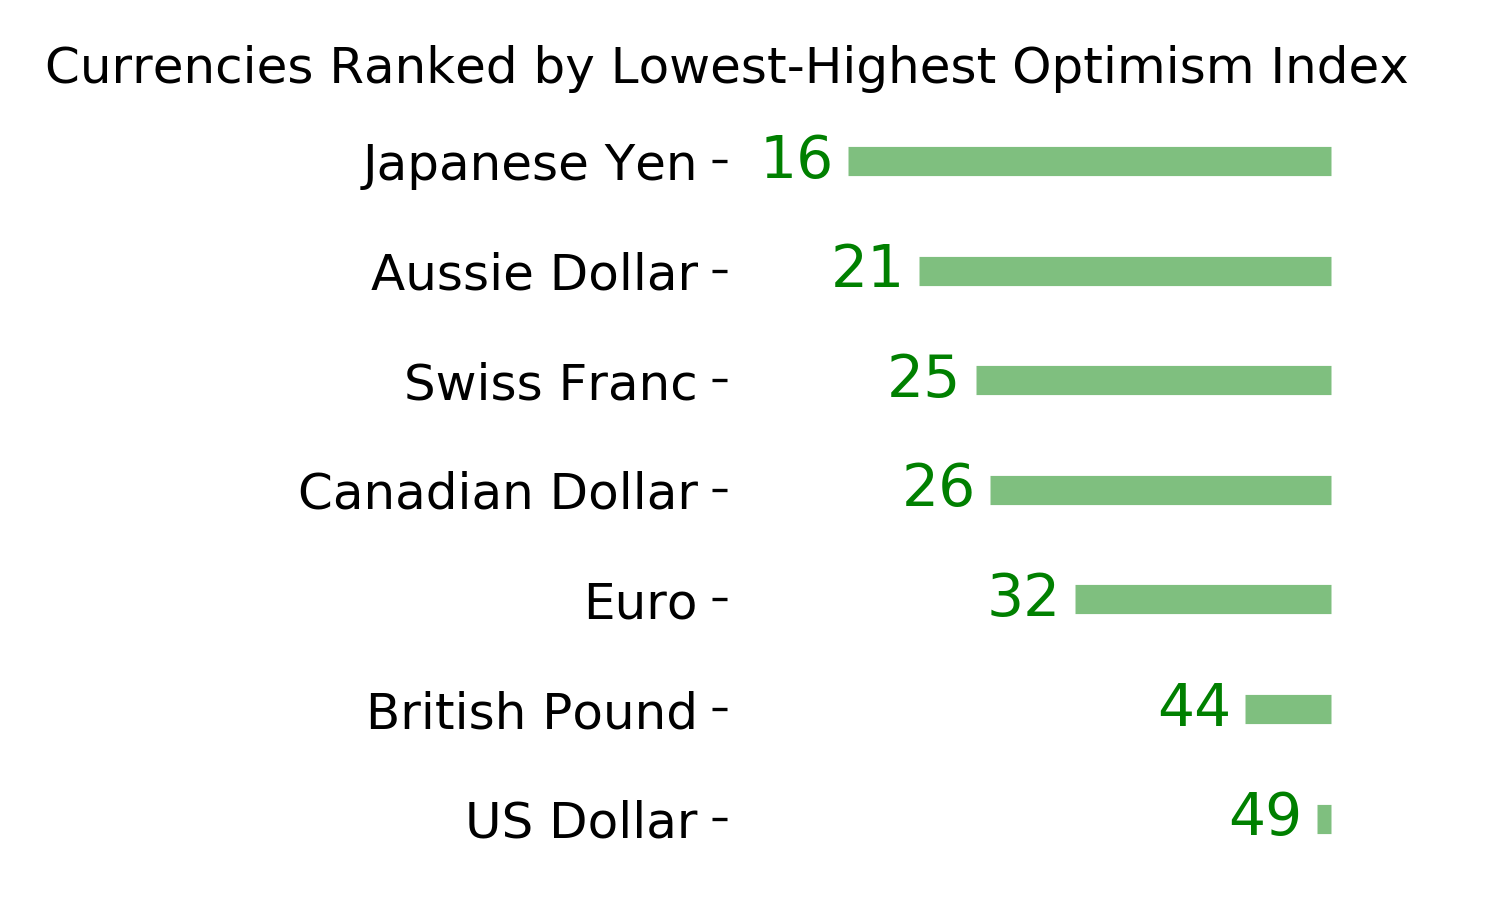
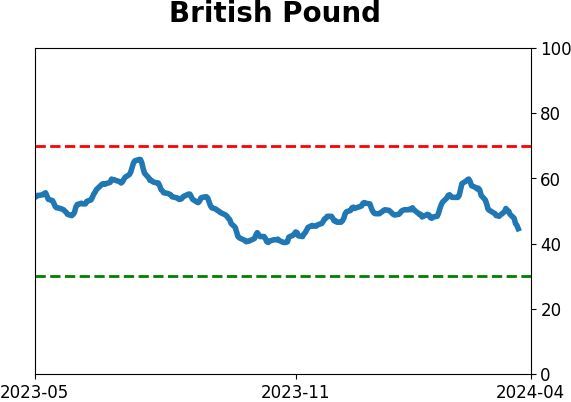
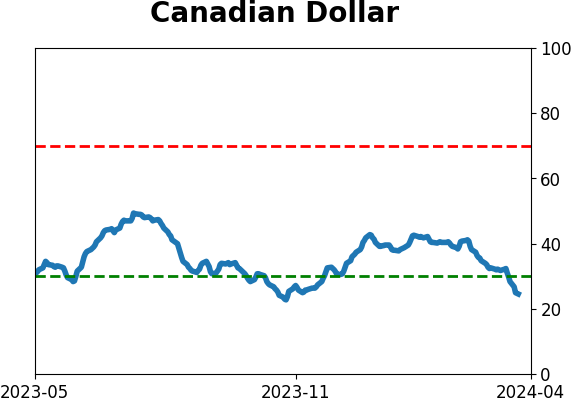
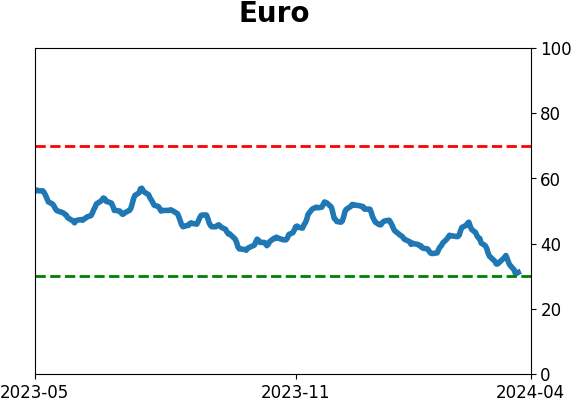
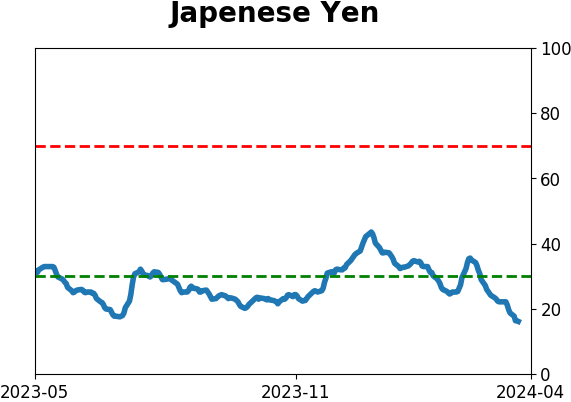
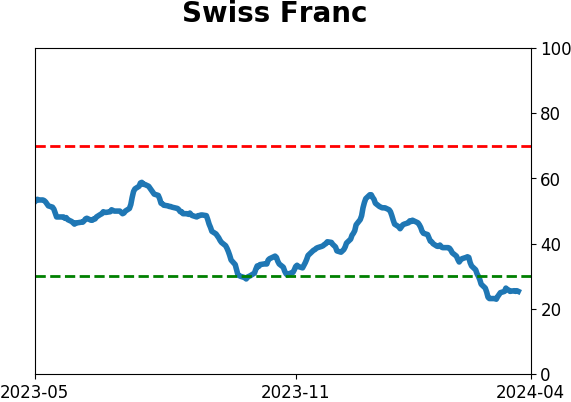
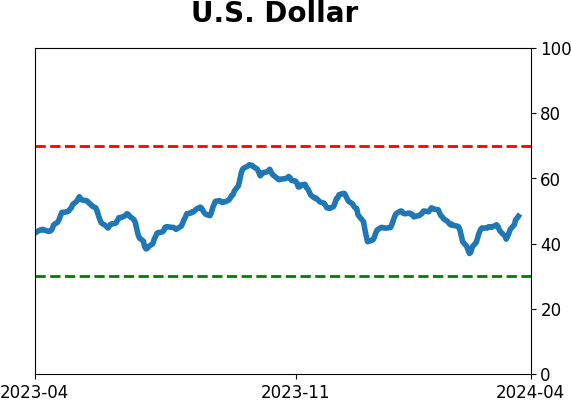
Currency ETF's - 5-Day Moving Average
|
|
|
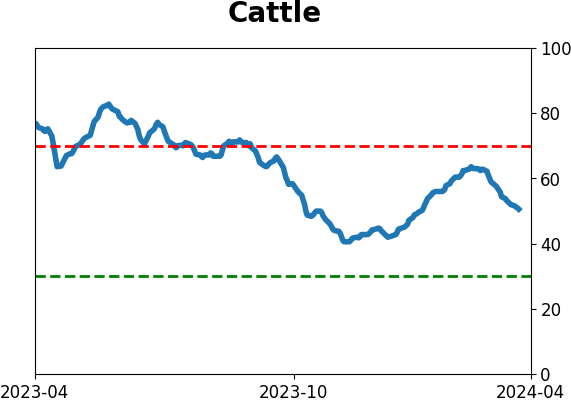
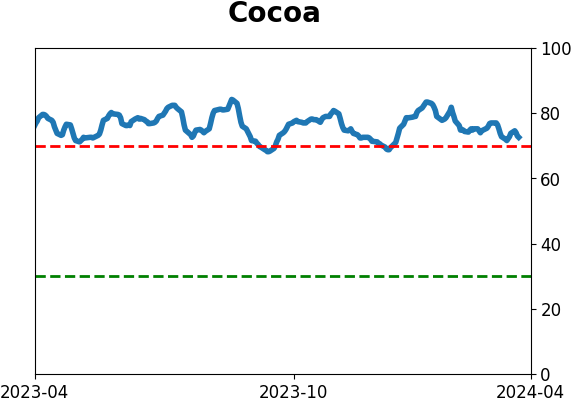
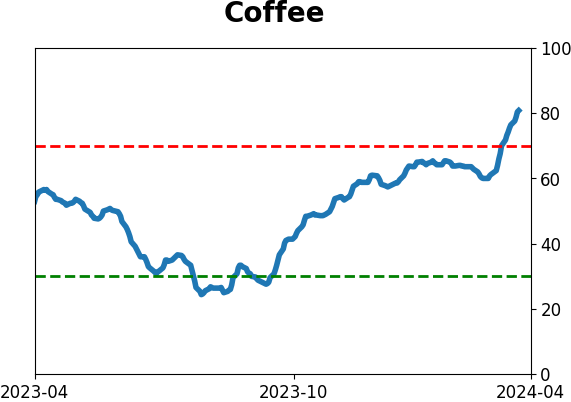
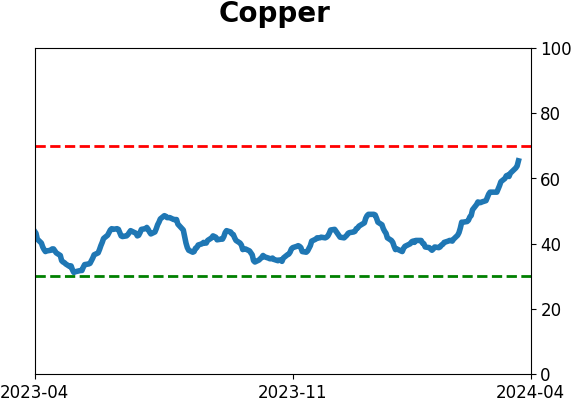
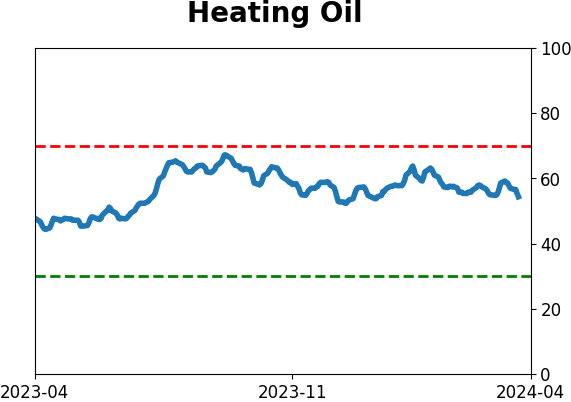
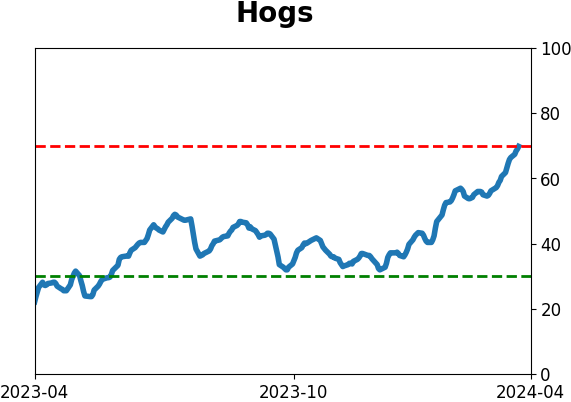
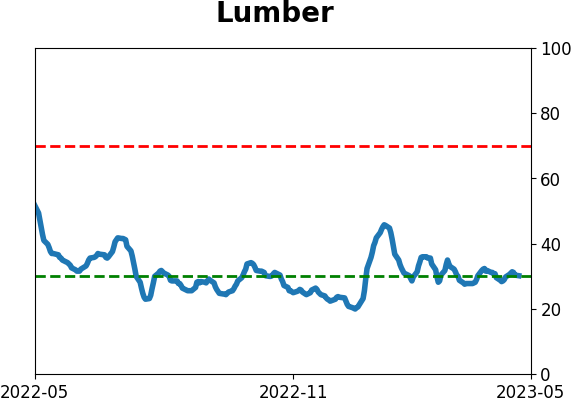
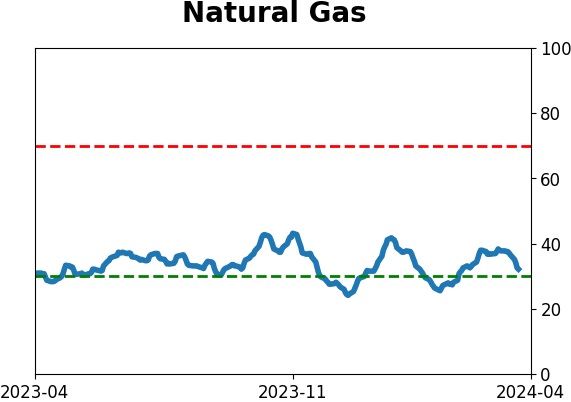
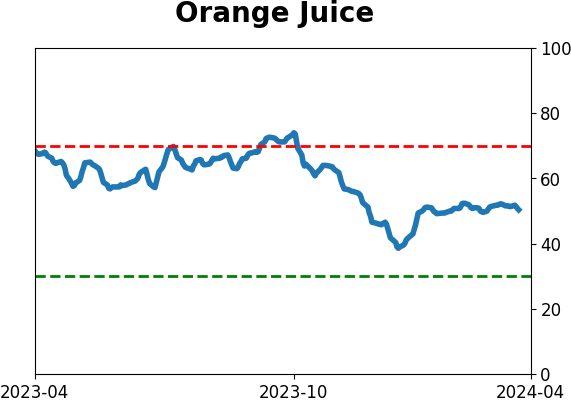
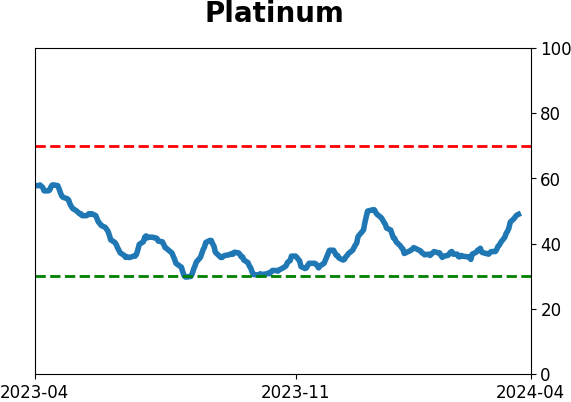
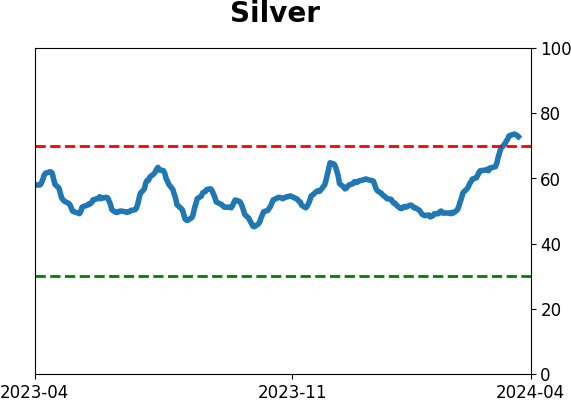
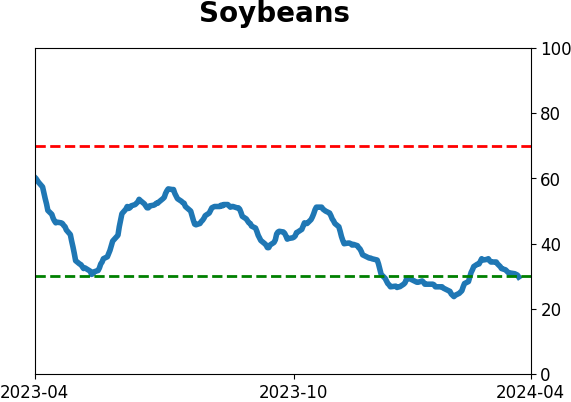
Commodity ETF's - 5-Day Moving Average
|
|